Embed Size (px)
Citation preview

STUDENT NAME: _______________________________
STUDENT SCORE: _______________________________
MISSISSIPPI ASSESSMENT PROGRAM (MAP) MATHEMATICS PRACTICE TESTLET
GRADE 8 (REVISED MARCH 2016)
Carey M. Wright, Ed.D., State Superintendent of Education
March 2016

MAP TESTLET-MATH-GRADE 8 MISSISSIPPI DEPARTMENT OF EDUCATION © 1
A Joint Publication
Division of Research and Development, Office of Student Assessment
• Walt Drane, Director of Operations and Test Security • Marion Jones, Director of Support Services • Richard Baliko, NAEP State Coordinator • Sharon Prestridge, Special Populations Coordinator • Vincent Segalini, MAP Program Coordinator • Kimberly Jones, SATP2 Coordinator
Office of the Chief Academic Officer
• Dr. Kim Benton, Chief Academic Officer • Trecina Green, Executive Director, Office of Professional Development • Jean Massey, Executive Director, Office of Secondary Education • Dr. Nathan Oakley, Executive Director, Office of Elementary Education and Reading • Dr. Marla Davis, Bureau Director, Office of Secondary Education • Dr. Shelita Brown, Secondary Mathematics Specialist, Office of Secondary Education • Carol Ladner, Mathematics Professional Development Coordinator • Elizabeth Fulmer, Mathematics Professional Development Coordinator
The Mississippi State Board of Education, the Mississippi Department of Education, the Mississippi School for the Arts, the Mississippi School for the Blind, the Mississippi School for the Deaf, and the Mississippi School for Mathematics and Science do not discriminate on the basis of race, sex, color, religion, national origin, age, or disability in the provision of educational programs and services or employment opportunities and benefits. The following office has been designated to handle inquiries and complaints regarding the non-discrimination policies of the above-mentioned entities:
Director, Office of Human Resources Mississippi Department of Education 359 North West Street Suite 203 Jackson, Mississippi 39201 (601) 359-3511
MAP TESTLET-MATH-GRADE 8 MISSISSIPPI DEPARTMENT OF EDUCATION © 2
Introduction
Purpose
The practice testlet is designed to provide students with an authentic opportunity to
practice items that are aligned to the Mississippi College-and Career-Readiness Standards (MS
CCRS) and that mirror those that may appear on the mathematics MAP assessment. The testlet is
also intended to provide teachers with data to drive classroom instruction and provide direct
feedback to students. It is NOT intended to predict student performance on the operational MAP
assessment.
Structure
The mathematics testlet contains various item types that will be administered on the MAP
assessment, such as standard multiple choice, matching, multiple select, and fill in the blank. At
the end of the testlet are a series of performance task items, which will assess the performance
task standards found in the mathematics MAP blueprint.
Directions
1. Allow students to complete each item type and performance task in the testlet.
2. Teachers will review student responses to the items and score the items and the
performance task using the scoring key.
3. Teachers should review the results to determine the needed instructional approach.
4. Teachers can utilize the testlets as teaching tools to help students gain a deeper
understanding of the MS CCRS.
5. At the bottom left of each page is an item tag, which will contain the item number,
grade level, suggested DOK level, and the standard aligned to the item.
MAP-TESTLET-MATH-GRADE 8 MISSISSIPPI DEPARTMENT OF EDUCATION © 3
1. Which statement explains why √30 is considered an irrational number?
A. When evaluated, √30 results in a repeating decimal, which is considered an irrational number.
B. When evaluated, √30 results in a terminating decimal, which is considered an
irrational number.
C. When evaluated, √30 results in a nonterminating and nonrepeating decimal, which is considered an irrational number.
D. When evaluated, √30 results in a whole number, which is considered an irrational
number.
01-GR8-LV1-8.NS.1
MAP-TESTLET-MATH-GRADE 8 MISSISSIPPI DEPARTMENT OF EDUCATION © 4
2. Which of the following equations are true? Select all that apply.
A. 3-3 × 35 = 32
B. 36 × 3-2 = 3-3
C. 34 × 32 = 36
D. 3-2 × 3-2 = 181
E. 32 × 32 = 30
02-GR8-LV2-8.EE.1
MAP-TESTLET-MATH-GRADE 8 MISSISSIPPI DEPARTMENT OF EDUCATION © 5
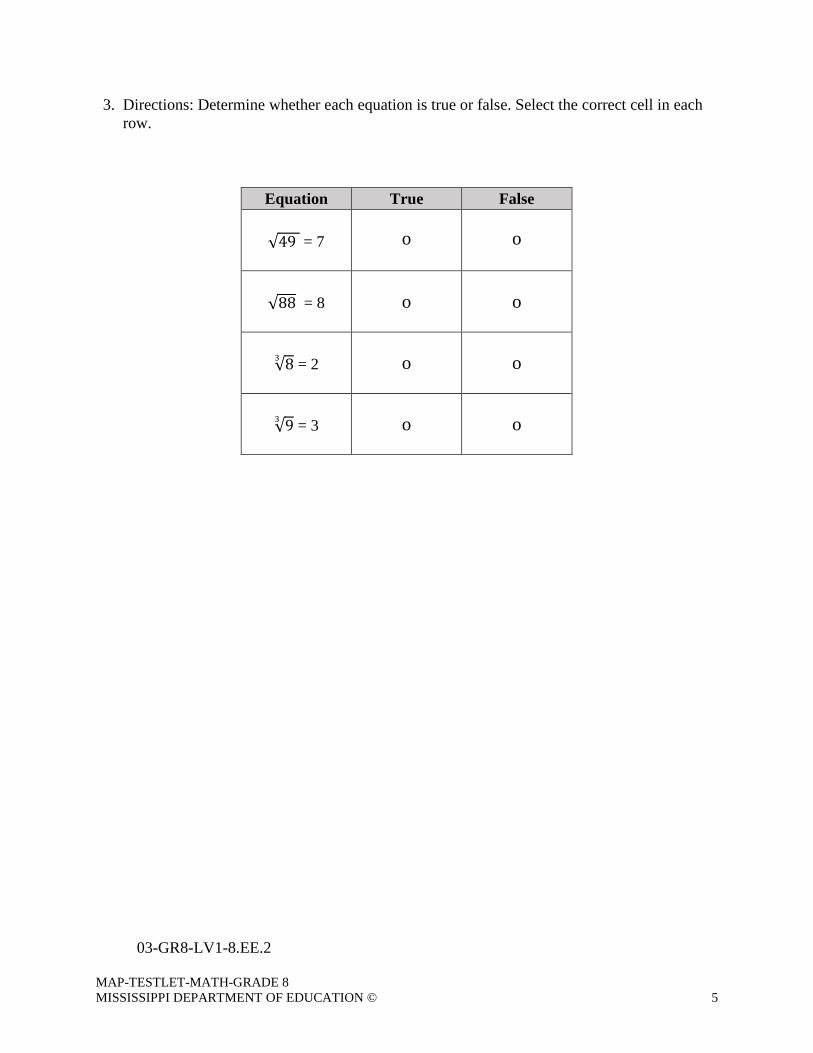
3. Directions: Determine whether each equation is true or false. Select the correct cell in each row.
Equation True False
√49 = 7 o o
√88 = 8 o o
√83 = 2 o o
√93 = 3 o o
03-GR8-LV1-8.EE.2
MAP-TESTLET-MATH-GRADE 8 MISSISSIPPI DEPARTMENT OF EDUCATION © 6
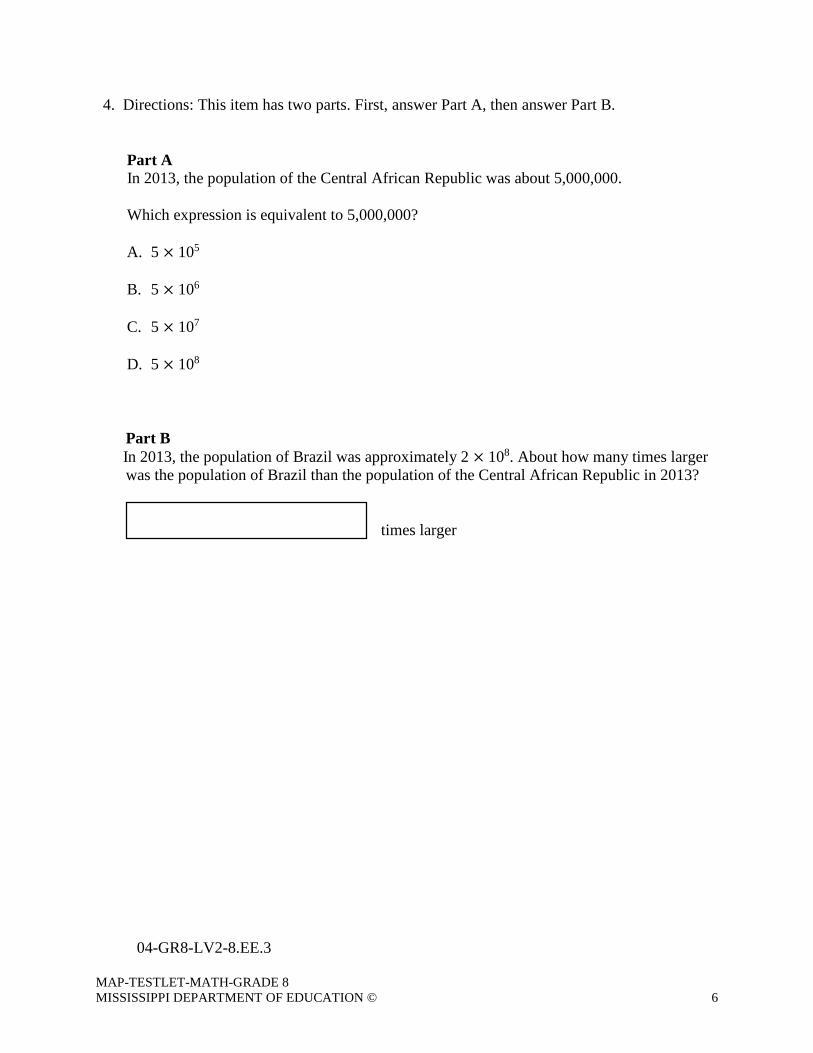
4. Directions: This item has two parts. First, answer Part A, then answer Part B. Part A In 2013, the population of the Central African Republic was about 5,000,000. Which expression is equivalent to 5,000,000?
A. 5 × 10⁵
B. 5 × 10⁶
C. 5 × 10⁷
D. 5 × 10⁸
Part B
In 2013, the population of Brazil was approximately 2 × 10⁸. About how many times larger was the population of Brazil than the population of the Central African Republic in 2013?
times larger
04-GR8-LV2-8.EE.3
MAP-TESTLET-MATH-GRADE 8 MISSISSIPPI DEPARTMENT OF EDUCATION © 7
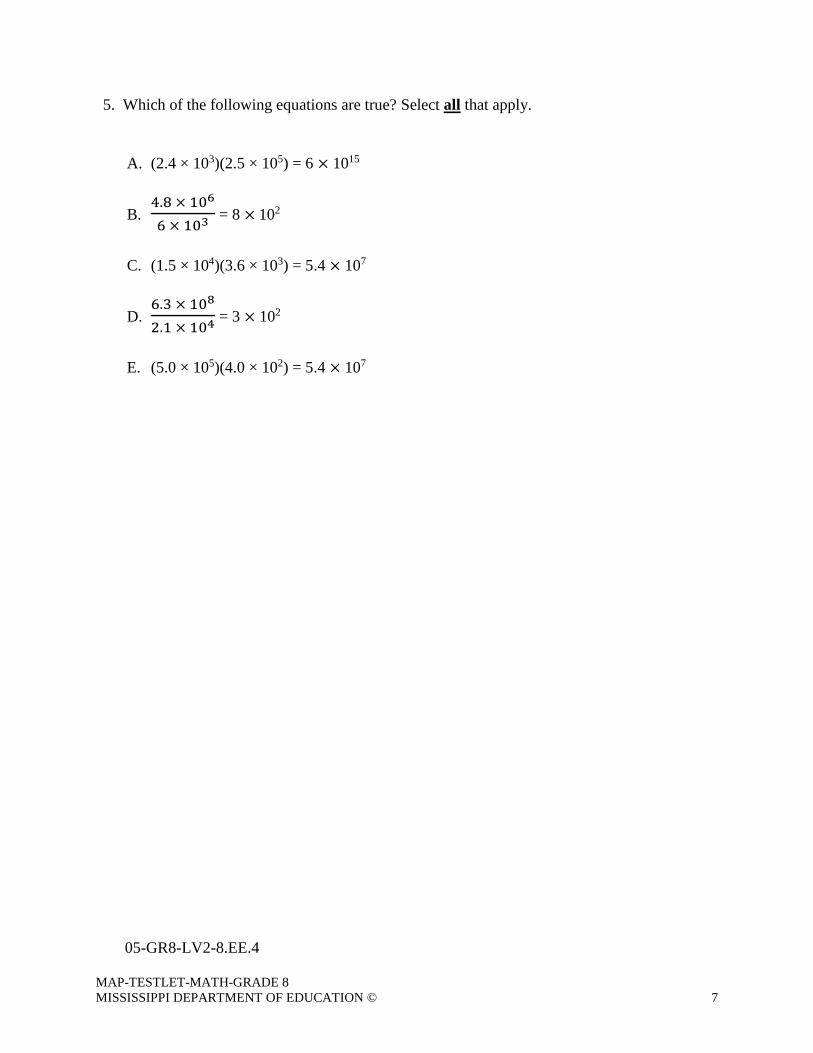
5. Which of the following equations are true? Select all that apply.
A. (2.4 × 10³)(2.5 × 10⁵) = 6 × 10¹⁵
B. 4.8 × 10⁶
6 × 103 = 8 × 10²
C. (1.5 × 10⁴)(3.6 × 10³) = 5.4 × 10⁷
D. 6.3 × 10⁸
2.1 × 104 = 3 × 10²
E. (5.0 × 10⁵)(4.0 × 10²) = 5.4 × 10⁷
05-GR8-LV2-8.EE.4
MAP-TESTLET-MATH-GRADE 8 MISSISSIPPI DEPARTMENT OF EDUCATION © 8
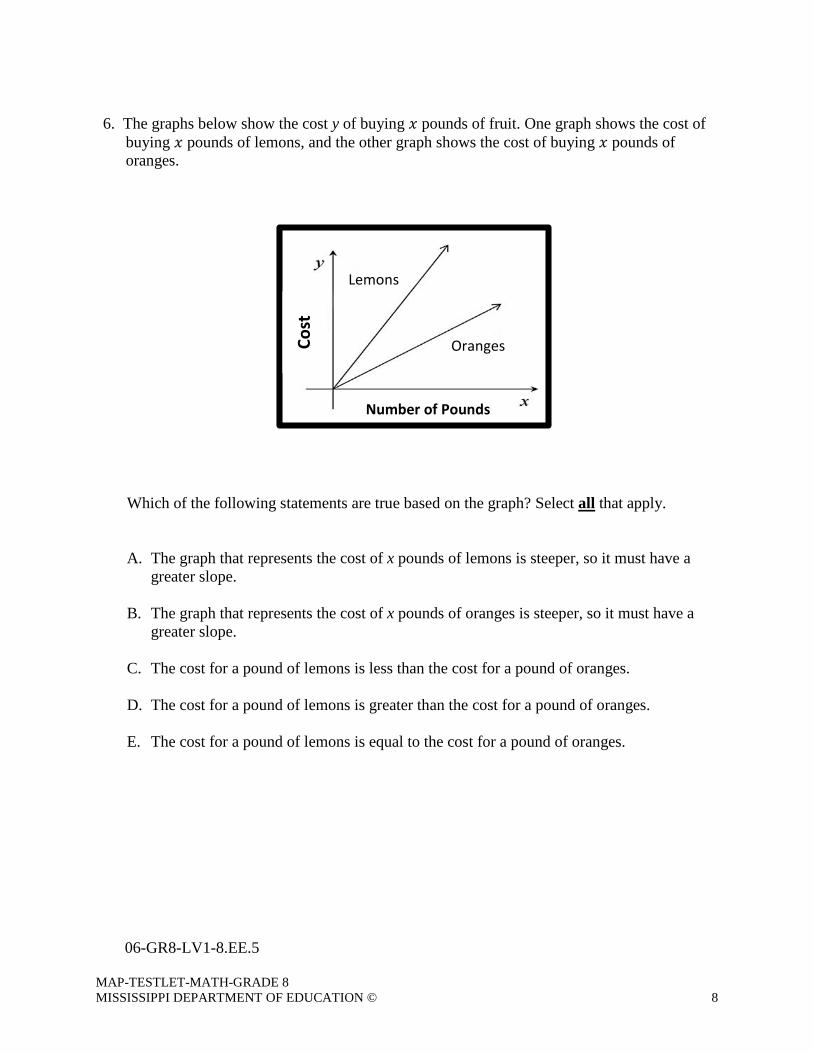
6. The graphs below show the cost y of buying 𝑥𝑥 pounds of fruit. One graph shows the cost of
buying 𝑥𝑥 pounds of lemons, and the other graph shows the cost of buying 𝑥𝑥 pounds of oranges.
Which of the following statements are true based on the graph? Select all that apply.
A. The graph that represents the cost of x pounds of lemons is steeper, so it must have a
greater slope.
B. The graph that represents the cost of x pounds of oranges is steeper, so it must have a greater slope.
C. The cost for a pound of lemons is less than the cost for a pound of oranges.
D. The cost for a pound of lemons is greater than the cost for a pound of oranges.
E. The cost for a pound of lemons is equal to the cost for a pound of oranges.
06-GR8-LV1-8.EE.5
Lemons
Oranges
Number of Pounds
Cost
MAP-TESTLET-MATH-GRADE 8 MISSISSIPPI DEPARTMENT OF EDUCATION © 9
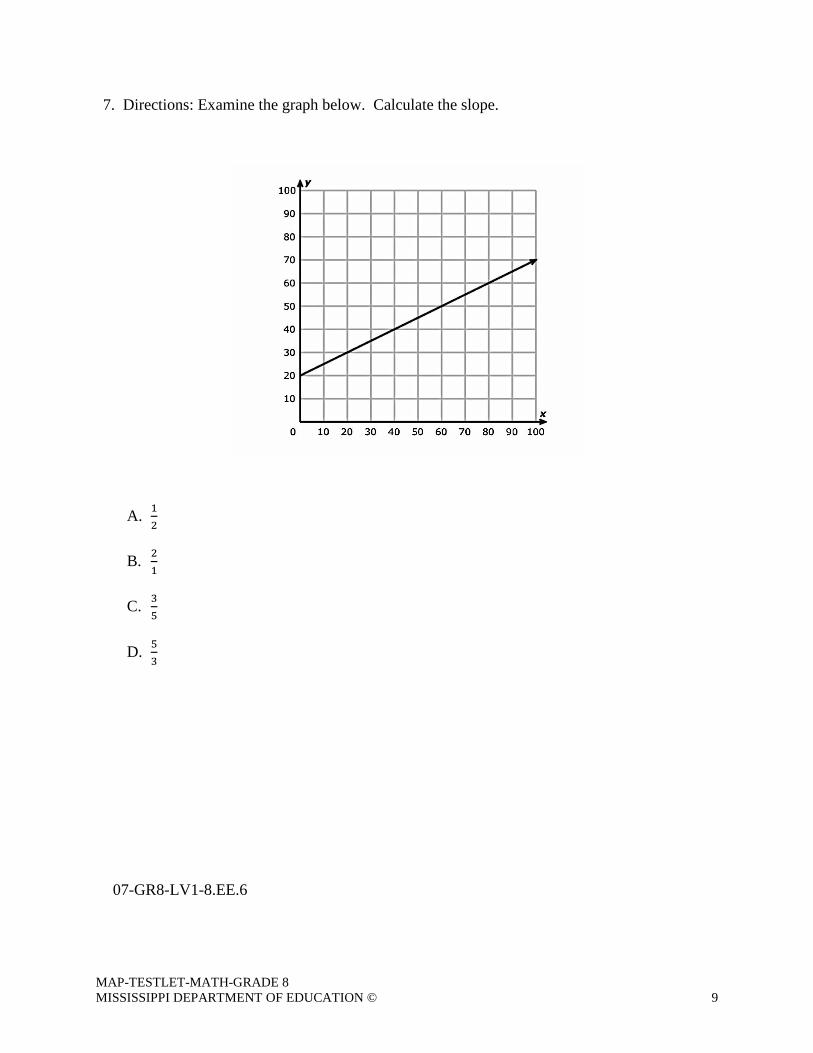
7. Directions: Examine the graph below. Calculate the slope.
A. 12
B. 2
1
C. 3
5
D. 5
3
07-GR8-LV1-8.EE.6
MAP-TESTLET-MATH-GRADE 8 MISSISSIPPI DEPARTMENT OF EDUCATION © 10
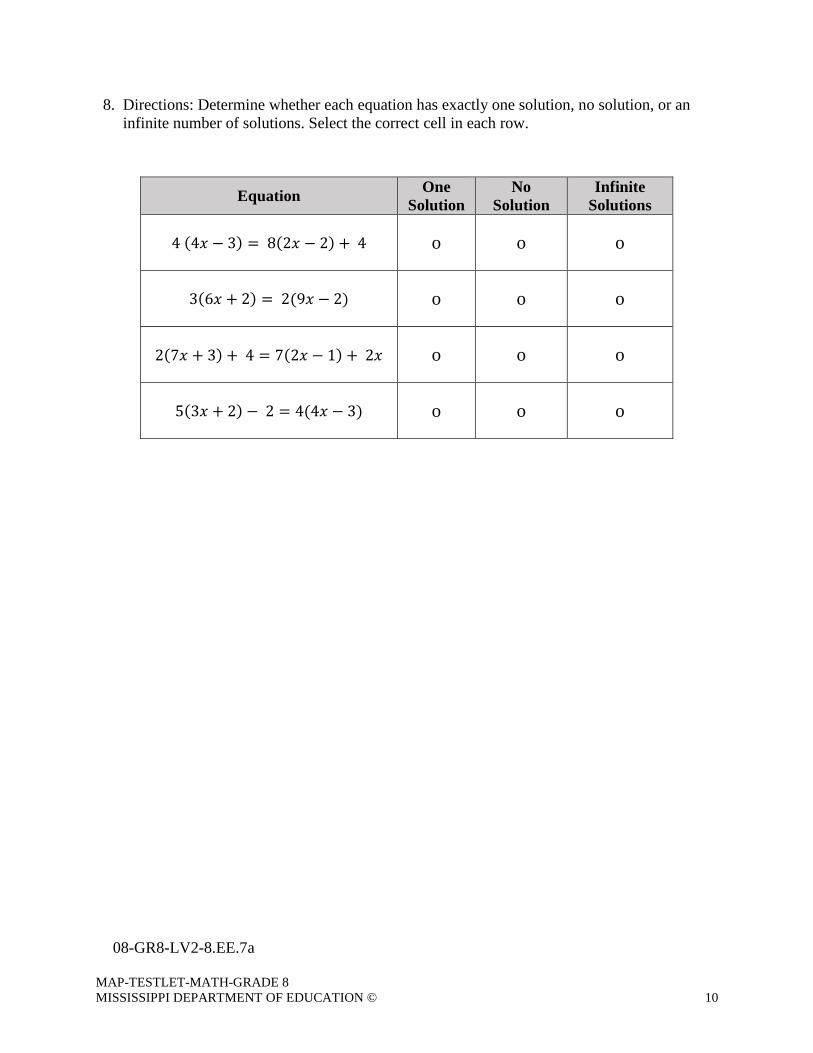
8. Directions: Determine whether each equation has exactly one solution, no solution, or an infinite number of solutions. Select the correct cell in each row.
Equation One Solution
No Solution
Infinite Solutions
4 (4𝑥𝑥 − 3) = 8(2𝑥𝑥 − 2) + 4
o o o
3(6𝑥𝑥 + 2) = 2(9𝑥𝑥 − 2)
o o o
2(7𝑥𝑥 + 3) + 4 = 7(2𝑥𝑥 − 1) + 2𝑥𝑥
o o o
5(3𝑥𝑥 + 2) − 2 = 4(4𝑥𝑥 − 3)
o o o
08-GR8-LV2-8.EE.7a
MAP-TESTLET-MATH-GRADE 8 MISSISSIPPI DEPARTMENT OF EDUCATION © 11
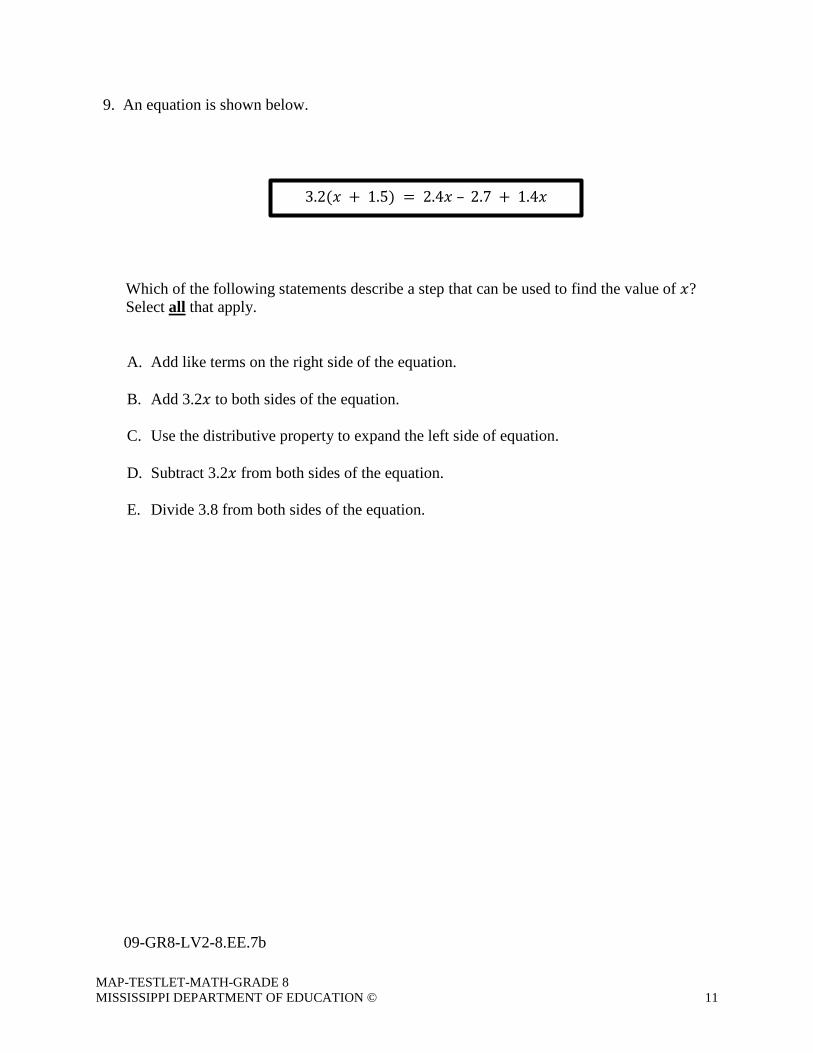
9. An equation is shown below.
Which of the following statements describe a step that can be used to find the value of 𝑥𝑥? Select all that apply.
A. Add like terms on the right side of the equation.
B. Add 3.2𝑥𝑥 to both sides of the equation.
C. Use the distributive property to expand the left side of equation.
D. Subtract 3.2𝑥𝑥 from both sides of the equation.
E. Divide 3.8 from both sides of the equation.
09-GR8-LV2-8.EE.7b
3.2(𝑥𝑥 + 1.5) = 2.4𝑥𝑥 – 2.7 + 1.4𝑥𝑥
MAP-TESTLET-MATH-GRADE 8 MISSISSIPPI DEPARTMENT OF EDUCATION © 12
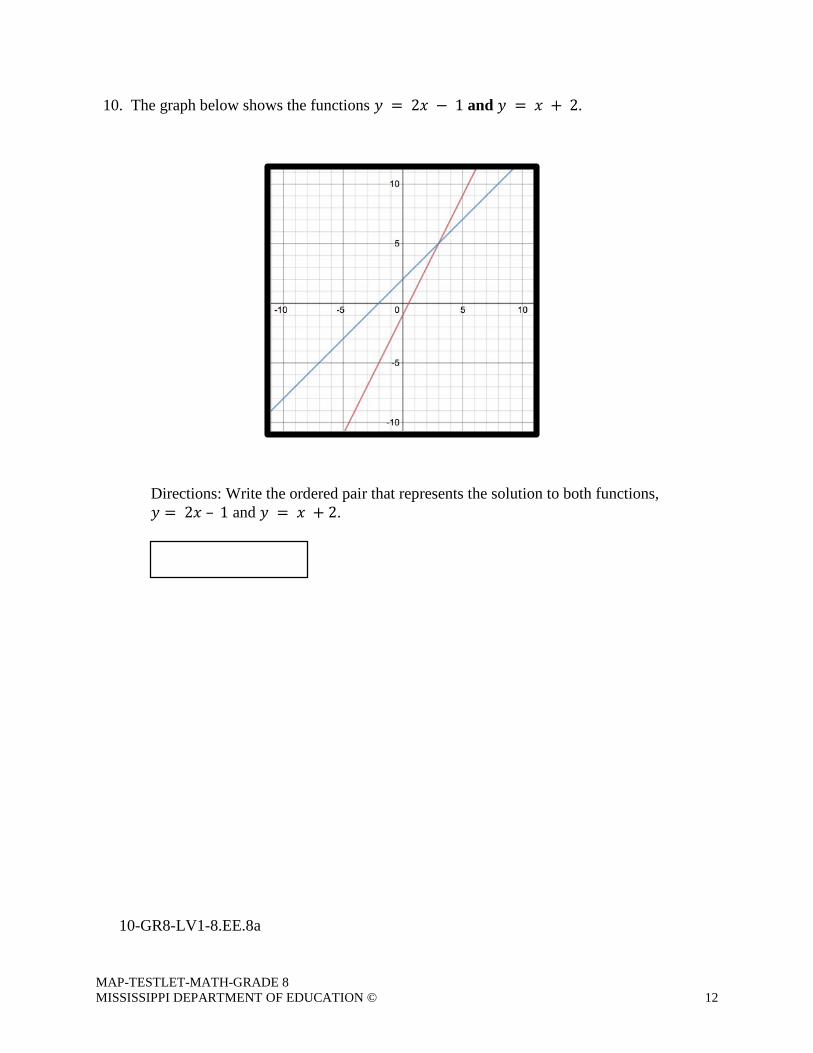
10. The graph below shows the functions 𝑦𝑦 = 2𝑥𝑥 − 1 and 𝑦𝑦 = 𝑥𝑥 + 2.
Directions: Write the ordered pair that represents the solution to both functions, 𝑦𝑦 = 2𝑥𝑥 – 1 and 𝑦𝑦 = 𝑥𝑥 + 2.
10-GR8-LV1-8.EE.8a
MAP-TESTLET-MATH-GRADE 8 MISSISSIPPI DEPARTMENT OF EDUCATION © 13
11. Robert called two bowling centers, Fannin Lanes and Fun Time Lanes, to determine the cost to bowl. Fannin Lanes charges $2.50 per game plus $2 for shoe rental, and Fun Time Lanes charges $2 per game plus $4 for shoe rental. Use this information to answer Part A and Part B.
Part A How many games will the cost to bowl be the same at both bowling centers?
Part B At the point where the cost is the same, how much will it cost to bowl at both bowling centers?
11-GR8-LV2-8.EE.8b
MAP-TESTLET-MATH-GRADE 8 MISSISSIPPI DEPARTMENT OF EDUCATION © 14
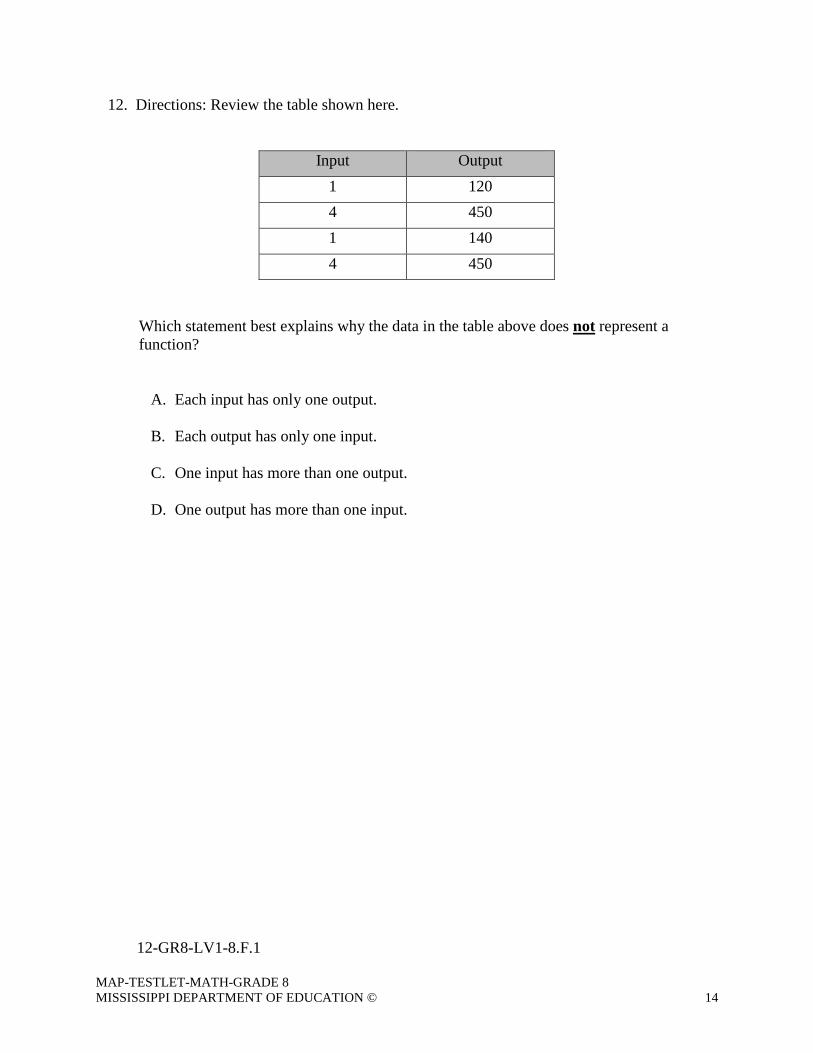
12. Directions: Review the table shown here.
Input Output
1 120 4 450 1 140 4 450
Which statement best explains why the data in the table above does not represent a function?
A. Each input has only one output.
B. Each output has only one input. C. One input has more than one output. D. One output has more than one input.
12-GR8-LV1-8.F.1
MAP-TESTLET-MATH-GRADE 8 MISSISSIPPI DEPARTMENT OF EDUCATION © 15
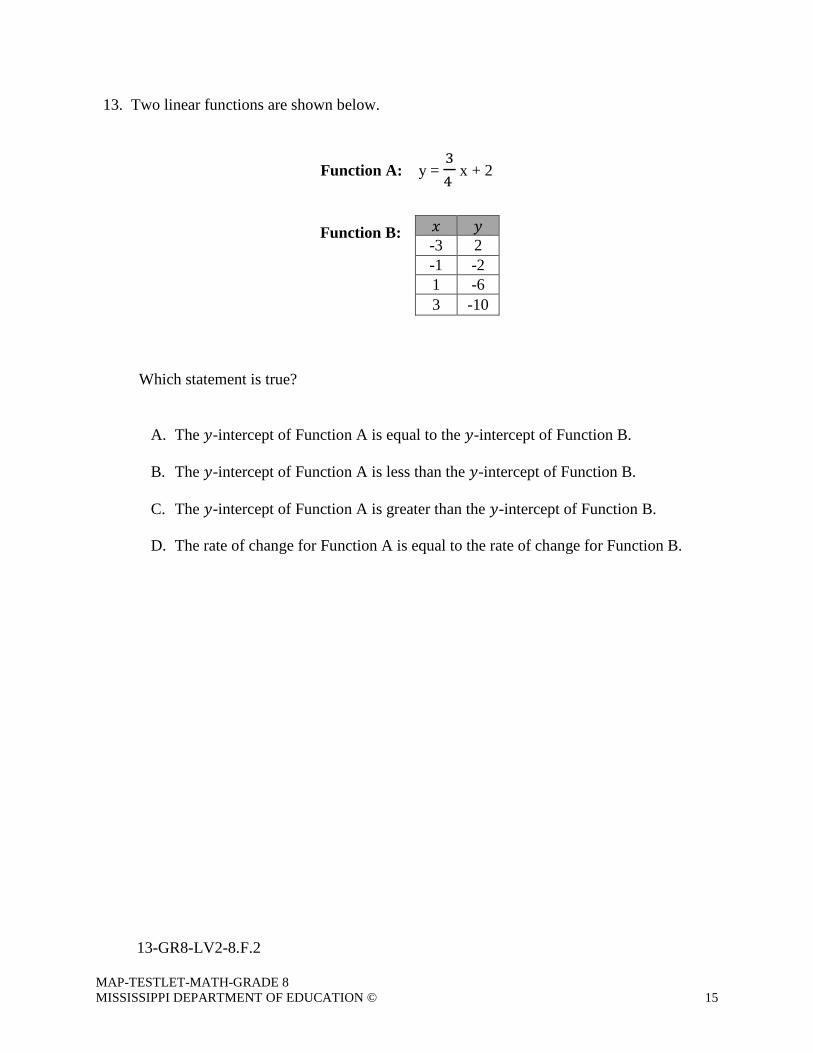
13. Two linear functions are shown below.
Function A: y = 34
x + 2
Function B:
Which statement is true?
A. The 𝑦𝑦-intercept of Function A is equal to the 𝑦𝑦-intercept of Function B.
B. The 𝑦𝑦-intercept of Function A is less than the 𝑦𝑦-intercept of Function B. C. The 𝑦𝑦-intercept of Function A is greater than the 𝑦𝑦-intercept of Function B. D. The rate of change for Function A is equal to the rate of change for Function B.
𝑥𝑥 𝑦𝑦 -3 2 -1 -2 1 -6 3 -10
13-GR8-LV2-8.F.2
MAP-TESTLET-MATH-GRADE 8 MISSISSIPPI DEPARTMENT OF EDUCATION © 16
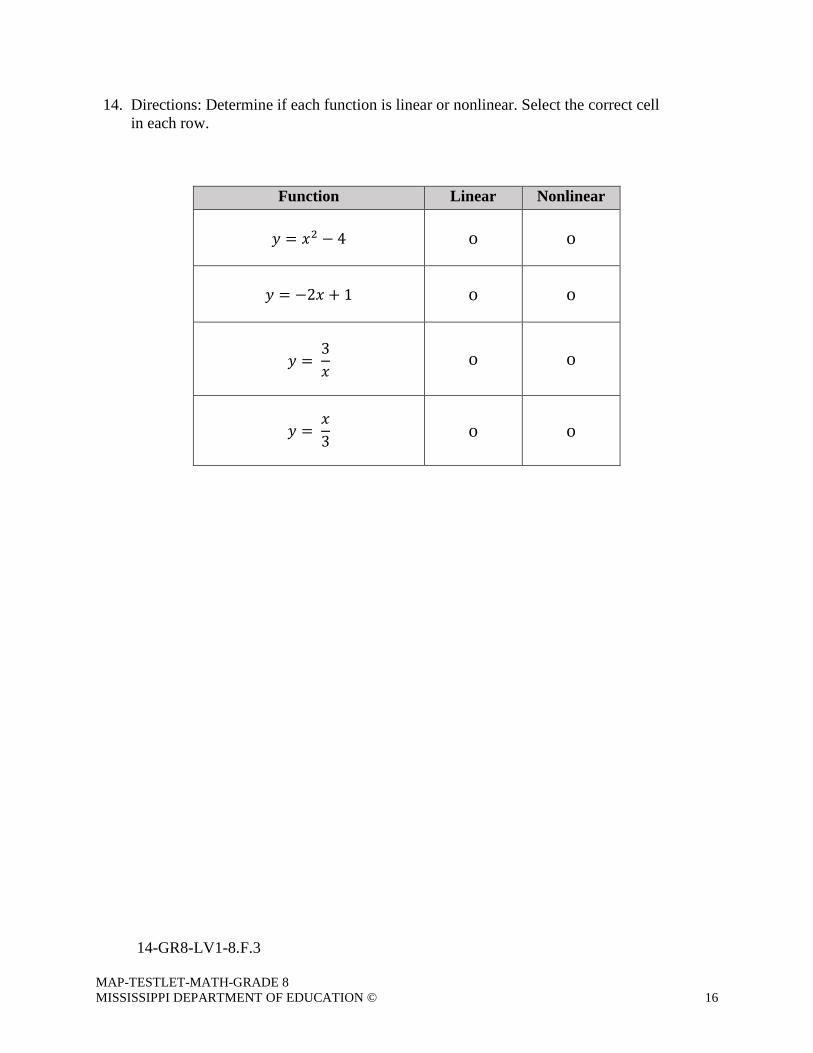
14. Directions: Determine if each function is linear or nonlinear. Select the correct cell in each row.
Function Linear Nonlinear
𝑦𝑦 = 𝑥𝑥2 − 4
o o
𝑦𝑦 = −2𝑥𝑥 + 1
o o
𝑦𝑦 = 3𝑥𝑥
o o
𝑦𝑦 =
𝑥𝑥3
o o
14-GR8-LV1-8.F.3
MAP-TESTLET-MATH-GRADE 8 MISSISSIPPI DEPARTMENT OF EDUCATION © 17
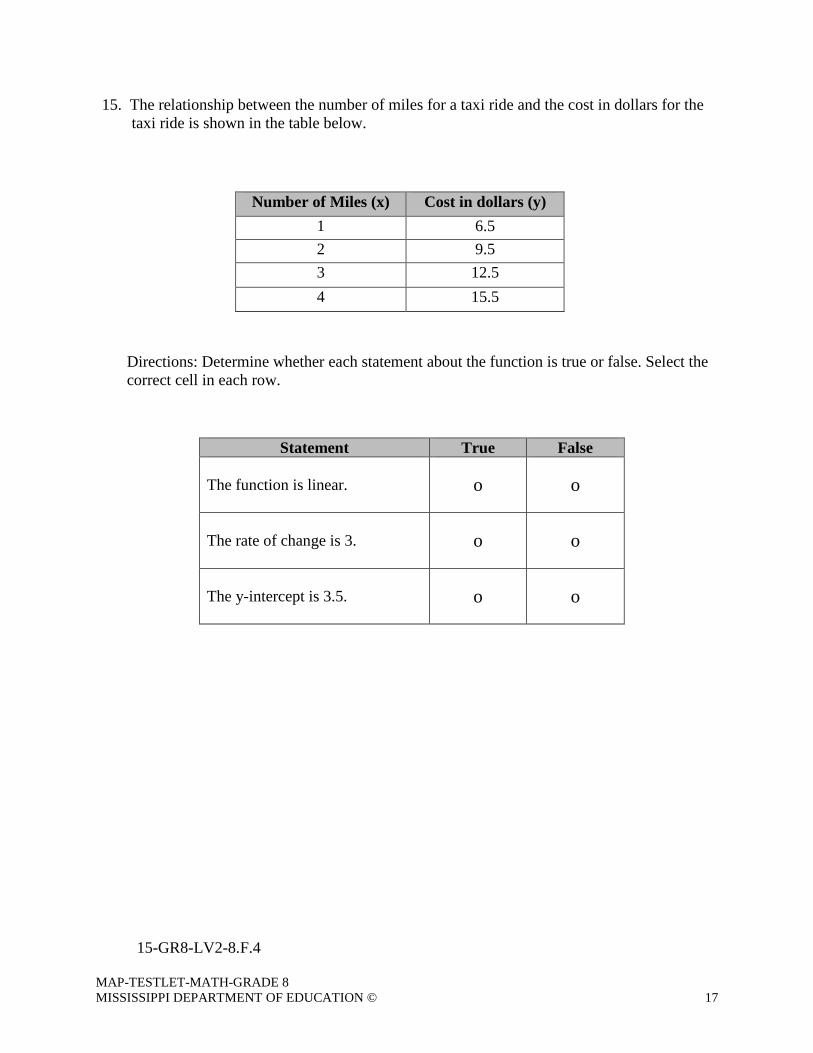
15. The relationship between the number of miles for a taxi ride and the cost in dollars for the taxi ride is shown in the table below.
Directions: Determine whether each statement about the function is true or false. Select the correct cell in each row.
Number of Miles (x) Cost in dollars (y) 1 6.5 2 9.5 3 12.5 4 15.5
Statement True False The function is linear.
o o
The rate of change is 3.
o o
The y-intercept is 3.5.
o o
15-GR8-LV2-8.F.4
MAP-TESTLET-MATH-GRADE 8 MISSISSIPPI DEPARTMENT OF EDUCATION © 18
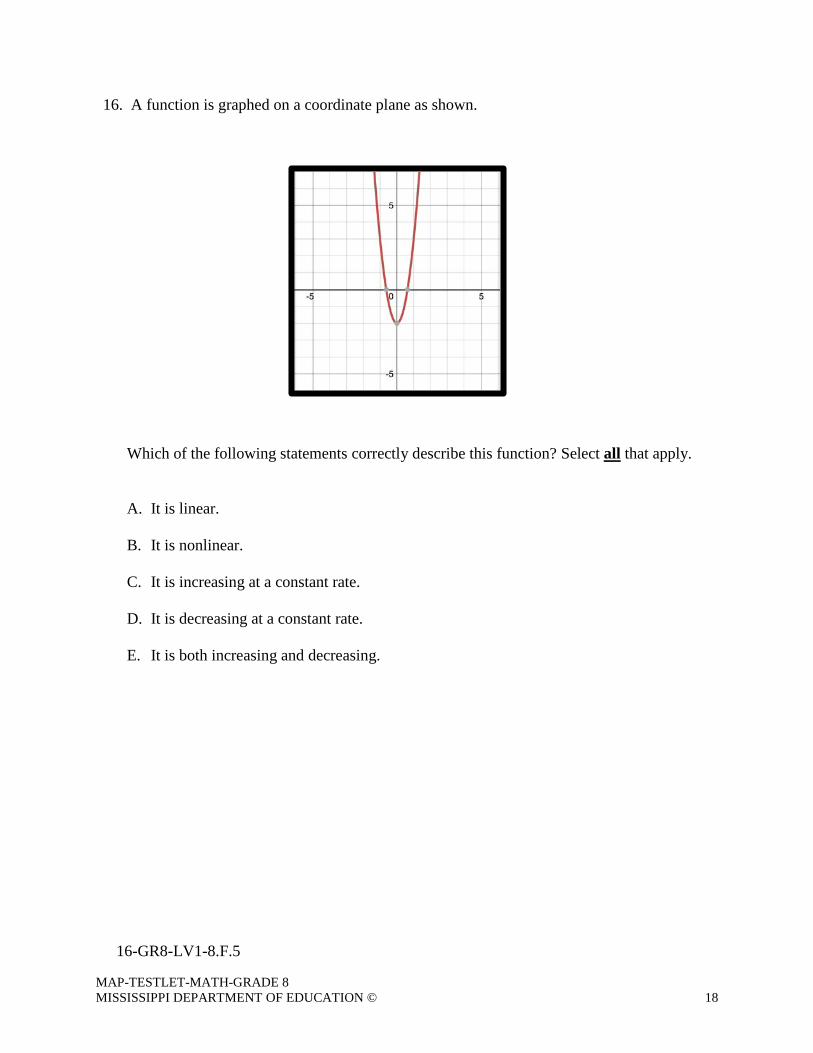
16. A function is graphed on a coordinate plane as shown. Which of the following statements correctly describe this function? Select all that apply.
A. It is linear.
B. It is nonlinear.
C. It is increasing at a constant rate.
D. It is decreasing at a constant rate.
E. It is both increasing and decreasing.
16-GR8-LV1-8.F.5
MAP-TESTLET-MATH-GRADE 8 MISSISSIPPI DEPARTMENT OF EDUCATION © 19
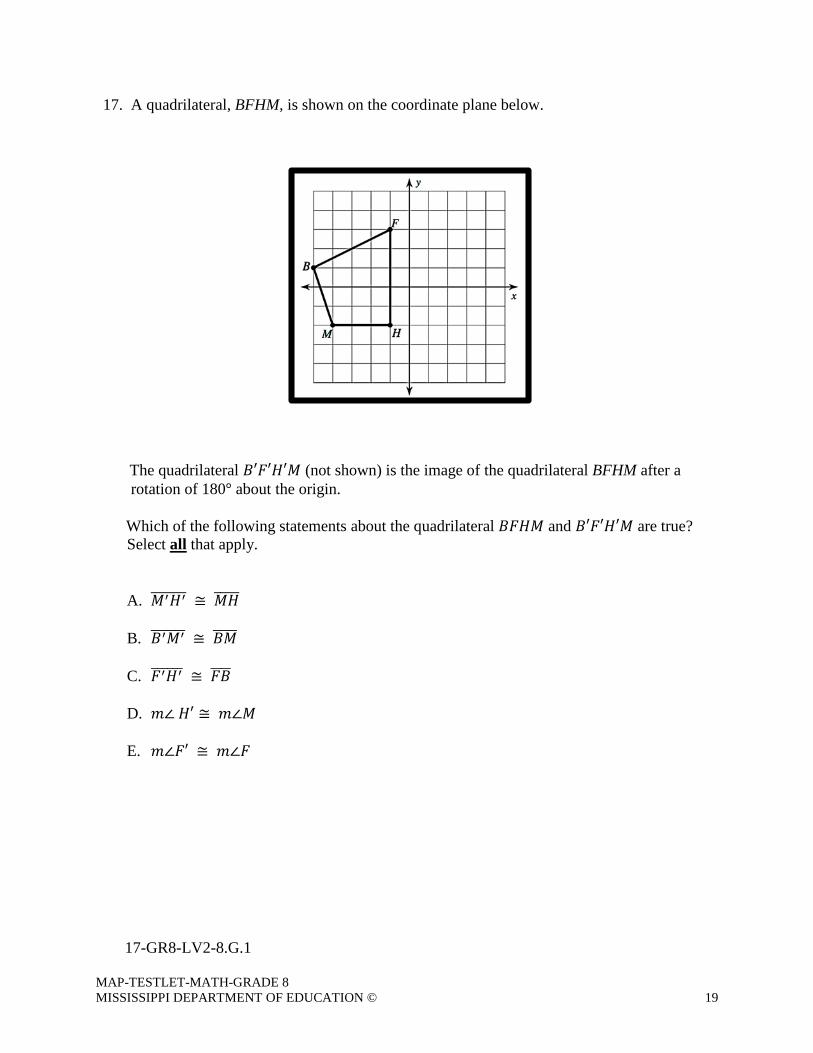
17. A quadrilateral, BFHM, is shown on the coordinate plane below. The quadrilateral 𝐵𝐵′𝐹𝐹′𝐻𝐻′𝑀𝑀 (not shown) is the image of the quadrilateral BFHM after a rotation of 180° about the origin. Which of the following statements about the quadrilateral 𝐵𝐵𝐹𝐹𝐻𝐻𝑀𝑀 and 𝐵𝐵′𝐹𝐹′𝐻𝐻′𝑀𝑀 are true? Select all that apply.
A. 𝑀𝑀′𝐻𝐻′������� ≅ 𝑀𝑀𝐻𝐻�����
B. 𝐵𝐵′𝑀𝑀′������� ≅ 𝐵𝐵𝑀𝑀�����
C. 𝐹𝐹′𝐻𝐻′������ ≅ 𝐹𝐹𝐵𝐵����
D. 𝑚𝑚∠ 𝐻𝐻′ ≅ 𝑚𝑚∠𝑀𝑀
E. 𝑚𝑚∠𝐹𝐹′ ≅ 𝑚𝑚∠𝐹𝐹
17-GR8-LV2-8.G.1
MAP-TESTLET-MATH-GRADE 8 MISSISSIPPI DEPARTMENT OF EDUCATION © 20
18. Triangle ABC was rotated to form Triangle 𝐴𝐴′𝐵𝐵′𝐶𝐶′. Triangle 𝐴𝐴′𝐵𝐵′𝐶𝐶′ was reflected across the x-axis to form Triangle 𝐴𝐴′′𝐵𝐵′′𝐶𝐶′′.
Which of the following statements correctly describe the relationship between Triangle
ABC, Triangle 𝐴𝐴′𝐵𝐵′𝐶𝐶′, and Triangle 𝐴𝐴′′𝐵𝐵′′𝐶𝐶′′? Select all that apply.
A. Triangle 𝐴𝐴′𝐵𝐵′𝐶𝐶′ is congruent to Triangle 𝐴𝐴′′𝐵𝐵′′𝐶𝐶′′.
B. Triangle 𝐴𝐴𝐵𝐵𝐶𝐶 is congruent to Triangle 𝐴𝐴′′𝐵𝐵′′𝐶𝐶′′.
C. Triangle 𝐴𝐴𝐵𝐵𝐶𝐶 has greater side lengths than Triangle 𝐴𝐴′′𝐵𝐵′′𝐶𝐶′′.
D. Triangle 𝐴𝐴′𝐵𝐵′𝐶𝐶′ has greater angle measurements than Triangle 𝐴𝐴′′𝐵𝐵′′𝐶𝐶′′.
E. Triangle 𝐴𝐴𝐵𝐵𝐶𝐶 has greater angle measurements than Triangle 𝐴𝐴′′𝐵𝐵′′𝐶𝐶′′.
18-GR8-LV2-8.G.2
MAP-TESTLET-MATH-GRADE 8 MISSISSIPPI DEPARTMENT OF EDUCATION © 21
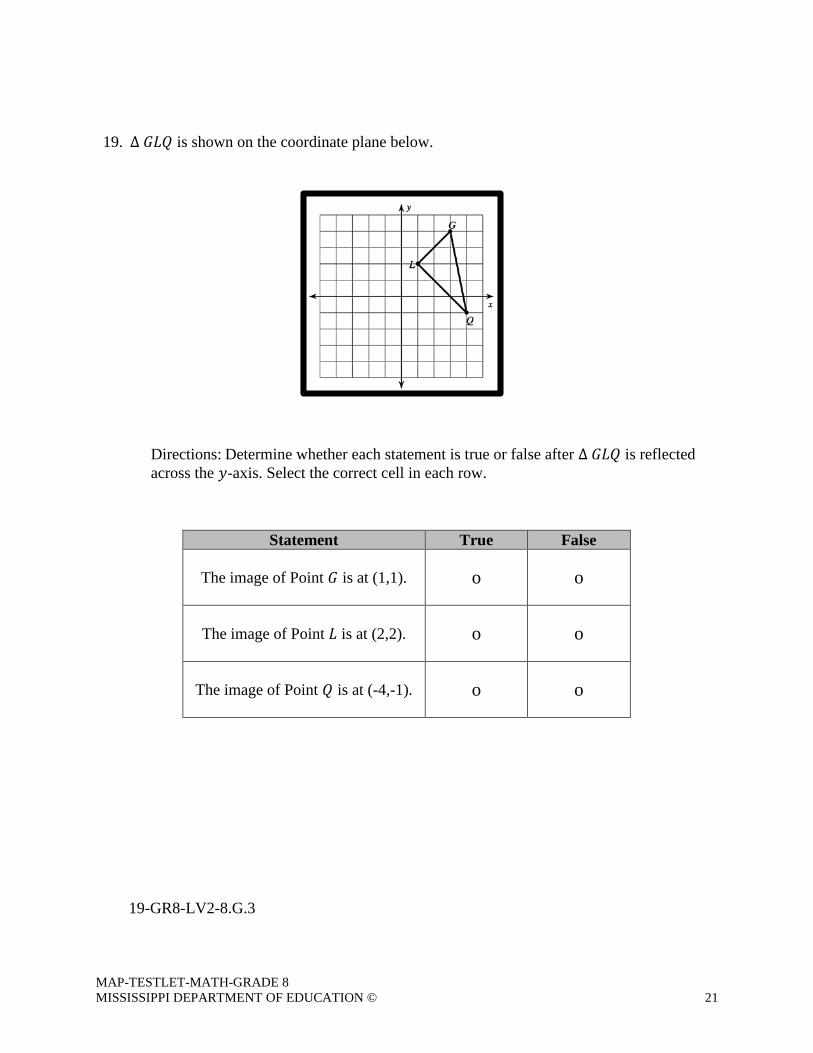
19. ∆ 𝐺𝐺𝐺𝐺𝐺𝐺 is shown on the coordinate plane below.
Directions: Determine whether each statement is true or false after ∆ 𝐺𝐺𝐺𝐺𝐺𝐺 is reflected across the 𝑦𝑦-axis. Select the correct cell in each row.
Statement True False
The image of Point 𝐺𝐺 is at (1,1).
o o
The image of Point 𝐺𝐺 is at (2,2).
o o
The image of Point 𝐺𝐺 is at (-4,-1).
o o
19-GR8-LV2-8.G.3
MAP-TESTLET-MATH-GRADE 8 MISSISSIPPI DEPARTMENT OF EDUCATION © 22
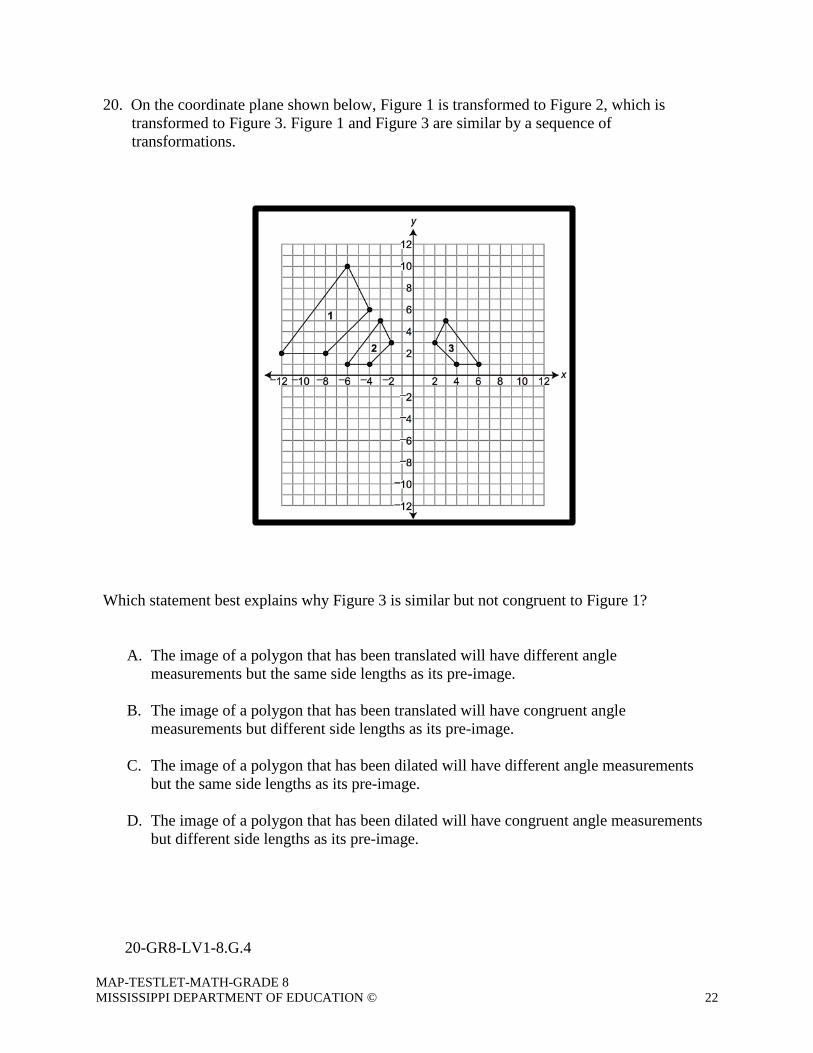
20. On the coordinate plane shown below, Figure 1 is transformed to Figure 2, which is transformed to Figure 3. Figure 1 and Figure 3 are similar by a sequence of transformations.
Which statement best explains why Figure 3 is similar but not congruent to Figure 1?
A. The image of a polygon that has been translated will have different angle measurements but the same side lengths as its pre-image.
B. The image of a polygon that has been translated will have congruent angle
measurements but different side lengths as its pre-image.
C. The image of a polygon that has been dilated will have different angle measurements but the same side lengths as its pre-image.
D. The image of a polygon that has been dilated will have congruent angle measurements
but different side lengths as its pre-image.
20-GR8-LV1-8.G.4
MAP-TESTLET-MATH-GRADE 8 MISSISSIPPI DEPARTMENT OF EDUCATION © 23
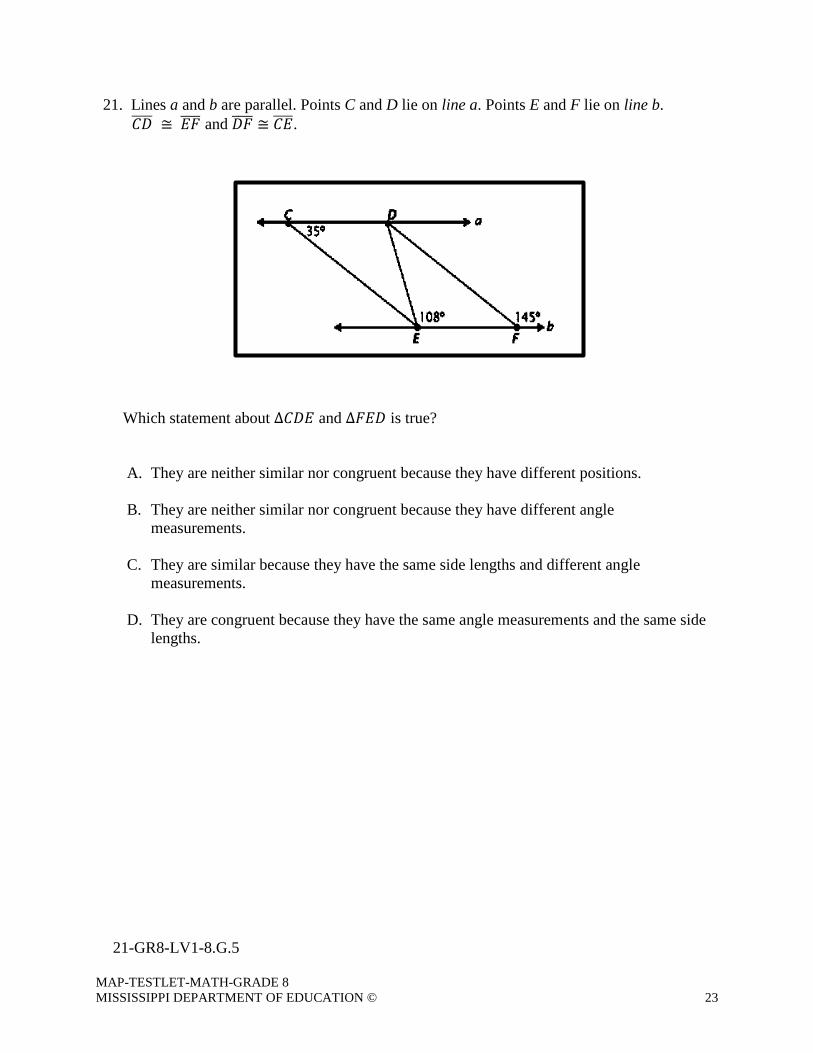
21. Lines a and b are parallel. Points C and D lie on line a. Points E and F lie on line b. 𝐶𝐶𝐶𝐶���� ≅ 𝐸𝐸𝐹𝐹���� and 𝐶𝐶𝐹𝐹���� ≅ 𝐶𝐶𝐸𝐸����.
Which statement about ∆𝐶𝐶𝐶𝐶𝐸𝐸 and ∆𝐹𝐹𝐸𝐸𝐶𝐶 is true?
A. They are neither similar nor congruent because they have different positions. B. They are neither similar nor congruent because they have different angle
measurements. C. They are similar because they have the same side lengths and different angle
measurements.
D. They are congruent because they have the same angle measurements and the same side lengths.
21-GR8-LV1-8.G.5
MAP-TESTLET-MATH-GRADE 8 MISSISSIPPI DEPARTMENT OF EDUCATION © 24
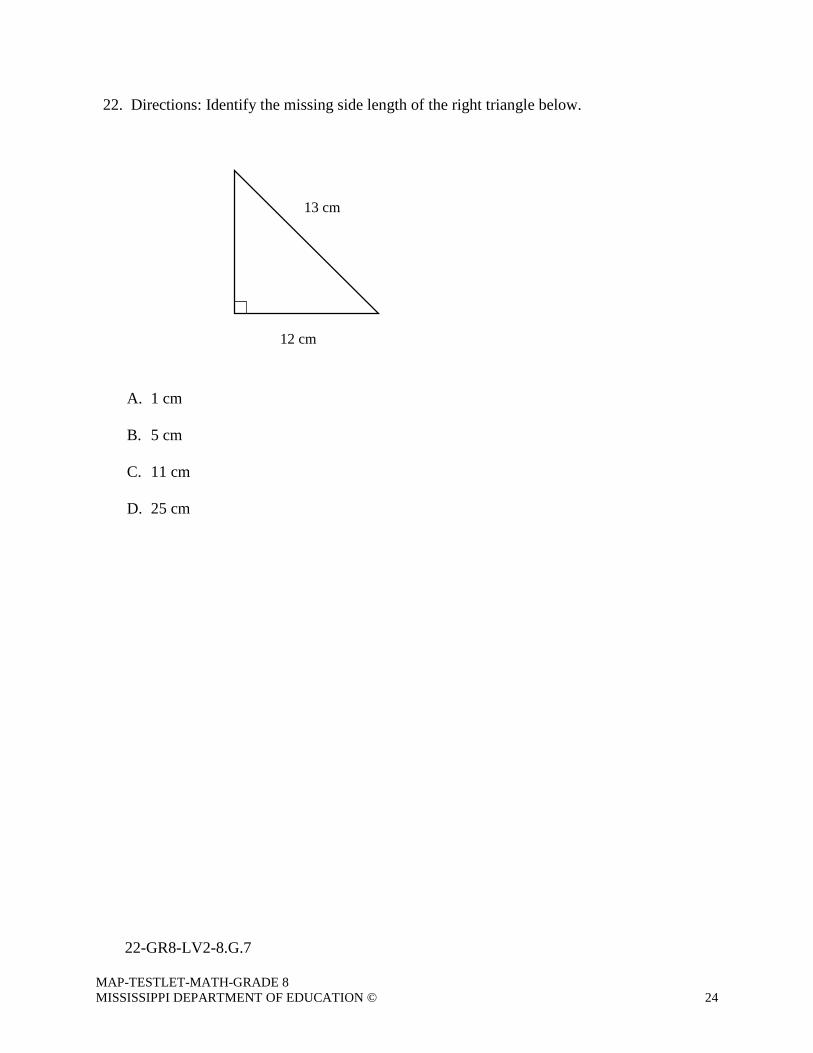
22. Directions: Identify the missing side length of the right triangle below.
A. 1 cm
B. 5 cm
C. 11 cm
D. 25 cm
22-GR8-LV2-8.G.7
13 cm
12 cm
MAP-TESTLET-MATH-GRADE 8 MISSISSIPPI DEPARTMENT OF EDUCATION © 25
23. Henry is fishing from a small boat. His fishing hook is in the water 8 meters directly below his boat. A fish is swimming at the same depth as the hook, however it is 15 meters away from the hook. What is the shortest distance between Henry and the fish?
meters
23-GR8-LV2-8.G.7
MAP-TESTLET-MATH-GRADE 8 MISSISSIPPI DEPARTMENT OF EDUCATION © 26
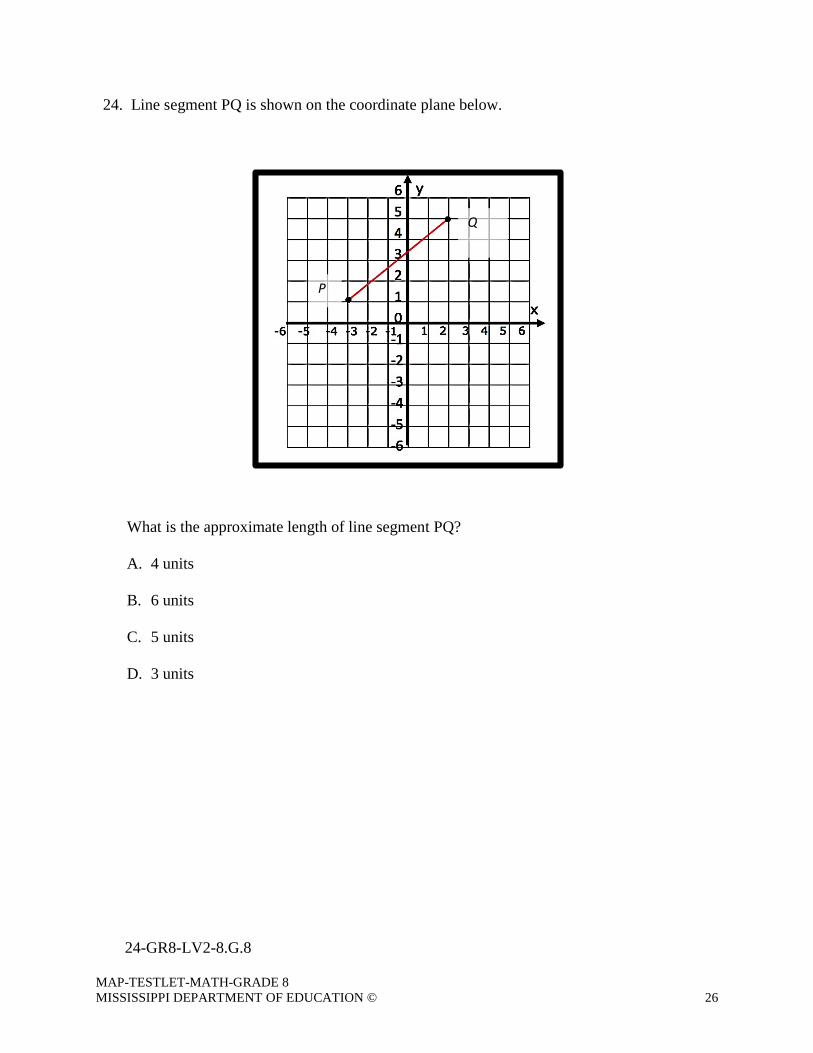
24. Line segment PQ is shown on the coordinate plane below. What is the approximate length of line segment PQ?
A. 4 units
B. 6 units
C. 5 units
D. 3 units
24-GR8-LV2-8.G.8
P
Q
MAP-TESTLET-MATH-GRADE 8 MISSISSIPPI DEPARTMENT OF EDUCATION © 27
25. A cylindrical tank has a height of 10 feet and a radius of 4 feet. Carla fills the tank with water at a rate of 8 cubic feet per minute. At this rate, how many minutes will it take Carla to completely fill the tank without it overflowing?
Round your answer to the nearest minute.
minutes
25-GR8-LV2-8.G.9
MAP-TESTLET-MATH-GRADE 8 MISSISSIPPI DEPARTMENT OF EDUCATION © 28
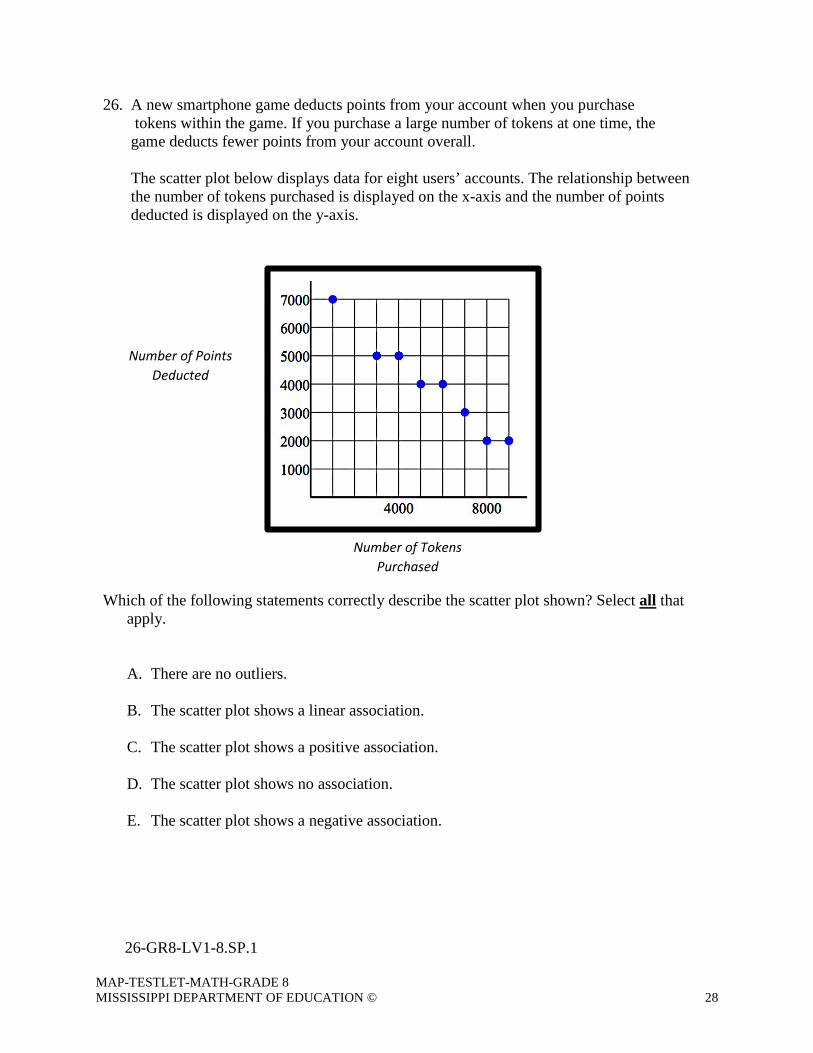
26. A new smartphone game deducts points from your account when you purchase tokens within the game. If you purchase a large number of tokens at one time, the game deducts fewer points from your account overall. The scatter plot below displays data for eight users’ accounts. The relationship between the number of tokens purchased is displayed on the x-axis and the number of points deducted is displayed on the y-axis. Which of the following statements correctly describe the scatter plot shown? Select all that apply.
A. There are no outliers.
B. The scatter plot shows a linear association.
C. The scatter plot shows a positive association.
D. The scatter plot shows no association.
E. The scatter plot shows a negative association.
26-GR8-LV1-8.SP.1
Number of Points Deducted
Number of Tokens Purchased
MAP-TESTLET-MATH-GRADE 8 MISSISSIPPI DEPARTMENT OF EDUCATION © 29
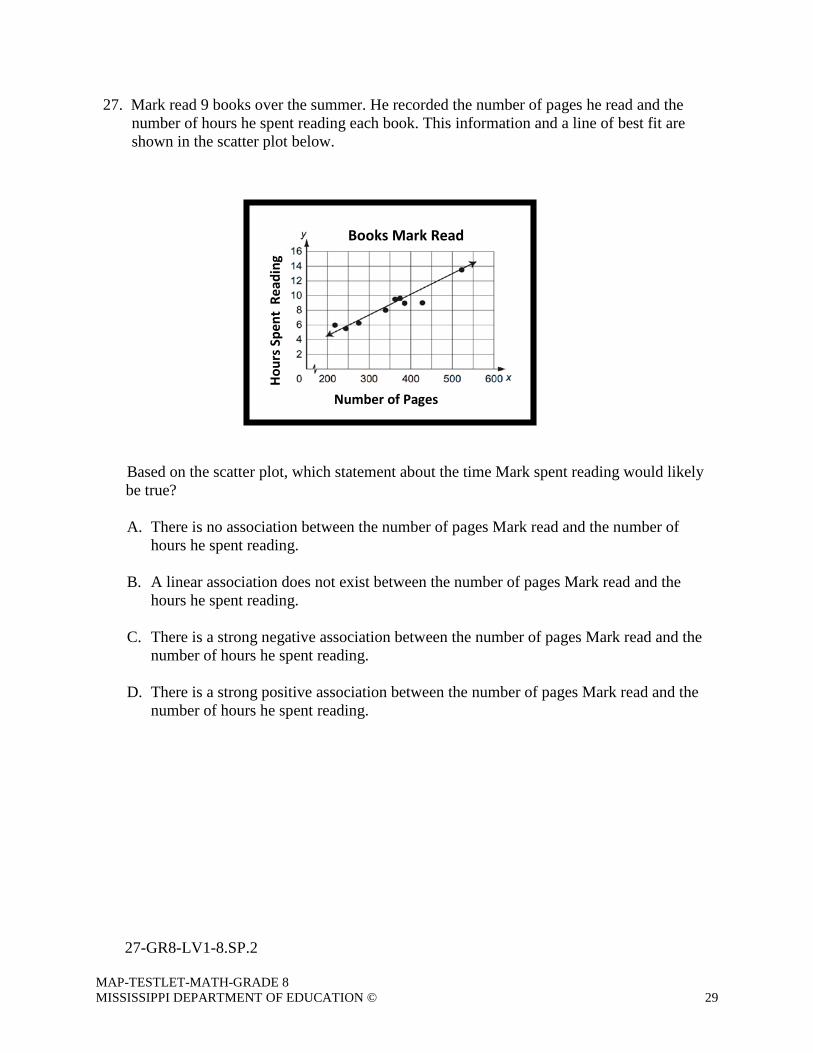
27. Mark read 9 books over the summer. He recorded the number of pages he read and the number of hours he spent reading each book. This information and a line of best fit are shown in the scatter plot below.
Based on the scatter plot, which statement about the time Mark spent reading would likely
be true?
A. There is no association between the number of pages Mark read and the number of hours he spent reading.
B. A linear association does not exist between the number of pages Mark read and the hours he spent reading.
C. There is a strong negative association between the number of pages Mark read and the number of hours he spent reading.
D. There is a strong positive association between the number of pages Mark read and the number of hours he spent reading.
Hour
s Spe
nt R
eadi
ng
Books Mark Read
Number of Pages
27-GR8-LV1-8.SP.2
MAP-TESTLET-MATH-GRADE 8 MISSISSIPPI DEPARTMENT OF EDUCATION © 30
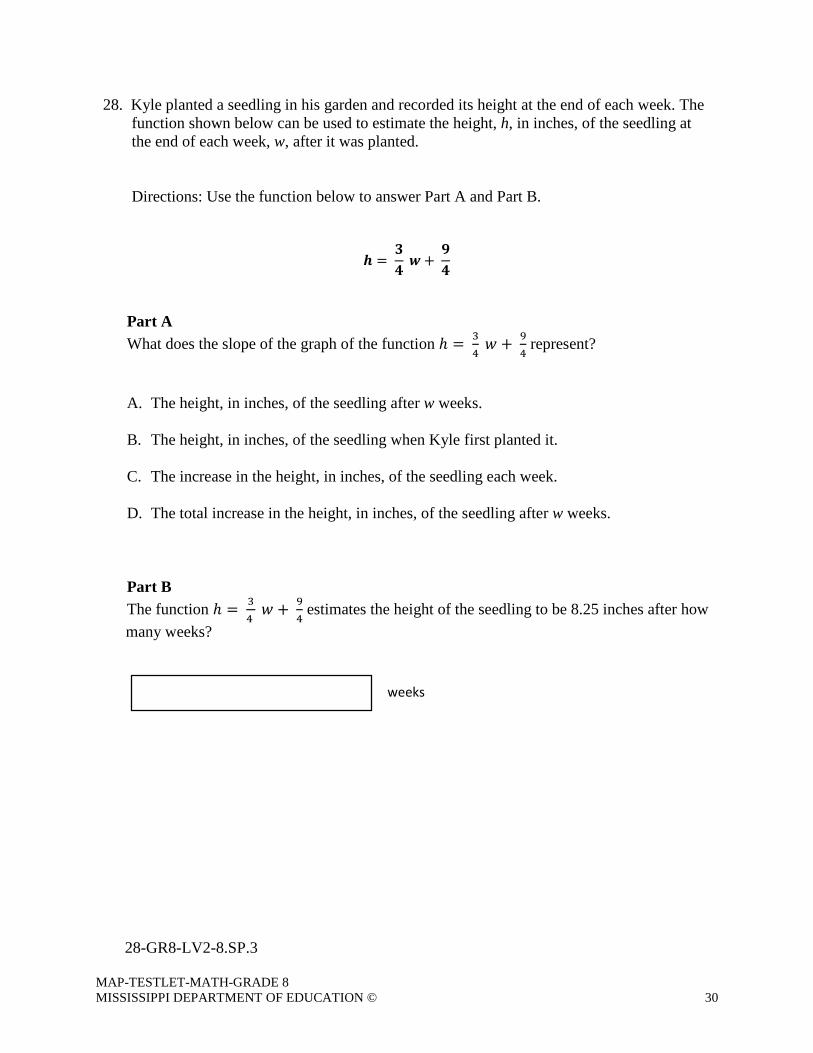
28. Kyle planted a seedling in his garden and recorded its height at the end of each week. The function shown below can be used to estimate the height, h, in inches, of the seedling at the end of each week, w, after it was planted.
Directions: Use the function below to answer Part A and Part B.
𝒉𝒉 = 𝟑𝟑𝟒𝟒
𝒘𝒘 + 𝟗𝟗𝟒𝟒
Part A What does the slope of the graph of the function ℎ = 3
4 𝑤𝑤 + 9
4 represent?
A. The height, in inches, of the seedling after w weeks.
B. The height, in inches, of the seedling when Kyle first planted it.
C. The increase in the height, in inches, of the seedling each week.
D. The total increase in the height, in inches, of the seedling after w weeks. Part B The function ℎ = 3
4 𝑤𝑤 + 9
4 estimates the height of the seedling to be 8.25 inches after how
many weeks?
28-GR8-LV2-8.SP.3
weeks
MAP-TESTLET-MATH-GRADE 8 MISSISSIPPI DEPARTMENT OF EDUCATION © 31
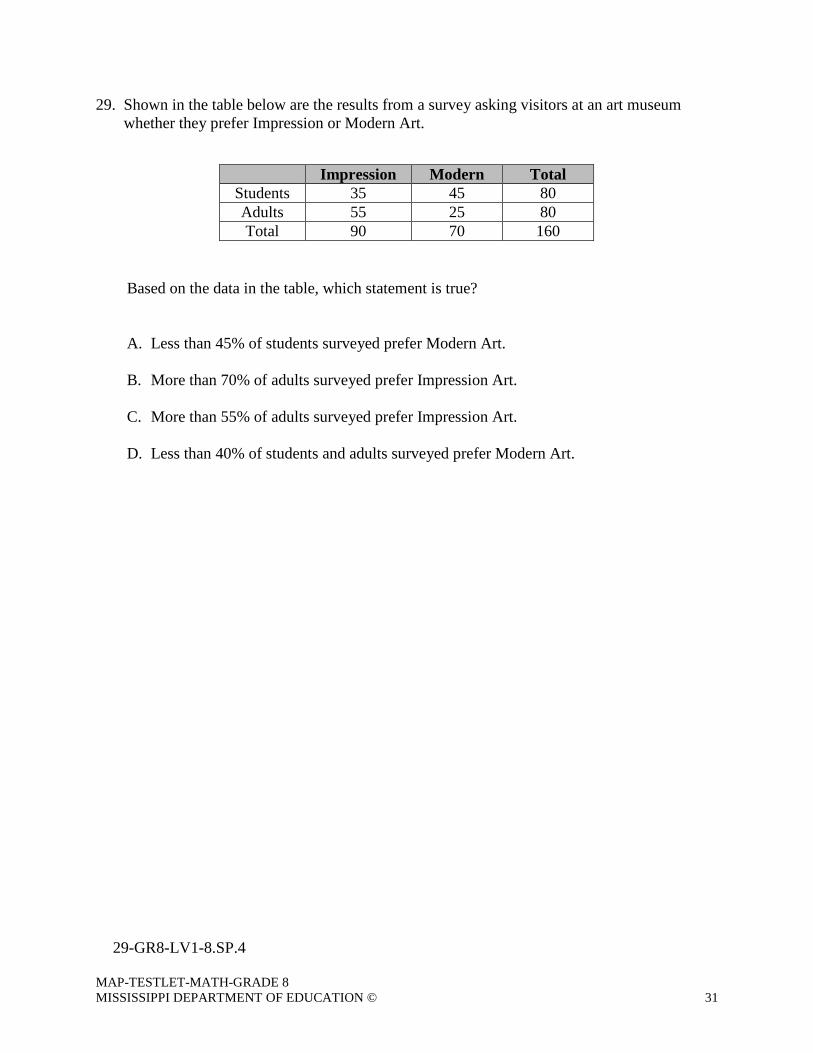
29. Shown in the table below are the results from a survey asking visitors at an art museum whether they prefer Impression or Modern Art. Based on the data in the table, which statement is true?
A. Less than 45% of students surveyed prefer Modern Art.
B. More than 70% of adults surveyed prefer Impression Art.
C. More than 55% of adults surveyed prefer Impression Art.
D. Less than 40% of students and adults surveyed prefer Modern Art.
Impression Modern Total Students 35 45 80 Adults 55 25 80 Total 90 70 160
29-GR8-LV1-8.SP.4
MAP-TESTLET-MATH-GRADE 8 MISSISSIPPI DEPARTMENT OF EDUCATION © 32
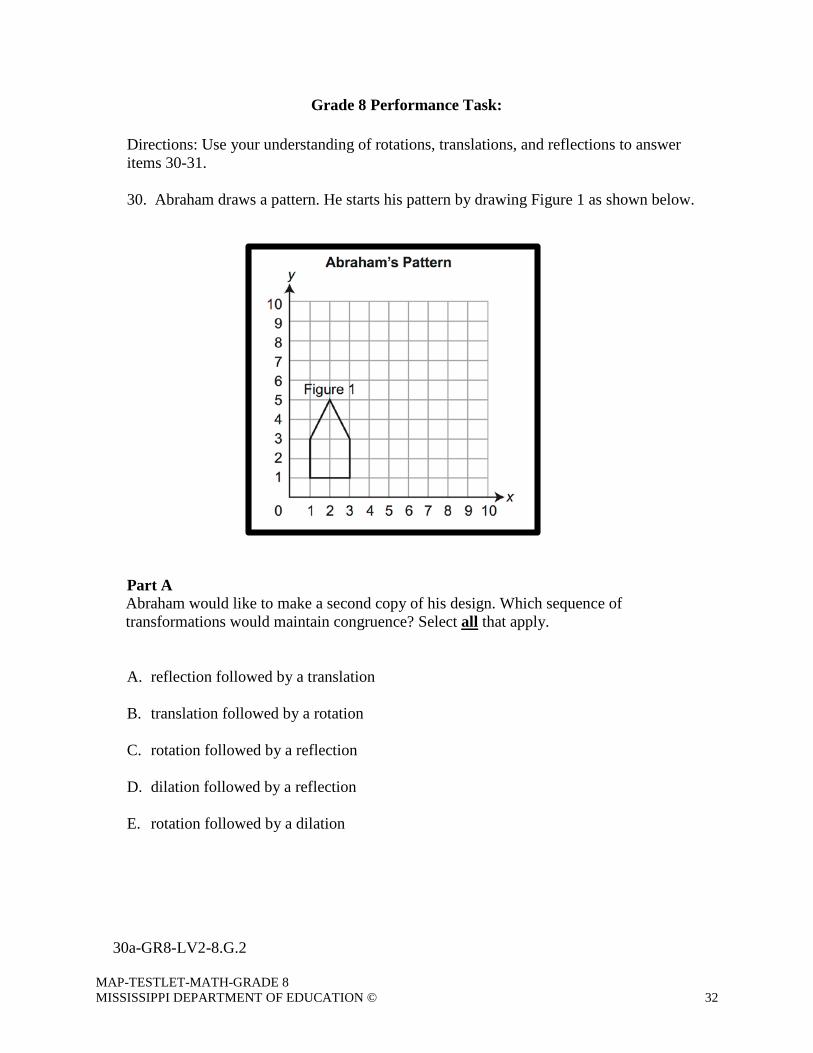
Grade 8 Performance Task:
Directions: Use your understanding of rotations, translations, and reflections to answer items 30-31. 30. Abraham draws a pattern. He starts his pattern by drawing Figure 1 as shown below.
Part A
Abraham would like to make a second copy of his design. Which sequence of transformations would maintain congruence? Select all that apply. A. reflection followed by a translation
B. translation followed by a rotation
C. rotation followed by a reflection
D. dilation followed by a reflection
E. rotation followed by a dilation
30a-GR8-LV2-8.G.2
MAP-TESTLET-MATH-GRADE 8 MISSISSIPPI DEPARTMENT OF EDUCATION © 33
Part B Abraham rotates Figure 1 180° around the point (2, 3), translates the figure 4 units to the
right, and labels it Figure 2. Which of the following statements are true? Select all that apply.
A. Figure 1 and Figure 2 have one pair of parallel line segments.
B. Figure 1 and Figure 2 are not the same shape.
C. The area of Figure 1 is less than the area of Figure 2
D. The perimeter of Figure 1 is greater than the perimeter of Figure 2.
E. The acute angles in Figure 1 and Figure 2 are congruent to one another.
30b-GR8-LV2-8.G.1
MAP-TESTLET-MATH-GRADE 8 MISSISSIPPI DEPARTMENT OF EDUCATION © 34
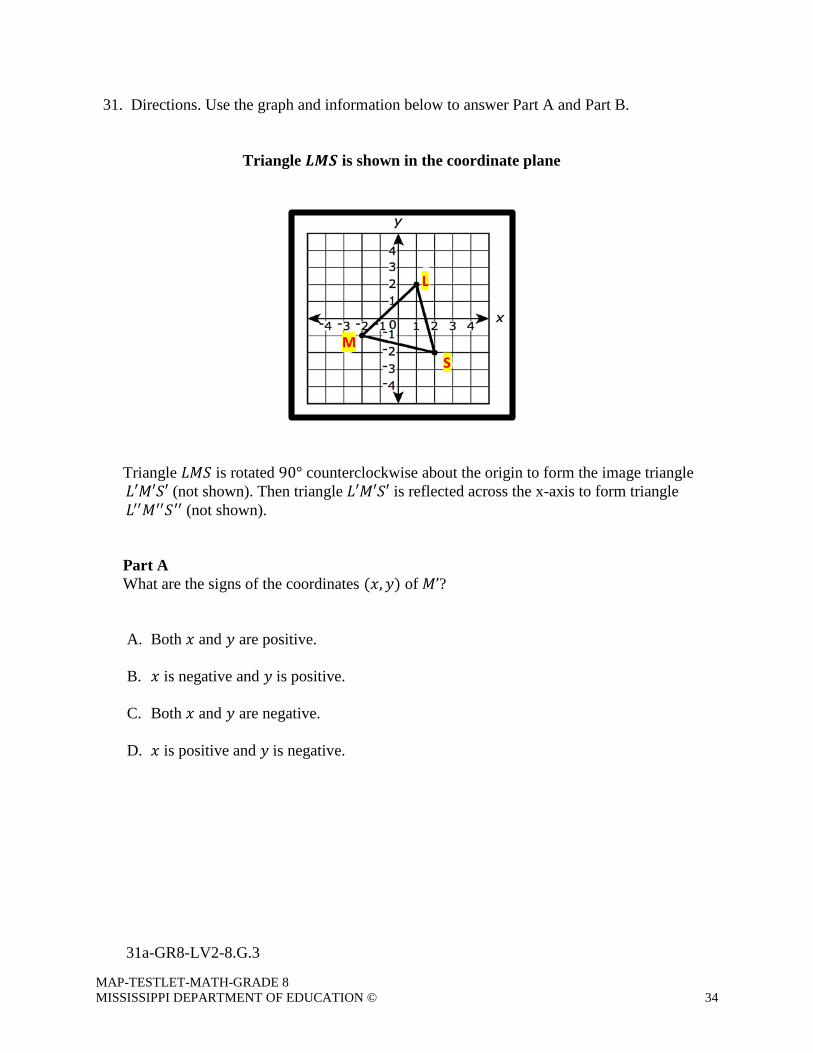
31. Directions. Use the graph and information below to answer Part A and Part B.
Triangle 𝑳𝑳𝑳𝑳𝑳𝑳 is shown in the coordinate plane
Triangle 𝐺𝐺𝑀𝑀𝐿𝐿 is rotated 90° counterclockwise about the origin to form the image triangle
𝐺𝐺′𝑀𝑀′𝐿𝐿′ (not shown). Then triangle 𝐺𝐺′𝑀𝑀′𝐿𝐿′ is reflected across the x-axis to form triangle 𝐺𝐺′′𝑀𝑀′′𝐿𝐿′′ (not shown).
Part A What are the signs of the coordinates (𝑥𝑥,𝑦𝑦) of 𝑀𝑀’?
A. Both 𝑥𝑥 and 𝑦𝑦 are positive.
B. 𝑥𝑥 is negative and 𝑦𝑦 is positive.
C. Both 𝑥𝑥 and 𝑦𝑦 are negative.
D. 𝑥𝑥 is positive and 𝑦𝑦 is negative.
31a-GR8-LV2-8.G.3
L
S M
MAP-TESTLET-MATH-GRADE 8 MISSISSIPPI DEPARTMENT OF EDUCATION © 35
Part B What are the signs of the coordinates (𝑥𝑥,𝑦𝑦) of 𝐺𝐺’’?
A. Both 𝑥𝑥 and 𝑦𝑦 are positive. B. 𝑥𝑥 is negative and 𝑦𝑦 is positive.
C. Both 𝑥𝑥 and 𝑦𝑦 are negative.
D. 𝑥𝑥 is positive and 𝑦𝑦 is negative.
31b-GR8-LV2-8.G.3
MAP-TESTLET-MATH-GRADE 8 MISSISSIPPI DEPARTMENT OF EDUCATION © 36
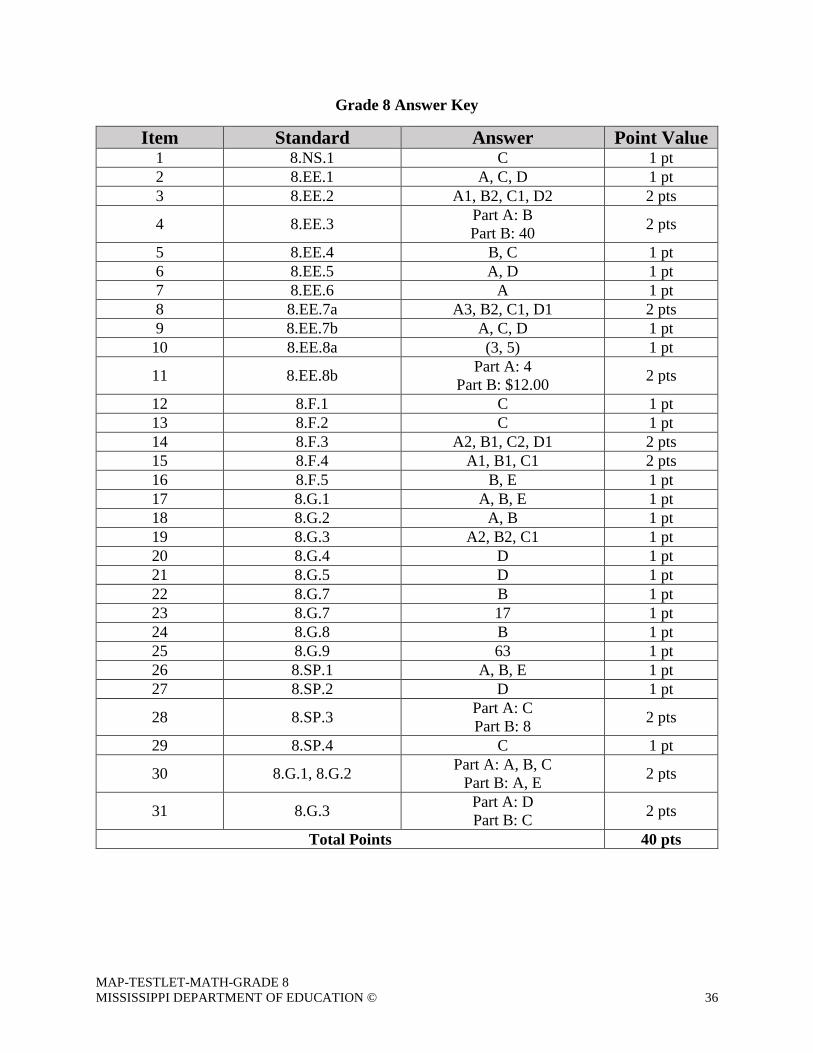
Grade 8 Answer Key
Item Standard Answer Point Value 1 8.NS.1 C 1 pt 2 8.EE.1 A, C, D 1 pt 3 8.EE.2 A1, B2, C1, D2 2 pts
4 8.EE.3 Part A: B Part B: 40 2 pts
5 8.EE.4 B, C 1 pt 6 8.EE.5 A, D 1 pt 7 8.EE.6 A 1 pt 8 8.EE.7a A3, B2, C1, D1 2 pts 9 8.EE.7b A, C, D 1 pt 10 8.EE.8a (3, 5) 1 pt
11 8.EE.8b Part A: 4 Part B: $12.00 2 pts
12 8.F.1 C 1 pt 13 8.F.2 C 1 pt 14 8.F.3 A2, B1, C2, D1 2 pts 15 8.F.4 A1, B1, C1 2 pts 16 8.F.5 B, E 1 pt 17 8.G.1 A, B, E 1 pt 18 8.G.2 A, B 1 pt 19 8.G.3 A2, B2, C1 1 pt 20 8.G.4 D 1 pt 21 8.G.5 D 1 pt 22 8.G.7 B 1 pt 23 8.G.7 17 1 pt 24 8.G.8 B 1 pt 25 8.G.9 63 1 pt 26 8.SP.1 A, B, E 1 pt 27 8.SP.2 D 1 pt
28 8.SP.3 Part A: C Part B: 8 2 pts
29 8.SP.4 C 1 pt
30 8.G.1, 8.G.2 Part A: A, B, C Part B: A, E 2 pts
31 8.G.3 Part A: D Part B: C 2 pts
Total Points 40 pts
MAP-TESTLET-MATH-GRADE 8 MISSISSIPPI DEPARTMENT OF EDUCATION © 37
Scoring Rules
Step #1: Use the answer key to view the maximum point value for each item.
Step #2: Add the total number of points the student has earned, and divide by the total number of points possible.
Step #3: Determine if the student has earned at least 80% of the total points.


![Comparison of integrated testlet and constructed-response ...examination [10,13]. A reading comprehension testlet provides a classic example of a traditional testlet, with a ... chem-istry,](https://img.pdfslide.us/doc/110x75/5f1781c12018f27c6453dbbd/comparison-of-integrated-testlet-and-constructed-response-examination-1013.jpg)