Embed Size (px)
Citation preview
Missions Management Tool
2017
Prepared for
University of Hawaii, John A. Burns School of Medicine
Association of American Medical Colleges
Missions Management Tool 2017 2
© 2017. Association of American Medical Colleges. May be reproduced for non-commercial, educational purposes only.
Missions Management Tool 2017 3
Missions Management Tool 2017
Table of Contents MMT
2017
Executive Summary……….………………..…..………………………......…………………………………………………………………
4
Definitions of Benchmark Performance Measures....................……………….…………………………………..……..
7
Missions Benchmark Tables
Mission 1: Graduate a Workforce that Will Address the Priority Health Needs of the Nation..............................
13
Mission 2: Prepare a Diverse Physician Workforce……………….................................................... ........................
14
Mission 3: Foster the Advancement of Medical Discovery..........................................................................................…..........
15
Mission 4: Provide High Quality Medical Education as Judged by Your Recent Graduates.…………………….……..
16
Mission 5: Prepare Physicians to Fulfill the Needs of the Community………………………………………..……………..…..
17
Mission 6: Graduate a Medical School Class with Manageable Debt……………………………...………..……………..……
18
For general questions or thoughts about this report, contact Ron Espiritu, Senior Director, Medical School Operations, at [email protected] or Hershel Alexander, Ph.D., Director, Data Operations and Services, at [email protected].
Missions Management Tool 2017 4
Missions Management Tool 2017
Executive Summary MMT
2017
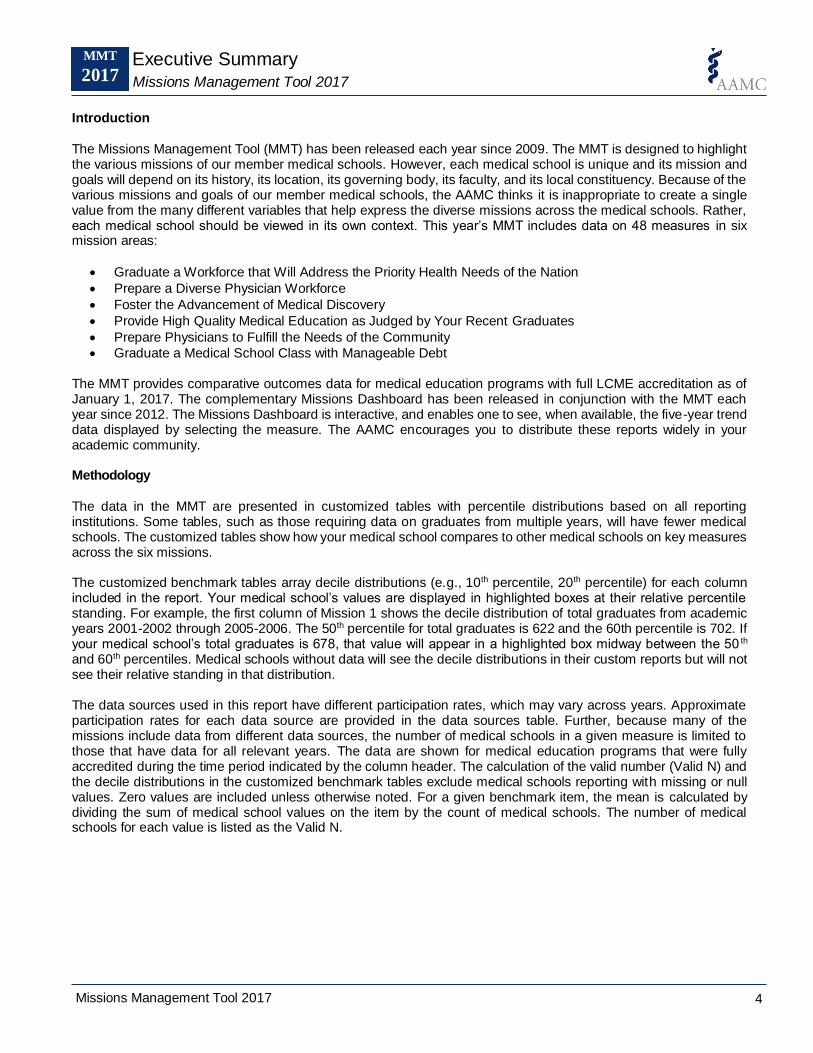
Introduction
The Missions Management Tool (MMT) has been released each year since 2009. The MMT is designed to highlight the various missions of our member medical schools. However, each medical school is unique and its mission and goals will depend on its history, its location, its governing body, its faculty, and its local constituency. Because of the various missions and goals of our member medical schools, the AAMC thinks it is inappropriate to create a single value from the many different variables that help express the diverse missions across the medical schools. Rather, each medical school should be viewed in its own context. This year’s MMT includes data on 48 measures in six mission areas:
Graduate a Workforce that Will Address the Priority Health Needs of the Nation
Prepare a Diverse Physician Workforce
Foster the Advancement of Medical Discovery
Provide High Quality Medical Education as Judged by Your Recent Graduates
Prepare Physicians to Fulfill the Needs of the Community
Graduate a Medical School Class with Manageable Debt The MMT provides comparative outcomes data for medical education programs with full LCME accreditation as of January 1, 2017. The complementary Missions Dashboard has been released in conjunction with the MMT each year since 2012. The Missions Dashboard is interactive, and enables one to see, when available, the five-year trend data displayed by selecting the measure. The AAMC encourages you to distribute these reports widely in your academic community. Methodology
The data in the MMT are presented in customized tables with percentile distributions based on all reporting institutions. Some tables, such as those requiring data on graduates from multiple years, will have fewer medical schools. The customized tables show how your medical school compares to other medical schools on key measures across the six missions. The customized benchmark tables array decile distributions (e.g., 10th percentile, 20th percentile) for each column included in the report. Your medical school’s values are displayed in highlighted boxes at their relative percentile standing. For example, the first column of Mission 1 shows the decile distribution of total graduates from academic years 2001-2002 through 2005-2006. The 50th percentile for total graduates is 622 and the 60th percentile is 702. If your medical school’s total graduates is 678, that value will appear in a highlighted box midway between the 50 th and 60th percentiles. Medical schools without data will see the decile distributions in their custom reports but will not see their relative standing in that distribution. The data sources used in this report have different participation rates, which may vary across years. Approximate participation rates for each data source are provided in the data sources table. Further, because many of the missions include data from different data sources, the number of medical schools in a given measure is limited to those that have data for all relevant years. The data are shown for medical education programs that were fully accredited during the time period indicated by the column header. The calculation of the valid number (Valid N) and the decile distributions in the customized benchmark tables exclude medical schools reporting with missing or null values. Zero values are included unless otherwise noted. For a given benchmark item, the mean is calculated by dividing the sum of medical school values on the item by the count of medical schools. The number of medical schools for each value is listed as the Valid N.
Missions Management Tool 2017 5
Missions Management Tool 2017
Executive Summary MMT
2017
Changes in the 2017 Iteration of the MMT and Missions Dashboard
The 2017 iteration of the MMT and Missions Dashboard includes the following new measures in Mission 5 “Prepare Physicians to Fulfill the Needs of the Community”:
Plans to participate in military service Plans to participate in a loan forgiveness program with service commitment
Missions Management Tool 2017 6
Missions Management Tool 2017
Executive Summary MMT
2017
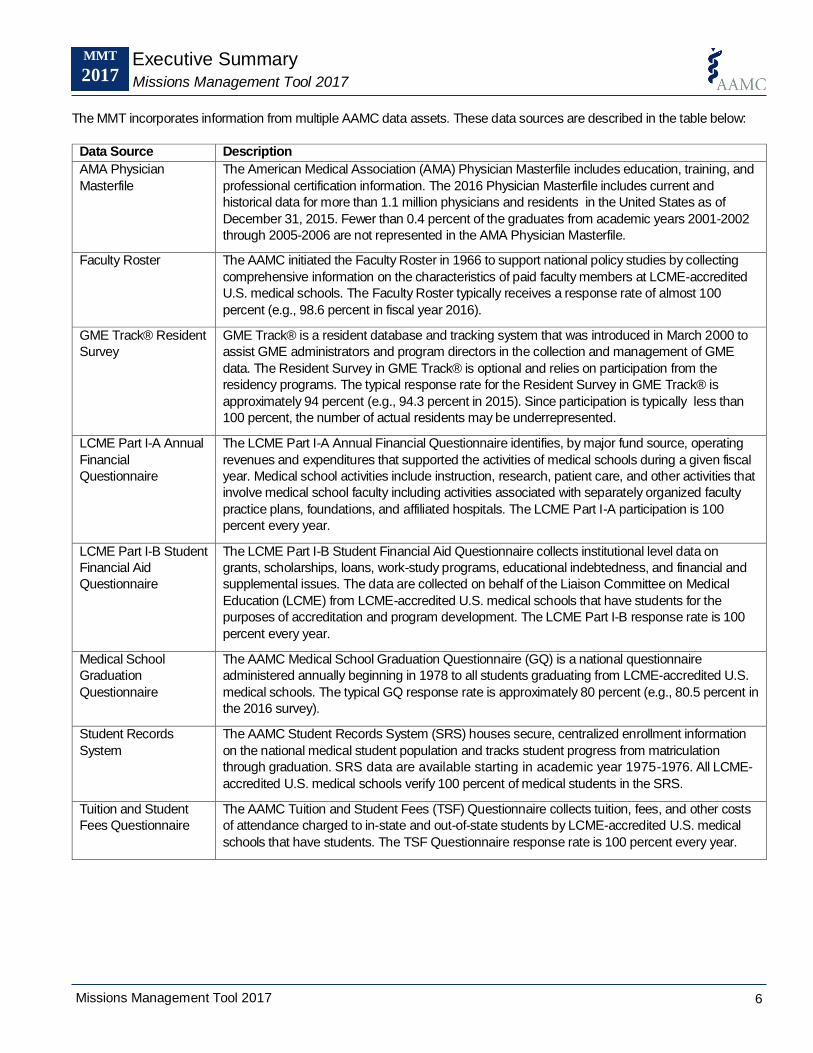
The MMT incorporates information from multiple AAMC data assets. These data sources are described in the table below:
Data Source Description
AMA Physician
Masterfile
The American Medical Association (AMA) Physician Masterfile includes education, training, and
professional certification information. The 2016 Physician Masterfile includes current and
historical data for more than 1.1 million physicians and residents in the United States as of
December 31, 2015. Fewer than 0.4 percent of the graduates from academic years 2001-2002
through 2005-2006 are not represented in the AMA Physician Masterfile.
Faculty Roster
The AAMC initiated the Faculty Roster in 1966 to support national policy studies by collecting
comprehensive information on the characteristics of paid faculty members at LCME-accredited
U.S. medical schools. The Faculty Roster typically receives a response rate of almost 100
percent (e.g., 98.6 percent in fiscal year 2016).
GME Track® Resident
Survey
GME Track® is a resident database and tracking system that was introduced in March 2000 to
assist GME administrators and program directors in the collection and management of GME
data. The Resident Survey in GME Track® is optional and relies on participation from the
residency programs. The typical response rate for the Resident Survey in GME Track® is
approximately 94 percent (e.g., 94.3 percent in 2015). Since participation is typically less than
100 percent, the number of actual residents may be underrepresented.
LCME Part I-A Annual
Financial
Questionnaire
The LCME Part I-A Annual Financial Questionnaire identifies, by major fund source, operating
revenues and expenditures that supported the activities of medical schools during a given fiscal
year. Medical school activities include instruction, research, patient care, and other activities that
involve medical school faculty including activities associated with separately organized faculty
practice plans, foundations, and affiliated hospitals. The LCME Part I-A participation is 100
percent every year.
LCME Part I-B Student
Financial Aid
Questionnaire
The LCME Part I-B Student Financial Aid Questionnaire collects institutional level data on
grants, scholarships, loans, work-study programs, educational indebtedness, and financial and
supplemental issues. The data are collected on behalf of the Liaison Committee on Medical
Education (LCME) from LCME-accredited U.S. medical schools that have students for the
purposes of accreditation and program development. The LCME Part I-B response rate is 100
percent every year.
Medical School
Graduation
Questionnaire
The AAMC Medical School Graduation Questionnaire (GQ) is a national questionnaire
administered annually beginning in 1978 to all students graduating from LCME-accredited U.S.
medical schools. The typical GQ response rate is approximately 80 percent (e.g., 80.5 percent in
the 2016 survey).
Student Records
System
The AAMC Student Records System (SRS) houses secure, centralized enrollment information
on the national medical student population and tracks student progress from matriculation
through graduation. SRS data are available starting in academic year 1975-1976. All LCME-
accredited U.S. medical schools verify 100 percent of medical students in the SRS.
Tuition and Student
Fees Questionnaire
The AAMC Tuition and Student Fees (TSF) Questionnaire collects tuition, fees, and other costs
of attendance charged to in-state and out-of-state students by LCME-accredited U.S. medical
schools that have students. The TSF Questionnaire response rate is 100 percent every year.
Missions Management Tool 2017 7
Missions Management Tool 2017
Definitions of Benchmark Performance Measures MMT
2017
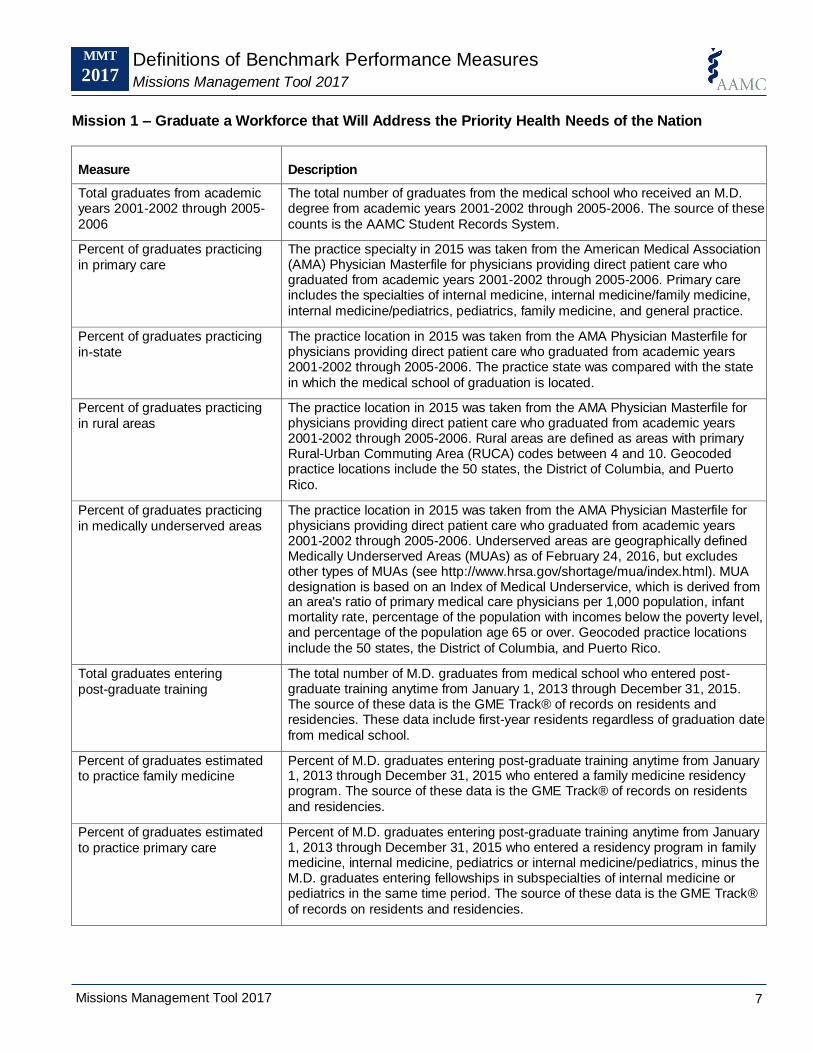
Mission 1 – Graduate a Workforce that Will Address the Priority Health Needs of the Nation
Measure Description
Total graduates from academic years 2001-2002 through 2005-
2006
The total number of graduates from the medical school who received an M.D. degree from academic years 2001-2002 through 2005-2006. The source of these
counts is the AAMC Student Records System.
Percent of graduates practicing
in primary care
The practice specialty in 2015 was taken from the American Medical Association (AMA) Physician Masterfile for physicians providing direct patient care who graduated from academic years 2001-2002 through 2005-2006. Primary care includes the specialties of internal medicine, internal medicine/family medicine,
internal medicine/pediatrics, pediatrics, family medicine, and general practice.
Percent of graduates practicing
in-state
The practice location in 2015 was taken from the AMA Physician Masterfile for physicians providing direct patient care who graduated from academic years 2001-2002 through 2005-2006. The practice state was compared with the state
in which the medical school of graduation is located.
Percent of graduates practicing
in rural areas
The practice location in 2015 was taken from the AMA Physician Masterfile for physicians providing direct patient care who graduated from academic years 2001-2002 through 2005-2006. Rural areas are defined as areas with primary Rural-Urban Commuting Area (RUCA) codes between 4 and 10. Geocoded practice locations include the 50 states, the District of Columbia, and Puerto
Rico.
Percent of graduates practicing
in medically underserved areas
The practice location in 2015 was taken from the AMA Physician Masterfile for physicians providing direct patient care who graduated from academic years 2001-2002 through 2005-2006. Underserved areas are geographically defined Medically Underserved Areas (MUAs) as of February 24, 2016, but excludes other types of MUAs (see http://www.hrsa.gov/shortage/mua/index.html). MUA designation is based on an Index of Medical Underservice, which is derived from an area's ratio of primary medical care physicians per 1,000 population, infant mortality rate, percentage of the population with incomes below the poverty level, and percentage of the population age 65 or over. Geocoded practice locations
include the 50 states, the District of Columbia, and Puerto Rico.
Total graduates entering
post-graduate training
The total number of M.D. graduates from medical school who entered post-graduate training anytime from January 1, 2013 through December 31, 2015. The source of these data is the GME Track® of records on residents and residencies. These data include first-year residents regardless of graduation date
from medical school.
Percent of graduates estimated to practice family medicine
Percent of M.D. graduates entering post-graduate training anytime from January 1, 2013 through December 31, 2015 who entered a family medicine residency program. The source of these data is the GME Track® of records on residents
and residencies.
Percent of graduates estimated
to practice primary care
Percent of M.D. graduates entering post-graduate training anytime from January 1, 2013 through December 31, 2015 who entered a residency program in family medicine, internal medicine, pediatrics or internal medicine/pediatrics, minus the M.D. graduates entering fellowships in subspecialties of internal medicine or pediatrics in the same time period. The source of these data is the GME Track®
of records on residents and residencies.
Missions Management Tool 2017 8
Missions Management Tool 2017
Definitions of Benchmark Performance Measures MMT
2017
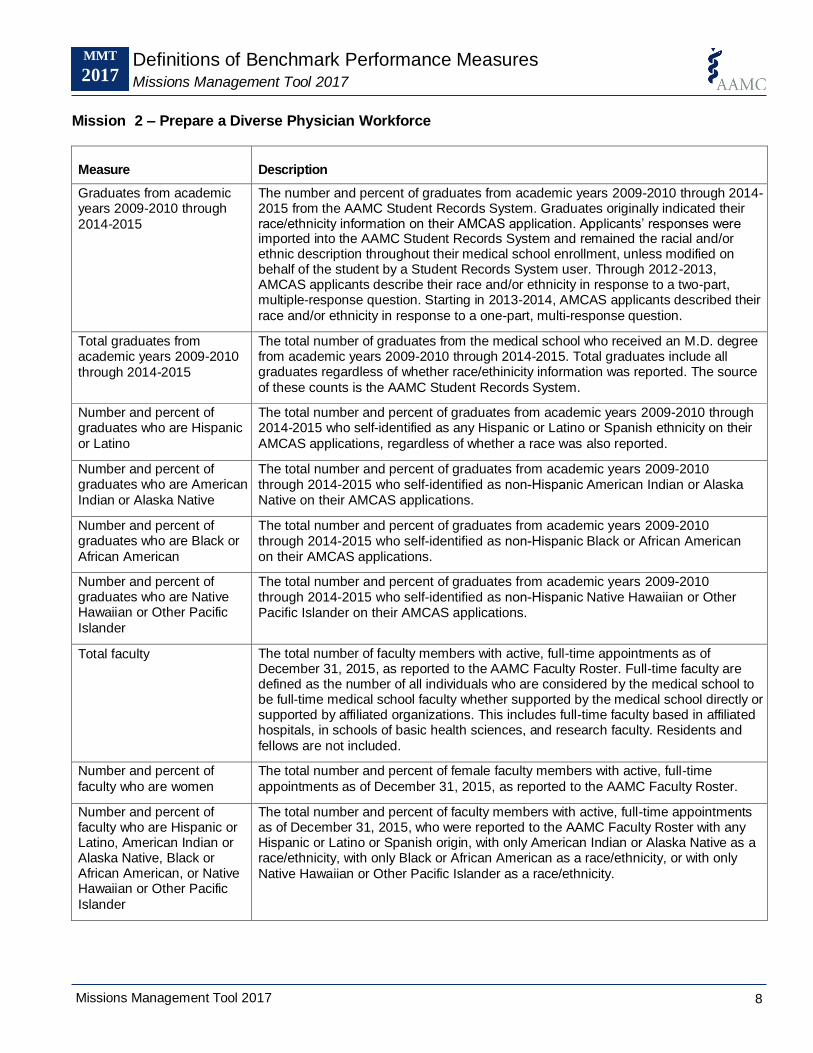
Mission 2 – Prepare a Diverse Physician Workforce
Measure Description
Graduates from academic years 2009-2010 through
2014-2015
The number and percent of graduates from academic years 2009-2010 through 2014-2015 from the AAMC Student Records System. Graduates originally indicated their race/ethnicity information on their AMCAS application. Applicants’ responses were imported into the AAMC Student Records System and remained the racial and/or ethnic description throughout their medical school enrollment, unless modified on behalf of the student by a Student Records System user. Through 2012-2013, AMCAS applicants describe their race and/or ethnicity in response to a two-part, multiple-response question. Starting in 2013-2014, AMCAS applicants described their
race and/or ethnicity in response to a one-part, multi-response question.
Total graduates from academic years 2009-2010
through 2014-2015
The total number of graduates from the medical school who received an M.D. degree from academic years 2009-2010 through 2014-2015. Total graduates include all graduates regardless of whether race/ethinicity information was reported. The source
of these counts is the AAMC Student Records System.
Number and percent of graduates who are Hispanic
or Latino
The total number and percent of graduates from academic years 2009-2010 through 2014-2015 who self-identified as any Hispanic or Latino or Spanish ethnicity on their
AMCAS applications, regardless of whether a race was also reported.
Number and percent of graduates who are American
Indian or Alaska Native
The total number and percent of graduates from academic years 2009-2010 through 2014-2015 who self-identified as non-Hispanic American Indian or Alaska Native on their AMCAS applications.
Number and percent of graduates who are Black or
African American
The total number and percent of graduates from academic years 2009-2010 through 2014-2015 who self-identified as non-Hispanic Black or African American on their AMCAS applications.
Number and percent of graduates who are Native Hawaiian or Other Pacific
Islander
The total number and percent of graduates from academic years 2009-2010 through 2014-2015 who self-identified as non-Hispanic Native Hawaiian or Other Pacific Islander on their AMCAS applications.
Total faculty The total number of faculty members with active, full-time appointments as of December 31, 2015, as reported to the AAMC Faculty Roster. Full-time faculty are defined as the number of all individuals who are considered by the medical school to be full-time medical school faculty whether supported by the medical school directly or supported by affiliated organizations. This includes full-time faculty based in affiliated hospitals, in schools of basic health sciences, and research faculty. Residents and
fellows are not included.
Number and percent of
faculty who are women
The total number and percent of female faculty members with active, full-time
appointments as of December 31, 2015, as reported to the AAMC Faculty Roster.
Number and percent of faculty who are Hispanic or Latino, American Indian or Alaska Native, Black or African American, or Native Hawaiian or Other Pacific
Islander
The total number and percent of faculty members with active, full-time appointments as of December 31, 2015, who were reported to the AAMC Faculty Roster with any Hispanic or Latino or Spanish origin, with only American Indian or Alaska Native as a race/ethnicity, with only Black or African American as a race/ethnicity, or with only
Native Hawaiian or Other Pacific Islander as a race/ethnicity.
Missions Management Tool 2017 9
Missions Management Tool 2017
Definitions of Benchmark Performance Measures MMT
2017
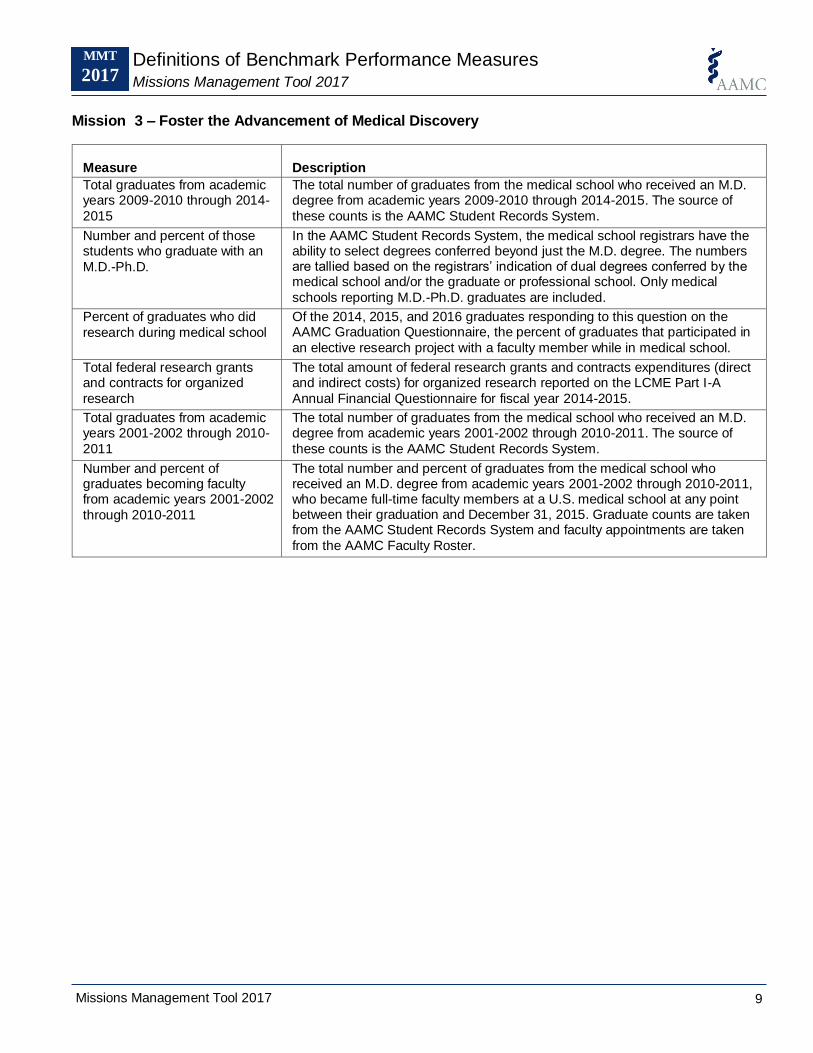
Mission 3 – Foster the Advancement of Medical Discovery
Measure
Description
Total graduates from academic years 2009-2010 through 2014-
2015
The total number of graduates from the medical school who received an M.D. degree from academic years 2009-2010 through 2014-2015. The source of
these counts is the AAMC Student Records System.
Number and percent of those students who graduate with an
M.D.-Ph.D.
In the AAMC Student Records System, the medical school registrars have the ability to select degrees conferred beyond just the M.D. degree. The numbers are tallied based on the registrars’ indication of dual degrees conferred by the medical school and/or the graduate or professional school. Only medical
schools reporting M.D.-Ph.D. graduates are included.
Percent of graduates who did
research during medical school
Of the 2014, 2015, and 2016 graduates responding to this question on the AAMC Graduation Questionnaire, the percent of graduates that participated in
an elective research project with a faculty member while in medical school.
Total federal research grants and contracts for organized
research
The total amount of federal research grants and contracts expenditures (direct and indirect costs) for organized research reported on the LCME Part I-A
Annual Financial Questionnaire for fiscal year 2014-2015.
Total graduates from academic years 2001-2002 through 2010-
2011
The total number of graduates from the medical school who received an M.D. degree from academic years 2001-2002 through 2010-2011. The source of
these counts is the AAMC Student Records System.
Number and percent of graduates becoming faculty from academic years 2001-2002
through 2010-2011
The total number and percent of graduates from the medical school who received an M.D. degree from academic years 2001-2002 through 2010-2011, who became full-time faculty members at a U.S. medical school at any point between their graduation and December 31, 2015. Graduate counts are taken from the AAMC Student Records System and faculty appointments are taken
from the AAMC Faculty Roster.
Missions Management Tool 2017 10
Missions Management Tool 2017
Definitions of Benchmark Performance Measures MMT
2017
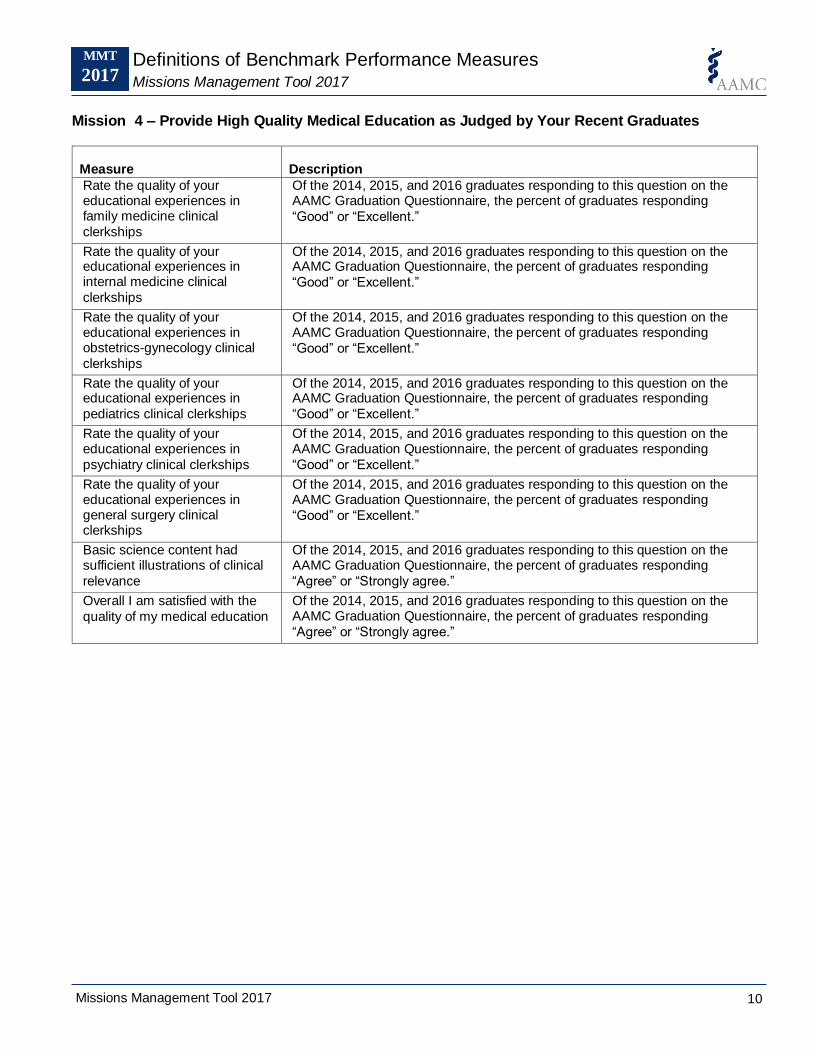
Mission 4 – Provide High Quality Medical Education as Judged by Your Recent Graduates
Measure
Description
Rate the quality of your educational experiences in family medicine clinical
clerkships
Of the 2014, 2015, and 2016 graduates responding to this question on the AAMC Graduation Questionnaire, the percent of graduates responding
“Good” or “Excellent.”
Rate the quality of your educational experiences in internal medicine clinical
clerkships
Of the 2014, 2015, and 2016 graduates responding to this question on the AAMC Graduation Questionnaire, the percent of graduates responding
“Good” or “Excellent.”
Rate the quality of your educational experiences in obstetrics-gynecology clinical
clerkships
Of the 2014, 2015, and 2016 graduates responding to this question on the AAMC Graduation Questionnaire, the percent of graduates responding
“Good” or “Excellent.”
Rate the quality of your educational experiences in
pediatrics clinical clerkships
Of the 2014, 2015, and 2016 graduates responding to this question on the AAMC Graduation Questionnaire, the percent of graduates responding
“Good” or “Excellent.”
Rate the quality of your educational experiences in
psychiatry clinical clerkships
Of the 2014, 2015, and 2016 graduates responding to this question on the AAMC Graduation Questionnaire, the percent of graduates responding
“Good” or “Excellent.”
Rate the quality of your educational experiences in general surgery clinical clerkships
Of the 2014, 2015, and 2016 graduates responding to this question on the AAMC Graduation Questionnaire, the percent of graduates responding
“Good” or “Excellent.”
Basic science content had sufficient illustrations of clinical
relevance
Of the 2014, 2015, and 2016 graduates responding to this question on the AAMC Graduation Questionnaire, the percent of graduates responding
“Agree” or “Strongly agree.”
Overall I am satisfied with the
quality of my medical education
Of the 2014, 2015, and 2016 graduates responding to this question on the AAMC Graduation Questionnaire, the percent of graduates responding
“Agree” or “Strongly agree.”
Missions Management Tool 2017 11
Missions Management Tool 2017
Definitions of Benchmark Performance Measures MMT
2017
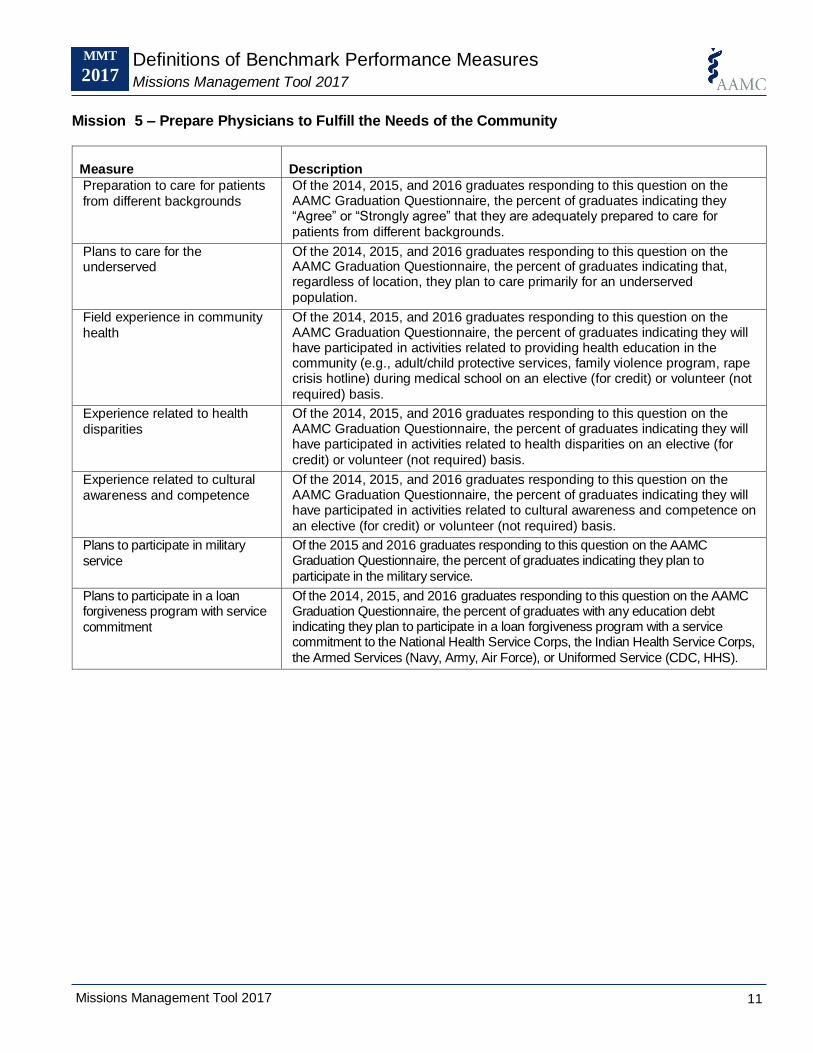
Mission 5 – Prepare Physicians to Fulfill the Needs of the Community
Measure
Description
Preparation to care for patients
from different backgrounds
Of the 2014, 2015, and 2016 graduates responding to this question on the AAMC Graduation Questionnaire, the percent of graduates indicating they “Agree” or “Strongly agree” that they are adequately prepared to care for
patients from different backgrounds.
Plans to care for the underserved
Of the 2014, 2015, and 2016 graduates responding to this question on the AAMC Graduation Questionnaire, the percent of graduates indicating that, regardless of location, they plan to care primarily for an underserved
population.
Field experience in community
health
Of the 2014, 2015, and 2016 graduates responding to this question on the AAMC Graduation Questionnaire, the percent of graduates indicating they will have participated in activities related to providing health education in the community (e.g., adult/child protective services, family violence program, rape crisis hotline) during medical school on an elective (for credit) or volunteer (not
required) basis.
Experience related to health
disparities
Of the 2014, 2015, and 2016 graduates responding to this question on the AAMC Graduation Questionnaire, the percent of graduates indicating they will have participated in activities related to health disparities on an elective (for
credit) or volunteer (not required) basis.
Experience related to cultural
awareness and competence
Of the 2014, 2015, and 2016 graduates responding to this question on the AAMC Graduation Questionnaire, the percent of graduates indicating they will have participated in activities related to cultural awareness and competence on
an elective (for credit) or volunteer (not required) basis.
Plans to participate in military
service
Of the 2015 and 2016 graduates responding to this question on the AAMC Graduation Questionnaire, the percent of graduates indicating they plan to
participate in the military service.
Plans to participate in a loan forgiveness program with service
commitment
Of the 2014, 2015, and 2016 graduates responding to this question on the AAMC Graduation Questionnaire, the percent of graduates with any education debt indicating they plan to participate in a loan forgiveness program with a service commitment to the National Health Service Corps, the Indian Health Service Corps,
the Armed Services (Navy, Army, Air Force), or Uniformed Service (CDC, HHS).
Missions Management Tool 2017 12
Missions Management Tool 2017
Definitions of Benchmark Performance Measures MMT
2017
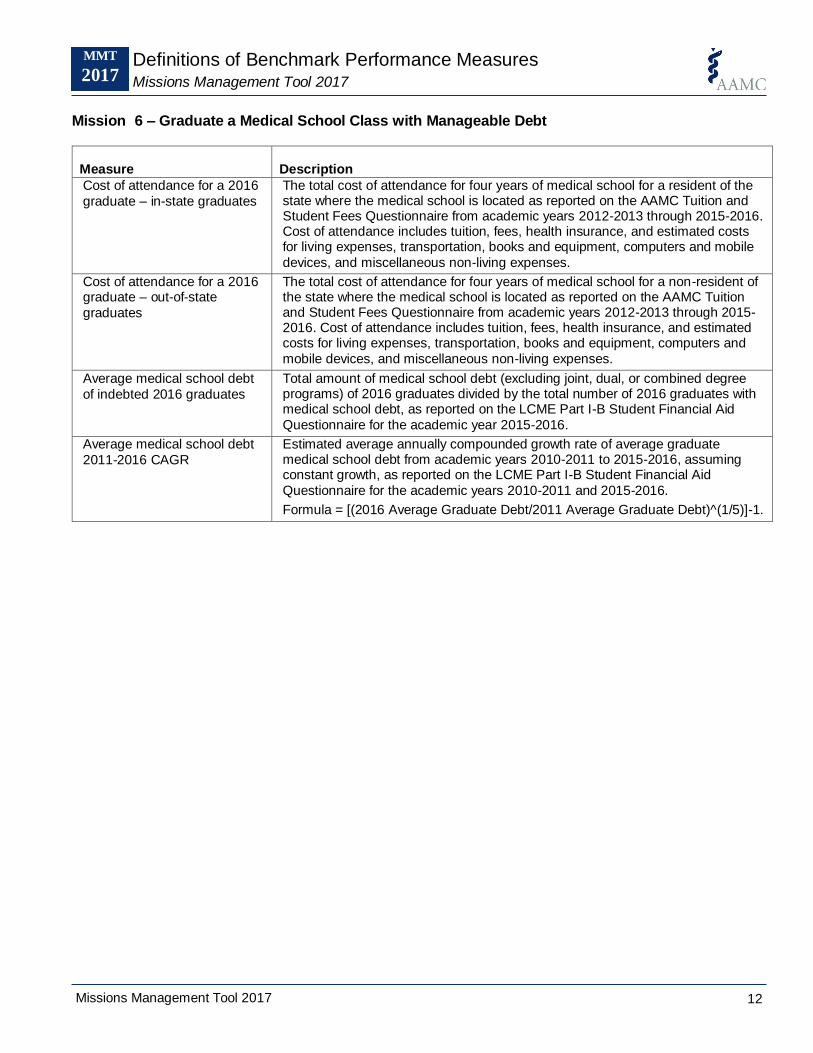
Mission 6 – Graduate a Medical School Class with Manageable Debt
Measure
Description
Cost of attendance for a 2016
graduate – in-state graduates
The total cost of attendance for four years of medical school for a resident of the state where the medical school is located as reported on the AAMC Tuition and Student Fees Questionnaire from academic years 2012-2013 through 2015-2016. Cost of attendance includes tuition, fees, health insurance, and estimated costs for living expenses, transportation, books and equipment, computers and mobile
devices, and miscellaneous non-living expenses.
Cost of attendance for a 2016 graduate – out-of-state
graduates
The total cost of attendance for four years of medical school for a non-resident of the state where the medical school is located as reported on the AAMC Tuition and Student Fees Questionnaire from academic years 2012-2013 through 2015-2016. Cost of attendance includes tuition, fees, health insurance, and estimated costs for living expenses, transportation, books and equipment, computers and
mobile devices, and miscellaneous non-living expenses.
Average medical school debt
of indebted 2016 graduates
Total amount of medical school debt (excluding joint, dual, or combined degree programs) of 2016 graduates divided by the total number of 2016 graduates with medical school debt, as reported on the LCME Part I-B Student Financial Aid
Questionnaire for the academic year 2015-2016.
Average medical school debt
2011-2016 CAGR
Estimated average annually compounded growth rate of average graduate medical school debt from academic years 2010-2011 to 2015-2016, assuming constant growth, as reported on the LCME Part I-B Student Financial Aid
Questionnaire for the academic years 2010-2011 and 2015-2016.
Formula = [(2016 Average Graduate Debt/2011 Average Graduate Debt)^(1/5)]-1.
Missions Management Tool 2017 13
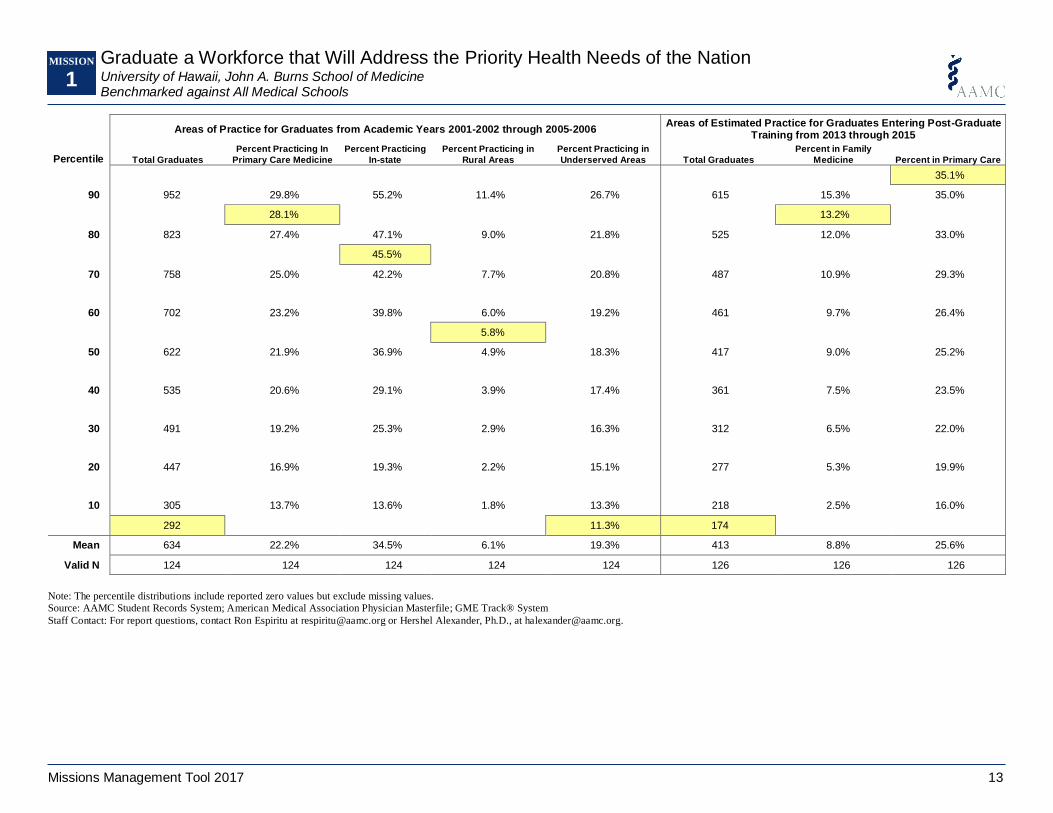
Areas of Practice for Graduates from Academic Years 2001-2002 through 2005-2006 Areas of Estimated Practice for Graduates Entering Post-Graduate
Training from 2013 through 2015
Percentile Total Graduates
Percent Practicing In
Primary Care Medicine
Percent Practicing
In-state
Percent Practicing in
Rural Areas
Percent Practicing in
Underserved Areas Total Graduates
Percent in Family
Medicine Percent in Primary Care
35.1%
90 952 29.8% 55.2% 11.4% 26.7% 615 15.3% 35.0%
28.1% 13.2%
80 823 27.4% 47.1% 9.0% 21.8% 525 12.0% 33.0%
45.5%
70 758 25.0% 42.2% 7.7% 20.8% 487 10.9% 29.3%
60 702 23.2% 39.8% 6.0% 19.2% 461 9.7% 26.4%
5.8%
50 622 21.9% 36.9% 4.9% 18.3% 417 9.0% 25.2%
40 535 20.6% 29.1% 3.9% 17.4% 361 7.5% 23.5%
30 491 19.2% 25.3% 2.9% 16.3% 312 6.5% 22.0%
20 447 16.9% 19.3% 2.2% 15.1% 277 5.3% 19.9%
10 305 13.7% 13.6% 1.8% 13.3% 218 2.5% 16.0%
292 11.3% 174
Mean 634 22.2% 34.5% 6.1% 19.3% 413 8.8% 25.6%
Valid N 124 124 124 124 124 126 126 126
Note: The percentile distributions include reported zero values but exclude missing values.
Source: AAMC Student Records System; American Medical Association Physician Masterfile; GME Track® System
Staff Contact: For report questions, contact Ron Espiritu at [email protected] or Hershel Alexander, Ph.D., at [email protected].
University of Hawaii, John A. Burns School of Medicine Benchmarked against All Medical Schools
Graduate a Workforce that Will Address the Priority Health Needs of the Nation MISSION
1
Missions Management Tool 2017 14
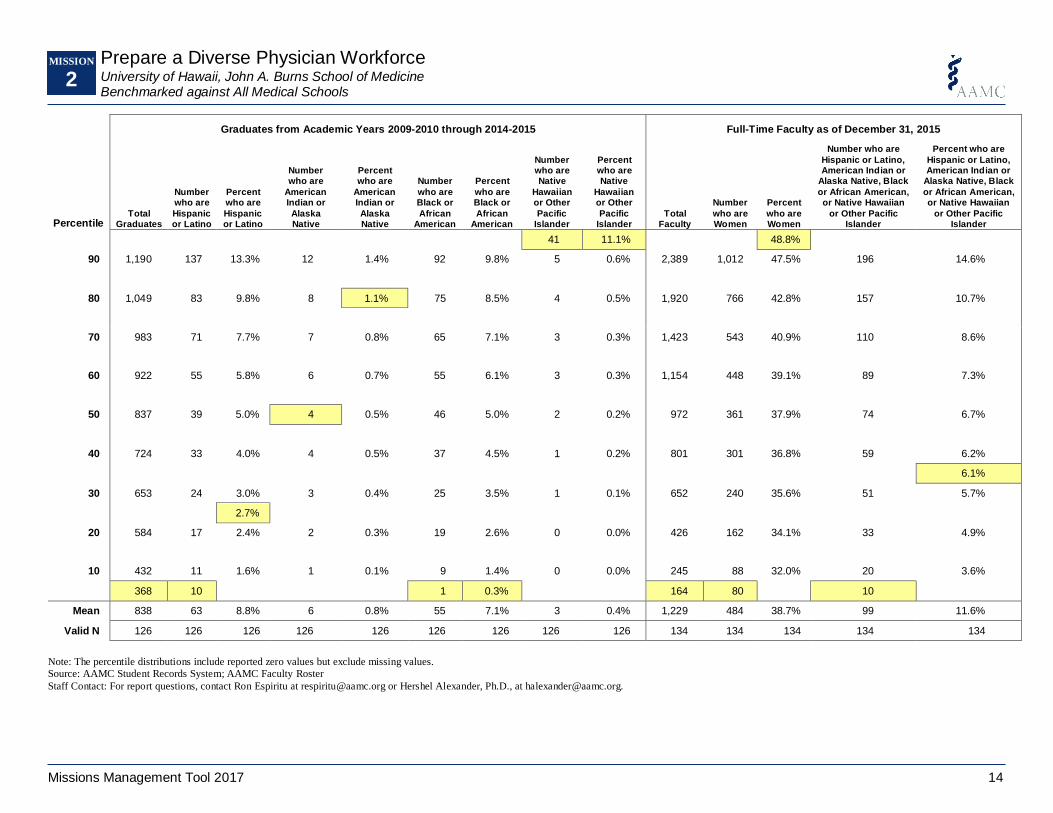
Graduates from Academic Years 2009-2010 through 2014-2015 Full-Time Faculty as of December 31, 2015
Percentile Total
Graduates
Number who are
Hispanic or Latino
Percent who are
Hispanic or Latino
Number who are
American Indian or
Alaska Native
Percent who are
American Indian or
Alaska Native
Number
who are Black or
African American
Percent
who are Black or
African American
Number who are Native
Hawaiian or Other
Pacific Islander
Percent who are Native
Hawaiian or Other
Pacific Islander
Total Faculty
Number
who are Women
Percent
who are Women
Number who are
Hispanic or Latino, American Indian or
Alaska Native, Black
or African American, or Native Hawaiian
or Other Pacific Islander
Percent who are
Hispanic or Latino, American Indian or
Alaska Native, Black
or African American, or Native Hawaiian
or Other Pacific Islander
41 11.1% 48.8%
90 1,190 137 13.3% 12 1.4% 92 9.8% 5 0.6% 2,389 1,012 47.5% 196 14.6%
80 1,049 83 9.8% 8 1.1% 75 8.5% 4 0.5% 1,920 766 42.8% 157 10.7%
70 983 71 7.7% 7 0.8% 65 7.1% 3 0.3% 1,423 543 40.9% 110 8.6%
60 922 55 5.8% 6 0.7% 55 6.1% 3 0.3% 1,154 448 39.1% 89 7.3%
50 837 39 5.0% 4 0.5% 46 5.0% 2 0.2% 972 361 37.9% 74 6.7%
40 724 33 4.0% 4 0.5% 37 4.5% 1 0.2% 801 301 36.8% 59 6.2%
6.1%
30 653 24 3.0% 3 0.4% 25 3.5% 1 0.1% 652 240 35.6% 51 5.7%
2.7%
20 584 17 2.4% 2 0.3% 19 2.6% 0 0.0% 426 162 34.1% 33 4.9%
10 432 11 1.6% 1 0.1% 9 1.4% 0 0.0% 245 88 32.0% 20 3.6%
368 10 1 0.3% 164 80 10
Mean 838 63 8.8% 6 0.8% 55 7.1% 3 0.4% 1,229 484 38.7% 99 11.6%
Valid N 126 126 126 126 126 126 126 126 126 134 134 134 134 134
Note: The percentile distributions include reported zero values but exclude missing values.
Source: AAMC Student Records System; AAMC Faculty Roster
Staff Contact: For report questions, contact Ron Espiritu at [email protected] or Hershel Alexander, Ph.D., at [email protected].
University of Hawaii, John A. Burns School of Medicine Benchmarked against All Medical Schools
Prepare a Diverse Physician Workforce MISSION
2
Missions Management Tool 2017 15
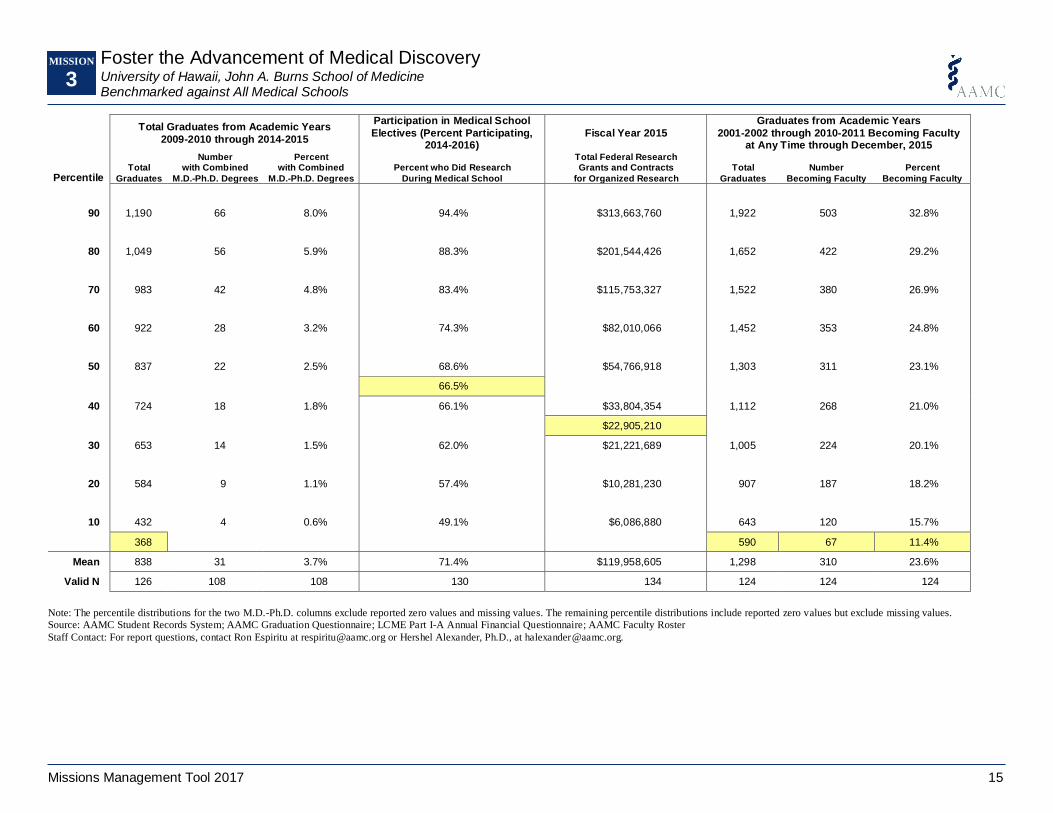
Total Graduates from Academic Years
2009-2010 through 2014-2015
Participation in Medical School
Electives (Percent Participating, 2014-2016)
Fiscal Year 2015
Graduates from Academic Years
2001-2002 through 2010-2011 Becoming Faculty at Any Time through December, 2015
Percentile Total
Graduates
Number with Combined
M.D.-Ph.D. Degrees
Percent with Combined
M.D.-Ph.D. Degrees
Percent who Did Research
During Medical School
Total Federal Research Grants and Contracts
for Organized Research
Total
Graduates
Number
Becoming Faculty
Percent
Becoming Faculty
90 1,190 66 8.0% 94.4% $313,663,760 1,922 503 32.8%
80 1,049 56 5.9% 88.3% $201,544,426 1,652 422 29.2%
70 983 42 4.8% 83.4% $115,753,327 1,522 380 26.9%
60 922 28 3.2% 74.3% $82,010,066 1,452 353 24.8%
50 837 22 2.5% 68.6% $54,766,918 1,303 311 23.1%
66.5%
40 724 18 1.8% 66.1% $33,804,354 1,112 268 21.0%
$22,905,210
30 653 14 1.5% 62.0% $21,221,689 1,005 224 20.1%
20 584 9 1.1% 57.4% $10,281,230 907 187 18.2%
10 432 4 0.6% 49.1% $6,086,880 643 120 15.7%
368 590 67 11.4%
Mean 838 31 3.7% 71.4% $119,958,605 1,298 310 23.6%
Valid N 126 108 108 130 134 124 124 124
Note: The percentile distributions for the two M.D.-Ph.D. columns exclude reported zero values and missing values. The remaining percentile distributions include reported zero values but exclude missing values.
Source: AAMC Student Records System; AAMC Graduation Questionnaire; LCME Part I-A Annual Financial Questionnaire; AAMC Faculty Roster
Staff Contact: For report questions, contact Ron Espiritu at [email protected] or Hershel Alexander, Ph.D., at [email protected].
University of Hawaii, John A. Burns School of Medicine Benchmarked against All Medical Schools
Foster the Advancement of Medical Discovery MISSION
3
Missions Management Tool 2017 16
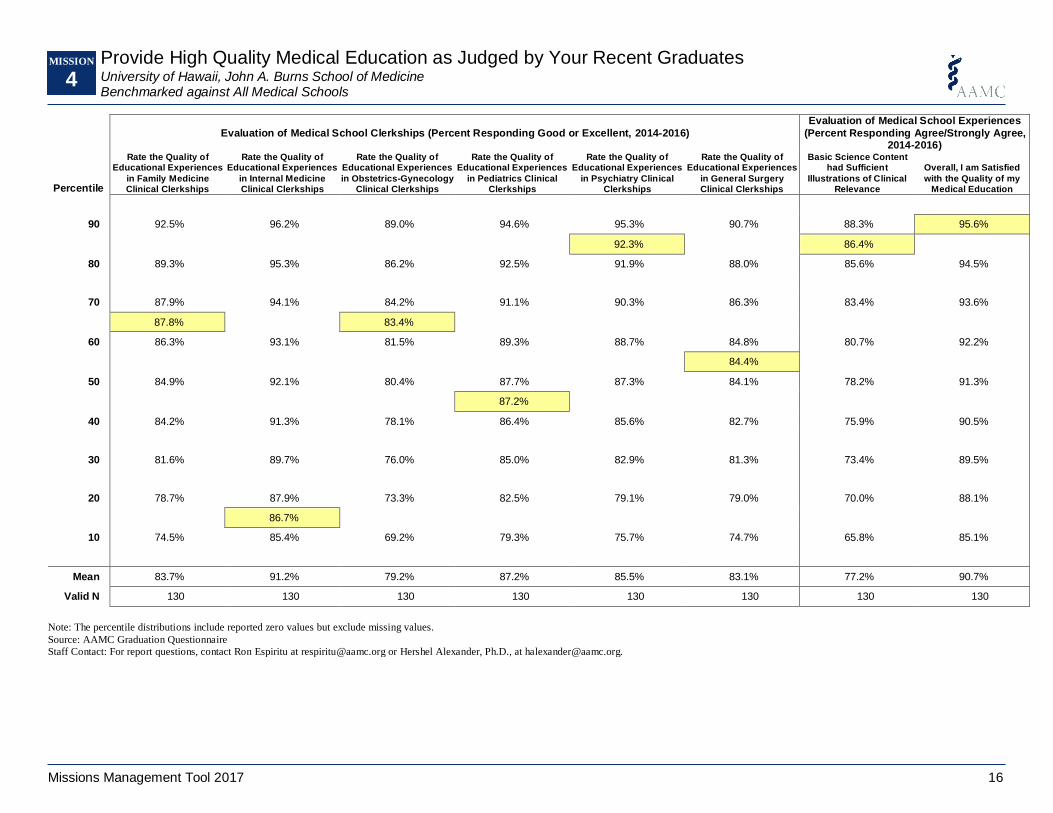
Evaluation of Medical School Clerkships (Percent Responding Good or Excellent, 2014-2016)
Evaluation of Medical School Experiences
(Percent Responding Agree/Strongly Agree, 2014-2016)
Percentile
Rate the Quality of Educational Experiences
in Family Medicine Clinical Clerkships
Rate the Quality of Educational Experiences
in Internal Medicine Clinical Clerkships
Rate the Quality of Educational Experiences
in Obstetrics-Gynecology Clinical Clerkships
Rate the Quality of Educational Experiences
in Pediatrics Clinical Clerkships
Rate the Quality of Educational Experiences
in Psychiatry Clinical Clerkships
Rate the Quality of Educational Experiences
in General Surgery Clinical Clerkships
Basic Science Content had Sufficient
Illustrations of Clinical Relevance
Overall, I am Satisfied
with the Quality of my Medical Education
90 92.5% 96.2% 89.0% 94.6% 95.3% 90.7% 88.3% 95.6%
92.3% 86.4%
80 89.3% 95.3% 86.2% 92.5% 91.9% 88.0% 85.6% 94.5%
70 87.9% 94.1% 84.2% 91.1% 90.3% 86.3% 83.4% 93.6%
87.8% 83.4%
60 86.3% 93.1% 81.5% 89.3% 88.7% 84.8% 80.7% 92.2%
84.4%
50 84.9% 92.1% 80.4% 87.7% 87.3% 84.1% 78.2% 91.3%
87.2%
40 84.2% 91.3% 78.1% 86.4% 85.6% 82.7% 75.9% 90.5%
30 81.6% 89.7% 76.0% 85.0% 82.9% 81.3% 73.4% 89.5%
20 78.7% 87.9% 73.3% 82.5% 79.1% 79.0% 70.0% 88.1%
86.7%
10 74.5% 85.4% 69.2% 79.3% 75.7% 74.7% 65.8% 85.1%
Mean 83.7% 91.2% 79.2% 87.2% 85.5% 83.1% 77.2% 90.7%
Valid N 130 130 130 130 130 130 130 130
Note: The percentile distributions include reported zero values but exclude missing values.
Source: AAMC Graduation Questionnaire
Staff Contact: For report questions, contact Ron Espiritu at [email protected] or Hershel Alexander, Ph.D., at [email protected].
University of Hawaii, John A. Burns School of Medicine Benchmarked against All Medical Schools
Provide High Quality Medical Education as Judged by Your Recent Graduates MISSION
4
Missions Management Tool 2017 17
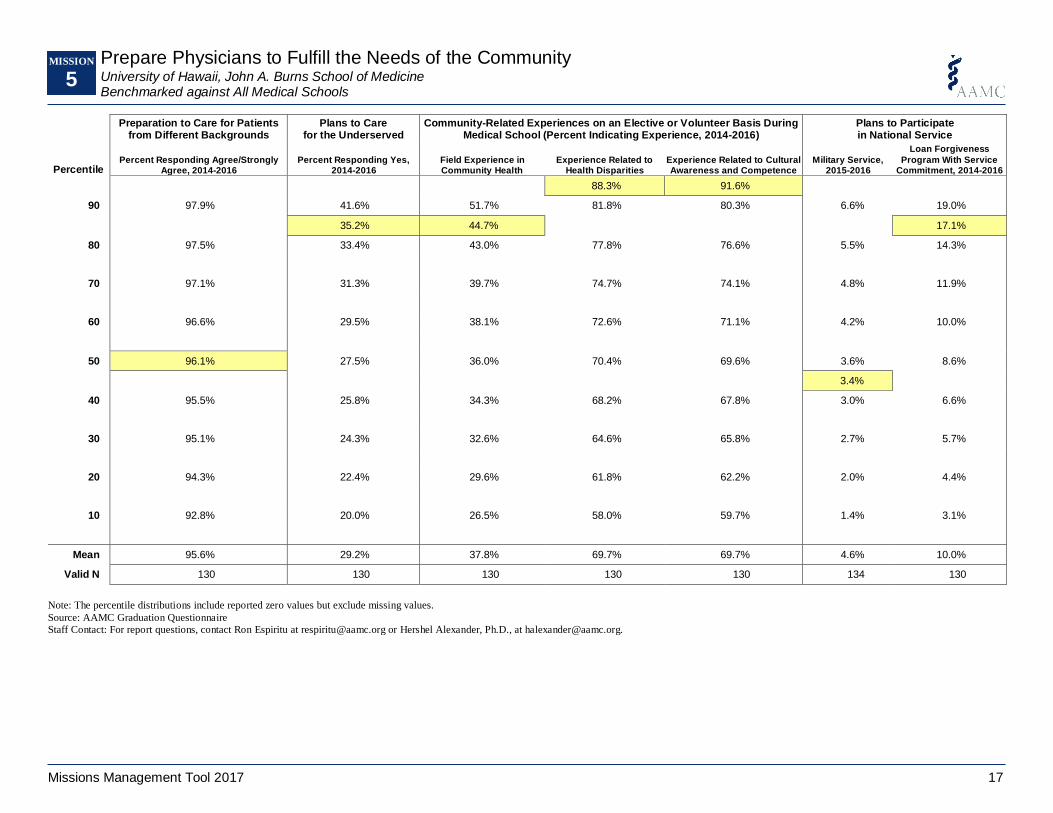
Preparation to Care for Patients
from Different Backgrounds Plans to Care
for the Underserved Community-Related Experiences on an Elective or Volunteer Basis During
Medical School (Percent Indicating Experience, 2014-2016) Plans to Participate in National Service
Percentile Percent Responding Agree/Strongly
Agree, 2014-2016 Percent Responding Yes,
2014-2016 Field Experience in Community Health
Experience Related to Health Disparities
Experience Related to Cultural Awareness and Competence
Military Service, 2015-2016
Loan Forgiveness
Program With Service Commitment, 2014-2016
88.3% 91.6%
90 97.9% 41.6% 51.7% 81.8% 80.3% 6.6% 19.0%
35.2% 44.7% 17.1%
80 97.5% 33.4% 43.0% 77.8% 76.6% 5.5% 14.3%
70 97.1% 31.3% 39.7% 74.7% 74.1% 4.8% 11.9%
60 96.6% 29.5% 38.1% 72.6% 71.1% 4.2% 10.0%
50 96.1% 27.5% 36.0% 70.4% 69.6% 3.6% 8.6%
3.4%
40 95.5% 25.8% 34.3% 68.2% 67.8% 3.0% 6.6%
30 95.1% 24.3% 32.6% 64.6% 65.8% 2.7% 5.7%
20 94.3% 22.4% 29.6% 61.8% 62.2% 2.0% 4.4%
10 92.8% 20.0% 26.5% 58.0% 59.7% 1.4% 3.1%
Mean 95.6% 29.2% 37.8% 69.7% 69.7% 4.6% 10.0%
Valid N 130 130 130 130 130 134 130
Note: The percentile distributions include reported zero values but exclude missing values.
Source: AAMC Graduation Questionnaire
Staff Contact: For report questions, contact Ron Espiritu at [email protected] or Hershel Alexander, Ph.D., at [email protected].
University of Hawaii, John A. Burns School of Medicine Benchmarked against All Medical Schools
Prepare Physicians to Fulfill the Needs of the Community MISSION
5
Missions Management Tool 2017 18
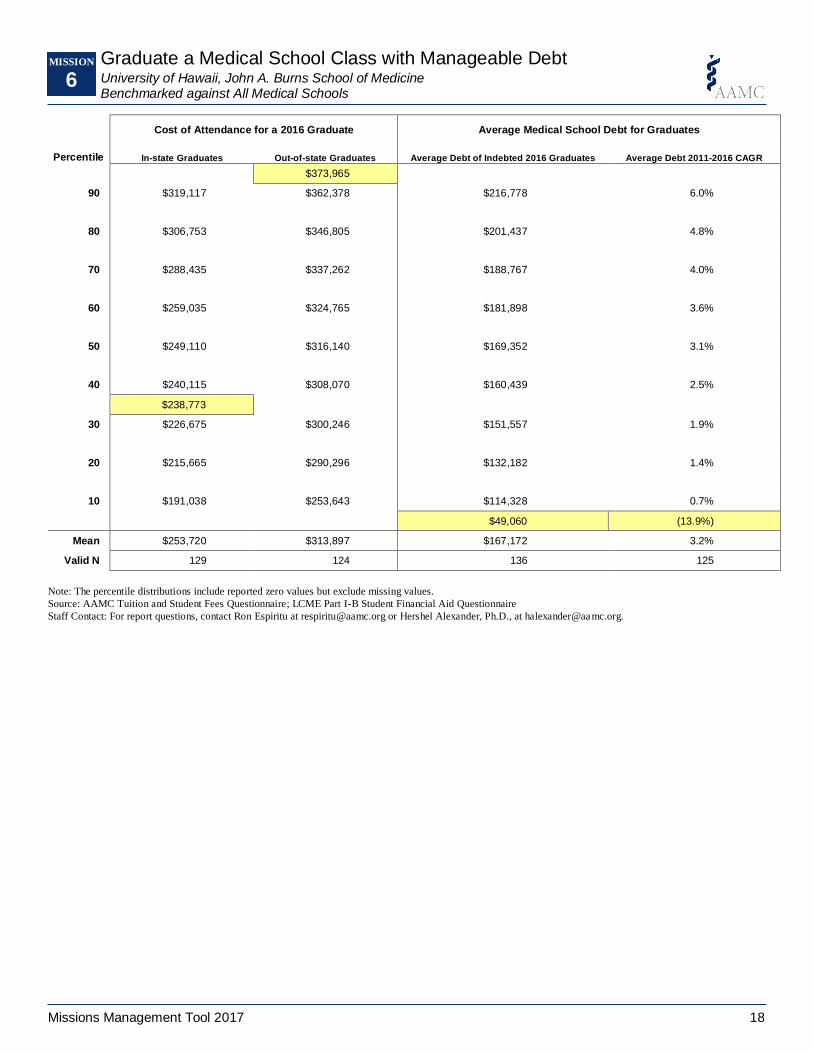
Cost of Attendance for a 2016 Graduate Average Medical School Debt for Graduates
Percentile In-state Graduates Out-of-state Graduates Average Debt of Indebted 2016 Graduates Average Debt 2011-2016 CAGR
$373,965
90 $319,117 $362,378 $216,778 6.0%
80 $306,753 $346,805 $201,437 4.8%
70 $288,435 $337,262 $188,767 4.0%
60 $259,035 $324,765 $181,898 3.6%
50 $249,110 $316,140 $169,352 3.1%
40 $240,115 $308,070 $160,439 2.5%
$238,773
30 $226,675 $300,246 $151,557 1.9%
20 $215,665 $290,296 $132,182 1.4%
10 $191,038 $253,643 $114,328 0.7%
$49,060 (13.9%)
Mean $253,720 $313,897 $167,172 3.2%
Valid N 129 124 136 125
Note: The percentile distributions include reported zero values but exclude missing values.
Source: AAMC Tuition and Student Fees Questionnaire; LCME Part I-B Student Financial Aid Questionnaire
Staff Contact: For report questions, contact Ron Espiritu at [email protected] or Hershel Alexander, Ph.D., at halexander@aa mc.org.
University of Hawaii, John A. Burns School of Medicine Benchmarked against All Medical Schools
Graduate a Medical School Class with Manageable Debt MISSION
6