Embed Size (px)
Citation preview

Received: 3 February 2017 Revised: 7 December 2017 Accepted: 14 February 2018
HEALTH ECONOM I C S L E T T ER
DOI: 10.1002/hec.3654
Missing data in trial‐based cost‐effectiveness analysis: Anincomplete journey
Baptiste Leurent1 | Manuel Gomes2 | James R. Carpenter1,3
1Department of Medical Statistics, LondonSchool of Hygiene and Tropical Medicine,London, UK2Department of Health Services Researchand Policy, London School of Hygiene andTropical Medicine, London, UK3MRC Clinical Trials Unit, UniversityCollege London, London, UK
CorrespondenceBaptiste Leurent, Department of MedicalStatistics, London School of Hygiene andTropical Medicine, Keppel Street, LondonWC1E 7HT, UK.Email: [email protected]
Funding informationResearch Trainees Coordinating Centre,Grant/Award Number: DRF‐12437; Medi-cal Research Council, Grant/Award Num-ber: MC_UU_12023/21
- - - - - - - - - - - - - - - - - - - - - - - - - - - - - - - - - - - - - - - -
This is an open access article under the terms of the C
original work is properly cited.
© 2018 The Authors Health Economics published by
This report is independent research supportedship, B.L., DRF‐12437). The views expressed inment of Health. J.C. is supported by a Medica
Health Economics. 2018;1–17.
SUMMARY
Cost‐effectiveness analyses (CEA) conducted alongside randomised trials pro-
vide key evidence for informing healthcare decision making, but missing data
pose substantive challenges. Recently, there have been a number of develop-
ments in methods and guidelines addressing missing data in trials. However,
it is unclear whether these developments have permeated CEA practice. This
paper critically reviews the extent of and methods used to address missing data
in recently published trial‐based CEA.
Issues of the Health Technology Assessment journal from 2013 to 2015 were
searched. Fifty‐two eligible studies were identified. Missing data were very com-
mon; the median proportion of trial participants with complete cost‐effective-
ness data was 63% (interquartile range: 47%–81%). The most common
approach for the primary analysis was to restrict analysis to those with com-
plete data (43%), followed by multiple imputation (30%). Half of the studies con-
ducted some sort of sensitivity analyses, but only 2 (4%) considered possible
departures from the missing‐at‐random assumption.
Further improvements are needed to address missing data in cost‐effectiveness
analyses conducted alongside randomised trials. These should focus on limiting
the extent of missing data, choosing an appropriate method for the primary
analysis that is valid under contextually plausible assumptions, and conducting
sensitivity analyses to departures from the missing‐at‐random assumption.
KEYWORDS
cost‐effectiveness analysis, missing data, multiple imputation, randomised controlled trials, sensitivity
analysis
- - - - - - - - - - - - - - - - - - - - - - - - - - - - - - - - - - - - - - - - - - - - - - - - - - - - - - - - - - - - - - - - - - - - - - - - - - - - - - - - - - - - - - - -
reative Commons Attribution License, which permits use, distribution and reproduction in any medium, provided the
John Wiley & Sons Ltd.
by the National Institute for Health Research Trainees Coordinating Centre (Doctoral Research Fellow-this publication are those of the author and not necessarily those of the NHS, the NIHR or the Depart-
l Research Council grant (MC_UU_12023/21).
wileyonlinelibrary.com/journal/hec 1
2 LEURENT ET AL.
1 | INTRODUCTION
Cost‐effectiveness analyses (CEA) conducted alongside randomised controlled trials are an important source of informationfor health commissioners and decisionmakers. However, clinical trials rarely succeed in collecting all the intended informa-tion (Bell, Fiero, Horton, & Hsu, 2014), and inappropriate handling of the resulting missing data can lead to misleadinginferences (Little et al., 2012). This issue is particularly pronounced in CEA because these usually rely on collecting rich,longitudinal information from participants, such as their use of healthcare services (e.g., Client Service Receipt Inventory;Beecham & Knapp, 2001) and their health‐related quality of life (e.g., EQ‐5D‐3L; Brooks, 1996).
Several guidelines have been published in recent years on the issue of missing data in clinical trials (NationalResearch Council, 2010; Committee for Medicinal Products for Human Use (CHMP), 2011; Burzykowski et al., 2010;Carpenter & Kenward, 2007) and for CEA in particular (Briggs, Clark, Wolstenholme, & Clarke, 2003; Burton,Billingham, & Bryan, 2007; Faria, Gomes, Epstein, & White, 2014; Manca & Palmer, 2005; Marshall, Billingham, &Bryan, 2009). Key recommendations include:
• taking practical steps to limit the number of missing observations;• avoiding methods whose validity rests on contextually implausible assumptions, and using methods that incorporate
all available information under reasonable assumptions; and• assessing the sensitivity of the results to departures from these assumptions.
In particular, following Rubin's taxonomy of missing data mechanisms (Little & Rubin, 2002), methods valid under amissing‐at‐random (MAR) assumption (i.e., when, given the observed data, missingness does not depend on the unseenvalues) appear more plausible than the more restrictive assumption of missing completely at random, where missingnessis assumed to be entirely independent of the variables of interest. Because we cannot exclude the possibility that themissingness may depend on unobserved values (missing not at random [MNAR]), an assessment of the robustness ofthe conclusions to alternative missing data assumptions should also be undertaken.
Noble and colleagues (Noble, Hollingworth, & Tilling, 2012) have previously reviewed how missing resource use datawere addressed in trial‐based CEA. They found that practice fell markedly short of recommendations in several aspects.In particular, that reporting was usually poor and that complete‐case analysis was the most common approach. How-ever, missing data research is a rapidly evolving area, and several of the key guidelines were published after that review.We therefore aimed to review how missing cost‐effectiveness data were addressed in recent trial‐based CEA.
We reviewed studies published in the National Institute for Health Research Health Technology Assessment (HTA)journal, as it provides an ideal source for assessing whether recommendations have permeated CEA practice. Thesereports give substantially more information than a typical medical journal article, allowing authors the space to clearlydescribe the issues raised by missing data in their study and the methods they used to address these. Our primary objec-tives were to determine the extent of missing data, how these were addressed in the analysis, and whether sensitivityanalyses to different missing data assumptions were performed. We also provide a critical review of our findings and rec-ommendations to improve practice.
2 | METHODS
The PubMed database was used to identify all trial‐based CEA published in HTA between the January 1, 2013, andDecember 31, 2015. We combined search terms such as “randomised,” “trial,” “cost,” or “economic” to capture rel-evant articles (see Appendix A.1 for details of the search strategy). The full reports of these articles were downloadedthen screened for eligibility by excluding all studies that were pilot or feasibility studies; reported costs and effectsseparately (e.g., cost‐consequence analysis); or did not report a within‐trial CEA.
For each included study, we extracted key information about the study and the analysis to answer our primaryresearch questions. A detailed definition of each indicator extracted is provided in Appendix B. In a second stage, we drewon published guidelines and our experience to derive a list of recommendations to address missing data, and then re‐reviewed the studies to assess to which extent they followed these recommendations (see Appendix B for further details).
Data analysis was conducted with Stata version 15 (StataCorp, 2017). The data from this review are available onrequest (Leurent, Gomes, & Carpenter, 2017).
LEURENT ET AL. 3
3 | RESULTS
3.1 | Included studies
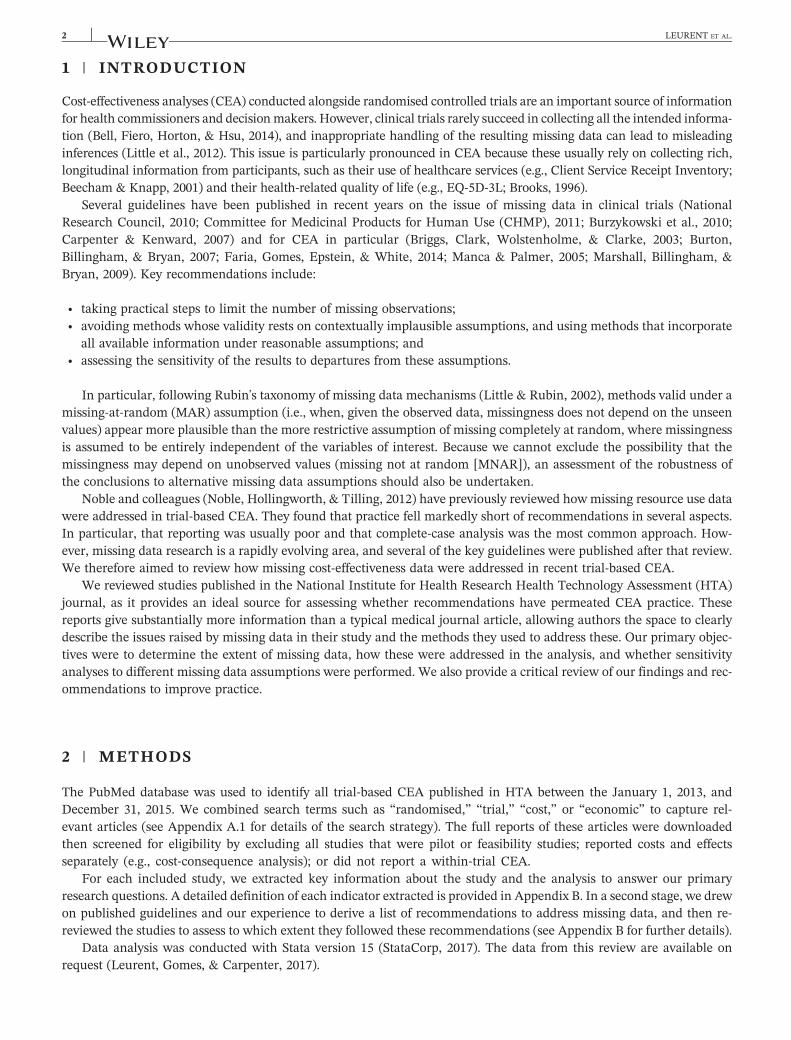
Sixty‐five articles were identified in our search (Figure 1), and 52 eligible studies were included in the review (listed inAppendix A.2). The median time frame for the CEA was over 12 months, and the majority of trials (71%, n = 37) con-ducted a follow‐up with repeated assessments over time (median of 2; Table 1). The most common effectiveness measurewas the quality‐adjusted life year (81%, n = 42). Other outcomes included score on clinical measures, or dichotomousoutcomes such as “smoking status”.
3.2 | Extent of missing data
Missing data was an issue in almost all studies, with only five studies (10%) having less than 5% of participantswith missing data. The median proportion of complete cases was 63% (interquartile range, 47–81%; Figure 2). Miss-ing data arose mostly from patient‐reported (e.g., resource use and quality of life) questionnaires. The extent ofmissing data was generally similar for cost and effectiveness data, but 10 (19%) studies had more missing data inthe latter (Table 1). The proportion of complete cases reduced, as the number of follow‐up assessments increased(Spearman's rank correlation coefficient ρ = −0.59, p value < .001) and as the study duration increased(ρ = −0.29, p = .04).
3.3 | Approach to missing data
In the remaining assessments, we excluded the five studies with over 95% of complete cases. Three main approaches tomissing data were used: complete‐case analysis (CCA; Faria et al., 2014), reported in 66% of studies (n = 31), multipleimputation (MI; Rubin, 1987; 49%, n = 23), and ad hoc hybrid methods (17%, n = 8). For the primary analysis, CCA
FIGURE 1 Studies selection flow diagram. CEA = cost‐effectiveness analyses; HTA = health technology assessment; RCT = randomised
controlled trial
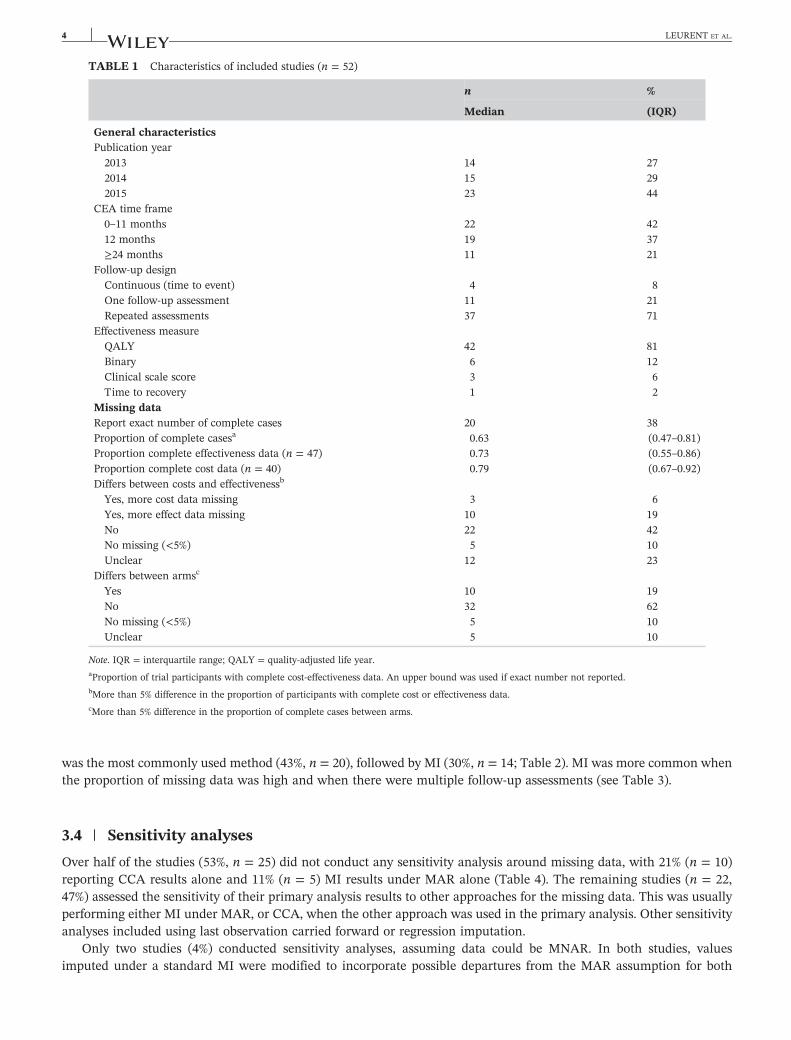
TABLE 1 Characteristics of included studies (n = 52)
n %
Median (IQR)
General characteristicsPublication year2013 14 272014 15 292015 23 44
CEA time frame0–11 months 22 4212 months 19 37≥24 months 11 21
Follow‐up designContinuous (time to event) 4 8One follow‐up assessment 11 21Repeated assessments 37 71
Effectiveness measureQALY 42 81Binary 6 12Clinical scale score 3 6Time to recovery 1 2
Missing dataReport exact number of complete cases 20 38Proportion of complete casesa 0.63 (0.47–0.81)Proportion complete effectiveness data (n = 47) 0.73 (0.55–0.86)Proportion complete cost data (n = 40) 0.79 (0.67–0.92)Differs between costs and effectivenessb
Yes, more cost data missing 3 6Yes, more effect data missing 10 19No 22 42No missing (<5%) 5 10Unclear 12 23
Differs between armsc
Yes 10 19No 32 62No missing (<5%) 5 10Unclear 5 10
Note. IQR = interquartile range; QALY = quality‐adjusted life year.aProportion of trial participants with complete cost‐effectiveness data. An upper bound was used if exact number not reported.bMore than 5% difference in the proportion of participants with complete cost or effectiveness data.cMore than 5% difference in the proportion of complete cases between arms.
4 LEURENT ET AL.
was the most commonly used method (43%, n = 20), followed by MI (30%, n = 14; Table 2). MI was more common whenthe proportion of missing data was high and when there were multiple follow‐up assessments (see Table 3).
3.4 | Sensitivity analyses
Over half of the studies (53%, n = 25) did not conduct any sensitivity analysis around missing data, with 21% (n = 10)reporting CCA results alone and 11% (n = 5) MI results under MAR alone (Table 4). The remaining studies (n = 22,47%) assessed the sensitivity of their primary analysis results to other approaches for the missing data. This was usuallyperforming either MI under MAR, or CCA, when the other approach was used in the primary analysis. Other sensitivityanalyses included using last observation carried forward or regression imputation.
Only two studies (4%) conducted sensitivity analyses, assuming data could be MNAR. In both studies, valuesimputed under a standard MI were modified to incorporate possible departures from the MAR assumption for both
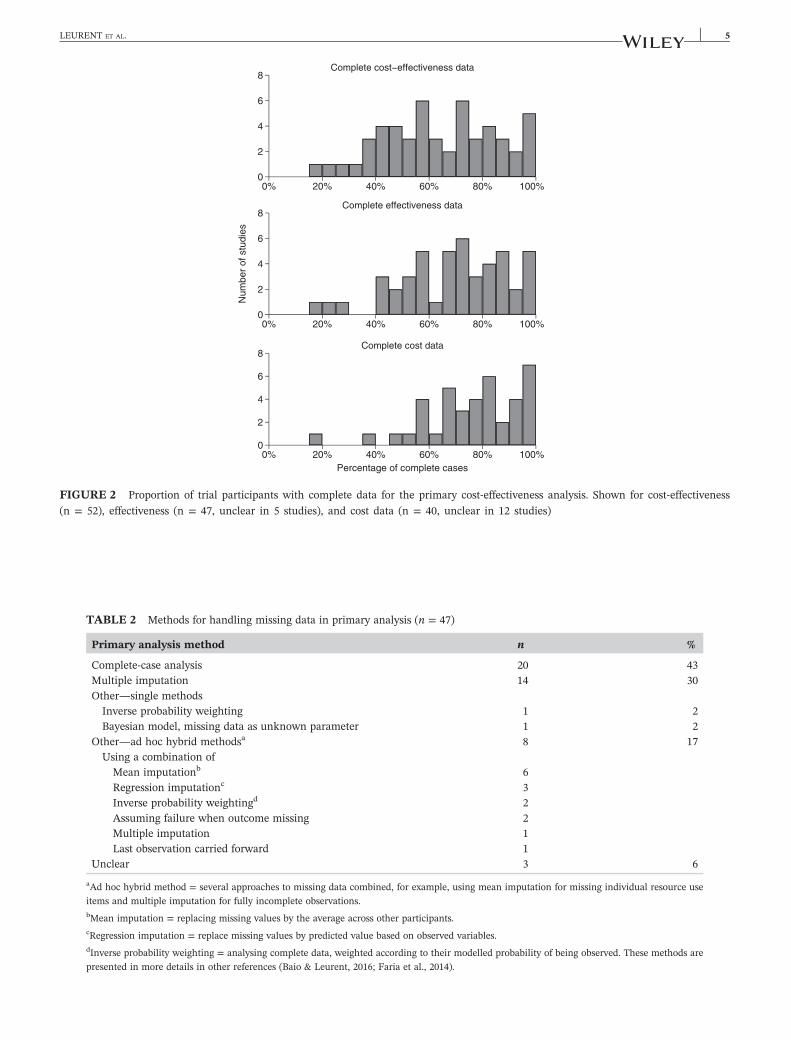
0
2
4
6
8
0% 20% 40% 60% 80% 100%
Complete cost effectiveness data
0
2
4
6
8
Num
ber
of s
tudi
es
0% 20% 40% 60% 80% 100%
Complete effectiveness data
0
2
4
6
8
0% 20% 40% 60% 80% 100% Percentage of complete cases
Complete cost data
FIGURE 2 Proportion of trial participants with complete data for the primary cost‐effectiveness analysis. Shown for cost‐effectiveness
(n = 52), effectiveness (n = 47, unclear in 5 studies), and cost data (n = 40, unclear in 12 studies)
TABLE 2 Methods for handling missing data in primary analysis (n = 47)
Primary analysis method n %
Complete‐case analysis 20 43Multiple imputation 14 30Other—single methodsInverse probability weighting 1 2Bayesian model, missing data as unknown parameter 1 2
Other—ad hoc hybrid methodsa 8 17Using a combination ofMean imputationb 6Regression imputationc 3Inverse probability weightingd 2Assuming failure when outcome missing 2Multiple imputation 1Last observation carried forward 1
Unclear 3 6
aAd hoc hybrid method = several approaches to missing data combined, for example, using mean imputation for missing individual resource useitems and multiple imputation for fully incomplete observations.bMean imputation = replacing missing values by the average across other participants.cRegression imputation = replace missing values by predicted value based on observed variables.dInverse probability weighting = analysing complete data, weighted according to their modelled probability of being observed. These methods arepresented in more details in other references (Baio & Leurent, 2016; Faria et al., 2014).
LEURENT ET AL. 5
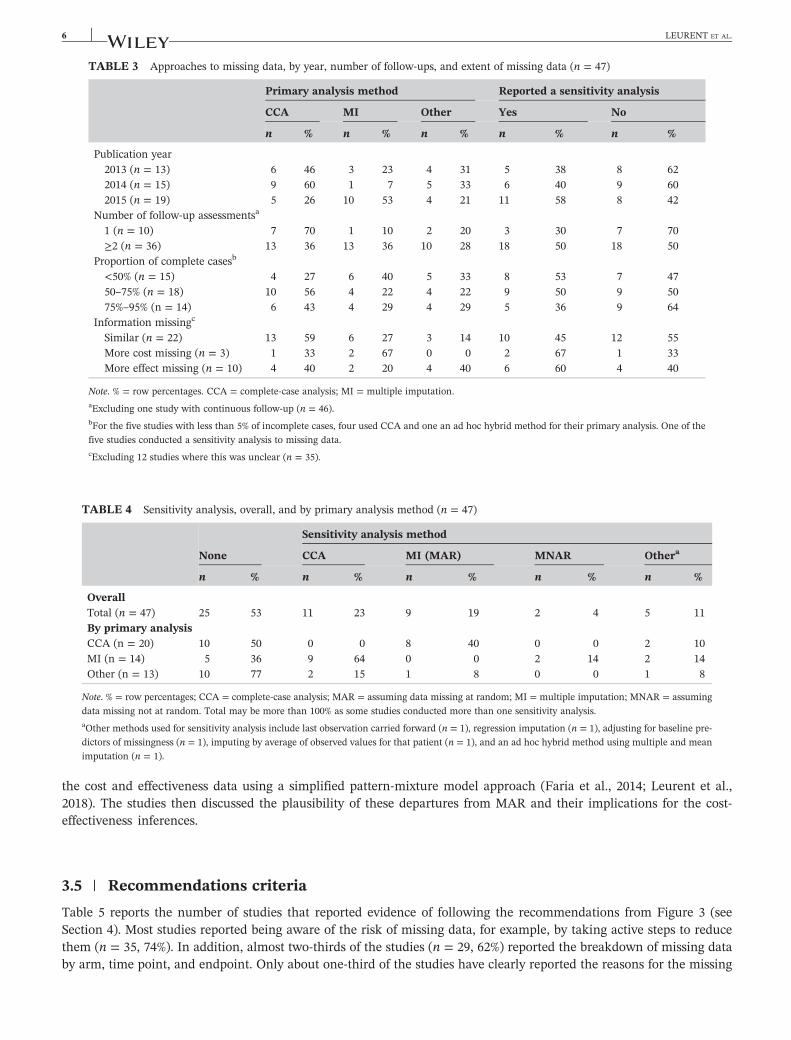
TABLE 3 Approaches to missing data, by year, number of follow‐ups, and extent of missing data (n = 47)
Primary analysis method Reported a sensitivity analysis
CCA MI Other Yes No
n % n % n % n % n %
Publication year2013 (n = 13) 6 46 3 23 4 31 5 38 8 622014 (n = 15) 9 60 1 7 5 33 6 40 9 602015 (n = 19) 5 26 10 53 4 21 11 58 8 42
Number of follow‐up assessmentsa
1 (n = 10) 7 70 1 10 2 20 3 30 7 70≥2 (n = 36) 13 36 13 36 10 28 18 50 18 50
Proportion of complete casesb
<50% (n = 15) 4 27 6 40 5 33 8 53 7 4750–75% (n = 18) 10 56 4 22 4 22 9 50 9 5075%–95% (n = 14) 6 43 4 29 4 29 5 36 9 64
Information missingc
Similar (n = 22) 13 59 6 27 3 14 10 45 12 55More cost missing (n = 3) 1 33 2 67 0 0 2 67 1 33More effect missing (n = 10) 4 40 2 20 4 40 6 60 4 40
Note. % = row percentages. CCA = complete‐case analysis; MI = multiple imputation.aExcluding one study with continuous follow‐up (n = 46).bFor the five studies with less than 5% of incomplete cases, four used CCA and one an ad hoc hybrid method for their primary analysis. One of thefive studies conducted a sensitivity analysis to missing data.cExcluding 12 studies where this was unclear (n = 35).
TABLE 4 Sensitivity analysis, overall, and by primary analysis method (n = 47)
None
Sensitivity analysis method
CCA MI (MAR) MNAR Othera
n % n % n % n % n %
OverallTotal (n = 47) 25 53 11 23 9 19 2 4 5 11By primary analysisCCA (n = 20) 10 50 0 0 8 40 0 0 2 10MI (n = 14) 5 36 9 64 0 0 2 14 2 14Other (n = 13) 10 77 2 15 1 8 0 0 1 8
Note. % = row percentages; CCA = complete‐case analysis; MAR = assuming data missing at random; MI = multiple imputation; MNAR = assuming
data missing not at random. Total may be more than 100% as some studies conducted more than one sensitivity analysis.aOther methods used for sensitivity analysis include last observation carried forward (n = 1), regression imputation (n = 1), adjusting for baseline pre-dictors of missingness (n = 1), imputing by average of observed values for that patient (n = 1), and an ad hoc hybrid method using multiple and meanimputation (n = 1).
6 LEURENT ET AL.
the cost and effectiveness data using a simplified pattern‐mixture model approach (Faria et al., 2014; Leurent et al.,2018). The studies then discussed the plausibility of these departures from MAR and their implications for the cost‐effectiveness inferences.
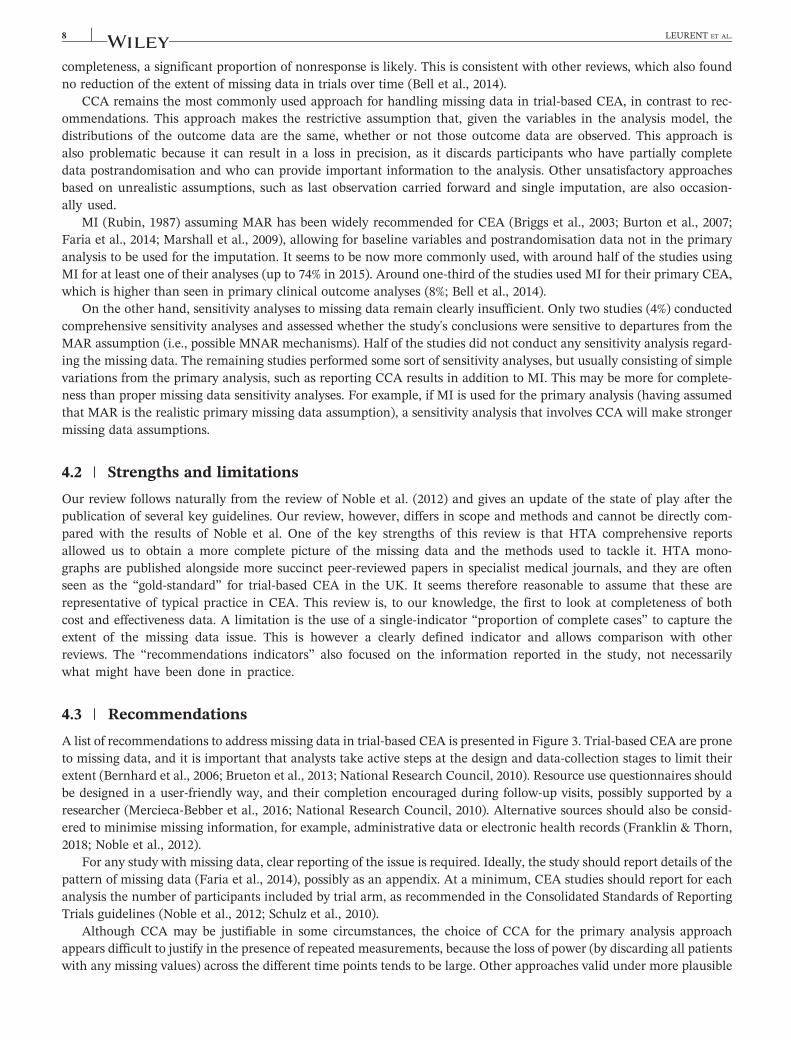
3.5 | Recommendations criteria
Table 5 reports the number of studies that reported evidence of following the recommendations from Figure 3 (seeSection 4). Most studies reported being aware of the risk of missing data, for example, by taking active steps to reducethem (n = 35, 74%). In addition, almost two‐thirds of the studies (n = 29, 62%) reported the breakdown of missing databy arm, time point, and endpoint. Only about one‐third of the studies have clearly reported the reasons for the missing
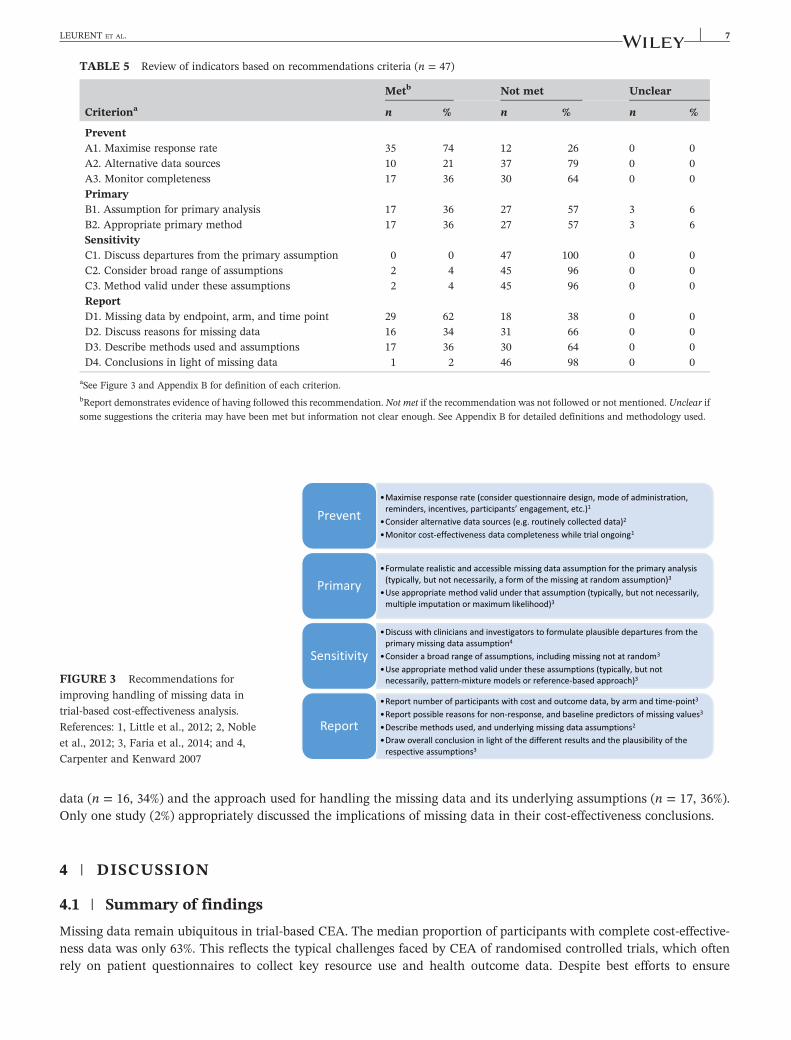
TABLE 5 Review of indicators based on recommendations criteria (n = 47)
Criteriona
Metb Not met Unclear
n % n % n %
PreventA1. Maximise response rate 35 74 12 26 0 0A2. Alternative data sources 10 21 37 79 0 0A3. Monitor completeness 17 36 30 64 0 0PrimaryB1. Assumption for primary analysis 17 36 27 57 3 6B2. Appropriate primary method 17 36 27 57 3 6SensitivityC1. Discuss departures from the primary assumption 0 0 47 100 0 0C2. Consider broad range of assumptions 2 4 45 96 0 0C3. Method valid under these assumptions 2 4 45 96 0 0ReportD1. Missing data by endpoint, arm, and time point 29 62 18 38 0 0D2. Discuss reasons for missing data 16 34 31 66 0 0D3. Describe methods used and assumptions 17 36 30 64 0 0D4. Conclusions in light of missing data 1 2 46 98 0 0
aSee Figure 3 and Appendix B for definition of each criterion.bReport demonstrates evidence of having followed this recommendation. Not met if the recommendation was not followed or not mentioned. Unclear if
some suggestions the criteria may have been met but information not clear enough. See Appendix B for detailed definitions and methodology used.
FIGURE 3 Recommendations for
improving handling of missing data in
trial‐based cost‐effectiveness analysis.
References: 1, Little et al., 2012; 2, Noble
et al., 2012; 3, Faria et al., 2014; and 4,
Carpenter and Kenward 2007
LEURENT ET AL. 7
data (n = 16, 34%) and the approach used for handling the missing data and its underlying assumptions (n = 17, 36%).Only one study (2%) appropriately discussed the implications of missing data in their cost‐effectiveness conclusions.
4 | DISCUSSION
4.1 | Summary of findings
Missing data remain ubiquitous in trial‐based CEA. The median proportion of participants with complete cost‐effective-ness data was only 63%. This reflects the typical challenges faced by CEA of randomised controlled trials, which oftenrely on patient questionnaires to collect key resource use and health outcome data. Despite best efforts to ensure
8 LEURENT ET AL.
completeness, a significant proportion of nonresponse is likely. This is consistent with other reviews, which also foundno reduction of the extent of missing data in trials over time (Bell et al., 2014).
CCA remains the most commonly used approach for handling missing data in trial‐based CEA, in contrast to rec-ommendations. This approach makes the restrictive assumption that, given the variables in the analysis model, thedistributions of the outcome data are the same, whether or not those outcome data are observed. This approach isalso problematic because it can result in a loss in precision, as it discards participants who have partially completedata postrandomisation and who can provide important information to the analysis. Other unsatisfactory approachesbased on unrealistic assumptions, such as last observation carried forward and single imputation, are also occasion-ally used.
MI (Rubin, 1987) assuming MAR has been widely recommended for CEA (Briggs et al., 2003; Burton et al., 2007;Faria et al., 2014; Marshall et al., 2009), allowing for baseline variables and postrandomisation data not in the primaryanalysis to be used for the imputation. It seems to be now more commonly used, with around half of the studies usingMI for at least one of their analyses (up to 74% in 2015). Around one‐third of the studies used MI for their primary CEA,which is higher than seen in primary clinical outcome analyses (8%; Bell et al., 2014).
On the other hand, sensitivity analyses to missing data remain clearly insufficient. Only two studies (4%) conductedcomprehensive sensitivity analyses and assessed whether the study's conclusions were sensitive to departures from theMAR assumption (i.e., possible MNAR mechanisms). Half of the studies did not conduct any sensitivity analysis regard-ing the missing data. The remaining studies performed some sort of sensitivity analyses, but usually consisting of simplevariations from the primary analysis, such as reporting CCA results in addition to MI. This may be more for complete-ness than proper missing data sensitivity analyses. For example, if MI is used for the primary analysis (having assumedthat MAR is the realistic primary missing data assumption), a sensitivity analysis that involves CCA will make strongermissing data assumptions.
4.2 | Strengths and limitations
Our review follows naturally from the review of Noble et al. (2012) and gives an update of the state of play after thepublication of several key guidelines. Our review, however, differs in scope and methods and cannot be directly com-pared with the results of Noble et al. One of the key strengths of this review is that HTA comprehensive reportsallowed us to obtain a more complete picture of the missing data and the methods used to tackle it. HTA mono-graphs are published alongside more succinct peer‐reviewed papers in specialist medical journals, and they are oftenseen as the “gold‐standard” for trial‐based CEA in the UK. It seems therefore reasonable to assume that these arerepresentative of typical practice in CEA. This review is, to our knowledge, the first to look at completeness of bothcost and effectiveness data. A limitation is the use of a single‐indicator “proportion of complete cases” to capture theextent of the missing data issue. This is however a clearly defined indicator and allows comparison with otherreviews. The “recommendations indicators” also focused on the information reported in the study, not necessarilywhat might have been done in practice.
4.3 | Recommendations
A list of recommendations to address missing data in trial‐based CEA is presented in Figure 3. Trial‐based CEA are proneto missing data, and it is important that analysts take active steps at the design and data‐collection stages to limit theirextent (Bernhard et al., 2006; Brueton et al., 2013; National Research Council, 2010). Resource use questionnaires shouldbe designed in a user‐friendly way, and their completion encouraged during follow‐up visits, possibly supported by aresearcher (Mercieca‐Bebber et al., 2016; National Research Council, 2010). Alternative sources should also be consid-ered to minimise missing information, for example, administrative data or electronic health records (Franklin & Thorn,2018; Noble et al., 2012).
For any study with missing data, clear reporting of the issue is required. Ideally, the study should report details of thepattern of missing data (Faria et al., 2014), possibly as an appendix. At a minimum, CEA studies should report for eachanalysis the number of participants included by trial arm, as recommended in the Consolidated Standards of ReportingTrials guidelines (Noble et al., 2012; Schulz et al., 2010).
Although CCA may be justifiable in some circumstances, the choice of CCA for the primary analysis approachappears difficult to justify in the presence of repeated measurements, because the loss of power (by discarding all patientswith any missing values) across the different time points tends to be large. Other approaches valid under more plausible
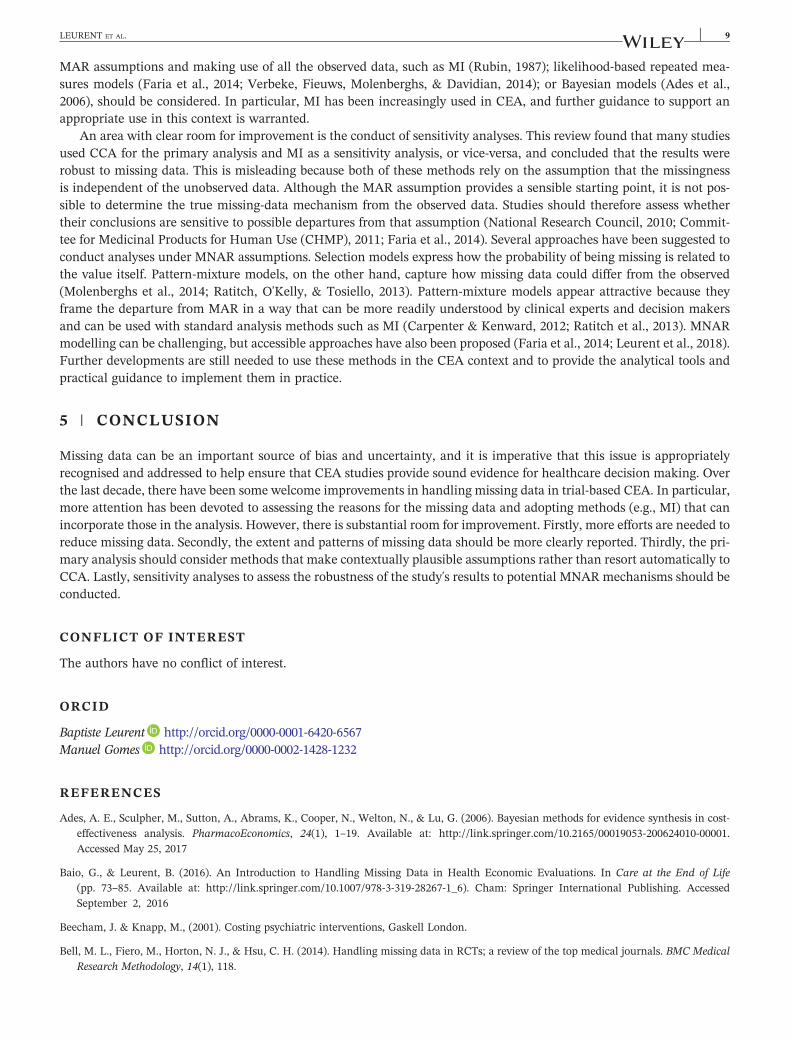
LEURENT ET AL. 9
MAR assumptions and making use of all the observed data, such as MI (Rubin, 1987); likelihood‐based repeated mea-sures models (Faria et al., 2014; Verbeke, Fieuws, Molenberghs, & Davidian, 2014); or Bayesian models (Ades et al.,2006), should be considered. In particular, MI has been increasingly used in CEA, and further guidance to support anappropriate use in this context is warranted.
An area with clear room for improvement is the conduct of sensitivity analyses. This review found that many studiesused CCA for the primary analysis and MI as a sensitivity analysis, or vice‐versa, and concluded that the results wererobust to missing data. This is misleading because both of these methods rely on the assumption that the missingnessis independent of the unobserved data. Although the MAR assumption provides a sensible starting point, it is not pos-sible to determine the true missing‐data mechanism from the observed data. Studies should therefore assess whethertheir conclusions are sensitive to possible departures from that assumption (National Research Council, 2010; Commit-tee for Medicinal Products for Human Use (CHMP), 2011; Faria et al., 2014). Several approaches have been suggested toconduct analyses under MNAR assumptions. Selection models express how the probability of being missing is related tothe value itself. Pattern‐mixture models, on the other hand, capture how missing data could differ from the observed(Molenberghs et al., 2014; Ratitch, O'Kelly, & Tosiello, 2013). Pattern‐mixture models appear attractive because theyframe the departure from MAR in a way that can be more readily understood by clinical experts and decision makersand can be used with standard analysis methods such as MI (Carpenter & Kenward, 2012; Ratitch et al., 2013). MNARmodelling can be challenging, but accessible approaches have also been proposed (Faria et al., 2014; Leurent et al., 2018).Further developments are still needed to use these methods in the CEA context and to provide the analytical tools andpractical guidance to implement them in practice.
5 | CONCLUSION
Missing data can be an important source of bias and uncertainty, and it is imperative that this issue is appropriatelyrecognised and addressed to help ensure that CEA studies provide sound evidence for healthcare decision making. Overthe last decade, there have been some welcome improvements in handling missing data in trial‐based CEA. In particular,more attention has been devoted to assessing the reasons for the missing data and adopting methods (e.g., MI) that canincorporate those in the analysis. However, there is substantial room for improvement. Firstly, more efforts are needed toreduce missing data. Secondly, the extent and patterns of missing data should be more clearly reported. Thirdly, the pri-mary analysis should consider methods that make contextually plausible assumptions rather than resort automatically toCCA. Lastly, sensitivity analyses to assess the robustness of the study's results to potential MNAR mechanisms should beconducted.
CONFLICT OF INTEREST
The authors have no conflict of interest.
ORCID
Baptiste Leurent http://orcid.org/0000-0001-6420-6567Manuel Gomes http://orcid.org/0000-0002-1428-1232
REFERENCES
Ades, A. E., Sculpher, M., Sutton, A., Abrams, K., Cooper, N., Welton, N., & Lu, G. (2006). Bayesian methods for evidence synthesis in cost‐effectiveness analysis. PharmacoEconomics, 24(1), 1–19. Available at: http://link.springer.com/10.2165/00019053‐200624010‐00001.Accessed May 25, 2017
Baio, G., & Leurent, B. (2016). An Introduction to Handling Missing Data in Health Economic Evaluations. In Care at the End of Life(pp. 73–85. Available at: http://link.springer.com/10.1007/978‐3‐319‐28267‐1_6). Cham: Springer International Publishing. AccessedSeptember 2, 2016
Beecham, J. & Knapp, M., (2001). Costing psychiatric interventions, Gaskell London.
Bell, M. L., Fiero, M., Horton, N. J., & Hsu, C. H. (2014). Handling missing data in RCTs; a review of the top medical journals. BMC MedicalResearch Methodology, 14(1), 118.
10 LEURENT ET AL.
Bernhard, J., Cella, D. F., Coates, A. S., Fallowfield, L., Ganz, P. A., Moinpour, C. M., … Hürny, C. (2006). Missing quality of life data in cancerclinical trials: Serious problems and challenges. Statistics in Medicine, 17(5–7), 517–532. Available at: http://www.ncbi.nlm.nih.gov/pubmed/9549801
Briggs, A., Clark, T., Wolstenholme, J., & Clarke, P. (2003). Missing....presumed at random: Cost‐analysis of incomplete data. Health Econom-ics, 12(5), 377–392.
Brooks, R. (1996). EuroQol: The current state of play. Health Policy, 37(1), 53–72.
Brueton, V. C., Tierney, J., Stenning, S., Harding, S., Meredith, S., Nazareth, I., & Rait, G. (2013). Strategies to improve retention inrandomised trials. The Cochrane Database of Systematic Reviews, 12(12). p.MR000032
Burton, A., Billingham, L. J., & Bryan, S. (2007). Cost‐effectiveness in clinical trials: Using multiple imputation to deal with incomplete costdata. Clinical Trials, 4(2), 154–161.
Burzykowski, T., Carpenter, J., Coens, C., Evans, D., France, L., Kenward, M., … of the PSI Missing Data Expert Group (2010). Missing data:Discussion points from the PSI missing data expert group. Pharmaceutical Statistics, 9(4), 288–297.
Carpenter, J., & Kenward, M. (2012). Multiple imputation and its application. Chichester: John Wiley & Sons.
Carpenter, J. R., & Kenward, M. G. (2007). Missing data in randomised controlled trials‐a practical guide. Birmingham: National Institute forHealth Research.
Committee for Medicinal Products for Human Use (CHMP) (2011). Guideline on missing data in confirmatory clinical trials. London: Euro-pean Medicines …, 44(July 2010), 1–12.
Faria, R., Gomes, M., Epstein, D., & White, I. R. (2014). A guide to handling missing data in cost‐effectiveness analysis conducted withinrandomised controlled trials. PharmacoEconomics, 32(12), 1157–1170.
Franklin, M., & Thorn, J. (2018). Self‐reported and routinely collected electronic data for trial‐based evaluations: the current state of play inEngland and considerations for the future. BMC Medical Research Methodology, Submitted.
Leurent, B., Gomes, M. & Carpenter, J., (2017). Missing data in trial‐based cost‐effectiveness analysis review dataset. Available at: https://doi.org/10.17037/DATA.272.
Leurent, B., Gomes, M., Faria, R., Morris, S., Grieve, R., & Carpenter, J. R. (2018). Sensitivity analysis for not‐at‐random missing data in trial‐based cost‐effectiveness analysis: a tutorial. PharmacoEconomics, Submitted.
Little, R. J., D'Agostino, R., Cohen, M. L., Dickersin, K., Emerson, S. S., Farrar, J. T., … Stern, H. (2012). The prevention and treatment of miss-ing data in clinical trials. New England Journal of Medicine, 367(14), 1355–1360.
Little, R. J. A., & Rubin, D. B. (2002). Statistical analysis with missing data. Hoboken, NJ: John Wiley & Sons.
Manca, A., & Palmer, S. (2005). Handling missing data in patient‐level cost‐effectiveness analysis alongside randomised clinical trials. Appliedhealth economics and health policy, 4(2), 65–75.
Marshall, A., Billingham, L. J., & Bryan, S. (2009). Can we afford to ignore missing data in cost‐effectiveness analyses? The European Journal ofHealth Economics, 10(1), 1–3.
Mercieca‐Bebber, R., Palmer, M. J., Brundage, M., Calvert, M., Stockler, M. R., & King, M. T. (2016). Design, implementation and reportingstrategies to reduce the instance and impact of missing patient‐reported outcome (PRO) data: A systematic review. BMJ Open, 6(6), e010938.
Molenberghs, G., Fitzmaurice, G., Kenward, M. G., Tsiatis, A., & Verbeke, G. (2014). Handbook of missing data methodology. Boca Raton, FL:CRC Press.
National Research Council (2010). The Prevention and Treatment of Missing Data in Clinical Trials. Washington, DC: The National AcademiesPress. Available at: http://www.nap.edu/catalog/12955/
Noble, S. M., Hollingworth, W., & Tilling, K. (2012). Missing data in trial‐based cost‐effectiveness analysis: The current state of play. HealthEconomics, 21(2), 187–200.
Ratitch, B., O'Kelly, M., & Tosiello, R. (2013). Missing data in clinical trials: From clinical assumptions to statistical analysis using pattern mix-ture models. Pharmaceutical Statistics, 12(6), 337–347.
Rubin, D. B. (1987). Multiple imputation for nonresponse in surveys. ( pp. 15–19). Harvard University: John Wiley & Sons.
Schulz, K. F., Altman, D. G., Moher, D., & CONSORT Group (2010). CONSORT 2010 statement: Updated guidelines for reporting parallelgroup randomized trials. Annals of Internal Medicine, 152(11), 726–732.
StataCorp, (2017). Stata Statistical Software: Release 15.
Verbeke, G., Fieuws, S., Molenberghs, G., & Davidian, M. (2014). The analysis of multivariate longitudinal data: A review. Statistical Methodsin Medical Research, 23(1), 42–59.
How to cite this article: Leurent B, Gomes M, Carpenter JR. Missing data in trial‐based cost‐effectivenessanalysis: An incomplete journey. Health Economics. 2018;1–17. https://doi.org/10.1002/hec.3654
LEURENT ET AL. 11
APPENDIX A
DETAILS OF STUDIES SELECTION
A.1 | PubMed search criteria and results
Search criteria:(“Health Technol Assess”[Journal])AND (“2015/01/01”[Date ‐ Publication]: “2015/12/31”[Date ‐ Publication])AND (“randomised”[Title] OR “randomized”[Title] OR “trial”[Title])AND (“economic”[Title/Abstract] OR “cost*”[Title/Abstract])NOT (“pilot”[Title] OR “feasibility”[Title])
Number of studies:
Search QueryItemsfound
4 Search (“health Technol assess”[journal]) AND (“2013/01/01”[date ‐ publication] : “2015/12/31”[date ‐ publication])AND (“randomised”[title] OR “randomised”[title] OR “trial”[title]) AND (“economic”[title/abstract] OR“cost*”[title/abstract]) NOT (“pilot”[title] OR “feasibility”[title])
65
3 Search (“Health Technol Assess”[Journal]) AND (“2013/01/01”[Date ‐ Publication] : “2015/12/31”[Date ‐
Publication]) AND (“randomised”[title] OR “randomized”[Title] OR “trial”[Title]) AND (“economic”[Title/Abstract] OR “cost*”[Title/Abstract])
74
2 Search (“Health Technol Assess”[Journal]) AND (“2013/01/01”[Date ‐ Publication] : “2015/12/31”[Date ‐
Publication]) AND (“randomised”[Title] OR “randomized”[Title] OR “trial”[Title])91
1 Search (“Health Technol Assess”[Journal]) AND (“2013/01/01”[Date ‐ Publication] : “2015/12/31”[Date ‐
Publication])236
A.2 | Included studies
Allen, S., Wareham, K., Wang, D., Bradley, C., Sewell, B., Hutchings, H., … Phillips, C. (2013). A high‐dose preparation oflactobacilli and bifidobacteria in the prevention of antibiotic‐associated and Clostridium difficile diarrhoea in older peo-ple admitted to hospital: A multicentre, randomised, double‐blind, placebo‐controlled, parallel arm trial. Health Tech-nology Assessment, 17(57), 1–140. http://doi.org/10.3310/hta17570
Ashby, R. L., Gabe, R., Ali, S., Saramago, P., Chuang, L.‐H., Adderley, U., … Torgerson, D. J. (2014). VenUS IV(Venous leg Ulcer Study IV) – compression hosiery compared with compression bandaging in the treatment of venousleg ulcers: A randomised controlled trial, mixed‐treatment comparison and decision‐analytic model. Health TechnologyAssessment, 18(57), 1–294. http://doi.org/10.3310/hta18570
Banerjee, S., Hellier, J., Romeo, R., Dewey, M., Knapp, M., Ballard, C., … Burns, A. (2013). Study of the use of anti-depressants for depression in dementia: the HTA‐SADD trial—A multicentre, randomised, double‐blind, placebo‐con-trolled trial of the clinical effectiveness and cost‐effectiveness of sertraline and mirtazapine. Health TechnologyAssessment (Winchester, England), 17(7), 1–166. http://doi.org/10.3310/hta17070
Bedson, E., Bell, D., Carr, D., Carter, B., Hughes, D., Jorgensen, A., … Williams, N. (2014). Folate Augmentation ofTreatment – Evaluation for Depression (FolATED): Randomised trial and economic evaluation. Health TechnologyAssessment, 18(48), 1–160. http://doi.org/10.3310/hta18480
Blyth, A., Maskrey, V., Notley, C., Barton, G. R., Brown, T. J., Aveyard, P., … Song, F. (2015). Effectiveness and eco-nomic evaluation of self‐help educational materials for the prevention of smoking relapse: Randomised controlled trial.Health Technology Assessment (Winchester, England), 19(59), 1–70, v–vi. http://doi.org/10.3310/hta19590
Brittenden, J., Cotton, S. C., Elders, A., Tassie, E., Scotland, G., Ramsay, C. R., … Campbell, M. K. (2015). Clinicaleffectiveness and cost‐effectiveness of foam sclerotherapy, endovenous laser ablation and surgery for varicose veins:Results from the Comparison of LAser, Surgery and foam Sclerotherapy (CLASS) randomised controlled trial. HealthTechnology Assessment (Winchester, England), 19(27), 1–342. http://doi.org/10.3310/hta19270
12 LEURENT ET AL.
Carr, A. J., Cooper, C. D., Campbell, M. K., Rees, J. L., Moser, J., Beard, D. J., … Ramsay, C. R. (2015). Clinical effec-tiveness and cost‐effectiveness of open and arthroscopic rotator cuff repair [the UK Rotator Cuff Surgery (UKUFF)randomised trial]. Health Technology Assessment (Winchester, England), 19(80), 1–218. http://doi.org/10.3310/hta19800
Chakravarthy, U., Harding, S. P., Rogers, C. A., Downes, S., Lotery, A. J., Dakin, H. A., … Reeves, B. C. (2015). Arandomised controlled trial to assess the clinical effectiveness and cost‐effectiveness of alternative treatments to InhibitVEGF in Age‐related choroidal Neovascularisation (IVAN). Health Technology Assessment, 19(78), 1–298. http://doi.org/10.3310/hta19780
Clark, T. J., Middleton, L. J., Cooper, N. A., Diwakar, L., Denny, E., Smith, P., … Daniels, J. P. (2015). A randomisedcontrolled trial of Outpatient versus inpatient Polyp Treatment (OPT) for abnormal uterine bleeding. Health TechnologyAssessment, 19(61), 1–194. http://doi.org/10.3310/hta19610
Cooper, S., Lewis, S., Thornton, J. G., Marlow, N., Watts, K., Britton, J., … Coleman, T. (2014). The SNAP trial: arandomised placebo‐controlled trial of nicotine replacement therapy in pregnancy – clinical effectiveness and safety until2 years after delivery, with economic evaluation. Health Technology Assessment, 18(54), 1–128. http://doi.org/10.3310/hta18540
Costa, M. L., Achten, J., Plant, C., Parsons, N. R., Rangan, A., Tubeuf, S., … Lamb, S. E. (2015). UK DRAFFT: Arandomised controlled trial of percutaneous fixation with Kirschner wires versus volar locking‐plate fixation in the treat-ment of adult patients with a dorsally displaced fracture of the distal radius. Health Technology Assessment, 19(17), 1–124. http://doi.org/10.3310/hta19170
Crawford, M. J., Sanatinia, R., Barrett, B., Byford, S., Dean, M., Green, J., …Ward, H. (2014). The clinical effectivenessand cost‐effectiveness of brief intervention for excessive alcohol consumption among people attending sexual healthclinics: A randomised controlled trial (SHEAR). Health Technology Assessment, 18(30), 1–48. http://doi.org/10.3310/hta18300
Creswell, C., Cruddace, S., Gerry, S., Gitau, R., McIntosh, E., Mollison, J., … Cooper, P. J. (2015). Treatment of child-hood anxiety disorder in the context of maternal anxiety disorder: A randomised controlled trial and economic analysis.Health Technology Assessment, 19(38), 1–184. http://doi.org/10.3310/hta19380
Cunningham, S., Rodriguez, A., Boyd, K. A., McIntosh, E., & Lewis, S. C. (2015). Bronchiolitis of Infancy DischargeStudy (BIDS): A multicentre, parallel‐group, double‐blind, randomised controlled, equivalence trial with economic eval-uation. Health Technology Assessment, 19(71), 1–172. http://doi.org/10.3310/hta19710
Dennis, M., Sandercock, P., Graham, C., & Forbes, J. (2015). The Clots in Legs Or sTockings after Stroke (CLOTS) 3trial: A randomised controlled trial to determine whether or not intermittent pneumatic compression reduces the risk ofpost‐stroke deep vein thrombosis and to estimate its cost‐effectiveness. Health Technology Assessment, 19(76), 1–90.http://doi.org/10.3310/hta19760
Everard, M. L., Hind, D., Ugonna, K., Freeman, J., Bradburn, M., Dixon, S., … Cross, E. (2015). Saline in Acute Bron-chiolitis RCT and Economic evaluation: Hypertonic saline in acute bronchiolitis – randomised controlled trial and sys-tematic review. Health Technology Assessment, 19(66), 1–130. http://doi.org/10.3310/hta19660
Forster, A., Dickerson, J., Young, J., Patel, A., Kalra, L., Nixon, J., … Farrin, A. (2013). A cluster randomised con-trolled trial and economic evaluation of a structured training programme for caregivers of inpatients after stroke: TheTRACS trial. Health Technology Assessment, 17(46), 1–216. http://doi.org/10.3310/hta17460
Gates, S., Perkins, G., Lamb, S., Kelly, C., Thickett, D., Young, J., … Gao Smith, F. (2013). Beta‐Agonist Lung injuryTrIal‐2 (BALTI‐2): A multicentre, randomised, double‐blind, placebo‐controlled trial and economic evaluation of intra-venous infusion of salbutamol versus placebo in patients with acute respiratory distress syndrome. Health TechnologyAssessment, 17(38), v–vi, 1–87. http://doi.org/10.3310/hta17380
Goyder, E., Hind, D., Breckon, J., Dimairo, M., Minton, J., Everson‐Hock, E., … Cooper, C. (2014). A randomised con-trolled trial and cost‐effectiveness evaluation of “booster” interventions to sustain increases in physical activity in mid-dle‐aged adults in deprived urban neighbourhoods. Health Technology Assessment, 18(13), 1–210. http://doi.org/10.3310/hta18130
Grant, A., Boachie, C., Cotton, S., Faria, R., Bojke, L., Epstein, D., … Campbell, M. (2013). Clinical and economicevaluation of laparoscopic surgery compared with medical management for gastro‐oesophageal reflux disease: 5‐year fol-low‐up of multicentre randomised trial (the REFLUX trial). Health Technology Assessment, 17(22), 1–167. http://doi.org/10.3310/hta17220
Gupta, J. K., Daniels, J. P., Middleton, L. J., Pattison, H. M., Prileszky, G., Roberts, T. E., … Kai, J. (2015). Arandomised controlled trial of the clinical effectiveness and cost‐effectiveness of the levonorgestrel‐releasing intrauterine
LEURENT ET AL. 13
system in primary care against standard treatment for menorrhagia: The ECLIPSE trial. Health Technology Assessment,19(88), 1–118. http://doi.org/10.3310/hta19880
Halligan, S., Dadswell, E., Wooldrage, K., Wardle, J., von Wagner, C., Lilford, R., … Atkin, W. (2015). Computedtomographic colonography compared with colonoscopy or barium enema for diagnosis of colorectal cancer in oldersymptomatic patients: Two multicentre randomised trials with economic evaluation (the SIGGAR trials). Health Tech-nology Assessment, 19(54), 1–134. http://doi.org/10.3310/hta19540
Handoll, H., Brealey, S., Rangan, A., Keding, A., Corbacho, B., Jefferson, L., … Torgerson, D. (2015). The ProFHER(PROximal Fracture of the Humerus: Evaluation by Randomisation) trial – a pragmatic multicentre randomised con-trolled trial evaluating the clinical effectiveness and cost‐effectiveness of surgical compared with non‐surgical treatmentfor proxi. Health Technology Assessment, 19(24), 1–280. http://doi.org/10.3310/hta19240
Iliffe, S., Kendrick, D., Morris, R., Masud, T., Gage, H., Skelton, D., … Belcher, C. (2014). Multicentre clusterrandomised trial comparing a community group exercise programme and home‐based exercise with usual care for peo-ple aged 65 years and over in primary care. Health Technology Assessment, 18(49), 1–106. http://doi.org/10.3310/hta18490
Kuyken, W., Hayes, R., Barrett, B., Byng, R., Dalgleish, T., Kessler, D., … Byford, S. (2015). The effectiveness and cost‐effectiveness of mindfulness‐based cognitive therapy compared with maintenance antidepressant treatment in the pre-vention of depressive relapse/recurrence: Results of a randomised controlled trial (the PREVENT study). Health Tech-nology Assessment, 19(73), 1–124. http://doi.org/10.3310/hta19730
Lall, R., Hamilton, P., Young, D., Hulme, C., Hall, P., Shah, S., … Lamb, S. (2015). A randomised controlled trial andcost‐effectiveness analysis of high‐frequency oscillatory ventilation against conventional artificial ventilation for adultswith acute respiratory distress syndrome. The OSCAR (OSCillation in ARDS) study. Health Technology Assessment,19(23), 1–178. http://doi.org/10.3310/hta19230
Lenney, W., McKay, A. J., Tudur Smith, C., Williamson, P. R., James, M., Price, D., & MASCOT Study Group. (2013).Management of Asthma in School age Children On Therapy (MASCOT): A randomised, double‐blind, placebo‐con-trolled, parallel study of efficacy and safety. Health Technology Assessment (Winchester, England), 17(4), 1–218.http://doi.org/10.3310/hta17040
Little, P., Hobbs, F. R., Moore, M., Mant, D., Williamson, I., McNulty, C., … Mullee, M. (2014). PRImary care Strep-tococcal Management (PRISM) study: in vitro study, diagnostic cohorts and a pragmatic adaptive randomised controlledtrial with nested qualitative study and cost‐effectiveness study. Health Technology Assessment, 18(6), vii–xxv, 1–101.http://doi.org/10.3310/hta18060
Littlewood, E., Duarte, A., Hewitt, C., Knowles, S., Palmer, S., Walker, S., … Gilbody, S. (2015). A randomised con-trolled trial of computerised cognitive behaviour therapy for the treatment of depression in primary care: TheRandomised Evaluation of the Effectiveness and Acceptability of Computerised Therapy (REEACT) trial. Health Tech-nology Assessment, 19(101), 1–174. http://doi.org/10.3310/hta191010
Livingston, G., Barber, J., Rapaport, P., Knapp, M., Griffin, M., Romeo, R., … Cooper, C. (2014). START (STrAtegiesfor RelaTives) study: A pragmatic randomised controlled trial to determine the clinical effectiveness and cost‐effective-ness of a manual‐based coping strategy programme in promoting the mental health of carers of people with dementia.Health Technology Assessment, 18(61), 1–242. http://doi.org/10.3310/hta18610
Logan, P. A., Armstrong, S., Avery, T. J., Barer, D., Barton, G. R., Darby, J., … Leighton, M. P. (2014). Rehabilitationaimed at improving outdoor mobility for people after stroke: a multicentre randomised controlled study (the Getting outof the House Study). Health Technology Assessment, 18(29), vii–viii, 1–113. http://doi.org/10.3310/hta18290
McMillan, A., Bratton, D. J., Faria, R., Laskawiec‐Szkonter, M., Griffin, S., Davies, R. J., … Morrell, M. J. (2015). Amulticentre randomised controlled trial and economic evaluation of continuous positive airway pressure for the treat-ment of obstructive sleep apnoea syndrome in older people: PREDICT. Health Technology Assessment, 19(40), 1–188.http://doi.org/10.3310/hta19400
Molassiotis, A., Russell, W., Hughes, J., Breckons, M., Lloyd‐Williams, M., Richardson, J., … Ryder, W. (2013). Theeffectiveness and cost‐effectiveness of acupressure for the control and management of chemotherapy‐related acute anddelayed nausea: Assessment of Nausea in Chemotherapy Research (ANCHoR), a randomised controlled trial. HealthTechnology Assessment, 17(26), 1–114. http://doi.org/10.3310/hta17260
Morris, R., Malin, G., Quinlan‐Jones, E., Middleton, L., Diwakar, L., Hemming, K., … Kilby, M. (2013). The Percuta-neous shunting in Lower Urinary Tract Obstruction (PLUTO) study and randomised controlled trial: evaluation of theeffectiveness, cost‐effectiveness and acceptability of percutaneous vesicoamniotic shunting for lower urinary tractobstruction. Health Technology Assessment, 17(59), 1–232. http://doi.org/10.3310/hta17590
14 LEURENT ET AL.
Mouncey, P. R., Osborn, T. M., Power, G. S., Harrison, D. A., Sadique, M. Z., Grieve, R. D., … Rowan, K. M. (2015).Protocolised Management In Sepsis (ProMISe): A multicentre randomised controlled trial of the clinical effectivenessand cost‐effectiveness of early, goal‐directed, protocolised resuscitation for emerging septic shock. Health TechnologyAssessment, 19(97), 1–150. http://doi.org/10.3310/hta19970
Murray, D. W., MacLennan, G. S., Breeman, S., Dakin, H. A., Johnston, L., Campbell, M. K., … Grant, A. M. (2014). Arandomised controlled trial of the clinical effectiveness and cost‐effectiveness of different knee prostheses: The KneeArthroplasty Trial (KAT). Health Technology Assessment, 18(19), 1–235, vii–viii. http://doi.org/10.3310/hta18190
Nicholson, K. G., Abrams, K. R., Batham, S., Medina, M. J., Warren, F. C., Barer, M., … Zambon, M. (2014).Randomised controlled trial and health economic evaluation of the impact of diagnostic testing for influenza, respiratorysyncytial virus and Streptococcus pneumoniae infection on the management of acute admissions in the elderly and high‐risk 18‐ to 64‐y. Health Technology Assessment, 18(36), 1–274, vii–viii. http://doi.org/10.3310/hta18360
Orgeta, V., Leung, P., Yates, L., Kang, S., Hoare, Z., Henderson, C., … Orrell, M. (2015). Individual cognitive stimu-lation therapy for dementia: a clinical effectiveness and cost‐effectiveness pragmatic, multicentre, randomised controlledtrial. Health Technology Assessment, 19(64), 1–108. http://doi.org/10.3310/hta19640
Pickard, R., Starr, K., MacLennan, G., Kilonzo, M., Lam, T., Thomas, R., … McClinton, S. (2015). Use of drugtherapy in the management of symptomatic ureteric stones in hospitalised adults: A multicentre, placebo‐controlled,randomised controlled trial and cost‐effectiveness analysis of a calcium channel blocker (nifedipine) and an alpha‐blocker (tam. Health Technology Assessment (Winchester, England)), 19(63), vii–viii, 1–171. http://doi.org/10.3310/hta19630
Powell, C., Kolamunnage‐Dona, R., Lowe, J., Boland, A., Petrou, S., Doull, I., … Williamson, P. (2013). MAGNEsiumTrial In Children (MAGNETIC): A randomised, placebo‐controlled trial and economic evaluation of nebulised magne-sium sulphate in acute severe asthma in children. Health Technology Assessment, 17(45), v–vi, 1–216. http://doi.org/10.3310/hta17450
Russell, I., Edwards, R., Gliddon, A., Ingledew, D., Russell, D., Whitaker, R., … Park, K. (2013). Cancer of Oesophagusor Gastricus – New Assessment of Technology of Endosonography (COGNATE): report of pragmatic randomised trial.Health Technology Assessment, 17(39), 1–170. http://doi.org/10.3310/hta17390
Salisbury, C., Foster, N., Hopper, C., Bishop, A., Hollinghurst, S., Coast, J., … Montgomery, A. (2013). A pragmaticrandomised controlled trial of the effectiveness and cost‐effectiveness of “PhysioDirect” telephone assessment and adviceservices for physiotherapy. Health Technology Assessment, 17(02), 1–157, v–vi. http://doi.org/10.3310/hta17020
Scott, D. L., Ibrahim, F., Farewell, V., O'Keeffe, A. G., Ma, M., Walker, D., … Kingsley, G. (2014). Randomised con-trolled trial of Tumour necrosis factor inhibitors Against Combination Intensive Therapy with conventional disease‐modifying antirheumatic drugs in established rheumatoid arthritis: The TACIT trial and associated systematic reviews.Health Technology Assessment, 18(66), 1–164. http://doi.org/10.3310/hta18660
Sharples, L., Glover, M., Clutterbuck‐James, A., Bennett, M., Jordan, J., Chadwick, R., … Quinnell, T. (2014). Clinicaleffectiveness and cost‐effectiveness results from the randomised controlled Trial of Oral Mandibular AdvancementDevices for Obstructive sleep apnoea–hypopnoea (TOMADO) and long‐term economic analysis of oral devices and con-tinuous positive airwa. Health Technology Assessment, 18(67), 1–296. http://doi.org/10.3310/hta18670
Stallard, P., Phillips, R., Montgomery, A., Spears, M., Anderson, R., Taylor, J., … Sayal, K. (2013). A clusterrandomised controlled trial to determine the clinical effectiveness and cost‐effectiveness of classroom‐based cognitive–behavioural therapy (CBT) in reducing symptoms of depression in high‐risk adolescents. Health Technology Assess-ment, 17(47), vii–xvii, 1–109. http://doi.org/10.3310/hta17470
Thursz, M., Forrest, E., Roderick, P., Day, C., Austin, A., O'Grady, J., … Ternent, L. (2015). The clinical effectivenessand cost‐effectiveness of STeroids Or Pentoxifylline for Alcoholic Hepatitis (STOPAH): A 2 × 2 factorial randomised con-trolled trial. Health Technology Assessment, 19(102), 1–104. http://doi.org/10.3310/hta191020
Underwood, M., Lamb, S., Eldridge, S., Sheehan, B., Slowther, A., Spencer, A., … Taylor, S. (2013). Exercise fordepression in care home residents: a randomised controlled trial with cost‐effectiveness analysis (OPERA). Health Tech-nology Assessment, 17(18), 1–281. http://doi.org/10.3310/hta17180
Ussher, M., Lewis, S., Aveyard, P., Manyonda, I., West, R., Lewis, B., … Coleman, T. (2015). The London Exercise AndPregnant smokers (LEAP) trial: A randomised controlled trial of physical activity for smoking cessation in pregnancywith an economic evaluation. Health Technology Assessment, 19(84), 1–136. http://doi.org/10.3310/hta19840
Watson, J., Crosby, H., Dale, V., Tober, G., Wu, Q., Lang, J., … Coulton, S. (2013). AESOPS: A randomised controlledtrial of the clinical effectiveness and cost‐effectiveness of opportunistic screening and stepped care interventions for olderhazardous alcohol users in primary care. Health Technology Assessment, 17(25), 1–158. http://doi.org/10.3310/hta17250
LEURENT ET AL. 15
Wiles, N., Thomas, L., Abel, A., Barnes, M., Carroll, F., Ridgway, N., … Lewis, G. (2014). Clinical effectiveness andcost‐effectiveness of cognitive behavioural therapy as an adjunct to pharmacotherapy for treatment‐resistant depressionin primary care: The CoBalT randomised controlled trial. Health Technology Assessment, 18(31), 1–167, vii–viii. http://doi.org/10.3310/hta18310
Williams, M. A., Williamson, E. M., Heine, P. J., Nichols, V., Glover, M. J., Dritsaki, M., … Lamb, S. E. (2015).Strengthening And stretching for Rheumatoid Arthritis of the Hand (SARAH). A randomised controlled trial and eco-nomic evaluation. Health Technology Assessment, 19(19), 1–222. http://doi.org/10.3310/hta19190
Wolf, A., McKay, A., Spowart, C., Granville, H., Boland, A., Petrou, S., … Gamble, C. (2014). Prospective multicentrerandomised, double‐blind, equivalence study comparing clonidine and midazolam as intravenous sedative agents in crit-ically ill children: The SLEEPS (Safety profiLe, Efficacy and Equivalence in Paediatric intensive care Sedation) st. HealthTechnology Assessment, 18(71), 1–212. http://doi.org/10.3310/hta18710
APPENDIX B
INDICATORS DEFINITION
B.1 | Primary indicators
Indicator Definition Notes
Proportion of complete cases Proportion of randomised participants forwhom all data were available for theprimary cost‐effectiveness analysis
If the number of complete‐cases was notclearly reported, we estimated an“upper bound,” from information, suchas the proportion of participants withcomplete cost, or effect, data. Seedefinition of primary analysis below.
Proportion complete effectiveness data Proportion of randomised participants forwhom all effectiveness data wereAvailable for the primary cost‐effectiveness analysis
Same as above
Proportion complete cost data Proportion of randomised participants forwhom all cost data were available forthe primary cost‐effectiveness analysis
Same as above
Report exact number of complete cases Whether the number of participants withcomplete cost and effectiveness datawas clearly reported.
More missing costs or effectiveness Whether the proportion of complete casesdiffer between cost and effectivenessvariable.
Considered “similar” when theproportion of complete cases waswithin 5% of each other.
Primary analysis method Methods used to address missing data inthe primary (base case) cost‐effectiveness analysis
When multiple effectiveness measures,time‐frames, or cost perspectives werereported, without a base‐case clearlydefined, we considered the analysisbased on quality‐adjusted life years(QALYs) over the longest within‐trialfollow‐up period, from the NHS andsocial services cost perceptive.
Conducted a sensitivity analysis tomissing data
Report results under more than oneapproach for addressing missing data
16 LEURENT ET AL.
B.2 | Secondary indicators: Derived from the recommendations list
B.2.1 | Methods
Because these aspects could have been mentioned in multiple parts in the monograph, we used a systematic approach,looking for keywords and checking the most relevant paragraphs in the full report.
i. Search in PDF: “Missing”; “Participation”; “Completion”; “Incomplete”; “Response”; “Non‐response”; “Monitor”;“MCAR”; “MAR”; “MNAR.”
ii. If did not find “steps to reduce missing data,” also check “reminder,” “incentive,” “telephone,” and “contact.”iii. Then, check relevant paragraphs manually: data source for cost‐effectiveness data; beginning of CEA results; and
CEA conclusions.
B.2.2 | Answers
“Yes”: The recommendation was clearly mentioned, and the criteria therefore met.“No”: The recommendation was not clearly mentioned or found. The recommendation may still have been followed
but not reported (or at least not found with the above strategy).“Unclear”: There was some suggestions the criteria may have been met but not enough information to be sure.
Recommendation Indicator definition Examples “yes” Examples “no” Notes
A1. Maximise response
rate (considerquestionnaire design,mode of administration,reminders, incentives,participants'
engagement, etc.)
Mention taking steps to
maximise response rate
Reminder, incentives,
home/hospital visit,multiple attempts,
Mention response was
maximised for clinicaloutcome but not reportedfor cost‐effectivenessendpoints
Can be for overall trial data if implicit
includes cost or effect data. Exceptif steps are clearly for non‐CEvariables only (e.g., primaryoutcome only).
A2. Consider alternative
data sources (e.g.,routinely collected data)
Mention that considered
missing data issues whenchoosing appropriatesource, OR mention morethan one source used for a
CE data.
Use of electronic health
records or administrativedata, e.g., hospital episodestatistics were used tosupplement trial's data,
for example, abouthospital admissions post‐randomisation (whichmight be otherwisemissing).
Using routine data as a
primary source: e.g.,resource use takenprimarily fromadministrative/hospital
records.
A3. Monitor cost‐effectiveness data
completeness while trialongoing
Mentioned monitoring datacompleteness while trial
ongoing.
Data managers checkedinconsistent and missing
data (if not clear “whiletrial ongoing” butmention monitoringprobably fine). Mentiontaking new steps to
reduce MD (e.g.,incentive) as realised lotsof MD after trial started.
Mention data checks forinconsistencies, but no
mention of checkingmissing data.
Can be for overall trial data. Except ifmonitoring clearly for non‐CE
variables only (e.g., primaryoutcome only).
B1. Formulate realistic andaccessible missing dataassumption for theprimary analysis
(typically, but notnecessarily, a form of themissing at randomassumption)
Primary (base‐case) CEAbased on reasonablemissing dataassumptions. (likely
MAR, or alternative ifwell justified).
– Used MI for primaryanalysis ‐ well justifiedand clear alternative
– Hybrid method, except ifclearly explain and justifyunderlying assumptions
(Continues)
(Continued)
Recommendation Indicator definition Examples “yes” Examples “no” Notes
B2. Use appropriatemethod valid under that
assumption (typically,but not necessarily,multiple imputation ormaximum likelihood)
Use appropriate analysismethod.
– MI for primary analysis ‐Bayesian under MAR ‐
well justified and clearalternative
– Use unadjusted CCAwhen reporting data are
MAR.
C1. Discuss with cliniciansand investigators toformulate plausible
departures from theprimary missing dataassumption
Conducted MNARSA + mention elicitation.
Did not conduct MNAR SA
C2. Consider a broad rangeof assumptions,including missing not atrandom mechanisms
Conducted MNAR SA Did not conduct MNAR SA
C3. Use appropriatemethod valid under
these assumptions(typically, but notnecessarily, pattern‐mixture models orreference‐based
approach)
Conducted MNAR SA, andused an appropriate
method (PMM, etc.).
Did not conduct MNAR SA
D1. Report number of
participants with costand outcome data, byarm and time‐point
Report number (or %) of
complete or missing data.Split at least byeffectiveness vs. cost, timepoint (when applicable),and arm
Reported missing data by
endpoint and arm, butnot by time point.
Do not have to be all at the same time
(split by endpoint + time + arm),can be three separate table/texts.
D2. Report possiblereasons for non‐
response, and baselinepredictors of missingvalues
Mention something aboutmain reason for the
missing data, OR Explorefactors associated with it.
Comment on why missingdata (e.g., “because
patients were too ill”). Orexplore baseline factorsassociated withmissingness
No mention of reasons forMD in the CE section.
Have to be specific to the CE missingdata, or clearly mentioning
something like “reasons for MD arediscussed in clinical analysissection …”
D3. Describe methodsused, and underlyingmissing data
assumptions
Clearly state the methodused to address missingdata, AND the underlying
assumption.
No report of missing dataassumption or methodused
Draw overall conclusion in
light of the differentresults and theplausibility of therespective assumptions
Conduct sensitivity
analyses, and interpretresults appropriately.
Did MNAR SA and
appropriate conclusion.
– Did not conduct sensitivity
analyses– Conducted sensitivity
analyses, but nocomment/conclusion
– Did MI and CC and only
say “results did notchange/robust to missingdata”
LEURENT ET AL. 17