Embed Size (px)
Citation preview
Misinformation and resolution 1
RUNNING HEAD: MISINFORMATION AND RESOLUTION
Trace-Strength and Source-Monitoring Accounts of Accuracy
and Metacognitive Resolution in the Misinformation Paradigm
Philip A. Higham
University of Southampton
Karlos Luna
University of Minho
Jessica Bloomfield
University of Southampton
Dr. Philip A. Higham
School of Psychology
University of Southampton
Highfield, Southampton
ENGLAND, SO17 1BJ
e-mail: [email protected]
phone: +44 23 8059 5942
fax: +44 23 8059 4597
Misinformation and resolution 2
Abstract
Two experiments are reported that investigate the impact of misinformation on memory accuracy and
metacognitive resolution. In Experiment 1, participants viewed a series of photographs depicting a
crime scene, were exposed to misinformation that contradicted details in the slides, and later took a
recognition memory test. For each answer, participants were required to indicate whether they were
willing to testify (report) their answer to the Court and to rate confidence. Misinformation impaired
memory accuracy but it had no effect on resolution, regardless of whether resolution was indexed with
confidence-rating measures (gamma correlation and mean confidence) or a report-option measure
(type-2 discrimination: d’). In Experiment 2, a similar accuracy-confidence dissociation was found, and
the misinformation effect occurred mostly with fine-grained responses, suggesting that responding
was based on recollected details. We argue that the results support source-monitoring accounts of
accuracy and resolution rather than accounts based on trace strength.
Keywords: misinformation, suggestibility, metacognitive monitoring, resolution, source monitoring,
strength, confidence
Misinformation and resolution 3
Trace-Strength and Source-Monitoring Accounts of Accuracy and Metacognitive Resolution
in the Misinformation Paradigm
For over 30 years, psychologists have investigated the effect of post-event misinformation on
memory accuracy (see Loftus, 2005 for a recent review). This research has shown that when people
are exposed to misleading details that contradict or supplement actual information contained in a
witnessed event, they often falsely recognize or recall those details on a later memory test. The fact
that people make these types of errors has not been contested. However, the mechanisms that are at
the root of the effect have been the subject of considerable debate (e.g., see Bekerian & Bowers,
1983; Belli, 1989; Christiansen & Ochalek, 1983; Lindsay, 1990; Lindsay & Johnson, 1989; Loftus,
Miller, & Burns, 1978; McCloskey & Zaragoza, 1985).
A related topic is the effect that misinformation has on confidence. When people wrongly
accept misinformation, are they sceptical about its veracity or is the new “memory” accepted with
assurance? Several studies have reported the latter, with participants being more confident in
incorrect responses involving the acceptance of misinformation than in other types of incorrect
responses, and sometimes having more confidence in erroneous misinformation than in correct
responses (e.g., see Cole & Loftus, 1979; Greene, Flynn, & Loftus, 1982; Loftus, Donders, Hoffman,
& Schooler, 1989; Loftus et al., 1978; Luna & Migueles, 2009; Ryan & Geiselman, 1991; Vornik,
Sharman, & Garry, 2003).
These findings with confidence suggest that misinformation impairs resolution, that is, the
extent to which subjective confidence ratings (assigned to different items by an individual participant)
discriminate correct answers from incorrect ones. If confidence assigned to suggested details is as
high (or higher) than confidence for correct details, then participants will have difficulty using
confidence to discriminate the accuracy of their answers. Surprisingly, very few studies have directly
investigated the effect of misinformation on resolution, but the few that have been published
unanimously confirm this prediction. For example, Weingardt, Leonesio, and Loftus (1994) presented
participants with a video of a liquor store robbery and later misled them in a written narrative about
two of four critical details. Finally, a 2AFC recognition test was administered which required a
confidence rating (ranging from 50% to 100%) that their decision was correct. Weingardt et al. found
that misinformation impaired recognition accuracy, but more importantly, analyses of the confidence
data indicated that resolution was also significantly impaired. In fact, in their Experiment 1,
Misinformation and resolution 4
participants demonstrated something akin to negative resolution: Misleading items rated as having
chance-level accuracy (50%) had actual accuracy over 60%, whereas other misleading items rated
with a higher level of confidence (70%, 90%, and 100%) had actual accuracy at about chance level
(50%). Tomes and Katz (2000) presented similar findings: Whereas the Goodman-Kruskal gamma
correlation (G) between confidence and accuracy in their study was .61 for control items, it
plummeted to a mere .05 for misinformation items.1 These results led Tomes and Katz to the strong
conclusion that, “When misinformation is presented, confidence becomes useless as an indicator of
veracity” (p. 279). Finally, Bonham and González-Vallejo (2009) replicated Tomes and Katz pattern of
results using the same materials. In their Experiment 1, G was much greater for control items (.47)
than misinformation items (-.03), demonstrating pronounced resolution impairment.2
That resolution is severely impaired by misinformation is unfortunate news for the legal
system. If it is the case confidence truly is “a useless indicator of veracity” (Tomes & Katz, 2000, p.
279), then various mechanisms that could have regulated misinformation’s effect on memory retrieval
are no longer useful. For example, by using a report option, an eyewitness in a courtroom whose
memory has been affected by misinformation could potentially achieve the same accuracy rate as an
eyewitness who has not been misled (Goldsmith & Koriat, 2008; Higham, 2002, 2007; Koriat &
Goldsmith, 1996). By saying “I don’t know” to questions associated with low-confidence candidate
answers, and only reporting to the Court candidate answers that have high confidence, high accuracy
of reported information can be achieved even if retrieval is poor. However, this high accuracy can only
be achieved if confidence is valid predictor of accuracy. If it is not, such regulatory mechanisms are
ineffectual, and possibly even harmful.
At a theoretical level, why might confidence in suggested details match or exceed confidence
in correct details resulting in poor resolution? One class of models might account for this effect by
examining the memory strength of the alternatives under consideration (e.g., Dougherty, Gettys, &
Ogden, 1999; Dougherty, 2001). For control test items in a typical misinformation study using a two-
alternative recognition task, the person must discriminate between a new-incorrect alternative not
presented in the experiment and an old-correct alternative presented in the event (see top panel of
Figure 1). Hence, there will be a large mean strength difference between these two alternatives, with
the old-correct alternative having higher mean strength than the new-incorrect alternative by virtue of
the fact that it was presented earlier. However, for misinformation test items, both the correct and
Misinformation and resolution 5
incorrect alternatives are old: the correct one was presented in the event whereas the incorrect one
was presented in the post-event. Consequently, both alternatives should have comparable strengths
(see bottom panel of Figure 1). To make a recognition decision, it might simply be assumed that the
chosen alternative on a given trial is the one with the greater strength. One might also assume that
confidence corresponds to the strength of the chosen item (i.e., higher strength of the chosen
alternative corresponds to greater confidence). Under these assumptions, a simple trace-strength
model would predict that misinformation will impair accuracy, and if the incorrect (suggested)
alternative is chosen for a misinformation item, it will be assigned high confidence. The impairment of
accuracy occurs because, compared to the control items, there is a higher likelihood for
misinformation items that the incorrect (suggested) alternative will exceed the strength of the correct
alternative and be chosen erroneously. High confidence is expected because, if the incorrect
(suggested) alternative is chosen, it will have high strength, necessarily higher than the strength of the
competing correct alternative (otherwise the correct alternative would have been chosen). The trace-
strength model also makes a clear prediction for resolution. For misinformation items, because the
strength of incorrect (suggested) alternatives is as high or even higher than the strength of the correct
alternative, and because confidence is based on trace strength, confidence will not be useful as an
accuracy discriminator, resulting in poor resolution (Figure 1).
Although a simple trace-strength model accounts nicely for the extant literature demonstrating
the negative effect of misinformation on resolution, there is ample evidence from other misinformation
studies that people do not always base memory decisions on the mere strength of the recognition
alternatives. For example, accounts based on source monitoring (e.g., Higham, 1998; Johnson,
Hashtroudi, & Lindsay 1993; Lindsay, 1990, 2008; Lindsay & Johnson, 1989; Zaragoza & Lane, 1994)
posit that recollection of memories’ details (e.g., perceptual information) is used to make source
discriminations. Thus, although the incorrect (suggested) alternative may have strength that is
comparable to that of the correct alternative for misinformation test items, it may be offered with low
confidence, or rejected altogether, because some recollected memory information designates it to the
post-event rather than the event. For example, if there is retrieval of an alternative’s typeface as it was
presented in written form in the post-event narrative, the person might infer that the source of the
alternative is the narrative and not the photographic slide sequence.
People do not automatically engage in source monitoring, and their willingness to do so is at
Misinformation and resolution 6
least partly under strategic control and influenced by task demands. For example, Lindsay & Johnson
(1989) found that a source-monitoring test that demanded participants to indicate the source of their
memories yielded better performance than a simple recognition test. Presumably, had participants
spontaneously monitored source during recognition to the same extent as during the source-
monitoring test, this performance difference would not have been observed. More generally, this
result suggests that if participants are to monitor source, they must be encouraged to do so.
Otherwise, they may respond merely to the strength of the alternatives and show serious deficits in
both accuracy and resolution if misinformation is presented, as the trace-strength model predicts.
Critically, close scrutiny of the research that has demonstrated misinformation’s impairment to
resolution indicates quite clearly that participants were not encouraged to monitor source. First,
recognition tests were used, which, as just mentioned, are not as effective as source-monitoring tests
for promoting source discrimination. Second, and perhaps more crucially, none of the participants in
any of the studies were warned directly that they had been misled either before or after the event.
Weingardt et al. (1994) at least specified to participants that they should base their memory-test
responses on what they saw, but neither Tomes and Katz (2000) nor Bonham and González-Vallejo
(2009) even included this instruction. Together, recognition testing and the lack of an experimenter
warning may have encouraged lax source monitoring and overreliance on strength to make
judgments, resulting in the poor resolution for misinformation items that was observed.
We report two experiments on the misinformation effect in this paper. To test the hypothesis
presented above, both experiments incorporate some design features intended to encourage rather
than discourage source monitoring, but which may be considered unusual for research on the
misinformation effect. First, all participants received a clear warning that they had been exposed to
misleading information prior to witnessing the event (Experiment 1) and/or prior to writing the memory
test (Experiments 1 and 2). Although others have used warnings in misinformation studies (e.g.,
Chambers & Zaragoza, 2001; Lindsay, 1990) the nature and extent of our warnings were somewhat
atypical as explained below. Second, we used numerous critical items per participant: 30 (15 control;
15 misinformation) in Experiment 1 and 24 (12 control; 12 misinformation) in Experiment 2. A large
number of critical items allowed us to obtain reasonable estimates of resolution and it promoted the
use of a wide range on the confidence and accuracy scales per participant. Third, we provided
participants with an option to “withhold” their answer, but unlike previous research incorporating such
Misinformation and resolution 7
an option (e.g., Blank, 1998; Roebers & Schneider, 2005), an answer was still required even if it was
chosen (i.e., a best guess). Previous research has shown that such an option with forced output can
be used to compute the hit rate (HR) and the false alarm rate (FAR) using type-2 signal detection
theory (SDT; e.g., see Higham, 2002, 2007; Higham & Arnold, 2007a, 2007b; Higham & Tam, 2005;
see also Koriat & Goldsmith, 1996). These rates were then used to derive an estimate of resolution
(d’) that could be used along with the more common resolution measures: G and mean confidence.
Fourth, in an attempt to distinguish between the trace-strength and source-monitoring accounts, we
presented the correct-control details twice to participants in Experiment 2, once in the slides and once
in the post-event narrative. As will become clear, the two accounts offer opposite predictions for the
effect this will have on resolution. Finally, in an attempt to ascertain the nature of the memory errors
we observed in Experiment 1, we designed a unique test that contained both coarse- and fine-grained
answers in Experiment 2.
Experiment 1
Method
Participants. Participants were 6 male and 12 female (n = 18) psychology students at the
University of Southampton who completed the study for course credits. Ages ranged from 19 to 26
years (M = 20.78 years, SD = 1.59 years). Participants were placed into two counterbalance groups
as outlined below.
Design and materials. The experiment was a 2 (testify: yes/no) x 2 (item type:
misinformation/control) within-subjects design. The crime scene consisted of 15 slides and 15
corresponding narratives. The narratives contained 30 critical details, two pertaining to each slide in
the crime-scene sequence. One version of each critical detail (misinformation) misrepresented the
detail in the slide, whereas the other version (control) either omitted the misinformation, or described
the detail in neutral form. For any given participant, half the critical details occurred in their
misinformation form and half in their control form, with the assignment counterbalanced across
participants. Misinformation appeared evenly throughout the slide sequence for each crime scene;
that is, each narrative contained one piece of misinformation and one control version of another
critical detail.
A 30-item two-alternative recognition memory test was constructed and made into booklets.
Each booklet contained a page of instructions followed by five pages of questions. For each question,
Misinformation and resolution 8
there were spaces to write an answer (A or B), a decision about testifying (Y/N), and a confidence
rating about the accuracy of each response (50-100%). Each question on the test queried a critical
detail, with two questions (and critical details) per slide. The questions appeared in chronological
order, starting with questions about slide 1 and ending with questions about slide 15. Across
questions, option A versus B represented the correct answer 14 versus 16 times, respectively.
Procedure. Participants entered the lab and were seated in front of an Apple 24-inch iMac
computer, which was used to present the crime-scene slides and narratives using Apple Keynote
software. The first two slides contained instructions that informed participants that they would be
shown a series of slides and written descriptions depicting a murder scene. They should study the
slides (8 seconds each) and descriptions (roughly 15 seconds each) closely, but that the narratives
would contain some misinformation. They were also told that it was vital that any information they
provide be accurate and informative and to ask any questions before proceeding. Participants then
viewed the slides one at a time, with each slide filling the computer monitor. Eight seconds was
allotted to study each slide, after which the screen went blank, then a written narrative appeared
which described the details of the slide. The narratives corresponding to each slide ranged in length
depending on the amount of detail depicted. Longer display times were allowed for longer narratives
so that all participants could finish reading them (range: 15-25 seconds).
The 15 slides were digital photographs of a staged murder. The photographs showed the
perpetrator’s car leaving the crime scene, the victim’s home, a knife, and the victim’s body. Two
versions of each narrative were created so that the control and misinformation versions of the critical
details could be presented and counterbalanced. The photographs remained in the same order for
both versions.
After the slide show and narratives for a given crime scene had been presented, participants
were given a Sudoku puzzle to complete for 10 minutes as a distractor task. Then they were
administered a booklet containing the questions for the recognition memory test. While writing the
test, participants were asked to imagine that they were in a courtroom. They were instructed to
answer all questions, but to indicate for each question whether they were confident enough to offer
their answer as testimony in court by circling either “Y” or “N” next to a “Testify” prompt. They were
reminded that the narratives read earlier contained some inaccurate details and therefore not to
assume that if a detail from one of the narratives was remembered that it was guaranteed to be
Misinformation and resolution 9
correct; to perform well on the test, they must accurately remember what happened on the slides,
which may or may not correspond to the account given in the narratives.
Additionally, they were provided with the following instructions:
There are 30 questions in total, each with two alternative answers. Fifteen of these questions
relate to details about which you have been misinformed. In other words, a narrative that you
read contained misleading information about that detail, so you have to be very careful when
answering these questions. For these questions, one alternative is correct (i.e., it appeared
only in the slides) whereas the other is incorrect (i.e., it was read about only in the narrative).
The other 15 questions relate to details about which you have received no misinformation. In
other words, the narrative did not contain misleading information about that detail. For these
questions, one alternative is correct (i.e., it appeared only in the slides) whereas the other is
incorrect (i.e., it is a new detail). Use this information to help you to answer the questions
correctly and make decisions about which answers to use in your testimony.
Results
Alpha level of .05 was adopted for all statistical tests reported in this paper.
Response likelihoods. Participants testified just over half of their answers and there was no
difference in the testify rates for the different item types, F < 1, (control: M = .53, SE = .03;
misinformation: M = .54, SE = .04).
Accuracy. Mean accuracy as a function of item type (misinformation/control) and report option
(testify/withhold) is shown in Table 1. A 2 X 2 repeated-measures Analysis of Variance (ANOVA) on
these accuracy data revealed a main effect of item type, F(1,17) = 6.94, MSE = 0.024, η2= .29 and a
main effect of report option, F(1,17) = 117.77, MSE = 0.018, η2= .87. Accuracy was higher for control
items (M = .77, SE = .03) than misinformation items (M = .67, SE = .03) and it was higher for testified
responses (M = .89, SE = .03) than withheld responses (M = .55, SE = .03). The interaction was not
significant, F < 1.
Resolution. To investigate the effect of misinformation on resolution, we first computed G
(Table 2), and then we compared mean confidence assigned to correct versus incorrect responses
(Table 3). For both of these analyses, item type (control/misinformation) was included as a variable in
the analysis but the data were collapsed across the report-option variable.3
If resolution was impaired by misinformation, then G should be less for misinformation items
Misinformation and resolution 10
than control items. However, as shown in Table 2, G was remarkably similar between the item types,
F < 1, although it was well above chance (0) for both, lower -95% confidence interval = .37.
For the analysis on mean confidence, an impairment of resolution by misinformation would be
indicated by in an interaction between accuracy and item type (i.e., a smaller difference in confidence
ratings assigned to correct versus incorrect responses for misinformation items compared to control
items). This interaction from a 2 (item type: control/misinformation) X 2 (accuracy: correct/incorrect)
within subjects ANOVA was not significant, F < 1. Instead, this analysis revealed only a significant
main effect of accuracy, F(1,16) = 33.67, MSE = 219.44, η2 = .68: mean confidence was higher for
correct answers (M = 79.61, SE = 1.97) than incorrect ones (M = 58.77, SE = 4.62), indicating that
resolution was reasonably good. The main effect of item type was not significant, F(1,16) = 1.93, MSE
= 61.67, η2 = .11.
Finally, the report-option variable was used to compute the type-2 HR and FAR and d’ (Table
4).4 The type-2 HR and FAR are defined as the proportion of correct and incorrect responses that are
testified, respectively, and the standardized difference between them (d’) can be used to index
resolution (e.g., see Higham, 2007). In particular if the HR is high whereas the FAR is low, there is
good discrimination between correct and incorrect answers, and d’ will be high. Conversely, if these
rates are equivalent, then there is failure to discriminate accurate from inaccurate responses, and d’
will equal zero. Because the testify decision was made separately from the confidence rating,
investigating resolution in this way has the advantage of providing a converging test of the effect of
misinformation on resolution, one that is not based on confidence data. If misinformation adversely
affected resolution, there would be a reduction in d’ for misinformation items compared to control
items (i.e., a reduction in accuracy discrimination). However, a one-way within-subjects ANOVA
indicated that this difference was not significant, F < 1 (Table 4). As with the previous measures of
resolution based on confidence ratings, d’ was well above chance for both item types, lower -95%
confidence interval = 0.65.
Discussion
Despite warnings given both pre- and post-event and instructions given prior to the test
indicating the proportion of control versus misinformation test items, a significant misinformation effect
on accuracy was obtained. However, this effect was not accompanied by a reduction in resolution.
Regardless of whether resolution was indexed with confidence ratings (G, mean confidence) or by
Misinformation and resolution 11
type-2 discrimination based on testify decisions (d’), no evidence of a misinformation impairment on
resolution was obtained. This null effect was not attributable to noisy, low levels of resolution overall.
Indeed, resolution was surprisingly high regardless of the particular measure chosen; G exceeded .50
for both misinformation and control items, there was a sizeable difference in confidence ratings
assigned to correct versus incorrect answers, and d’ was well above chance (see Tables 2, 3, and 4).
Thus, the results of Experiment 1 support the contention that if participants are clearly informed that
they have been misled, resolution remains quite high and intact despite the misinformation and its
effect on accuracy.
Accuracy was higher for testified answers than withheld ones (Table 1), indicating that
participants were able to regulate accuracy. This difference is consistent with the analyses on
resolution reported above because reasonable levels of resolution are needed for accuracy to be
regulated with a report option (e.g., see Higham, in press; Koriat & Goldsmith, 1996). However, there
was no tendency for the testify rates to vary according to item type.
Experiment 2
The primary aim of Experiment 2 was to replicate and extend the central results of
Experiment 1 and to further investigate the trace-strength and source-monitoring accounts of
misinformation effects on confidence and accuracy. To achieve this end, there were a few critical
differences between this experiment and the last one. First, instead of the correct-control alternatives
being shown only once in the slides, they were repeated in Experiment 2 by also mentioning them in
the post-event narratives. Thus, for control items, the correct control alternative was seen in the slides
and mentioned in the narratives (two presentations), whereas the incorrect alternative was new (no
presentations). For misinformation items, nothing changed between Experiments 1 and 2; the correct
alternative was seen once in the slides whereas the incorrect alternative was mentioned once in the
narrative.
The purpose of this change was to pit the predictions of the trace-strength model and the
source-monitoring framework against each other. If responding is based on strength, this change
should boost the impairment to resolution caused by misinformation (see Figure 2). For control items,
the repetition of the correct-control alternatives would enhance the difference in mean strength
between them and the new, incorrect-control alternatives compared to a situation in which the correct
control detail is presented only once (e.g., Experiment 1 depicted in Figure 1). Thus, if responding is
Misinformation and resolution 12
based on trace strength, we should observe excellent accuracy and resolution for control items that
should far exceed that for misinformation items, where strength levels are comparable between the
correct and incorrect alternatives (each presented once).
On the other hand, the source-monitoring framework makes a different prediction. In
Experiment 2, the correct-control alternative is presented in different and competing sources (once in
the slides and once in the narrative; Figure 2). As a result, there may be conflicting source details
recollected for correct-control alternatives, making source discrimination difficult. For example, the
colour of the alternative might be recollected from its photographic presentation in the slides and its
typeface recollected from its written presentation in the narrative. From the source-monitoring
perspective, there is no reason for this source-ambiguous alternative to be correctly chosen with any
regularity over the new, incorrect alternative, which provides no experimental-source information at
all. Nor is there any reason to suppose it will be assigned high confidence if it is chosen. Therefore, in
contrast to good accuracy and resolution for control items in this experiment as predicted by the trace-
strength model, the source-monitoring framework predicts poorer accuracy and lower confidence for
these items. Compared to the prediction of the trace-strength model, the situation is slightly better for
the misinformation items for the source-monitoring model: each alternative is at least unique to one
source and retrieved source details can be used to discriminate between the two alternatives that
have comparable strength. Consequently, the net effect according to the source-monitoring
framework is that by repeating correct control details in different sources in Experiment 2,
misinformation may produce little impairment, and perhaps even facilitation, to resolution (see Figure
2).5
Some changes were implemented in Experiment 2 to lessen the possibility that participants
would deliberately avoid reading the narrative so as not to be misled. First, we did not warn them
about misinformation until immediately before the memory test, after presentation of the slide show
was complete. This change also increased the ecological validity of Experiment 2. In real eyewitness
scenarios, it is unlikely that information is encoded as correct or incorrect, which is likely to occur if
warnings are given prior to the witnessed event, as in Experiment 1. Second, a single narrative
containing all the misleading details was constructed and presented in a scrambled chronological
order after all the slides had been viewed. Participants were required to indicate the correct order,
which would have necessitated that they encoded all the (mis)information in the narrative.
Misinformation and resolution 13
Finally, as a further test of the trace-strength and source-monitoring accounts, we
implemented a change to the structure of the test questions. Specifically, we added one correct and
one incorrect coarse-grained alternative to the two fine-grained alternatives for each test question.
This change meant that each test question had four possible answers: one fine-correct, one fine-
incorrect, one coarse-correct, and one coarse-incorrect. The trace-strength and source-monitoring
accounts differ in terms of the amount of conscious recollection that supports responding. On the one
hand, a simple trace-strength account suggests that misinformation’s effect on accuracy involves no
recollection at all; the errors are caused by the comparable strengths of the misinformation and
correct alternatives. Conversely, source-monitoring errors are recollection-based, involving retrieval of
fine-grained, episodic details that can possibly become bound to the wrong item (e.g., Holmes,
Waters, & Rajaram, 1998). Hence, if responding entails source monitoring, then misinformation’s
effect on accuracy should be manifested more in fine- than coarse-grained responses. On the other
hand, if responding is based on strength, then no such prediction holds. If anything, given that
strength by its very nature is vague and non-specific, participants may choose to respond
predominantly with coarse-grained answers because fine-grained choices are not supported by
recollection. If so, then according to the trace- strength account, the misinformation effect should be
manifested more in coarse-grained than in fine-grained answers. To ensure that participants were
able to tell apart experimenter-defined fine- versus coarse-grained answers, we manipulated the
incentives to choose each answer type. As in Experiment 1, participants in Experiment 2 were also
provided with a report option.
Method
Participants. A total of 23 female and 17 male students (n = 40) from the University of
Southampton participated individually in the experiment in exchange for £5. Ages ranged from 18 to
46 years (M = 22.27 years, SD = 5.15 years). Twenty participants were randomly assigned to the low-
incentive group and 20 to the high-incentive group.
Design and materials. The design was a 2 (item: control/misinformation) X 2 (incentive:
high/low) mixed-factorial design with incentive manipulated between subjects. A murder crime scene
was used again in this experiment, with 15 slides the same as those used in Experiment 1 plus three
additional slides. However, unlike Experiment 1 in which there was alternating slide-narrative
presentation, misinformation details were mentioned in a single narrative (approximately 500 words)
Misinformation and resolution 14
that was presented at the end of the slideshow. Also, unlike Experiment 1, critical items were chosen
so that both fine- and coarse-grained versions could be constructed.
In total, 24 critical items were embedded in the narrative, of which 12 appeared in a fine-
grained control form, and 12 in a fine-grained misinformation form. Assignment of the critical details to
their control and misinformation forms was counterbalanced across participants. Approximately 1-3
critical details in the narrative pertained to each slide so that all aspects of the slideshow were
represented. Throughout the narrative, no more than two critical details of the same form occurred in
a row.
A four-alternative free-choice recognition memory test was constructed that consisted of 32
questions, 24 pertaining to critical items, and 8 to filler items. Twelve of the 24 critical-item questions
pertained to control items and 12 to misinformation items. The four alternatives for all critical item
questions consisted of: 1) correct-fine-grained alternative, 2) incorrect-fine-grained alternative, 3)
coarse-grained version of “1”, and d) coarse-grained version of “2”. For the 12 questions pertaining to
control items, the fine-correct alternative corresponded to a detail that appeared in the slide and was
mentioned in the narrative, whereas the fine-incorrect alternative corresponded to new information.
On the other hand, for the 12 questions pertaining to misinformation items, the fine-correct alternative
corresponded to a detail that appeared only in the slide whereas the fine-incorrect alternative
corresponded to a detail that had been read only in the narrative. For example, the DVD “Basic”
appeared in one of the slides. For half the participants, the narrative mentioned that the DVD was
“Basic,” whereas for the other half, the narrative mentioned that the DVD was “Grease.” For the test
question about this slide, participants were asked to choose between 1) “Basic” (fine-correct), 2)
“Grease” (fine-incorrect), 3) “an action film” (coarse-correct), and 4) “a musical film” (coarse-incorrect).
Thus, there were two correct and two incorrect answers that varied in specificity. Assignment of these
answers to the a, b, c, and d alternatives was counterbalanced across test questions. The grain size
of the critical-item alternatives was manipulated in a number of different ways including the use of
colours (e.g., coarse: dark colour, fine: black), numbers (coarse: an odd number, fine: 35), and
category membership (coarse: a single storey building, fine: bungalow). However, in all cases, the
fine-grained alternative could be considered more specific than its coarse-grained counterpart.
Eight filler items were included in the test. For these four-alternative items, there were two
incorrect fine-grained alternatives, an incorrect coarse-grained alternative, and a correct coarse-
Misinformation and resolution 15
grained one. The intention was that the inclusion of these items would vary the question structure
enough so that strategic decision making would have little influence on performance. The data from
these filler items were not analysed. A single, fixed order of the questions was used for all participants
that queried details in the slides in the order in which they appeared. The filler items were randomly
interspersed amongst the critical-item questions.
Participants had the opportunity for each question of choosing a “don’t know” option. If this
option was chosen, participants were presented again with the same question with the same four
alternatives and were then required to provide a response. It was not possible to advance to the next
question until a response was provided. By gathering best guesses to “don’t know” responses, it was
possible to calculate resolution in the same way as Experiment 1. Without these responses, it would
not have been possible to know whether withheld answers were correct or not, which would have
made it impossible to calculate the HR, FAR, and d’.
Procedure. After completing a consent form, participants were seated in front of a 24-inch
Apple iMac computer and viewed the 18 slides of the murder crime scene on the computer screen.
The slides were presented for 5 seconds each separated by a 1-second black screen. After the
slideshow was complete, participants engaged in a filler task of solving anagrams (unscrambling sets
of six or seven letter common words) for 5 minutes, and then they were presented with the narrative
containing the misinformation on the computer screen. The narrative was a summary of the entire
slideshow of approximately 500 words. To encourage encoding of the critical items, the narrative was
broken into 9 segments that were presented in a scrambled order. Participants’ task was to put these
segments into chronological order by placing numbers from 1 to 9 next to each segment. There was
no time limit for this task. This method of introducing misinformation has been successfully used in
previous research (e.g., Zaragoza & Lane, 1994).
After chronologically sorting the narrative, participants completed a second filler task (word
recall) for approximately 15 minutes. This task was not related to the current experiment. After
finishing the filler task, participants read the instructions for the memory test, which also appeared on
the computer screen. The instructions emphasised that some of the details provided in the narrative
were inaccurate so there should be no assumption that if a detail from the narrative was remembered,
that it must also have been present on one of the slides. The instructions indicated, using an example,
that most questions had two alternatives that were specific and two that were not, that most questions
Misinformation and resolution 16
had more than one correct answer, and that if none of the answers seemed correct, the “don’t know”
option could be used.
For participants in the high-incentive group, the following instructions were given:
You are the only eyewitness of this crime and the police need information that is very likely to
be correct. If you report errors, they could be very costly causing the investigation to fail, so it
is critical that you be as accurate as you can. Providing very specific details is not so critical in
case they are wrong. Thus, if you have low confidence in your answer, it is better to choose a
vague answer or to click the “don't know” button than to choose an incorrect specific answer.
This will avoid costly mistakes. Only choose specific answers if you are highly confident about
your answer.
Participants in the low-incentive group received these instructions instead:
There were several eyewitnesses to this crime and the police are in the initial stages of the
investigation looking for leads. Consequently, it is not critical that you be accurate on every
single question because the police can compare your evidence with other eyewitness reports.
It is more important that your answer be specific and informative, so that the police have
information to go on that they haven't already obtained from other eyewitnesses. Thus, if you
have any confidence at all in your answer, it is better to choose a specific answer than to
choose a vague one or to click the “don't know” button. Only choose vague answers or the
“don't know” option if you really have no idea about which answer(s) is correct.
It was indicated to participants that the four alternatives would be shown to them again even if
the “don’t know” option was chosen. Participants were told that any incentives that applied to the free-
report stage did not apply, but that answers in the forced-report stage were to be used by the
experimenters to find out what they would have said had they answered the question. Finally,
regardless of whether the “don’t know” option had been used, participants were instructed to rate their
confidence in the accuracy in their answer using a 0% to 100% scale. Participants then completed the
32-item (24 critical items, 8 filler items) recognition memory test on the computer using the mouse to
select answers. Each question was presented individually on the computer monitor and the test was
self-paced.
Results and Discussion
For all mixed ANOVAs reported for Experiment 2, only the incentive variable was manipulated
Misinformation and resolution 17
between subjects.
Response likelihoods. Overall, more than half of participants’ responses were fine-grained (M
= .59, SE = .02), -95% confidence limit = .55. As expected, more fine-grained answers were chosen in
the low-incentive group (M = .64, SE = .03) than in the high-incentive group (M = .53, SE = .03),
F(1,38) = 6.80, MSE = 0.04, η2= .15. This result indicates that participants were able to distinguish
between the experimenter-defined fine- versus coarse-grained alternatives and responded to our
incentive instructions. There was also no difference in the rate of fine-grain responses according to
item type, F < 1 (control: M = .58, SE = .02; misinformation: M = .60, SE = .03).
About three-quarters of responses were reported, a rate which did not differ according to
either item type, F < 1 (control: M = .77, SE = .03; misinformation: M = .75, SE = .03) or incentives,
F(1,38) = 1.26, MSE = .02, η2 = .015 (low incentive: M = .79, SE = .03; high incentive: M = .74, SE =
.03).
Accuracy. Table 1 shows mean accuracy (collapsed across grain size) as a function of item
type, incentive and report option. A 2 (incentive: high/low) X 2 (report option: reported/withheld) X 2
(item: control/misinformation) mixed ANOVA was conducted on accuracy.6 It revealed a main effect of
item type, F(1,31) = 8.05, MSE = 0.08, η2= .21, and a main effect of report option, F(1,31) = 44.79,
MSE = 0.06, η2= .59. Accuracy was higher for control (M = .72, SE = .03) than misinformation items
(M = .57, SE = .03) and it was higher for reported (M = .79, SE = .02) than withheld items (M = .50,
SE = .03). No other main effect or interaction was significant, largest F(1,31) = 1.64, MSE = 0.04, η2=
.05.
Accuracy by grain size. To investigate whether the misinformation effect was manifested
predominantly in coarse- versus fine-grained answers, we conducted a 2 (incentive: high/low) X 2
(grain size: coarse/fine) X 2 (item: control/misinformation) mixed ANOVA on accuracy. The data,
shown in Table 5, were collapsed across the report option variable to avoid a predominance of empty
cells. The ANOVA yielded a main effect of item, F(1,37) = 21.23, MSE = 0.04, η2= .37, and a main
effect of grain size, F(1,37) = 36.94, MSE = 0.03, η2= .50.7 Accuracy was higher for control items (M =
.76, SE = .02) than misinformation items (M = .61, SE = .02) and it was higher for fine-grained
answers (M = .77, SE = .02) than coarse-grained answers (M = .60, SE = .02). The main effect of
misinformation was qualified by a marginal interaction with grain size, F(1,37) = 4.03, MSE = 0.05,
Misinformation and resolution 18
η2= .10, p = .05. The marginal interaction occurred because the misinformation effect was larger for
fine-grained responses than coarse-grained responses. Indeed, only the misinformation effect for fine-
grained responses was significant, F(1,37) = 26.96, MSE = 0.04, η2= .42 and F(1,37) = 2.19, MSE =
0.05, η2= .06, for fine-grained and coarse-grained responses, respectively. The main effect of grain
size was qualified by an interaction with incentive, F(1,37) = 4.67, MSE = 0.03, η2= .11. This
interaction reflected the fact that the accuracy advantage of fine-grained responses over coarse-
grained responses was larger in the high-incentive group than the low-incentive group (Table 5),
although both effects were significant, F(1,19) = 53.80, MSE = 0.02, η2= .74 and F(1,18) = 5.45, MSE
= 0.04, η2= .23, respectively. No other main effect or interaction was significant, largest F < 1.
Resolution. As in Experiment 1, the effect of misinformation on resolution was investigated
with G (Table 2), mean confidence (Table 3), and type-2 d’ (Table 4). For the analyses involving
confidence ratings (G and mean confidence), item type (control/misinformation) and incentive
(high/low) were included as variables in the analysis, but the data were collapsed across the report-
option variable. On the other hand, the report-option variable was used to define the HR and FAR for
the analysis on d’.
The 2 (incentive: high/low) X 2 (item: control/misinformation) mixed ANOVA on G revealed no
significant effects, largest F(1,38) = 2.37, MSE =.11, η2= .06. However, G was well above chance (0)
in all conditions, lowest -95% confidence limit = .38. An analogous ANOVA on d’ also revealed no
significant effects, largest F(1,38) = 1.12, MSE = 0.75, η2= .03, but as with G, all d’s were well above
chance, lowest -95% confidence limit = .45. Finally, a 2 (incentive: high/low) X 2 (item:
control/misinformation) X 2 (accuracy: correct/incorrect) ANOVA on mean confidence revealed only a
main effect of accuracy, F(1,38) = 81.50, MSE = 253.2, η2= .68. Participants were more confident in
accurate responses (M = 68.06, SE = 2.43) than inaccurate ones (M = 45.35, SE = 3.15), indicating
reasonably good resolution. No other main effect or interaction was significant, although the three-
way interaction was marginal, F(1,38) = 3.17, MSE = 115.9, η2= .08, p = .08. In summary, there was
no evidence that resolution was moderated by misinformation in any of these analyses, all Fs < 1.
Discussion
The results of Experiment 2 replicated and extended the central results of Experiment 1. A
robust misinformation effect on accuracy was obtained, but misinformation had no discernible effect
Misinformation and resolution 19
on resolution. Again, this null effect was not attributable to low levels of resolution. Rather, both
analyses involving confidence ratings (G and mean confidence) and the analysis involving the report
option (d’) indicated that resolution was reasonably good in all conditions.
Comparable resolution for control and misinformation items severely limits the generalisability
of the conclusion based on previous research that misinformation has a devastating effect on people’s
ability to monitor the accuracy of their responses (e.g., Bonham & González-Vallejo, 2009; Tomes &
Katz, 2000; Weingardt et al., 1994). If multiple critical items are used and participants are clearly
informed that they have been misled, resolution remains quite high and intact despite the
misinformation and its effect on accuracy. In contrast to previous research that has directly examined
resolution in the misinformation paradigm, the current results suggest that participants were not solely
relying on strength when making their recognition decisions and confidence ratings. If they had been,
resolution for control items would have far exceeded that for misinformation items. Instead, the results
suggest that participants were monitoring the source of the alternatives, which may have been difficult
for repeated correct-control alternatives because they were presented in different, competing sources.
Source confusion for correct-control alternatives would have limited the advantage that control items
had over misinformation items, possibly rendering comparable resolution levels between the item
types, which is exactly the pattern of results that we observed.
Added support that participants’ responses were based to some degree on consciously
recollected details that allowed them to engage in source discrimination is obtained by examining the
graininess of their decisions. More than half of all responses were fine-grained, and the difference
between control and misinformation accuracy was only significant with fine-grained answers.
As in Experiment 1, accuracy was higher for reported answers than for withheld answers,
indicating that participants were successful at regulating accuracy. Such regulation would not have
been possible without reasonably high levels of resolution (Koriat & Goldsmith, 1996). However, as in
Experiment 1, there was no evidence that participants were selective in their use of the report option.
General Discussion
Robust misinformation effects on accuracy were found throughout both experiments.
However, contrary to previous reports (Bonham & González-Vallejo, 2009; Tomes & Katz, 2000;
Weingardt et al., 1994), these effects occurred without a concomitant effect on resolution. This
dissociation between accuracy and resolution was observed with three different indices of resolution:
Misinformation and resolution 20
the Goodman-Kruskal gamma correlation (G), mean confidence, and type-2 discrimination (d’). The
first two measures, commonly used in the metacognitive literature, are based on confidence ratings,
whereas the third is derived from the rates of reporting correct (HR) versus incorrect (FAR) answers.
All indices revealed reasonably good levels of resolution throughout all conditions in both
experiments. Thus, the current results attest to the robustness of the misinformation effect, but
indicate that the effect is not always accompanied by poor resolution performance.
If there are few misleading details and no indication that misleading information has been
presented in the experiment, which is typical of previous studies that have directly examined
resolution in the misinformation paradigm, participants have no reason to be vigilant about source and
may have relied mostly on the strength of the alternatives. However, we suspect that the atypical
design features of our experiments – particularly multiple critical items and greatly emphasised
warnings about the presence of misleading information – may have encouraged more source
monitoring than has been observed in previous research. These features likely made it evident that
simply responding to the strength of the alternative(s) would not be enough for successful completion
of the task. By attending to the recollected details of memories in our experiments, any effect of the
high strength of misinformation alternatives could be appropriately discounted. Naturally, this would
lead to better accuracy, but even if the misinformation alternative was mistakenly chosen, there may
have been enough contradictory evidence regarding its source to lower confidence and improve
resolution overall.
Further evidence of source-monitoring processes was found in Experiment 2 in which
participants chose predominantly fine-grained rather than coarse-grained responses, and the
difference between control- and misinformation-item accuracy was only significant for fine-grained
answers. These results show that participants’ memories were not vague and gist-based, which is
what would be expected if strength was the primary basis of responding and source details were not
being incorporated into their judgments.
Can the simple strength model that we have tested in these experiments be modified to
account for our results? One possible change would be to base confidence on the relative strength of
the two competing recognition alternatives instead of the absolute strength of the chosen alternative.
Such a mechanism is implemented in Dougherty et al. ‘s (1999; see also Dougherty, 2001) Minerva-
Decision Making (MDM) model of confidence. As the name implies, this model is based on
Misinformation and resolution 21
Hintzman’s (1988) MINERVA model of memory. It is assumed that alternative answers access a
distributed memory system and strength (in this case, echo intensity) is computed based on the
similarity of each alternative to traces in memory. In a misinformation paradigm, this means that
misinformation alternatives, by virtue of having been presented earlier in the experiment, will have
higher strength than new-incorrect alternatives and comparable strength to correct alternatives.
However, rather than confidence being based on the strength of the chosen alternative per se, it is
computed by comparing the relative strengths of the two alternatives under consideration; large and
small differential strength translates into high and low confidence, respectively. Hence, for
misinformation items, confidence in the incorrect misinformation alternative will be low because of the
comparable strength of the competing correct alternative, possibly leading to good resolution.
The problem with this amendment to the trace-strength model is that low differential strength
between the alternatives means that confidence in both correct and incorrect responses to
misinformation items should be low. Lowering confidence to correct responses would impair
resolution of misinformation items compared to control items, just as if confidence was based on
absolute strength. As noted, we found no evidence for impaired resolution due to misinformation or
low confidence in correct responses to misinformation items. For example, as shown in Table 3, in
both of our experiments, confidence in correct responses to misinformation items was high and
considerably greater than confidence in incorrect responses. In our view, it is necessary to consider
more than the strength of the alternatives to explain our results by taking into account participants’
use of source information.
Because resolution was reasonably good and unaffected by misinformation, participants were
in a position to strategically regulate their accuracy. Indeed, in both experiments, accuracy of reported
answers was considerably higher than the accuracy of withheld answers (Table 1). However, as
noted above, participants exhibited no tendency whatsoever to be selective in their use of the report
option by, for example, reporting fewer answers to misinformation items than to control items.
Equivalent reporting rates between the item types even occurred in Experiment 1 in which participants
were informed that there was an equal number of each item type on the test, information which could
presumably be used to assist in the selection process.
Conclusions
Three decades of memory research has examined the effects of misinformation on memory
Misinformation and resolution 22
accuracy. Some of this research has suggested that misinformation has a profound effect on
confidence and that resolution is impaired. However, in our studies, which had clear warnings about
misinformation and multiple critical items, misinformation impaired memory accuracy but had no
detectable effect on resolution. These results contribute to a growing body of research on
metacognitive processes underpinning the regulation of memory accuracy in forensic contexts.
Misinformation and resolution 23
References
Bekerian, D. A., & Bowers, J. M. (1983). Eyewitness testimony: Were we misled? Journal of
Experimental Psychology: Learning, Memory, and Cognition, 9, 139-145.
Belli, R. F. (1989). Influences of misleading postevent information: Misinformation interference and
acceptance. Journal of Experimental Psychology: General, 118, 72-85.
Blank, H. (1998). Memory states and memory tasks: An integrative framework for eyewitness memory
and suggestibility. Memory, 6, 481-529.
Bonham, A. J., & González-Vallejo, C. (2009). Assessment of calibration for reconstructed eye-
witness memories. Acta Psychologica, 131, 34-52.
Bothwell, R. K., Deffenbacher, K. A., & Brigham, J. C. (1987). Correlation of eyewitness accuracy and
confidence: Optimality hypothesis revisited. Journal of Applied Psychology, 72, 691-695.
Chambers, K. L., & Zaragoza, M. S. (2001). Intended and unintended effects of explicit warnings on
eyewitness suggestibility: Evidence from source identification tests. Memory & Cognition, 29,
1120-1129.
Christiaansen, R. E., & Ochalek, K. (1983). Editing misleading information from memory: Evidence for
the coexistence of original and postevent information. Memory & Cognition, 11, 467-475.
Cole, W. G., & Loftus, E. F. (1979). Incorporating new information into memory. American Journal of
Psychology, 92, 413-425.
Dougherty, M. R. P., Gettys, C. F., & Ogden, E. E. (1999). MINERVA-DM: A memory processes
model for judgments of likelihood. Psychological Review, 106, 180-209.
Dougherty, M. R. P. (2001). Integration of the ecological and error models of overconfidence using a
multiple-trace memory model. Journal of Experimental Psychology: General, 130, 579-599.
Goldsmith, G., & Koriat, A. (2008). The strategic regulation of memory accuracy and informativeness.
In A. Benjamin & B. Ross (Eds.), The Psychology of Learning and Motivation, Vol. 48:
Memory use as skilled cognition (pp. 307-324). San Diego, USA: Elsevier.
Greene, E., Flynn, M. S., & Loftus, E. F. (1982). Inducing resistance to misleading information.
Journal of Verbal Learning and Verbal Behavior, 21, 207-219.
Higham, P. A. (1998). Believing details known to have been suggested. British Journal of Psychology,
89, 265-283.
Higham, P. A. (2002). Strong cues are not necessarily weak: Thomson and Tulving (1970) and the
Misinformation and resolution 24
encoding specificity principle revisited. Memory & Cognition, 30, 67-80.
Higham, P. A. (2007). No Special K! A signal detection framework for the strategic regulation of
memory accuracy. Journal of Experimental Psychology: General, 136, 1-22.
Higham, P.A. (in press). Accuracy discrimination and type-2 signal detection theory: Clarifications,
extensions, and an analysis of bias. In P.A. Higham and J.P. Leboe (Eds.) Constructions of
remembering and metacognition: Essays in honor of Bruce Whittlesea. Houndmills, UK:
Palgrave-MacMillan.
Higham, P.A., & Arnold, M. M. (2007a). Beyond reliability and validity: The role of metacognition in
psychological testing. In R.A. Degregorio (Ed.) New developments in psychological testing
(pp. 139-162). Hauppauge, USA: Nova Science.
Higham, P.A., & Arnold, M. M. (2007b). How many questions should I answer? Using bias profiles to
estimate optimal bias and maximum score on formula-scored tests. European Journal of
Cognitive Psychology, 19, 718-742.
Higham, P. A., & Tam, H. (2005). Generation failure: Estimating metacognition in cued recall. Journal
of Memory and Language, 52, 595-617.
Hintzman, D. L. (1988). Judgments of frequency and recognition memory in a multiple-trace memory
model. Psychological Review, 95, 528-551.
Holmes, J.B., Waters, H.S., & Rajaram, S. (1998). The phenomenology of false memories: Episodic
content and confidence. Journal of Experimental Psychology: Learning, Memory, and
Cognition, 24, 1026-1040.
Johnson, M. K., Hashtroudi, S., & Lindsay, D. S. (1993). Source monitoring. Psychological Bulletin,
114, 3-28.
Koriat, A., & Goldsmith, M. (1996). Monitoring and control processes in the strategic regulation of
memory accuracy. Psychological Review, 103, 490-517.
Lindsay, D. S. (1990). Misleading suggestions can impair eyewitnesses' ability to remember event
details. Journal of Experimental Psychology: Learning, Memory, and Cognition, 16, 1077-
1083.
Lindsay, D. S. (2008). Source monitoring. In H. L. Roediger, III (Ed.), Cognitive psychology of
memory. Vol. 2 of Learning and memory: A comprehensive reference, 4 vols. (J. Byrne,
Editor) (pp. 325-348). Oxford: Elsevier.
Misinformation and resolution 25
Lindsay, D. S., & Johnson, M. K. (1989). The eyewitness suggestibility effect and memory for source.
Memory & Cognition, 17, 349-358.
Lindsay, D. S., Read, J. D., & Sharma, K. (1998). Accuracy and confidence in person identification.
The relationship is strong when witnessing conditions vary widely. Psychological Science, 9,
215-218.
Loftus, E. F. (2005). Planting misinformation in the human mind: A 30-year investigation of the
malleability of memory. Learning and Memory, 12, 361-366.
Loftus, E. F., Donders, K., Hoffman, H. G., & Schooler, J. W. (1989). Creating new memories that are
quickly accessed and confidently held. Memory & Cognition, 17, 607-616.
Loftus, E.F., Miller, D.G., & Burns, H.J. (1978). Semantic integration of verbal information into a visual
memory. Journal of Experimental Psychology: Human Learning and Memory, 4, 19-31.
Luna, K., & Migueles, M. (2009). Acceptance of central and peripheral misinformation and confidence.
Spanish Journal of Psychology, 12, 405-413.
McCloskey, M. & Zaragoza, M. (1985). Misleading postevent information and memory for events:
Arguments and evidence against memory impairment hypotheses. Journal of Experimental
Psychology: General, 114, 1-16.
Macmillan, N. A. & Creelman, C. D. (2005). Detection theory. Mahwah, USA: Erlbaum.
Nelson, T. O. (1984). A comparison of current measures of the accuracy of feeling-of-knowing
predictions. Psychological Bulletin, 95, 109-133.
Roebers, C. M., & Schneider, W. (2005). The strategic regulation of children’s memory performance
and suggestibility. Journal of Experimental Child Psychology, 91, 24-44.
Ryan, R. H., & Geiselman, R. E. (1991). Effect of biased information on the relationship between
eyewitness confidence and accuracy. Bulletin of the Psychonomic Society, 29, 7-9.
Tomes, J. L., & Katz, A. N. (2000). Confidence-accuracy relations for real and suggested events.
Memory, 8, 273-283.
Vornik, L. A., Sharman, S. J., & Garry, M. (2003). The power of the spoken word: Sociolinguistic cues
influence the misinformation effect. Memory, 11, 101-109.
Weingardt, K. R., Leonesio, R. J., & Loftus, E. F. (1994). Viewing eyewitness research from a
metacognitive perspective. In J. Metcalfe, & A. P. Shimamura (Eds.), Metacognition: Knowing
about knowing (pp. 157-184). Cambridge, USA: The MIT Press.
Misinformation and resolution 26
Zaragoza, M. S., & Lane, S. M. (1994). Source misattributions and the suggestibility of eyewitness
memory. Journal of Experimental Psychology: Learning, Memory, and Cognition, 20, 934-
945.
Misinformation and resolution 27
Author Notes
Philip A. Higham, School of Psychology, University of Southampton, Karlos Luna, School of
Psychology, University of Minho, Jessica Bloomfield, School of Psychology, University of
Southampton. Portions of this research were presented at the 25th Annual British Psychological
Society Cognitive Section Conference, September 8–10, 2008, Southampton, UK and at the 49th
Annual Meeting of The Psychonomic Society, Chicago, Illinois, November 13–16, 2008. Thanks to
Hartmut Blank for helpful discussion. Also thanks to Steve Lindsay and an anonymous reviewer for
comments on a previous version of this paper. Correspondence concerning this article should be
addressed to Philip A. Higham, School of Psychology, University of Southampton, Highfield,
Southampton, ENGLAND, SO17 1BJ. E-mail: [email protected].
Misinformation and resolution 28
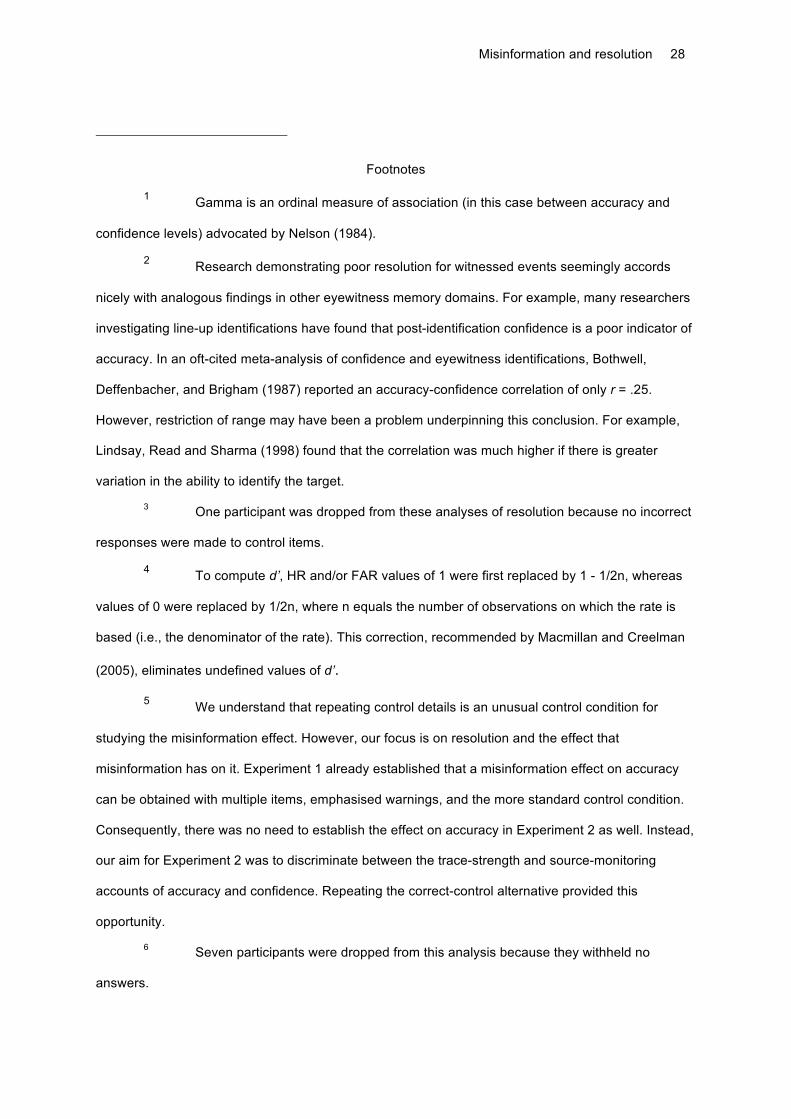
Footnotes
1 Gamma is an ordinal measure of association (in this case between accuracy and
confidence levels) advocated by Nelson (1984).
2 Research demonstrating poor resolution for witnessed events seemingly accords
nicely with analogous findings in other eyewitness memory domains. For example, many researchers
investigating line-up identifications have found that post-identification confidence is a poor indicator of
accuracy. In an oft-cited meta-analysis of confidence and eyewitness identifications, Bothwell,
Deffenbacher, and Brigham (1987) reported an accuracy-confidence correlation of only r = .25.
However, restriction of range may have been a problem underpinning this conclusion. For example,
Lindsay, Read and Sharma (1998) found that the correlation was much higher if there is greater
variation in the ability to identify the target.
3 One participant was dropped from these analyses of resolution because no incorrect
responses were made to control items.
4 To compute d’, HR and/or FAR values of 1 were first replaced by 1 - 1/2n, whereas
values of 0 were replaced by 1/2n, where n equals the number of observations on which the rate is
based (i.e., the denominator of the rate). This correction, recommended by Macmillan and Creelman
(2005), eliminates undefined values of d’.
5 We understand that repeating control details is an unusual control condition for
studying the misinformation effect. However, our focus is on resolution and the effect that
misinformation has on it. Experiment 1 already established that a misinformation effect on accuracy
can be obtained with multiple items, emphasised warnings, and the more standard control condition.
Consequently, there was no need to establish the effect on accuracy in Experiment 2 as well. Instead,
our aim for Experiment 2 was to discriminate between the trace-strength and source-monitoring
accounts of accuracy and confidence. Repeating the correct-control alternative provided this
opportunity.
6 Seven participants were dropped from this analysis because they withheld no
answers.

Misinformation and resolution 29
7 One participant was dropped from this analysis because no coarse-grained answers
were chosen.
Misinformation and metacognitive monitoring 30
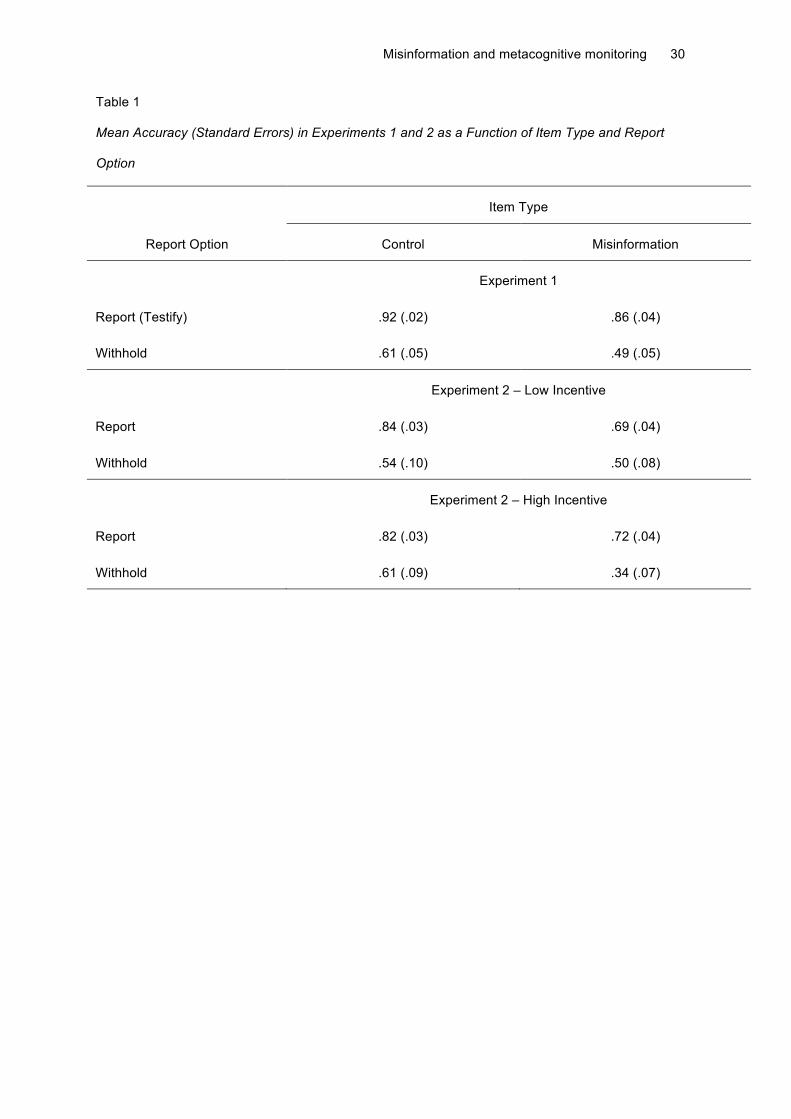
Table 1
Mean Accuracy (Standard Errors) in Experiments 1 and 2 as a Function of Item Type and Report
Option
Item Type
Report Option Control Misinformation
Experiment 1
Report (Testify) .92 (.02) .86 (.04)
Withhold .61 (.05) .49 (.05)
Experiment 2 – Low Incentive
Report .84 (.03) .69 (.04)
Withhold .54 (.10) .50 (.08)
Experiment 2 – High Incentive
Report .82 (.03) .72 (.04)
Withhold .61 (.09) .34 (.07)
Misinformation and metacognitive monitoring 31
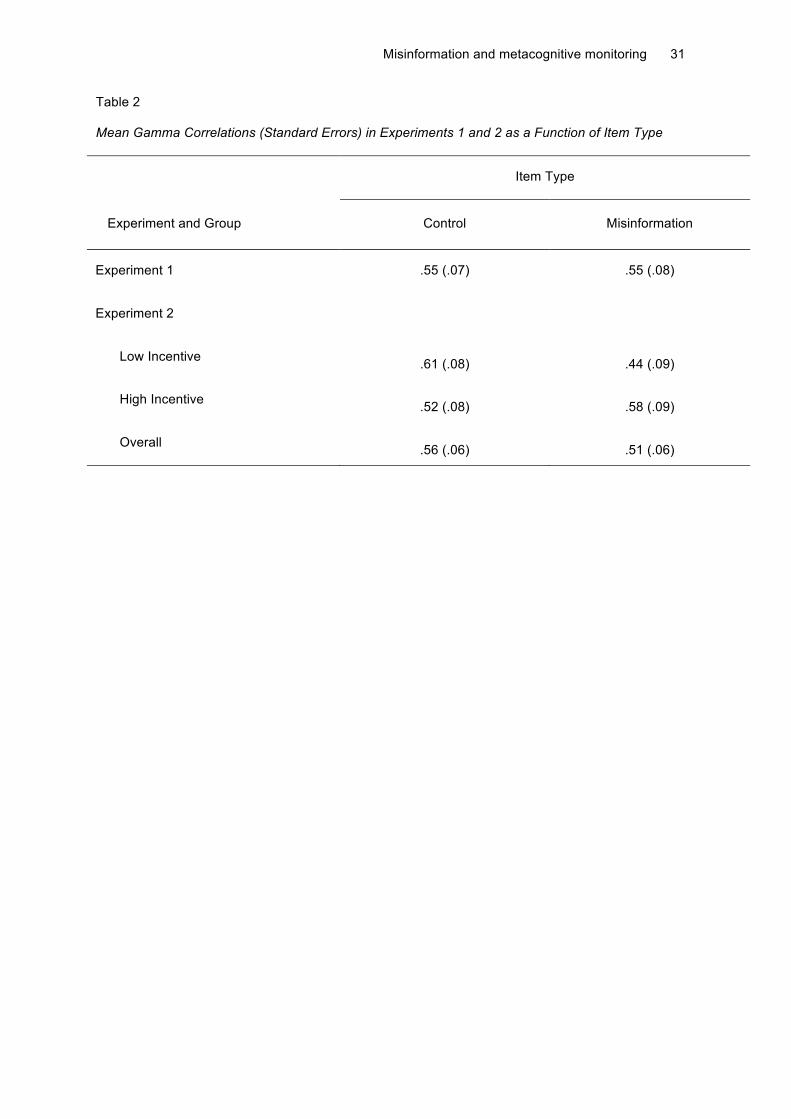
Table 2
Mean Gamma Correlations (Standard Errors) in Experiments 1 and 2 as a Function of Item Type
Item Type
Experiment and Group Control Misinformation
Experiment 1 .55 (.07) .55 (.08)
Experiment 2
Low Incentive .61 (.08) .44 (.09)
High Incentive .52 (.08) .58 (.09)
Overall .56 (.06) .51 (.06)
Misinformation and metacognitive monitoring 32
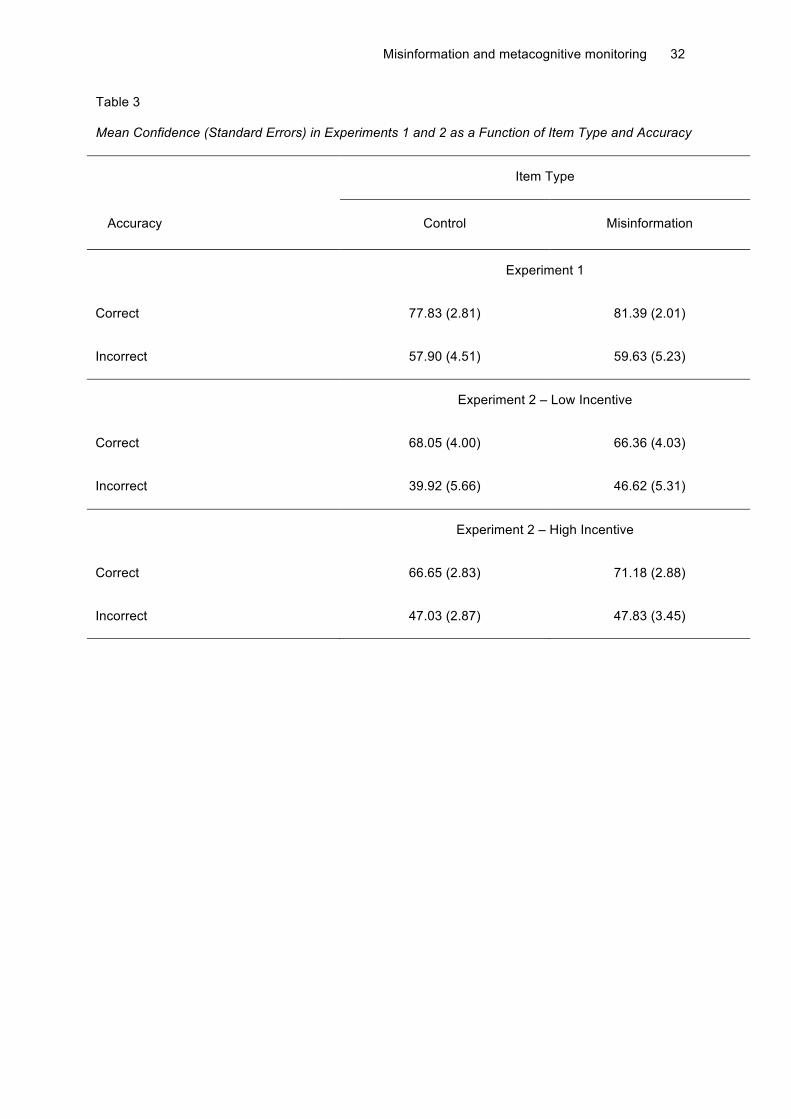
Table 3
Mean Confidence (Standard Errors) in Experiments 1 and 2 as a Function of Item Type and Accuracy
Item Type
Accuracy Control Misinformation
Experiment 1
Correct 77.83 (2.81) 81.39 (2.01)
Incorrect 57.90 (4.51) 59.63 (5.23)
Experiment 2 – Low Incentive
Correct 68.05 (4.00) 66.36 (4.03)
Incorrect 39.92 (5.66) 46.62 (5.31)
Experiment 2 – High Incentive
Correct 66.65 (2.83) 71.18 (2.88)
Incorrect 47.03 (2.87) 47.83 (3.45)
Misinformation and metacognitive monitoring 33
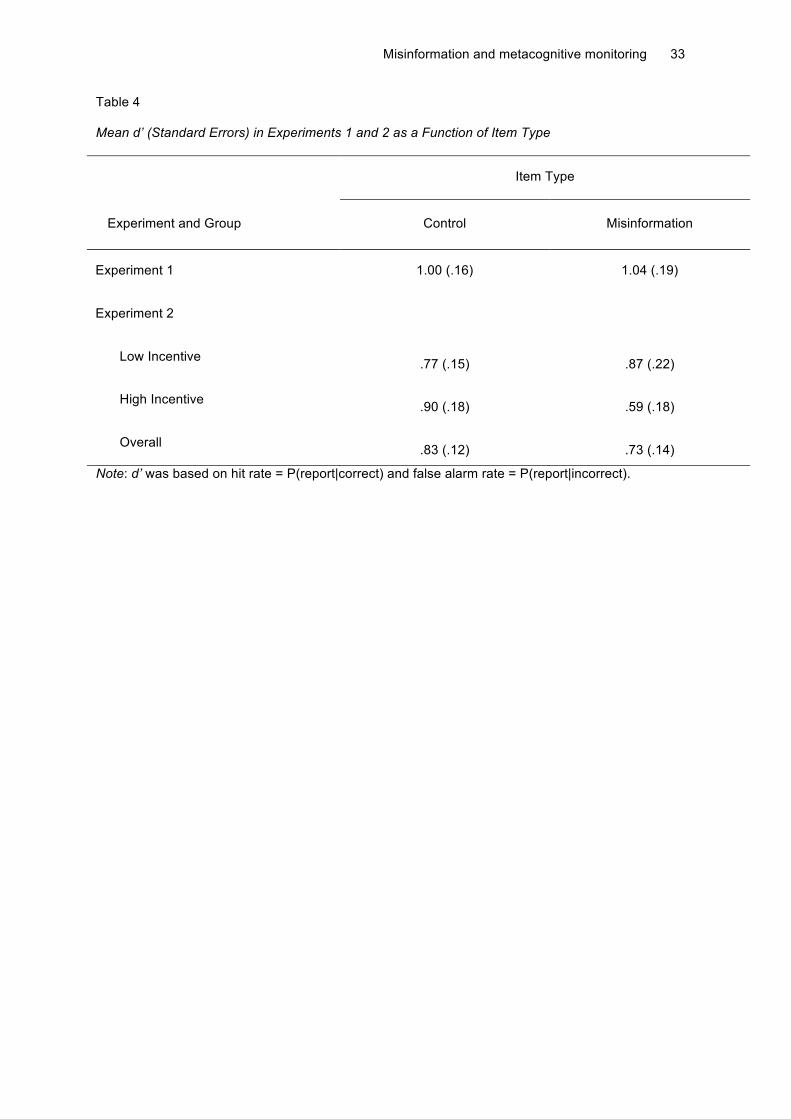
Table 4
Mean d’ (Standard Errors) in Experiments 1 and 2 as a Function of Item Type
Item Type
Experiment and Group Control Misinformation
Experiment 1 1.00 (.16) 1.04 (.19)
Experiment 2
Low Incentive .77 (.15) .87 (.22)
High Incentive .90 (.18) .59 (.18)
Overall .83 (.12) .73 (.14)
Note: d’ was based on hit rate = P(report|correct) and false alarm rate = P(report|incorrect).
Misinformation and metacognitive monitoring 34
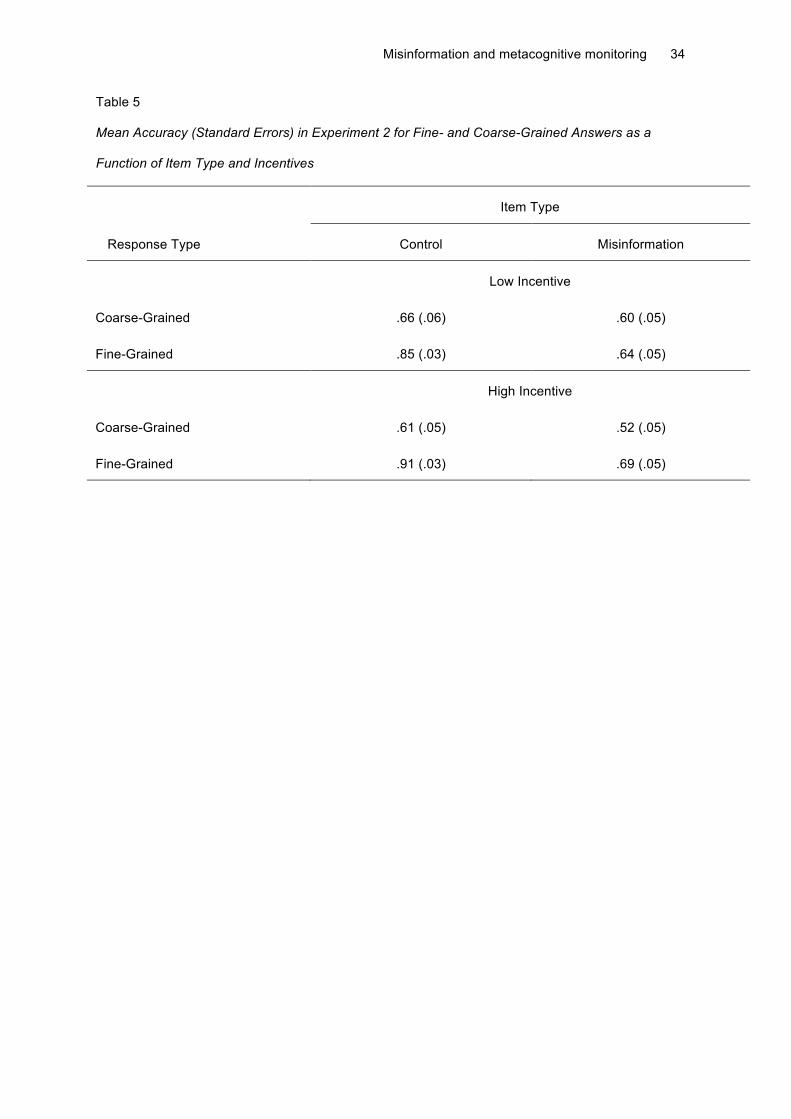
Table 5
Mean Accuracy (Standard Errors) in Experiment 2 for Fine- and Coarse-Grained Answers as a
Function of Item Type and Incentives
Item Type
Response Type Control Misinformation
Low Incentive
Coarse-Grained .66 (.06) .60 (.05)
Fine-Grained .85 (.03) .64 (.05)
High Incentive
Coarse-Grained .61 (.05) .52 (.05)
Fine-Grained .91 (.03) .69 (.05)
Misinformation and metacognitive monitoring 35
Figure Captions
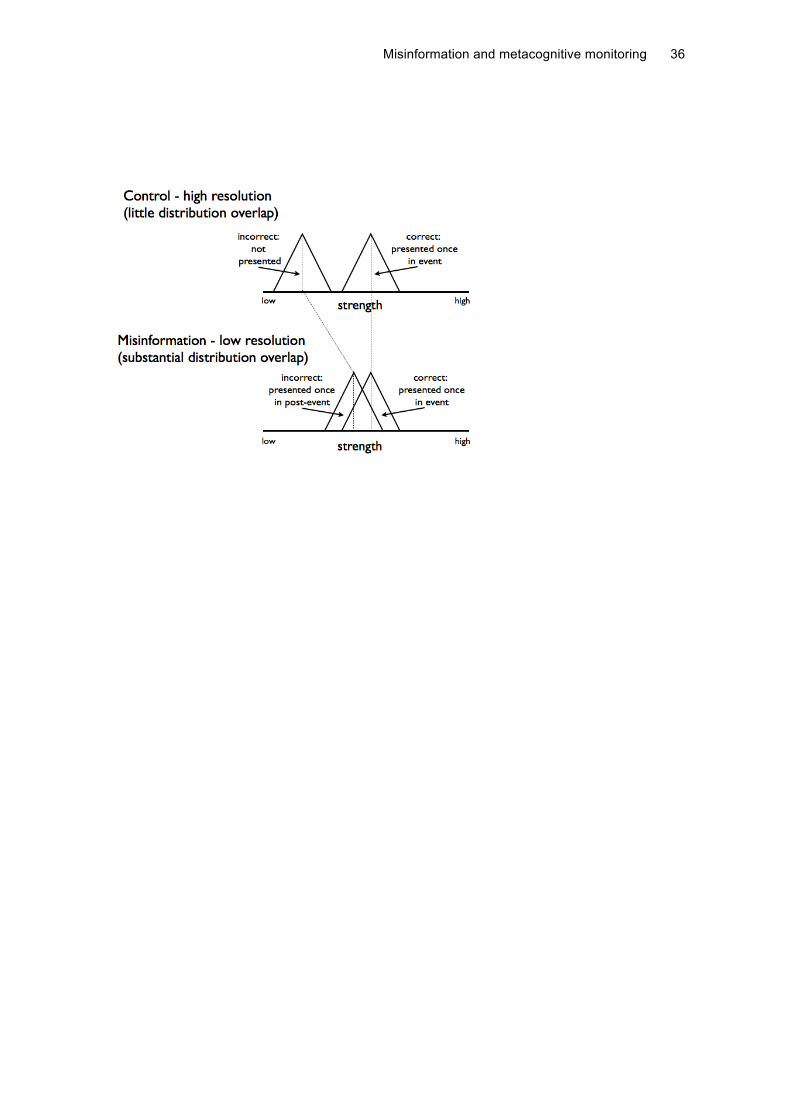
Figure 1. Resolution predictions of the trace-strength model for the typical experimental
design on the misinformation effect (e.g., Experiment 1). For control test items, the incorrect
alternatives are new and hence the distribution has lower mean strength than the distribution of
correct alternatives, which appeared in the event (slides). For misinformation test items, however,
both alternatives were presented, the correct one in the event (slides) and the incorrect one in the
post-event (narrative). The result is that, compared to the distribution of incorrect control alternatives,
the mean strength of the distribution of incorrect alternatives for misinformation items is increased.
The result is overlapping of the distributions of correct and incorrect alternatives for misinformation
test items, impairing resolution relative to control test items.
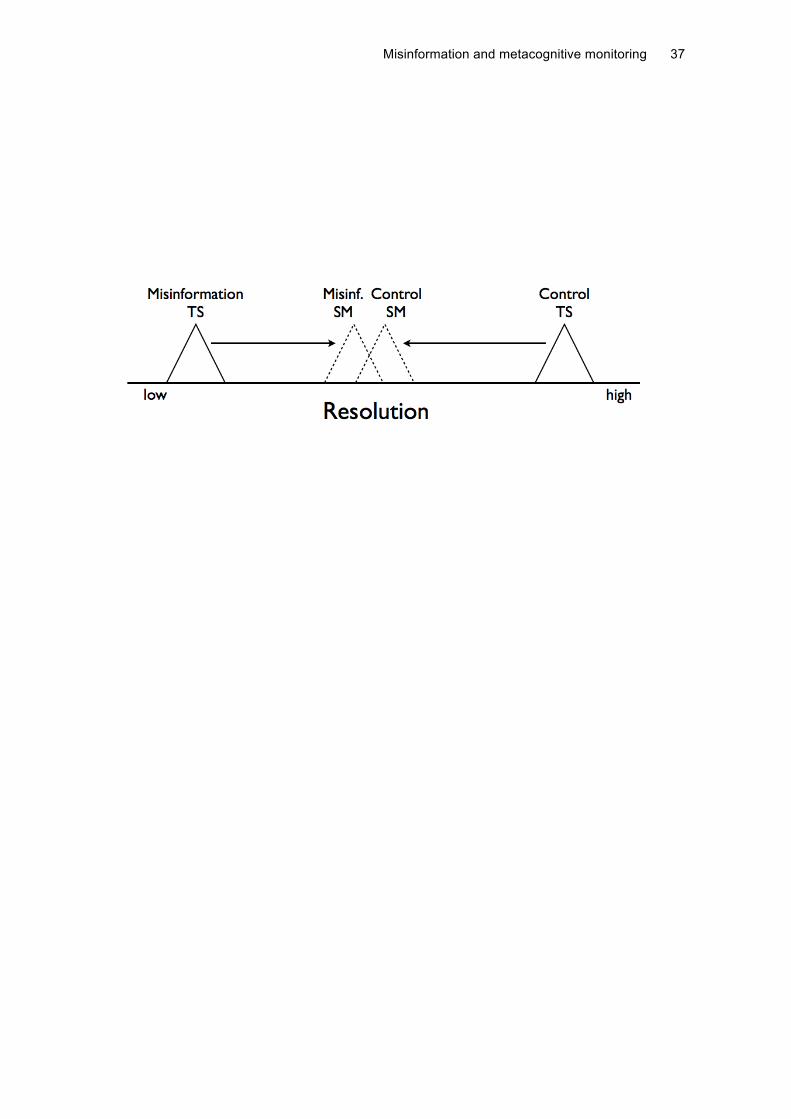
Figure 2. Hypothetical distributions of participants’ resolution scores (e.g., G, d’) for control
and misinformation test items in Experiment 2 as predicted by the trace-strength (TS) and source-
monitoring (SM) models. According to the TS model, high differential trace strength between correct
and incorrect alternatives results in high resolution (cf. Figure 1). This is the case for control items
because the correct alternative has been presented twice whereas the incorrect one is new. However,
resolution will be low for misinformation items because both the correct and incorrect alternatives
were each presented once, resulting in similar trace strength. The SM model, on the other hand,
maintains that resolution is more a function of source discrimination. The two competing sources
(event and post-event) for the twice presented, correct-control alternative could lead to source
confusion, thus impairing resolution for control items relative to the prediction of the TS model. For
misinformation items, the SM model maintains that source details can be used to discriminate
between alternatives of comparable strength, thus enhancing resolution relative to the prediction of
the TS model. The net result is that the TS model predicts a large impairment to resolution caused by
misinformation whereas the SM model predicts that misinformation will have little to no effect.
Misinformation and metacognitive monitoring 36
Misinformation and metacognitive monitoring 37