Embed Size (px)
Citation preview
0
MISCELLANEOUS :: PROPOSED DEMERGER OF THE PROPERTY BUSINESS THROUGH THE DIVIDEND IN SPECIE OF ALL THE ISSUED SHARES IN FRASERS CENTREPOINT LIMITED TO SHAREHOLDERS AND THE LISTING OF FRASERS CENTREPOINT LIMITED BY WAY OF AN INTRODUCTION
* Asterisks denote mandatory information
Name of Announcer * FRASER AND NEAVE, LIMITED
Company Registration No. 189800001R
Announcement submitted on behalf of
FRASER AND NEAVE, LIMITED
Announcement is submitted with respect to *
FRASER AND NEAVE, LIMITED
Announcement is submitted by * Anthony Cheong Fook Seng
Designation * Group Company Secretary
Date & Time of Broadcast 27-Aug-2013 19:39:52
Announcement No. 00168
>> ANNOUNCEMENT DETAILS
The details of the announcement start here ...
Announcement Title * PROPOSED DEMERGER OF THE PROPERTY BUSINESS THROUGH THE DIVIDEND IN SPECIE OF ALL THE ISSUED SHARES IN FRASERS CENTREPOINT LIMITED TO SHAREHOLDERS AND THE LISTING OF FRASERS CENTREPOINT LIMITED BY WAY OF AN INTRODUCTION
Description Please see attached.
Attachments FN_Cap_Red_DIS_Announcement-270813.pdf
Press-Release-27.8.13.pdf
Investor-Presentation-DIS-Overview.pdf
Investor-Presentation-FB.pdf
Investor-Presentation-FCL.pdf
Total size =5718K (2048K size limit recommended)
1
FRASER AND NEAVE, LIMITED
(Incorporated in the Republic of Singapore)
(Company Registration No: 189800001R)
ANNOUNCEMENT
PROPOSED DEMERGER OF THE PROPERTY BUSINESS THROUGH THE DIVIDEND IN SPECIE
OF ALL THE ISSUED SHARES IN FRASERS CENTREPOINT LIMITED TO SHAREHOLDERS AND
THE LISTING OF FRASERS CENTREPOINT LIMITED BY WAY OF AN INTRODUCTION
1. INTRODUCTION
1.1 Background. The Board of Directors (“Board”) of Fraser and Neave, Limited (the “Company”
or “F&N”) is pleased to announce that the Company proposes to demerge its property
business by:
1.1.1 effecting a distribution in specie (the “FCL Distribution”) of all the ordinary shares in
the issued share capital of Frasers Centrepoint Limited (the “FCL Shares”), a wholly-
owned subsidiary of the Company, to the shareholders of the Company
(“Shareholders”), on the basis of two FCL Shares for each ordinary share in the
issued share capital of the Company (the “Shares”) held by Shareholders or on their
behalf as at a books closure date to be determined by the Board (the “Books
Closure Date”); and
1.1.2 listing the FCL Shares on the Main Board of the Singapore Exchange Securities
Trading Limited (“SGX-ST”) by way of an introduction (the “Proposed Listing”). The
FCL Distribution is subject to the approval of Shareholders and such other approvals
as set out in paragraph 8 below.
1.2 No Payment Required from Shareholders. No payment will be required from Shareholders
for the FCL Shares to be received from the FCL Distribution. The FCL Shares will be
distributed free of encumbrances and together with all rights attaching thereto on and from the
date the FCL Distribution is effected.
1.3 Application to SGX-ST. An application to the SGX-ST will be made for the FCL Shares to
be listed on the Main Board of the SGX-ST, which will enable the FCL Shares to be traded
on the SGX-ST after the completion of the FCL Distribution.
2
2. INFORMATION ON FCL
2.1 FCL. Frasers Centrepoint Limited (“FCL”) is headquartered in Singapore and its principal
activities are property development, and investment and management of commercial property,
serviced residences and property trusts. FCL and its subsidiaries (the “FCL Group”) has a
property portfolio which comprises properties located in Singapore and overseas, ranging
from residential and commercial developments to shopping malls, serviced residences and
office and business space properties, as represented by the following four lead
brands/divisions - Frasers Centrepoint Homes (for Singapore residential development
properties), Frasers Property (for overseas development properties), Frasers Centrepoint
Commercial (for shopping malls, office and business space properties) and Frasers
Hospitality (for serviced residences).
Frasers Centrepoint Homes focuses on residential property development in Singapore. As at
30 June 2013, it has built over 11,000 homes in Singapore.
Frasers Property is the international arm of the FCL Group which develops residential and/or
mixed-use property projects outside of Singapore, including in China, Australia, New Zealand,
Thailand, and the United Kingdom. China and Australia are the two key overseas property
markets for development properties for the FCL Group.
Frasers Centrepoint Commercial manages FCL’s shopping malls in Singapore under Frasers
Centrepoint Malls. As at 30 June 2013, it manages five shopping malls in Singapore through
Frasers Centrepoint Trust (“FCT”), an entity which is listed on the SGX-ST with a market
capitalisation of $1,459 million as at 26 August 2013. In addition, FCL also has interests in
and/or manages seven other shopping malls in Singapore, one shopping mall in China and
currently has interests in one shopping mall under development in Australia.
Frasers Centrepoint Commercial also manages office and business space properties. As at
30 June 2013, FCL manages five commercial and office properties in Singapore and Australia
through Frasers Commercial Trust (“FCOT”), an entity which is listed on the SGX-ST with a
market capitalisation of $808 million as at 26 August 2013. In addition, the FCL Group also
has interests in six office and business space properties located in Singapore, China and
Vietnam. As at 30 June 2013, FCL has developed six1 commercial properties.
Frasers Hospitality has interests in and/or manages serviced residences under the branded
lifestyle offerings of Fraser Suites, Fraser Place, Fraser Residence and Modena and Capri by
Fraser, offering, as at 30 June 2013, more than 8,000 apartments in over 30 key gateway
cities. Based on management contracts secured as at 30 June 2013, more than 6,400
apartments will be added to Frasers Hospitality’s portfolio of serviced residences over the
next three years.
2.2 Further Information. Certain information pertaining to the financial and operational
performance of FCL’s businesses can be found in paragraph 4, and Appendices 3 and 4 of
this Announcement. Detailed information on FCL, including its portfolio of assets and
business immediately prior to the Proposed Listing, risk factors and pro forma financial
statements will also be set out in the introductory document to be issued in connection with
the Proposed Listing (the “Introductory Document”), which will be despatched to
Shareholders in due course.
1 Including properties that were jointly developed with joint venture partners.
3
3. RATIONALE FOR THE FCL DISTRIBUTION
3.1 The FCL Distribution will enable the Company to demerge its property business from
its food and beverage and printing and publishing businesses. The Board believes that
the FCL Distribution and the Proposed Listing will benefit the Company, its Shareholders and
FCL as follows:
3.1.1 Enable the Company to focus on its food and beverage business.
3.1.2 Unlock shareholder value and create investment flexibility for Shareholders.
3.1.3 Allow Shareholders to participate directly in FCL.
3.1.4 Establish FCL’s financial independence and provide it with direct access to capital
markets.
3.1.5 Enhance the public image of FCL.
3.2 Enable the Company to Focus on its Food and Beverage Business. The FCL Distribution
will focus the Company as a principally food and beverage business, which would appeal to
investors specifically seeking food and beverage exposure and could contribute to a market
re-rating of the share price of the Company.
The FCL Distribution allows the Company to focus greater management attention and
resources on growth opportunities for the food and beverage business, by pursuing strategies
best suited to its markets and goals, including mergers and/or acquisitions. Investors may
prefer the cash flow generated from the food and beverage business to be used for growing
the said business and/or distributed to Shareholders.
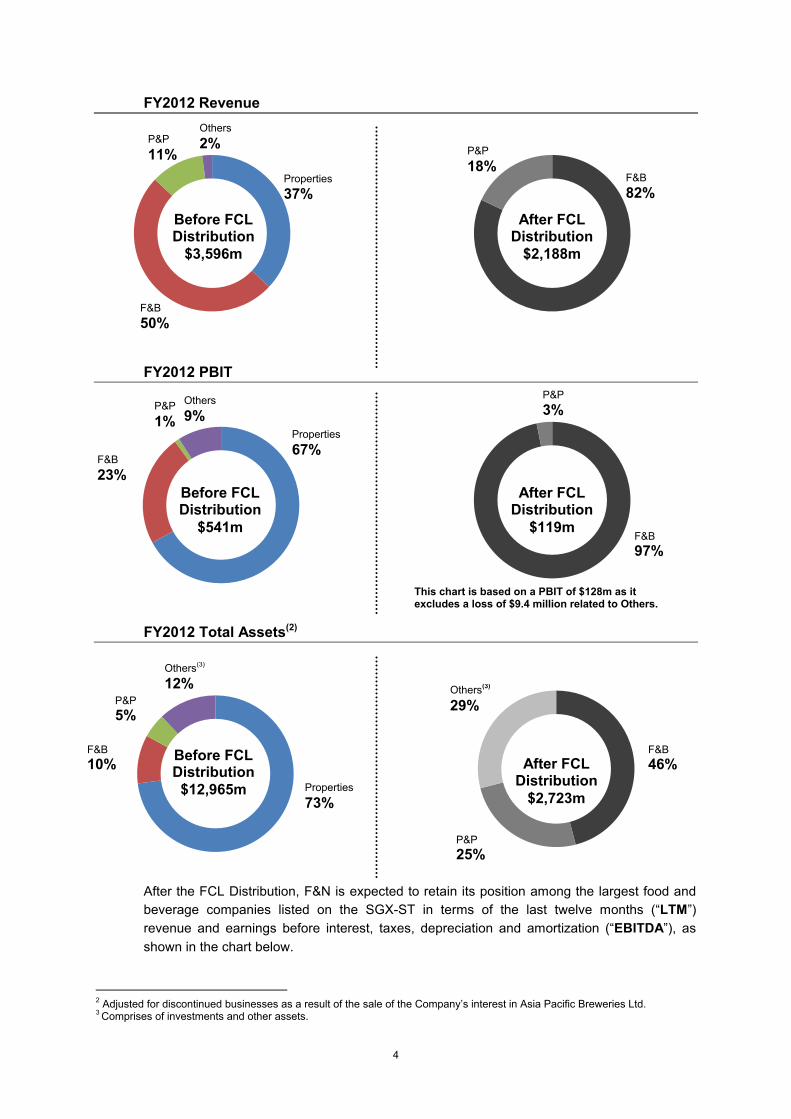
In general, food and beverage and printing and publishing businesses are typically valued by
the market based on cash flow and earnings, whereas property investments and development
land banks are typically valued based on revalued net asset value. By separating the property
business from the food and beverage and printing and publishing businesses, the de-merger
enables the market to accord an appropriate value to each of the principal businesses
currently held within the Company and its subsidiaries (“F&N Group”).
The pie charts below show that for the financial year ended 30 September 2012 (“FY2012”),
the F&N Group derives 50 per cent. of its revenue and 23 per cent. of its profit before interest
and tax (“PBIT”) from the food and beverage business. Assuming that the FCL Distribution
had occurred on 1 October 2011, these percentages would have increased to 82 per cent.
and 97 per cent., respectively. As at 30 September 2012, the food and beverage business
accounted for 10 per cent. of F&N Group’s total assets. Assuming that the FCL Distribution
had occurred on 1 October 2011, this percentage would have increased to 46 per cent.
4
FY2012 Revenue
FY2012 PBIT
FY2012 Total Assets(2)
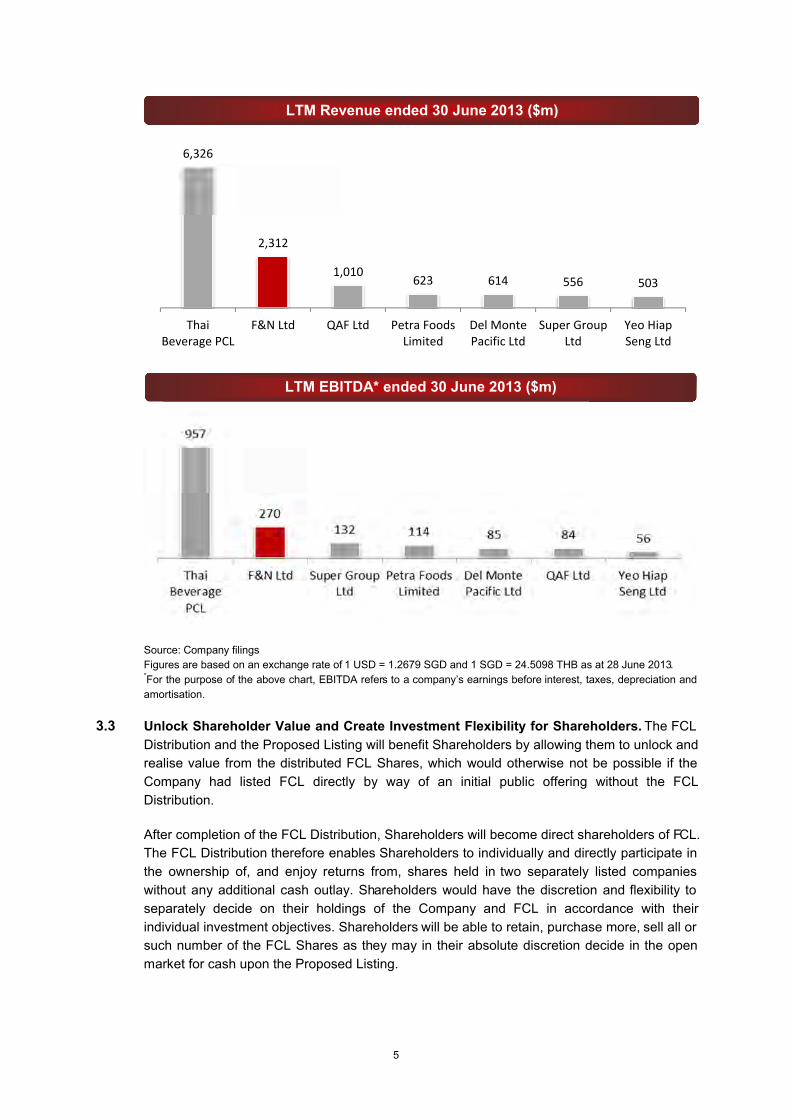
After the FCL Distribution, F&N is expected to retain its position among the largest food and
beverage companies listed on the SGX-ST in terms of the last twelve months (“LTM”)
revenue and earnings before interest, taxes, depreciation and amortization (“EBITDA”), as
shown in the chart below.
2 Adjusted for discontinued businesses as a result of the sale of the Company’s interest in Asia Pacific Breweries Ltd.3 Comprises of investments and other assets.
P&P
18%F&B
82%
After FCL Distribution
$2,188m
Before FCL Distribution
$3,596m
Properties
37%
F&B
50%
P&P
11%
Others
2%
Properties
67%F&B
23%
P&P
1%
Others
9%
Before FCL Distribution
$541mF&B
97%
After FCL Distribution
$119m
P&P
5%
F&B
10%
Properties
73%
Before FCL Distribution$12,965m
After FCL Distribution
$2,723m
F&B
46%
P&P
3%
Others(3)
12% Others(3)
29%
This chart is based on a PBIT of $128m as it excludes a loss of $9.4 million related to Others.
P&P
25%
5
Source: Company filings
Figures are based on an exchange rate of 1 USD = 1.2679 SGD and 1 SGD = 24.5098 THB as at 28 June 2013.*For the purpose of the above chart, EBITDA refers to a company’s earnings before interest, taxes, depreciation and
amortisation.
3.3 Unlock Shareholder Value and Create Investment Flexibility for Shareholders. The FCL
Distribution and the Proposed Listing will benefit Shareholders by allowing them to unlock and
realise value from the distributed FCL Shares, which would otherwise not be possible if the
Company had listed FCL directly by way of an initial public offering without the FCL
Distribution.
After completion of the FCL Distribution, Shareholders will become direct shareholders of FCL.
The FCL Distribution therefore enables Shareholders to individually and directly participate in
the ownership of, and enjoy returns from, shares held in two separately listed companies
without any additional cash outlay. Shareholders would have the discretion and flexibility to
separately decide on their holdings of the Company and FCL in accordance with their
individual investment objectives. Shareholders will be able to retain, purchase more, sell all or
such number of the FCL Shares as they may in their absolute discretion decide in the open
market for cash upon the Proposed Listing.
LTM Revenue ended 30 June 2013 ($m)
6,326
2,312
1,010623 614 556 503
ThaiBeverage PCL
F&N Ltd QAF Ltd Petra FoodsLimited
Del MontePacific Ltd
Super GroupLtd
Yeo HiapSeng Ltd
LTM EBITDA* ended 30 June 2013 ($m)
6
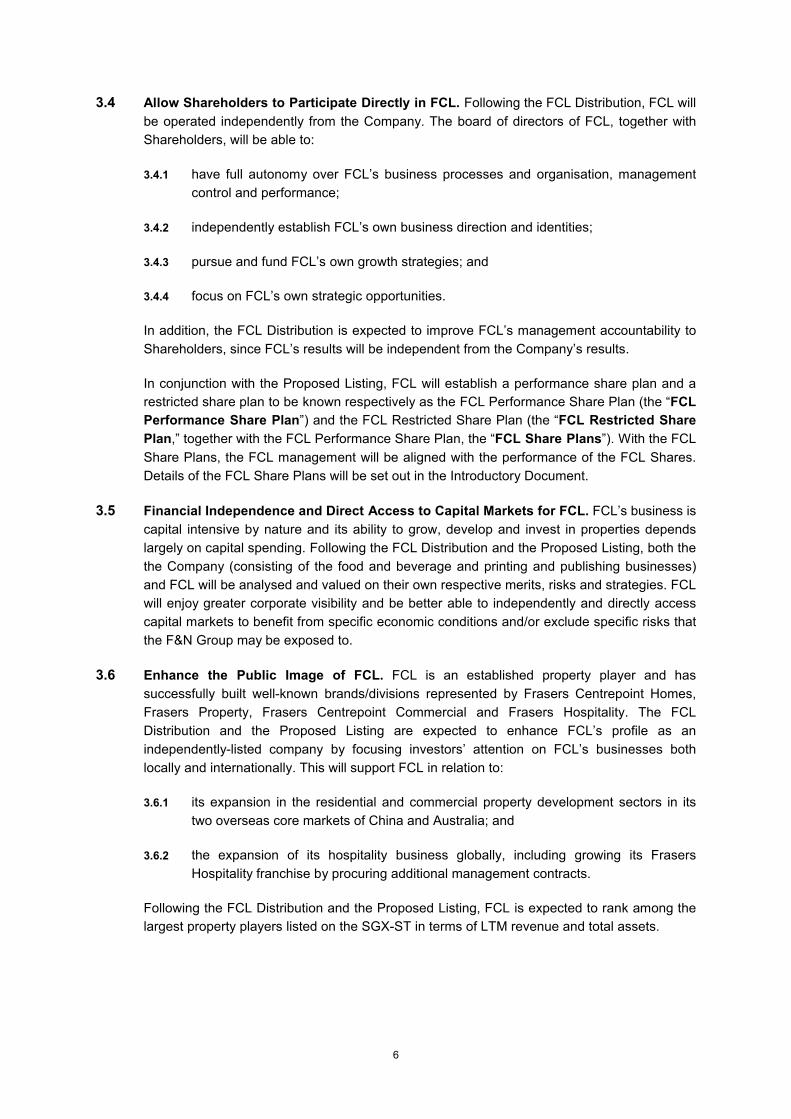
3.4 Allow Shareholders to Participate Directly in FCL. Following the FCL Distribution, FCL will
be operated independently from the Company. The board of directors of FCL, together with
Shareholders, will be able to:
3.4.1 have full autonomy over FCL’s business processes and organisation, management
control and performance;
3.4.2 independently establish FCL’s own business direction and identities;
3.4.3 pursue and fund FCL’s own growth strategies; and
3.4.4 focus on FCL’s own strategic opportunities.
In addition, the FCL Distribution is expected to improve FCL’s management accountability to
Shareholders, since FCL’s results will be independent from the Company’s results.
In conjunction with the Proposed Listing, FCL will establish a performance share plan and a
restricted share plan to be known respectively as the FCL Performance Share Plan (the “FCL
Performance Share Plan”) and the FCL Restricted Share Plan (the “FCL Restricted Share
Plan,” together with the FCL Performance Share Plan, the “FCL Share Plans”). With the FCL
Share Plans, the FCL management will be aligned with the performance of the FCL Shares.
Details of the FCL Share Plans will be set out in the Introductory Document.
3.5 Financial Independence and Direct Access to Capital Markets for FCL. FCL’s business is
capital intensive by nature and its ability to grow, develop and invest in properties depends
largely on capital spending. Following the FCL Distribution and the Proposed Listing, both the
the Company (consisting of the food and beverage and printing and publishing businesses)
and FCL will be analysed and valued on their own respective merits, risks and strategies. FCL
will enjoy greater corporate visibility and be better able to independently and directly access
capital markets to benefit from specific economic conditions and/or exclude specific risks that
the F&N Group may be exposed to.
3.6 Enhance the Public Image of FCL. FCL is an established property player and has
successfully built well-known brands/divisions represented by Frasers Centrepoint Homes,
Frasers Property, Frasers Centrepoint Commercial and Frasers Hospitality. The FCL
Distribution and the Proposed Listing are expected to enhance FCL’s profile as an
independently-listed company by focusing investors’ attention on FCL’s businesses both
locally and internationally. This will support FCL in relation to:
3.6.1 its expansion in the residential and commercial property development sectors in its
two overseas core markets of China and Australia; and
3.6.2 the expansion of its hospitality business globally, including growing its Frasers
Hospitality franchise by procuring additional management contracts.
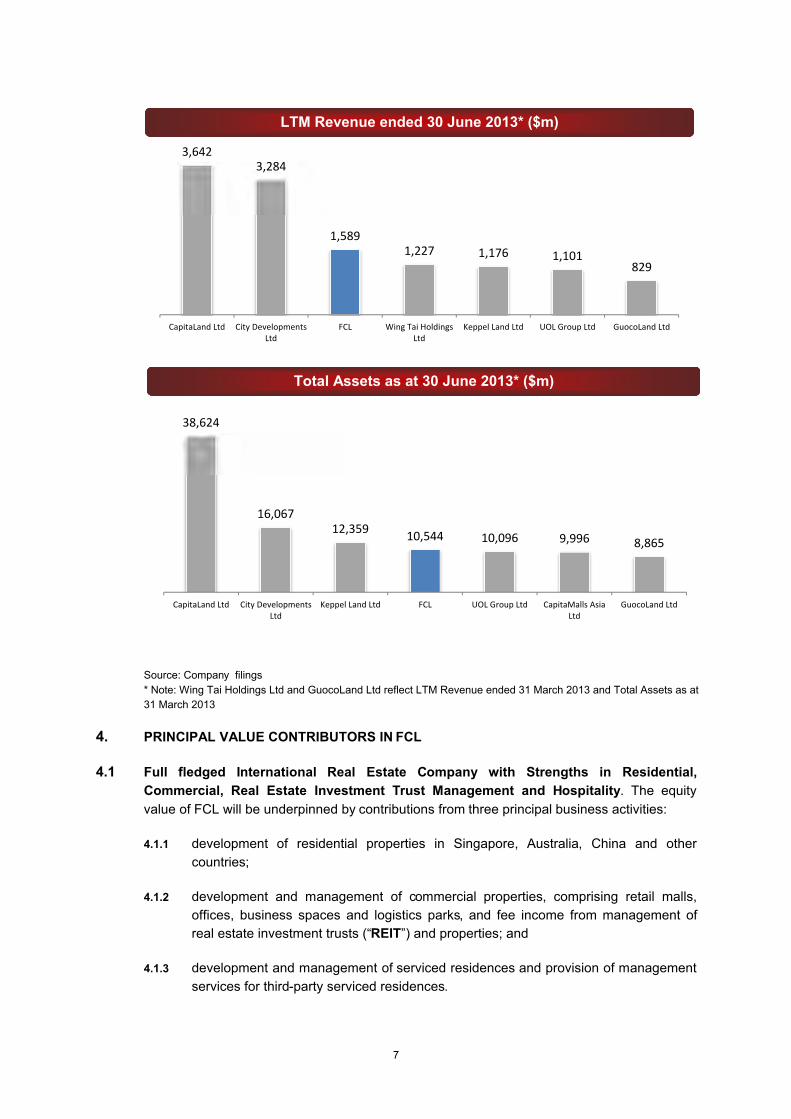
Following the FCL Distribution and the Proposed Listing, FCL is expected to rank among the
largest property players listed on the SGX-ST in terms of LTM revenue and total assets.
7
Source: Company filings
* Note: Wing Tai Holdings Ltd and GuocoLand Ltd reflect LTM Revenue ended 31 March 2013 and Total Assets as at
31 March 2013
4. PRINCIPAL VALUE CONTRIBUTORS IN FCL
4.1 Full fledged International Real Estate Company with Strengths in Residential,
Commercial, Real Estate Investment Trust Management and Hospitality. The equity
value of FCL will be underpinned by contributions from three principal business activities:
4.1.1 development of residential properties in Singapore, Australia, China and other
countries;
4.1.2 development and management of commercial properties, comprising retail malls,
offices, business spaces and logistics parks, and fee income from management of
real estate investment trusts (“REIT”) and properties; and
4.1.3 development and management of serviced residences and provision of management
services for third-party serviced residences.
Total Assets as at 30 June 2013* ($m)
LTM Revenue ended 30 June 2013* ($m)
3,6423,284
1,5891,227 1,176 1,101
829
CapitaLand Ltd City DevelopmentsLtd
FCL Wing Tai HoldingsLtd
Keppel Land Ltd UOL Group Ltd GuocoLand Ltd
38,624
16,06712,359
10,544 10,096 9,996 8,865
CapitaLand Ltd City DevelopmentsLtd
Keppel Land Ltd FCL UOL Group Ltd CapitaMalls AsiaLtd
GuocoLand Ltd
8
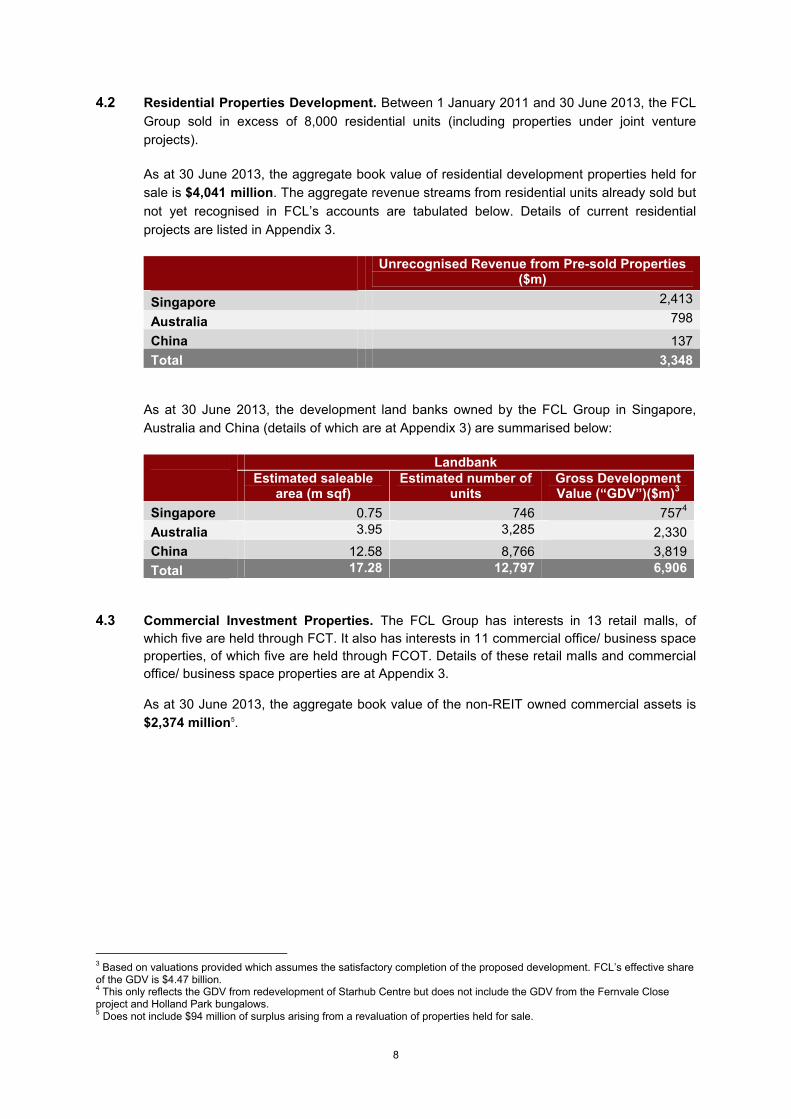
4.2 Residential Properties Development. Between 1 January 2011 and 30 June 2013, the FCL
Group sold in excess of 8,000 residential units (including properties under joint venture
projects).
As at 30 June 2013, the aggregate book value of residential development properties held for
sale is $4,041 million. The aggregate revenue streams from residential units already sold but
not yet recognised in FCL’s accounts are tabulated below. Details of current residential
projects are listed in Appendix 3.
Unrecognised Revenue from Pre-sold Properties($m)
Singapore 2,413
Australia 798
China 137
Total 3,348
As at 30 June 2013, the development land banks owned by the FCL Group in Singapore,
Australia and China (details of which are at Appendix 3) are summarised below:
LandbankEstimated saleable
area (m sqf)Estimated number of
unitsGross Development Value (“GDV”)($m)
3
Singapore 0.75 746 7574
Australia 3.95 3,285 2,330
China 12.58 8,766 3,819
Total 17.28 12,797 6,906
4.3 Commercial Investment Properties. The FCL Group has interests in 13 retail malls, of
which five are held through FCT. It also has interests in 11 commercial office/ business space
properties, of which five are held through FCOT. Details of these retail malls and commercial
office/ business space properties are at Appendix 3.
As at 30 June 2013, the aggregate book value of the non-REIT owned commercial assets is
$2,374 million5.
3 Based on valuations provided which assumes the satisfactory completion of the proposed development. FCL’s effective share of the GDV is $4.47 billion.4 This only reflects the GDV from redevelopment of Starhub Centre but does not include the GDV from the Fernvale Close project and Holland Park bungalows.5 Does not include $94 million of surplus arising from a revaluation of properties held for sale.
9
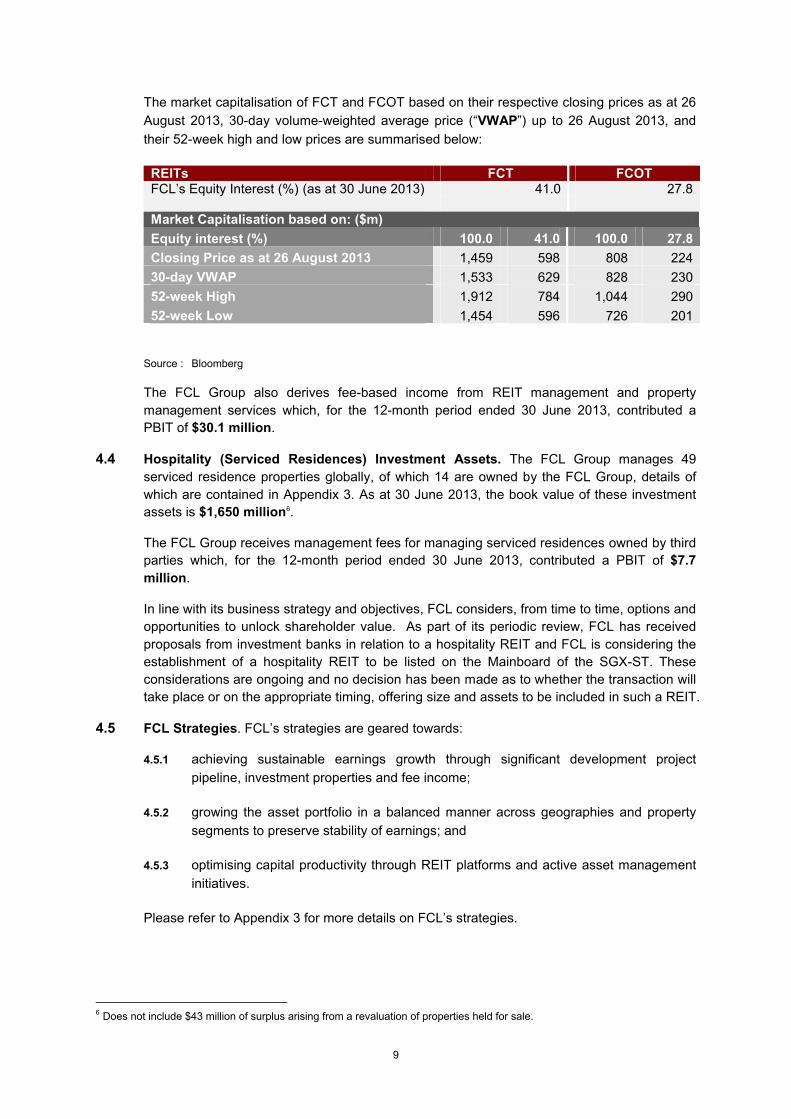
The market capitalisation of FCT and FCOT based on their respective closing prices as at 26
August 2013, 30-day volume-weighted average price (“VWAP”) up to 26 August 2013, and
their 52-week high and low prices are summarised below:
REITs FCT FCOTFCL’s Equity Interest (%) (as at 30 June 2013) 41.0 27.8
Market Capitalisation based on: ($m)
Equity interest (%) 100.0 41.0 100.0 27.8
Closing Price as at 26 August 2013 1,459 598 808 224
30-day VWAP 1,533 629 828 230
52-week High 1,912 784 1,044 290
52-week Low 1,454 596 726 201
Source : Bloomberg
The FCL Group also derives fee-based income from REIT management and property
management services which, for the 12-month period ended 30 June 2013, contributed a
PBIT of $30.1 million.
4.4 Hospitality (Serviced Residences) Investment Assets. The FCL Group manages 49
serviced residence properties globally, of which 14 are owned by the FCL Group, details of
which are contained in Appendix 3. As at 30 June 2013, the book value of these investment
assets is $1,650 million6.
The FCL Group receives management fees for managing serviced residences owned by third
parties which, for the 12-month period ended 30 June 2013, contributed a PBIT of $7.7
million.
In line with its business strategy and objectives, FCL considers, from time to time, options and
opportunities to unlock shareholder value. As part of its periodic review, FCL has received
proposals from investment banks in relation to a hospitality REIT and FCL is considering the
establishment of a hospitality REIT to be listed on the Mainboard of the SGX-ST. These
considerations are ongoing and no decision has been made as to whether the transaction will
take place or on the appropriate timing, offering size and assets to be included in such a REIT.
4.5 FCL Strategies. FCL’s strategies are geared towards:
4.5.1 achieving sustainable earnings growth through significant development project
pipeline, investment properties and fee income;
4.5.2 growing the asset portfolio in a balanced manner across geographies and property
segments to preserve stability of earnings; and
4.5.3 optimising capital productivity through REIT platforms and active asset management
initiatives.
Please refer to Appendix 3 for more details on FCL’s strategies.
6 Does not include $43 million of surplus arising from a revaluation of properties held for sale.
10
5. PRINCIPAL VALUE CONTRIBUTORS IN F&N POST THE FCL DISTRIBUTION
After the FCL Distribution, F&N will continue to be engaged in two principal core businesses.
5.1 Food and Beverage Business Division (the “F&B Division”). The F&B Division produces,
markets and sells beer and non-beer beverages and products (the latter including soft drinks,
dairy products and ice cream). The F&B Division consists principally of the following:
5.1.1 55.9 per cent. equity interest (as at 30 June 2013) in Fraser & Neave Holdings Bhd
(“F&NHB”) which is listed on Bursa Malaysia. F&NHB engages primarily in the
manufacture, distribution, marketing and sale of soft drinks and dairy products in
Malaysia and Thailand; and
5.1.2 privately-held subsidiaries of F&N (“Unlisted F&B”), including F&N’s soft drinks and
dairy businesses in Singapore as well as the ice cream business in Singapore,
Malaysia and Thailand. Unlisted F&B also includes privately-held Myanmar Brewery
Limited, an entity in which F&N holds a 55 per cent. equity interest, which
manufactures leading beer brands in Myanmar.
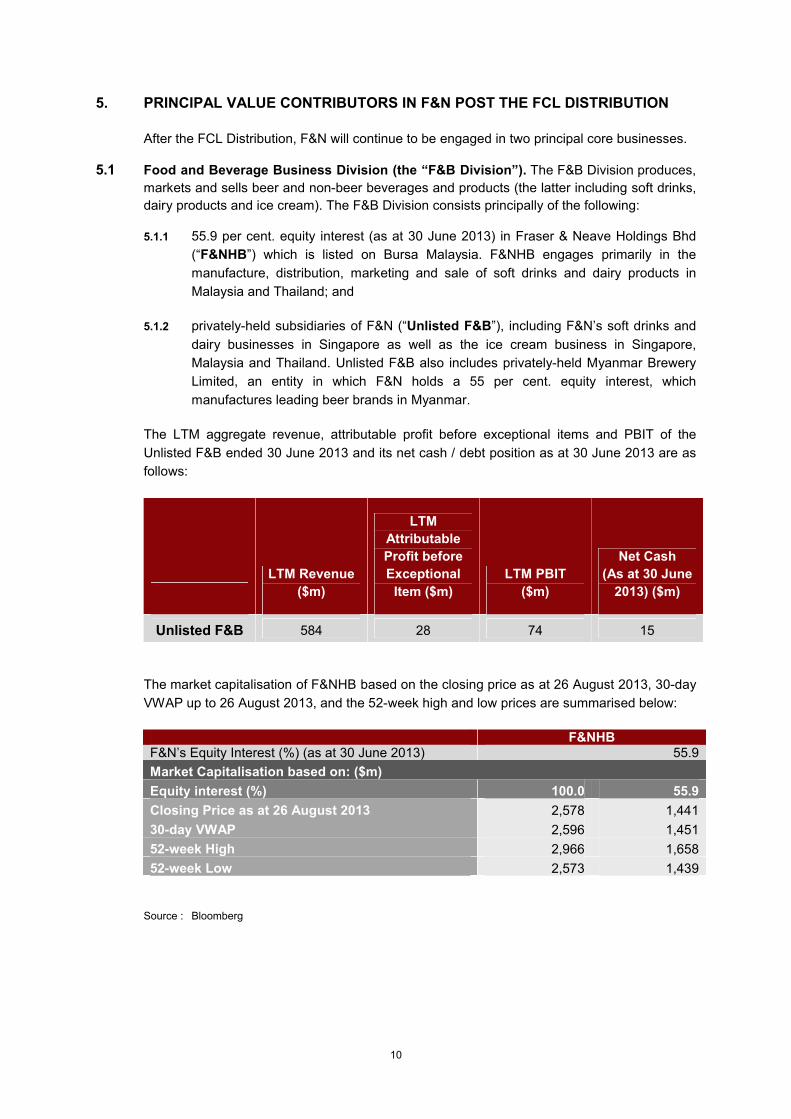
The LTM aggregate revenue, attributable profit before exceptional items and PBIT of the
Unlisted F&B ended 30 June 2013 and its net cash / debt position as at 30 June 2013 are as
follows:
LTM Revenue
($m)
LTM
Attributable
Profit before
Exceptional
Item ($m)
LTM PBIT
($m)
Net Cash
(As at 30 June
2013) ($m)
Unlisted F&B 584 28 74 15
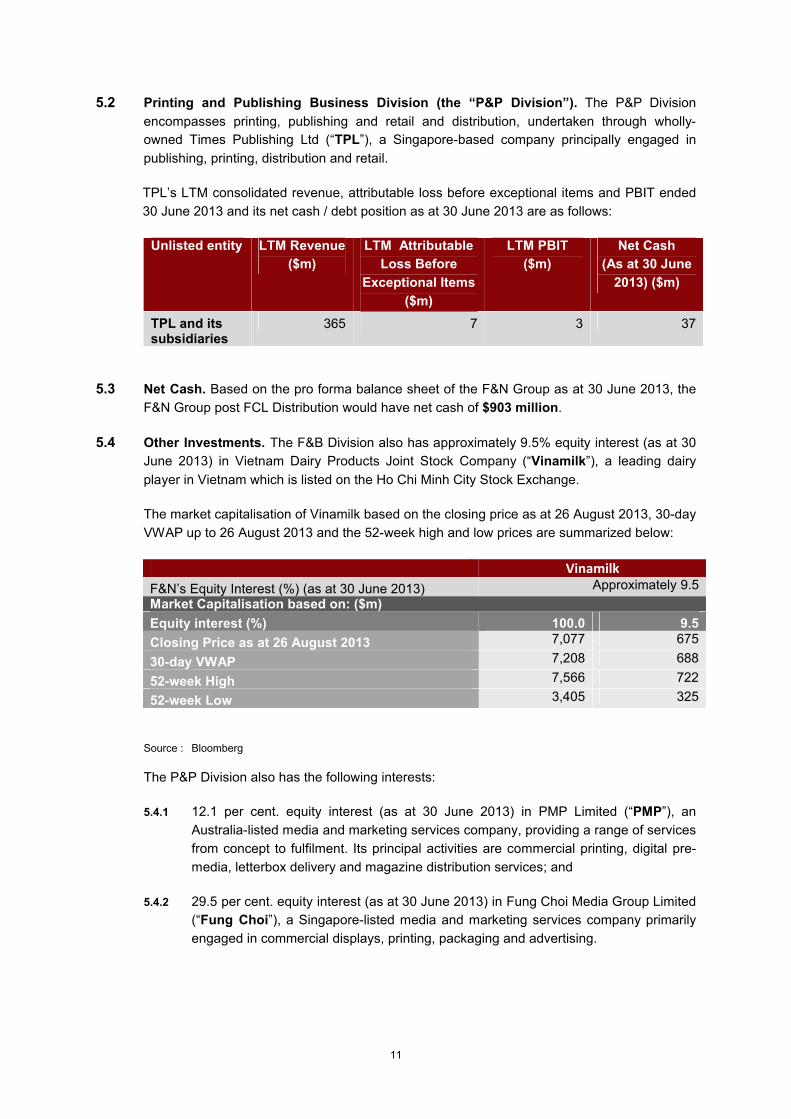
The market capitalisation of F&NHB based on the closing price as at 26 August 2013, 30-day
VWAP up to 26 August 2013, and the 52-week high and low prices are summarised below:
F&NHBF&N’s Equity Interest (%) (as at 30 June 2013) 55.9
Market Capitalisation based on: ($m)
Equity interest (%) 100.0 55.9
Closing Price as at 26 August 2013 2,578 1,441
30-day VWAP 2,596 1,451
52-week High 2,966 1,658
52-week Low 2,573 1,439
Source : Bloomberg
11
5.2 Printing and Publishing Business Division (the “P&P Division”). The P&P Division
encompasses printing, publishing and retail and distribution, undertaken through wholly-
owned Times Publishing Ltd (“TPL”), a Singapore-based company principally engaged in
publishing, printing, distribution and retail.
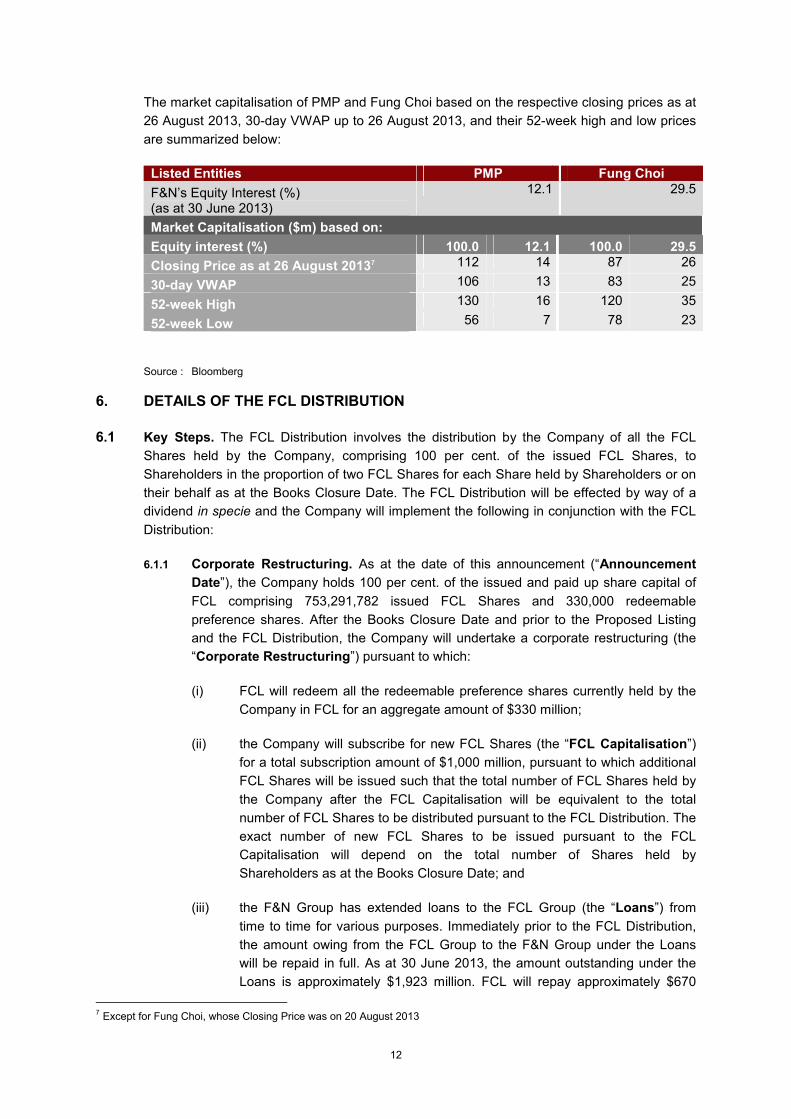
TPL’s LTM consolidated revenue, attributable loss before exceptional items and PBIT ended
30 June 2013 and its net cash / debt position as at 30 June 2013 are as follows:
Unlisted entity LTM Revenue
($m)
LTM Attributable
Loss Before
Exceptional Items
($m)
LTM PBIT
($m)
Net Cash
(As at 30 June
2013) ($m)
TPL and its subsidiaries
365 7 3 37
5.3 Net Cash. Based on the pro forma balance sheet of the F&N Group as at 30 June 2013, the
F&N Group post FCL Distribution would have net cash of $903 million.
5.4 Other Investments. The F&B Division also has approximately 9.5% equity interest (as at 30
June 2013) in Vietnam Dairy Products Joint Stock Company (“Vinamilk”), a leading dairy
player in Vietnam which is listed on the Ho Chi Minh City Stock Exchange.
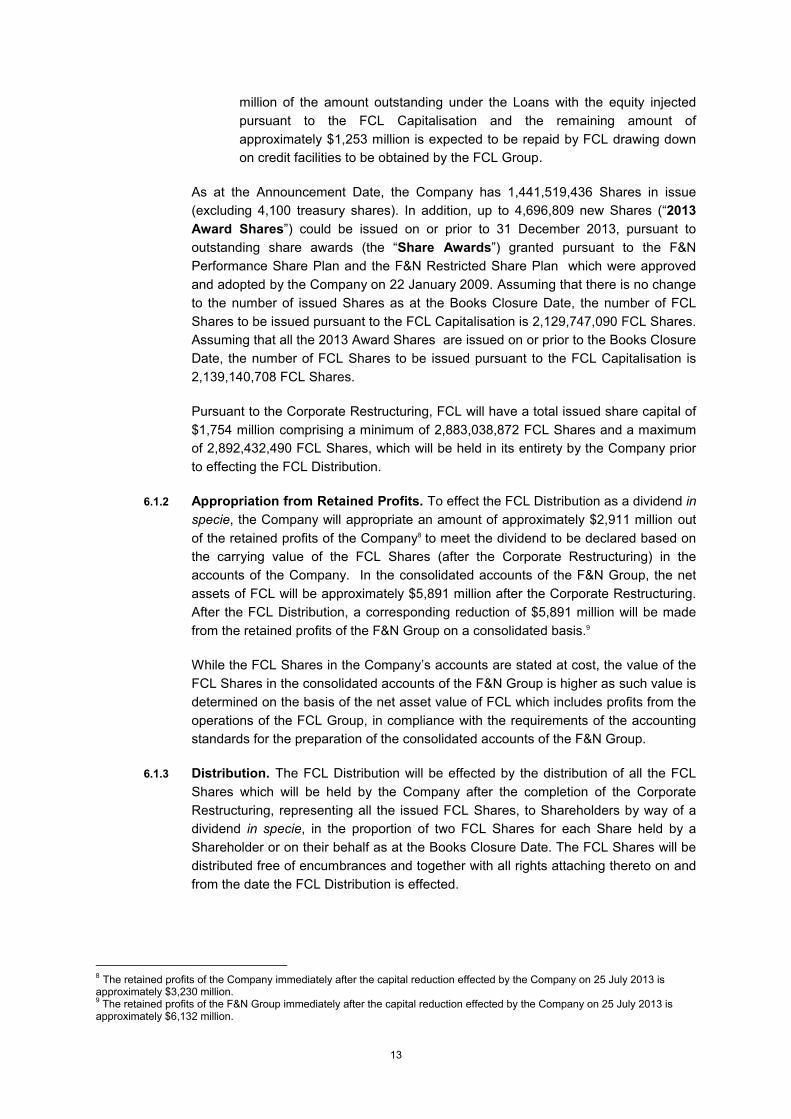
The market capitalisation of Vinamilk based on the closing price as at 26 August 2013, 30-day
VWAP up to 26 August 2013 and the 52-week high and low prices are summarized below:
Vinamilk
F&N’s Equity Interest (%) (as at 30 June 2013) Approximately 9.5
Market Capitalisation based on: ($m)
Equity interest (%) 100.0 9.5
Closing Price as at 26 August 2013 7,077 675
30-day VWAP 7,208 688
52-week High 7,566 722
52-week Low 3,405 325
Source : Bloomberg
The P&P Division also has the following interests:
5.4.1 12.1 per cent. equity interest (as at 30 June 2013) in PMP Limited (“PMP”), an
Australia-listed media and marketing services company, providing a range of services
from concept to fulfilment. Its principal activities are commercial printing, digital pre-
media, letterbox delivery and magazine distribution services; and
5.4.2 29.5 per cent. equity interest (as at 30 June 2013) in Fung Choi Media Group Limited
(“Fung Choi”), a Singapore-listed media and marketing services company primarily
engaged in commercial displays, printing, packaging and advertising.
12
The market capitalisation of PMP and Fung Choi based on the respective closing prices as at
26 August 2013, 30-day VWAP up to 26 August 2013, and their 52-week high and low prices
are summarized below:
Listed Entities PMP Fung Choi
F&N’s Equity Interest (%)(as at 30 June 2013)
12.1 29.5
Market Capitalisation ($m) based on:
Equity interest (%) 100.0 12.1 100.0 29.5
Closing Price as at 26 August 20137 112 14 87 26
30-day VWAP 106 13 83 25
52-week High 130 16 120 35
52-week Low 56 7 78 23
Source : Bloomberg
6. DETAILS OF THE FCL DISTRIBUTION
6.1 Key Steps. The FCL Distribution involves the distribution by the Company of all the FCL
Shares held by the Company, comprising 100 per cent. of the issued FCL Shares, to
Shareholders in the proportion of two FCL Shares for each Share held by Shareholders or on
their behalf as at the Books Closure Date. The FCL Distribution will be effected by way of a
dividend in specie and the Company will implement the following in conjunction with the FCL
Distribution:
6.1.1 Corporate Restructuring. As at the date of this announcement (“Announcement
Date”), the Company holds 100 per cent. of the issued and paid up share capital of
FCL comprising 753,291,782 issued FCL Shares and 330,000 redeemable
preference shares. After the Books Closure Date and prior to the Proposed Listing
and the FCL Distribution, the Company will undertake a corporate restructuring (the
“Corporate Restructuring”) pursuant to which:
(i) FCL will redeem all the redeemable preference shares currently held by the
Company in FCL for an aggregate amount of $330 million;
(ii) the Company will subscribe for new FCL Shares (the “FCL Capitalisation”)
for a total subscription amount of $1,000 million, pursuant to which additional
FCL Shares will be issued such that the total number of FCL Shares held by
the Company after the FCL Capitalisation will be equivalent to the total
number of FCL Shares to be distributed pursuant to the FCL Distribution. The
exact number of new FCL Shares to be issued pursuant to the FCL
Capitalisation will depend on the total number of Shares held by
Shareholders as at the Books Closure Date; and
(iii) the F&N Group has extended loans to the FCL Group (the “Loans”) from
time to time for various purposes. Immediately prior to the FCL Distribution,
the amount owing from the FCL Group to the F&N Group under the Loans
will be repaid in full. As at 30 June 2013, the amount outstanding under the
Loans is approximately $1,923 million. FCL will repay approximately $670
7 Except for Fung Choi, whose Closing Price was on 20 August 2013
13
million of the amount outstanding under the Loans with the equity injected
pursuant to the FCL Capitalisation and the remaining amount of
approximately $1,253 million is expected to be repaid by FCL drawing down
on credit facilities to be obtained by the FCL Group.
As at the Announcement Date, the Company has 1,441,519,436 Shares in issue
(excluding 4,100 treasury shares). In addition, up to 4,696,809 new Shares (“2013
Award Shares”) could be issued on or prior to 31 December 2013, pursuant to
outstanding share awards (the “Share Awards”) granted pursuant to the F&N
Performance Share Plan and the F&N Restricted Share Plan which were approved
and adopted by the Company on 22 January 2009. Assuming that there is no change
to the number of issued Shares as at the Books Closure Date, the number of FCL
Shares to be issued pursuant to the FCL Capitalisation is 2,129,747,090 FCL Shares.
Assuming that all the 2013 Award Shares are issued on or prior to the Books Closure
Date, the number of FCL Shares to be issued pursuant to the FCL Capitalisation is
2,139,140,708 FCL Shares.
Pursuant to the Corporate Restructuring, FCL will have a total issued share capital of
$1,754 million comprising a minimum of 2,883,038,872 FCL Shares and a maximum
of 2,892,432,490 FCL Shares, which will be held in its entirety by the Company prior
to effecting the FCL Distribution.
6.1.2 Appropriation from Retained Profits. To effect the FCL Distribution as a dividend in
specie, the Company will appropriate an amount of approximately $2,911 million out
of the retained profits of the Company8 to meet the dividend to be declared based on
the carrying value of the FCL Shares (after the Corporate Restructuring) in the
accounts of the Company. In the consolidated accounts of the F&N Group, the net
assets of FCL will be approximately $5,891 million after the Corporate Restructuring.
After the FCL Distribution, a corresponding reduction of $5,891 million will be made
from the retained profits of the F&N Group on a consolidated basis.9
While the FCL Shares in the Company’s accounts are stated at cost, the value of the
FCL Shares in the consolidated accounts of the F&N Group is higher as such value is
determined on the basis of the net asset value of FCL which includes profits from the
operations of the FCL Group, in compliance with the requirements of the accounting
standards for the preparation of the consolidated accounts of the F&N Group.
6.1.3 Distribution. The FCL Distribution will be effected by the distribution of all the FCL
Shares which will be held by the Company after the completion of the Corporate
Restructuring, representing all the issued FCL Shares, to Shareholders by way of a
dividend in specie, in the proportion of two FCL Shares for each Share held by a
Shareholder or on their behalf as at the Books Closure Date. The FCL Shares will be
distributed free of encumbrances and together with all rights attaching thereto on and
from the date the FCL Distribution is effected.
8 The retained profits of the Company immediately after the capital reduction effected by the Company on 25 July 2013 is approximately $3,230 million.9 The retained profits of the F&N Group immediately after the capital reduction effected by the Company on 25 July 2013 is approximately $6,132 million.
14
6.2 Pro forma of FCL. The pro forma financial statements of the FCL Group as set out in
Appendix 4 have been prepared on the assumption that the Corporate Restructuring has
been completed.
6.3 Effects of the FCL Distribution. The effect of the FCL Distribution is to distribute the FCL
Shares to be held directly by Shareholders in the proportion of two FCL Shares for each
Share held by Shareholders or on their behalf as at the Books Closure Date. On completion
of the FCL Distribution and the Proposed Listing, the Company will cease to hold any FCL
Shares and Shareholders will hold listed shares in both the Company and FCL respectively.
The FCL Distribution will not result in any change to the issued and paid up share
capital of the Company after the FCL Distribution or to the number of Shares held by a
Shareholder.
7. FINANCIAL EFFECTS
The pro forma financial effects of the FCL Distribution on the F&N Group are set out in
Appendix 1. The pro forma financial effects are for illustration purposes only and do not reflect
the actual financial position of the F&N Group after the FCL Distribution.
The pro forma profit statement and balance sheet of the F&N Group after the FCL Distribution
are set out in Appendix 2.
The Company has issued notes pursuant to its $1,000,000,000 multicurrency medium term
note programme and has given guarantees in respect of (i) the notes issued pursuant to the
$2,000,000,000 multicurrency medium term note programme established by F&N Treasury
Pte. Ltd. (“F&NT”), (ii) $300,000,000 bonds issued by F&NT in 2011 and (iii) certain loan
facilities which relate to the operations of the FCL Group (together, the “Facilities”). In
connection with the FCL Distribution, the Company intends to seek the relevant third party
consents, approvals or waivers in respect of these Facilities and the Company may discharge
the amounts outstanding under the Facilities. The pro forma financial effects, profit statement
and balance sheet of the F&N Group after the FCL Distribution have been prepared on the
assumption that such Facilities have been fully discharged.
8. CONDITIONS TO THE FCL DISTRIBUTION
The FCL Distribution and the completion thereof is subject to, inter alia:
8.1.1 the approval of Shareholders by way of an ordinary resolution for the FCL Distribution
at the extraordinary general meeting to be convened (the “EGM”);
8.1.2 the eligibility to list letter from the SGX-ST for the listing and quotation of the FCL
Shares on the Main Board of the SGX-ST having been obtained and not having been
revoked or withdrawn; and
8.1.3 such other regulatory approvals or third party consents, approvals or waivers as the
Board may determine is required to effect the FCL Distribution.
15
9. TCC ASSETS LIMITED INTENDS TO VOTE IN FAVOUR OF THE FCL DISTRIBUTION
TCC Assets Limited, the majority Shareholder currently holding approximately 61.59 per cent.
of the Shares, has notified the Company on 27 August 2013 of its intention to vote all the
Shares it holds as at the date of the EGM in favour of the FCL Distribution.
10. OVERSEAS SHAREHOLDERS
Where the Directors are of the view that the distribution of the FCL Shares to any
Shareholders whose registered address appearing in the register of members of the
Company (the “Register”) or the depository register maintained by The Central Depository
(Pte) Limited (“Depository Register”) (as the case may be) is outside Singapore may infringe
any relevant foreign law or may necessitate compliance with conditions or requirements which
they, in their sole discretion, regard as onerous by reason of costs, delay or otherwise, the
FCL Shares which such Overseas Shareholders (as defined below) would have been entitled
to pursuant to the FCL Distribution (the “Overseas Shareholders’ FCL Shares”) will not be
distributed to such Overseas Shareholders. Instead, the Overseas Shareholders’ FCL Shares
shall be transferred to such nominee(s) as the Company may appoint, who shall sell the
Overseas Shareholders’ FCL Shares and thereafter distribute the aggregate amount of the
net proceeds, after deducting for all dealings and other expenses in connection therewith,
proportionately among such Overseas Shareholders according to their respective
entitlements to the FCL Shares as at the Books Closure Date in full satisfaction of their rights
to the FCL Shares which they would otherwise have become entitled to under the FCL
Distribution.
A Shareholder will be regarded as an “Overseas Shareholder” if their registered address in
the Register or the Depository Register (as the case may be) is outside Singapore as at the
Books Closure Date. Shareholders who wish to change their registered address on the
Register or the Depository Register (as the case may be) to provide a Singapore address in
substitution thereof prior to the Books Closure Date may do so by sending a notice in writing
to Tricor Barbinder Share Registration Services (in the case of a change of address on the
Register) and The Central Depository (Pte) Limited (in the case of a change of address on the
Depository Register), respectively, no later than three Market Days prior to the Books Closure
Date. For the purposes of the foregoing, a Market Day means a day on which the SGX-ST is
open for trading in securities.
Where the net proceeds to which any particular Overseas Shareholder is entitled is less than
$10, such net proceeds shall be retained for the benefit of the Company, and no Overseas
Shareholder shall have any claim whatsoever against the Company or any other person in
connection therewith.
Further information on the entitlements of the Overseas Shareholders will be set out in the
Circular (as defined below).
11. FURTHER INFORMATION
11.1 Circular and Introductory Document. A circular to Shareholders (the "Circular") in respect
of the resolution to approve the FCL Distribution, together with a notice of the EGM to be
convened, and the Introductory Document will be despatched in due course to Shareholders
to provide details on the FCL Distribution and the Proposed Listing.
16
11.2 Joint Financial Advisors. DBS Bank Ltd., United Overseas Bank Ltd. and Morgan Stanley
Asia Ltd. have been appointed to advise the Company on the Corporate Restructuring, FCL
Distribution and Proposed Listing.
11.3 Caution. Shareholders are advised to exercise caution when dealing in the Shares and to
refrain from taking any action in respect of their Shares which may be prejudicial to their
interests until they or their advisers have considered the information in the Introductory
Document and the Circular, as well as the recommendations to be set out in the Circular.
By Order of the Board
Anthony Cheong Fook Seng Company Secretary 27 August 2013
17
APPENDIX 1
FINANCIAL EFFECTS
1. Assumptions. The pro forma financial effects of the FCL Distribution on selected financial
measures of the F&N Group have been prepared based on the audited consolidated financial
statements of the F&N Group for FY2012 and the unaudited consolidated financial
statements of the F&N Group for the nine months ended 30 June 2013 (“9M2013”). The pro
forma financial effects are purely for illustration purposes only and do not reflect the actual
financial position of the F&N Group after the completion of the FCL Distribution.
As the sale of the Company’s interests in Asia Pacific Breweries Limited and Asia Pacific
Investment Pte Ltd (the “APB Sale”) was completed only in the first quarter of the financial
year ending 30 September 2013 and the cash distribution of approximately $4,730 million in
aggregate to Shareholders which was approved at an extraordinary general meeting of the
Company on 28 June 2013, and effected on 25 July 2013 (the “Capital Reduction”) was
completed only in the fourth quarter of the financial year ending 30 September 2013, the pro
forma financial effects for FY2012 on net asset value (“NAV”) and NAV per Share have been
prepared on the assumption that the APB Sale, the Capital Reduction and the FCL
Distribution were completed on 30 September 2012 and the pro forma financial effects on
NAV and NAV per Share for 9M2013 have been prepared on the assumption that the Capital
Reduction and the FCL Distribution were completed on 30 June 2013. The pro forma
financial effects of the FCL Distribution on the profit after tax and non-controlling interest for
FY2012 and 9M2013 are computed on the assumption that the APB Sale, the Capital
Reduction and the FCL Distribution were completed on 1 October 2011 and 1 October 2012
respectively. The pro forma financial effects are prepared on the assumption that the
Facilities have been fully discharged.
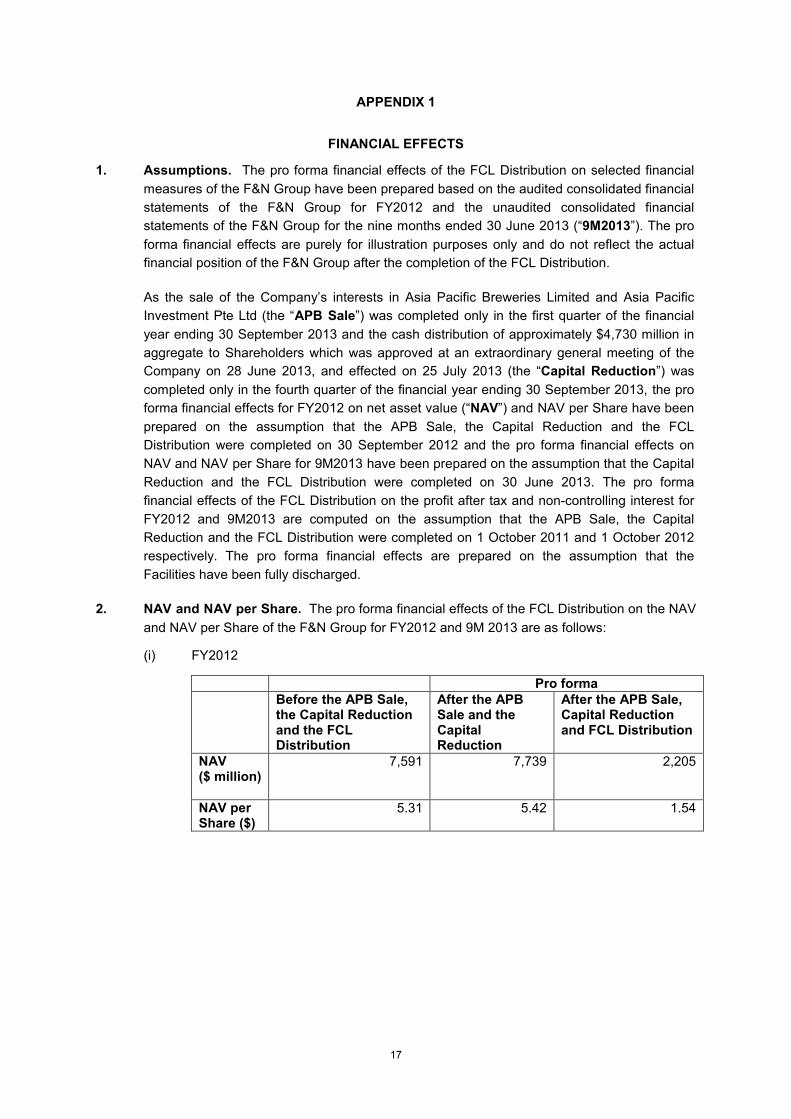
2. NAV and NAV per Share. The pro forma financial effects of the FCL Distribution on the NAV
and NAV per Share of the F&N Group for FY2012 and 9M 2013 are as follows:
(i) FY2012
Pro formaBefore the APB Sale, the Capital Reduction and the FCL Distribution
After the APB Sale and the Capital Reduction
After the APB Sale, Capital Reduction and FCL Distribution
NAV ($ million)
7,591 7,739 2,205
NAV per Share ($)
5.31 5.42 1.54
18
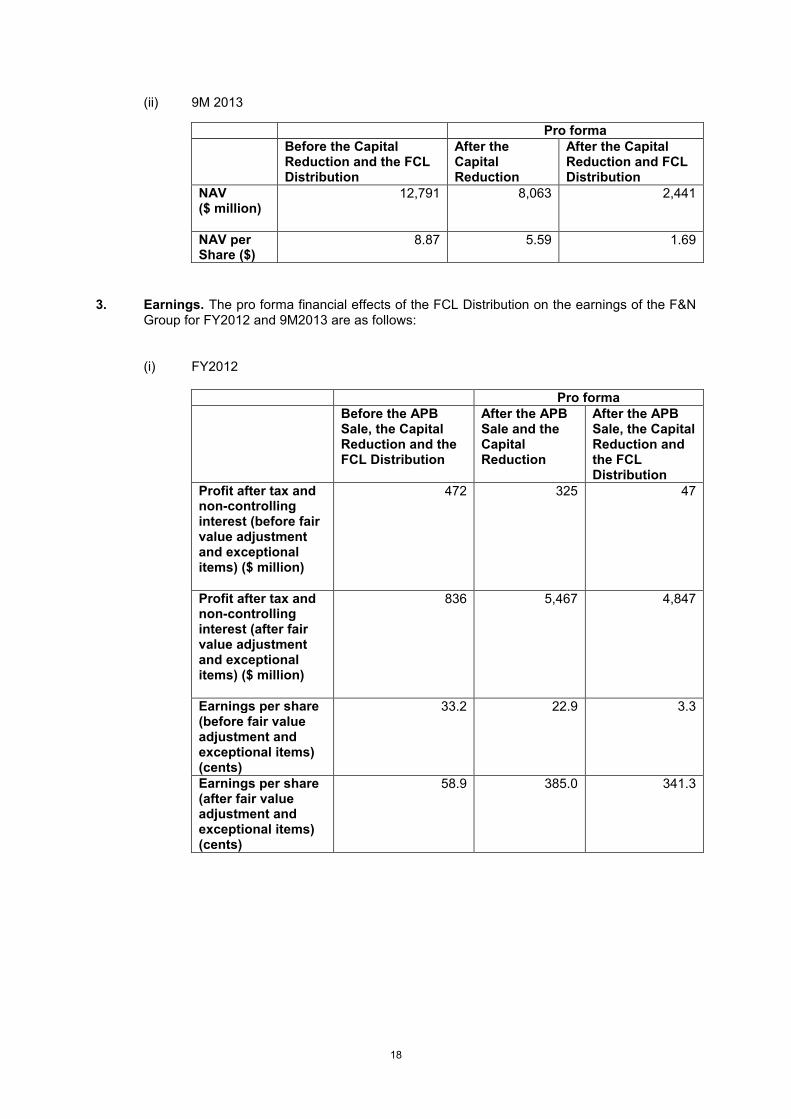
(ii) 9M 2013
Pro formaBefore the Capital Reduction and the FCL Distribution
After the Capital Reduction
After the Capital Reduction and FCL Distribution
NAV ($ million)
12,791 8,063 2,441
NAV per Share ($)
8.87 5.59 1.69
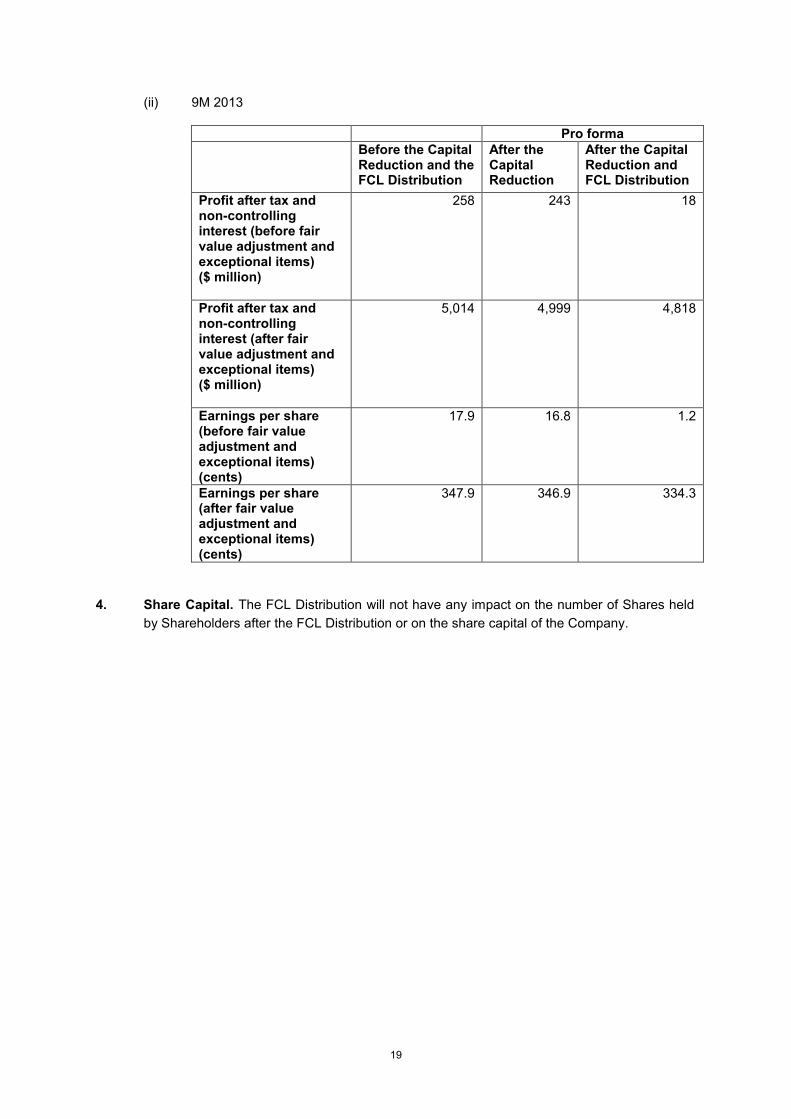
3. Earnings. The pro forma financial effects of the FCL Distribution on the earnings of the F&N Group for FY2012 and 9M2013 are as follows:
(i) FY2012
Pro formaBefore the APB Sale, the Capital Reduction and the FCL Distribution
After the APB Sale and the Capital Reduction
After the APB Sale, the Capital Reduction and the FCL Distribution
Profit after tax and non-controlling interest (before fair value adjustment and exceptional items) ($ million)
472 325 47
Profit after tax and non-controlling interest (after fair value adjustment and exceptional items) ($ million)
836 5,467 4,847
Earnings per share (before fair value adjustment and exceptional items) (cents)
33.2 22.9 3.3
Earnings per share (after fair value adjustment and exceptional items) (cents)
58.9 385.0 341.3
19
(ii) 9M 2013
Pro formaBefore the Capital Reduction and the FCL Distribution
After the Capital Reduction
After the Capital Reduction and FCL Distribution
Profit after tax and non-controlling interest (before fair value adjustment and exceptional items) ($ million)
258 243 18
Profit after tax and non-controlling interest (after fair value adjustment and exceptional items) ($ million)
5,014 4,999 4,818
Earnings per share (before fair value adjustment and exceptional items) (cents)
17.9 16.8 1.2
Earnings per share (after fair value adjustment and exceptional items) (cents)
347.9 346.9 334.3
4. Share Capital. The FCL Distribution will not have any impact on the number of Shares held
by Shareholders after the FCL Distribution or on the share capital of the Company.
20
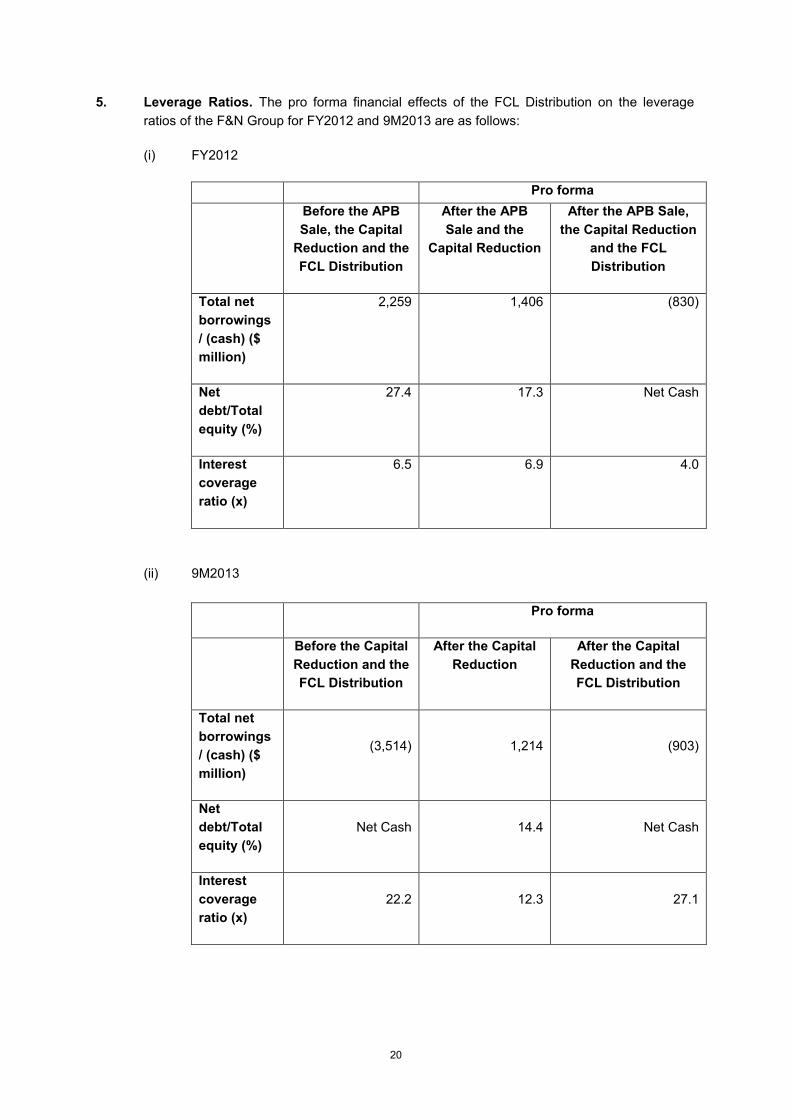
5. Leverage Ratios. The pro forma financial effects of the FCL Distribution on the leverage
ratios of the F&N Group for FY2012 and 9M2013 are as follows:
(i) FY2012
Pro forma
Before the APB
Sale, the Capital
Reduction and the
FCL Distribution
After the APB
Sale and the
Capital Reduction
After the APB Sale,
the Capital Reduction
and the FCL
Distribution
Total net
borrowings
/ (cash) ($
million)
2,259 1,406 (830)
Net
debt/Total
equity (%)
27.4 17.3 Net Cash
Interest
coverage
ratio (x)
6.5 6.9 4.0
(ii) 9M2013
Pro forma
Before the Capital
Reduction and the
FCL Distribution
After the Capital
Reduction
After the Capital
Reduction and the
FCL Distribution
Total net
borrowings
/ (cash) ($
million)
(3,514) 1,214 (903)
Net
debt/Total
equity (%)
Net Cash 14.4 Net Cash
Interest
coverage
ratio (x)
22.2 12.3 27.1
21
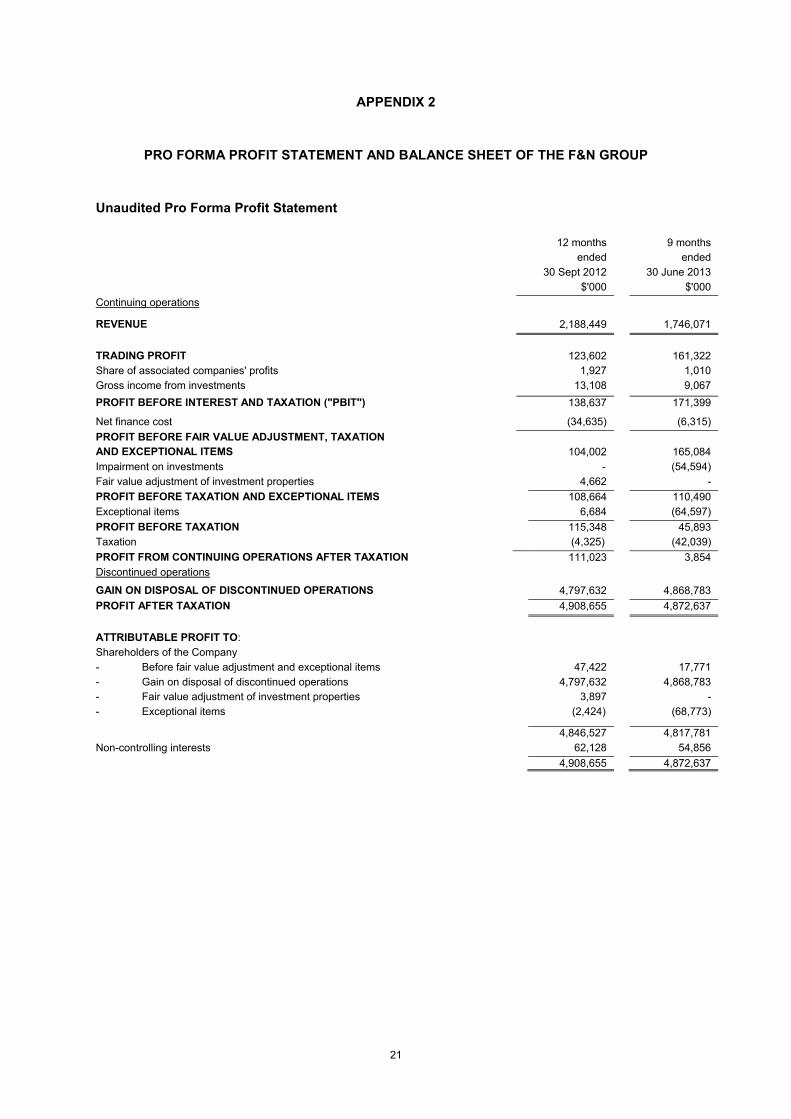
APPENDIX 2
PRO FORMA PROFIT STATEMENT AND BALANCE SHEET OF THE F&N GROUP
Unaudited Pro Forma Profit Statement
12 months
ended
30 Sept 2012
9 months
ended
30 June 2013
$'000 $'000
Continuing operations
REVENUE 2,188,449 1,746,071
TRADING PROFIT 123,602 161,322
Share of associated companies' profits 1,927 1,010
Gross income from investments 13,108 9,067
PROFIT BEFORE INTEREST AND TAXATION ("PBIT") 138,637 171,399
Net finance cost (34,635) (6,315)
PROFIT BEFORE FAIR VALUE ADJUSTMENT, TAXATION
AND EXCEPTIONAL ITEMS 104,002 165,084
Impairment on investments - (54,594)
Fair value adjustment of investment properties 4,662 -
PROFIT BEFORE TAXATION AND EXCEPTIONAL ITEMS 108,664 110,490
Exceptional items 6,684 (64,597)
PROFIT BEFORE TAXATION 115,348 45,893
Taxation (4,325) (42,039)
PROFIT FROM CONTINUING OPERATIONS AFTER TAXATION 111,023 3,854
Discontinued operations
GAIN ON DISPOSAL OF DISCONTINUED OPERATIONS 4,797,632 4,868,783
PROFIT AFTER TAXATION 4,908,655 4,872,637
ATTRIBUTABLE PROFIT TO:
Shareholders of the Company
- Before fair value adjustment and exceptional items 47,422 17,771
- Gain on disposal of discontinued operations 4,797,632 4,868,783
- Fair value adjustment of investment properties 3,897 -
- Exceptional items (2,424) (68,773)
4,846,527 4,817,781
Non-controlling interests 62,128 54,856
4,908,655 4,872,637
22
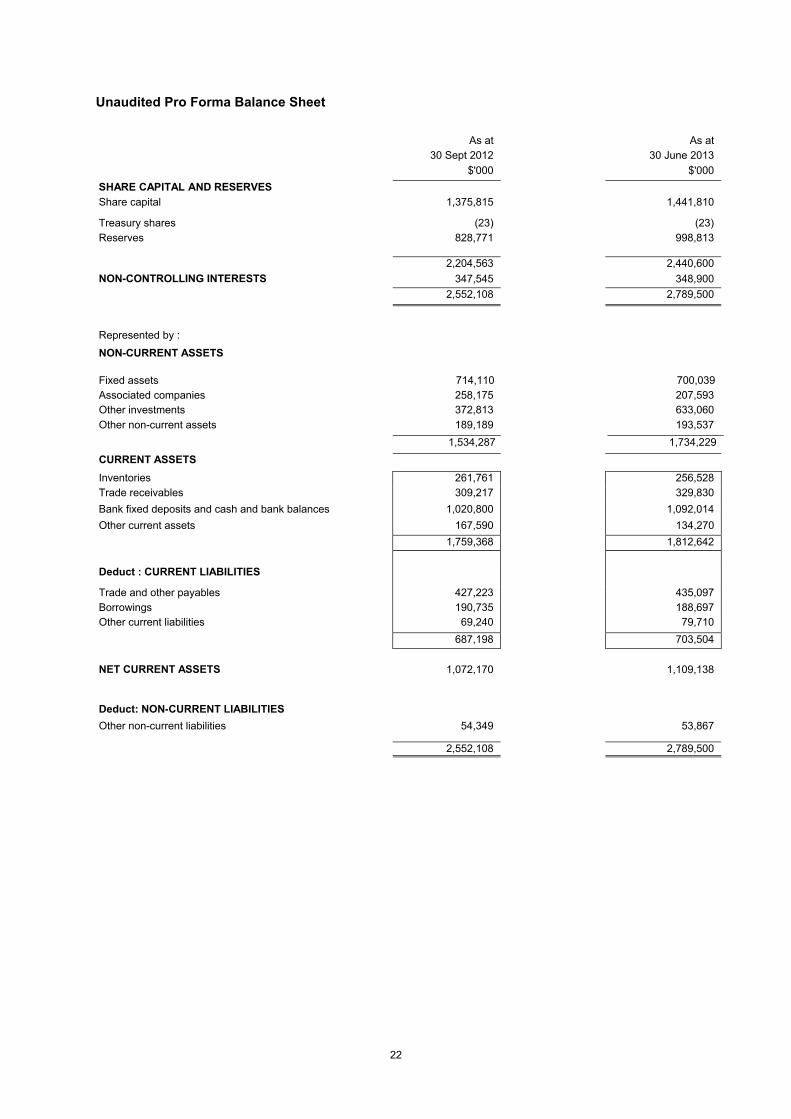
Unaudited Pro Forma Balance Sheet
As at
30 Sept 2012
As at
30 June 2013
$'000 $'000
SHARE CAPITAL AND RESERVES
Share capital 1,375,815 1,441,810
Treasury shares (23) (23)
Reserves 828,771 998,813
2,204,563 2,440,600
NON-CONTROLLING INTERESTS 347,545 348,900
2,552,108 2,789,500
Represented by :
NON-CURRENT ASSETS
Fixed assets 714,110 700,039
Associated companies 258,175 207,593
Other investments 372,813 633,060
Other non-current assets 189,189 193,537
1,534,287 1,734,229
CURRENT ASSETS
Inventories 261,761 256,528
Trade receivables 309,217 329,830
Bank fixed deposits and cash and bank balances 1,020,800 1,092,014
Other current assets 167,590 134,270
1,759,368 1,812,642
Deduct : CURRENT LIABILITIES
Trade and other payables 427,223 435,097
Borrowings 190,735 188,697
Other current liabilities 69,240 79,710
687,198 703,504
NET CURRENT ASSETS 1,072,170 1,109,138
Deduct: NON-CURRENT LIABILITIES
Other non-current liabilities 54,349 53,867
2,552,108 2,789,500
23
APPENDIX 3
INFORMATION ON FCL
The information in this Appendix 3 is qualified in its entirety by, and is subject to, the more
detailed information to be set out in the Introductory Document which will be issued
subsequently. The information presented in this Appendix 3 is subject to change.
Statements contained in this Appendix 3 which are not historical facts may be forward looking
statements. Such statements are based on certain assumptions and are subject to certain
risks, uncertainties and assumptions which could cause actual results to differ materially.
1. Competitive Strengths
1.1 FCL is a Full Fledged International Real Estate Company Headquartered in Singapore.
FCL is a full fledged international real estate company with three core businesses focused on
residential property, commercial property (comprising office, business and retail space) and
hospitality (comprising primarily extended-stay residences). In addition, FCL is a sponsor and
manager of two real estate investment trusts listed on the Main Board of the SGX-ST, FCT
and FCOT, that are focused on retail properties and office and business space properties
respectively. FCL has extensive experience and a long track record in property development
(since 1980), property management (since 1983) and investment management (since 2006).
FCL’s diversified portfolio includes residential projects in Singapore, Australia, China, New
Zealand, Thailand and the United Kingdom, commercial assets comprising retail malls, offices
and business space in Singapore, Malaysia, Vietnam, China and Australia, serviced
residences in Asia, Europe, Australia and the Middle East, as well as equity interests in real
estate investment trusts listed in Singapore and Malaysia. FCL’s capabilities enable FCL to
participate in and extract value from the entire real estate value chain, encompassing asset
origination, project development, leasing, operations and property management.
1.2 FCL is Among Three Largest Residential Developers in Singapore in Terms of New
Home Sales, with Significant Developments Overseas.
FCL is one of the top three residential developers in Singapore in terms of new home sales in
201210. The residential division in Singapore, Frasers Centrepoint Homes, started in 1993 and
has since developed more than 11,000 homes in over 40 projects. In Singapore, FCL’s core
strength is in the mid-tier and mass market segments which have proven to be relatively more
resilient over recent economic cycles.
Through the international property division, Frasers Property, FCL has developed over 20
residential projects in Australia, China, New Zealand, Thailand and the United Kingdom. As
of 30 June 2013, FCL has a significant development pipeline in China and Australia,
comprising 8,100 homes in two residential projects in Shanghai and Suzhou in China, and
3,300 homes in five residential projects in Sydney and Perth in Australia.
10 Source: The Straits Times news release dated 12 February 2013 and entitled “Far East sold most private homes this year”. The Company and its financial adviser has not sought the consent of The Straits Times, nor has the Straits Times provided their consent to, and are accordingly not liable for the inclusion of the relevant information extracted from the informationservices provided by the Straits Times and disclaim any responsibility in relation to reliance on these statistics and information. The Company and its financial adviser have not conducted an independent review of the information contained in such information services and have not verified the accuracy of such information services.
24
1.3 One of the Largest Retail Mall Owners and/or Operators in Singapore.
FCL is one of the largest retail mall owners and/ or operators in Singapore with a portfolio of
12 urban and suburban malls under management, having a total net lettable area of
approximately 2.4 million square feet. FCL has direct interests in six of these malls and
another five malls are held through FCT. In addition, FCL also manage one mall owned by a
third party.
1.4 FCL’s position as one of the largest retail mall owners and/ or operators in Singapore
provides FCL with certain competitive advantages:
1.4.1 FCL is able to offer existing and prospective tenants tailored leasing solutions across
multiple urban and/or suburban locations, depending on their business needs. FCL’s
extensive network of suburban malls allows its retail tenants to tap a large cross-
section of the Singapore population in locations that are highly convenient to their
homes.
1.4.2 FCL enjoys economies of scale in property leasing and operations, and the ability to
share best practices across a large portfolio of retail space.
In addition to the aforesaid competitive advantages, FCL has created value through asset
enhancement initiatives undertaken at Anchorpoint, Northpoint and Causeway Point malls
which have contributed to a net value creation of about $165 million in the respective initial
years after such asset enhancement initiatives based on the increase in the respective mall’s
net property income.
1.5 FCL Owns and Manages a Portfolio of Office, Business and Logistics Space in Four
Countries.
FCL owns and manages over 4 million square feet of net lettable office, business and logistics
space in 11 offices and business parks in Singapore, Canberra, Chengdu, Ho Chi Minh City
and Perth. FCL has direct interests in six of these commercial properties and the remaining
five are held through FCOT.
1.6 FCL is a Leading Hospitality Operator in the Extended Stay Market Worldwide,
excluding North America .
Frasers Hospitality is a scalable hospitality operation with presence in 39 cities worldwide,
managing more than 8,000 apartments with another over 6,400 apartments signed up under a
family of five brands, as at 30 June 2013.
Based on management contracts secured as at 30 June 2013, over 6,400 apartments will be
added to Frasers Hospitality’s portfolio of serviced residences over the next three years. This
will double FCL’s presence in China to 23 hospitality properties within the next three years,
strengthening FCL’s presence in Beijing, Shanghai, Guangzhou and Shenzhen as well as
important secondary-tier Chinese cities such as Wuxi, Wuhan and Chengdu.
25
The value of Frasers Hospitality to FCL and FCL’s shareholders is set out as follows:
1.6.1 The international footprint of Frasers Hospitality was achieved through years of
painstaking effort, and cannot be easily replicated by new entrants to this sector
without significant investment in talent, time and branding. These factors provide FCL
with a competitive advantage, having been one of the early movers in the serviced
residence industry in Asia.
1.6.2 Many of the properties managed by Frasers Hospitality are in prime locations which
were secured after extensive negotiations with vendors and/or property owners, as
the case may be. Because prime locations are difficult to secure once a desirable
city precinct has matured, FCL’s incumbent position in a sought-after location
strengthens its value proposition to guests and sustains the capital values of those
properties that FCL owns.
1.6.3 FCL’s family of brands is well-recognised by the market and the brands cater to
important segments of business travellers in the long-stay and short-stay markets
who have differing requirements for luxury, amenities and length of stay. Three of its
brands, namely Fraser Suites, Fraser Place and Fraser Residence, have been
established for over 10 years, and cater to the extended-stay hospitality market with a
range of formats suitable for those staying with or without families. FCL’s two newer
brands, Modena and Capri by Fraser, were launched to offer fresh formats for a new
generation of travellers whose business and leisure hours have inter-mingled and/or
who seek the facilities and services of a deluxe hotel combined with the convenience
and extra space of a full service residence.
1.7 FCL is Well Capitalised and Have Sufficient Financial Resources to Fund Expansion.
Based on the pro forma accounts of FCL Group as at 30 June 2013, FCL is well capitalised
and have sufficient financial resources to fund expansion:
1.7.1 Net debt to equity ratio of 0.36 times;
1.7.2 More than $0.98 billion of cash and cash equivalents;
1.7.3 Undrawn credit facilities and MTN Programme exceeding $1.77 billion; and
1.7.4 Shareholders’ equity of $5.89 billion.
The strength of the balance sheet is a competitive advantage given the capital intensive
nature of the property business. These financial resources give FCL flexibility to fund future
growth and tap investment opportunities, which include tendering for raw land to develop
residential projects, asset enhancement initiatives for existing retail and commercial
properties and/or purchasing suitable retail, commercial or hospitality assets.
26
1.8 REIT Platforms Facilitate Efficient Recycling of Capital to Pursue New Opportunities
FCL’s two listed REITs, FCT and FCOT, have served as proven funding platforms for FCL to
divest mature, stable yield retail and commercial assets, thereby facilitating the recycling of
capital which can be redeployed to pursue new opportunities as they arise. As of 30 June
2013, FCL has received gross proceeds totalling $1.31 billion from the sale of five retail malls
to FCT, and further capital can be recycled if and when FCL divests further retail malls to FCT.
FCL directly owns retail and commercial properties with an aggregate appraised value of
$2,374 million as at 30 June 2013, which could potentially form a pipeline for injection into
FCL REITs in the future. An example of this would be Changi City Point, a 50:50 joint venture
development with Ascendas Land (Singapore).
1.9 FCL Asset Portfolio Provides Visible Streams of Residential Income Supported by a
Good Base of Recurring Income from its Retail, Commercial and Hospitality
Businesses.
FCL residential business is expected to provide visible income while recurring income from its
retail, commercial and hospitality businesses are expected to contribute to fairly stable cash
flows in the next few years:
1.9.1 Residential – As at 30 June 2013, FCL has pre-sold apartments in Singapore and
overseas which are expected to deliver approximately $3.3 billion of revenue over the
next three to four financial years, of which $2.4 billion is attributable to Singapore
residential pre-sales and $0.9 billion is attributable to overseas projects, principally
from Australian residential pre-sales. Based on FCL’s historical residential pre-sales,
FCL expects a low level of default from its pre-sales.
1.9.2 Retail Malls – FCL will continue to receive recurring rental and property management
income derived from the six retail malls that FCL has direct interests in, plus dividend
income from the 41.0% interest FCL has in FCT, which owns another five retail malls.
FCT recorded growth in net property income in each of the past five financial years,
from $56.6 million in FY2008 to $104.4 million in FY2012, while distributable income
rose from $45.2 million to $82.3 million over the same period. Income from many of
FCL’s suburban malls remained resilient during recent economic slowdowns owing to
many of their tenants’ focus on non-discretionary spending market and dominant
presence in their respective catchment areas.
1.9.3 Office and Business Space – FCL will continue to receive rental and property
management income derived from the six office properties that FCL has direct
interests in, plus dividend income from the 27.8 per cent. interest FCL has in FCOT,
which owns another five office properties. Revenue derived from its directly owned
office properties has increased steadily over the past 5 years, from $17.5 million in
2008 to $35.2 million in 2012. Since FCL acquired an equity interest in and assumed
management of FCOT in 2008, FCOT has recorded growth in net property income
from $81.0 million in FY2008 to $102.5 million in FY2012, while aggregate income
distributable to unitholders and convertible perpetual preferred units holders rose
from $45.8 million to $61.9 million over the same period.
27
1.9.4 Hospitality – As at 30 June 2013, FCL receives rental income derived from 14
serviced residences/ hotel residences which FCL has direct interest in and net
property income for 9 months amounting to $18.7 million. In order to expand FCL’s
income generating capacity while conserving capital, most of the serviced residences
FCL manages are owned by third parties. FCL generates recurring fee income from
the management of such serviced residences.
1.10 FCL’s Asset Portfolio Value has Further Potential to Grow Through Asset
Enhancement Initiatives and Redevelopment of its Investment Properties.
The numerous assets in FCL’s portfolio are at different stages of maturity.
Relatively mature retail and office properties may benefit from asset enhancement initiatives
from time to time, subject to requisite approvals, and such initiatives may enhance their value
through re-positioning to adapt to changing tenant demand and visitor traffic, and/or through
additional gross floor area available for lease.
For example, FCL has created additional value through asset enhancement initiatives
undertaken at Anchorpoint, Northpoint and Causeway Point malls which have contributed to a
net value creation of about $165 million in the respective initial year post such asset
enhancement initiative based on increase in the respective mall’s net property income.
The proposed asset enhancement initiative to rejuvenate China Square Central, if approved
and implemented, would include the addition of 16,000 sqm of gross floor area for hotel use,
subject to re-zoning of the site from white with a stipulated at gross plot ratio of 4.2 to white
without a stipulated gross plot ratio, and this could contribute further distributable income in
the years ahead.
In addition, some of FCL’s investment properties that FCL directly owns such as The
Centrepoint, Robertson Walk and Valley Point, are prime properties located around Orchard
Road, Robertson Quay and River Valley district respectively, and have considerable potential
for redevelopment and/or asset enhancement which will in turn unlock intrinsic value to FCL
shareholders.
FCL is one of the few international developers with residential, retail and commercial business
exposure. FCL’s project design, execution and delivery capabilities of its various businesses
are attested to by the technically demanding large-scale projects that FCL has undertaken
and by the awards and accolades FCL has garnered over the years. Consequently, FCL is
able to leverage on its experience and capability as a multi-segment real estate developer to
secure large scale and complex mixed-use projects which would otherwise elude those
without such expertise.
For example, Changi City which was jointly developed by FCL, is Singapore’s largest
integrated business park development to-date, spanning 4.7 hectares and offering 207,000
square feet of net lettable retail space on three floors, a nine-storey office tower with 650,000
square feet of net lettable floor area, and a 313-room hotel operated under the Capri by
Frasers brand. FCL is also jointly developing Central Park, a AUD2.0 billion mixed-used
development occupying a 5.8 hectare parcel of inner-city land that will offer approximately
2,100 apartments in seven residential towers, student accommodation, 50,000 square metres
of office space, 20,000 square metres of retail facilities, restoration and adaptive re-use of
heritage items, and a 6,400 square metre public park. Central Park will feature low-carbon
28
environmentally sustainable central thermal energy plant and water recycling facilities, that
puts it at the forefront of sustainable precinct and community developments in Australia.
Central Park constitutes one of the largest urban land regeneration projects in Australia.
1.11 FCL has a Well-Established Brand and Reputation
Since FCL developed its first shopping mall, The Centrepoint, in Singapore in 1983, FCL has
built a strong reputation in cities such as Singapore and Australia, and won numerous awards.
Frasers Centrepoint Homes has scored high values and received numerous awards for
excellence in design and features. FCL has also been awarded Construction Excellence, an
award developed by the Building and Construction Authority in co-operation with major public
sector agencies and various leading industry professional bodies to measure workmanship
quality in a completed building.
Frasers Centrepoint Malls was a finalist in the Sales Promotion & Events category of the
International Council of Shopping Centre Asia Pacific Shopping Centre Awards (2012) which
recognises excellence within the region’s shopping centre industry, whereby awards were
given for outstanding achievement in marketing and design/development of retail properties.
Frasers Centrepoint Malls has also been recognised to have gone the extra mile to welcome
families through family-friendly strategies, facilities and service touch points.
Frasers Centrepoint Trust is recognised for its strength in investor relations and corporate
governance. FCT was the "Grand Prix for best overall investor relations (mid/small cap)"
presented by the IR Magazine Awards South East Asia 2012 and was voted “Singapore’s
Best Mid-Cap” in the 11th Finance Asia’s “Asia’s Best Companies Poll” in 2012. It was also
ranked in the top quartile for corporate governance in Asia by CLSA in 2012.
FCL’s hospitality operations have won numerous awards across the globe. FCL believes it
has well-established brands for its hospitality business, under “The Fraser Collection”,
“Modena by Fraser” and “Capri by Fraser”. FCL believes it can leverage on this branding to
open up new opportunities to it.
1.12 FCL is Backed by a Strong Sponsor which Invests in and Develops a Wide Range of
Real Estate Projects Globally.
The Thai Charoen Corporation Group (the “TCC Group”, which comprises companies and entities controlled by Charoen Sirivadhanabhakdi and Khunying Wanna Sirivadhanabhakdi) will be the majority shareholder of FCL after the completion of the FCL Distribution and
Proposed Listing.
The TCC Group is among the largest businesses in Southeast Asia and is engaged in a
variety of businesses including real estate. The TCC Group invests in and develops a wide
range of real estate projects globally, including hotels, office towers, retail centres, residences,
serviced apartments, convention centres, golf courses and resorts. As at 30 June 2013, it
owns, among others, 17 retail shopping centres with approximately 500,000 square metres of
retail space, seven commercial offices with approximately 810,000 square metres of office
space, 40 hotels with 10,000 keys in Thailand and 10 countries worldwide and over 48,000
acres of land bank for development.
29
FCL currently enjoys access to the TCC Group’s portfolio of assets and has begun to
evaluate several opportunities for asset origination, strategic partnerships and collaboration.
In addition, Mr Charoen Sirivadhanabhakdi and Khunying Wanna Sirivadhanabhakdi, the
ultimate controlling shareholders of the TCC Group, have granted a right of first refusal over
any opportunity whether by way of sale, investment or otherwise, in relation to certain
businesses referred to and/or made available to the TCC Group from or through any third
party sources, and a right to participate in any bidding process in relation to any opportunity
whether by way of sale, investment or otherwise, in respect of any of the abovementioned
businesses, called by the TCC Group.
1.13 Experienced Board and Management Team with Proven Track Record.
FCL has strong management bench strength in all four segments of its property business.
FCL executive officers have proven track records in acquiring, developing, managing,
operating and enhancing properties in the residential, retail, business space and hospitality
segments.
FCL’s offices in each of its principal geographies are staffed by experienced management
teams familiar with local markets and regulations, thereby enabling us to compete and
respond appropriately in the local business context.
FCL employees benefit from a human resource program and system that are designed to
attract, retain and develop qualified individuals. FCL training programmes encompass the
development of both soft and hard skills backed by positive and constructive individual
coaching, and feedback with comprehensive policies and procedures to encourage a learning
environment.
2. Business and Operations
FCL conducts its operations and hold investments through its subsidiaries, joint venture
companies and the two listed REITs, that is, FCT and FCOT.
30
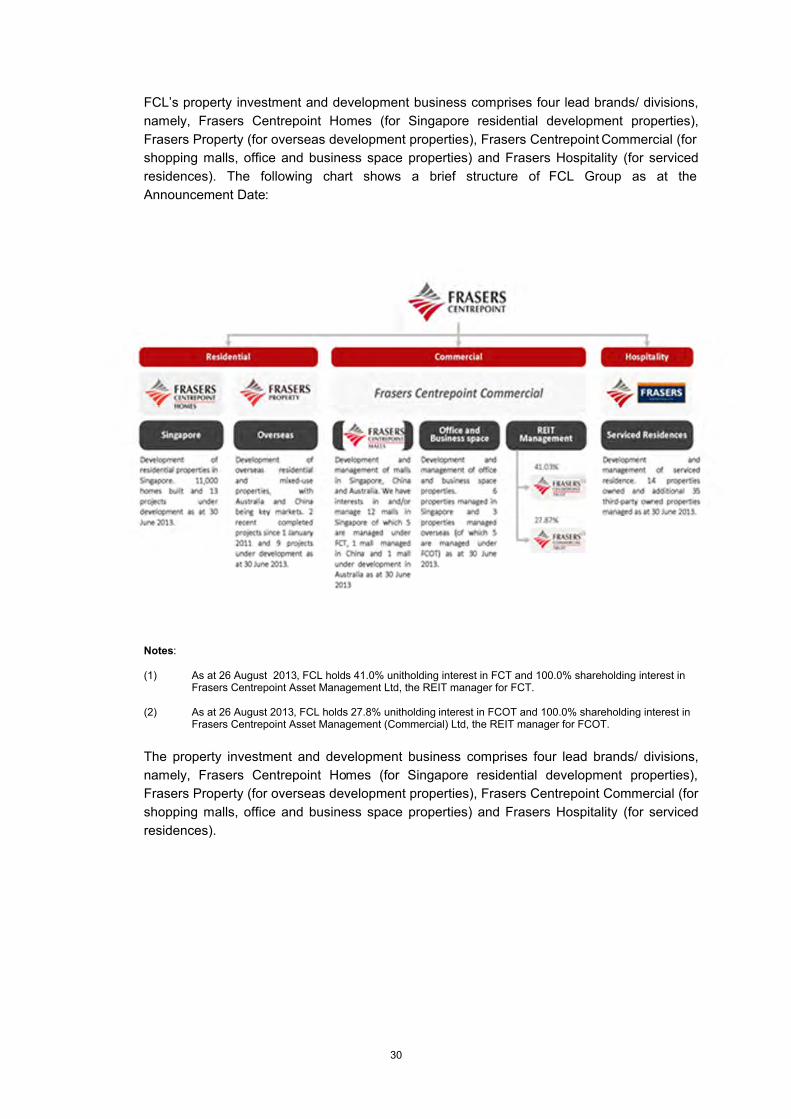
FCL’s property investment and development business comprises four lead brands/ divisions,
namely, Frasers Centrepoint Homes (for Singapore residential development properties),
Frasers Property (for overseas development properties), Frasers Centrepoint Commercial (for
shopping malls, office and business space properties) and Frasers Hospitality (for serviced
residences). The following chart shows a brief structure of FCL Group as at the
Announcement Date:
Notes:
(1) As at 26 August 2013, FCL holds 41.0% unitholding interest in FCT and 100.0% shareholding interest in Frasers Centrepoint Asset Management Ltd, the REIT manager for FCT.
(2) As at 26 August 2013, FCL holds 27.8% unitholding interest in FCOT and 100.0% shareholding interest in Frasers Centrepoint Asset Management (Commercial) Ltd, the REIT manager for FCOT.
The property investment and development business comprises four lead brands/ divisions,
namely, Frasers Centrepoint Homes (for Singapore residential development properties),
Frasers Property (for overseas development properties), Frasers Centrepoint Commercial (for
shopping malls, office and business space properties) and Frasers Hospitality (for serviced
residences).
31
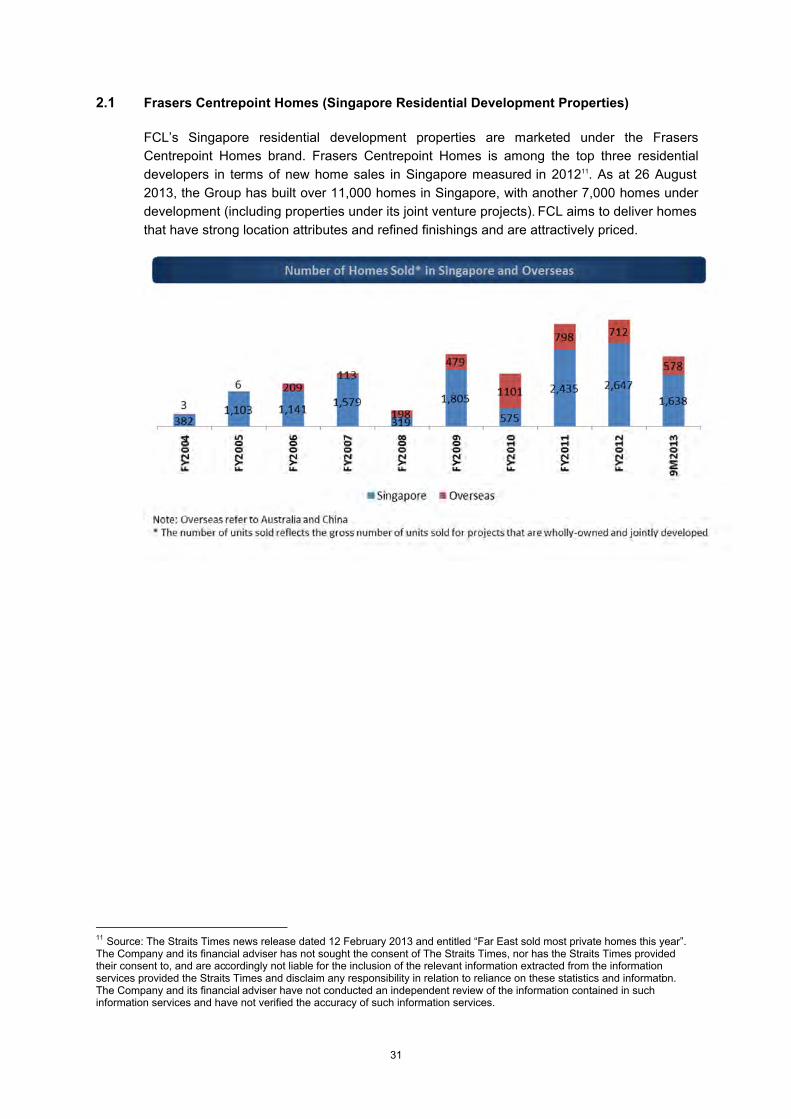
2.1 Frasers Centrepoint Homes (Singapore Residential Development Properties)
FCL’s Singapore residential development properties are marketed under the Frasers
Centrepoint Homes brand. Frasers Centrepoint Homes is among the top three residential
developers in terms of new home sales in Singapore measured in 201211. As at 26 August
2013, the Group has built over 11,000 homes in Singapore, with another 7,000 homes under
development (including properties under its joint venture projects). FCL aims to deliver homes
that have strong location attributes and refined finishings and are attractively priced.
11 Source: The Straits Times news release dated 12 February 2013 and entitled “Far East sold most private homes this year”. The Company and its financial adviser has not sought the consent of The Straits Times, nor has the Straits Times provided their consent to, and are accordingly not liable for the inclusion of the relevant information extracted from the information services provided the Straits Times and disclaim any responsibility in relation to reliance on these statistics and information. The Company and its financial adviser have not conducted an independent review of the information contained in such information services and have not verified the accuracy of such information services.
32
Between 1 January 2011 and 30 June 2013, FCL sold approximately 6,200 residential units
(including properties under joint venture projects).
2.1.1 Recent Completed Projects
The following table sets out the recent completed projects of Frasers Centrepoint
Homes (as of 30 June 2013) since 1 January 2011:
Project name No. of units % Sold Effective interest (%)
Martin Place Residences 302 100 100.0
Soleil@Sinaran 417 99 100.0
Woodsville 28 110 100 100.0
Waterfront Waves(1)
405 100 50.0
8@Woodleigh 330 100 100.0
Caspian 712 100 100.0
Residences Botanique 81 100 100.0
Waterfront Key(1)
437 100 50.0
Note:
(1) Joint ventures with Far East Organization.
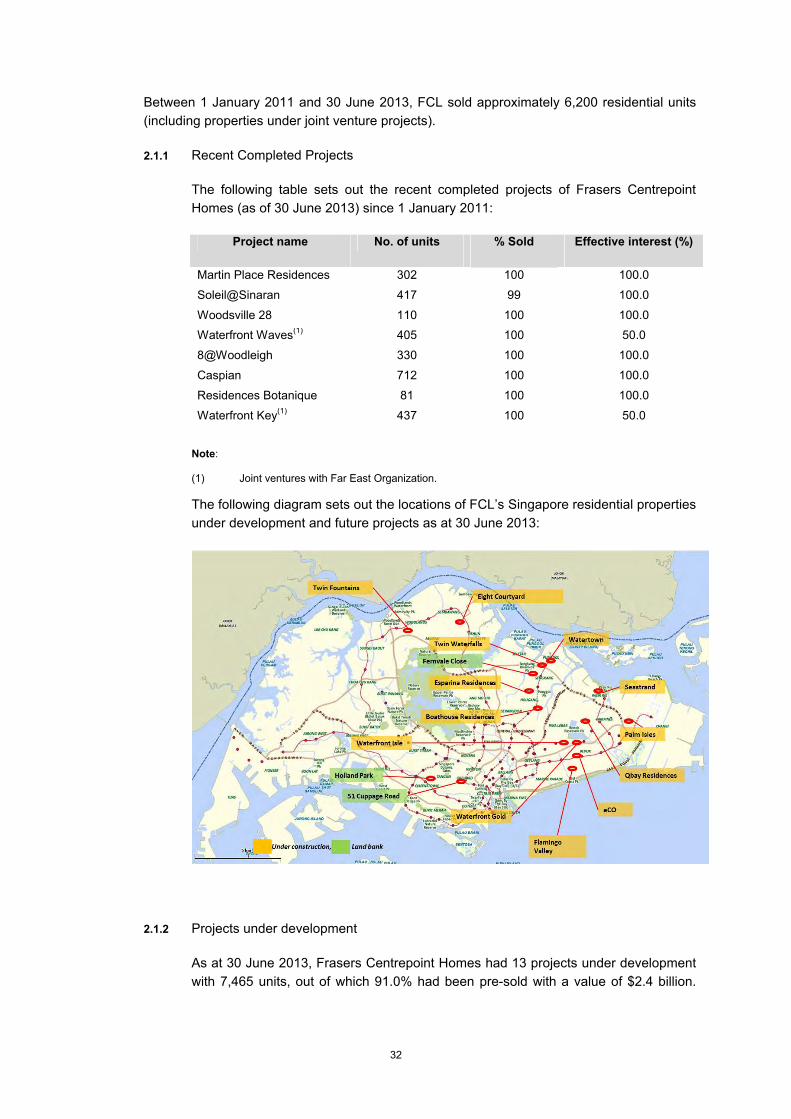
The following diagram sets out the locations of FCL’s Singapore residential properties
under development and future projects as at 30 June 2013:
2.1.2 Projects under development
As at 30 June 2013, Frasers Centrepoint Homes had 13 projects under development
with 7,465 units, out of which 91.0% had been pre-sold with a value of $2.4 billion.
33
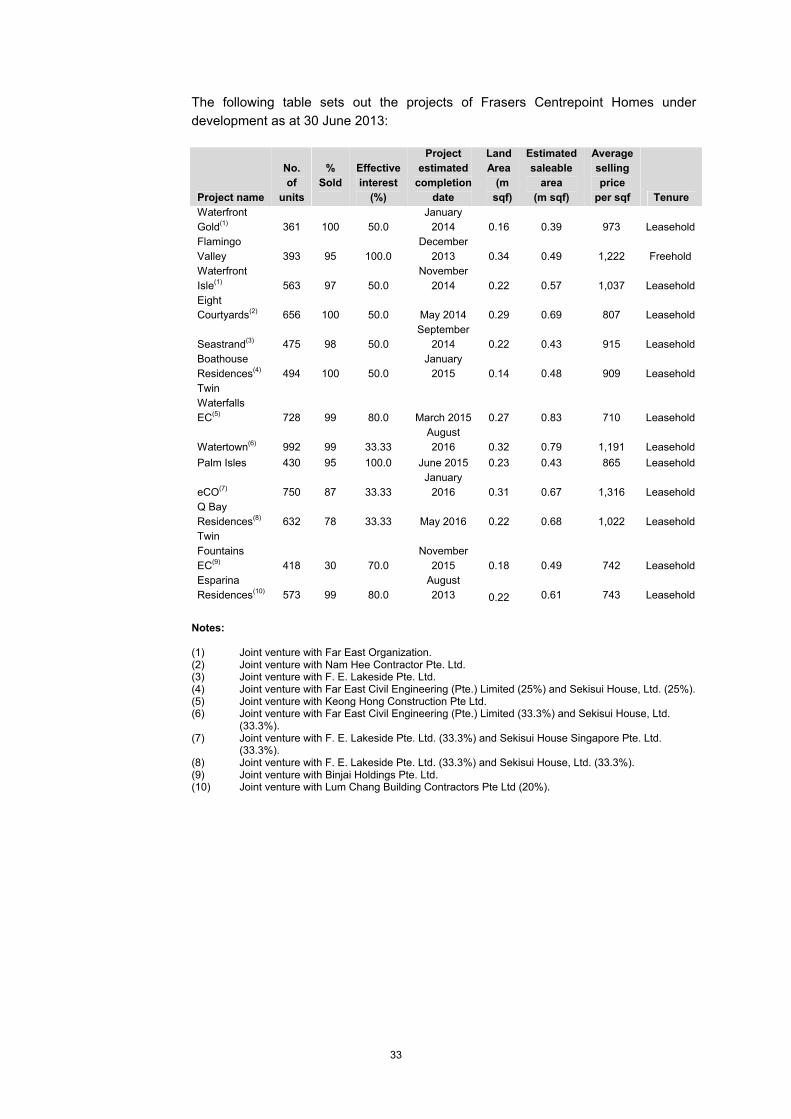
The following table sets out the projects of Frasers Centrepoint Homes under
development as at 30 June 2013:
Project name
No.
of
units
%
Sold
Effective
interest
(%)
Project
estimated
completion
date
Land
Area
(m
sqf)
Estimated
saleable
area
(m sqf)
Average
selling
price
per sqf Tenure
Waterfront
Gold(1) 361 100 50.0
January
2014 0.16 0.39 973 Leasehold
Flamingo
Valley 393 95 100.0
December
2013 0.34 0.49 1,222 Freehold
Waterfront
Isle(1) 563 97 50.0
November
2014 0.22 0.57 1,037 Leasehold
Eight
Courtyards(2) 656 100 50.0 May 2014 0.29 0.69 807 Leasehold
Seastrand(3) 475 98 50.0
September
2014 0.22 0.43 915 Leasehold
Boathouse
Residences(4) 494 100 50.0
January
2015 0.14 0.48 909 Leasehold
Twin
Waterfalls
EC(5) 728 99 80.0 March 2015 0.27 0.83 710 Leasehold
Watertown(6) 992 99 33.33
August
2016 0.32 0.79 1,191 Leasehold
Palm Isles 430 95 100.0 June 2015 0.23 0.43 865 Leasehold
eCO(7) 750 87 33.33
January
2016 0.31 0.67 1,316 Leasehold
Q Bay
Residences(8) 632 78 33.33 May 2016 0.22 0.68 1,022 Leasehold
Twin
Fountains
EC(9) 418 30 70.0
November
2015 0.18 0.49 742 Leasehold
Esparina
Residences(10) 573 99 80.0
August
2013 0.22 0.61 743 Leasehold
Notes:
(1) Joint venture with Far East Organization.(2) Joint venture with Nam Hee Contractor Pte. Ltd. (3) Joint venture with F. E. Lakeside Pte. Ltd. (4) Joint venture with Far East Civil Engineering (Pte.) Limited (25%) and Sekisui House, Ltd. (25%).(5) Joint venture with Keong Hong Construction Pte Ltd.(6) Joint venture with Far East Civil Engineering (Pte.) Limited (33.3%) and Sekisui House, Ltd.
(33.3%).(7) Joint venture with F. E. Lakeside Pte. Ltd. (33.3%) and Sekisui House Singapore Pte. Ltd.
(33.3%).(8) Joint venture with F. E. Lakeside Pte. Ltd. (33.3%) and Sekisui House, Ltd. (33.3%).(9) Joint venture with Binjai Holdings Pte. Ltd.(10) Joint venture with Lum Chang Building Contractors Pte Ltd (20%).
34
2.1.3 Land Bank
As at 30 June 2013, Frasers Centrepoint Homes has a land bank in Singapore with
an estimated saleable area of 0.75 m sqf. The following table sets out the land bank
of Frasers Centrepoint Homes for future projects as at 30 June 2013:
Sites Location Effecti
ve
intere
st (%)
Estimated
no. of
units
Land
Area (m
sqf)
Estimated
saleable
area (m
sqf)
Tenure
51 Cuppage
Road (formerly
known as
“Starhub
Centre”)
Orchard
Road100.0 249 0.07 0.24 Leasehold
Fernvale
Close(1)
Sengkan
g40.0 495 0.16 0.48 Leasehold
Holland ParkHolland
Village100.0 2 0.02 0.03 Freehold
Total 746 0.25 0.75
Note:
(1) Joint venture with Far East Orchard Limited (30%) and Sekisui House, Ltd. (30%).
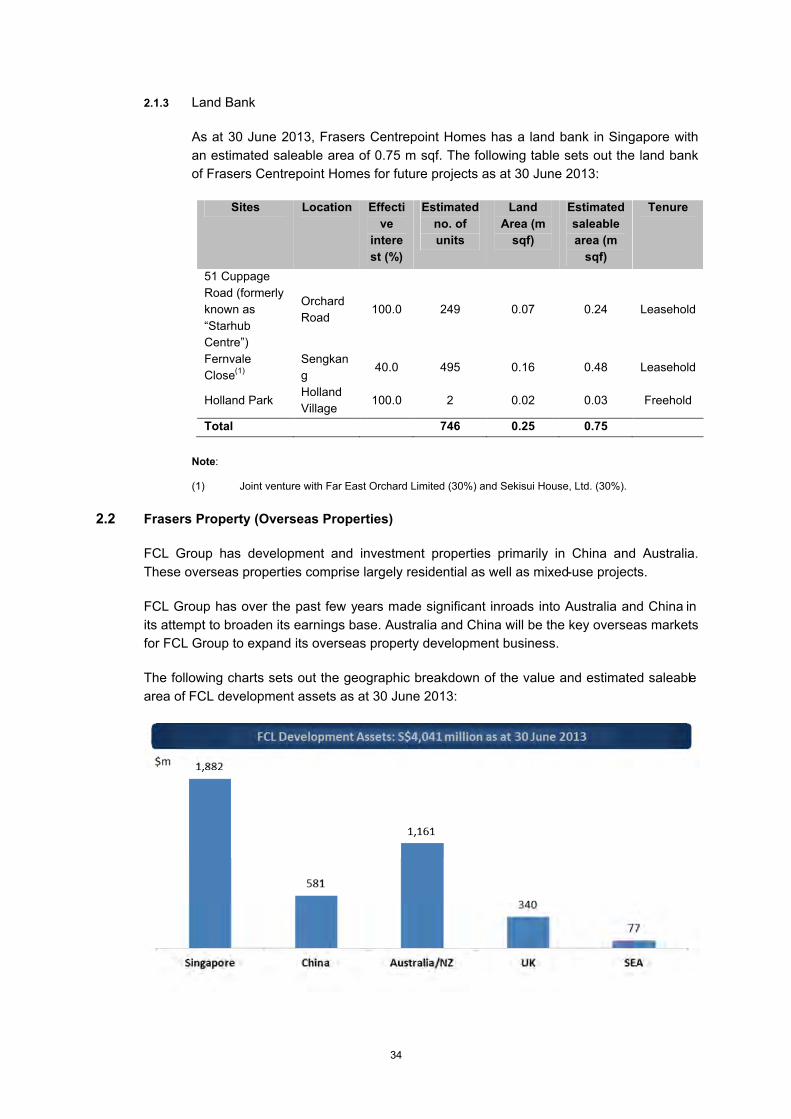
2.2 Frasers Property (Overseas Properties)
FCL Group has development and investment properties primarily in China and Australia.
These overseas properties comprise largely residential as well as mixed-use projects.
FCL Group has over the past few years made significant inroads into Australia and China in
its attempt to broaden its earnings base. Australia and China will be the key overseas markets
for FCL Group to expand its overseas property development business.
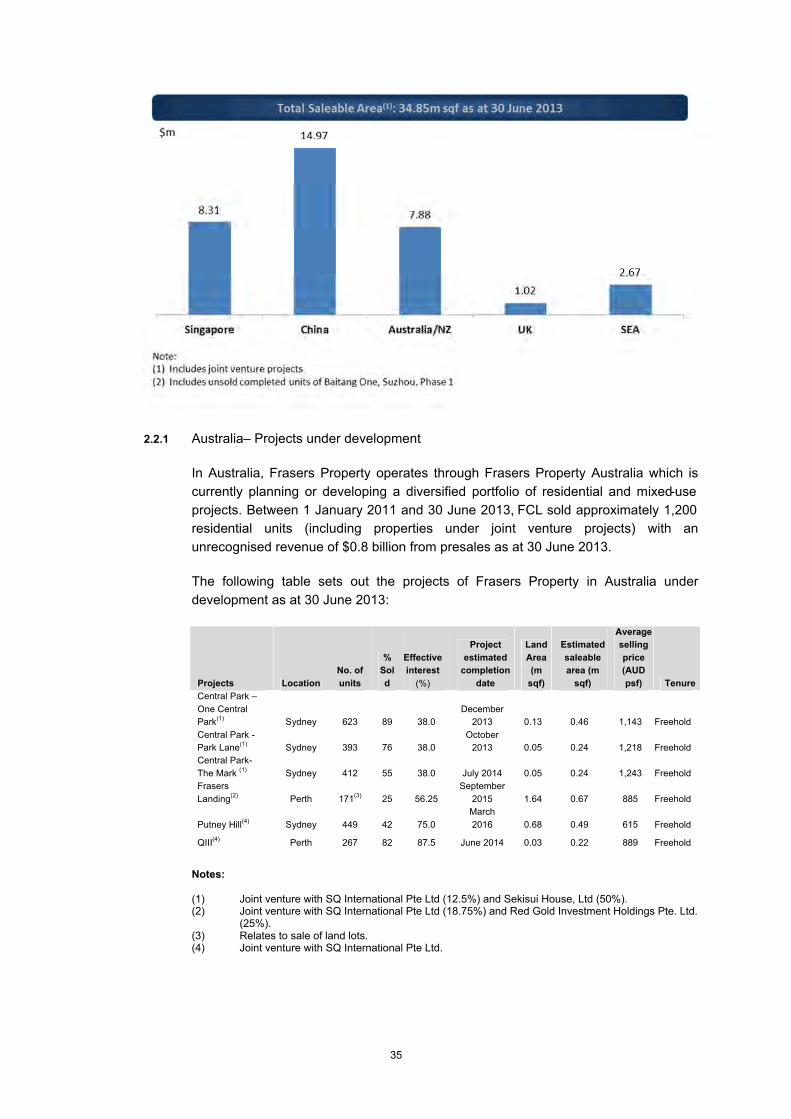
The following charts sets out the geographic breakdown of the value and estimated saleable
area of FCL development assets as at 30 June 2013:
35
2.2.1 Australia– Projects under development
In Australia, Frasers Property operates through Frasers Property Australia which is
currently planning or developing a diversified portfolio of residential and mixed-use
projects. Between 1 January 2011 and 30 June 2013, FCL sold approximately 1,200
residential units (including properties under joint venture projects) with an
unrecognised revenue of $0.8 billion from presales as at 30 June 2013.
The following table sets out the projects of Frasers Property in Australia under
development as at 30 June 2013:
Projects Location
No. of
units
%
Sol
d
Effective
interest
(%)
Project
estimated
completion
date
Land
Area
(m
sqf)
Estimated
saleable
area (m
sqf)
Average
selling
price
(AUD
psf) Tenure
Central Park –
One Central
Park(1)
Sydney 623 89 38.0
December
2013 0.13 0.46 1,143 Freehold
Central Park -
Park Lane(1) Sydney 393 76 38.0
October
2013 0.05 0.24 1,218 Freehold
Central Park-
The Mark (1) Sydney 412 55 38.0 July 2014 0.05 0.24 1,243 Freehold
Frasers
Landing(2)
Perth 171(3)
25 56.25
September
2015 1.64 0.67 885 Freehold
Putney Hill(4) Sydney 449 42 75.0
March
2016 0.68 0.49 615 Freehold
QIII(4)
Perth 267 82 87.5 June 2014 0.03 0.22 889 Freehold
Notes:
(1) Joint venture with SQ International Pte Ltd (12.5%) and Sekisui House, Ltd (50%).(2) Joint venture with SQ International Pte Ltd (18.75%) and Red Gold Investment Holdings Pte. Ltd.
(25%). (3) Relates to sale of land lots.(4) Joint venture with SQ International Pte Ltd.
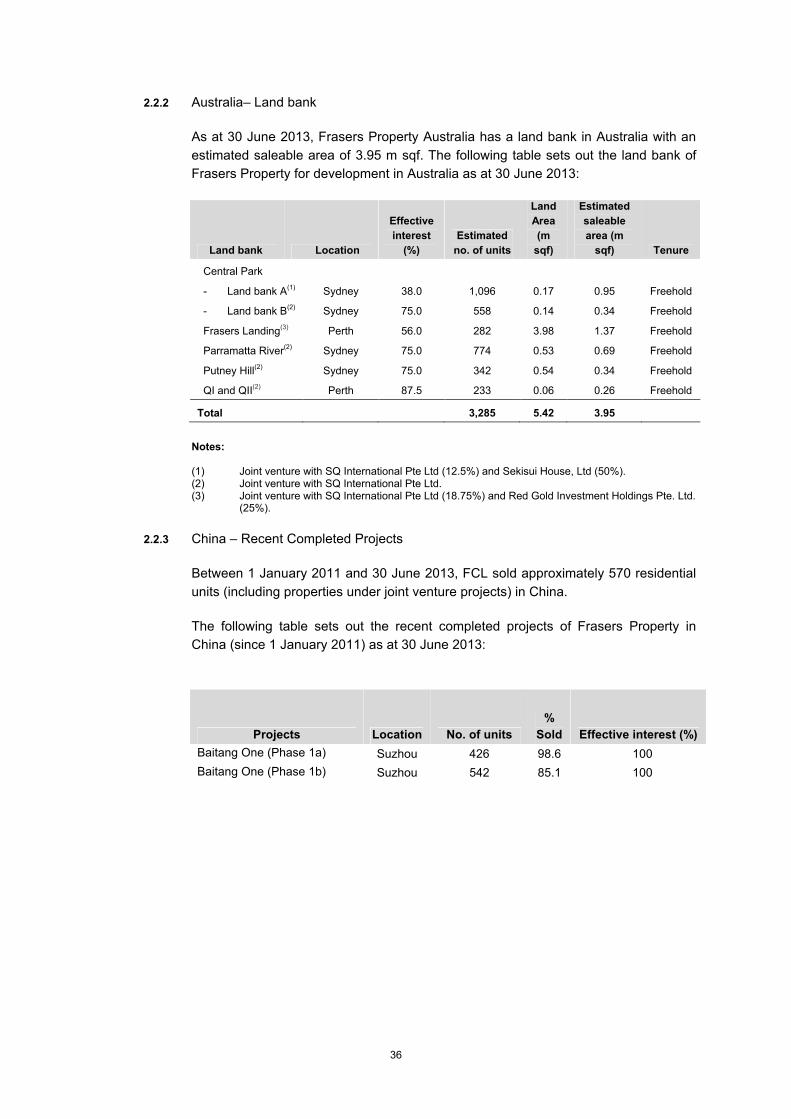
36
2.2.2 Australia– Land bank
As at 30 June 2013, Frasers Property Australia has a land bank in Australia with an
estimated saleable area of 3.95 m sqf. The following table sets out the land bank of
Frasers Property for development in Australia as at 30 June 2013:
Land bank Location
Effective
interest
(%)
Estimated
no. of units
Land
Area
(m
sqf)
Estimated
saleable
area (m
sqf) Tenure
Central Park
- Land bank A(1) Sydney 38.0 1,096 0.17 0.95 Freehold
- Land bank B(2) Sydney 75.0 558 0.14 0.34 Freehold
Frasers Landing(3) Perth 56.0 282 3.98 1.37 Freehold
Parramatta River(2) Sydney 75.0 774 0.53 0.69 Freehold
Putney Hill(2) Sydney 75.0 342 0.54 0.34 Freehold
QI and QII(2) Perth 87.5 233 0.06 0.26 Freehold
Total 3,285 5.42 3.95
Notes:
(1) Joint venture with SQ International Pte Ltd (12.5%) and Sekisui House, Ltd (50%).(2) Joint venture with SQ International Pte Ltd.(3) Joint venture with SQ International Pte Ltd (18.75%) and Red Gold Investment Holdings Pte. Ltd.
(25%).
2.2.3 China – Recent Completed Projects
Between 1 January 2011 and 30 June 2013, FCL sold approximately 570 residential
units (including properties under joint venture projects) in China.
The following table sets out the recent completed projects of Frasers Property in
China (since 1 January 2011) as at 30 June 2013:
Projects Location No. of units
%
Sold Effective interest (%)
Baitang One (Phase 1a) Suzhou 426 98.6 100
Baitang One (Phase 1b) Suzhou 542 85.1 100
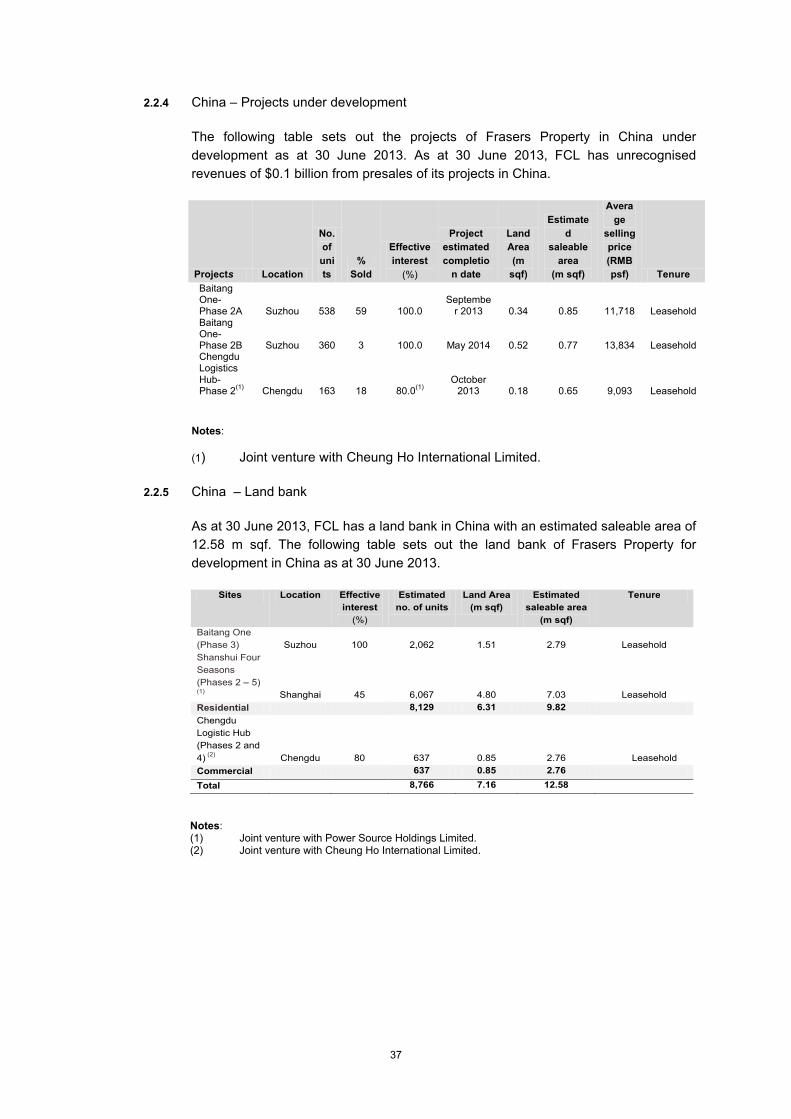
37
2.2.4 China – Projects under development
The following table sets out the projects of Frasers Property in China under
development as at 30 June 2013. As at 30 June 2013, FCL has unrecognised
revenues of $0.1 billion from presales of its projects in China.
Notes:
(1) Joint venture with Cheung Ho International Limited.
2.2.5 China – Land bank
As at 30 June 2013, FCL has a land bank in China with an estimated saleable area of
12.58 m sqf. The following table sets out the land bank of Frasers Property for
development in China as at 30 June 2013.
Notes:(1) Joint venture with Power Source Holdings Limited.(2) Joint venture with Cheung Ho International Limited.
Projects Location
No.
of
uni
ts
%
Sold
Effective
interest
(%)
Project
estimated
completio
n date
Land
Area
(m
sqf)
Estimate
d
saleable
area
(m sqf)
Avera
ge
selling
price
(RMB
psf) Tenure
Baitang One-Phase 2A Suzhou 538 59 100.0
September 2013 0.34 0.85 11,718 Leasehold
Baitang One-Phase 2B Suzhou 360 3 100.0 May 2014 0.52 0.77 13,834 LeaseholdChengdu Logistics Hub-Phase 2
(1)Chengdu 163 18 80.0
(1)October
2013 0.18 0.65 9,093 Leasehold
Sites Location Effective
interest
(%)
Estimated
no. of units
Land Area
(m sqf)
Estimated
saleable area
(m sqf)
Tenure
Baitang One
(Phase 3) Suzhou 100 2,062 1.51 2.79 Leasehold
Shanshui Four
Seasons
(Phases 2 – 5)(1) Shanghai 45 6,067 4.80 7.03 Leasehold
Residential 8,129 6.31 9.82
Chengdu
Logistic Hub
(Phases 2 and
4)(2)
Chengdu 80 637 0.85 2.76 Leasehold
Commercial 637 0.85 2.76
Total 8,766 7.16 12.58
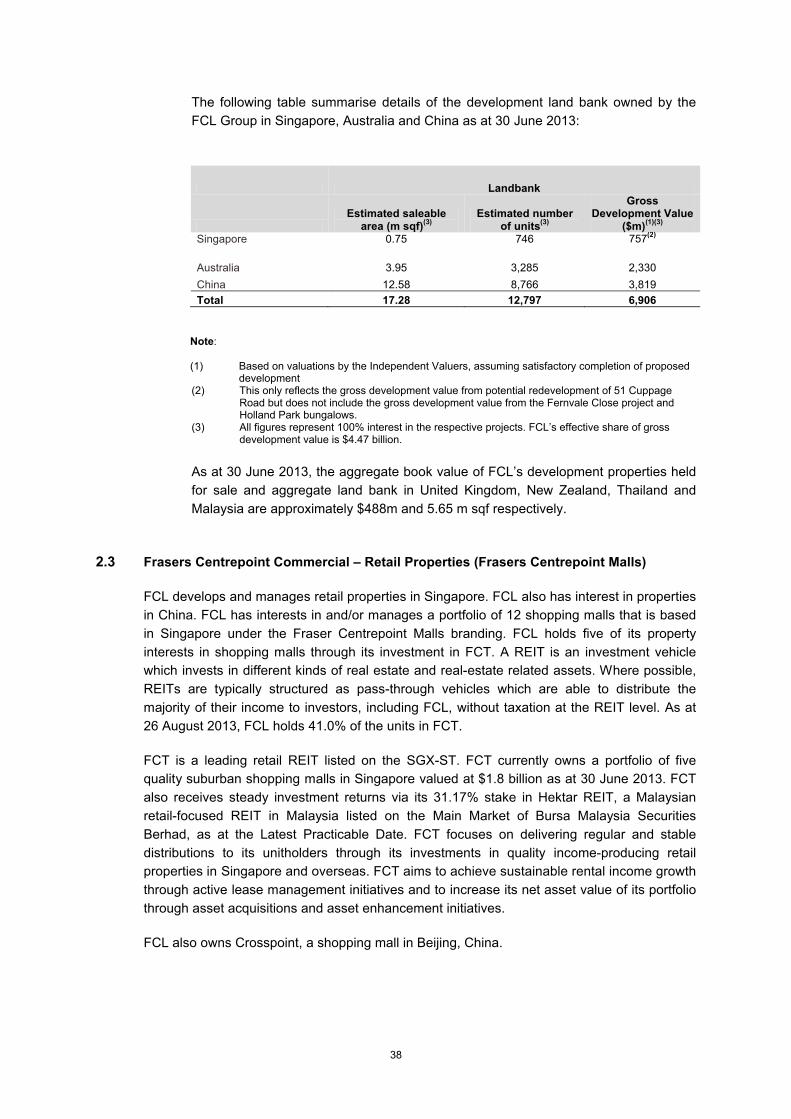
38
The following table summarise details of the development land bank owned by the
FCL Group in Singapore, Australia and China as at 30 June 2013:
Note:
(1) Based on valuations by the Independent Valuers, assuming satisfactory completion of proposed development
(2) This only reflects the gross development value from potential redevelopment of 51 Cuppage Road but does not include the gross development value from the Fernvale Close project and Holland Park bungalows.
(3) All figures represent 100% interest in the respective projects. FCL’s effective share of gross development value is $4.47 billion.
As at 30 June 2013, the aggregate book value of FCL’s development properties held
for sale and aggregate land bank in United Kingdom, New Zealand, Thailand and
Malaysia are approximately $488m and 5.65 m sqf respectively.
2.3 Frasers Centrepoint Commercial – Retail Properties (Frasers Centrepoint Malls)
FCL develops and manages retail properties in Singapore. FCL also has interest in properties
in China. FCL has interests in and/or manages a portfolio of 12 shopping malls that is based
in Singapore under the Fraser Centrepoint Malls branding. FCL holds five of its property
interests in shopping malls through its investment in FCT. A REIT is an investment vehicle
which invests in different kinds of real estate and real-estate related assets. Where possible,
REITs are typically structured as pass-through vehicles which are able to distribute the
majority of their income to investors, including FCL, without taxation at the REIT level. As at
26 August 2013, FCL holds 41.0% of the units in FCT.
FCT is a leading retail REIT listed on the SGX-ST. FCT currently owns a portfolio of five
quality suburban shopping malls in Singapore valued at $1.8 billion as at 30 June 2013. FCT
also receives steady investment returns via its 31.17% stake in Hektar REIT, a Malaysian
retail-focused REIT in Malaysia listed on the Main Market of Bursa Malaysia Securities
Berhad, as at the Latest Practicable Date. FCT focuses on delivering regular and stable
distributions to its unitholders through its investments in quality income-producing retail
properties in Singapore and overseas. FCT aims to achieve sustainable rental income growth
through active lease management initiatives and to increase its net asset value of its portfolio
through asset acquisitions and asset enhancement initiatives.
FCL also owns Crosspoint, a shopping mall in Beijing, China.
Landbank
Estimated saleable area (m sqf)
(3)Estimated number
of units(3)
Gross Development Value
($m)(1)(3)
Singapore 0.75 746 757(2)
Australia 3.95 3,285 2,330
China 12.58 8,766 3,819
Total 17.28 12,797 6,906
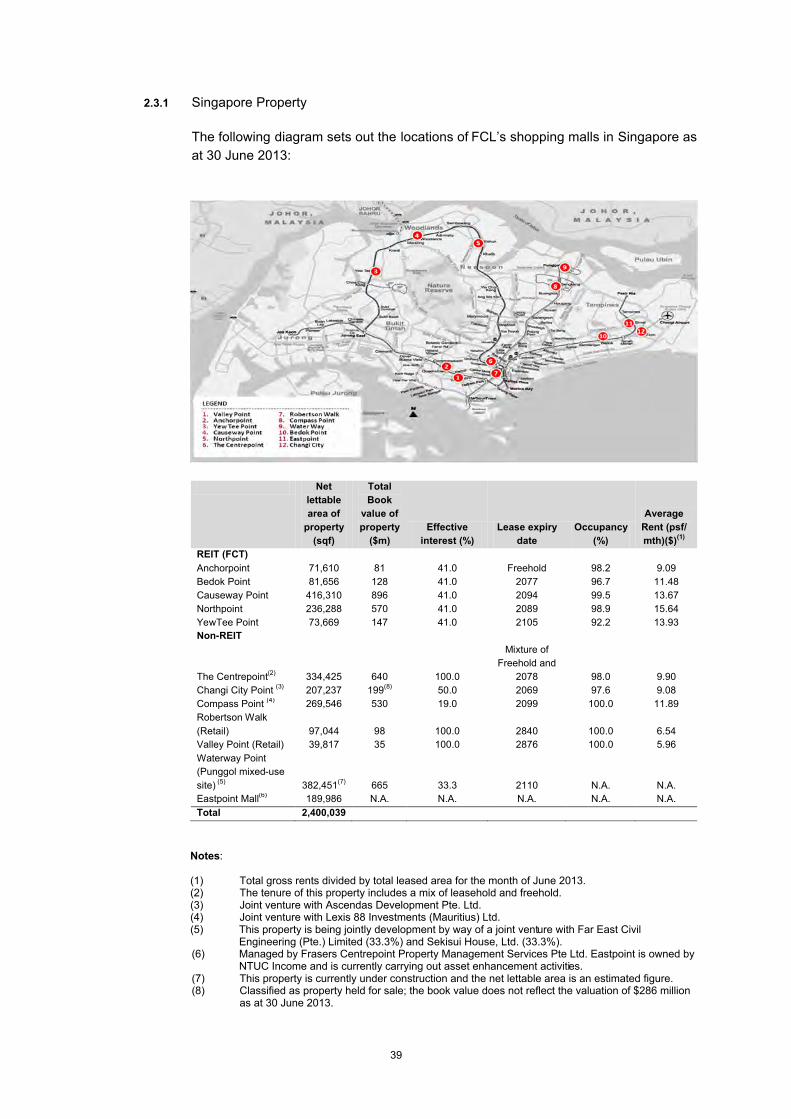
39
2.3.1 Singapore Property
The following diagram sets out the locations of FCL’s shopping malls in Singapore as
at 30 June 2013:
Notes:
(1) Total gross rents divided by total leased area for the month of June 2013.(2) The tenure of this property includes a mix of leasehold and freehold.(3) Joint venture with Ascendas Development Pte. Ltd. (4) Joint venture with Lexis 88 Investments (Mauritius) Ltd. (5) This property is being jointly development by way of a joint venture with Far East Civil
Engineering (Pte.) Limited (33.3%) and Sekisui House, Ltd. (33.3%). (6) Managed by Frasers Centrepoint Property Management Services Pte Ltd. Eastpoint is owned by
NTUC Income and is currently carrying out asset enhancement activities.(7) This property is currently under construction and the net lettable area is an estimated figure.(8) Classified as property held for sale; the book value does not reflect the valuation of $286 million
as at 30 June 2013.
Net
lettable
area of
property
(sqf)
Total
Book
value of
property
($m)
Effective
interest (%)
Lease expiry
date
Occupancy
(%)
Average
Rent (psf/
mth)($)(1)
REIT (FCT)
Anchorpoint 71,610 81 41.0 Freehold 98.2 9.09
Bedok Point 81,656 128 41.0 2077 96.7 11.48
Causeway Point 416,310 896 41.0 2094 99.5 13.67
Northpoint 236,288 570 41.0 2089 98.9 15.64
YewTee Point 73,669 147 41.0 2105 92.2 13.93
Non-REIT
The Centrepoint(2)
334,425 640 100.0
Mixture of
Freehold and
2078 98.0 9.90
Changi City Point (3)
207,237 199(8)
50.0 2069 97.6 9.08
Compass Point (4)
269,546 530 19.0 2099 100.0 11.89
Robertson Walk
(Retail) 97,044 98 100.0 2840 100.0 6.54
Valley Point (Retail) 39,817 35 100.0 2876 100.0 5.96
Waterway Point
(Punggol mixed-use
site)(5)
382,451(7)
665 33.3 2110 N.A. N.A.
Eastpoint Mall(6)
189,986 N.A. N.A. N.A. N.A. N.A.
Total 2,400,039
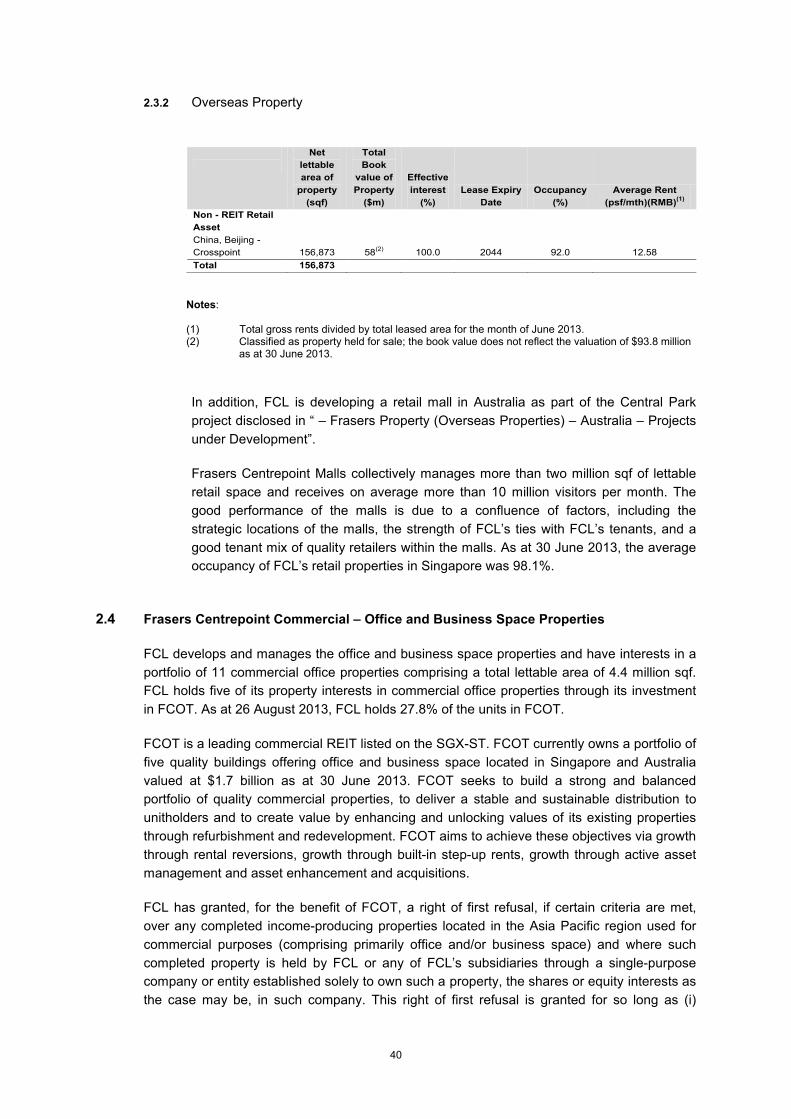
40
2.3.2 Overseas Property
Notes:
(1) Total gross rents divided by total leased area for the month of June 2013.(2) Classified as property held for sale; the book value does not reflect the valuation of $93.8 million
as at 30 June 2013.
In addition, FCL is developing a retail mall in Australia as part of the Central Park
project disclosed in “ – Frasers Property (Overseas Properties) – Australia – Projects
under Development”.
Frasers Centrepoint Malls collectively manages more than two million sqf of lettable
retail space and receives on average more than 10 million visitors per month. The
good performance of the malls is due to a confluence of factors, including the
strategic locations of the malls, the strength of FCL’s ties with FCL’s tenants, and a
good tenant mix of quality retailers within the malls. As at 30 June 2013, the average
occupancy of FCL’s retail properties in Singapore was 98.1%.
2.4 Frasers Centrepoint Commercial – Office and Business Space Properties
FCL develops and manages the office and business space properties and have interests in a
portfolio of 11 commercial office properties comprising a total lettable area of 4.4 million sqf.
FCL holds five of its property interests in commercial office properties through its investment
in FCOT. As at 26 August 2013, FCL holds 27.8% of the units in FCOT.
FCOT is a leading commercial REIT listed on the SGX-ST. FCOT currently owns a portfolio of
five quality buildings offering office and business space located in Singapore and Australia
valued at $1.7 billion as at 30 June 2013. FCOT seeks to build a strong and balanced
portfolio of quality commercial properties, to deliver a stable and sustainable distribution to
unitholders and to create value by enhancing and unlocking values of its existing properties
through refurbishment and redevelopment. FCOT aims to achieve these objectives via growth
through rental reversions, growth through built-in step-up rents, growth through active asset
management and asset enhancement and acquisitions.
FCL has granted, for the benefit of FCOT, a right of first refusal, if certain criteria are met,
over any completed income-producing properties located in the Asia Pacific region used for
commercial purposes (comprising primarily office and/or business space) and where such
completed property is held by FCL or any of FCL’s subsidiaries through a single-purpose
company or entity established solely to own such a property, the shares or equity interests as
the case may be, in such company. This right of first refusal is granted for so long as (i)
Net
lettable
area of
property
(sqf)
Total
Book
value of
Property
($m)
Effective
interest
(%)
Lease Expiry
Date
Occupancy
(%)
Average Rent
(psf/mth)(RMB)(1)
Non - REIT Retail
Asset
China, Beijing -
Crosspoint 156,873 58(2) 100.0 2044 92.0 12.58
Total 156,873
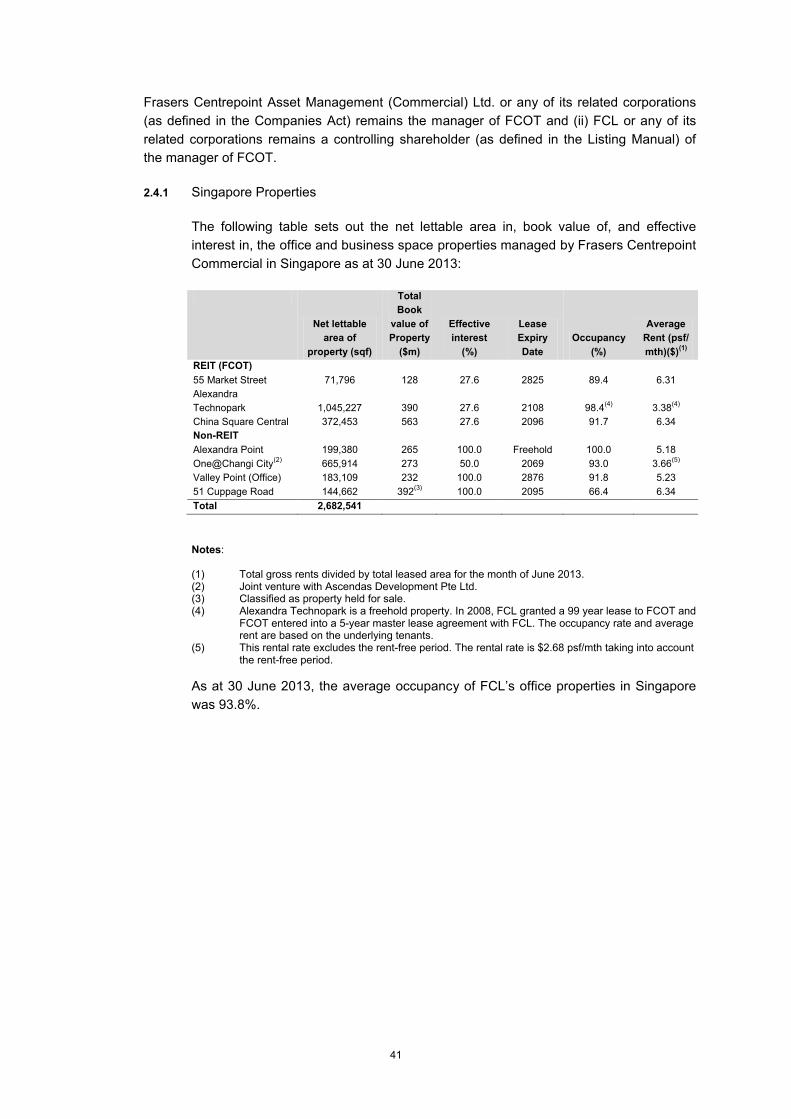
41
Frasers Centrepoint Asset Management (Commercial) Ltd. or any of its related corporations
(as defined in the Companies Act) remains the manager of FCOT and (ii) FCL or any of its
related corporations remains a controlling shareholder (as defined in the Listing Manual) of
the manager of FCOT.
2.4.1 Singapore Properties
The following table sets out the net lettable area in, book value of, and effective
interest in, the office and business space properties managed by Frasers Centrepoint
Commercial in Singapore as at 30 June 2013:
Notes:
(1) Total gross rents divided by total leased area for the month of June 2013.(2) Joint venture with Ascendas Development Pte Ltd.(3) Classified as property held for sale. (4) Alexandra Technopark is a freehold property. In 2008, FCL granted a 99 year lease to FCOT and
FCOT entered into a 5-year master lease agreement with FCL. The occupancy rate and average rent are based on the underlying tenants.
(5) This rental rate excludes the rent-free period. The rental rate is $2.68 psf/mth taking into account the rent-free period.
As at 30 June 2013, the average occupancy of FCL’s office properties in Singapore
was 93.8%.
Net lettable
area of
property (sqf)
Total
Book
value of
Property
($m)
Effective
interest
(%)
Lease
Expiry
Date
Occupancy
(%)
Average
Rent (psf/
mth)($)(1)
REIT (FCOT)
55 Market Street 71,796 128 27.6 2825 89.4 6.31
Alexandra
Technopark 1,045,227 390 27.6 2108 98.4(4)
3.38(4)
China Square Central 372,453 563 27.6 2096 91.7 6.34
Non-REIT
Alexandra Point 199,380 265 100.0 Freehold 100.0 5.18
One@Changi City(2)
665,914 273 50.0 2069 93.0 3.66(5)
Valley Point (Office) 183,109 232 100.0 2876 91.8 5.23
51 Cuppage Road 144,662 392(3)
100.0 2095 66.4 6.34
Total 2,682,541
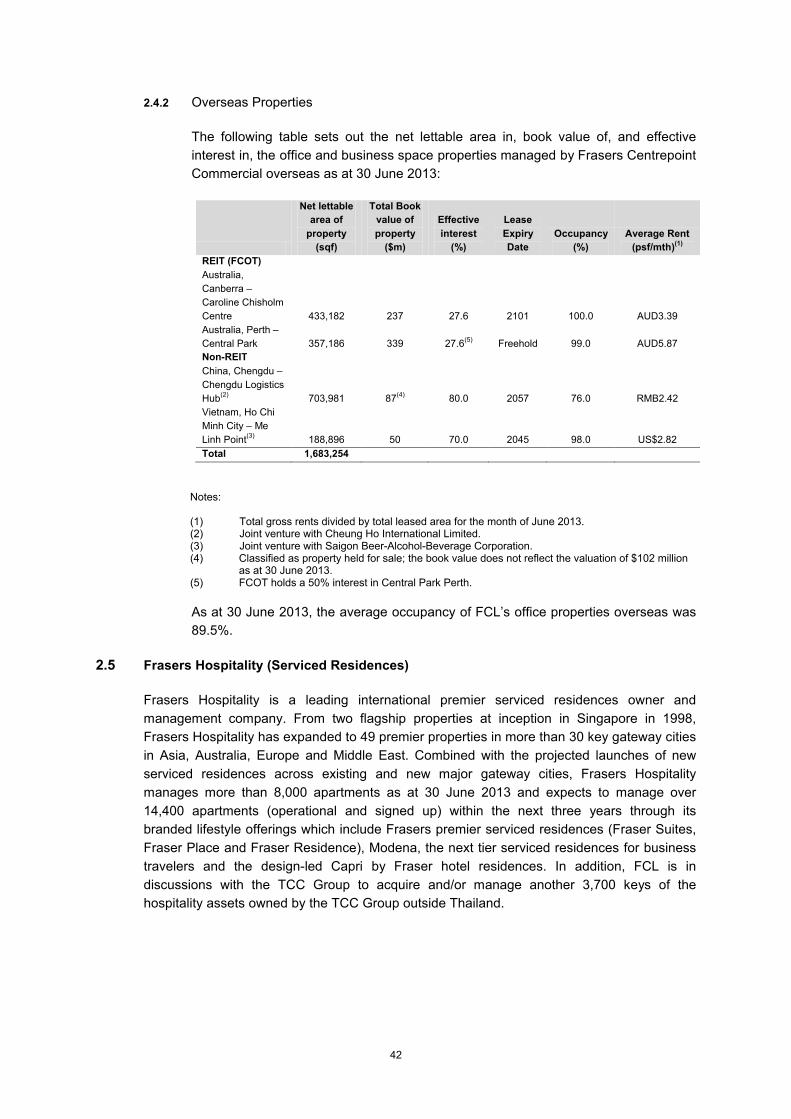
42
2.4.2 Overseas Properties
The following table sets out the net lettable area in, book value of, and effective
interest in, the office and business space properties managed by Frasers Centrepoint
Commercial overseas as at 30 June 2013:
Notes:
(1) Total gross rents divided by total leased area for the month of June 2013.(2) Joint venture with Cheung Ho International Limited.(3) Joint venture with Saigon Beer-Alcohol-Beverage Corporation.(4) Classified as property held for sale; the book value does not reflect the valuation of $102 million
as at 30 June 2013. (5) FCOT holds a 50% interest in Central Park Perth.
As at 30 June 2013, the average occupancy of FCL’s office properties overseas was
89.5%.
2.5 Frasers Hospitality (Serviced Residences)
Frasers Hospitality is a leading international premier serviced residences owner and
management company. From two flagship properties at inception in Singapore in 1998,
Frasers Hospitality has expanded to 49 premier properties in more than 30 key gateway cities
in Asia, Australia, Europe and Middle East. Combined with the projected launches of new
serviced residences across existing and new major gateway cities, Frasers Hospitality
manages more than 8,000 apartments as at 30 June 2013 and expects to manage over
14,400 apartments (operational and signed up) within the next three years through its
branded lifestyle offerings which include Frasers premier serviced residences (Fraser Suites,
Fraser Place and Fraser Residence), Modena, the next tier serviced residences for business
travelers and the design-led Capri by Fraser hotel residences. In addition, FCL is in
discussions with the TCC Group to acquire and/or manage another 3,700 keys of the
hospitality assets owned by the TCC Group outside Thailand.
Net lettable
area of
property
(sqf)
Total Book
value of
property
($m)
Effective
interest
(%)
Lease
Expiry
Date
Occupancy
(%)
Average Rent
(psf/mth)(1)
REIT (FCOT)
Australia,
Canberra –
Caroline Chisholm
Centre 433,182 237 27.6 2101 100.0 AUD3.39
Australia, Perth –
Central Park 357,186 339 27.6(5) Freehold 99.0 AUD5.87
Non-REIT
China, Chengdu –
Chengdu Logistics
Hub(2) 703,981 87(4) 80.0 2057 76.0 RMB2.42
Vietnam, Ho Chi
Minh City – Me
Linh Point(3)
188,896 50 70.0 2045 98.0 US$2.82
Total 1,683,254
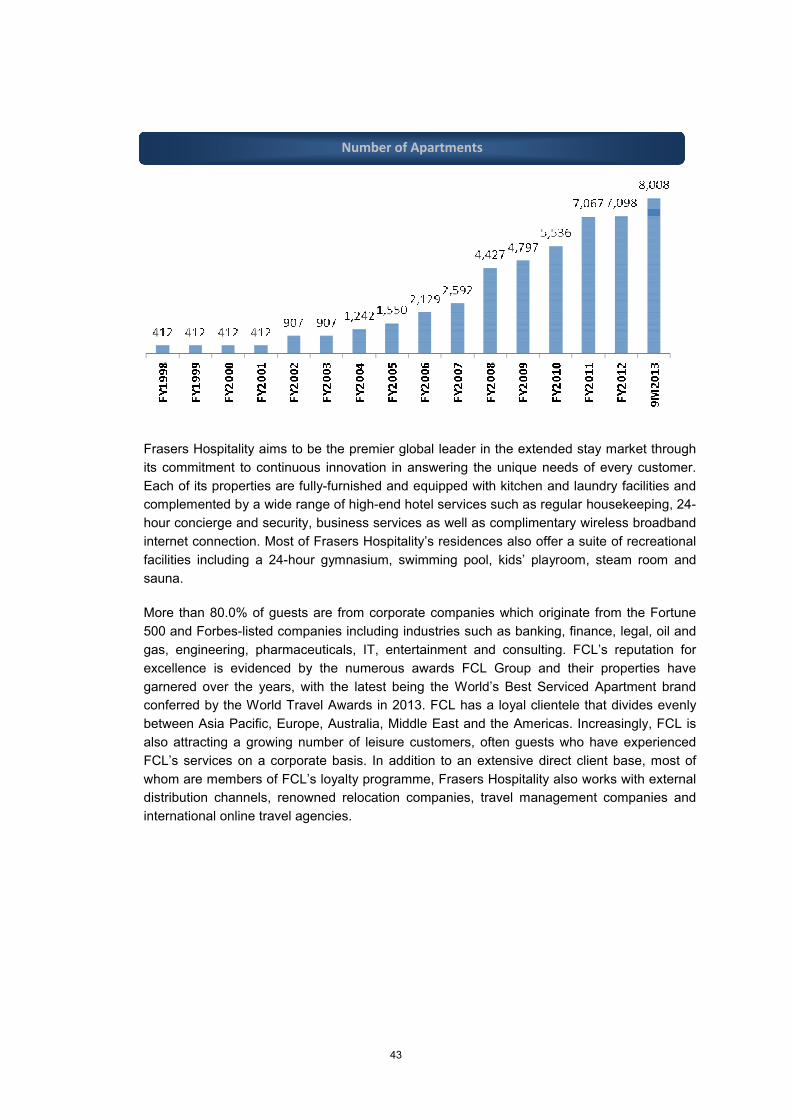
43
Frasers Hospitality aims to be the premier global leader in the extended stay market through
its commitment to continuous innovation in answering the unique needs of every customer.
Each of its properties are fully-furnished and equipped with kitchen and laundry facilities and
complemented by a wide range of high-end hotel services such as regular housekeeping, 24-
hour concierge and security, business services as well as complimentary wireless broadband
internet connection. Most of Frasers Hospitality’s residences also offer a suite of recreational
facilities including a 24-hour gymnasium, swimming pool, kids’ playroom, steam room and
sauna.
More than 80.0% of guests are from corporate companies which originate from the Fortune
500 and Forbes-listed companies including industries such as banking, finance, legal, oil and
gas, engineering, pharmaceuticals, IT, entertainment and consulting. FCL’s reputation for
excellence is evidenced by the numerous awards FCL Group and their properties have
garnered over the years, with the latest being the World’s Best Serviced Apartment brand
conferred by the World Travel Awards in 2013. FCL has a loyal clientele that divides evenly
between Asia Pacific, Europe, Australia, Middle East and the Americas. Increasingly, FCL is
also attracting a growing number of leisure customers, often guests who have experienced
FCL’s services on a corporate basis. In addition to an extensive direct client base, most of
whom are members of FCL’s loyalty programme, Frasers Hospitality also works with external
distribution channels, renowned relocation companies, travel management companies and
international online travel agencies.
Number of Apartments
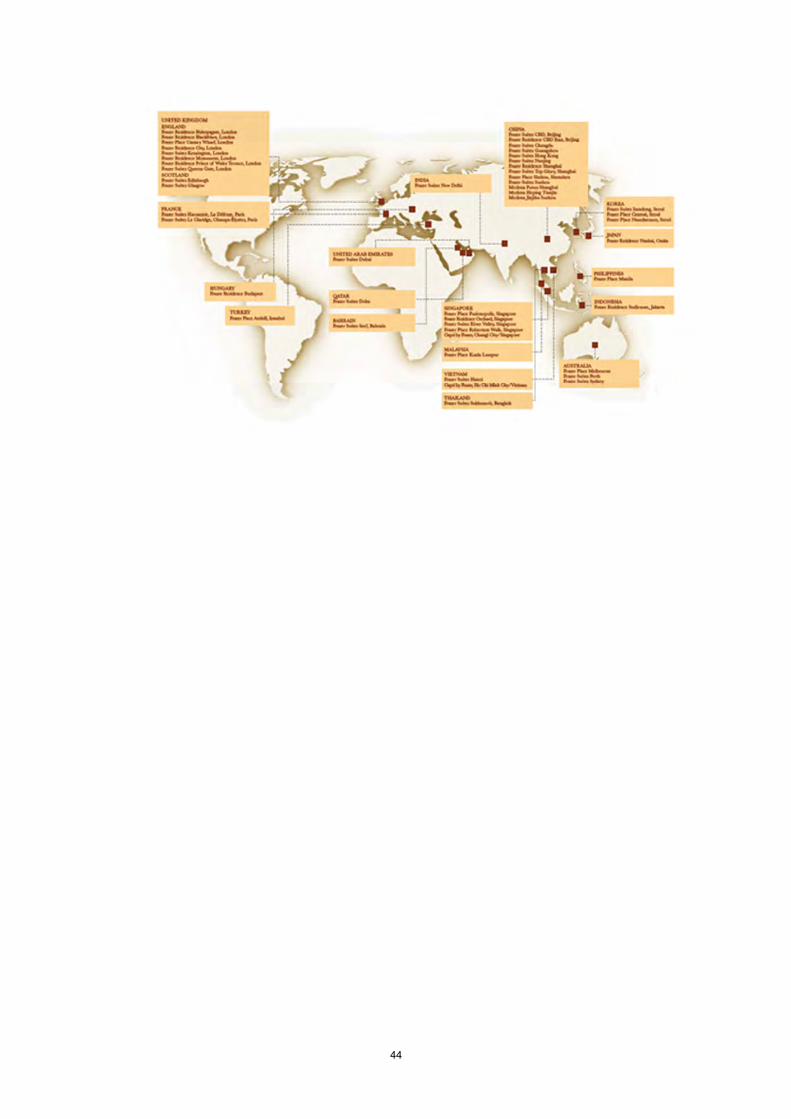
44
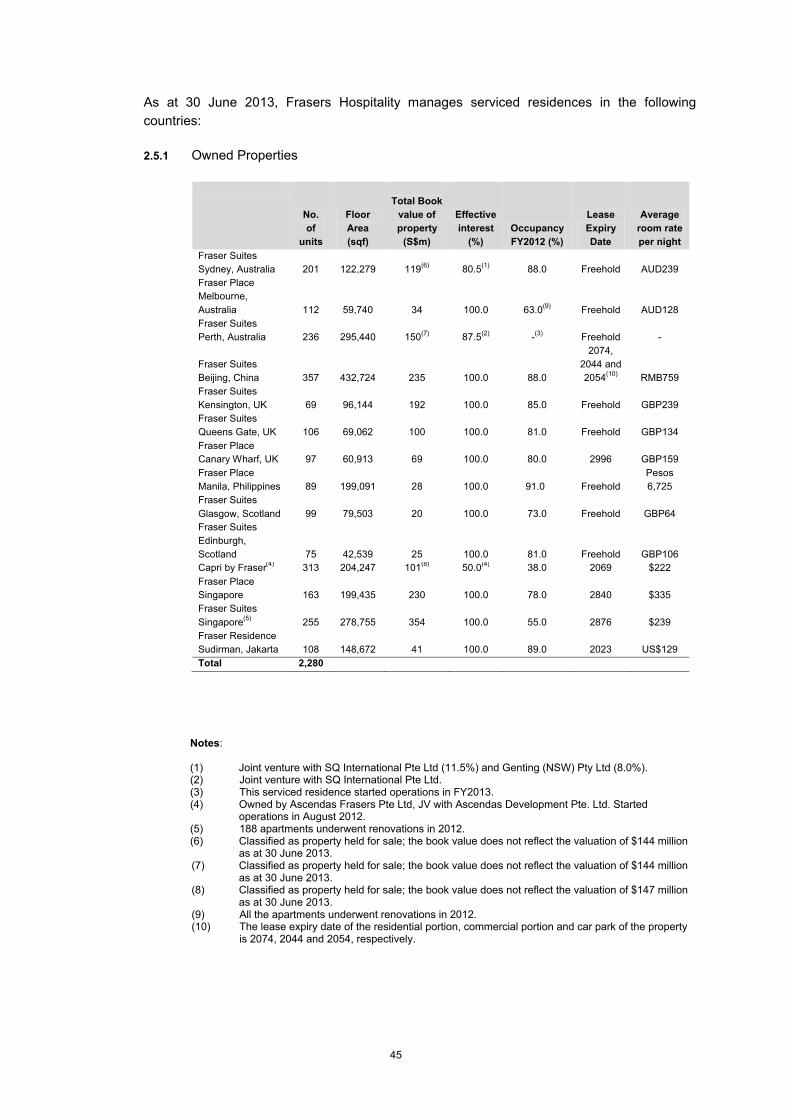
45
As at 30 June 2013, Frasers Hospitality manages serviced residences in the following
countries:
2.5.1 Owned Properties
Notes:
(1) Joint venture with SQ International Pte Ltd (11.5%) and Genting (NSW) Pty Ltd (8.0%).(2) Joint venture with SQ International Pte Ltd.(3) This serviced residence started operations in FY2013. (4) Owned by Ascendas Frasers Pte Ltd, JV with Ascendas Development Pte. Ltd. Started
operations in August 2012.(5) 188 apartments underwent renovations in 2012.(6) Classified as property held for sale; the book value does not reflect the valuation of $144 million
as at 30 June 2013. (7) Classified as property held for sale; the book value does not reflect the valuation of $144 million
as at 30 June 2013.(8) Classified as property held for sale; the book value does not reflect the valuation of $147 million
as at 30 June 2013.(9) All the apartments underwent renovations in 2012.(10) The lease expiry date of the residential portion, commercial portion and car park of the property
is 2074, 2044 and 2054, respectively.
No.
of
units
Floor
Area
(sqf)
Total Book
value of
property
(S$m)
Effective
interest
(%)
Occupancy
FY2012 (%)
Lease
Expiry
Date
Average
room rate
per night
Fraser Suites
Sydney, Australia 201 122,279 119(6)
80.5(1)
88.0 Freehold AUD239
Fraser Place
Melbourne,
Australia 112 59,740 34 100.0 63.0(9)
Freehold AUD128
Fraser Suites
Perth, Australia 236 295,440 150(7)
87.5(2)
-(3)
Freehold -
Fraser Suites
Beijing, China 357 432,724 235 100.0 88.0
2074,
2044 and
2054(10)
RMB759
Fraser Suites
Kensington, UK 69 96,144 192 100.0 85.0 Freehold GBP239
Fraser Suites
Queens Gate, UK 106 69,062 100 100.0 81.0 Freehold GBP134
Fraser Place
Canary Wharf, UK 97 60,913 69 100.0 80.0 2996 GBP159
Fraser Place
Manila, Philippines 89 199,091 28 100.0 91.0 Freehold
Pesos
6,725
Fraser Suites
Glasgow, Scotland 99 79,503 20 100.0 73.0 Freehold GBP64
Fraser Suites
Edinburgh,
Scotland 75 42,539 25 100.0 81.0 Freehold GBP106
Capri by Fraser(4)
313 204,247 101(8)
50.0(4)
38.0 2069 $222
Fraser Place
Singapore 163 199,435 230 100.0 78.0 2840 $335
Fraser Suites
Singapore(5)
255 278,755 354 100.0 55.0 2876 $239
Fraser Residence
Sudirman, Jakarta 108 148,672 41 100.0 89.0 2023 US$129
Total 2,280
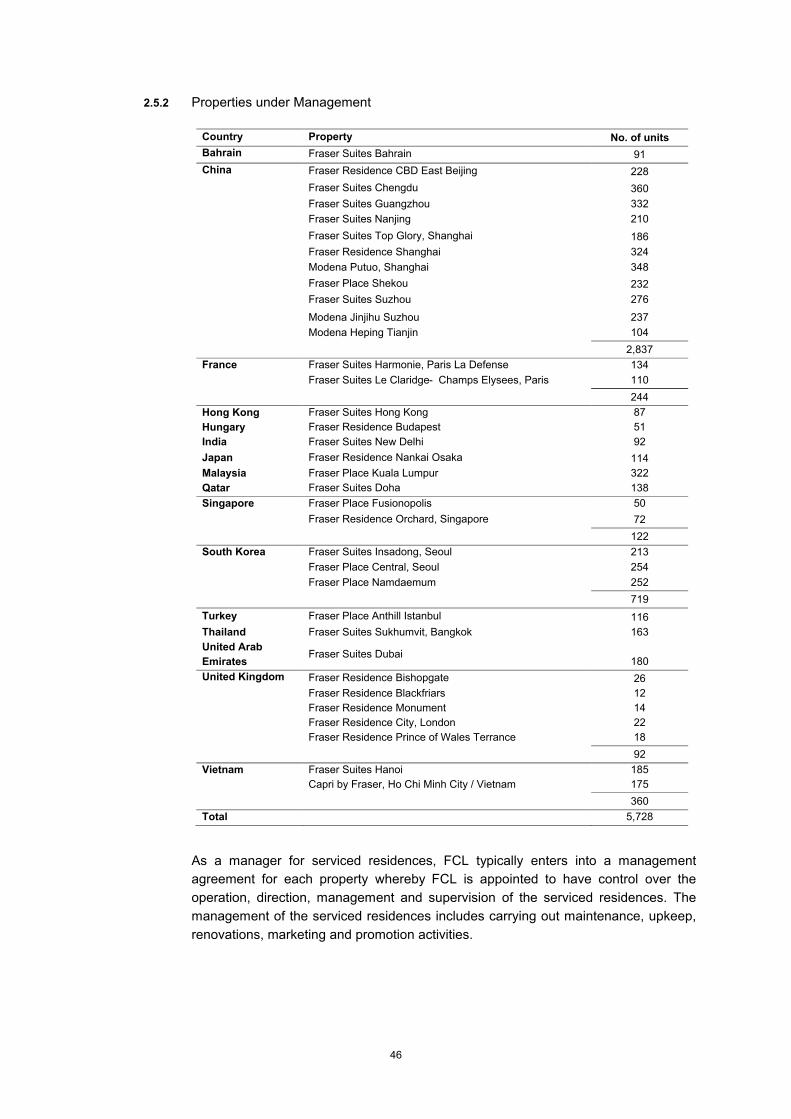
46
2.5.2 Properties under Management
As a manager for serviced residences, FCL typically enters into a management
agreement for each property whereby FCL is appointed to have control over the
operation, direction, management and supervision of the serviced residences. The
management of the serviced residences includes carrying out maintenance, upkeep,
renovations, marketing and promotion activities.
Country Property No. of units
Bahrain Fraser Suites Bahrain 91
China Fraser Residence CBD East Beijing 228
Fraser Suites Chengdu 360
Fraser Suites Guangzhou 332
Fraser Suites Nanjing 210
Fraser Suites Top Glory, Shanghai 186
Fraser Residence Shanghai 324
Modena Putuo, Shanghai 348
Fraser Place Shekou 232
Fraser Suites Suzhou 276
Modena Jinjihu Suzhou 237
Modena Heping Tianjin 104
2,837
France Fraser Suites Harmonie, Paris La Defense 134
Fraser Suites Le Claridge- Champs Elysees, Paris 110
244
Hong Kong Fraser Suites Hong Kong 87
Hungary Fraser Residence Budapest 51
India Fraser Suites New Delhi 92
Japan Fraser Residence Nankai Osaka 114
Malaysia Fraser Place Kuala Lumpur 322
Qatar Fraser Suites Doha 138
Singapore Fraser Place Fusionopolis 50
Fraser Residence Orchard, Singapore 72
122
South Korea Fraser Suites Insadong, Seoul 213
Fraser Place Central, Seoul 254
Fraser Place Namdaemum 252
719
Turkey Fraser Place Anthill Istanbul 116
Thailand Fraser Suites Sukhumvit, Bangkok 163
United Arab
EmiratesFraser Suites Dubai
180
United Kingdom Fraser Residence Bishopgate 26
Fraser Residence Blackfriars 12
Fraser Residence Monument 14
Fraser Residence City, London 22
Fraser Residence Prince of Wales Terrance 18
92
Vietnam Fraser Suites Hanoi 185
Capri by Fraser, Ho Chi Minh City / Vietnam 175
360
Total 5,728
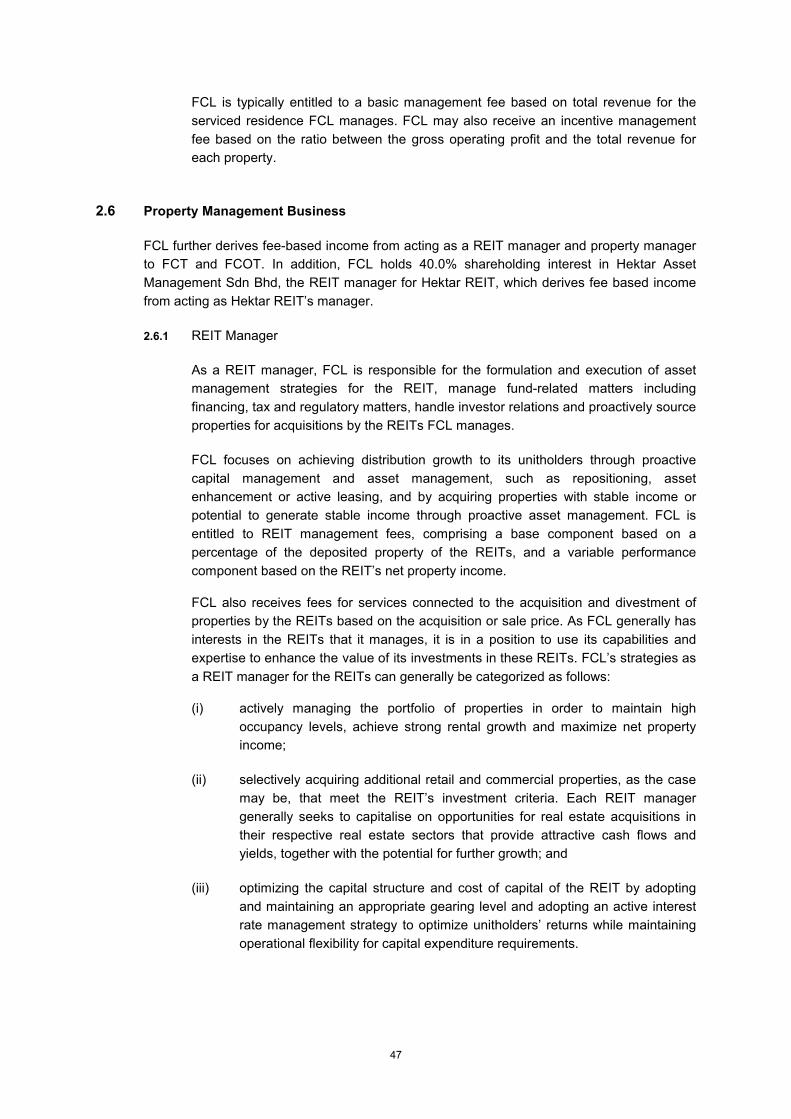
47
FCL is typically entitled to a basic management fee based on total revenue for the
serviced residence FCL manages. FCL may also receive an incentive management
fee based on the ratio between the gross operating profit and the total revenue for
each property.
2.6 Property Management Business
FCL further derives fee-based income from acting as a REIT manager and property manager
to FCT and FCOT. In addition, FCL holds 40.0% shareholding interest in Hektar Asset
Management Sdn Bhd, the REIT manager for Hektar REIT, which derives fee based income
from acting as Hektar REIT’s manager.
2.6.1 REIT Manager
As a REIT manager, FCL is responsible for the formulation and execution of asset
management strategies for the REIT, manage fund-related matters including
financing, tax and regulatory matters, handle investor relations and proactively source
properties for acquisitions by the REITs FCL manages.
FCL focuses on achieving distribution growth to its unitholders through proactive
capital management and asset management, such as repositioning, asset
enhancement or active leasing, and by acquiring properties with stable income or
potential to generate stable income through proactive asset management. FCL is
entitled to REIT management fees, comprising a base component based on a
percentage of the deposited property of the REITs, and a variable performance
component based on the REIT’s net property income.
FCL also receives fees for services connected to the acquisition and divestment of
properties by the REITs based on the acquisition or sale price. As FCL generally has
interests in the REITs that it manages, it is in a position to use its capabilities and
expertise to enhance the value of its investments in these REITs. FCL’s strategies as
a REIT manager for the REITs can generally be categorized as follows:
(i) actively managing the portfolio of properties in order to maintain high
occupancy levels, achieve strong rental growth and maximize net property
income;
(ii) selectively acquiring additional retail and commercial properties, as the case
may be, that meet the REIT’s investment criteria. Each REIT manager
generally seeks to capitalise on opportunities for real estate acquisitions in
their respective real estate sectors that provide attractive cash flows and
yields, together with the potential for further growth; and
(iii) optimizing the capital structure and cost of capital of the REIT by adopting
and maintaining an appropriate gearing level and adopting an active interest
rate management strategy to optimize unitholders’ returns while maintaining
operational flexibility for capital expenditure requirements.
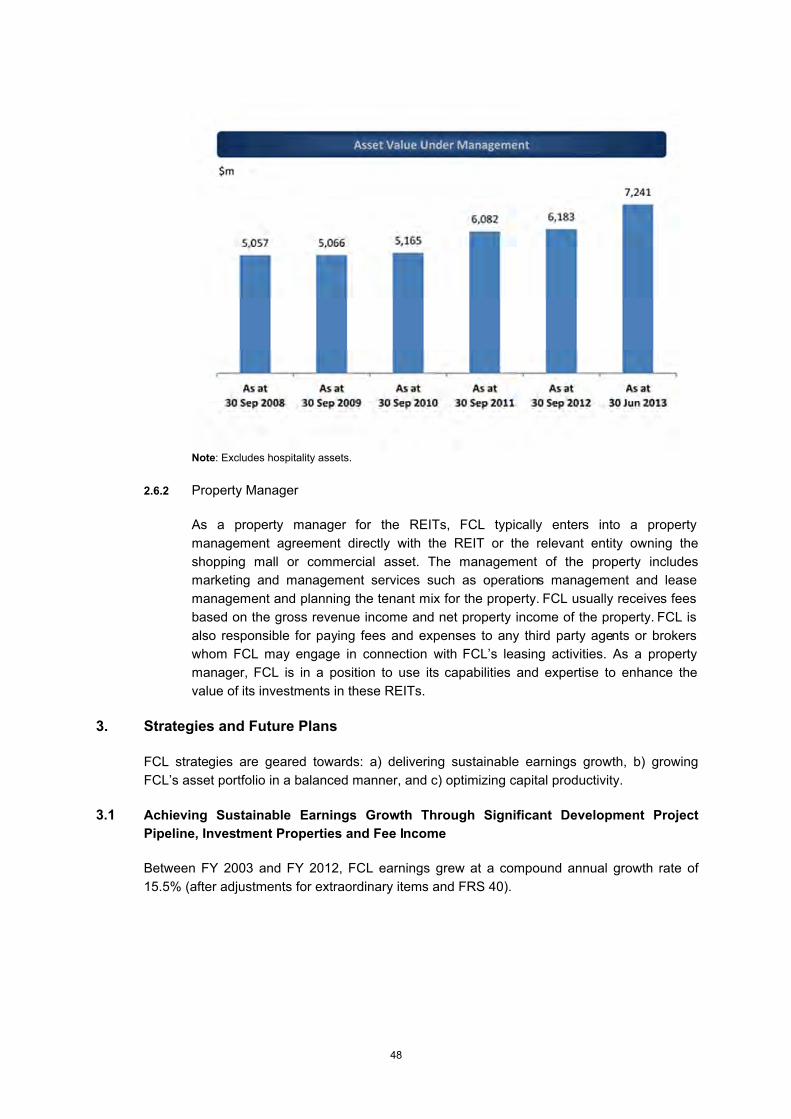
48
Note: Excludes hospitality assets.
2.6.2 Property Manager
As a property manager for the REITs, FCL typically enters into a property
management agreement directly with the REIT or the relevant entity owning the
shopping mall or commercial asset. The management of the property includes
marketing and management services such as operations management and lease
management and planning the tenant mix for the property. FCL usually receives fees
based on the gross revenue income and net property income of the property. FCL is
also responsible for paying fees and expenses to any third party agents or brokers
whom FCL may engage in connection with FCL’s leasing activities. As a property
manager, FCL is in a position to use its capabilities and expertise to enhance the
value of its investments in these REITs.
3. Strategies and Future Plans
FCL strategies are geared towards: a) delivering sustainable earnings growth, b) growing
FCL’s asset portfolio in a balanced manner, and c) optimizing capital productivity.
3.1 Achieving Sustainable Earnings Growth Through Significant Development Project
Pipeline, Investment Properties and Fee Income
Between FY 2003 and FY 2012, FCL earnings grew at a compound annual growth rate of
15.5% (after adjustments for extraordinary items and FRS 40).
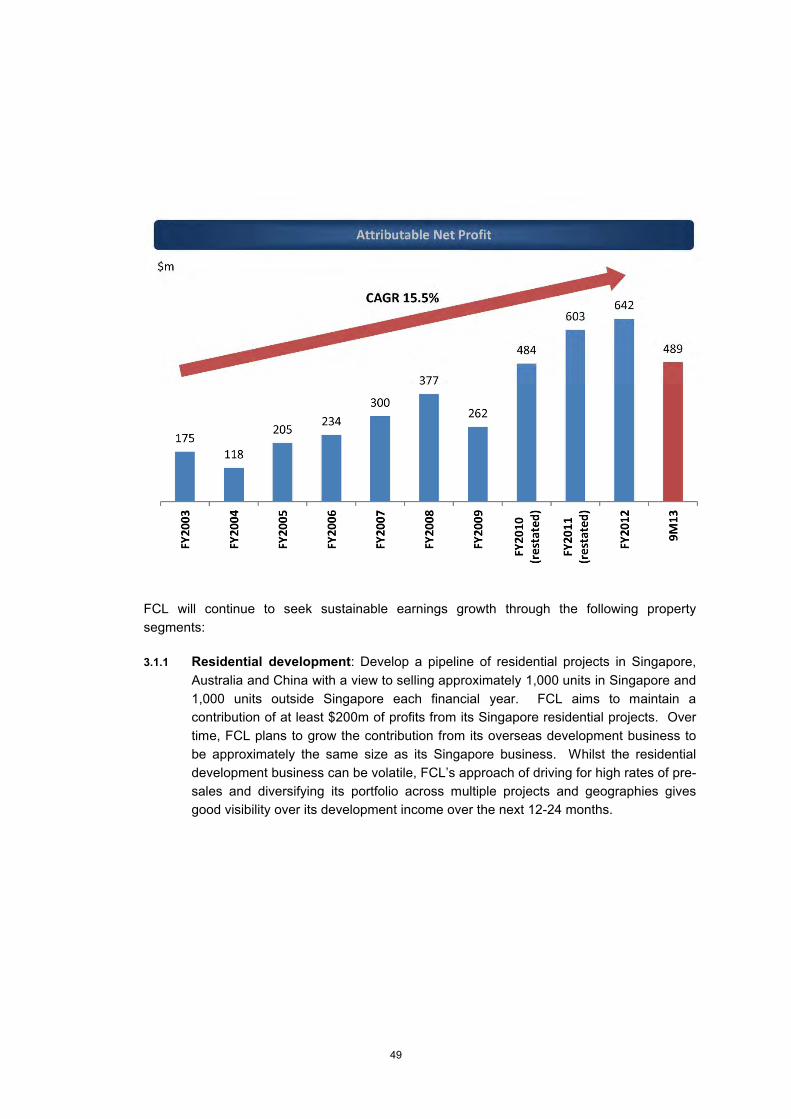
49
FCL will continue to seek sustainable earnings growth through the following property
segments:
3.1.1 Residential development: Develop a pipeline of residential projects in Singapore,
Australia and China with a view to selling approximately 1,000 units in Singapore and
1,000 units outside Singapore each financial year. FCL aims to maintain a
contribution of at least $200m of profits from its Singapore residential projects. Over
time, FCL plans to grow the contribution from its overseas development business to
be approximately the same size as its Singapore business. Whilst the residential
development business can be volatile, FCL’s approach of driving for high rates of pre-
sales and diversifying its portfolio across multiple projects and geographies gives
good visibility over its development income over the next 12-24 months.
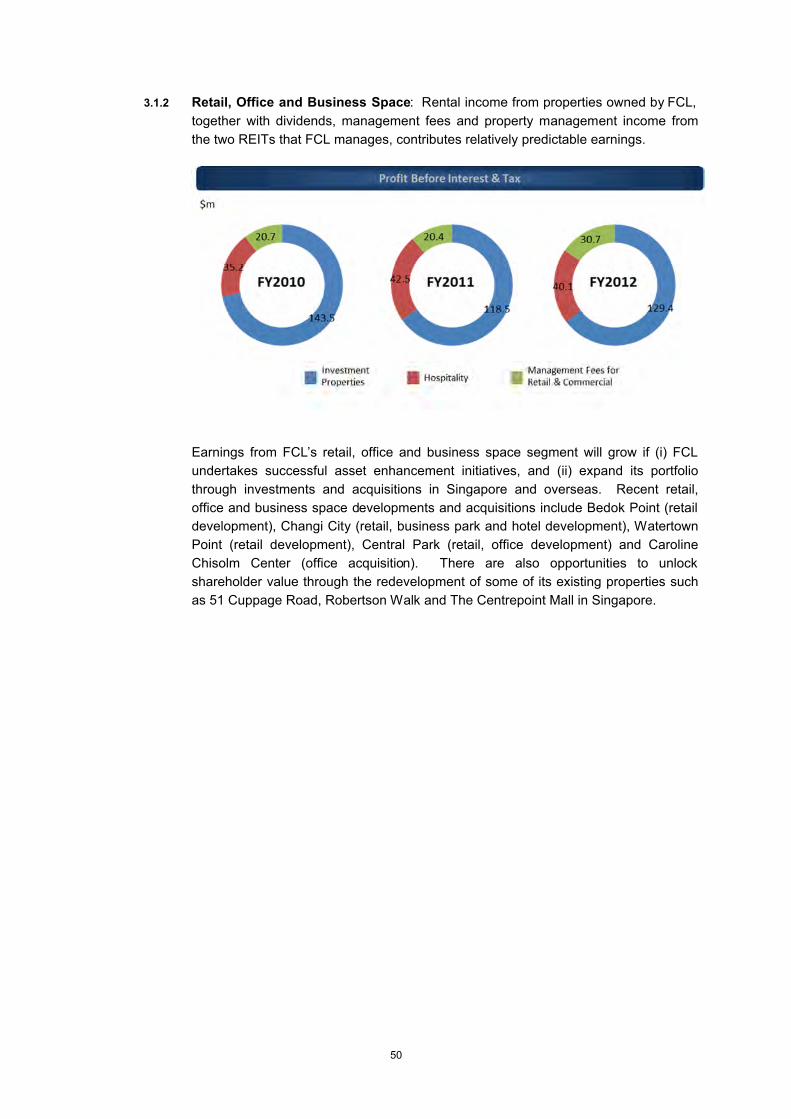
50
3.1.2 Retail, Office and Business Space: Rental income from properties owned by FCL,
together with dividends, management fees and property management income from
the two REITs that FCL manages, contributes relatively predictable earnings.
Earnings from FCL’s retail, office and business space segment will grow if (i) FCL
undertakes successful asset enhancement initiatives, and (ii) expand its portfolio
through investments and acquisitions in Singapore and overseas. Recent retail,
office and business space developments and acquisitions include Bedok Point (retail
development), Changi City (retail, business park and hotel development), Watertown
Point (retail development), Central Park (retail, office development) and Caroline
Chisolm Center (office acquisition). There are also opportunities to unlock
shareholder value through the redevelopment of some of its existing properties such
as 51 Cuppage Road, Robertson Walk and The Centrepoint Mall in Singapore.
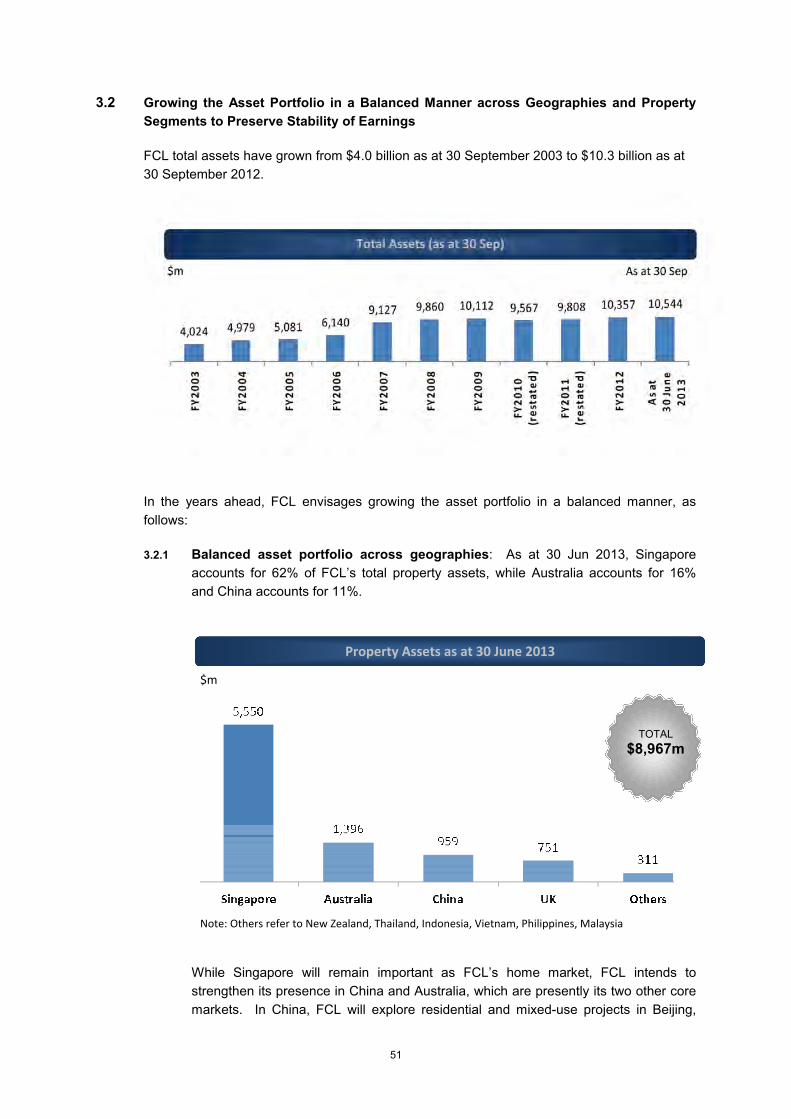
51
3.2 Growing the Asset Portfolio in a Balanced Manner across Geographies and Property
Segments to Preserve Stability of Earnings
FCL total assets have grown from $4.0 billion as at 30 September 2003 to $10.3 billion as at
30 September 2012.
In the years ahead, FCL envisages growing the asset portfolio in a balanced manner, as
follows:
3.2.1 Balanced asset portfolio across geographies: As at 30 Jun 2013, Singapore
accounts for 62% of FCL’s total property assets, while Australia accounts for 16%
and China accounts for 11%.
While Singapore will remain important as FCL’s home market, FCL intends to
strengthen its presence in China and Australia, which are presently its two other core
markets. In China, FCL will explore residential and mixed-use projects in Beijing,
Property Assets as at 30 June 2013
$m
TOTAL
$8,967m
Note: Others refer to New Zealand, Thailand, Indonesia, Vietnam, Philippines, Malaysia
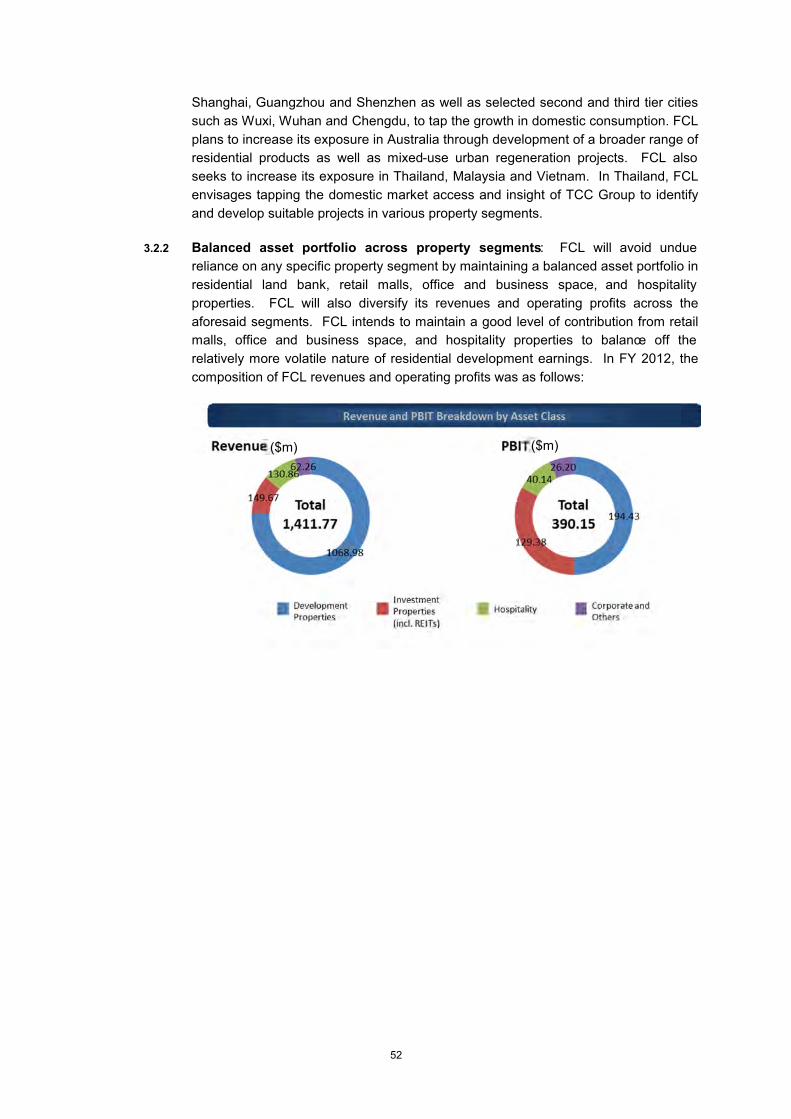
52
Shanghai, Guangzhou and Shenzhen as well as selected second and third tier cities
such as Wuxi, Wuhan and Chengdu, to tap the growth in domestic consumption. FCL
plans to increase its exposure in Australia through development of a broader range of
residential products as well as mixed-use urban regeneration projects. FCL also
seeks to increase its exposure in Thailand, Malaysia and Vietnam. In Thailand, FCL
envisages tapping the domestic market access and insight of TCC Group to identify
and develop suitable projects in various property segments.
3.2.2 Balanced asset portfolio across property segments: FCL will avoid undue
reliance on any specific property segment by maintaining a balanced asset portfolio in
residential land bank, retail malls, office and business space, and hospitality
properties. FCL will also diversify its revenues and operating profits across the
aforesaid segments. FCL intends to maintain a good level of contribution from retail
malls, office and business space, and hospitality properties to balance off the
relatively more volatile nature of residential development earnings. In FY 2012, the
composition of FCL revenues and operating profits was as follows:
($m) ($m)
53
3.3 Optimizing Capital Productivity through REIT Platforms and Active Asset Management
Initiatives
In the course of expanding its global footprint, FCL will seek to optimize capital productivity
through several means:
3.3.1 FCL will maintain significant discipline in turning around its landbank acquisitions. In
Singapore, the gestation period (time from land acquisition to sales launch) for its
residential development projects can be as short as 7 months. Overseas, the
gestation periods can be longer due to differences in planning processes. However,
its objective is to minimize the time taken to launch its projects as much as possible.
3.3.2 FCL will embark on redevelopment and/or asset enhancement initiatives to upgrade
or re-position retail, office, business space and hospitality properties that FCL
currently owns, with a view to improve tenant mix, customer traffic and/or rental rates.
Asset enhancement initiatives undertaken at Anchorpoint, Northpoint and Causeway
Point malls, have contributed to a net value creation of about $165 million based on
increase in the respective mall's net property income over assumed capitalisation
rates.
3.3.3 In line with FCL’s asset light strategy, mature properties in the retail, office and
business space segments that are producing stable rental yields can be divested to
Frasers Centrepoint Trust and Frasers Commercial Trust to recycle capital for new
investments and acquisitions which can deliver attractive returns on capital employed.
FCL is also exploring the extension of its asset light strategy to its portfolio of
hospitality assets through the setting up of a Hospitality REIT.
3.3.4 As FCL grows the number of units in its serviced residence business, FCL will, as far
as practicable, seek to enter into management contracts with property owners with a
view to earning management fees without a commensurately large capital outlay to
build or acquire buildings. As at 30 June 2013, 77% of its serviced residence units
are under management, another 3% are leased and only 20% are owned. This
asset-light approach has enabled us to establish a global network of 74 serviced
residence properties in 39 cities without having to deploy excessive capital to build or
own properties. The emphasis on management contracts has also enabled us to
expand its network faster than FCL would otherwise have been able to, had FCL
relied heavily on capital expenditure to buy or build serviced residences.
While FCL strives to optimize capital productivity through the above strategies, FCL may
make selected investments and acquisitions of properties if FCL is of the view that the capital
deployed can be justified in terms of synergy and/or future capital appreciation.

54
APPENDIX 4
PRO FORMA FINANCIAL STATEMENTS OF THE FCL GROUP
The pro forma financial statements of the FCL Group in this Appendix 4 is qualified in its
entirety by, and is subject to, the more detailed information to be set out in the Introductory
Document which will be issued subsequently. The information presented in this Appendix 4 is
subject to change.
The financial statements of the FCL Group as set out in this Appendix 4 on a pro forma basis
is not necessarily indicative of the actual or future performance of the FCL Group.
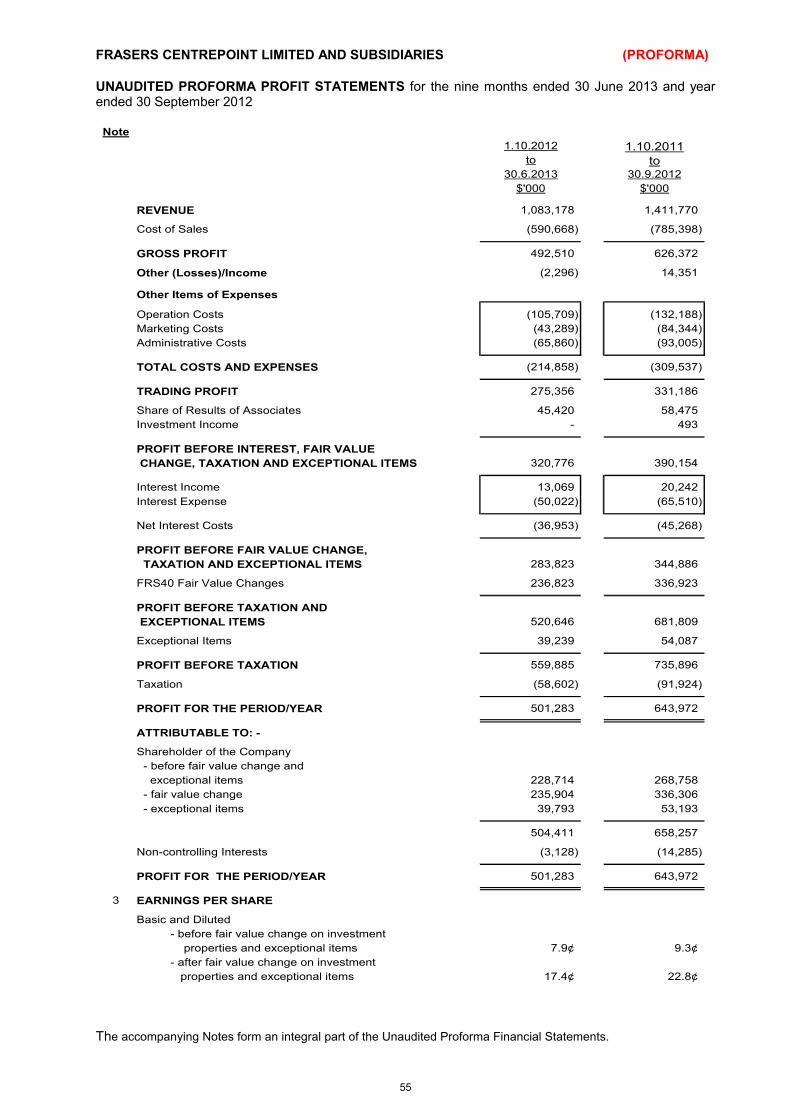
55
FRASERS CENTREPOINT LIMITED AND SUBSIDIARIES (PROFORMA)
UNAUDITED PROFORMA PROFIT STATEMENTS for the nine months ended 30 June 2013 and year ended 30 September 2012
Note
1.10.2012 1.10.2011to to
30.6.2013 30.9.2012
$'000 $'000
REVENUE 1,083,178 1,411,770
Cost of Sales (590,668) (785,398)
GROSS PROFIT 492,510 626,372
Other (Losses)/Income (2,296) 14,351
Other Items of Expenses
Operation Costs (105,709) (132,188)
Marketing Costs (43,289) (84,344)
Administrative Costs (65,860) (93,005)
TOTAL COSTS AND EXPENSES (214,858) (309,537)
TRADING PROFIT 275,356 331,186
Share of Results of Associates 45,420 58,475
Investment Income - 493
PROFIT BEFORE INTEREST, FAIR VALUE
CHANGE, TAXATION AND EXCEPTIONAL ITEMS 320,776 390,154
Interest Income 13,069 20,242
Interest Expense (50,022) (65,510)
Net Interest Costs (36,953) (45,268)
PROFIT BEFORE FAIR VALUE CHANGE,
TAXATION AND EXCEPTIONAL ITEMS 283,823 344,886
FRS40 Fair Value Changes 236,823 336,923
PROFIT BEFORE TAXATION AND
EXCEPTIONAL ITEMS 520,646 681,809
Exceptional Items 39,239 54,087
PROFIT BEFORE TAXATION 559,885 735,896
Taxation (58,602) (91,924)
PROFIT FOR THE PERIOD/YEAR 501,283 643,972
ATTRIBUTABLE TO: -
Shareholder of the Company
- before fair value change and
exceptional items 228,714 268,758
- fair value change 235,904 336,306
- exceptional items 39,793 53,193
504,411 658,257
Non-controlling Interests (3,128) (14,285)
PROFIT FOR THE PERIOD/YEAR 501,283 643,972
3 EARNINGS PER SHARE
Basic and Diluted
- before fair value change on investment
properties and exceptional items 7.9¢ 9.3¢
- after fair value change on investment
properties and exceptional items 17.4¢ 22.8¢
The accompanying Notes form an integral part of the Unaudited Proforma Financial Statements.
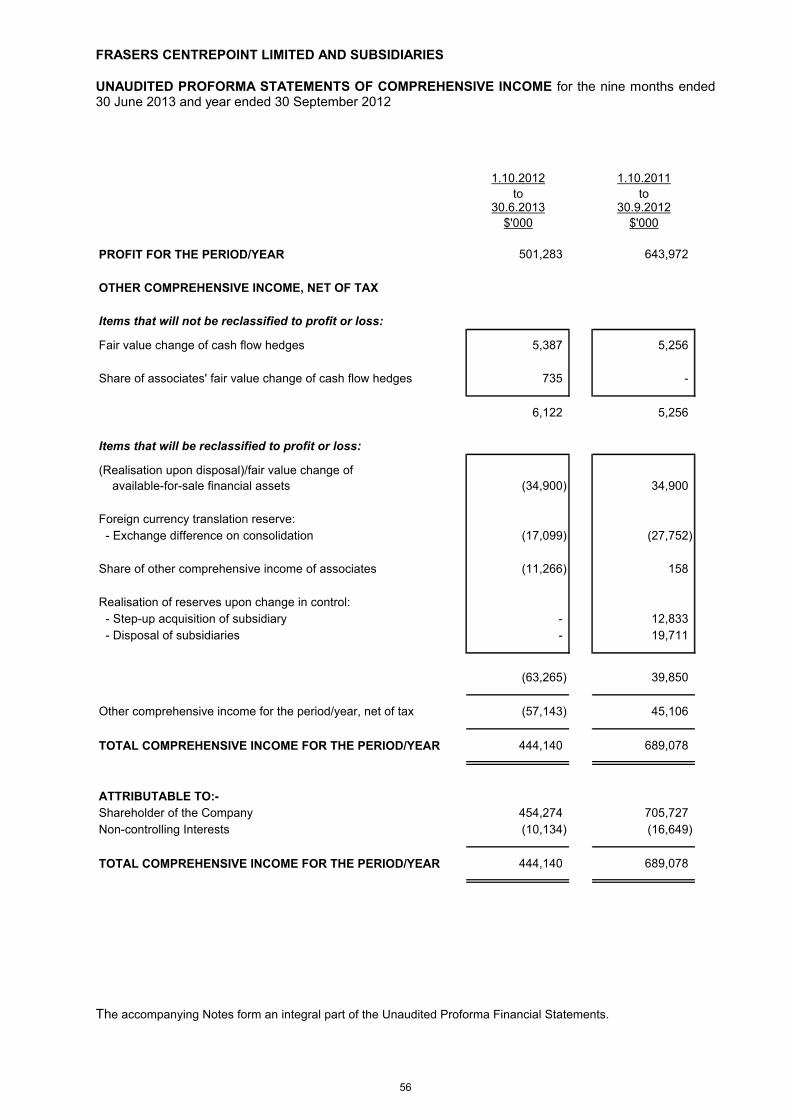
56
FRASERS CENTREPOINT LIMITED AND SUBSIDIARIES
UNAUDITED PROFORMA STATEMENTS OF COMPREHENSIVE INCOME for the nine months ended 30 June 2013 and year ended 30 September 2012
1.10.2012 1.10.2011
to to30.6.2013 30.9.2012
$'000 $'000
PROFIT FOR THE PERIOD/YEAR 501,283 643,972
OTHER COMPREHENSIVE INCOME, NET OF TAX
Items that will not be reclassified to profit or loss:
Fair value change of cash flow hedges 5,387 5,256
Share of associates' fair value change of cash flow hedges 735 -
6,122 5,256
Items that will be reclassified to profit or loss:
(Realisation upon disposal)/fair value change of
available-for-sale financial assets (34,900) 34,900
Foreign currency translation reserve:
- Exchange difference on consolidation (17,099) (27,752)
Share of other comprehensive income of associates (11,266) 158
Realisation of reserves upon change in control:
- Step-up acquisition of subsidiary - 12,833
- Disposal of subsidiaries - 19,711
(63,265) 39,850
Other comprehensive income for the period/year, net of tax (57,143) 45,106
TOTAL COMPREHENSIVE INCOME FOR THE PERIOD/YEAR 444,140 689,078
ATTRIBUTABLE TO:-
Shareholder of the Company 454,274 705,727
Non-controlling Interests (10,134) (16,649)
TOTAL COMPREHENSIVE INCOME FOR THE PERIOD/YEAR 444,140 689,078
The accompanying Notes form an integral part of the Unaudited Proforma Financial Statements.
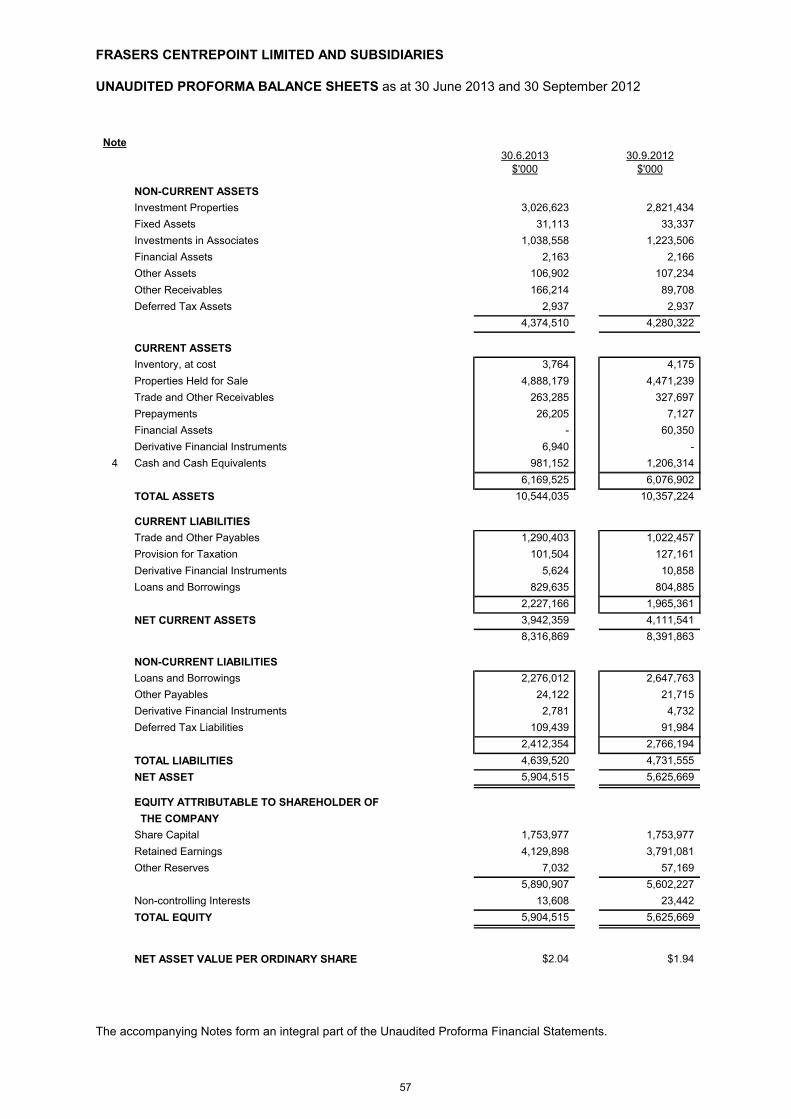
57
FRASERS CENTREPOINT LIMITED AND SUBSIDIARIES
UNAUDITED PROFORMA BALANCE SHEETS as at 30 June 2013 and 30 September 2012
Note30.6.2013 30.9.2012
$'000 $'000
NON-CURRENT ASSETS
Investment Properties 3,026,623 2,821,434
Fixed Assets 31,113 33,337
Investments in Associates 1,038,558 1,223,506
Financial Assets 2,163 2,166
Other Assets 106,902 107,234
Other Receivables 166,214 89,708
Deferred Tax Assets 2,937 2,937
4,374,510 4,280,322
CURRENT ASSETS
Inventory, at cost 3,764 4,175
Properties Held for Sale 4,888,179 4,471,239
Trade and Other Receivables 263,285 327,697
Prepayments 26,205 7,127
Financial Assets - 60,350
Derivative Financial Instruments 6,940 -
4 Cash and Cash Equivalents 981,152 1,206,314
6,169,525 6,076,902
TOTAL ASSETS 10,544,035 10,357,224
CURRENT LIABILITIES
Trade and Other Payables 1,290,403 1,022,457
Provision for Taxation 101,504 127,161
Derivative Financial Instruments 5,624 10,858
Loans and Borrowings 829,635 804,885
2,227,166 1,965,361
NET CURRENT ASSETS 3,942,359 4,111,541
8,316,869 8,391,863
NON-CURRENT LIABILITIES
Loans and Borrowings 2,276,012 2,647,763
Other Payables 24,122 21,715
Derivative Financial Instruments 2,781 4,732
Deferred Tax Liabilities 109,439 91,984
2,412,354 2,766,194
TOTAL LIABILITIES 4,639,520 4,731,555
NET ASSET 5,904,515 5,625,669
EQUITY ATTRIBUTABLE TO SHAREHOLDER OF
THE COMPANY
Share Capital 1,753,977 1,753,977
Retained Earnings 4,129,898 3,791,081
Other Reserves 7,032 57,169
5,890,907 5,602,227
Non-controlling Interests 13,608 23,442
TOTAL EQUITY 5,904,515 5,625,669
NET ASSET VALUE PER ORDINARY SHARE $2.04 $1.94
The accompanying Notes form an integral part of the Unaudited Proforma Financial Statements.
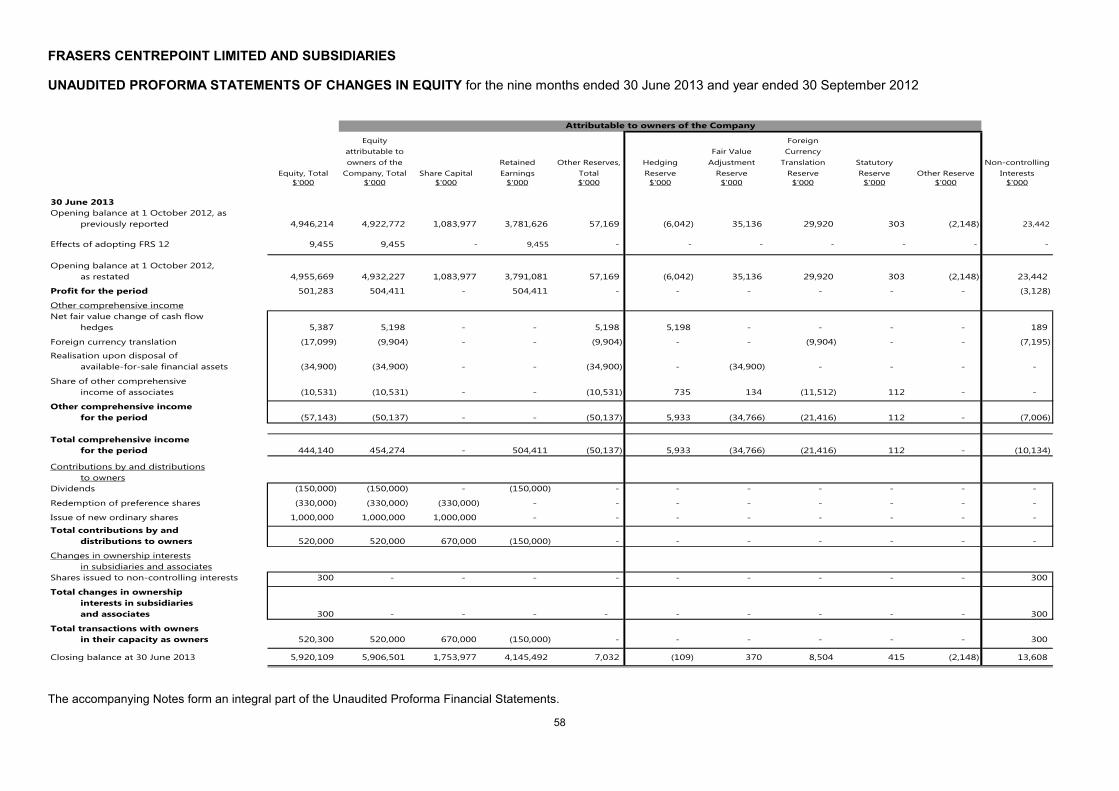
58
FRASERS CENTREPOINT LIMITED AND SUBSIDIARIES
UNAUDITED PROFORMA STATEMENTS OF CHANGES IN EQUITY for the nine months ended 30 June 2013 and year ended 30 September 2012
Equity, Total
Equity
attributable to
owners of the
Company, Total Share Capital
Retained
Earnings
Other Reserves,
Total
Hedging
Reserve
Fair Value
Adjustment
Reserve
Foreign
Currency
Translation
Reserve
Statutory
Reserve Other Reserve
Non-controlling
Interests
$'000 $'000 $'000 $'000 $'000 $'000 $'000 $'000 $'000 $'000 $'000
30 June 2013
Opening balance at 1 October 2012, as
previously reported 4,946,214 4,922,772 1,083,977 3,781,626 57,169 (6,042) 35,136 29,920 303 (2,148) 23,442
Effects of adopting FRS 12 9,455 9,455 - 9,455 - - - - - - -
Opening balance at 1 October 2012,
as restated 4,955,669 4,932,227 1,083,977 3,791,081 57,169 (6,042) 35,136 29,920 303 (2,148) 23,442
Profit for the period 501,283 504,411 - 504,411 - - - - - - (3,128)
Other comprehensive income
Net fair value change of cash flow
hedges 5,387 5,198 - - 5,198 5,198 - - - - 189
Foreign currency translation (17,099) (9,904) - - (9,904) - - (9,904) - - (7,195)
Realisation upon disposal of
available-for-sale financial assets (34,900) (34,900) - - (34,900) - (34,900) - - - -
Share of other comprehensive
income of associates (10,531) (10,531) - - (10,531) 735 134 (11,512) 112 - -
Other comprehensive income
for the period (57,143) (50,137) - - (50,137) 5,933 (34,766) (21,416) 112 - (7,006)
Total comprehensive income
for the period 444,140 454,274 - 504,411 (50,137) 5,933 (34,766) (21,416) 112 - (10,134)
Contributions by and distributions
to owners
Dividends (150,000) (150,000) - (150,000) - - - - - - -
Redemption of preference shares (330,000) (330,000) (330,000) - - - - - - - -
Issue of new ordinary shares 1,000,000 1,000,000 1,000,000 - - - - - - - -
Total contributions by and
distributions to owners 520,000 520,000 670,000 (150,000) - - - - - - -
Changes in ownership interests
in subsidiaries and associates
Shares issued to non-controlling interests 300 - - - - - - - - - 300
Total changes in ownership
interests in subsidiaries
and associates 300 - - - - - - - - - 300
Total transactions with owners
in their capacity as owners 520,300 520,000 670,000 (150,000) - - - - - - 300
Closing balance at 30 June 2013 5,920,109 5,906,501 1,753,977 4,145,492 7,032 (109) 370 8,504 415 (2,148) 13,608
Attributable to owners of the Company
The accompanying Notes form an integral part of the Unaudited Proforma Financial Statements.
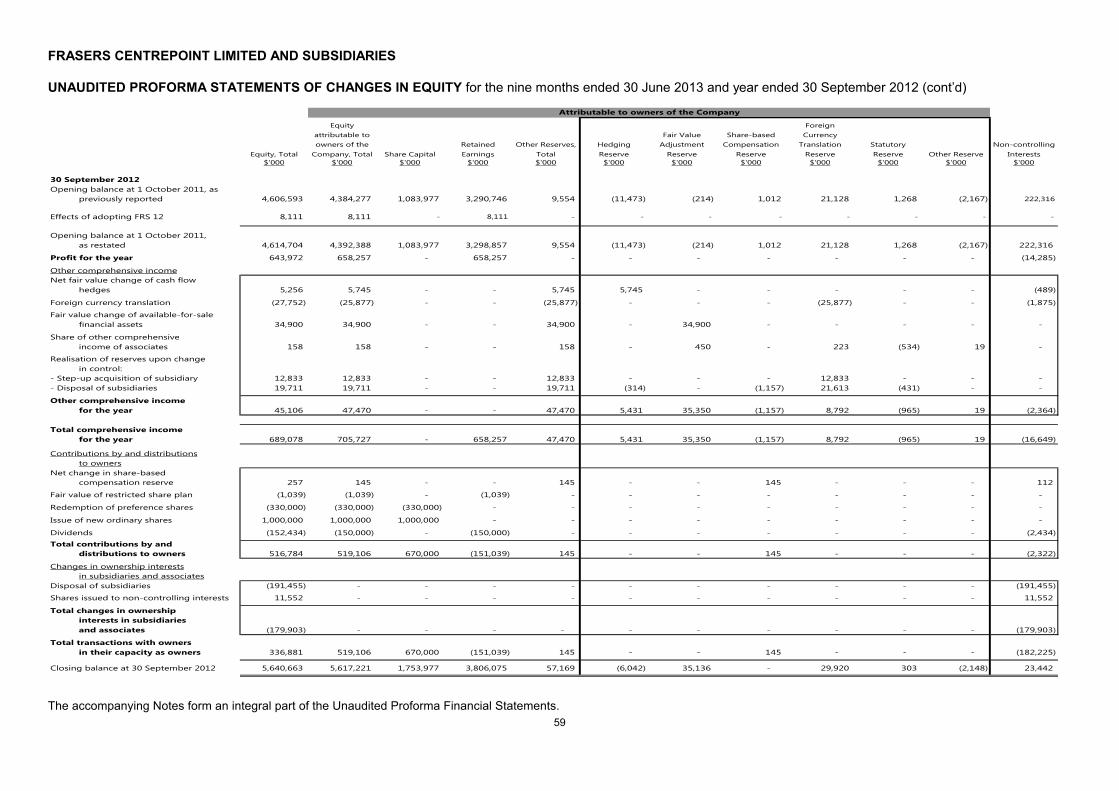
59
FRASERS CENTREPOINT LIMITED AND SUBSIDIARIES
UNAUDITED PROFORMA STATEMENTS OF CHANGES IN EQUITY for the nine months ended 30 June 2013 and year ended 30 September 2012 (cont’d)
Equity, Total
Equity
attributable to
owners of the
Company, Total Share Capital
Retained
Earnings
Other Reserves,
Total
Hedging
Reserve
Fair Value
Adjustment
Reserve
Share-based
Compensation
Reserve
Foreign
Currency
Translation
Reserve
Statutory
Reserve Other Reserve
Non-controlling
Interests
$'000 $'000 $'000 $'000 $'000 $'000 $'000 $'000 $'000 $'000 $'000 $'000
30 September 2012
Opening balance at 1 October 2011, as
previously reported 4,606,593 4,384,277 1,083,977 3,290,746 9,554 (11,473) (214) 1,012 21,128 1,268 (2,167) 222,316
Effects of adopting FRS 12 8,111 8,111 - 8,111 - - - - - - - -
Opening balance at 1 October 2011,
as restated 4,614,704 4,392,388 1,083,977 3,298,857 9,554 (11,473) (214) 1,012 21,128 1,268 (2,167) 222,316
Profit for the year 643,972 658,257 - 658,257 - - - - - - - (14,285)
Other comprehensive income
Net fair value change of cash flow
hedges 5,256 5,745 - - 5,745 5,745 - - - - - (489)
Foreign currency translation (27,752) (25,877) - - (25,877) - - - (25,877) - - (1,875)
Fair value change of available-for-sale
financial assets 34,900 34,900 - - 34,900 - 34,900 - - - - -
Share of other comprehensive
income of associates 158 158 - - 158 - 450 - 223 (534) 19 -
Realisation of reserves upon change
in control:
- Step-up acquisition of subsidiary 12,833 12,833 - - 12,833 - - - 12,833 - - -
- Disposal of subsidiaries 19,711 19,711 - - 19,711 (314) - (1,157) 21,613 (431) - -
Other comprehensive income
for the year 45,106 47,470 - - 47,470 5,431 35,350 (1,157) 8,792 (965) 19 (2,364)
Total comprehensive income
for the year 689,078 705,727 - 658,257 47,470 5,431 35,350 (1,157) 8,792 (965) 19 (16,649)
Contributions by and distributions
to owners
Net change in share-based
compensation reserve 257 145 - - 145 - - 145 - - - 112
Fair value of restricted share plan (1,039) (1,039) - (1,039) - - - - - - - -
Redemption of preference shares (330,000) (330,000) (330,000) - - - - - - - - -
Issue of new ordinary shares 1,000,000 1,000,000 1,000,000 - - - - - - - - -
Dividends (152,434) (150,000) - (150,000) - - - - - - - (2,434)
Total contributions by and
distributions to owners 516,784 519,106 670,000 (151,039) 145 - - 145 - - - (2,322)
Changes in ownership interests
in subsidiaries and associates
Disposal of subsidiaries (191,455) - - - - - - - - - - (191,455)
Shares issued to non-controlling interests 11,552 - - - - - - - - - - 11,552
Total changes in ownership
interests in subsidiaries
and associates (179,903) - - - - - - - - - - (179,903)
Total transactions with owners
in their capacity as owners 336,881 519,106 670,000 (151,039) 145 - - 145 - - - (182,225)
Closing balance at 30 September 2012 5,640,663 5,617,221 1,753,977 3,806,075 57,169 (6,042) 35,136 - 29,920 303 (2,148) 23,442
Attributable to owners of the Company
The accompanying Notes form an integral part of the Unaudited Proforma Financial Statements.
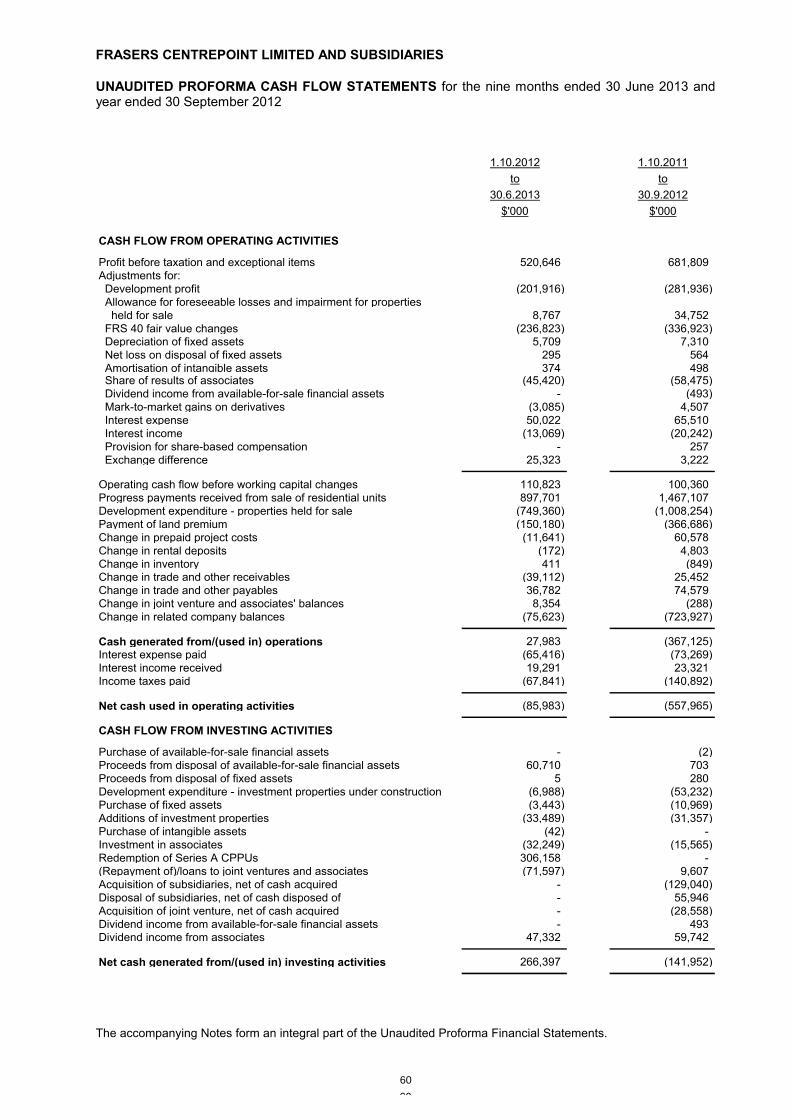
60
FRASERS CENTREPOINT LIMITED AND SUBSIDIARIES
UNAUDITED PROFORMA CASH FLOW STATEMENTS for the nine months ended 30 June 2013 and year ended 30 September 2012
1.10.2012 1.10.2011
to to
30.6.2013 30.9.2012
$'000 $'000
CASH FLOW FROM OPERATING ACTIVITIES
Profit before taxation and exceptional items 520,646 681,809 Adjustments for: Development profit (201,916) (281,936) Allowance for foreseeable losses and impairment for properties held for sale 8,767 34,752 FRS 40 fair value changes (236,823) (336,923) Depreciation of fixed assets 5,709 7,310 Net loss on disposal of fixed assets 295 564 Amortisation of intangible assets 374 498 Share of results of associates (45,420) (58,475) Dividend income from available-for-sale financial assets - (493) Mark-to-market gains on derivatives (3,085) 4,507 Interest expense 50,022 65,510 Interest income (13,069) (20,242) Provision for share-based compensation - 257 Exchange difference 25,323 3,222
Operating cash flow before working capital changes 110,823 100,360 Progress payments received from sale of residential units 897,701 1,467,107 Development expenditure - properties held for sale (749,360) (1,008,254) Payment of land premium (150,180) (366,686) Change in prepaid project costs (11,641) 60,578 Change in rental deposits (172) 4,803 Change in inventory 411 (849) Change in trade and other receivables (39,112) 25,452 Change in trade and other payables 36,782 74,579 Change in joint venture and associates' balances 8,354 (288) Change in related company balances (75,623) (723,927)
Cash generated from/(used in) operations 27,983 (367,125) Interest expense paid (65,416) (73,269) Interest income received 19,291 23,321 Income taxes paid (67,841) (140,892)
Net cash used in operating activities (85,983) (557,965)
CASH FLOW FROM INVESTING ACTIVITIES
Purchase of available-for-sale financial assets - (2) Proceeds from disposal of available-for-sale financial assets 60,710 703 Proceeds from disposal of fixed assets 5 280 Development expenditure - investment properties under construction (6,988) (53,232) Purchase of fixed assets (3,443) (10,969) Additions of investment properties (33,489) (31,357) Purchase of intangible assets (42) - Investment in associates (32,249) (15,565) Redemption of Series A CPPUs 306,158 - (Repayment of)/loans to joint ventures and associates (71,597) 9,607 Acquisition of subsidiaries, net of cash acquired - (129,040) Disposal of subsidiaries, net of cash disposed of - 55,946 Acquisition of joint venture, net of cash acquired - (28,558) Dividend income from available-for-sale financial assets - 493 Dividend income from associates 47,332 59,742
Net cash generated from/(used in) investing activities 266,397 (141,952)
The accompanying Notes form an integral part of the Unaudited Proforma Financial Statements.
60

61
FRASERS CENTREPOINT LIMITED AND SUBSIDIARIES
UNAUDITED PROFORMA CASH FLOW STATEMENTS for the nine months ended 30 June 2013 and year ended 30 September 2012 (cont’d)
1.10.2012 1.10.2011
to to
30.6.2013 30.9.2012$'000 $'000
CASH FLOW FROM FINANCING ACTIVITIES
Proceeds from issue of new shares by subsidiary to non-controlling interests 300 11,552 Proceeds from bank loans drawn down 1,778,210 2,543,709 Repayment of bank loans (242,273) (234,925) Repayment of long-term loans to a related company (2,456,962) (1,901,188) Payment of dividends to shareholders (150,000) (152,434) Redemption of preference shares (330,000) (330,000) Issue of new ordinary shares 1,000,000 1,000,000
Net cash (used in)/generated from financing activities (400,725) 936,714
Net change in cash and cash equivalents (220,311) 236,797 Cash and cash equivalents at beginning of period/year 1,201,005 968,249
Cash and cash equivalents at end of period/year (Note 4) 980,694 1,205,046
The accompanying Notes form an integral part of the Unaudited Proforma Financial Statements.
FRASERS CENTREPOINT LIMITED AND SUBSIDIARIES
NOTES TO THE UNAUDITED PROFORMA FINANCIAL STATEMENTS for the nine months ended 30 June 2013 and year ended 30 September 2012
62
The unaudited proforma financial information should be read in conjunction with the audited financial statements of Frasers Centrepoint Limited (the “Company”) and its subsidiaries (the “FCL Group”) for the financial years ended 30 September 2012 and the interim financial statements of the FCL Group for the nine months ended 30 June 2013 which will be set out in the Introductory Document.
1. BACKGROUND AND BASIS OF PREPARATION
Introduction
The unaudited proforma financial statements, comprising the unaudited proforma balance sheets of the FCL Group as at 30 June 2013 and 30 September 2012, the unaudited proforma profit statements, unaudited proforma statements of comprehensive income, unaudited proforma statements of changes in equity and the unaudited proforma statements of cash flows of the FCL Group for the nine months ended 30 June 2013 and for the financial year ended 30 September 2012 and the notes thereon, have been prepared for inclusion in the Introductory Document of Frasers Centrepoint Limited in connection with the listing of the ordinary shares of the Company.
The Company was incorporated in the Republic of Singapore and has its registered office at 438 Alexandra Road #21-00 Alexandra Point Singapore 119958. The principal activities of the Company and its subsidiaries are those of investment holding, property investment and development, operation of serviced apartments and management services.
The Corporate Restructuring
Immediately prior to the Listing, the Company will redeem all the redeemable preference shares currently held by F&N in FCL for an aggregate amount of $330,000,000.
F&N and F&N Treasury Pte Ltd, a wholly-owned subsidiary of F&N, have, from time to time, extended loans to the FCL Group ("Intercompany Loan") for various purposes. Immediately prior to the Listing, $670,000,000 of the Intercompany Loans will be repaid with equity injected by F&N pursuant to the Capitalisation (see defined below), while the remaining of the Intercompany Loans will be repaid by drawing down on credit facilities.
Immediately prior to the Listing, F&N will subscribe for up to 2,139,140,708 new FCL Shares (the “Capitalisation”) for a total subscription amount of $1,000,000,000.
These changes are assumed to have occurred on:
(a) 1 October 2011 for the purposes of the financial information covering the period to
30 September 2012 and for the nine months to 30 June 2013; and
(b) the balance sheet date for the purposes of the balance sheets as at 30 September 2012
and 30 June 2013.
The unaudited proforma financial statements have been prepared for illustrative purposes only, and because of their nature, may not give a true picture of the actual financial position, results of operations and cash flows of the FCL Group.
FRASERS CENTREPOINT LIMITED AND SUBSIDIARIES
NOTES TO THE UNAUDITED PROFORMA FINANCIAL STATEMENTS for the nine months ended 30 June 2013 and year ended 30 September 2012
63
1. BACKGROUND AND BASIS OF PREPARATION (cont’d)
Basis of preparation of unaudited proforma financial statements
The unaudited proforma financial statements have been prepared for illustrative purposes only and are prepared based on:
(a) the audited financial statements of the FCL Group for the financial year ended 30
September 2012; and
(b) the audited interim financial statements of the FCL Group for the nine months ended 30
June 2013;
which were prepared in accordance with the Singapore Financial Reporting Standards and were audited by Ernst & Young LLP Singapore, Public Accountants and Chartered Accountants.
The auditor’s reports on the above financial statements were not subject to any qualifications, modifications or disclaimers.
The following key adjustments and assumptions were made for each of the periods presented :
(1) The Company will redeem all its redeemable preference shares currently held by F&N in the Company for an aggregate amount of $330,000,000.
(2) $670,000,000 of the aggregated Intercompany Loans from F&N and F&N Treasury Pte Ltd, a wholly-owned subsidiary of F&N, will be repaid with equity injected by F&Npursuant to the Capitalisation, while the remaining of the Intercompany Loans will be repaid by drawing down on credit facilities.
(3) F&N will subscribe for up to 2,139,140,708 new Ordinary Shares in the Company for a total subscription amount of $1,000,000,000.
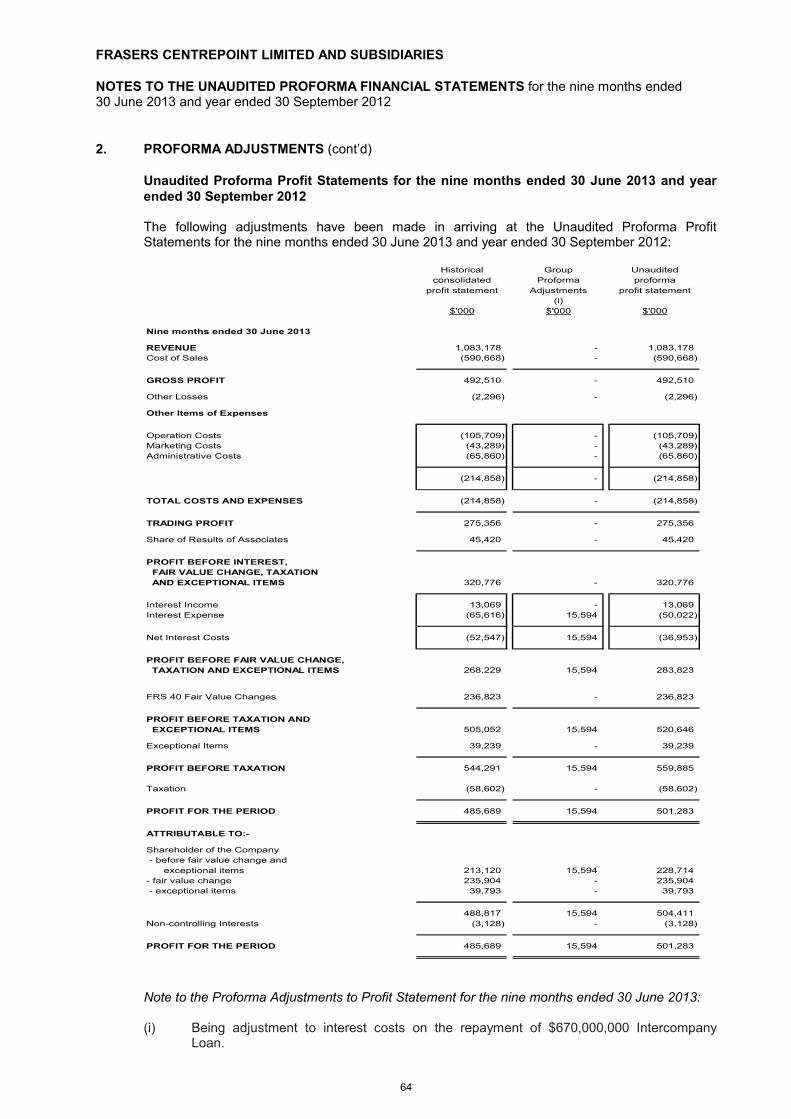
FRASERS CENTREPOINT LIMITED AND SUBSIDIARIES
NOTES TO THE UNAUDITED PROFORMA FINANCIAL STATEMENTS for the nine months ended 30 June 2013 and year ended 30 September 2012
64
2. PROFORMA ADJUSTMENTS (cont’d)
Unaudited Proforma Profit Statements for the nine months ended 30 June 2013 and yearended 30 September 2012
The following adjustments have been made in arriving at the Unaudited Proforma ProfitStatements for the nine months ended 30 June 2013 and year ended 30 September 2012:
Historical Group Unaudited
consolidated Proforma proforma
profit statement Adjustments profit statement
(i)
$'000 $'000 $'000
Nine months ended 30 June 2013
REVENUE 1,083,178 - 1,083,178
Cost of Sales (590,668) - (590,668)
GROSS PROFIT 492,510 - 492,510
Other Losses (2,296) - (2,296)
Other Items of Expenses
Operation Costs (105,709) - (105,709)
Marketing Costs (43,289) - (43,289)
Administrative Costs (65,860) - (65,860)
(214,858) - (214,858)
TOTAL COSTS AND EXPENSES (214,858) - (214,858)
TRADING PROFIT 275,356 - 275,356
Share of Results of Associates 45,420 - 45,420
PROFIT BEFORE INTEREST,
FAIR VALUE CHANGE, TAXATION
AND EXCEPTIONAL ITEMS 320,776 - 320,776
Interest Income 13,069 - 13,069
Interest Expense (65,616) 15,594 (50,022)
Net Interest Costs (52,547) 15,594 (36,953)
PROFIT BEFORE FAIR VALUE CHANGE,
TAXATION AND EXCEPTIONAL ITEMS 268,229 15,594 283,823
FRS 40 Fair Value Changes 236,823 - 236,823
PROFIT BEFORE TAXATION AND
EXCEPTIONAL ITEMS 505,052 15,594 520,646
Exceptional Items 39,239 - 39,239
PROFIT BEFORE TAXATION 544,291 15,594 559,885
Taxation (58,602) - (58,602)
PROFIT FOR THE PERIOD 485,689 15,594 501,283
ATTRIBUTABLE TO:-
Shareholder of the Company
- before fair value change and
exceptional items 213,120 15,594 228,714
- fair value change 235,904 - 235,904
- exceptional items 39,793 - 39,793
488,817 15,594 504,411
Non-controlling Interests (3,128) - (3,128)
PROFIT FOR THE PERIOD 485,689 15,594 501,283
Note to the Proforma Adjustments to Profit Statement for the nine months ended 30 June 2013:
(i) Being adjustment to interest costs on the repayment of $670,000,000 Intercompany Loan.
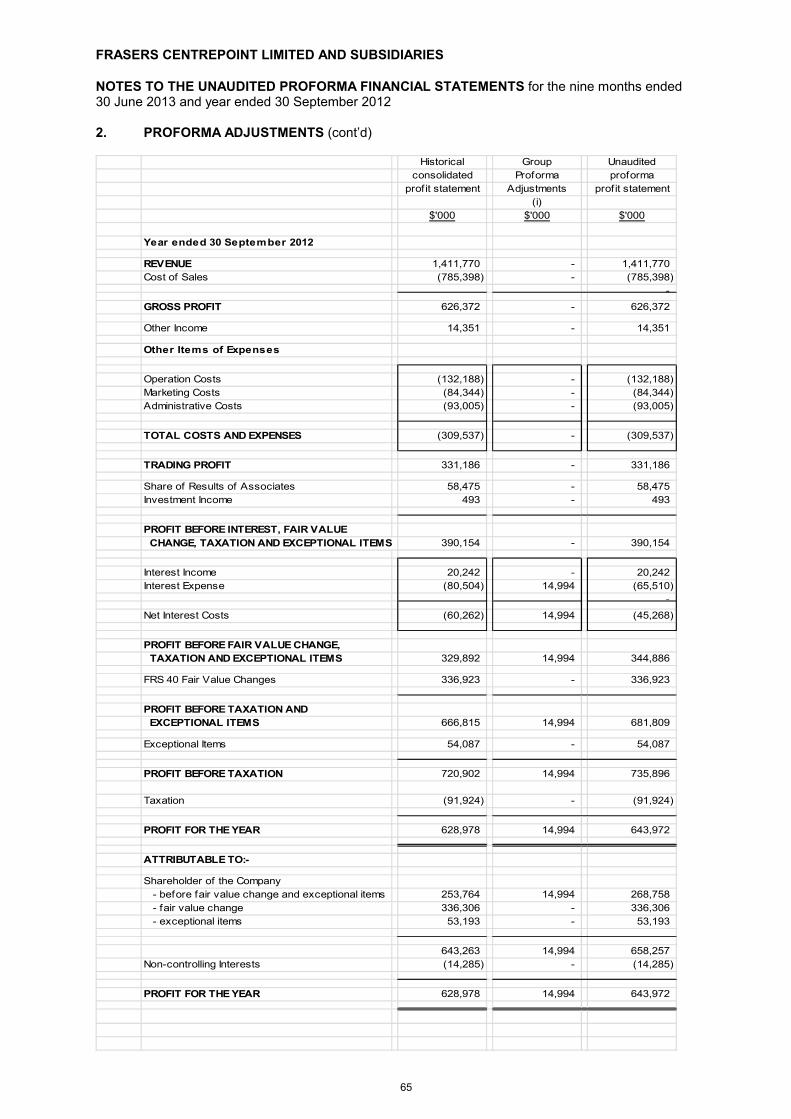
FRASERS CENTREPOINT LIMITED AND SUBSIDIARIES
NOTES TO THE UNAUDITED PROFORMA FINANCIAL STATEMENTS for the nine months ended 30 June 2013 and year ended 30 September 2012
65
2. PROFORMA ADJUSTMENTS (cont’d)
Historical Group Unaudited
consolidated Proforma proforma
prof it statement Adjustments prof it statement
(i)
$'000 $'000 $'000
Year ended 30 September 2012
REVENUE 1,411,770 - 1,411,770
Cost of Sales (785,398) - (785,398)
-
GROSS PROFIT 626,372 - 626,372
Other Income 14,351 - 14,351
Other Items of Expenses
Operation Costs (132,188) - (132,188)
Marketing Costs (84,344) - (84,344)
Administrative Costs (93,005) - (93,005)
TOTAL COSTS AND EXPENSES (309,537) - (309,537)
TRADING PROFIT 331,186 - 331,186
Share of Results of Associates 58,475 - 58,475
Investment Income 493 - 493
PROFIT BEFORE INTEREST, FAIR VALUE
CHANGE, TAXATION AND EXCEPTIONAL ITEMS 390,154 - 390,154
Interest Income 20,242 - 20,242
Interest Expense (80,504) 14,994 (65,510)
-
Net Interest Costs (60,262) 14,994 (45,268)
PROFIT BEFORE FAIR VALUE CHANGE,
TAXATION AND EXCEPTIONAL ITEMS 329,892 14,994 344,886
FRS 40 Fair Value Changes 336,923 - 336,923
PROFIT BEFORE TAXATION AND
EXCEPTIONAL ITEMS 666,815 14,994 681,809
Exceptional Items 54,087 - 54,087
PROFIT BEFORE TAXATION 720,902 14,994 735,896
Taxation (91,924) - (91,924)
PROFIT FOR THE YEAR 628,978 14,994 643,972
ATTRIBUTABLE TO:-
Shareholder of the Company
- before fair value change and exceptional items 253,764 14,994 268,758
- fair value change 336,306 - 336,306
- exceptional items 53,193 - 53,193
643,263 14,994 658,257
Non-controlling Interests (14,285) - (14,285)
PROFIT FOR THE YEAR 628,978 14,994 643,972

FRASERS CENTREPOINT LIMITED AND SUBSIDIARIES
NOTES TO THE UNAUDITED PROFORMA FINANCIAL STATEMENTS for the nine months ended 30 June 2013 and year ended 30 September 2012
66
2. PROFORMA ADJUSTMENTS (cont’d)
Note to the Proforma Adjustments to Profit Statement for the year ended 30 September 2012:
(i) Being adjustment to interest costs on the repayment of $670,000,000 Intercompany Loan.
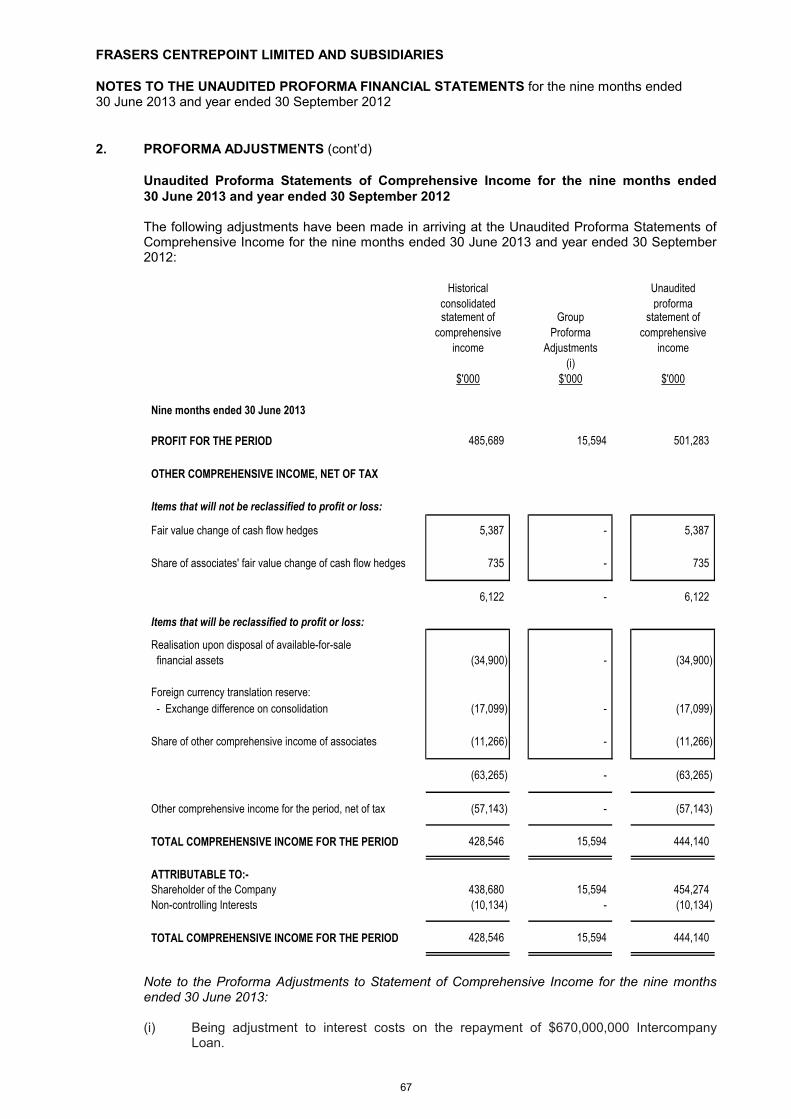
FRASERS CENTREPOINT LIMITED AND SUBSIDIARIES
NOTES TO THE UNAUDITED PROFORMA FINANCIAL STATEMENTS for the nine months ended 30 June 2013 and year ended 30 September 2012
67
2. PROFORMA ADJUSTMENTS (cont’d)
Unaudited Proforma Statements of Comprehensive Income for the nine months ended 30 June 2013 and year ended 30 September 2012
The following adjustments have been made in arriving at the Unaudited Proforma Statements of Comprehensive Income for the nine months ended 30 June 2013 and year ended 30 September 2012:
Historical Unaudited
consolidated proformastatement of Group statement of
comprehensive Proforma comprehensive
income Adjustments income
(i)
$'000 $'000 $'000
Nine months ended 30 June 2013
PROFIT FOR THE PERIOD 485,689 15,594 501,283
OTHER COMPREHENSIVE INCOME, NET OF TAX
Items that will not be reclassified to profit or loss:
Fair value change of cash flow hedges 5,387 - 5,387
Share of associates' fair value change of cash flow hedges 735 - 735
6,122 - 6,122
Items that will be reclassified to profit or loss:
Realisation upon disposal of available-for-sale
financial assets (34,900) - (34,900)
Foreign currency translation reserve:
- Exchange difference on consolidation (17,099) - (17,099)
Share of other comprehensive income of associates (11,266) - (11,266)
(63,265) - (63,265)
Other comprehensive income for the period, net of tax (57,143) - (57,143)
TOTAL COMPREHENSIVE INCOME FOR THE PERIOD 428,546 15,594 444,140
ATTRIBUTABLE TO:-
Shareholder of the Company 438,680 15,594 454,274
Non-controlling Interests (10,134) - (10,134)
TOTAL COMPREHENSIVE INCOME FOR THE PERIOD 428,546 15,594 444,140
Note to the Proforma Adjustments to Statement of Comprehensive Income for the nine monthsended 30 June 2013:
(i) Being adjustment to interest costs on the repayment of $670,000,000 Intercompany Loan.
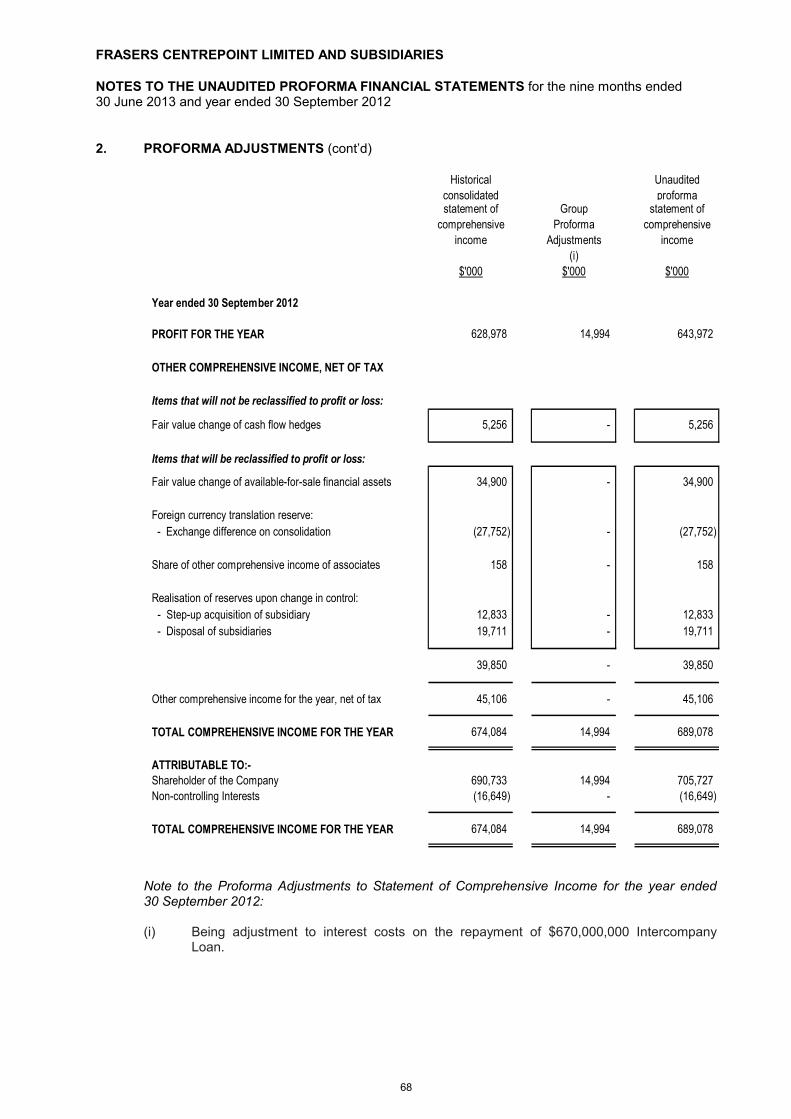
FRASERS CENTREPOINT LIMITED AND SUBSIDIARIES
NOTES TO THE UNAUDITED PROFORMA FINANCIAL STATEMENTS for the nine months ended 30 June 2013 and year ended 30 September 2012
68
2. PROFORMA ADJUSTMENTS (cont’d)
Historical Unaudited
consolidated proformastatement of Group statement of
comprehensive Proforma comprehensive
income Adjustments income
(i)
$'000 $'000 $'000
Year ended 30 September 2012
PROFIT FOR THE YEAR 628,978 14,994 643,972
OTHER COMPREHENSIVE INCOME, NET OF TAX
Items that will not be reclassified to profit or loss:
Fair value change of cash flow hedges 5,256 - 5,256
Items that will be reclassified to profit or loss:
Fair value change of available-for-sale financial assets 34,900 - 34,900
Foreign currency translation reserve:
- Exchange difference on consolidation (27,752) - (27,752)
Share of other comprehensive income of associates 158 - 158
Realisation of reserves upon change in control:
- Step-up acquisition of subsidiary 12,833 - 12,833
- Disposal of subsidiaries 19,711 - 19,711
39,850 - 39,850
Other comprehensive income for the year, net of tax 45,106 - 45,106
TOTAL COMPREHENSIVE INCOME FOR THE YEAR 674,084 14,994 689,078
ATTRIBUTABLE TO:-
Shareholder of the Company 690,733 14,994 705,727
Non-controlling Interests (16,649) - (16,649)
TOTAL COMPREHENSIVE INCOME FOR THE YEAR 674,084 14,994 689,078
Note to the Proforma Adjustments to Statement of Comprehensive Income for the year ended 30 September 2012:
(i) Being adjustment to interest costs on the repayment of $670,000,000 Intercompany Loan.
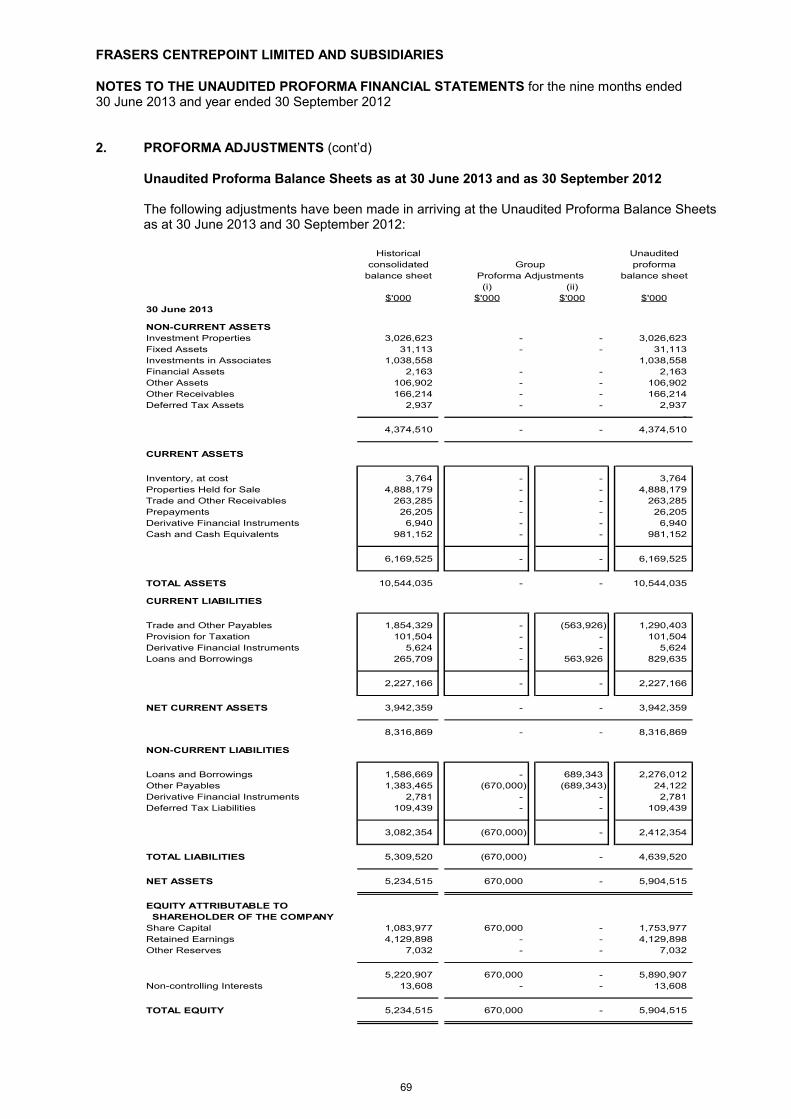
FRASERS CENTREPOINT LIMITED AND SUBSIDIARIES
NOTES TO THE UNAUDITED PROFORMA FINANCIAL STATEMENTS for the nine months ended 30 June 2013 and year ended 30 September 2012
69
2. PROFORMA ADJUSTMENTS (cont’d)
Unaudited Proforma Balance Sheets as at 30 June 2013 and as 30 September 2012
The following adjustments have been made in arriving at the Unaudited Proforma Balance Sheets as at 30 June 2013 and 30 September 2012:
Historical Unaudited
consolidated proforma
balance sheet balance sheet
(i) (ii)
$'000 $'000 $'000 $'000
30 June 2013
NON-CURRENT ASSETS
Investment Properties 3,026,623 - - 3,026,623
Fixed Assets 31,113 - - 31,113
Investments in Associates 1,038,558 1,038,558
Financial Assets 2,163 - - 2,163
Other Assets 106,902 - - 106,902
Other Receivables 166,214 - - 166,214
Deferred Tax Assets 2,937 - - 2,937
-
4,374,510 - - 4,374,510
CURRENT ASSETS
Inventory, at cost 3,764 - - 3,764
Properties Held for Sale 4,888,179 - - 4,888,179
Trade and Other Receivables 263,285 - - 263,285
Prepayments 26,205 - - 26,205
Derivative Financial Instruments 6,940 - - 6,940
Cash and Cash Equivalents 981,152 - - 981,152
6,169,525 - - 6,169,525
TOTAL ASSETS 10,544,035 - - 10,544,035
CURRENT LIABILITIES
Trade and Other Payables 1,854,329 - (563,926) 1,290,403
Provision for Taxation 101,504 - - 101,504
Derivative Financial Instruments 5,624 - - 5,624
Loans and Borrowings 265,709 - 563,926 829,635
2,227,166 - - 2,227,166
NET CURRENT ASSETS 3,942,359 - - 3,942,359
8,316,869 - - 8,316,869
NON-CURRENT LIABILITIES
Loans and Borrowings 1,586,669 - 689,343 2,276,012
Other Payables 1,383,465 (670,000) (689,343) 24,122
Derivative Financial Instruments 2,781 - - 2,781
Deferred Tax Liabilities 109,439 - - 109,439
3,082,354 (670,000) - 2,412,354
TOTAL LIABILITIES 5,309,520 (670,000) - 4,639,520
NET ASSETS 5,234,515 670,000 - 5,904,515
EQUITY ATTRIBUTABLE TO
SHAREHOLDER OF THE COMPANY
Share Capital 1,083,977 670,000 - 1,753,977
Retained Earnings 4,129,898 - - 4,129,898
Other Reserves 7,032 - - 7,032
5,220,907 670,000 - 5,890,907
Non-controlling Interests 13,608 - - 13,608
TOTAL EQUITY 5,234,515 670,000 - 5,904,515
Proforma Adjustments
Group
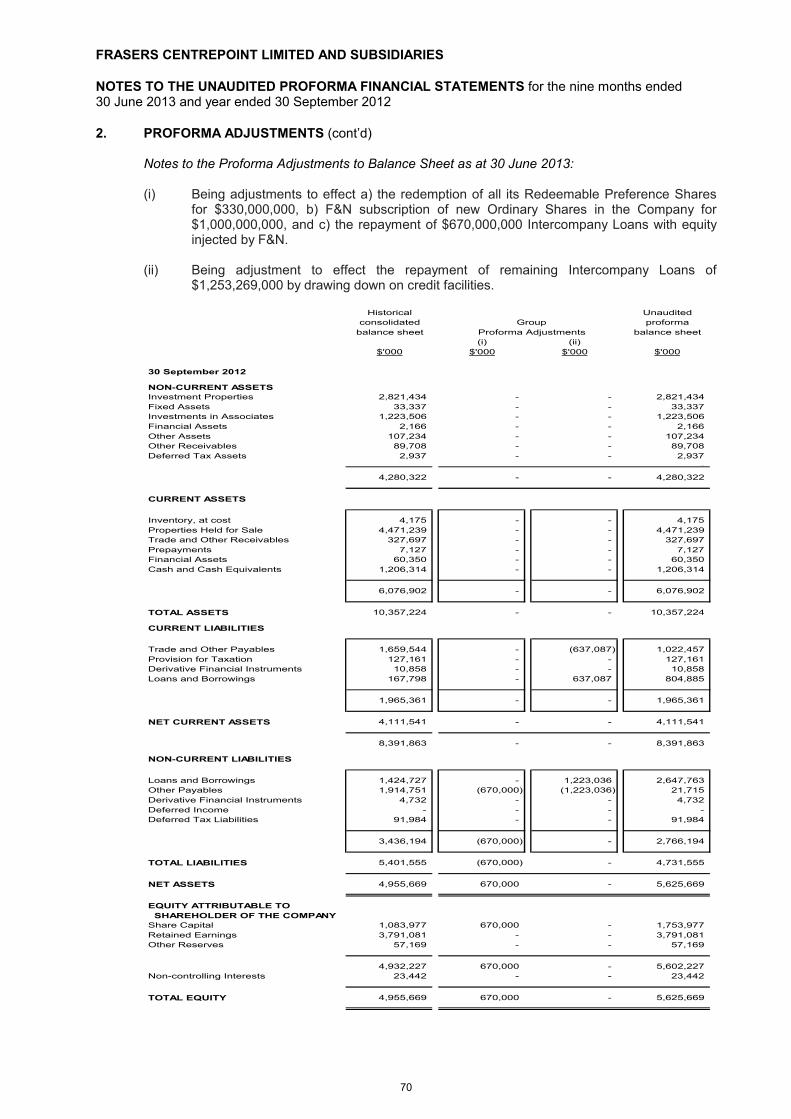
FRASERS CENTREPOINT LIMITED AND SUBSIDIARIES
NOTES TO THE UNAUDITED PROFORMA FINANCIAL STATEMENTS for the nine months ended 30 June 2013 and year ended 30 September 2012
70
2. PROFORMA ADJUSTMENTS (cont’d)
Notes to the Proforma Adjustments to Balance Sheet as at 30 June 2013:
(i) Being adjustments to effect a) the redemption of all its Redeemable Preference Shares for $330,000,000, b) F&N subscription of new Ordinary Shares in the Company for $1,000,000,000, and c) the repayment of $670,000,000 Intercompany Loans with equity injected by F&N.
(ii) Being adjustment to effect the repayment of remaining Intercompany Loans of $1,253,269,000 by drawing down on credit facilities.
Historical Unaudited
consolidated proforma
balance sheet balance sheet
(i) (ii)
$'000 $'000 $'000 $'000
30 September 2012
NON-CURRENT ASSETS
Investment Properties 2,821,434 - - 2,821,434
Fixed Assets 33,337 - - 33,337
Investments in Associates 1,223,506 - - 1,223,506
Financial Assets 2,166 - - 2,166
Other Assets 107,234 - - 107,234
Other Receivables 89,708 - - 89,708
Deferred Tax Assets 2,937 - - 2,937
-
4,280,322 - - 4,280,322
CURRENT ASSETS
Inventory, at cost 4,175 - - 4,175
Properties Held for Sale 4,471,239 - - 4,471,239
Trade and Other Receivables 327,697 - - 327,697
Prepayments 7,127 - - 7,127
Financial Assets 60,350 - - 60,350
Cash and Cash Equivalents 1,206,314 - - 1,206,314
6,076,902 - - 6,076,902
TOTAL ASSETS 10,357,224 - - 10,357,224
CURRENT LIABILITIES
Trade and Other Payables 1,659,544 - (637,087) 1,022,457
Provision for Taxation 127,161 - - 127,161
Derivative Financial Instruments 10,858 - - 10,858
Loans and Borrowings 167,798 - 637,087 804,885
1,965,361 - - 1,965,361
NET CURRENT ASSETS 4,111,541 - - 4,111,541
8,391,863 - - 8,391,863
NON-CURRENT LIABILITIES
Loans and Borrowings 1,424,727 - 1,223,036 2,647,763
Other Payables 1,914,751 (670,000) (1,223,036) 21,715
Derivative Financial Instruments 4,732 - - 4,732
Deferred Income - - - -
Deferred Tax Liabilities 91,984 - - 91,984
3,436,194 (670,000) - 2,766,194
TOTAL LIABILITIES 5,401,555 (670,000) - 4,731,555
NET ASSETS 4,955,669 670,000 - 5,625,669
EQUITY ATTRIBUTABLE TO
SHAREHOLDER OF THE COMPANY
Share Capital 1,083,977 670,000 - 1,753,977
Retained Earnings 3,791,081 - - 3,791,081
Other Reserves 57,169 - - 57,169
4,932,227 670,000 - 5,602,227
Non-controlling Interests 23,442 - - 23,442
TOTAL EQUITY 4,955,669 670,000 - 5,625,669
Group
Proforma Adjustments
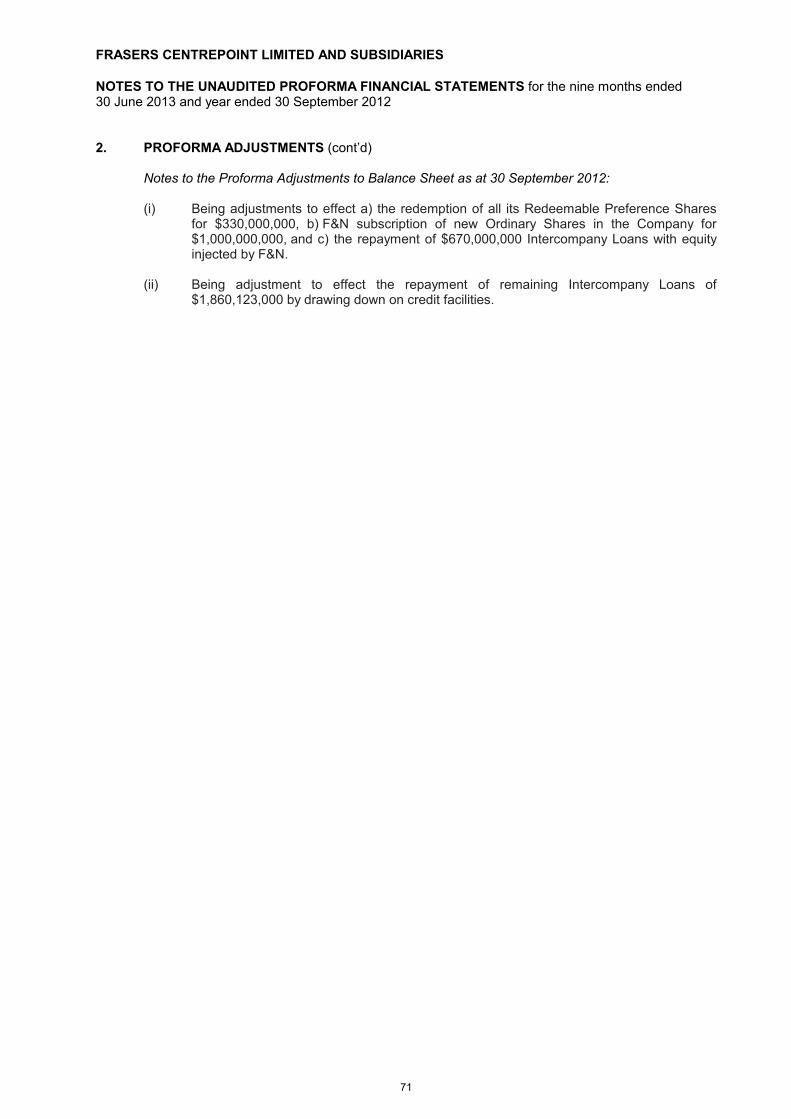
FRASERS CENTREPOINT LIMITED AND SUBSIDIARIES
NOTES TO THE UNAUDITED PROFORMA FINANCIAL STATEMENTS for the nine months ended 30 June 2013 and year ended 30 September 2012
71
2. PROFORMA ADJUSTMENTS (cont’d)
Notes to the Proforma Adjustments to Balance Sheet as at 30 September 2012:
(i) Being adjustments to effect a) the redemption of all its Redeemable Preference Shares for $330,000,000, b) F&N subscription of new Ordinary Shares in the Company for $1,000,000,000, and c) the repayment of $670,000,000 Intercompany Loans with equity injected by F&N.
(ii) Being adjustment to effect the repayment of remaining Intercompany Loans of $1,860,123,000 by drawing down on credit facilities.
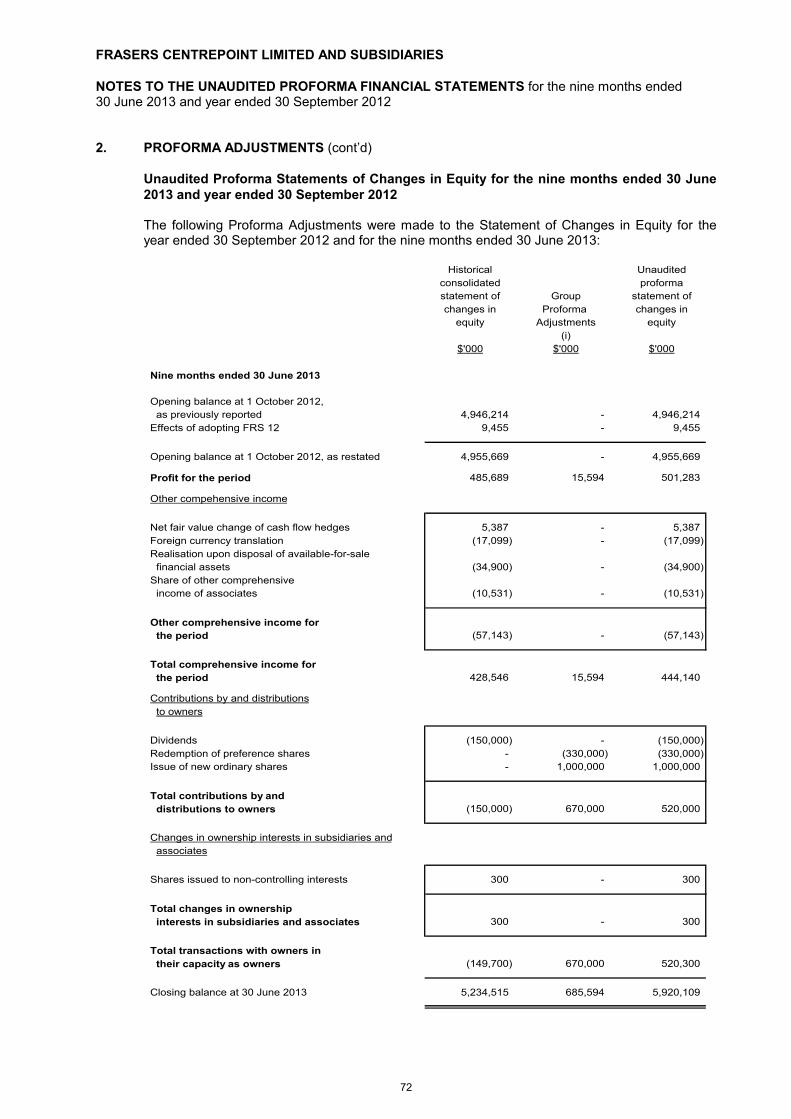
FRASERS CENTREPOINT LIMITED AND SUBSIDIARIES
NOTES TO THE UNAUDITED PROFORMA FINANCIAL STATEMENTS for the nine months ended 30 June 2013 and year ended 30 September 2012
72
2. PROFORMA ADJUSTMENTS (cont’d)
Unaudited Proforma Statements of Changes in Equity for the nine months ended 30 June 2013 and year ended 30 September 2012
The following Proforma Adjustments were made to the Statement of Changes in Equity for the year ended 30 September 2012 and for the nine months ended 30 June 2013:
Historical Unaudited
consolidated proforma
statement of Group statement of
changes in Proforma changes in
equity Adjustments equity
(i)
$'000 $'000 $'000
Nine months ended 30 June 2013
Opening balance at 1 October 2012,
as previously reported 4,946,214 - 4,946,214
Effects of adopting FRS 12 9,455 - 9,455
Opening balance at 1 October 2012, as restated 4,955,669 - 4,955,669
Profit for the period 485,689 15,594 501,283
Other compehensive income
Net fair value change of cash flow hedges 5,387 - 5,387
Foreign currency translation (17,099) - (17,099)
Realisation upon disposal of available-for-sale
financial assets (34,900) - (34,900)
Share of other comprehensive
income of associates (10,531) - (10,531)
Other comprehensive income for
the period (57,143) - (57,143)
Total comprehensive income for
the period 428,546 15,594 444,140
Contributions by and distributions
to owners
Dividends (150,000) - (150,000)
Redemption of preference shares - (330,000) (330,000)
Issue of new ordinary shares - 1,000,000 1,000,000
Total contributions by and
distributions to owners (150,000) 670,000 520,000
Changes in ownership interests in subsidiaries and
associates
Shares issued to non-controlling interests 300 - 300
Total changes in ownership
interests in subsidiaries and associates 300 - 300
Total transactions with owners in
their capacity as owners (149,700) 670,000 520,300
Closing balance at 30 June 2013 5,234,515 685,594 5,920,109

FRASERS CENTREPOINT LIMITED AND SUBSIDIARIES
NOTES TO THE UNAUDITED PROFORMA FINANCIAL STATEMENTS for the nine months ended 30 June 2013 and year ended 30 September 2012
73
2. PROFORMA ADJUSTMENTS (cont’d)
Note to the Proforma Adjustments to Statement of Changes in Equity for the nine months ended 30 June 2013:
(i) Being (a) adjustments to Share Capital to effect i) the redemption of all its Redeemable Preference Shares for $330,000,000, and ii) F&N subscription of new Ordinary Shares in the Company for $1,000,000,000; and (b) being adjustment to Profit for the period on lower interest costs.
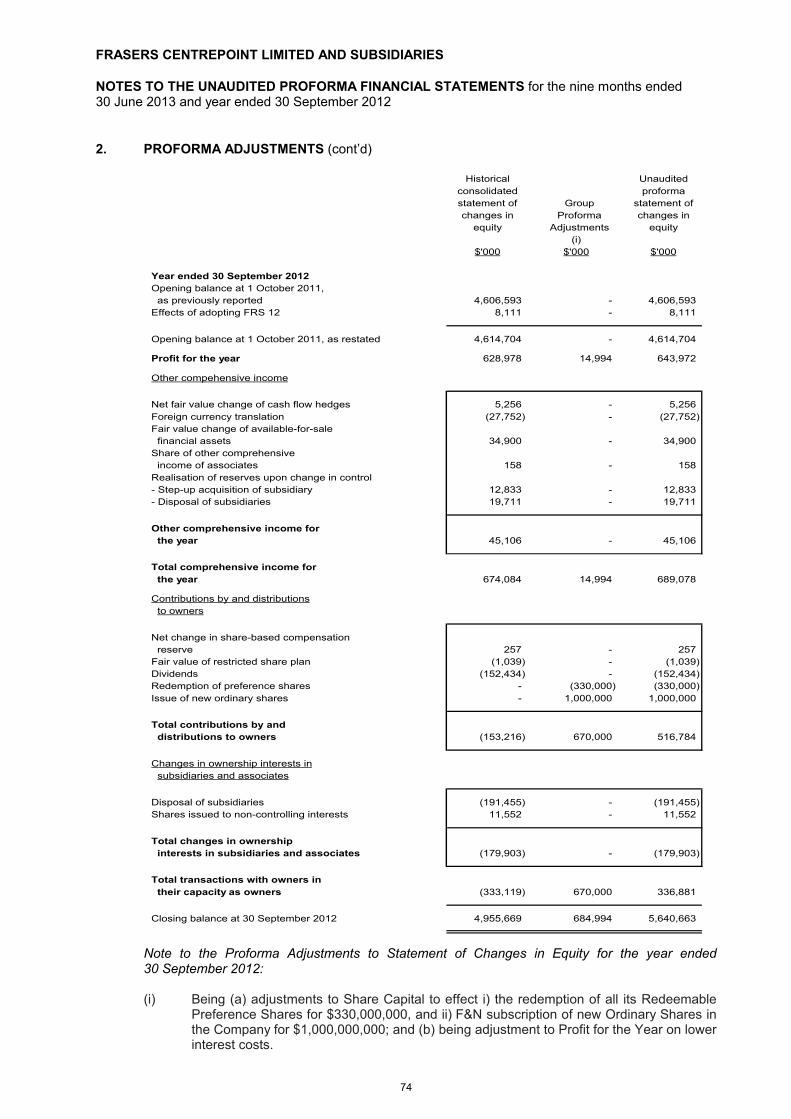
FRASERS CENTREPOINT LIMITED AND SUBSIDIARIES
NOTES TO THE UNAUDITED PROFORMA FINANCIAL STATEMENTS for the nine months ended 30 June 2013 and year ended 30 September 2012
74
2. PROFORMA ADJUSTMENTS (cont’d)
Historical Unaudited
consolidated proforma
statement of statement of
changes in changes in
equity equity
(i)
$'000 $'000 $'000
Year ended 30 September 2012
Opening balance at 1 October 2011,
as previously reported 4,606,593 - 4,606,593
Effects of adopting FRS 12 8,111 - 8,111
Opening balance at 1 October 2011, as restated 4,614,704 - 4,614,704
Profit for the year 628,978 14,994 643,972
Other compehensive income
Net fair value change of cash flow hedges 5,256 - 5,256
Foreign currency translation (27,752) - (27,752)
Fair value change of available-for-sale
financial assets 34,900 - 34,900
Share of other comprehensive
income of associates 158 - 158
Realisation of reserves upon change in control
- Step-up acquisition of subsidiary 12,833 - 12,833
- Disposal of subsidiaries 19,711 - 19,711
Other comprehensive income for
the year 45,106 - 45,106
Total comprehensive income for
the year 674,084 14,994 689,078
Contributions by and distributions
to owners
Net change in share-based compensation
reserve 257 - 257
Fair value of restricted share plan (1,039) - (1,039)
Dividends (152,434) - (152,434)
Redemption of preference shares - (330,000) (330,000)
Issue of new ordinary shares - 1,000,000 1,000,000
Total contributions by and
distributions to owners (153,216) 670,000 516,784
Changes in ownership interests in
subsidiaries and associates
Disposal of subsidiaries (191,455) - (191,455)
Shares issued to non-controlling interests 11,552 - 11,552
Total changes in ownership
interests in subsidiaries and associates (179,903) - (179,903)
Total transactions with owners in
their capacity as owners (333,119) 670,000 336,881
Closing balance at 30 September 2012 4,955,669 684,994 5,640,663
Adjustments
Proforma
Group
Note to the Proforma Adjustments to Statement of Changes in Equity for the year ended 30 September 2012:
(i) Being (a) adjustments to Share Capital to effect i) the redemption of all its Redeemable Preference Shares for $330,000,000, and ii) F&N subscription of new Ordinary Shares inthe Company for $1,000,000,000; and (b) being adjustment to Profit for the Year on lower interest costs.
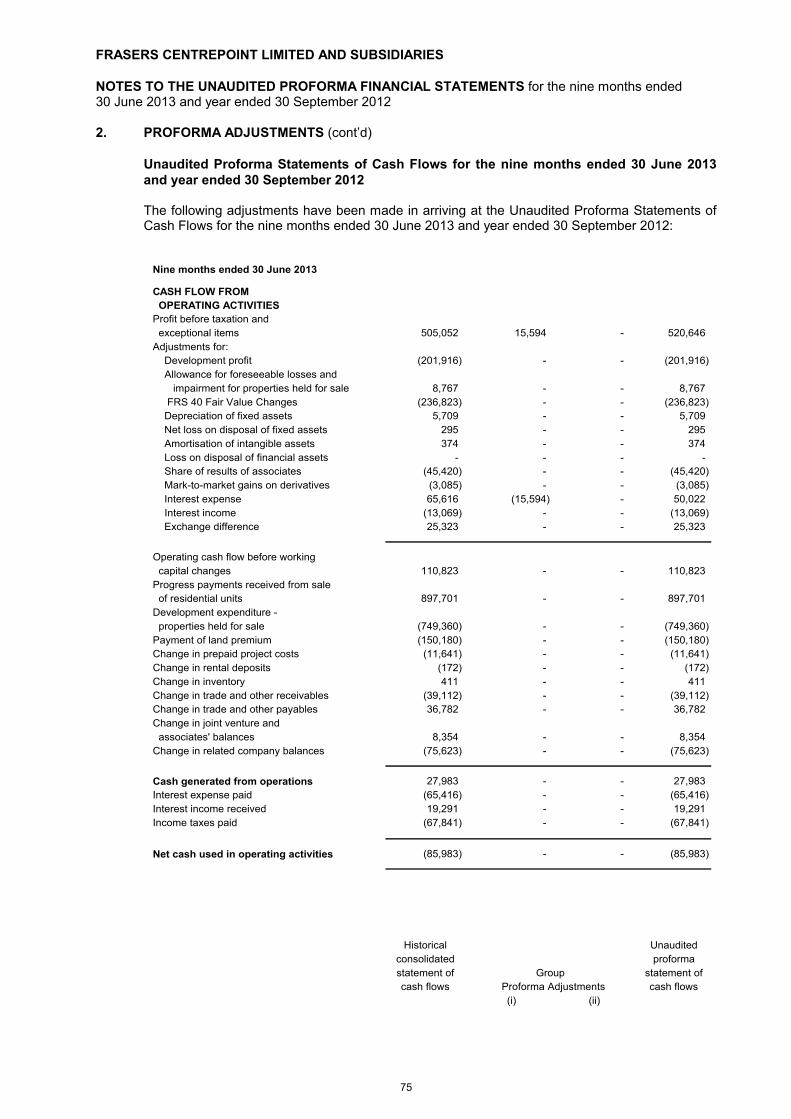
FRASERS CENTREPOINT LIMITED AND SUBSIDIARIES
NOTES TO THE UNAUDITED PROFORMA FINANCIAL STATEMENTS for the nine months ended 30 June 2013 and year ended 30 September 2012
75
2. PROFORMA ADJUSTMENTS (cont’d)
Unaudited Proforma Statements of Cash Flows for the nine months ended 30 June 2013 and year ended 30 September 2012
The following adjustments have been made in arriving at the Unaudited Proforma Statements of Cash Flows for the nine months ended 30 June 2013 and year ended 30 September 2012:
Nine months ended 30 June 2013
CASH FLOW FROM
OPERATING ACTIVITIES
Profit before taxation and
exceptional items 505,052 15,594 - 520,646
Adjustments for:
Development profit (201,916) - - (201,916)
Allowance for foreseeable losses and
impairment for properties held for sale 8,767 - - 8,767
FRS 40 Fair Value Changes (236,823) - - (236,823)
Depreciation of fixed assets 5,709 - - 5,709
Net loss on disposal of fixed assets 295 - - 295
Amortisation of intangible assets 374 - - 374
Loss on disposal of financial assets - - - -
Share of results of associates (45,420) - - (45,420)
Mark-to-market gains on derivatives (3,085) - - (3,085)
Interest expense 65,616 (15,594) - 50,022
Interest income (13,069) - - (13,069)
Exchange difference 25,323 - - 25,323
Operating cash flow before working
capital changes 110,823 - - 110,823
Progress payments received from sale
of residential units 897,701 - - 897,701
Development expenditure -
properties held for sale (749,360) - - (749,360)
Payment of land premium (150,180) - - (150,180)
Change in prepaid project costs (11,641) - - (11,641)
Change in rental deposits (172) - - (172)
Change in inventory 411 - - 411
Change in trade and other receivables (39,112) - - (39,112)
Change in trade and other payables 36,782 - - 36,782
Change in joint venture and
associates' balances 8,354 - - 8,354
Change in related company balances (75,623) - - (75,623)
Cash generated from operations 27,983 - - 27,983
Interest expense paid (65,416) - - (65,416)
Interest income received 19,291 - - 19,291
Income taxes paid (67,841) - - (67,841)
Net cash used in operating activities (85,983) - - (85,983)
Historical Unaudited
consolidated proforma
statement of statement of
cash flows cash flows
(i) (ii)
Proforma Adjustments
Group
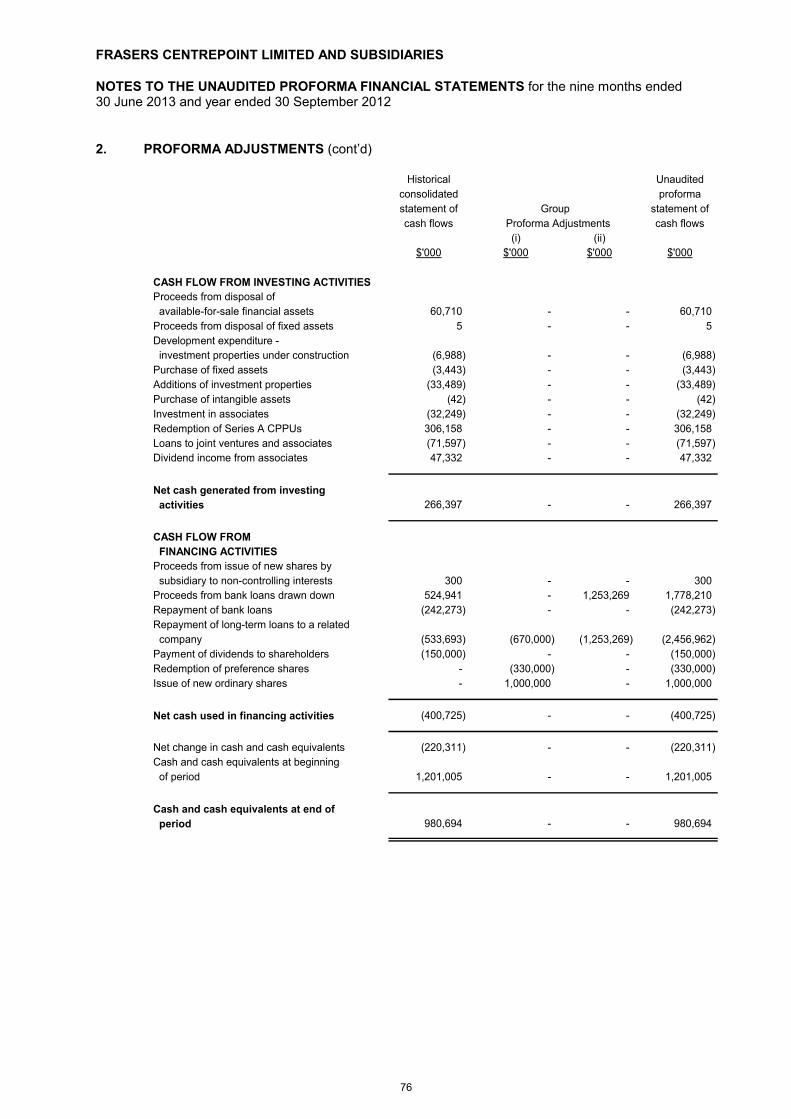
FRASERS CENTREPOINT LIMITED AND SUBSIDIARIES
NOTES TO THE UNAUDITED PROFORMA FINANCIAL STATEMENTS for the nine months ended 30 June 2013 and year ended 30 September 2012
76
2. PROFORMA ADJUSTMENTS (cont’d)
Historical Unaudited
consolidated proforma
statement of statement of
cash flows cash flows
(i) (ii)
$'000 $'000 $'000 $'000
CASH FLOW FROM INVESTING ACTIVITIES
Proceeds from disposal of
available-for-sale financial assets 60,710 - - 60,710
Proceeds from disposal of fixed assets 5 - - 5
Development expenditure -
investment properties under construction (6,988) - - (6,988)
Purchase of fixed assets (3,443) - - (3,443)
Additions of investment properties (33,489) - - (33,489)
Purchase of intangible assets (42) - - (42)
Investment in associates (32,249) - - (32,249)
Redemption of Series A CPPUs 306,158 - - 306,158
Loans to joint ventures and associates (71,597) - - (71,597)
Dividend income from associates 47,332 - - 47,332
Net cash generated from investing
activities 266,397 - - 266,397
CASH FLOW FROM
FINANCING ACTIVITIES
Proceeds from issue of new shares by
subsidiary to non-controlling interests 300 - - 300
Proceeds from bank loans drawn down 524,941 - 1,253,269 1,778,210
Repayment of bank loans (242,273) - - (242,273)
Repayment of long-term loans to a related
company (533,693) (670,000) (1,253,269) (2,456,962)
Payment of dividends to shareholders (150,000) - - (150,000)
Redemption of preference shares - (330,000) - (330,000)
Issue of new ordinary shares - 1,000,000 - 1,000,000
Net cash used in financing activities (400,725) - - (400,725)
Net change in cash and cash equivalents (220,311) - - (220,311)
Cash and cash equivalents at beginning
of period 1,201,005 - - 1,201,005
Cash and cash equivalents at end of
period 980,694 - - 980,694
Proforma Adjustments
Group
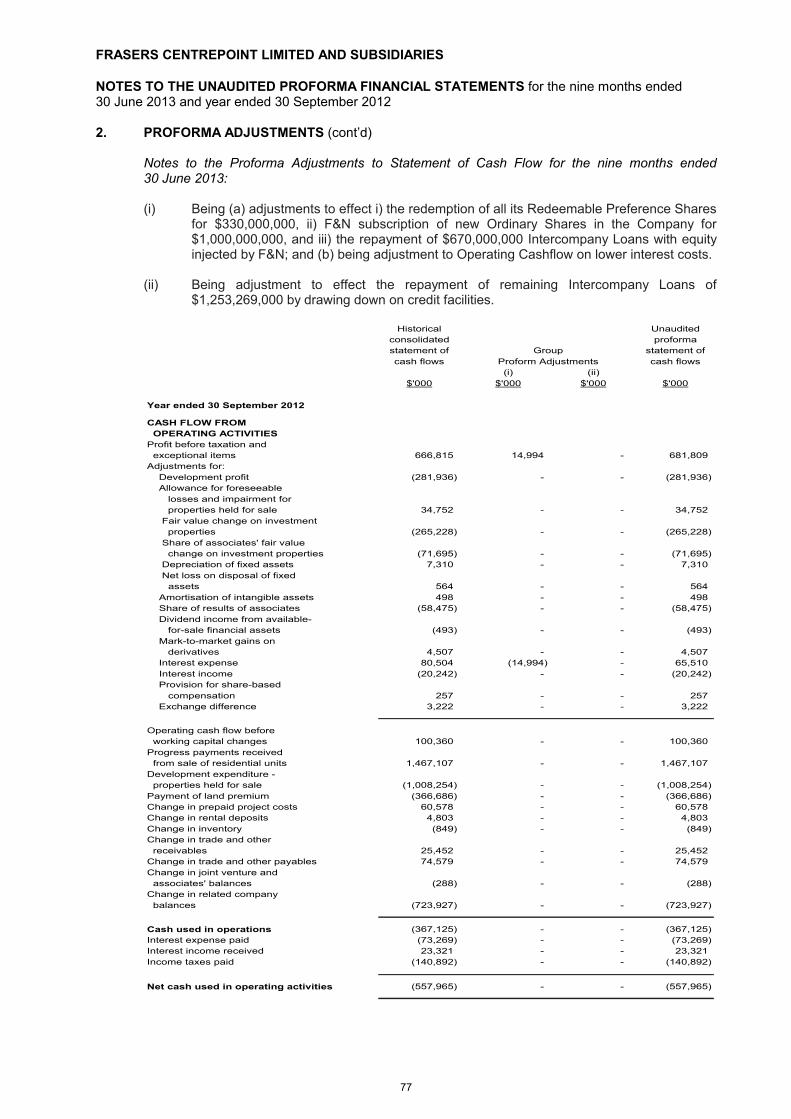
FRASERS CENTREPOINT LIMITED AND SUBSIDIARIES
NOTES TO THE UNAUDITED PROFORMA FINANCIAL STATEMENTS for the nine months ended 30 June 2013 and year ended 30 September 2012
77
2. PROFORMA ADJUSTMENTS (cont’d)
Notes to the Proforma Adjustments to Statement of Cash Flow for the nine months ended 30 June 2013:
(i) Being (a) adjustments to effect i) the redemption of all its Redeemable Preference Shares for $330,000,000, ii) F&N subscription of new Ordinary Shares in the Company for $1,000,000,000, and iii) the repayment of $670,000,000 Intercompany Loans with equity injected by F&N; and (b) being adjustment to Operating Cashflow on lower interest costs.
(ii) Being adjustment to effect the repayment of remaining Intercompany Loans of $1,253,269,000 by drawing down on credit facilities.
Historical Unaudited
consolidated proforma
statement of statement of
cash flows cash flows
(i) (ii)
$'000 $'000 $'000 $'000
Year ended 30 September 2012
CASH FLOW FROM
OPERATING ACTIVITIES
Profit before taxation and
exceptional items 666,815 14,994 - 681,809
Adjustments for:
Development profit (281,936) - - (281,936)
Allowance for foreseeable
losses and impairment for
properties held for sale 34,752 - - 34,752
Fair value change on investment
properties (265,228) - - (265,228)
Share of associates' fair value
change on investment properties (71,695) - - (71,695)
Depreciation of fixed assets 7,310 - - 7,310
Net loss on disposal of fixed
assets 564 - - 564
Amortisation of intangible assets 498 - - 498
Share of results of associates (58,475) - - (58,475)
Dividend income from available-
for-sale financial assets (493) - - (493)
Mark-to-market gains on
derivatives 4,507 - - 4,507
Interest expense 80,504 (14,994) - 65,510
Interest income (20,242) - - (20,242)
Provision for share-based
compensation 257 - - 257
Exchange difference 3,222 - - 3,222
Operating cash flow before
working capital changes 100,360 - - 100,360
Progress payments received
from sale of residential units 1,467,107 - - 1,467,107
Development expenditure -
properties held for sale (1,008,254) - - (1,008,254)
Payment of land premium (366,686) - - (366,686)
Change in prepaid project costs 60,578 - - 60,578
Change in rental deposits 4,803 - - 4,803
Change in inventory (849) - - (849)
Change in trade and other
receivables 25,452 - - 25,452
Change in trade and other payables 74,579 - - 74,579
Change in joint venture and
associates' balances (288) - - (288)
Change in related company
balances (723,927) - - (723,927)
Cash used in operations (367,125) - - (367,125)
Interest expense paid (73,269) - - (73,269)
Interest income received 23,321 - - 23,321
Income taxes paid (140,892) - - (140,892)
Net cash used in operating activities (557,965) - - (557,965)
Proform Adjustments
Group
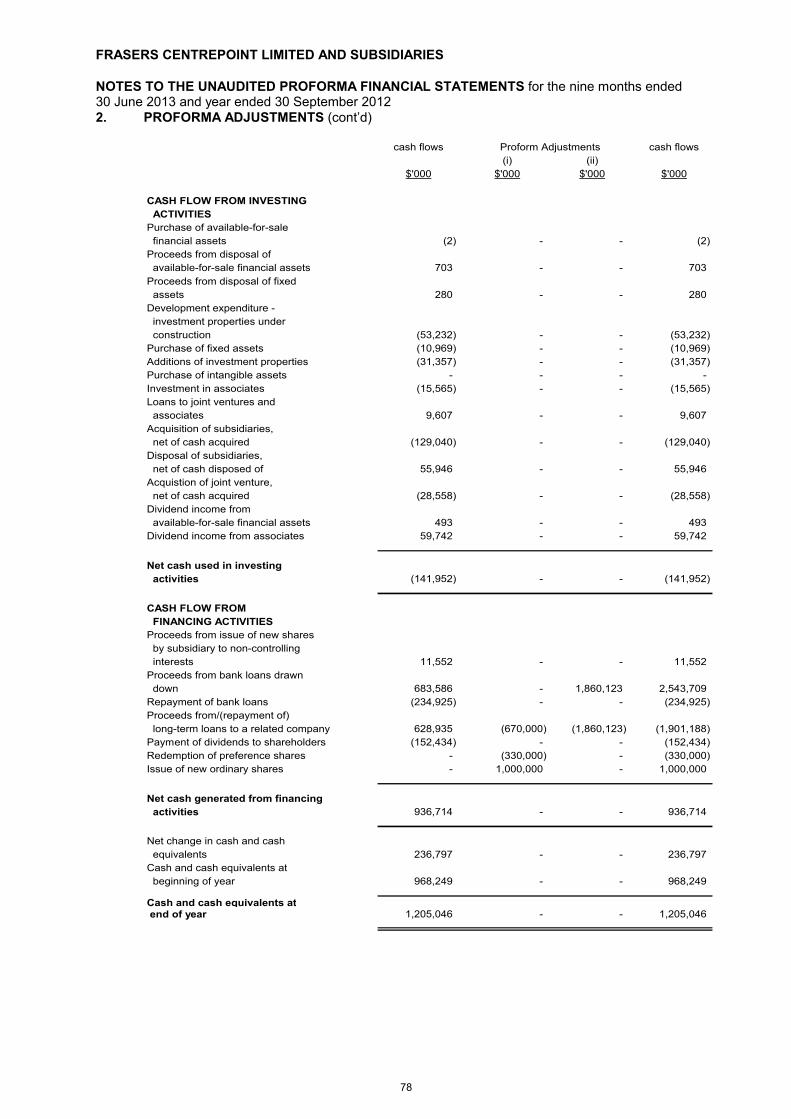
FRASERS CENTREPOINT LIMITED AND SUBSIDIARIES
NOTES TO THE UNAUDITED PROFORMA FINANCIAL STATEMENTS for the nine months ended 30 June 2013 and year ended 30 September 2012
78
2. PROFORMA ADJUSTMENTS (cont’d)
cash flows cash flows
(i) (ii)
$'000 $'000 $'000 $'000
CASH FLOW FROM INVESTING
ACTIVITIES
Purchase of available-for-sale
financial assets (2) - - (2)
Proceeds from disposal of
available-for-sale financial assets 703 - - 703
Proceeds from disposal of fixed
assets 280 - - 280
Development expenditure -
investment properties under
construction (53,232) - - (53,232)
Purchase of fixed assets (10,969) - - (10,969)
Additions of investment properties (31,357) - - (31,357)
Purchase of intangible assets - - - -
Investment in associates (15,565) - - (15,565)
Loans to joint ventures and
associates 9,607 - - 9,607
Acquisition of subsidiaries,
net of cash acquired (129,040) - - (129,040)
Disposal of subsidiaries,
net of cash disposed of 55,946 - - 55,946
Acquistion of joint venture,
net of cash acquired (28,558) - - (28,558)
Dividend income from
available-for-sale financial assets 493 - - 493
Dividend income from associates 59,742 - - 59,742
Net cash used in investing
activities (141,952) - - (141,952)
CASH FLOW FROM
FINANCING ACTIVITIES
Proceeds from issue of new shares
by subsidiary to non-controlling
interests 11,552 - - 11,552
Proceeds from bank loans drawn
down 683,586 - 1,860,123 2,543,709
Repayment of bank loans (234,925) - - (234,925)
Proceeds from/(repayment of)
long-term loans to a related company 628,935 (670,000) (1,860,123) (1,901,188)
Payment of dividends to shareholders (152,434) - - (152,434)
Redemption of preference shares - (330,000) - (330,000)
Issue of new ordinary shares - 1,000,000 - 1,000,000
Net cash generated from financing
activities 936,714 - - 936,714
Net change in cash and cash
equivalents 236,797 - - 236,797
Cash and cash equivalents at
beginning of year 968,249 - - 968,249
Cash and cash equivalents at end of year 1,205,046 - - 1,205,046
Proform Adjustments
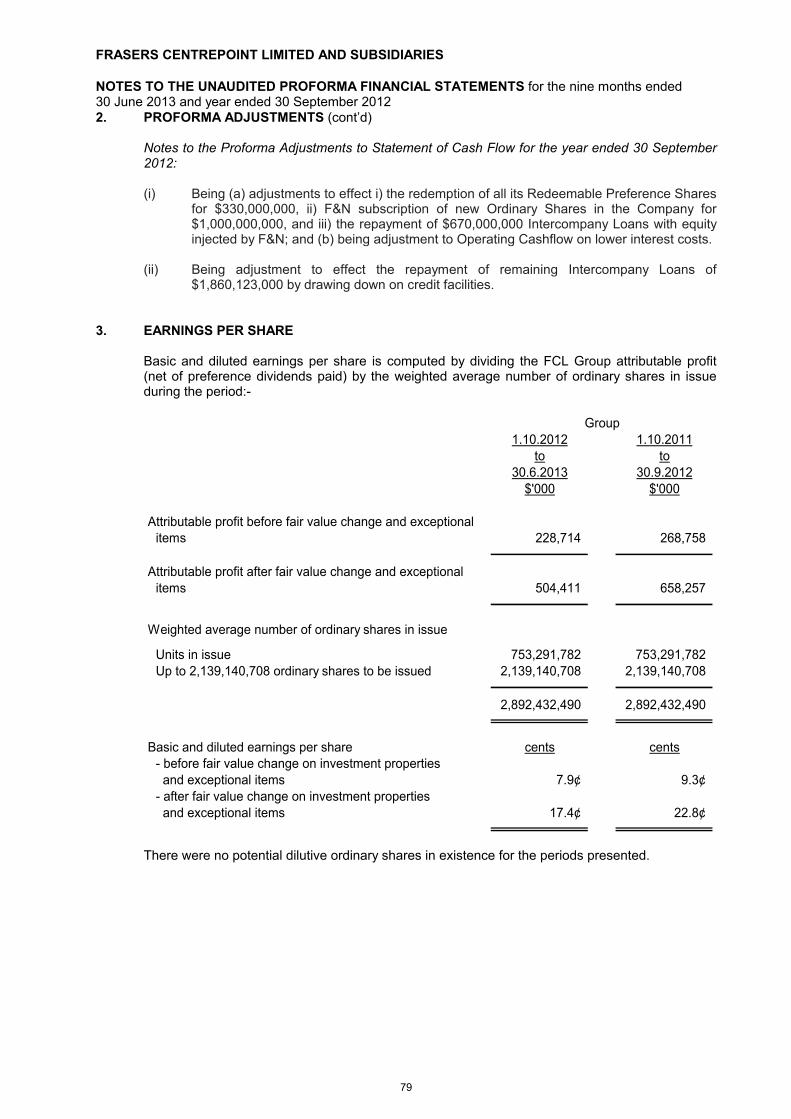
FRASERS CENTREPOINT LIMITED AND SUBSIDIARIES
NOTES TO THE UNAUDITED PROFORMA FINANCIAL STATEMENTS for the nine months ended 30 June 2013 and year ended 30 September 2012
79
2. PROFORMA ADJUSTMENTS (cont’d)
Notes to the Proforma Adjustments to Statement of Cash Flow for the year ended 30 September 2012:
(i) Being (a) adjustments to effect i) the redemption of all its Redeemable Preference Shares for $330,000,000, ii) F&N subscription of new Ordinary Shares in the Company for $1,000,000,000, and iii) the repayment of $670,000,000 Intercompany Loans with equity injected by F&N; and (b) being adjustment to Operating Cashflow on lower interest costs.
(ii) Being adjustment to effect the repayment of remaining Intercompany Loans of $1,860,123,000 by drawing down on credit facilities.
3. EARNINGS PER SHARE
Basic and diluted earnings per share is computed by dividing the FCL Group attributable profit (net of preference dividends paid) by the weighted average number of ordinary shares in issue during the period:-
1.10.2012 1.10.2011to to
30.6.2013 30.9.2012$'000 $'000
Attributable profit before fair value change and exceptional
items 228,714 268,758
Attributable profit after fair value change and exceptionalitems 504,411 658,257
Weighted average number of ordinary shares in issue
Units in issue 753,291,782 753,291,782 Up to 2,139,140,708 ordinary shares to be issued 2,139,140,708 2,139,140,708
2,892,432,490 2,892,432,490
Basic and diluted earnings per share cents cents- before fair value change on investment properties and exceptional items 7.9¢ 9.3¢- after fair value change on investment properties and exceptional items 17.4¢ 22.8¢
Group
There were no potential dilutive ordinary shares in existence for the periods presented.
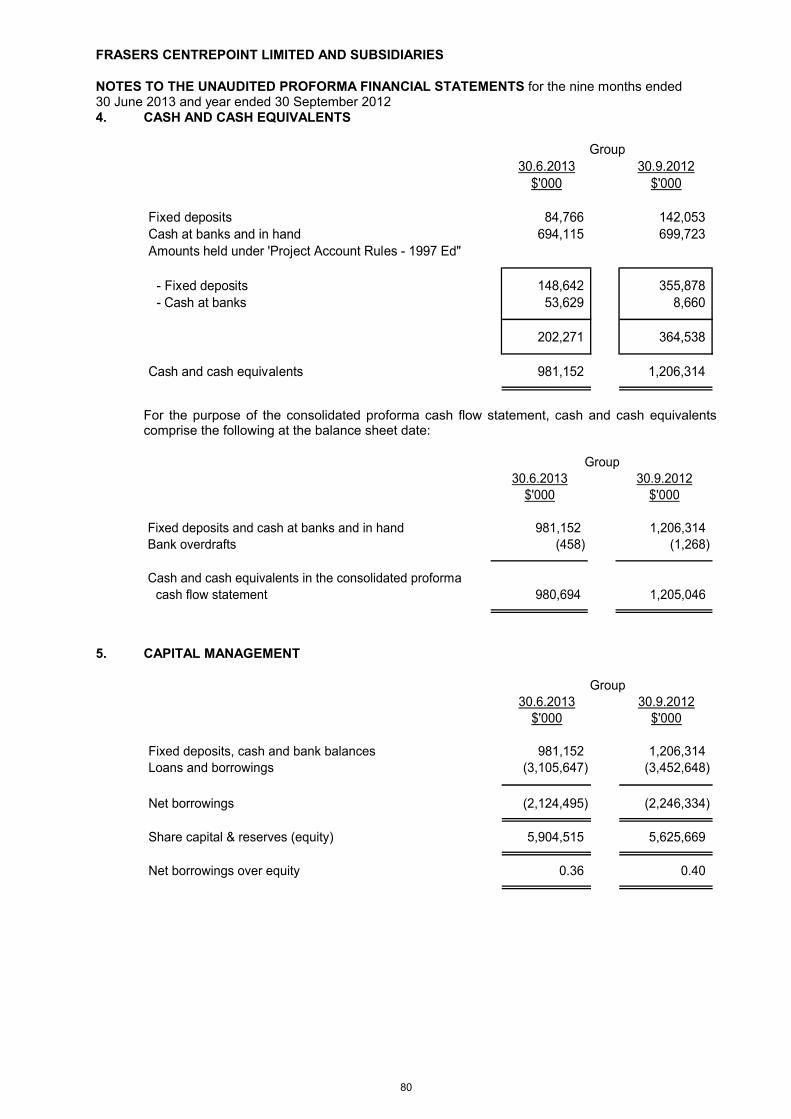
FRASERS CENTREPOINT LIMITED AND SUBSIDIARIES
NOTES TO THE UNAUDITED PROFORMA FINANCIAL STATEMENTS for the nine months ended 30 June 2013 and year ended 30 September 2012
80
4. CASH AND CASH EQUIVALENTS
30.6.2013 30.9.2012$'000 $'000
Fixed deposits 84,766 142,053 Cash at banks and in hand 694,115 699,723 Amounts held under 'Project Account Rules - 1997 Ed"
- Fixed deposits 148,642 355,878 - Cash at banks 53,629 8,660
202,271 364,538
Cash and cash equivalents 981,152 1,206,314
Group
For the purpose of the consolidated proforma cash flow statement, cash and cash equivalents comprise the following at the balance sheet date:
30.6.2013 30.9.2012$'000 $'000
Fixed deposits and cash at banks and in hand 981,152 1,206,314 Bank overdrafts (458) (1,268)
Cash and cash equivalents in the consolidated proforma
cash flow statement 980,694 1,205,046
Group
5. CAPITAL MANAGEMENT
30.6.2013 30.9.2012$'000 $'000
Fixed deposits, cash and bank balances 981,152 1,206,314 Loans and borrowings (3,105,647) (3,452,648)
Net borrowings (2,124,495) (2,246,334)
Share capital & reserves (equity) 5,904,515 5,625,669
Net borrowings over equity 0.36 0.40
Group
For Immediate Release
Fraser and Neave further unlocks shareholder value via the listing of its property arm, Frasers Centrepoint Limited
F&N shareholders to receive, at no cost, two FCL shares for each F&N
share held
The listing of FCL shares is expected in November or December 2013
TCC Assets intends to vote in favour of the in-specie distribution
Singapore, 27 August 2013 – Fraser and Neave, Limited (“F&N” or the “Company”) today
announced a proposal to list its property arm, Frasers Centrepoint Limited (“FCL”) by
undertaking a dividend in-specie distribution of FCL shares to F&N shareholders. FCL is
expected to be listed by way of introduction on the Main Board of the Singapore Exchange
Securities Trading Limited (“SGX-ST”).
Upon obtaining the relevant approvals, F&N shareholders will receive, at no cost, two FCL
shares for every one F&N share owned. F&N and FCL will be traded separately on the SGX-ST.
The listing of FCL shares is expected in November or December 2013. Following the completion
of the proposed transaction, F&N will no longer have an interest in FCL.
The in-specie distribution and listing exercise is an effective way to release value to F&N
shareholders. It provides sharper focus on the growth of the Food & Beverage and Properties
businesses as independently-listed entities, and paves the way for further growth in both
sectors. This is consistent with the Company’s strategy of maximising value for shareholders.
1
Following the in-specie distribution exercise, F&N and Thai Beverage Public Company Limited
will be able to draw on each other's strengths in their regional distribution networks, product
development capabilities and their portfolio of beverage brands. This exercise will solidify
F&N’s position as a leading consumer group in South-east Asia.
Upon listing, FCL will be a separate standalone entity listed on the SGX-ST, with its own
independent Board and Management. FCL will enjoy greater corporate visibility and have direct
access to capital markets to pursue its growth strategies, building on its established market
leading position as an integrated real estate player.
Mr. Lim Ee Seng, Group Chief Executive Officer of FCL said, “This is another milestone in FCL’s
corporate history. The listing will enhance FCL’s profile, and enable us to pursue our growth
strategies independently. Our priority is to continue creating value for shareholders through
optimising capital productivity, seeking sustainable earnings growth and expanding the asset
portfolio in a balanced manner to preserve stability of earnings.”
On FCL’s plans moving forward, Mr. Lim said, “In addition to Singapore, China and Australia are
core markets for FCL and we will continue to focus on the residential and commercial property
development sectors there. We will also continue to grow fee-based management contracts
under our serviced residence brands, and undertake asset enhancement initiatives on our
investment properties to improve asset yields and capital values. To further unlock value, we
are also considering the establishment of a hospitality REIT.”
The proposed transaction, which is subject to approvals by F&N shareholders at an
Extraordinary General Meeting (“EGM”), the SGX-ST and relevant approvals and consents,
provides F&N shareholders the flexibility to decide on their investment holdings in two
separately listed companies, without any additional cash outlay.
A circular outlining the details of the above transaction will be despatched to F&N shareholders
by about the end of October, after which an EGM is expected to be convened in November. The
Books Closure Date and the listing of FCL shares are expected to follow thereafter.
2
TCC Assets Limited, which holds about 61.59 per cent stake in F&N, has notified the Company
of its intention to vote in favour of the proposed in-specie distribution.
- END -
For clarification and further enquiries, please contact:
Fraser and Neave, Limited
HUI Choon Kit Chief Financial Officer Email: [email protected] Tel: +65 6318 9272 Jennifer YU Investor Relations Manager Email: [email protected] Tel: +65 6318 9231
Newgate Communications
Terence FOO Managing Partner Email: [email protected] Tel: +65 6532 0606 LIM Yuan See Partner Email: [email protected] Tel: +65 6532 0606
3
About Fraser and Neave, Limited
Established in 1883, Fraser and Neave, Limited is a leading Asia Pacific Consumer Group with
expertise and prominent standing in the Food & Beverage, Property and Publishing & Printing
industries.
Leveraging its strengths in marketing and distribution; research and development; brands and
financial management; as well as years of acquisition experience, F&N provides key resources
and sets strategic directions for its subsidiary companies across all three industries.
Listed on the Singapore stock exchange, F&N ranks as one of the most established and
successful companies in the region with an impressive array of renowned brands that enjoy
strong market leadership. It has shareholders’ funds and total assets employed of over S$8
billion and S$14 billion. F&N is present in over 20 countries spanning Asia Pacific, Europe and
the USA, and employs over 10,000 people worldwide.
For more information on F&N, please visit www.fraserandneave.com.
About Frasers Centrepoint Limited
Frasers Centrepoint Limited, the wholly-owned property arm of Singapore-listed consumer
group F&N, is one of Singapore’s top property companies, with total assets of S$10.54 billion.
From owning just a single shopping mall in 1983, Frasers Centrepoint has since grown to
become an integrated real estate company with a portfolio of residential, commercial and
serviced residences spanning 19 countries across Asia, Australasia, Europe and the Middle-East.
Its serviced residences management company, Frasers Hospitality, has award-winning gold-
standard serviced residences in 39 cities. Frasers Property, FCL’s international property arm,
develops projects in Australia, China, Malaysia, New Zealand, Thailand and the UK.
4
FCL also manages Frasers Centrepoint Trust (FCT, a Singapore-listed retail trust), and Frasers
Commercial Trust (FCOT, a Singapore-listed office/business space trust).
As a testament to its excellent service standards, best practices and support of the environment,
the company is the proud recipient of numerous awards and accolades both locally and abroad.
Frasers Centrepoint Limited was formerly known as Centrepoint Properties Limited, which was
previously listed on SGX-ST in 1988. Centrepoint Properties Limited was de-listed in March 2002,
and subsequently re-branded as Frasers Centrepoint Limited in 2006.
For more information on FCL, please visit www.fraserscentrepoint.com
5
Fraser & Neave, Limited Dividend in Specie
27 August 2013
2 Important Notice
Certain statements in this Presentation constitute “forward-looking statements”, including forward-looking financial information. Such forward-looking statements and financial information involve known and unknown risks, uncertainties and other factors which may cause the actual results, performance or achievements of F&NL and/or FCL, or industry results, to be materially different from any future results, performance or achievements expressed or implied by such forward-looking statements and financial information. Such forward-looking statements and financial information are based on numerous assumptions regarding F&NL’s and/or FCL’s present and future business strategies and the environment in which F&NL and/or FCL will operate in the future. Because these statements and financial information reflect F&NL’s and/or FCL’s current views concerning future events, these statements and financial information necessarily involve risks, uncertainties and assumptions. Actual future performance could differ materially from these forward-looking statements and financial information. F&NL and FCL expressly disclaim any obligation or undertaking to release publicly any updates or revisions to any forward-looking statement or financial information contained in this Presentation to reflect any change in F&NL’s and FCL’s expectations with regard thereto or any change in events, conditions or circumstances on which any such statement or information is based, subject to compliance with all applicable laws and regulations and/or the rules of the SGX-ST and/or any other regulatory or supervisory body or agency. This Presentation includes market and industry data and forecast that have been obtained from internal surveys, reports and studies, where appropriate, as well as market research, publicly available information and industry publications. Industry publications, surveys and forecasts generally state that the information they contain has been obtained from sources believed to be reliable, but there can be no assurance as to the accuracy or completeness of such included information. While F&NL and FCL have taken reasonable steps to ensure that the information is extracted accurately and in its proper context, F&NL and FCL have not independently verified any of the data from third party sources or ascertained the underlying economic assumptions relied upon therein.
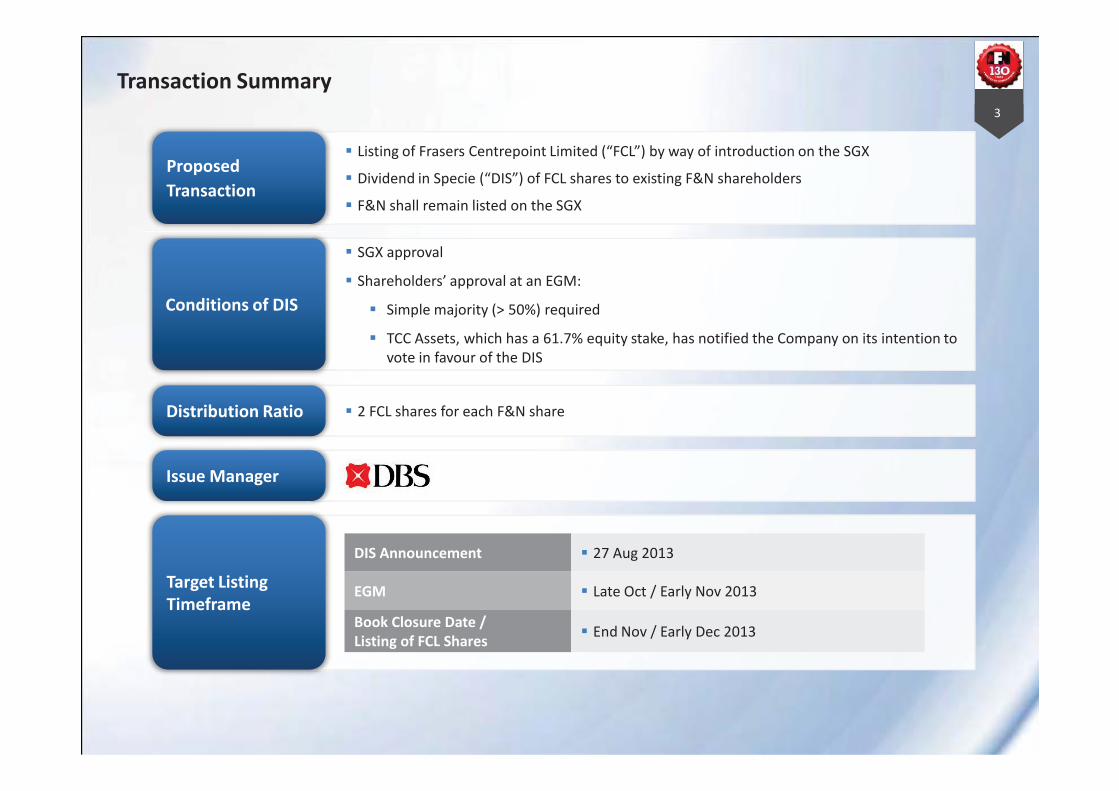
Transaction Summary 3
Listing of Frasers Centrepoint Limited (“FCL”) by way of introduction on the SGX
Dividend in Specie (“DIS”) of FCL shares to existing F&N shareholders
F&N shall remain listed on the SGX
Proposed Transaction
SGX approval
Shareholders’ approval at an EGM:
Simple majority (> 50%) required
TCC Assets, which has a 61.7% equity stake, has notified the Company on its intention to vote in favour of the DIS
Conditions of DIS
2 FCL shares for each F&N share Distribution Ratio
Issue Manager
Target Listing Timeframe
DIS Announcement 27 Aug 2013
EGM Late Oct / Early Nov 2013
Book Closure Date / Listing of FCL Shares
End Nov / Early Dec 2013
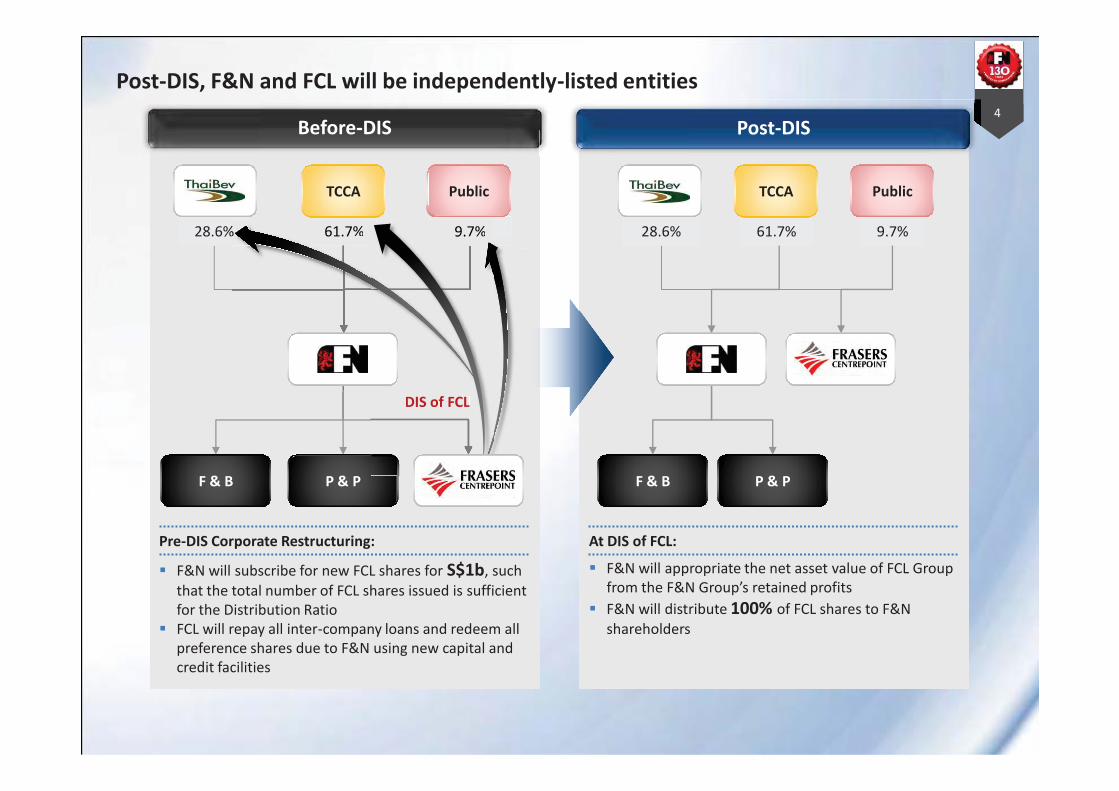
Post-DIS, F&N and FCL will be independently-listed entities 4
DIS of FCL
9.7%
P & P
Public
28.6% 61.7%
TCCA
F & B
9.7%
P & P
Public
28.6% 61.7%
TCCA
% 61.7%
Post-DIS Before-DIS
DIS of FCL
%9.7%
Pre-DIS Corporate Restructuring:
F&N will subscribe for new FCL shares for S$1b, such that the total number of FCL shares issued is sufficient for the Distribution Ratio FCL will repay all inter-company loans and redeem all preference shares due to F&N using new capital and credit facilities
At DIS of FCL:
F&N will appropriate the net asset value of FCL Group from the F&N Group’s retained profits F&N will distribute 100% of FCL shares to F&N shareholders
F & B
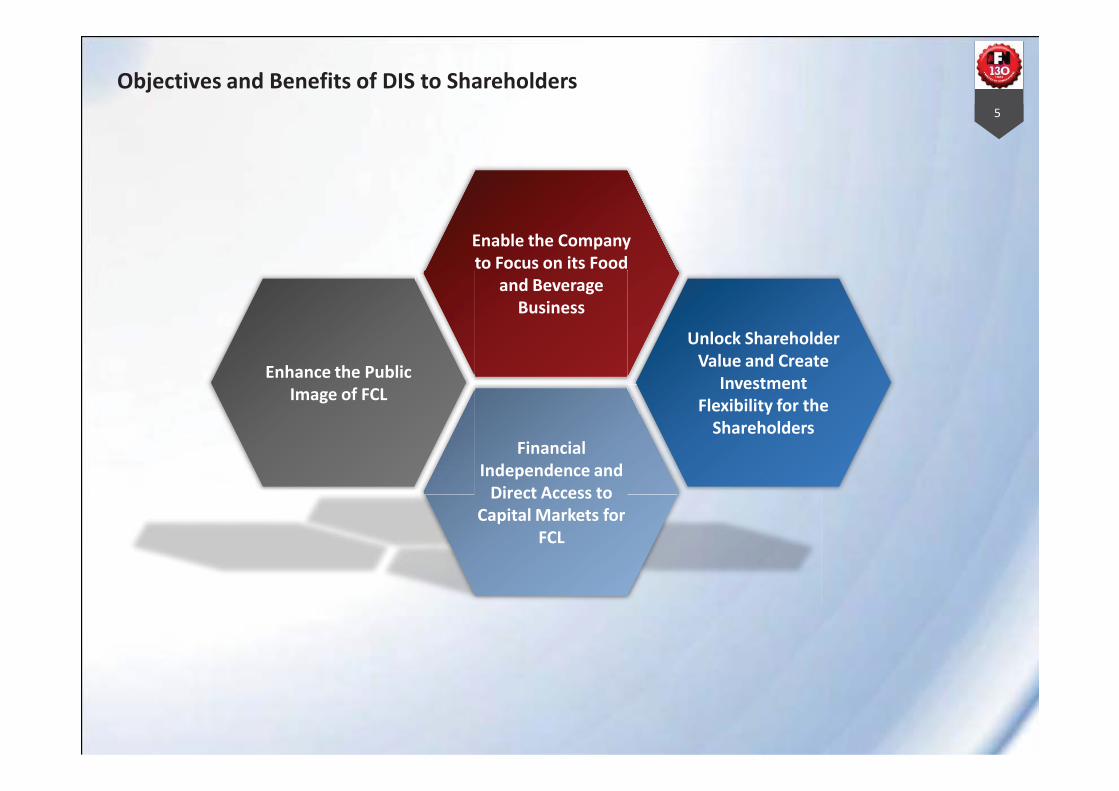
Objectives and Benefits of DIS to Shareholders 5
Enable the Company to Focus on its Food
and Beverage Business
Financial Independence and
Direct Access to Capital Markets for
FCL
Unlock Shareholder Value and Create
Investment Flexibility for the
Shareholders
Enhance the Public Image of FCL
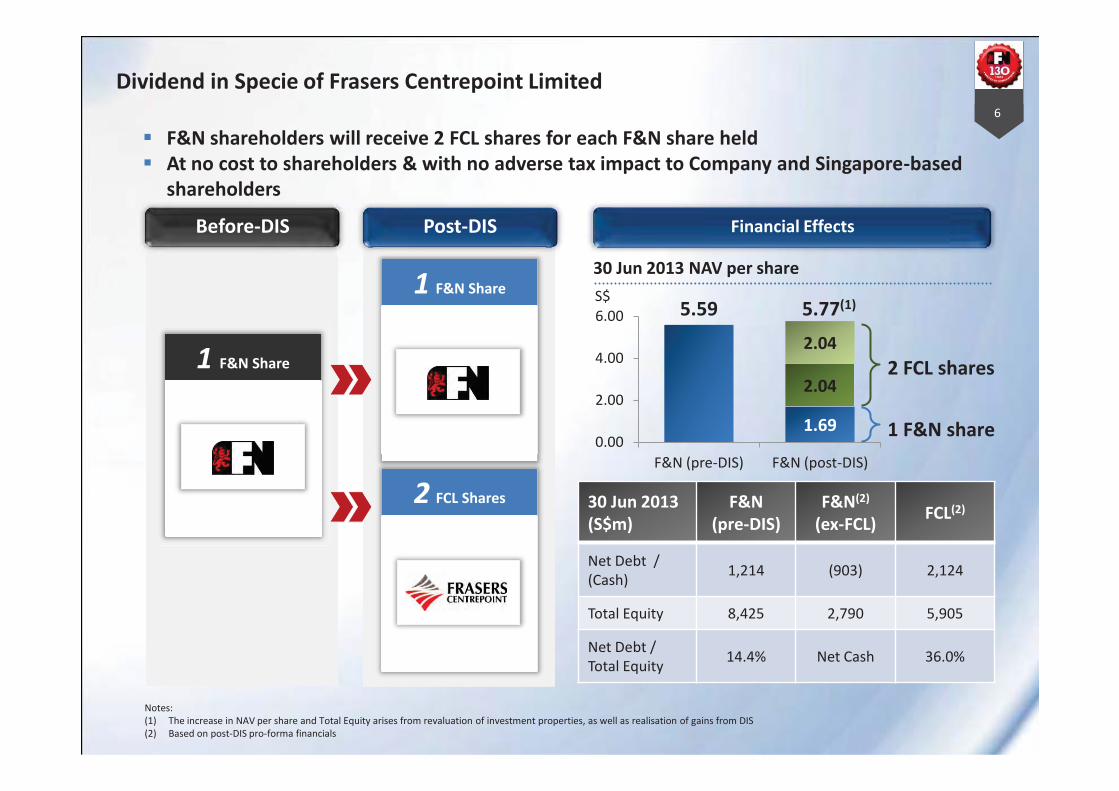
6
F&N shareholders will receive 2 FCL shares for each F&N share held At no cost to shareholders & with no adverse tax impact to Company and Singapore-based shareholders
Post-DIS Before-DIS
1 F&N Share
Dividend in Specie of Frasers Centrepoint Limited
2 FCL Shares
1 F&N Share
Financial Effects
30 Jun 2013 NAV per share
30 Jun 2013 (S$m)
F&N (pre-DIS)
F&N(2) (ex-FCL)
FCL(2)
Net Debt / (Cash)
1,214 (903) 2,124
Total Equity 8,425 2,790 5,905
Net Debt / Total Equity
14.4% Net Cash 36.0%
1.69
2.04
2.04
0.00
2.00
4.00
6.00
F&N (pre-DIS) F&N (post-DIS)
2 FCL shares
S$ 5.77(1)
1 F&N share
5.59
Notes: (1) The increase in NAV per share and Total Equity arises from revaluation of investment properties, as well as realisation of gains from DIS (2) Based on post-DIS pro-forma financials

Fraser & Neave, Limited
Sharpening Our
Focus on F&B
27 August 2013
2
Certain statements in this Presentation constitute “forward-looking statements”, including forward-looking financial information. Such forward-looking statements and financial information involve known and unknown risks, uncertainties and other factors which may cause the actual results, performance or achievements of F&NL and/or FCL, or industry results, to be materially different from any future results, performance or achievements expressed or implied by such forward-looking statements and financial information. Such forward-looking statements and financial information are based on numerous assumptions regarding F&NL’s and/or FCL’s present and future business strategies and the environment in which F&NL and/or FCL will operate in the future. Because these statements and financial information reflect F&NL’s and/or FCL’s current views concerning future events, these statements and financial information necessarily involve risks, uncertainties and assumptions. Actual future performance could differ materially from these forward-looking statements and financial information. F&NL and FCL expressly disclaim any obligation or undertaking to release publicly any updates or revisions to any forward-looking statement or financial information contained in this Presentation to reflect any change in F&NL’s and FCL’s expectations with regard thereto or any change in events, conditions or circumstances on which any such statement or information is based, subject to compliance with all applicable laws and regulations and/or the rules of the SGX-ST and/or any other regulatory or supervisory body or agency. This Presentation includes market and industry data and forecast that have been obtained from internal surveys, reports and studies, where appropriate, as well as market research, publicly available information and industry publications. Industry publications, surveys and forecasts generally state that the information they contain has been obtained from sources believed to be reliable, but there can be no assurance as to the accuracy or completeness of such included information. While F&NL and FCL have taken reasonable steps to ensure that the information is extracted accurately and in its proper context, F&NL and FCL have not independently verified any of the data from third party sources or ascertained the underlying economic assumptions relied upon therein.
Content Page
Content Page 3
Section Page
Section A Overview of F&N 4
Section B Strategies In Place 6
Section C Overview of P&P 15
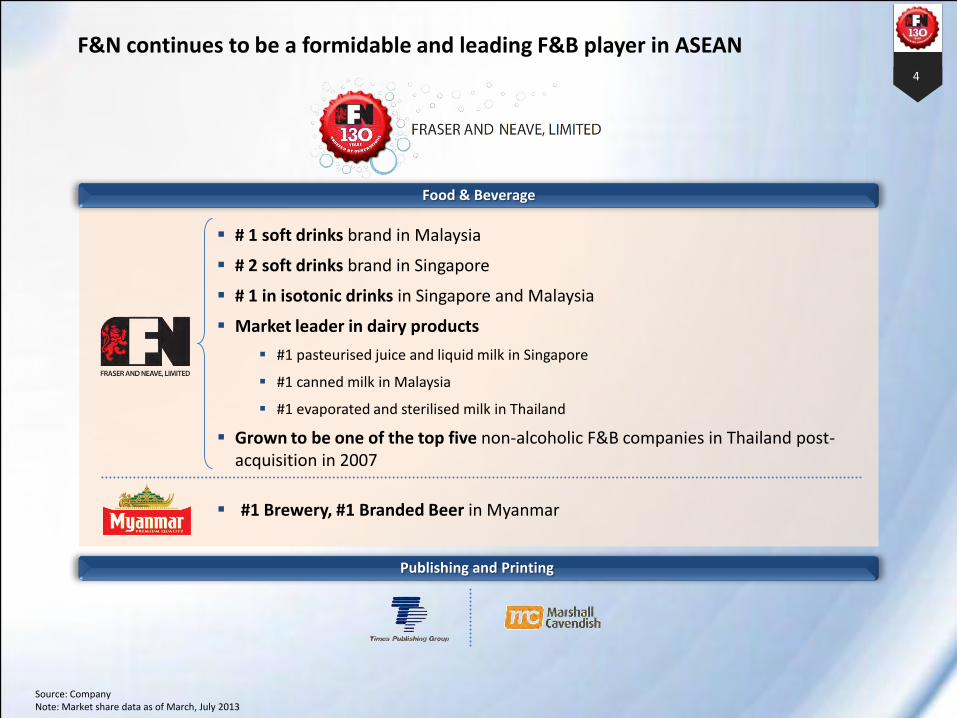
F&N continues to be a formidable and leading F&B player in ASEAN 4
Food & Beverage
Publishing and Printing
Source: Company Note: Market share data as of March, July 2013
# 1 soft drinks brand in Malaysia
# 2 soft drinks brand in Singapore
# 1 in isotonic drinks in Singapore and Malaysia
Market leader in dairy products
#1 pasteurised juice and liquid milk in Singapore
#1 canned milk in Malaysia
#1 evaporated and sterilised milk in Thailand
Grown to be one of the top five non-alcoholic F&B companies in Thailand post-acquisition in 2007
#1 Brewery, #1 Branded Beer in Myanmar
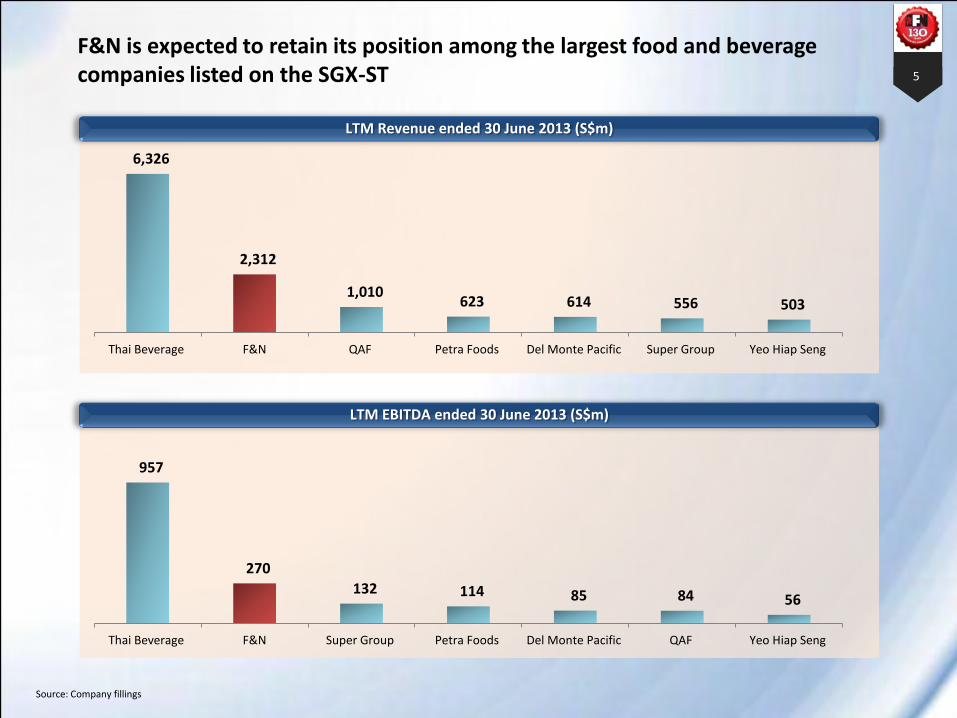
6,326
2,312
1,010 623 614 556 503
Thai Beverage F&N QAF Petra Foods Del Monte Pacific Super Group Yeo Hiap Seng
F&N is expected to retain its position among the largest food and beverage companies listed on the SGX-ST 5
Source: Company fillings
LTM Revenue ended 30 June 2013 (S$m)
LTM EBITDA ended 30 June 2013 (S$m)
957
270
132 114 85 84 56
Thai Beverage F&N Super Group Petra Foods Del Monte Pacific QAF Yeo Hiap Seng
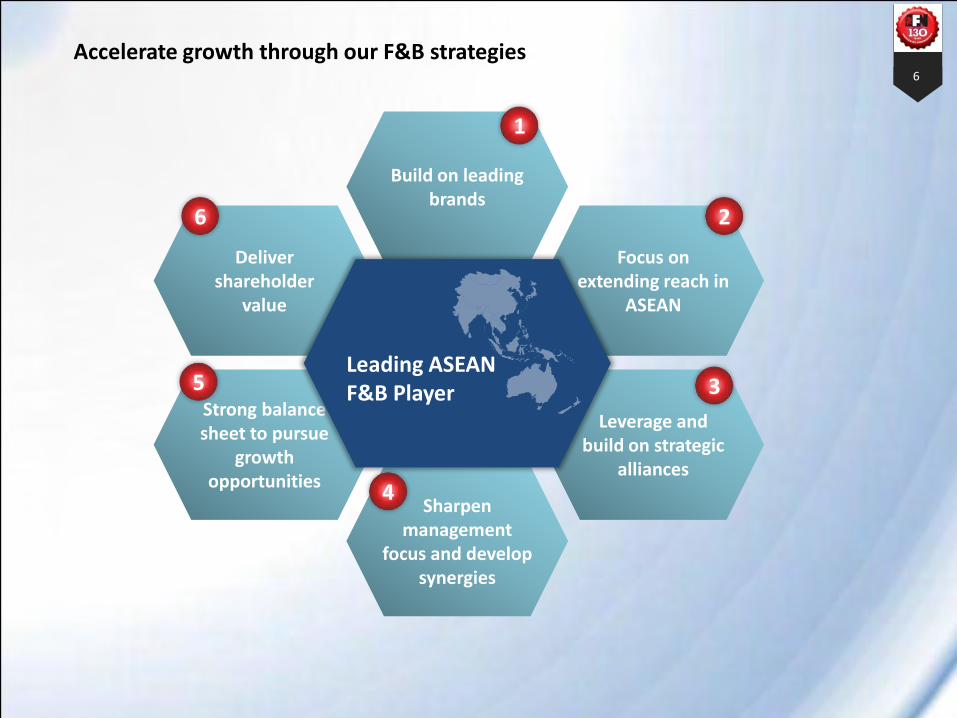
Accelerate growth through our F&B strategies 6
Build on leading brands
Focus on extending reach in
ASEAN
Leverage and build on strategic
alliances
Sharpen management
focus and develop synergies
Deliver shareholder
value
Strong balance sheet to pursue
growth opportunities
Leading ASEAN F&B Player
1
2
3
4
5
6
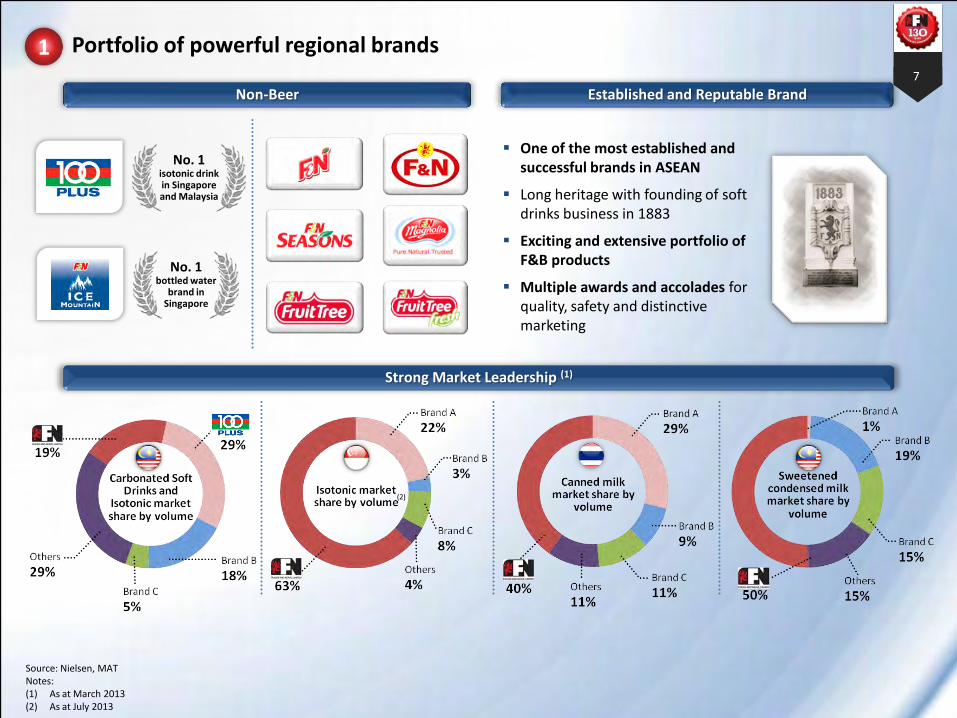
7
One of the most established and successful brands in ASEAN
Long heritage with founding of soft drinks business in 1883
Exciting and extensive portfolio of F&B products
Multiple awards and accolades for quality, safety and distinctive marketing
Non-Beer
Portfolio of powerful regional brands
Established and Reputable Brand
Strong Market Leadership (1)
Source: Nielsen, MAT Notes: (1) As at March 2013 (2) As at July 2013
No. 1 isotonic drink in Singapore and Malaysia
No. 1 bottled water
brand in Singapore
1
(2)
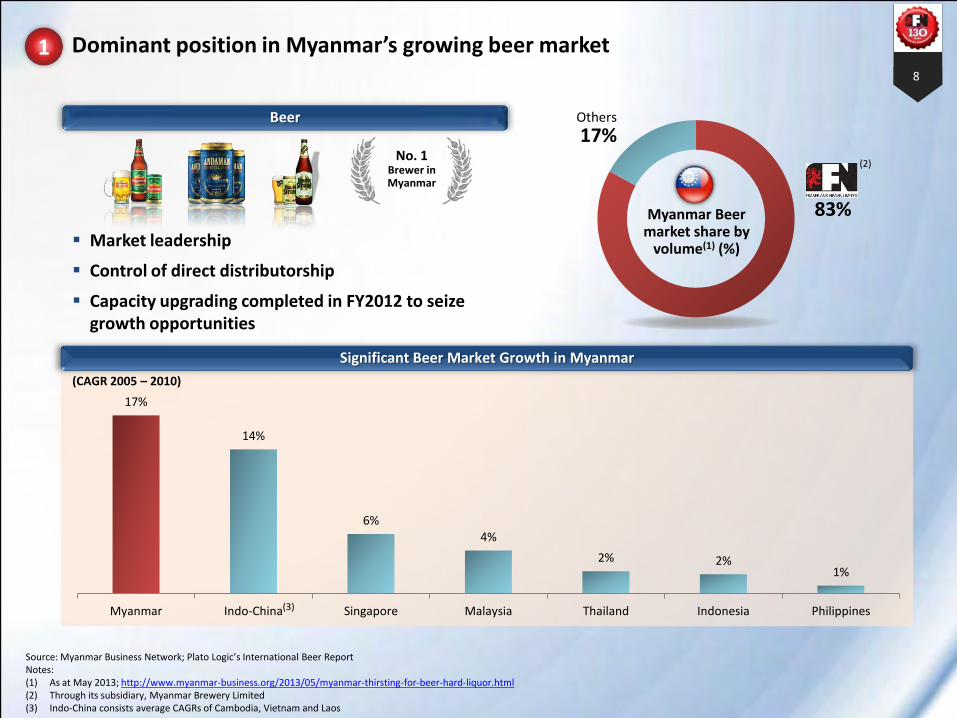
17%
14%
6% 4%
2% 2% 1%
Myanmar Indo-China Singapore Malaysia Thailand Indonesia Philippines
8
Beer
Dominant position in Myanmar’s growing beer market
No. 1 Brewer in Myanmar
Significant Beer Market Growth in Myanmar
Source: Myanmar Business Network; Plato Logic’s International Beer Report Notes: (1) As at May 2013; http://www.myanmar-business.org/2013/05/myanmar-thirsting-for-beer-hard-liquor.html (2) Through its subsidiary, Myanmar Brewery Limited (3) Indo-China consists average CAGRs of Cambodia, Vietnam and Laos
(CAGR 2005 – 2010)
1
83%
Others
17%
Myanmar Beer market share by
volume(1) (%)
(2)
Market leadership
Control of direct distributorship
Capacity upgrading completed in FY2012 to seize growth opportunities
(3)
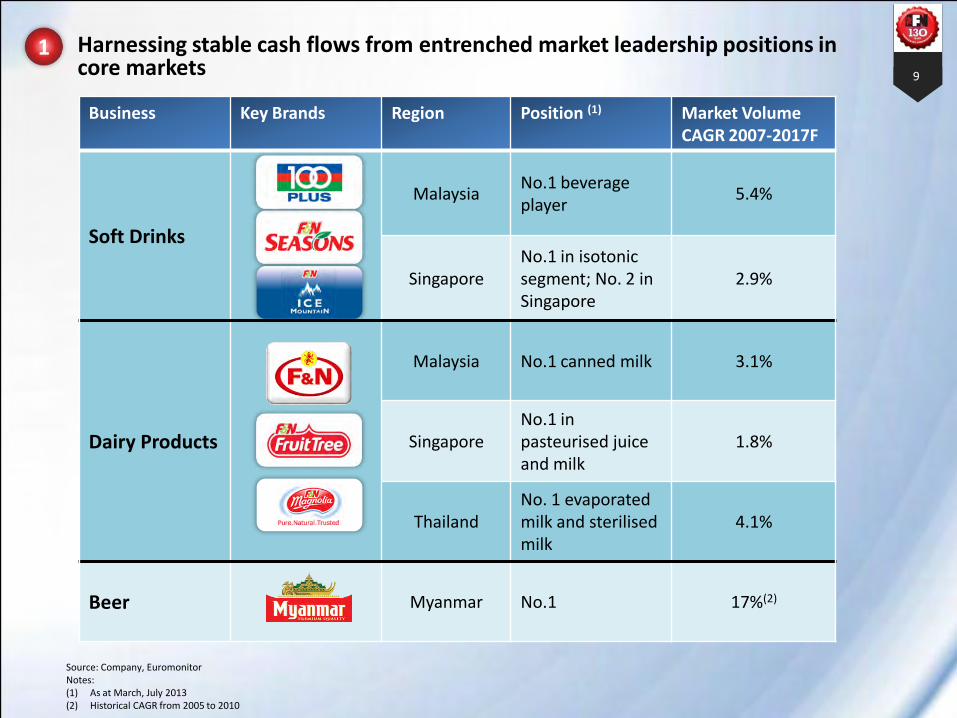
9
Harnessing stable cash flows from entrenched market leadership positions in core markets
Source: Company, Euromonitor Notes: (1) As at March, July 2013 (2) Historical CAGR from 2005 to 2010
Business Key Brands Region Position (1) Market Volume CAGR 2007-2017F
Soft Drinks
Malaysia No.1 beverage player
5.4%
Singapore No.1 in isotonic segment; No. 2 in Singapore
2.9%
Dairy Products
Malaysia No.1 canned milk 3.1%
Singapore No.1 in pasteurised juice and milk
1.8%
Thailand No. 1 evaporated milk and sterilised milk
4.1%
Beer Myanmar No.1 17%(2)
1
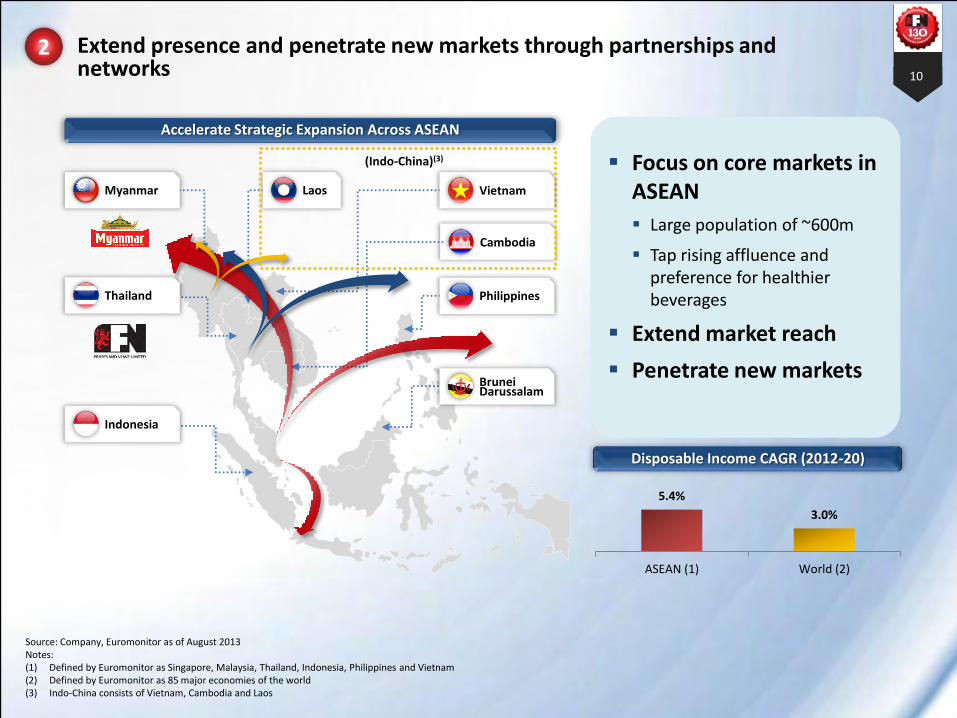
10
Focus on core markets in ASEAN
Large population of ~600m
Tap rising affluence and preference for healthier beverages
Extend market reach
Penetrate new markets
Extend presence and penetrate new markets through partnerships and networks
5.4%
3.0%
ASEAN (1) World (2)
Disposable Income CAGR (2012-20)
Source: Company, Euromonitor as of August 2013 Notes: (1) Defined by Euromonitor as Singapore, Malaysia, Thailand, Indonesia, Philippines and Vietnam (2) Defined by Euromonitor as 85 major economies of the world (3) Indo-China consists of Vietnam, Cambodia and Laos
Accelerate Strategic Expansion Across ASEAN
Cambodia
Philippines Thailand
Laos
(Indo-China)(3)
Indonesia
Myanmar Vietnam
Brunei Darussalam
2
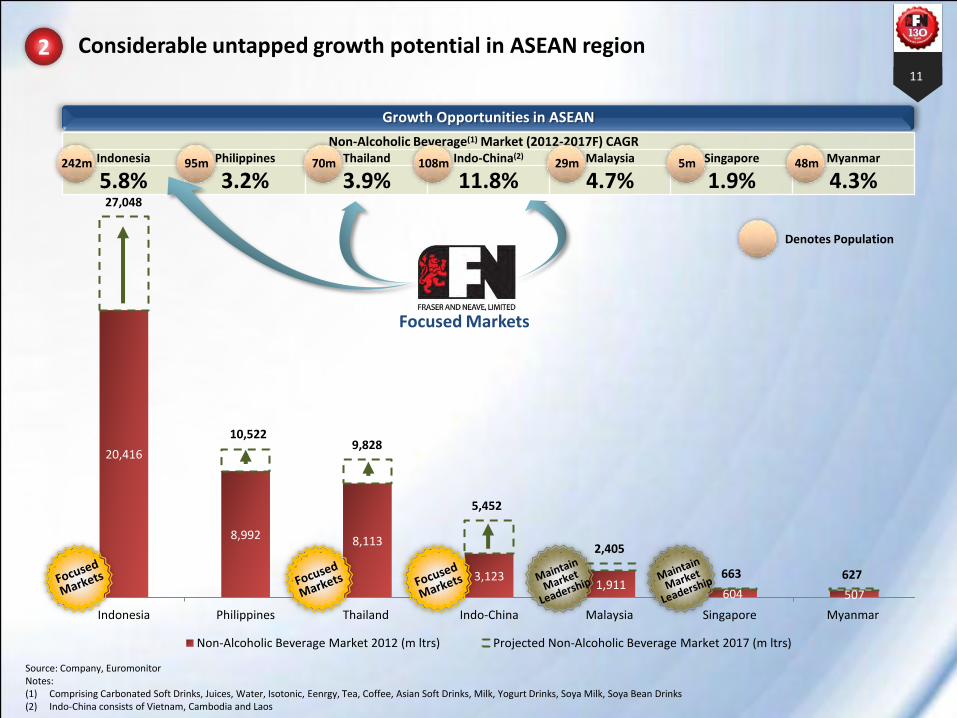
20,416
8,992 8,113
3,123 1,911
604 507
Indonesia Philippines Thailand Indo-China Malaysia Singapore Myanmar
Non-Alcoholic Beverage Market 2012 (m ltrs) Projected Non-Alcoholic Beverage Market 2017 (m ltrs)
627
11
Source: Company, Euromonitor Notes: (1) Comprising Carbonated Soft Drinks, Juices, Water, Isotonic, Eenrgy, Tea, Coffee, Asian Soft Drinks, Milk, Yogurt Drinks, Soya Milk, Soya Bean Drinks (2) Indo-China consists of Vietnam, Cambodia and Laos
2
Growth Opportunities in ASEAN
27,048
Non-Alcoholic Beverage(1) Market (2012-2017F) CAGR Indonesia Philippines Thailand Indo-China(2) Malaysia Singapore Myanmar
5.8% 3.2% 3.9% 11.8% 4.7% 1.9% 4.3%
10,522 9,828
5,452
2,405
663
Focused Markets
Considerable untapped growth potential in ASEAN region
242m 95m 70m 108m 29m 5m 48m
Denotes Population
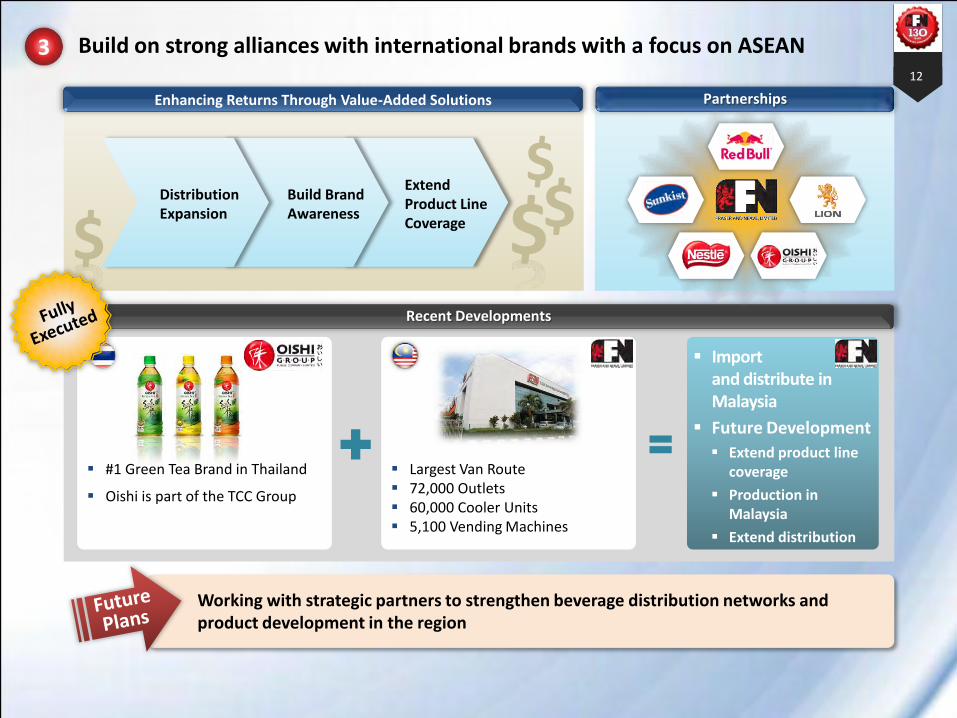
12
Build on strong alliances with international brands with a focus on ASEAN 3
$ Recent Developments
Partnerships
#1 Green Tea Brand in Thailand
Oishi is part of the TCC Group
Largest Van Route 72,000 Outlets 60,000 Cooler Units 5,100 Vending Machines
Import and distribute in Malaysia
Future Development
Extend product line coverage
Production in Malaysia
Extend distribution
Working with strategic partners to strengthen beverage distribution networks and product development in the region
Enhancing Returns Through Value-Added Solutions
Distribution Expansion
Build Brand Awareness
Extend Product Line Coverage $ $
$
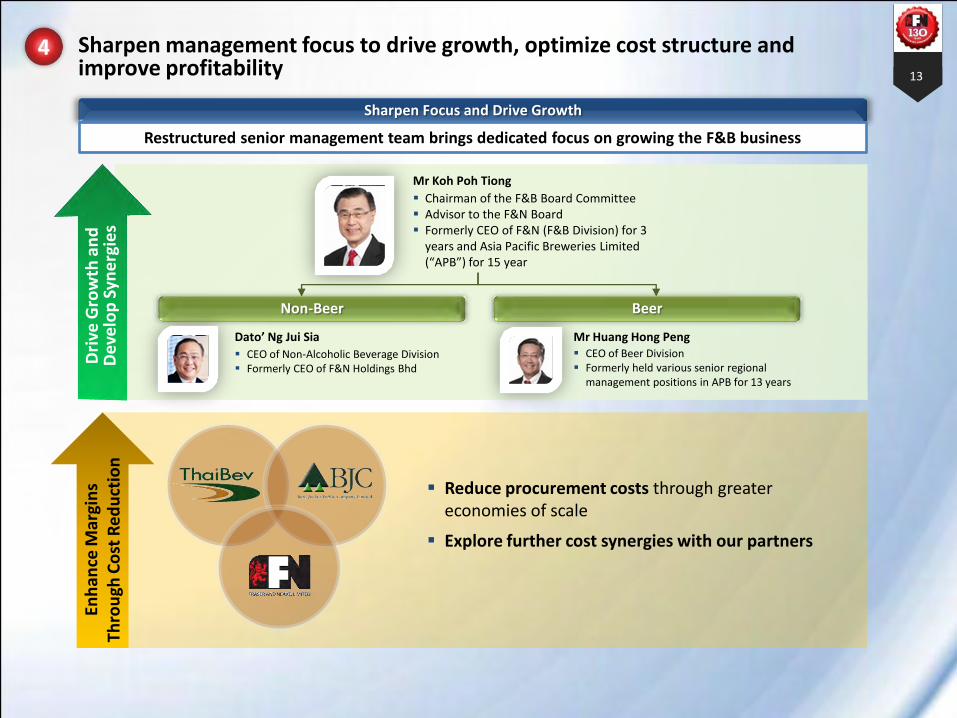
Sharpen Focus and Drive Growth
Restructured senior management team brings dedicated focus on growing the F&B business
13
Sharpen management focus to drive growth, optimize cost structure and improve profitability
Dri
ve G
row
th a
nd
D
eve
lop
Syn
erg
ies
Enh
ance
Mar
gin
s Th
rou
gh C
ost
Re
du
ctio
n
Reduce procurement costs through greater economies of scale
Explore further cost synergies with our partners
Mr Koh Poh Tiong
Chairman of the F&B Board Committee Advisor to the F&N Board Formerly CEO of F&N (F&B Division) for 3
years and Asia Pacific Breweries Limited (“APB”) for 15 year
Beer
Mr Huang Hong Peng CEO of Beer Division Formerly held various senior regional
management positions in APB for 13 years
Non-Beer
Dato’ Ng Jui Sia
CEO of Non-Alcoholic Beverage Division Formerly CEO of F&N Holdings Bhd
4
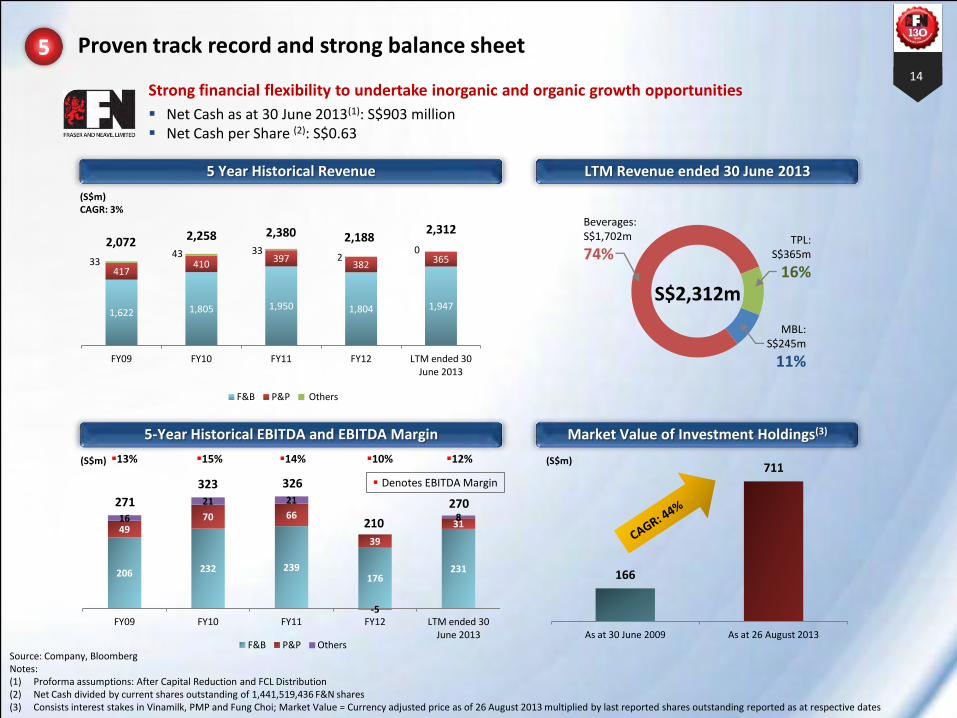
Proven track record and strong balance sheet 14
S$2,312m
Beverages: S$1,702m
74%
TPL: S$365m
16%
MBL: S$245m
11%
LTM Revenue ended 30 June 2013 5 Year Historical Revenue
Strong financial flexibility to undertake inorganic and organic growth opportunities
Net Cash as at 30 June 2013(1): S$903 million Net Cash per Share (2): S$0.63
5
(S$m) CAGR: 3%
Source: Company, Bloomberg Notes: (1) Proforma assumptions: After Capital Reduction and FCL Distribution (2) Net Cash divided by current shares outstanding of 1,441,519,436 F&N shares (3) Consists interest stakes in Vinamilk, PMP and Fung Choi; Market Value = Currency adjusted price as of 26 August 2013 multiplied by last reported shares outstanding reported as at respective dates
2,072 2,258 2,380 2,188 2,312
206 232 239 176
231
49 70 66
39
31 16
21 21
-5
8
FY09 FY10 FY11 FY12 LTM ended 30 June 2013
F&B P&P Others
5-Year Historical EBITDA and EBITDA Margin
271
323 326
210
270
(S$m) 13% 15% 14% 10% 12%
Denotes EBITDA Margin
Market Value of Investment Holdings(3)
(S$m)
166
711
As at 30 June 2009 As at 26 August 2013
1,622 1,805 1,950 1,804 1,947
417 410
397 382
365 33 43 33
2 0
FY09 FY10 FY11 FY12 LTM ended 30 June 2013
F&B P&P Others
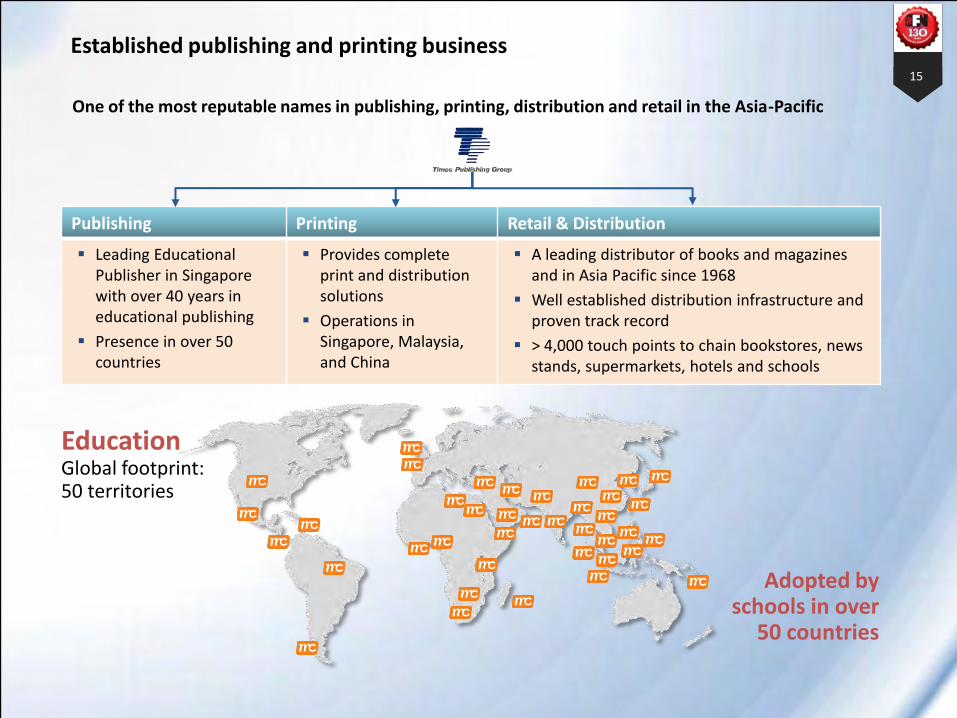
Established publishing and printing business 15
One of the most reputable names in publishing, printing, distribution and retail in the Asia-Pacific
Publishing Printing Retail & Distribution
Leading Educational Publisher in Singapore with over 40 years in educational publishing
Presence in over 50 countries
Provides complete print and distribution solutions
Operations in Singapore, Malaysia, and China
A leading distributor of books and magazines and in Asia Pacific since 1968
Well established distribution infrastructure and proven track record
> 4,000 touch points to chain bookstores, news stands, supermarkets, hotels and schools
Adopted by schools in over
50 countries
Education Global footprint: 50 territories
Frasers Centrepoint Limited Integrated Real Estate Company with International Scale and Capabilities
27 August 2013
2 Important Notice
Certain statements in this Presentation constitute “forward-looking statements”, including forward-looking financial information. Such forward-looking statements and financial information involve known and unknown risks, uncertainties and other factors which may cause the actual results, performance or achievements of F&NL and/or FCL, or industry results, to be materially different from any future results, performance or achievements expressed or implied by such forward-looking statements and financial information. Such forward-looking statements and financial information are based on numerous assumptions regarding F&NL’s and/or FCL’s present and future business strategies and the environment in which F&NL and/or FCL will operate in the future. Because these statements and financial information reflect F&NL’s and/or FCL’s current views concerning future events, these statements and financial information necessarily involve risks, uncertainties and assumptions. Actual future performance could differ materially from these forward-looking statements and financial information. F&NL and FCL expressly disclaim any obligation or undertaking to release publicly any updates or revisions to any forward-looking statement or financial information contained in this Presentation to reflect any change in F&NL’s and FCL’s expectations with regard thereto or any change in events, conditions or circumstances on which any such statement or information is based, subject to compliance with all applicable laws and regulations and/or the rules of the SGX-ST and/or any other regulatory or supervisory body or agency. This Presentation includes market and industry data and forecast that have been obtained from internal surveys, reports and studies, where appropriate, as well as market research, publicly available information and industry publications. Industry publications, surveys and forecasts generally state that the information they contain has been obtained from sources believed to be reliable, but there can be no assurance as to the accuracy or completeness of such included information. While F&NL and FCL have taken reasonable steps to ensure that the information is extracted accurately and in its proper context, F&NL and FCL have not independently verified any of the data from third party sources or ascertained the underlying economic assumptions relied upon therein.
3
Section Page
Section A Overview of FCL 4
Section B Key Competitive Strengths 5
Section C The FCL Strategy 16
Section D Uncovering FCL’s Intrinsic Value 17
Content Page
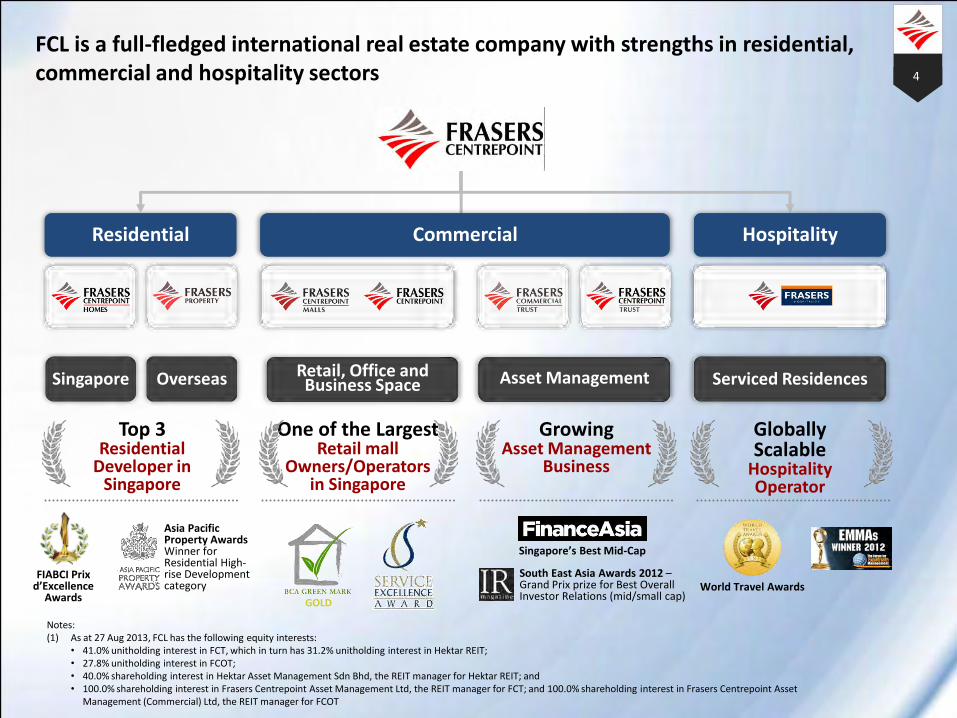
4
Notes: (1) As at 27 Aug 2013, FCL has the following equity interests:
• 41.0% unitholding interest in FCT, which in turn has 31.2% unitholding interest in Hektar REIT; • 27.8% unitholding interest in FCOT; • 40.0% shareholding interest in Hektar Asset Management Sdn Bhd, the REIT manager for Hektar REIT; and • 100.0% shareholding interest in Frasers Centrepoint Asset Management Ltd, the REIT manager for FCT; and 100.0% shareholding interest in Frasers Centrepoint Asset
Management (Commercial) Ltd, the REIT manager for FCOT
Residential
Singapore Overseas
Top 3 Residential
Developer in Singapore
FCL is a full-fledged international real estate company with strengths in residential, commercial and hospitality sectors
Hospitality
Serviced Residences
Globally Scalable
Hospitality Operator
Retail, Office and Business Space Asset Management
Commercial
One of the Largest Retail mall
Owners/Operators in Singapore
Growing Asset Management
Business
World Travel Awards FIABCI Prix
d’Excellence Awards
South East Asia Awards 2012 – Grand Prix prize for Best Overall Investor Relations (mid/small cap)
Singapore’s Best Mid-Cap
Asia Pacific Property Awards Winner for Residential High-rise Development category
GOLD
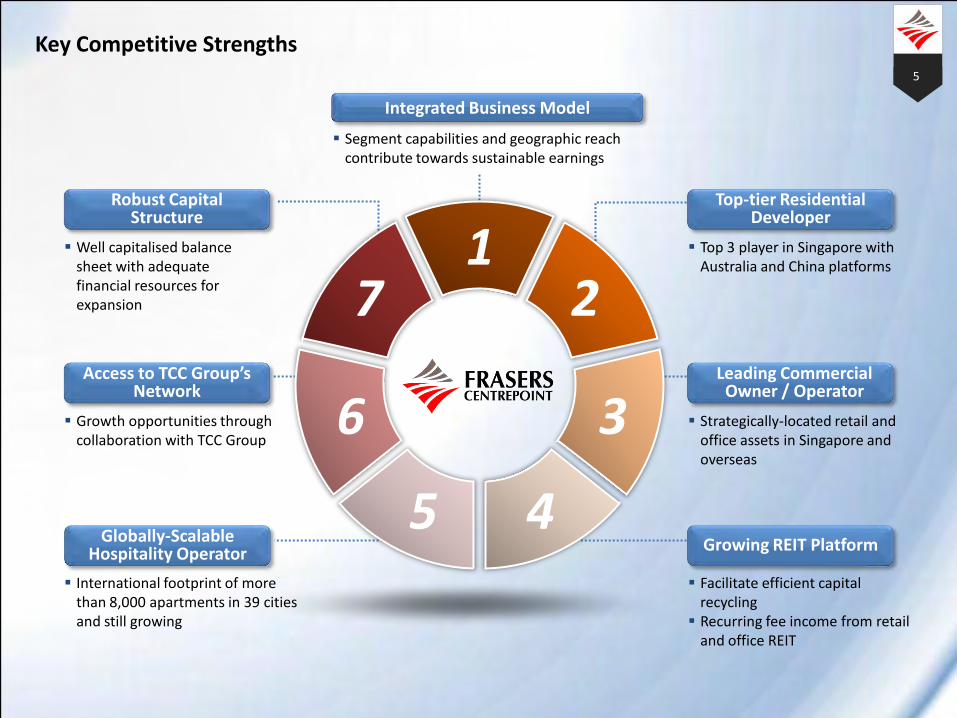
Key Competitive Strengths 5
5 4
3
2 1
7
6
Segment capabilities and geographic reach contribute towards sustainable earnings
Top 3 player in Singapore with Australia and China platforms
Top-tier Residential Developer
Strategically-located retail and office assets in Singapore and overseas
Leading Commercial Owner / Operator
Facilitate efficient capital recycling
Recurring fee income from retail and office REIT
Growing REIT Platform
International footprint of more than 8,000 apartments in 39 cities and still growing
Growth opportunities through collaboration with TCC Group
Well capitalised balance sheet with adequate financial resources for expansion
Integrated Business Model
Globally-Scalable Hospitality Operator
Access to TCC Group’s Network
Robust Capital Structure
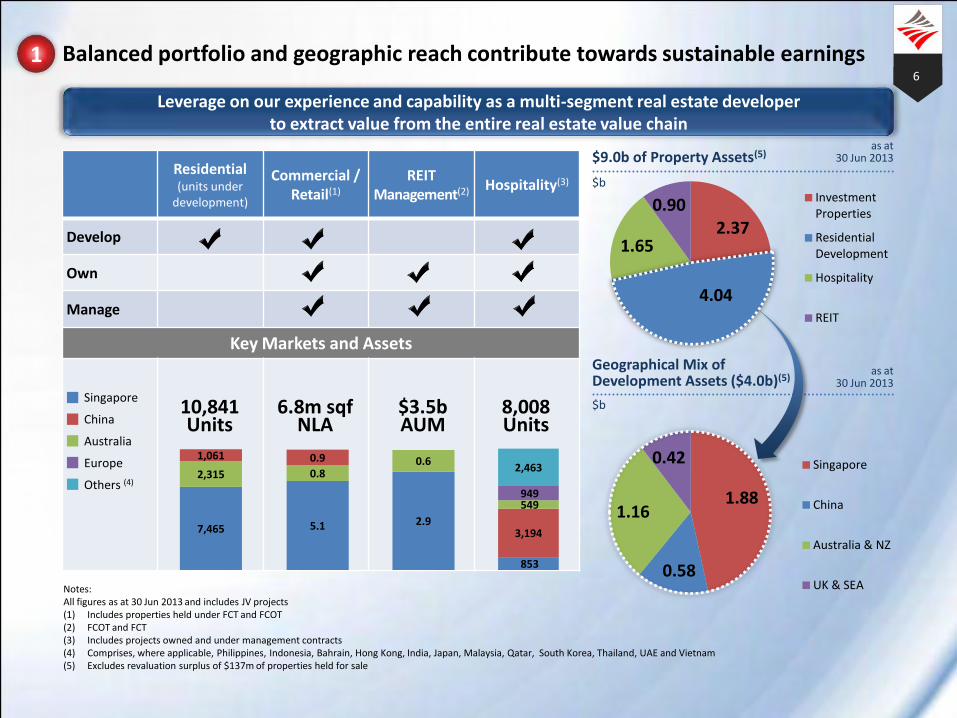
2.37
4.04
1.65
0.90 Investment Properties
Residential Development
Hospitality
REIT
Balanced portfolio and geographic reach contribute towards sustainable earnings 6
Leverage on our experience and capability as a multi-segment real estate developer to extract value from the entire real estate value chain
Residential (units under
development)
Commercial / Retail(1)
REIT Management(2)
Hospitality(3)
Develop
Own
Manage
Key Markets and Assets
Notes: All figures as at 30 Jun 2013 and includes JV projects (1) Includes properties held under FCT and FCOT (2) FCOT and FCT (3) Includes projects owned and under management contracts (4) Comprises, where applicable, Philippines, Indonesia, Bahrain, Hong Kong, India, Japan, Malaysia, Qatar, South Korea, Thailand, UAE and Vietnam (5) Excludes revaluation surplus of $137m of properties held for sale
Singapore
China
Australia
Europe
Others (4)
$9.0b of Property Assets(5)
Geographical Mix of Development Assets ($4.0b)(5)
10,841 Units
6.8m sqf NLA
4.04
as at 30 Jun 2013
as at 30 Jun 2013
853
3,194
549 949
2,463
8,008 Units
$3.5b AUM
2.9
0.6
7,465
2,315
1,061
1
1.88
0.58
1.16
0.42 Singapore
China
Australia & NZ
UK & SEA
5.1
0.8
0.9
$b
$b
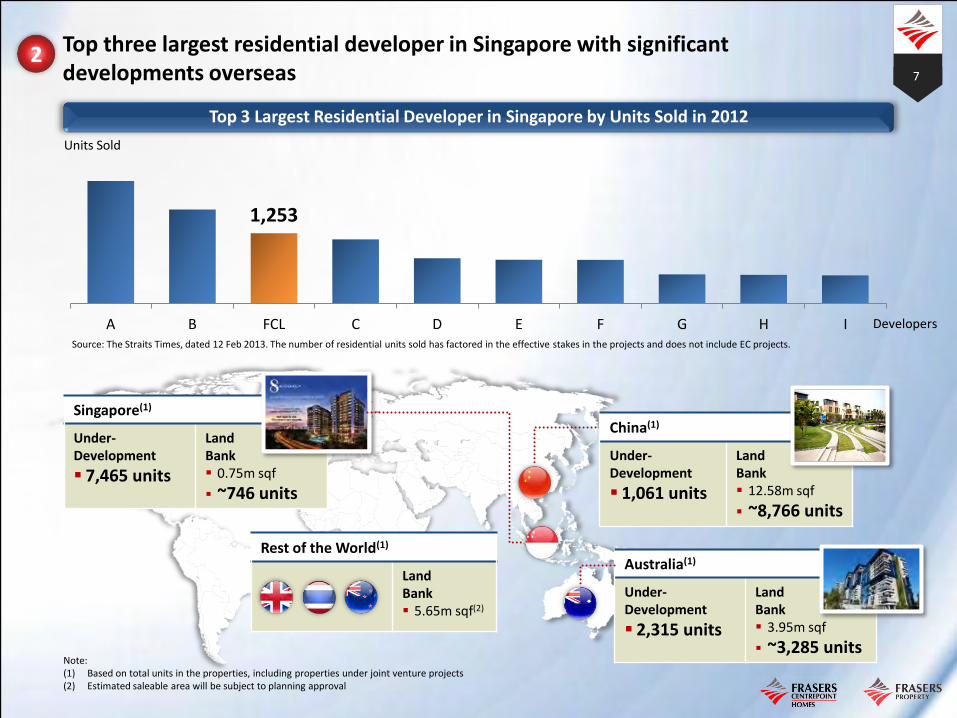
1,253
A B FCL C D E F G H I
Top three largest residential developer in Singapore with significant developments overseas 7
Source: The Straits Times, dated 12 Feb 2013. The number of residential units sold has factored in the effective stakes in the projects and does not include EC projects.
Top 3 Largest Residential Developer in Singapore by Units Sold in 2012
Units Sold
Singapore(1)
Under-Development
7,465 units
Land Bank 0.75m sqf
~746 units
Australia(1)
Under-Development
2,315 units
Land Bank 3.95m sqf
~3,285 units
Rest of the World(1)
Land Bank 5.65m sqf(2)
China(1)
Under- Development
1,061 units
Land Bank 12.58m sqf
~8,766 units
Developers
Note: (1) Based on total units in the properties, including properties under joint venture projects (2) Estimated saleable area will be subject to planning approval
2
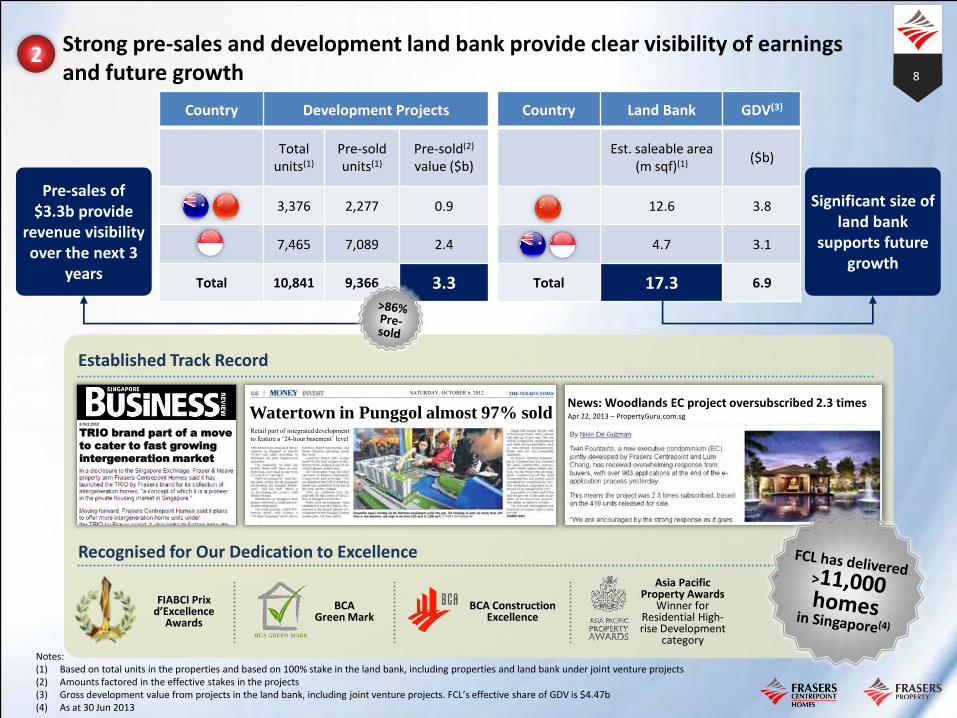
Established Track Record
Recognised for Our Dedication to Excellence
Apr 22, 2013 – PropertyGuru.com.sg
News: Woodlands EC project oversubscribed 2.3 times Watertown in Punggol almost 97% sold
SATURDAY, OCTOBER 6, 2012
Retail part of integrated development to feature a ‘24-hour basement’ level
FIABCI Prix d’Excellence
Awards
BCA Green Mark
Asia Pacific Property Awards
Winner for Residential High-rise Development
category
BCA Construction Excellence
3 Oct 2012
TRIO brand part of a move
to cater to fast growing
intergeneration market
Country Development Projects
Total units(1)
Pre-sold units(1)
Pre-sold(2) value ($b)
3,376 2,277 0.9
7,465 7,089 2.4
Total 10,841 9,366 3.3
Strong pre-sales and development land bank provide clear visibility of earnings and future growth 8
Notes: (1) Based on total units in the properties and based on 100% stake in the land bank, including properties and land bank under joint venture projects (2) Amounts factored in the effective stakes in the projects (3) Gross development value from projects in the land bank, including joint venture projects. FCL’s effective share of GDV is $4.47b (4) As at 30 Jun 2013
Pre-sales of $3.3b provide
revenue visibility over the next 3
years
Country Land Bank GDV(3)
Est. saleable area (m sqf)(1)
($b)
12.6 3.8
4.7 3.1
Total 17.3 6.9
Significant size of land bank
supports future growth
2
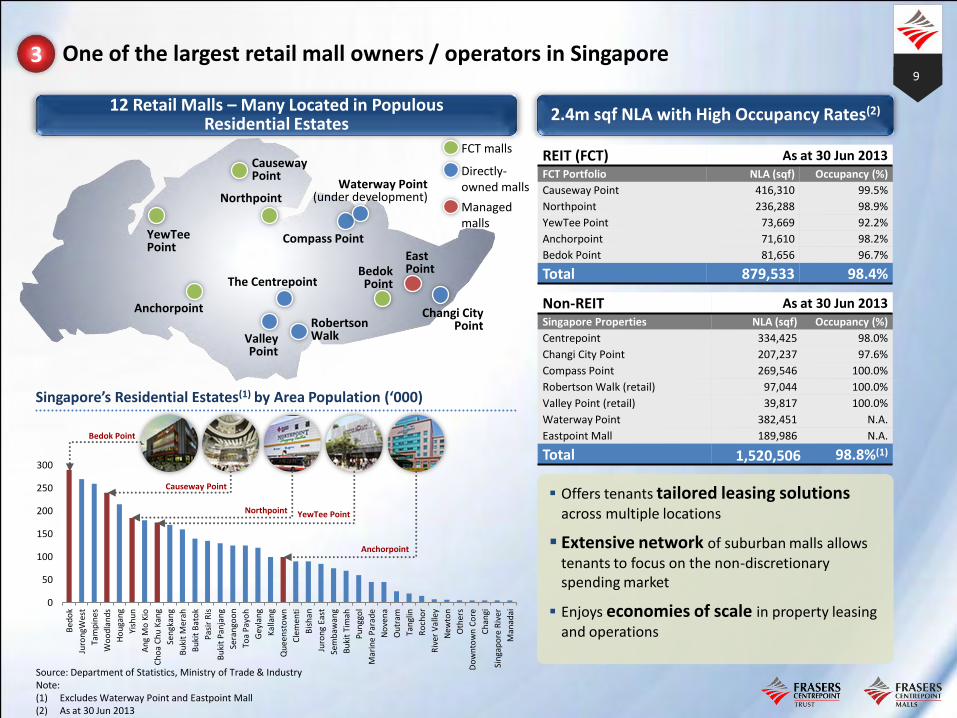
9
Bedok Point
Anchorpoint
Northpoint
Causeway Point
YewTee Point
Compass Point
The Centrepoint
Robertson Walk Valley
Point
Changi City Point
East Point
Waterway Point (under development)
One of the largest retail mall owners / operators in Singapore
12 Retail Malls – Many Located in Populous Residential Estates
FCT malls
Directly-owned malls
Managed malls
0
50
100
150
200
250
300
Bed
ok
Juro
ngW
est
Tam
pin
es
Wo
od
lan
ds
Ho
uga
ng
Yish
un
An
g M
o K
io
Ch
oa
Ch
u K
ang
Sen
gkan
g
Bu
kit
Mer
ah
Bu
kit
Bat
ok
Pas
ir R
is
Bu
kit
Pan
jan
g
Sera
ngo
on
Toa
Pay
oh
Gey
lan
g
Kal
lan
g
Qu
een
sto
wn
Cle
men
ti
Bis
han
Juro
ng
East
Sem
baw
ang
Bu
kit
Tim
ah
Pu
ngg
ol
Mar
ine
Par
ade
No
ven
a
Ou
tram
Tan
glin
Ro
cho
r
Riv
er V
alle
y
New
ton
Oth
ers
Do
wn
tow
n C
ore
Ch
angi
Sin
gap
ore
Riv
er
Man
adai
Offers tenants tailored leasing solutions across multiple locations
Extensive network of suburban malls allows tenants to focus on the non-discretionary spending market
Enjoys economies of scale in property leasing and operations
2.4m sqf NLA with High Occupancy Rates(2)
Singapore’s Residential Estates(1) by Area Population (‘000)
Bedok Point
Causeway Point
Northpoint YewTee Point
Anchorpoint
Source: Department of Statistics, Ministry of Trade & Industry Note: (1) Excludes Waterway Point and Eastpoint Mall (2) As at 30 Jun 2013
REIT (FCT) As at 30 Jun 2013 FCT Portfolio NLA (sqf) Occupancy (%)
Causeway Point 416,310 99.5%
Northpoint 236,288 98.9%
YewTee Point 73,669 92.2%
Anchorpoint 71,610 98.2%
Bedok Point 81,656 96.7%
Total 879,533 98.4%
Non-REIT As at 30 Jun 2013 Singapore Properties NLA (sqf) Occupancy (%)
Centrepoint 334,425 98.0%
Changi City Point 207,237 97.6%
Compass Point 269,546 100.0%
Robertson Walk (retail) 97,044 100.0%
Valley Point (retail) 39,817 100.0%
Waterway Point 382,451 N.A.
Eastpoint Mall 189,986 N.A.
Total 1,520,506 98.8%(1)
3
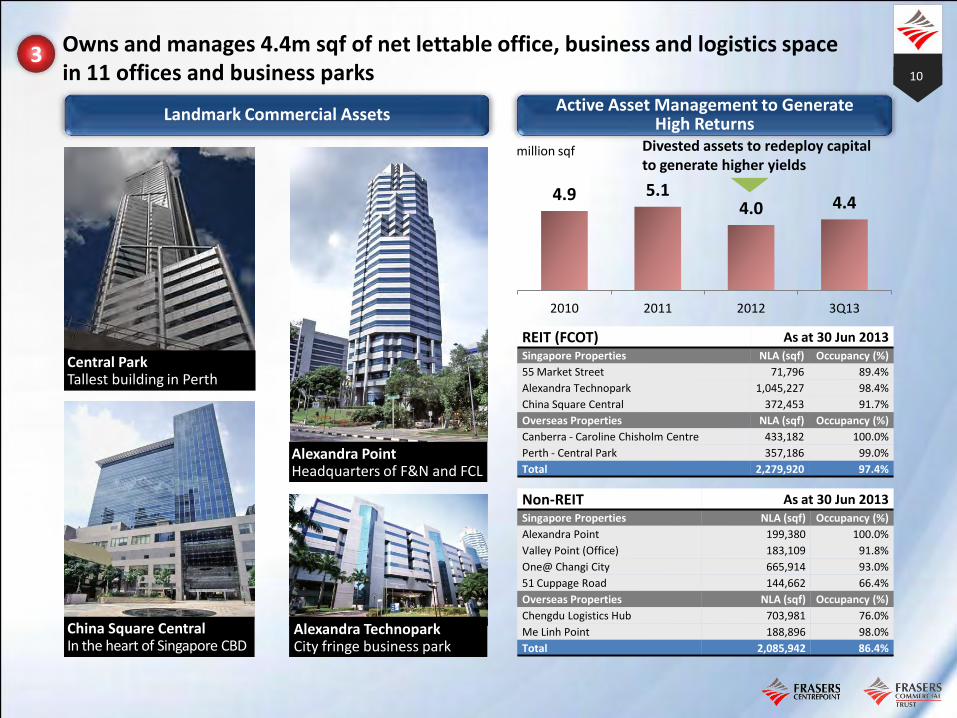
10
4.9 5.1 4.0 4.4
2010 2011 2012 3Q13
million sqf
Active Asset Management to Generate High Returns
REIT (FCOT) As at 30 Jun 2013 Singapore Properties NLA (sqf) Occupancy (%)
55 Market Street 71,796 89.4%
Alexandra Technopark 1,045,227 98.4%
China Square Central 372,453 91.7%
Overseas Properties NLA (sqf) Occupancy (%)
Canberra - Caroline Chisholm Centre 433,182 100.0%
Perth - Central Park 357,186 99.0%
Total 2,279,920 97.4%
Non-REIT As at 30 Jun 2013 Singapore Properties NLA (sqf) Occupancy (%)
Alexandra Point 199,380 100.0%
Valley Point (Office) 183,109 91.8%
One@ Changi City 665,914 93.0%
51 Cuppage Road 144,662 66.4%
Overseas Properties NLA (sqf) Occupancy (%)
Chengdu Logistics Hub 703,981 76.0%
Me Linh Point 188,896 98.0%
Total 2,085,942 86.4%
Owns and manages 4.4m sqf of net lettable office, business and logistics space in 11 offices and business parks
Landmark Commercial Assets
Alexandra Technopark City fringe business park
China Square Central In the heart of Singapore CBD
Alexandra Point Headquarters of F&N and FCL
Central Park Tallest building in Perth
Divested assets to redeploy capital to generate higher yields
3
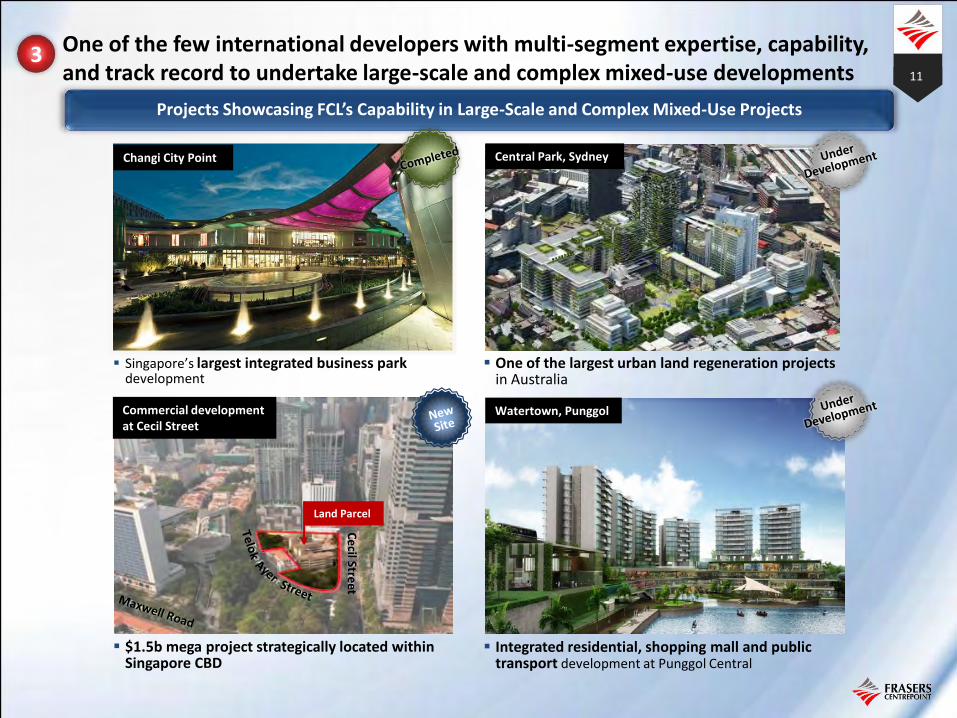
11
One of the few international developers with multi-segment expertise, capability, and track record to undertake large-scale and complex mixed-use developments
Projects Showcasing FCL’s Capability in Large-Scale and Complex Mixed-Use Projects
Singapore’s largest integrated business park development
Changi City Point
Integrated residential, shopping mall and public transport development at Punggol Central
Central Park, Sydney
$1.5b mega project strategically located within Singapore CBD
Commercial development at Cecil Street
Watertown, Punggol
Ce
cil Stree
t
One of the largest urban land regeneration projects in Australia
Land Parcel
3
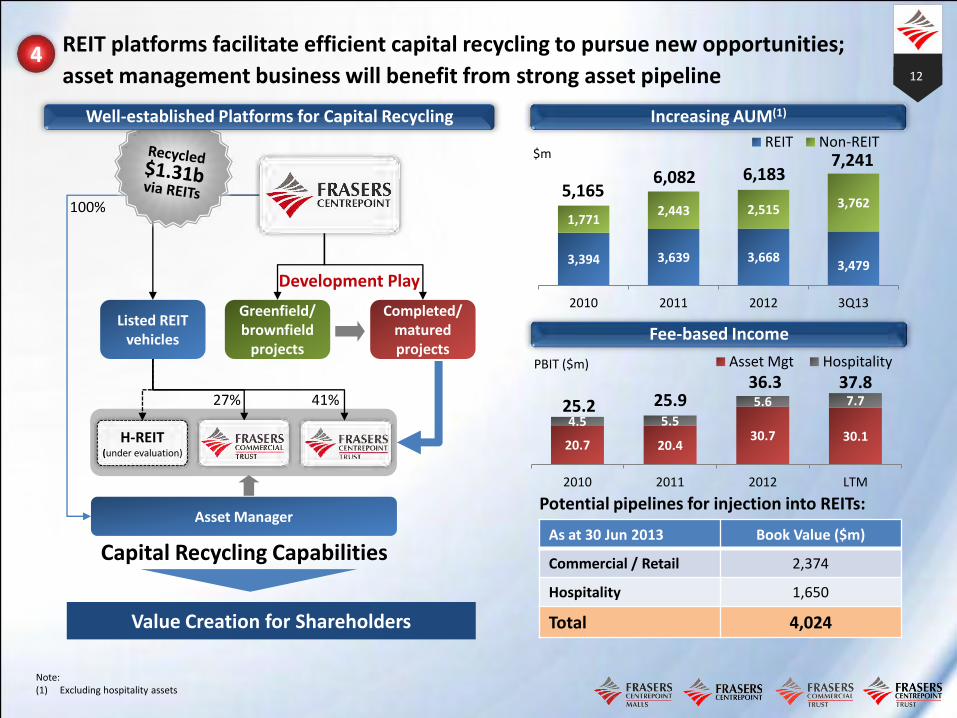
12
REIT platforms facilitate efficient capital recycling to pursue new opportunities;
asset management business will benefit from strong asset pipeline
Increasing AUM(1)
3,394 3,639 3,668 3,479
1,771 2,443 2,515 3,762
2010 2011 2012 3Q13
REIT Non-REIT $m
Potential pipelines for injection into REITs:
As at 30 Jun 2013 Book Value ($m)
Commercial / Retail 2,374
Hospitality 1,650
Total 4,024
Fee-based Income
20.7 20.4 30.7 30.1
4.5 5.5
5.6 7.7
2010 2011 2012 LTM
Asset Mgt Hospitality PBIT ($m)
Listed REIT vehicles
Greenfield/ brownfield
projects
Completed/ matured projects
Value Creation for Shareholders
Development Play
Capital Recycling Capabilities
H-REIT (under evaluation)
Asset Manager
100%
27% 41%
Well-established Platforms for Capital Recycling
5,165 6,082 6,183
7,241
25.2 25.9 36.3 37.8
Note: (1) Excluding hospitality assets
4
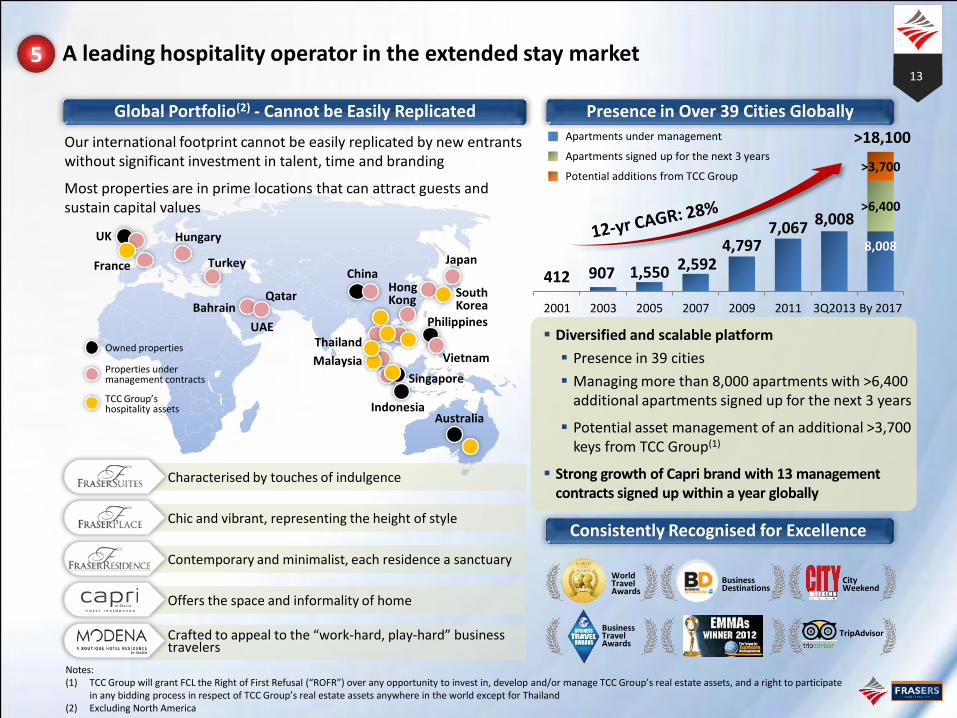
13
412 907 1,550 2,592 4,797
7,067 8,008
8,008
>6,400
>3,700
2001 2003 2005 2007 2009 2011 3Q2013 By 2017 Philippines
China
UK
Australia
Singapore
Indonesia
Bahrain
Hong Kong
Japan France
Malaysia
Hungary
Qatar South Korea
Vietnam
UAE
Turkey
Thailand Owned properties
TCC Group’s hospitality assets
Properties under management contracts
A leading hospitality operator in the extended stay market
Diversified and scalable platform
Presence in 39 cities
Managing more than 8,000 apartments with >6,400 additional apartments signed up for the next 3 years
Potential asset management of an additional >3,700 keys from TCC Group(1)
Strong growth of Capri brand with 13 management contracts signed up within a year globally
Global Portfolio(2) - Cannot be Easily Replicated Presence in Over 39 Cities Globally
Characterised by touches of indulgence
Chic and vibrant, representing the height of style
Contemporary and minimalist, each residence a sanctuary
Offers the space and informality of home
Crafted to appeal to the “work-hard, play-hard” business travelers
Our international footprint cannot be easily replicated by new entrants without significant investment in talent, time and branding
Most properties are in prime locations that can attract guests and sustain capital values
Consistently Recognised for Excellence
World Travel Awards
TripAdvisor
Business Destinations
City Weekend
Business Travel Awards
Apartments under management
Apartments signed up for the next 3 years
Potential additions from TCC Group
Notes: (1) TCC Group will grant FCL the Right of First Refusal (“ROFR”) over any opportunity to invest in, develop and/or manage TCC Group’s real estate assets, and a right to participate
in any bidding process in respect of TCC Group’s real estate assets anywhere in the world except for Thailand (2) Excluding North America
>18,100
5
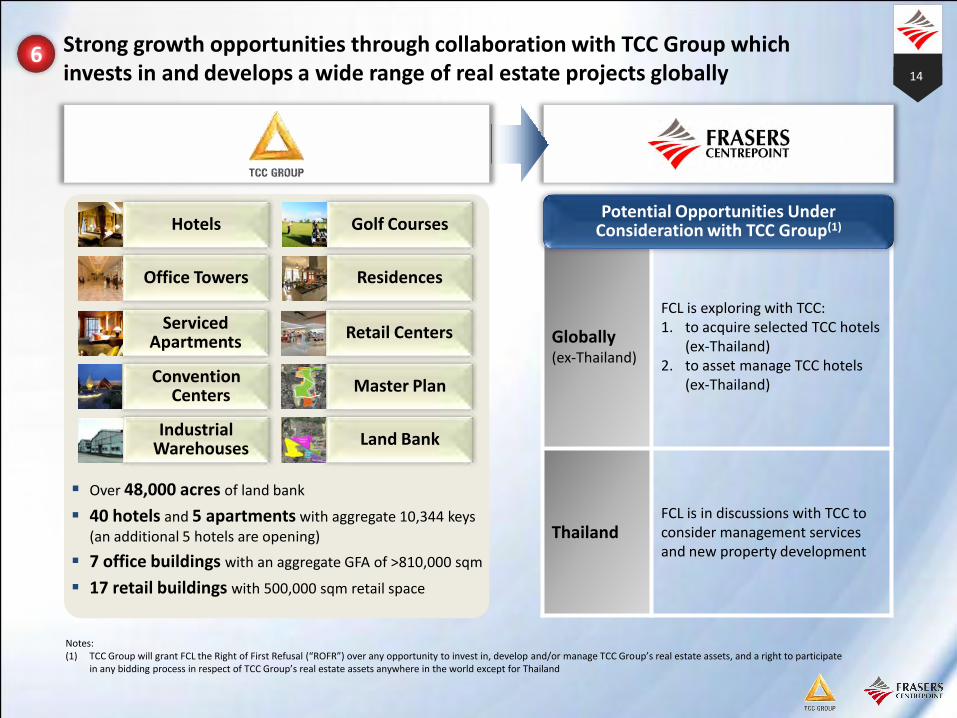
14
Strong growth opportunities through collaboration with TCC Group which invests in and develops a wide range of real estate projects globally
Globally (ex-Thailand)
FCL is exploring with TCC: 1. to acquire selected TCC hotels
(ex-Thailand) 2. to asset manage TCC hotels
(ex-Thailand)
Thailand FCL is in discussions with TCC to consider management services and new property development
Potential Opportunities Under Consideration with TCC Group(1) Hotels
Office Towers
Serviced Apartments
Convention Centers
Golf Courses
Residences
Retail Centers
Master Plan
Notes: (1) TCC Group will grant FCL the Right of First Refusal (“ROFR”) over any opportunity to invest in, develop and/or manage TCC Group’s real estate assets, and a right to participate
in any bidding process in respect of TCC Group’s real estate assets anywhere in the world except for Thailand
Over 48,000 acres of land bank
40 hotels and 5 apartments with aggregate 10,344 keys (an additional 5 hotels are opening)
7 office buildings with an aggregate GFA of >810,000 sqm
17 retail buildings with 500,000 sqm retail space
Industrial Warehouses
Land Bank
6
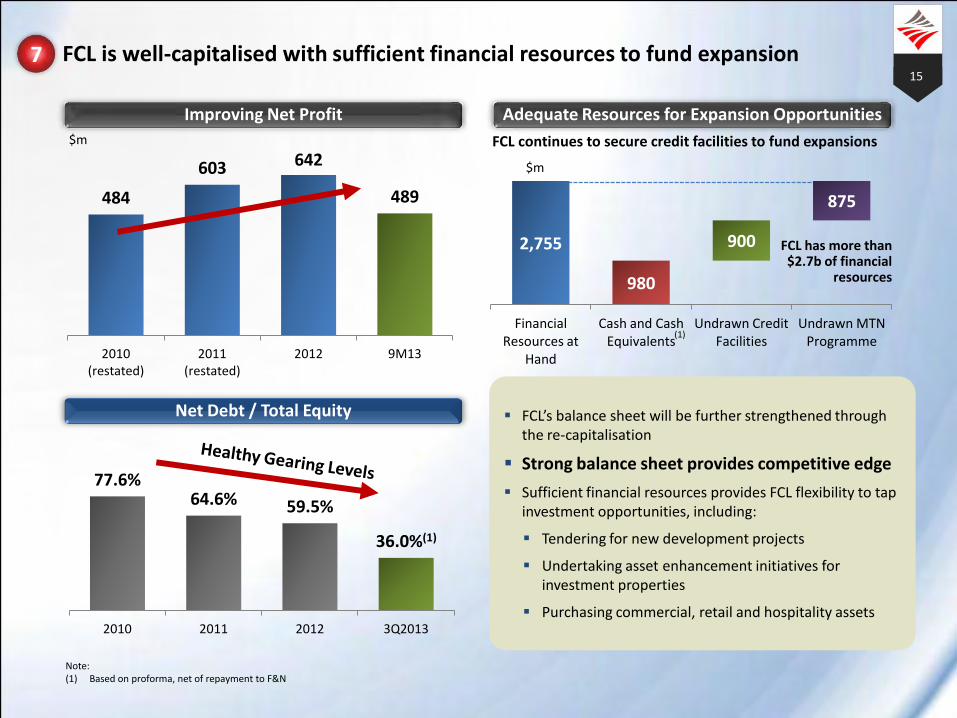
15
484
603 642
489
2010 (restated)
2011 (restated)
2012 9M13
2,755
980
900
875
Financial Resources at
Hand
Cash and Cash Equivalents
Undrawn Credit Facilities
Undrawn MTN Programme
(1)
Improving Net Profit
77.6% 64.6% 59.5%
36.0%(1)
2010 2011 2012 3Q2013
Net Debt / Total Equity FCL’s balance sheet will be further strengthened through the re-capitalisation
Strong balance sheet provides competitive edge
Sufficient financial resources provides FCL flexibility to tap investment opportunities, including:
Tendering for new development projects
Undertaking asset enhancement initiatives for investment properties
Purchasing commercial, retail and hospitality assets
FCL is well-capitalised with sufficient financial resources to fund expansion
Adequate Resources for Expansion Opportunities
$m
$m
7
Note: (1) Based on proforma, net of repayment to F&N
FCL continues to secure credit facilities to fund expansions
FCL has more than $2.7b of financial
resources
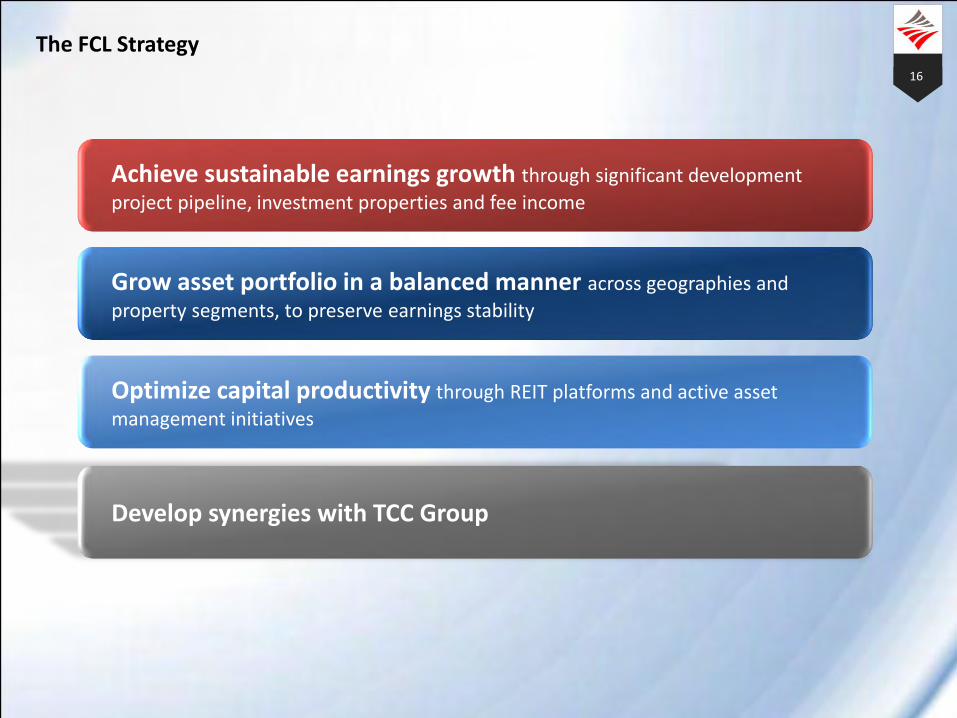
The FCL Strategy 16
Achieve sustainable earnings growth through significant development
project pipeline, investment properties and fee income
Optimize capital productivity through REIT platforms and active asset
management initiatives
Grow asset portfolio in a balanced manner across geographies and
property segments, to preserve earnings stability
Develop synergies with TCC Group
Appendix Uncovering FCL’s Intrinsic Value
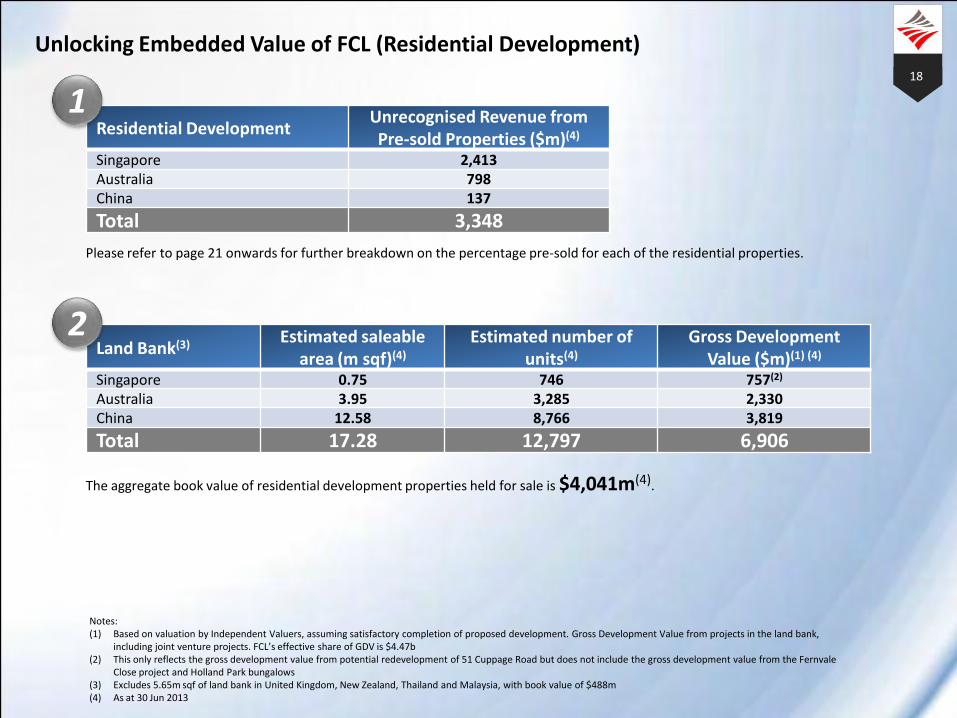
Unlocking Embedded Value of FCL (Residential Development)
18
Residential Development Unrecognised Revenue from Pre-sold Properties ($m)(4)
Singapore 2,413 Australia 798 China 137
Total 3,348
Please refer to page 21 onwards for further breakdown on the percentage pre-sold for each of the residential properties.
Land Bank(3) Estimated saleable
area (m sqf)(4)
Estimated number of units(4)
Gross Development Value ($m)(1) (4)
Singapore 0.75 746 757(2)
Australia 3.95 3,285 2,330 China 12.58 8,766 3,819
Total 17.28 12,797 6,906
1
Notes: (1) Based on valuation by Independent Valuers, assuming satisfactory completion of proposed development. Gross Development Value from projects in the land bank,
including joint venture projects. FCL’s effective share of GDV is $4.47b (2) This only reflects the gross development value from potential redevelopment of 51 Cuppage Road but does not include the gross development value from the Fernvale
Close project and Holland Park bungalows (3) Excludes 5.65m sqf of land bank in United Kingdom, New Zealand, Thailand and Malaysia, with book value of $488m (4) As at 30 Jun 2013
2
The aggregate book value of residential development properties held for sale is $4,041m(4).
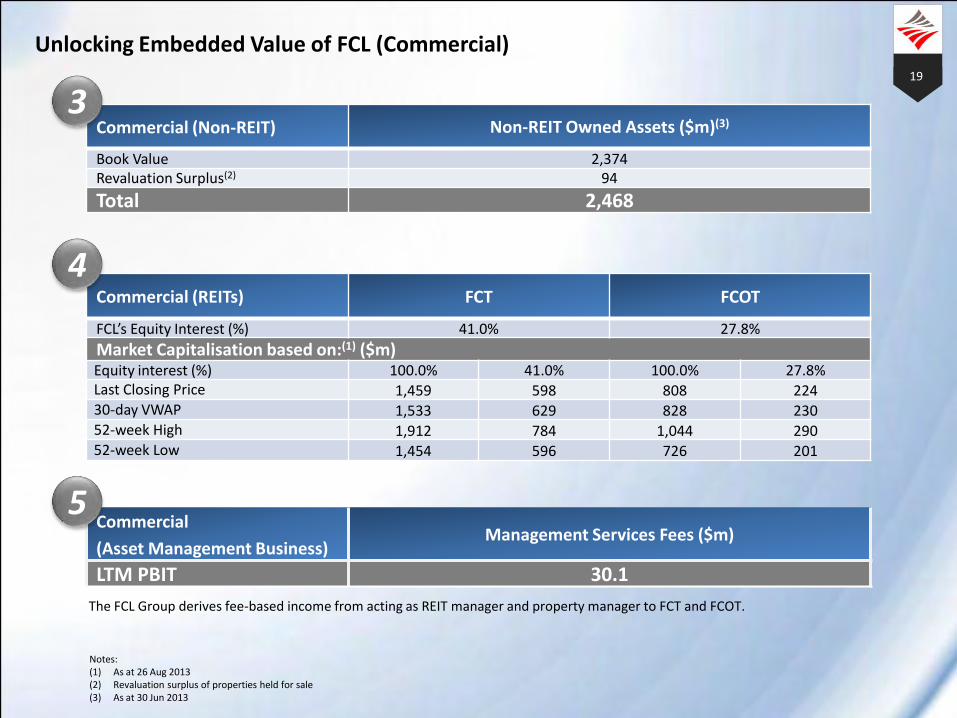
Unlocking Embedded Value of FCL (Commercial) 19
Commercial (Non-REIT) Non-REIT Owned Assets ($m)(3)
Book Value 2,374 Revaluation Surplus(2) 94
Total 2,468
3
Commercial (REITs) FCT FCOT
FCL’s Equity Interest (%) 41.0% 27.8%
Market Capitalisation based on:(1) ($m) Equity interest (%) 100.0% 41.0% 100.0% 27.8% Last Closing Price 1,459 598 808 224 30-day VWAP 1,533 629 828 230 52-week High 1,912 784 1,044 290 52-week Low 1,454 596 726 201
Notes: (1) As at 26 Aug 2013 (2) Revaluation surplus of properties held for sale (3) As at 30 Jun 2013
Commercial
(Asset Management Business) Management Services Fees ($m)
LTM PBIT 30.1
The FCL Group derives fee-based income from acting as REIT manager and property manager to FCT and FCOT.
4
5
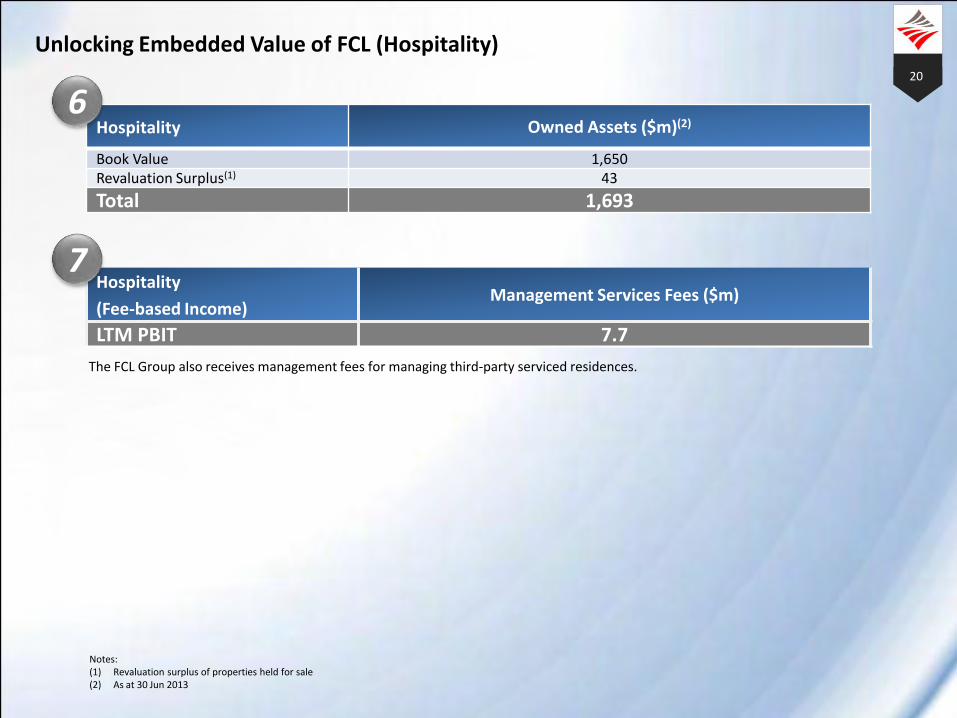
20
The FCL Group also receives management fees for managing third-party serviced residences.
Unlocking Embedded Value of FCL (Hospitality)
Hospitality Owned Assets ($m)(2)
Book Value 1,650 Revaluation Surplus(1) 43
Total 1,693
6
Hospitality
(Fee-based Income) Management Services Fees ($m)
LTM PBIT 7.7
Notes: (1) Revaluation surplus of properties held for sale (2) As at 30 Jun 2013
7
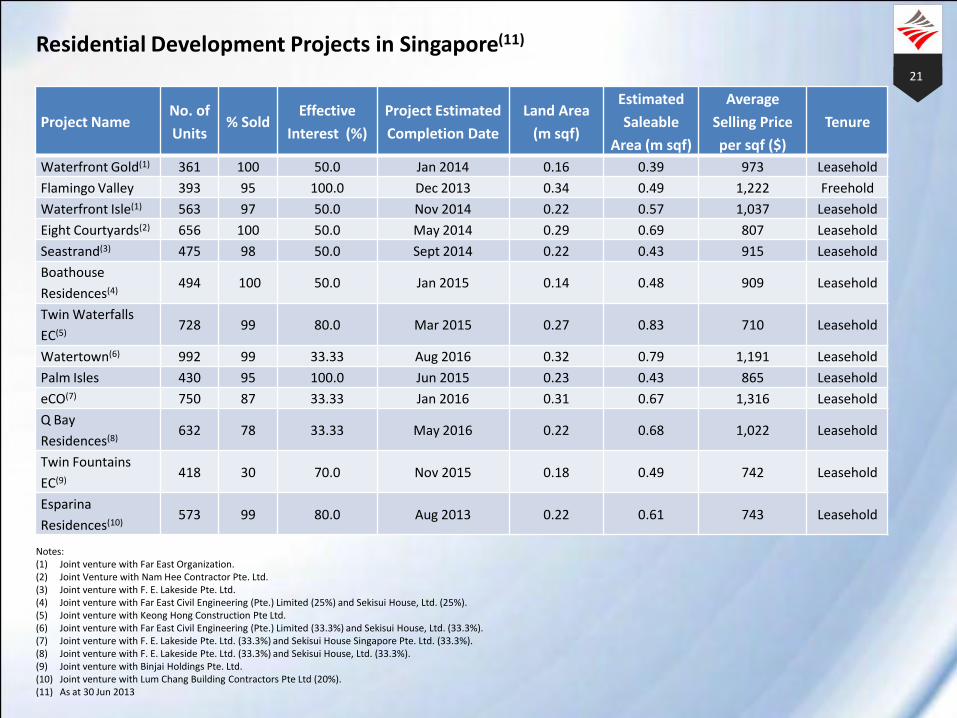
21
Notes: (1) Joint venture with Far East Organization. (2) Joint Venture with Nam Hee Contractor Pte. Ltd. (3) Joint venture with F. E. Lakeside Pte. Ltd. (4) Joint venture with Far East Civil Engineering (Pte.) Limited (25%) and Sekisui House, Ltd. (25%). (5) Joint venture with Keong Hong Construction Pte Ltd. (6) Joint venture with Far East Civil Engineering (Pte.) Limited (33.3%) and Sekisui House, Ltd. (33.3%). (7) Joint venture with F. E. Lakeside Pte. Ltd. (33.3%) and Sekisui House Singapore Pte. Ltd. (33.3%). (8) Joint venture with F. E. Lakeside Pte. Ltd. (33.3%) and Sekisui House, Ltd. (33.3%). (9) Joint venture with Binjai Holdings Pte. Ltd. (10) Joint venture with Lum Chang Building Contractors Pte Ltd (20%). (11) As at 30 Jun 2013
Residential Development Projects in Singapore(11)
Project Name No. of
Units % Sold
Effective
Interest (%)
Project Estimated
Completion Date
Land Area
(m sqf)
Estimated
Saleable
Area (m sqf)
Average
Selling Price
per sqf ($)
Tenure
Waterfront Gold(1) 361 100 50.0 Jan 2014 0.16 0.39 973 Leasehold
Flamingo Valley 393 95 100.0 Dec 2013 0.34 0.49 1,222 Freehold
Waterfront Isle(1) 563 97 50.0 Nov 2014 0.22 0.57 1,037 Leasehold
Eight Courtyards(2) 656 100 50.0 May 2014 0.29 0.69 807 Leasehold
Seastrand(3) 475 98 50.0 Sept 2014 0.22 0.43 915 Leasehold
Boathouse
Residences(4) 494 100 50.0 Jan 2015 0.14 0.48 909 Leasehold
Twin Waterfalls
EC(5) 728 99 80.0 Mar 2015 0.27 0.83 710 Leasehold
Watertown(6) 992 99 33.33 Aug 2016 0.32 0.79 1,191 Leasehold
Palm Isles 430 95 100.0 Jun 2015 0.23 0.43 865 Leasehold
eCO(7) 750 87 33.33 Jan 2016 0.31 0.67 1,316 Leasehold
Q Bay
Residences(8) 632 78 33.33 May 2016 0.22 0.68 1,022 Leasehold
Twin Fountains
EC(9) 418 30 70.0 Nov 2015 0.18 0.49 742 Leasehold
Esparina
Residences(10) 573 99 80.0 Aug 2013 0.22 0.61 743 Leasehold
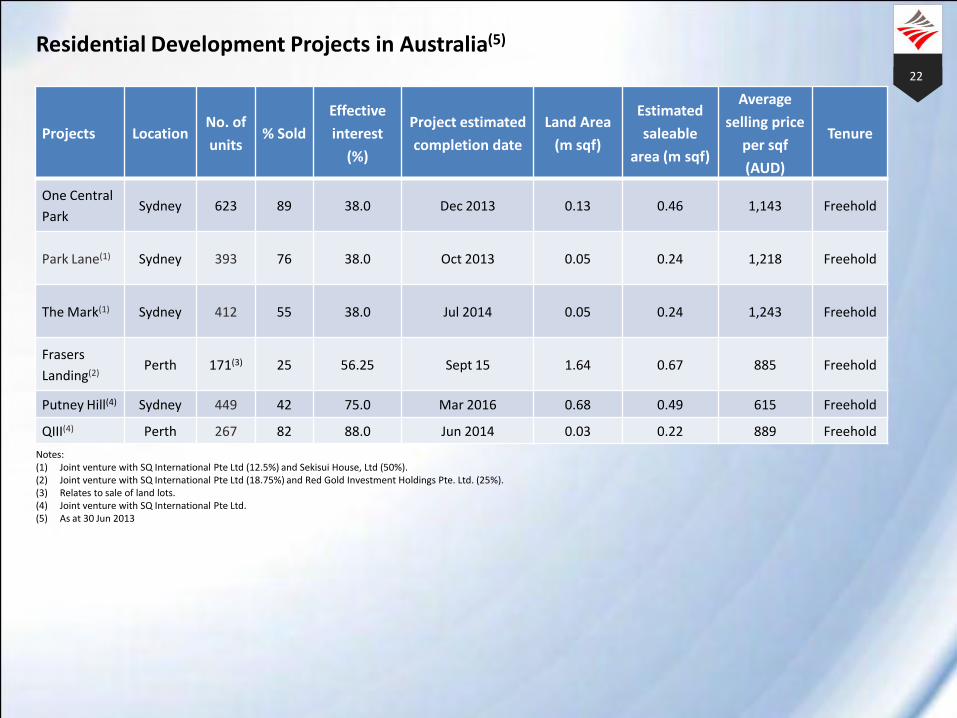
22
Projects Location No. of
units % Sold
Effective
interest
(%)
Project estimated
completion date
Land Area
(m sqf)
Estimated
saleable
area (m sqf)
Average
selling price
per sqf
(AUD)
Tenure
One Central
Park Sydney 623 89 38.0 Dec 2013 0.13 0.46 1,143 Freehold
Park Lane(1) Sydney 393 76 38.0 Oct 2013 0.05 0.24 1,218 Freehold
The Mark(1) Sydney 412 55 38.0 Jul 2014 0.05 0.24 1,243 Freehold
Frasers
Landing(2) Perth 171(3) 25 56.25 Sept 15 1.64 0.67 885 Freehold
Putney Hill(4) Sydney 449 42 75.0 Mar 2016 0.68 0.49 615 Freehold
QIII(4) Perth 267 82 88.0 Jun 2014 0.03 0.22 889 Freehold
Notes: (1) Joint venture with SQ International Pte Ltd (12.5%) and Sekisui House, Ltd (50%). (2) Joint venture with SQ International Pte Ltd (18.75%) and Red Gold Investment Holdings Pte. Ltd. (25%). (3) Relates to sale of land lots. (4) Joint venture with SQ International Pte Ltd. (5) As at 30 Jun 2013
Residential Development Projects in Australia(5)
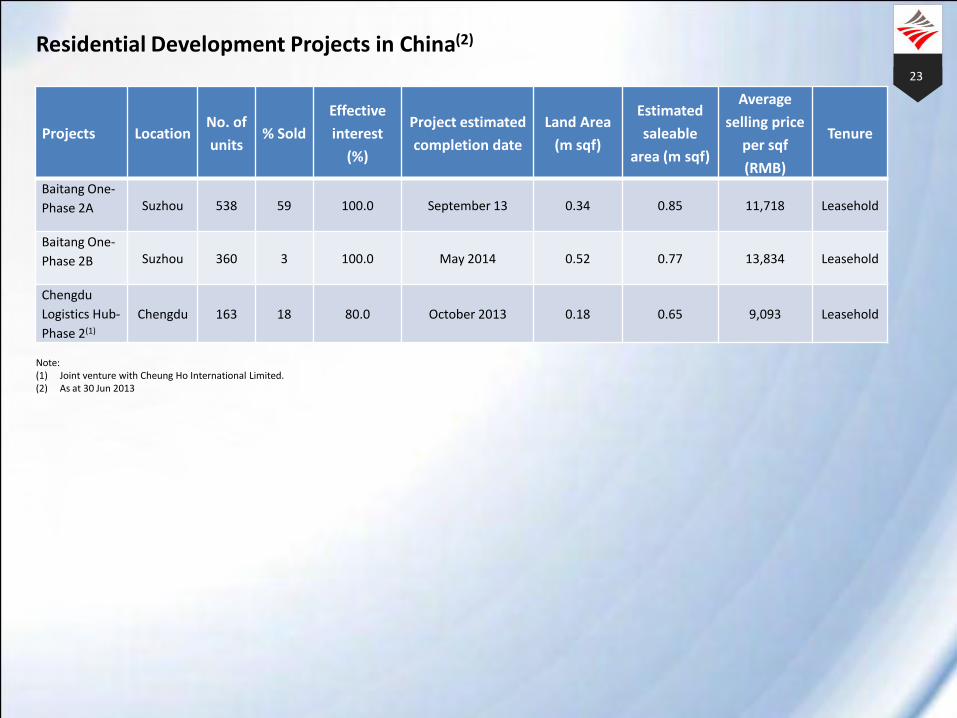
23
Residential Development Projects in China(2)
Projects Location No. of
units % Sold
Effective
interest
(%)
Project estimated
completion date
Land Area
(m sqf)
Estimated
saleable
area (m sqf)
Average
selling price
per sqf
(RMB)
Tenure
Baitang One-
Phase 2A Suzhou 538 59 100.0 September 13 0.34 0.85 11,718 Leasehold
Baitang One-
Phase 2B Suzhou 360 3 100.0 May 2014 0.52 0.77 13,834 Leasehold
Chengdu
Logistics Hub-
Phase 2(1)
Chengdu 163 18 80.0 October 2013 0.18 0.65 9,093 Leasehold
Note: (1) Joint venture with Cheung Ho International Limited. (2) As at 30 Jun 2013


![Cost of Acquisition of Shares on Demerger [Corp. Action]](https://img.pdfslide.us/doc/110x75/577c7e1b1a28abe054a093a2/cost-of-acquisition-of-shares-on-demerger-corp-action.jpg)