Embed Size (px)
Citation preview

reportANNUAL FINANCIAL REPORT 2014
MIRVAC PROPERTY TRUST AND ITS CONTROLLED ENTITIES
Mirvac Property Trust
Annual Financial ReportFor the year ended 30 June 2014
The consolidated entity comprises Mirvac Property Trust (ARSN 086 780 645) and its controlled entities.
01 Directors’ report05 Auditor’s Independence Declaration06 Financial statements07 Consolidated statement of comprehensive income08 Consolidated statement of financial position09 Consolidated statement of changes in equity10 Consolidated statement of cash flows11 Notes to the consolidated financial statements 11 1 Summary of significant accounting policies 18 2 Critical accounting judgements and estimates 19 3 Segmental information 22 4 Revenue from continuing operations and other income 22 5 Expenses 22 6 Income tax 23 7 Earnings per stapled unit 23 8 Receivables 24 9 Other financial assets at fair value through profit or loss 25 10 Assets classified as held for sale 25 11 Investments accounted for using the equity method 29 12 Derivative financial assets 29 13 Other financial assets 29 14 Investment properties 32 15 Intangible assets 33 16 Payables 33 17 Borrowings 34 18 Provisions 35 19 Contributed equity 36 20 Reserves 36 21 Retained earnings 36 22 Distributions 37 23 Contingent liabilities 37 24 Commitments 37 25 Key management personnel 39 26 Related parties 40 27 Financial risk management 44 28 Fair value measurement of financial instruments 45 29 Interests in controlled entities of MPT 47 30 Remuneration of auditors 47 31 Notes to the consolidated statement of cash flows 48 32 Events occurring after the end of the year 48 33 Parent entity financial information49 Directors’ declaration50 Independent auditor’s report to the unitholders of Mirvac Property Trust
And its Controlled Entities
MIRVAC PROPERTY TRUST AND ITS CONTROLLED ENTITIES ANNUAL FINANCIAL REPORT 2014
01MIRVAC PROPERTY TRUST AND ITS CONTROLLED ENTITIES ANNUAL FINANCIAL REPORT 2014
Directors’ report
The Directors of Mirvac Funds Limited (ABN 70 002 561 640, AFSL 233121), the Responsible Entity of Mirvac Property Trust (“MPT” or “Trust”) present their report, together with the consolidated report of MPT and its controlled entities (“consolidated entity”) for the year ended 30 June 2014.
MPT and its controlled entities together with Mirvac Limited and its controlled entities form the stapled entity, Mirvac Group (“Mirvac” or “Group”).
Responsible EntityThe Responsible Entity of the Trust is Mirvac Funds Limited, an entity incorporated in New South Wales. The immediate parent entity of the Responsible Entity is Mirvac Woolloomooloo Pty Limited (ABN 44 001 162 205), incorporated in New South Wales, and its ultimate parent entity is Mirvac Limited (ABN 92 003 280 699), incorporated in New South Wales.
DirectorsThe following persons were Directors of Mirvac Funds Limited during the whole of the year and up to the date of this report, unless otherwise stated:
— John Mulcahy— Susan Lloyd-Hurwitz— Peter Hawkins— James Millar AM— John Peters— Elana Rubin— James MacKenzie (resigned as a Director on 30 January 2014)— Marina Darling (resigned as a Director on 24 January 2014).
Principal activitiesThe principal continuing activities of the consolidated entity consist of property investment for the purpose of deriving rental income and investments in listed and unlisted funds. There has been no significant change in the principal activities of the consolidated entity during the year.
DistributionsDistributions paid to stapled unitholders during the year were as follows:
2014 1 2013 $m $m
June 2013 half yearly distribution paid on 26 July 2013 of 4.50 cents per stapled unit (“cpsu”) 164.9 —June 2012 quarterly distribution paid on 27 July 2012 of 2.40 cpsu — 82.0December 2013 half yearly distribution paid on 27 February 2014 of 4.40 cpsu 161.3 —December 2012 half yearly distribution paid on 25 January 2013 of 4.20 cpsu — 143.9
Total distributions paid 326.2 225.9
1) Includes distribution reinvestment plan (“DRP”) activated for the 31 December 2013 half yearly distribution.
The June 2014 half yearly distribution of 4.60 cpsu totalling $169.8m will be paid on 28 August 2014.
Distributions paid and payable by the Trust for the year ended 30 June 2014 totalled $331.1m, being 9.00 cpsu (2013: $308.8m – 8.70 cpsu).
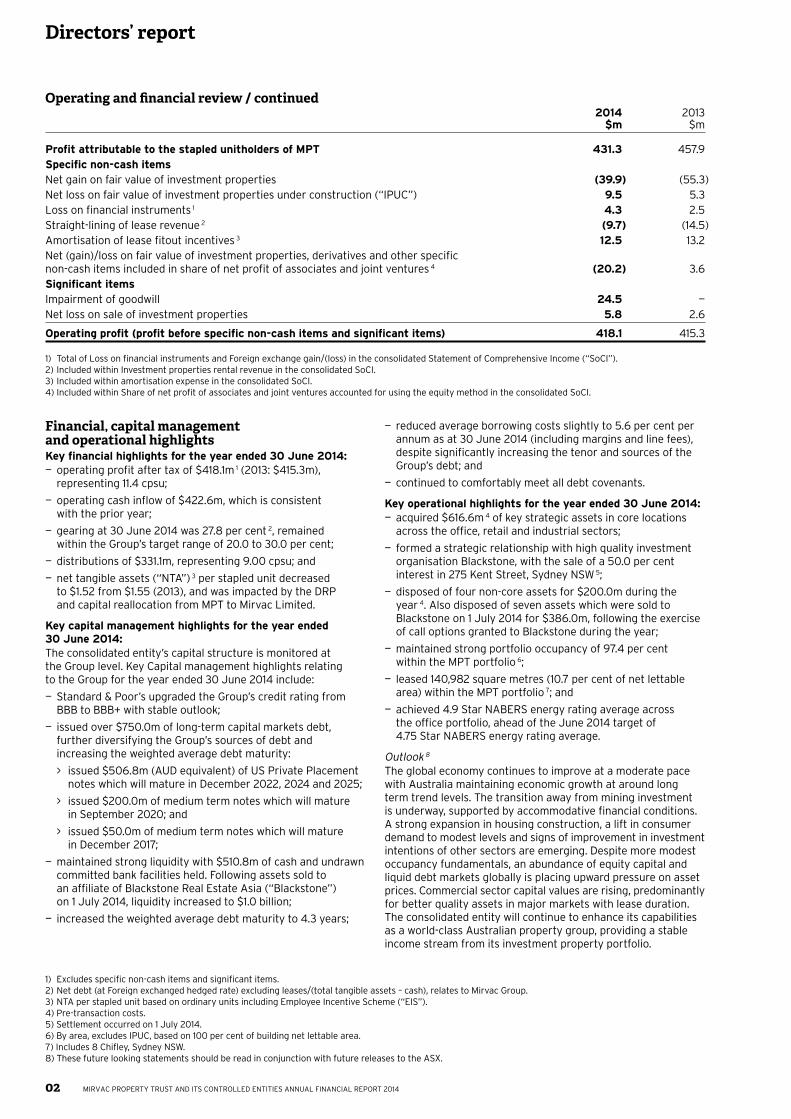
Operating and financial reviewThe statutory profit after tax attributable to the stapled unitholders of the Trust for the year ended 30 June 2014 was $431.3m (2013: $457.9m). The operating profit (profit before specific non-cash and significant items) was $418.1m (2013: $415.3m).
Operating profit is a financial measure which is not prescribed by Australian Accounting Standards (“AAS”) and represents the profit under AAS adjusted for specific non-cash items and significant items. The Directors consider operating profit to reflect the core earnings of the consolidated entity.
The following table summarises key reconciling items between statutory profit after tax attributable to the stapled unitholders of MPT and operating profit. The operating profit information included in the table below has not been subject to any specific audit procedures by the consolidated entity’s auditor but has been extracted from note 3 of the accompanying financial statements for the year ended 30 June 2014, which have been subject to audit; refer to pages 50 and 51 for the auditor’s report on the financial statements.
02
Directors’ report
MIRVAC PROPERTY TRUST AND ITS CONTROLLED ENTITIES ANNUAL FINANCIAL REPORT 2014
Operating and financial review / continued 2014 2013 $m $m
Profit attributable to the stapled unitholders of MPT 431.3 457.9Specific non-cash itemsNet gain on fair value of investment properties (39.9) (55.3)Net loss on fair value of investment properties under construction (“IPUC”) 9.5 5.3Loss on financial instruments 1 4.3 2.5Straight-lining of lease revenue 2 (9.7) (14.5)Amortisation of lease fitout incentives 3 12.5 13.2Net (gain)/loss on fair value of investment properties, derivatives and other specific non-cash items included in share of net profit of associates and joint ventures 4 (20.2) 3.6Significant itemsImpairment of goodwill 24.5 —Net loss on sale of investment properties 5.8 2.6
Operating profit (profit before specific non-cash items and significant items) 418.1 415.3
1) Total of Loss on financial instruments and Foreign exchange gain/(loss) in the consolidated Statement of Comprehensive Income (“SoCI”).2) Included within Investment properties rental revenue in the consolidated SoCI.3) Included within amortisation expense in the consolidated SoCI.4) Included within Share of net profit of associates and joint ventures accounted for using the equity method in the consolidated SoCI.
Financial, capital management and operational highlightsKey financial highlights for the year ended 30 June 2014:— operating profit after tax of $418.1m 1 (2013: $415.3m),
representing 11.4 cpsu;
— operating cash inflow of $422.6m, which is consistent with the prior year;
— gearing at 30 June 2014 was 27.8 per cent 2, remained within the Group’s target range of 20.0 to 30.0 per cent;
— distributions of $331.1m, representing 9.00 cpsu; and
— net tangible assets (“NTA”) 3 per stapled unit decreased to $1.52 from $1.55 (2013), and was impacted by the DRP and capital reallocation from MPT to Mirvac Limited.
Key capital management highlights for the year ended 30 June 2014:The consolidated entity’s capital structure is monitored at the Group level. Key Capital management highlights relating to the Group for the year ended 30 June 2014 include:
— Standard & Poor’s upgraded the Group’s credit rating from BBB to BBB+ with stable outlook;
— issued over $750.0m of long-term capital markets debt, further diversifying the Group’s sources of debt and increasing the weighted average debt maturity:
> issued $506.8m (AUD equivalent) of US Private Placement notes which will mature in December 2022, 2024 and 2025;
> issued $200.0m of medium term notes which will mature in September 2020; and
> issued $50.0m of medium term notes which will mature in December 2017;
— maintained strong liquidity with $510.8m of cash and undrawn committed bank facilities held. Following assets sold to an affiliate of Blackstone Real Estate Asia (“Blackstone”) on 1 July 2014, liquidity increased to $1.0 billion;
— increased the weighted average debt maturity to 4.3 years;
— reduced average borrowing costs slightly to 5.6 per cent per annum as at 30 June 2014 (including margins and line fees), despite significantly increasing the tenor and sources of the Group’s debt; and
— continued to comfortably meet all debt covenants.
Key operational highlights for the year ended 30 June 2014:— acquired $616.6m 4 of key strategic assets in core locations
across the office, retail and industrial sectors;
— formed a strategic relationship with high quality investment organisation Blackstone, with the sale of a 50.0 per cent interest in 275 Kent Street, Sydney NSW 5;
— disposed of four non-core assets for $200.0m during the year 4. Also disposed of seven assets which were sold to Blackstone on 1 July 2014 for $386.0m, following the exercise of call options granted to Blackstone during the year;
— maintained strong portfolio occupancy of 97.4 per cent within the MPT portfolio 6;
— leased 140,982 square metres (10.7 per cent of net lettable area) within the MPT portfolio 7; and
— achieved 4.9 Star NABERS energy rating average across the office portfolio, ahead of the June 2014 target of 4.75 Star NABERS energy rating average.
Outlook 8
The global economy continues to improve at a moderate pace with Australia maintaining economic growth at around long term trend levels. The transition away from mining investment is underway, supported by accommodative financial conditions. A strong expansion in housing construction, a lift in consumer demand to modest levels and signs of improvement in investment intentions of other sectors are emerging. Despite more modest occupancy fundamentals, an abundance of equity capital and liquid debt markets globally is placing upward pressure on asset prices. Commercial sector capital values are rising, predominantly for better quality assets in major markets with lease duration. The consolidated entity will continue to enhance its capabilities as a world-class Australian property group, providing a stable income stream from its investment property portfolio.
1) Excludes specific non-cash items and significant items.2) Net debt (at Foreign exchanged hedged rate) excluding leases/(total tangible assets – cash), relates to Mirvac Group.3) NTA per stapled unit based on ordinary units including Employee Incentive Scheme (“EIS”).4) Pre-transaction costs.5) Settlement occurred on 1 July 2014.6) By area, excludes IPUC, based on 100 per cent of building net lettable area.7) Includes 8 Chifley, Sydney NSW.8) These future looking statements should be read in conjunction with future releases to the ASX.
03MIRVAC PROPERTY TRUST AND ITS CONTROLLED ENTITIES ANNUAL FINANCIAL REPORT 2014
Retail: while recent improvements in retail sales is encouraging, leasing conditions remain challenging. With 25.3 per cent 4 of MPT’s portfolio represented by retail assets, the Trust is focused on continually refreshing its retail assets (via refurbishment, redevelopment or tenant remixing) to adapt to changing market dynamics. Furthermore, the Trust maintains a focus on non-discretionary offerings, and a diversified tenancy mix, where no single specialty retailer contributes greater than 1.4 per cent of the total portfolio’s gross rent; and
Industrial: continuing investor demand for prime grade industrial assets in key locations is resulting in compressed capitalisation rates. As a result, the Trust’s industrial portfolio has experienced a contraction of its weighted average capitalisation rate to 7.98 per cent. The Trust continues to focus on properties with long lease terms and secure cash flow profiles, which will benefit from the increase in investor demand and continue to provide steady returns.
Environmental regulationsThe consolidated entity is subject to compliance with both Federal and State environment protection legislation, and is satisfied that adequate systems are in place for the consolidated entity’s compliance with the applicable legislation.
Within the consolidated entity’s health, safety and environment performance reporting systems, including internal and external audits and inspections, the consolidated entity has not experienced any incidents that have resulted in any significant harm to the environment. There has been no infringement notices issued for minor environmental incidents during the year.
A key initiative to reduce greenhouse gas emissions was a commitment to achieve an average 4.75 Star NABERS Energy rating on applicable office buildings by July 2014. The consolidated entity achieved this target in December 2013, six months ahead of schedule and is now achieving 4.9 Stars. This has resulted in reduced operating costs, improved environmental performance, demonstrating excellent energy operational and management practices, and high efficiency systems and equipment.
The new sustainability strategy ‘This Changes Everything’ sets short term targets for the whole portfolio to reduce carbon emissions by 20 per cent and increase energy generation to 1MW by 2018. This plan also includes a long term mission to be Net Positive for energy and water by 2030, whilst achieving zero waste to landfill in the same period.
The consolidated entity is required under the National Greenhouse and Energy Reporting Act 2007 to report annually on greenhouse gas emissions, reductions, removals and offsets, and energy consumption and production figures.
The Federal Government has introduced into Parliament legislation that terminates the Energy Efficiency Opportunities Program and so removes the mandatory requirement for large energy using businesses to assess opportunities to improve energy efficiency and to report publicly on the outcomes of those assessments. The Federal Government has recently repealed the carbon tax, the consolidated entity will approximately reduce its energy bill by 10%. The carbon tax will be replaced by direct action details of which are still being finalised.
The consolidated entity is also subject to the commercial Building Energy Efficiency Disclosure Act 2010. This involves the disclosure of energy efficiency-related information at the point of sale or lease of office space greater than 2,000 square metres.
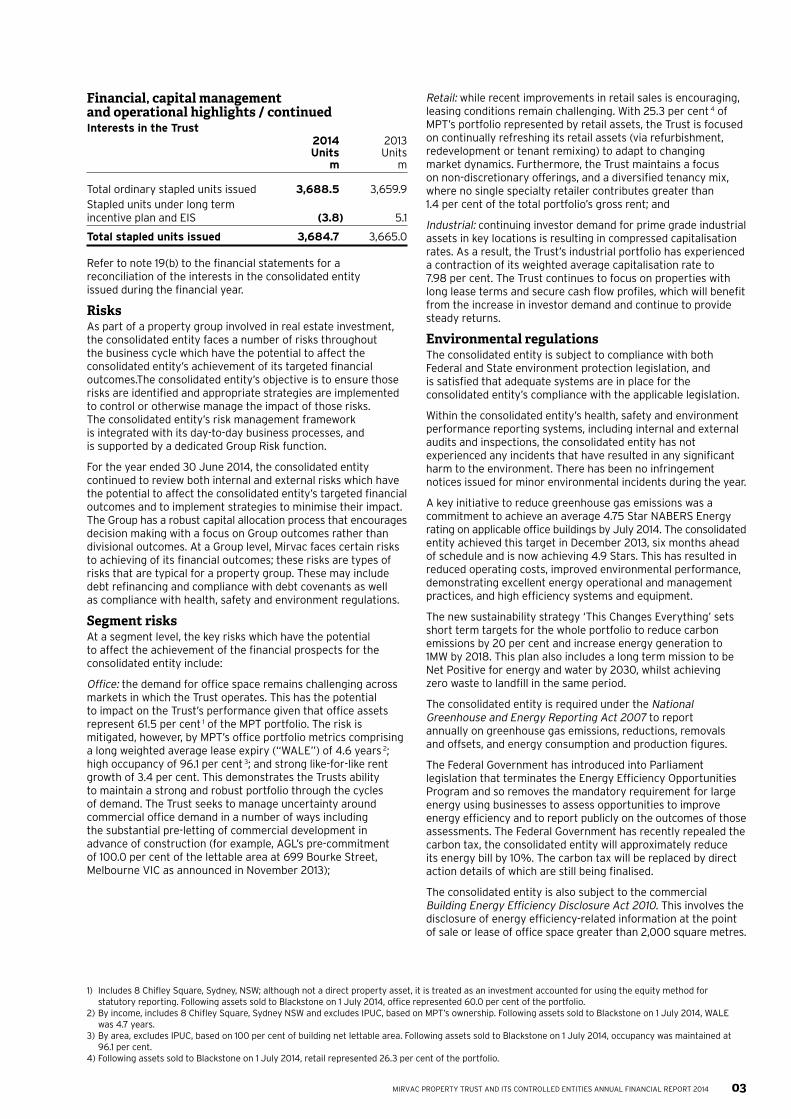
Financial, capital management and operational highlights / continuedInterests in the Trust 2014 2013 Units Units m m
Total ordinary stapled units issued 3,688.5 3,659.9Stapled units under long term incentive plan and EIS (3.8) 5.1
Total stapled units issued 3,684.7 3,665.0
Refer to note 19(b) to the financial statements for a reconciliation of the interests in the consolidated entity issued during the financial year.
RisksAs part of a property group involved in real estate investment, the consolidated entity faces a number of risks throughout the business cycle which have the potential to affect the consolidated entity’s achievement of its targeted financial outcomes.The consolidated entity’s objective is to ensure those risks are identified and appropriate strategies are implemented to control or otherwise manage the impact of those risks. The consolidated entity’s risk management framework is integrated with its day-to-day business processes, and is supported by a dedicated Group Risk function.
For the year ended 30 June 2014, the consolidated entity continued to review both internal and external risks which have the potential to affect the consolidated entity’s targeted financial outcomes and to implement strategies to minimise their impact. The Group has a robust capital allocation process that encourages decision making with a focus on Group outcomes rather than divisional outcomes. At a Group level, Mirvac faces certain risks to achieving of its financial outcomes; these risks are types of risks that are typical for a property group. These may include debt refinancing and compliance with debt covenants as well as compliance with health, safety and environment regulations.
Segment risksAt a segment level, the key risks which have the potential to affect the achievement of the financial prospects for the consolidated entity include:
Office: the demand for office space remains challenging across markets in which the Trust operates. This has the potential to impact on the Trust’s performance given that office assets represent 61.5 per cent 1 of the MPT portfolio. The risk is mitigated, however, by MPT’s office portfolio metrics comprising a long weighted average lease expiry (“WALE”) of 4.6 years 2; high occupancy of 96.1 per cent 3; and strong like-for-like rent growth of 3.4 per cent. This demonstrates the Trusts ability to maintain a strong and robust portfolio through the cycles of demand. The Trust seeks to manage uncertainty around commercial office demand in a number of ways including the substantial pre-letting of commercial development in advance of construction (for example, AGL’s pre-commitment of 100.0 per cent of the lettable area at 699 Bourke Street, Melbourne VIC as announced in November 2013);
1) Includes 8 Chifley Square, Sydney, NSW; although not a direct property asset, it is treated as an investment accounted for using the equity method for statutory reporting. Following assets sold to Blackstone on 1 July 2014, office represented 60.0 per cent of the portfolio.
2) By income, includes 8 Chifley Square, Sydney NSW and excludes IPUC, based on MPT’s ownership. Following assets sold to Blackstone on 1 July 2014, WALE was 4.7 years.
3) By area, excludes IPUC, based on 100 per cent of building net lettable area. Following assets sold to Blackstone on 1 July 2014, occupancy was maintained at 96.1 per cent.
4) Following assets sold to Blackstone on 1 July 2014, retail represented 26.3 per cent of the portfolio.
04
Directors’ report
MIRVAC PROPERTY TRUST AND ITS CONTROLLED ENTITIES ANNUAL FINANCIAL REPORT 2014
Significant changes in the state of affairsDetails of the state of affairs of the consolidated entity are disclosed within the operating and financial review section.
Matters subsequent to the end of the yearOn 1 July 2014, the consolidated entity completed the sale of a 50 per cent interest in 275 Kent Street, Sydney NSW to Blackstone. Blackstone has also exercised its call options over a portfolio of seven non-core assets, with settlement of the sale occurring on the same date. Total consideration for the 50 per cent interest in 275 Kent Street, Sydney NSW and the non-core assets is $821.0m. The consolidated entity has provided vendor finance of $156.0m in relation to the sale of the non-core assets, at an initial coupon of 8.0 per cent per annum and for a maximum term of 48 months (under terms of the vendor financing agreement, Blackstone have the option to repay the loan after a minimum of 12 months) which will help to manage the dilutionary impact to earnings from the sale of the non-core assets. The sale provided a benefit to the headline gearing ratio of approximately five per cent.
No other matter or circumstance has arisen since the end of the year which have significantly affected, or may significantly affect; the operations of the consolidated entity, or the results of those operations, or the state of affairs of the consolidated entity in future years.
Insurance of officersDuring the year, the Responsible Entity has not indemnified, or entered into any agreement indemnifying against a liability, any person who is or who has been an officer of the Responsible Entity of the Trust. No insurance premiums are paid for out of the assets of the Trust in regards to insurance cover provided to Mirvac Funds Limited.
Fees paid to the Responsible Entity or its associatesFees paid to the Responsible Entity out of Trust property during the year were $8.0m (2013: $6.1m). Fees charged by the Responsible Entity represent recovery of costs. No fees were paid out of Trust property to the Directors of the Responsible Entity during the year. Fees paid to the Responsible Entity and its associates out of Trust property during the year are disclosed in note 26 to the financial statements.
Auditor’s independence declarationA copy of the auditor independence declaration required under section 307C of the Corporations Act 2001 is set out on page 05.
AuditorPricewaterhouseCoopers continues in office in accordance with section 327 of the Corporations Act 2001.
Rounding of amountsThe Trust is an entity of the kind referred to in Class Order 98/0100 issued by the ASIC, relating to the rounding off of amounts in the financial statements. Amounts in the financial statements have been rounded off to the nearest tenth of a million (“m”) dollars in accordance with that class order.
This statement is made in accordance with a resolution of the Directors.
Susan Lloyd-HurwitzDirector
Sydney21 August 2014
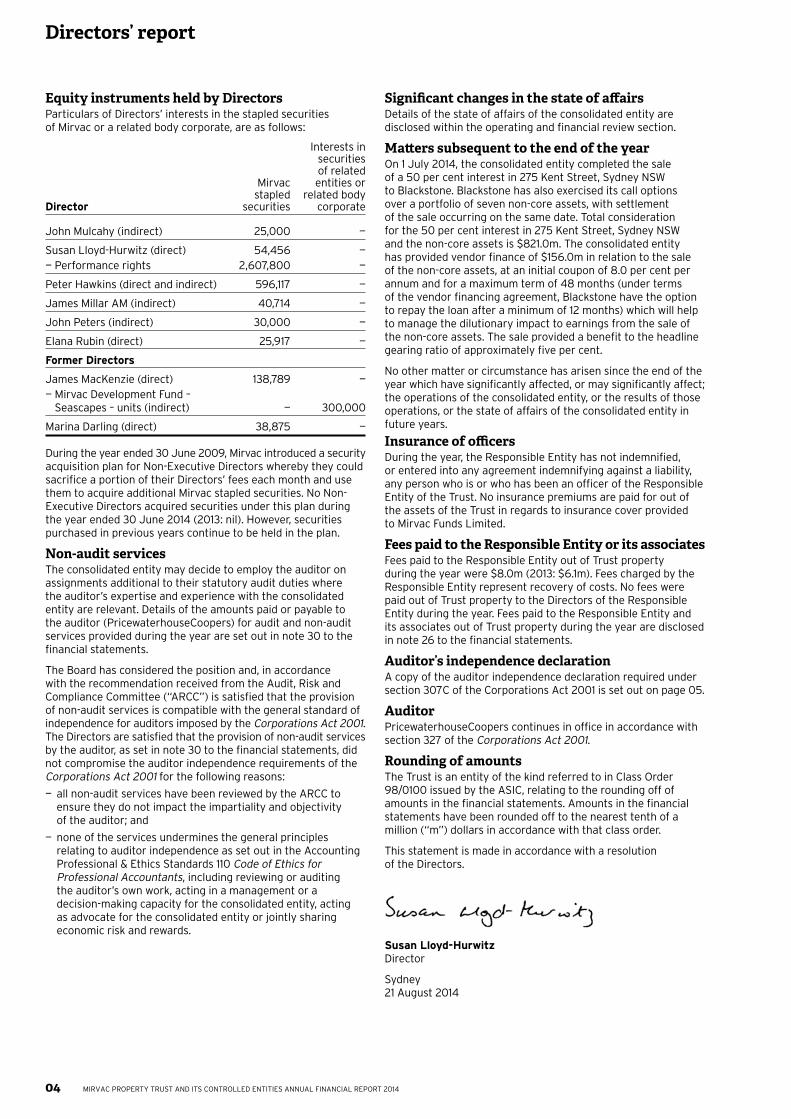
Equity instruments held by DirectorsParticulars of Directors’ interests in the stapled securities of Mirvac or a related body corporate, are as follows:
Interests in securities of related Mirvac entities or stapled related body Director securities corporate
John Mulcahy (indirect) 25,000 —
Susan Lloyd-Hurwitz (direct) 54,456 —— Performance rights 2,607,800 —
Peter Hawkins (direct and indirect) 596,117 —
James Millar AM (indirect) 40,714 —
John Peters (indirect) 30,000 —
Elana Rubin (direct) 25,917 —
Former Directors
James MacKenzie (direct) 138,789 —— Mirvac Development Fund –
Seascapes – units (indirect) — 300,000
Marina Darling (direct) 38,875 —
During the year ended 30 June 2009, Mirvac introduced a security acquisition plan for Non-Executive Directors whereby they could sacrifice a portion of their Directors’ fees each month and use them to acquire additional Mirvac stapled securities. No Non-Executive Directors acquired securities under this plan during the year ended 30 June 2014 (2013: nil). However, securities purchased in previous years continue to be held in the plan.
Non-audit servicesThe consolidated entity may decide to employ the auditor on assignments additional to their statutory audit duties where the auditor’s expertise and experience with the consolidated entity are relevant. Details of the amounts paid or payable to the auditor (PricewaterhouseCoopers) for audit and non-audit services provided during the year are set out in note 30 to the financial statements.
The Board has considered the position and, in accordance with the recommendation received from the Audit, Risk and Compliance Committee (“ARCC”) is satisfied that the provision of non-audit services is compatible with the general standard of independence for auditors imposed by the Corporations Act 2001. The Directors are satisfied that the provision of non-audit services by the auditor, as set in note 30 to the financial statements, did not compromise the auditor independence requirements of the Corporations Act 2001 for the following reasons:
— all non-audit services have been reviewed by the ARCC to ensure they do not impact the impartiality and objectivity of the auditor; and
— none of the services undermines the general principles relating to auditor independence as set out in the Accounting Professional & Ethics Standards 110 Code of Ethics for Professional Accountants, including reviewing or auditing the auditor’s own work, acting in a management or a decision-making capacity for the consolidated entity, acting as advocate for the consolidated entity or jointly sharing economic risk and rewards.
05
Auditor’s independence declaration
MIRVAC PROPERTY TRUST AND ITS CONTROLLED ENTITIES ANNUAL FINANCIAL REPORT 2014
As lead auditor of the audit of Mirvac Property Trust for the year ended 30 June 2014, I declare that to the best of my knowledge and belief, there have been:
a) no contraventions of the auditor independence requirements of the Corporations Act 2001 in relation to the audit; and
b) no contravention of any applicable code of professional conduct in relation to the audit.
This declaration is in respect of Mirvac Property Trust and the entities it controlled during the period.
Matthew Lunn Sydney Partner 21 August 2014PricewaterhouseCoopers
PricewaterhouseCoopers, ABN 52 780 433 757 Darling Park Tower 2, 201 Sussex Street, GPO BOX 2650, SYDNEY NSW 1171 DX 77 Sydney, Australia T +61 2 8266 0000, F +61 2 8266 9999, www.pwc.com.au
Liability limited by a scheme approved under Professional Standards Legislation
06
Consolidated financial statements
MIRVAC PROPERTY TRUST AND ITS CONTROLLED ENTITIES ANNUAL FINANCIAL REPORT 2014
These financial statements cover the financial statements for the consolidated entity consisting of Mirvac Property Trust and its controlled entities. The financial statements are presented in Australian currency.
The Responsible Entity of Mirvac Property Trust is Mirvac Funds Limited (ABN 70 002 561 640, AFSL 233121), a company limited by shares, incorporated and domiciled in Australia. Its registered office and principal place of business are:
Mirvac Funds LimitedLevel 2660 Margaret StreetSydney NSW 2000.
A description of the nature of the consolidated entity’s operations and its principal activities is included in the Directors’ report on pages 01 to 04, both of which are not part of these financial statements.
The financial statements were authorised for issue by the Directors on 21 August 2014. The Directors have the power to amend and reissue the financial statements.
Through the use of the internet, the Trust has ensured that its corporate reporting is timely and complete. All press releases, financial reports and other information are available in the Investor Relations section on the Group’s website: www.mirvac.com.
07 Consolidated statement of comprehensive income08 Consolidated statement of financial position09 Consolidated statement of changes in equity10 Consolidated statement of cash flows11 Notes to the consolidated financial statements49 Directors’ declaration50 Independent auditor’s report to the unitholders of Mirvac Property Trust
07MIRVAC PROPERTY TRUST AND ITS CONTROLLED ENTITIES ANNUAL FINANCIAL REPORT 2014
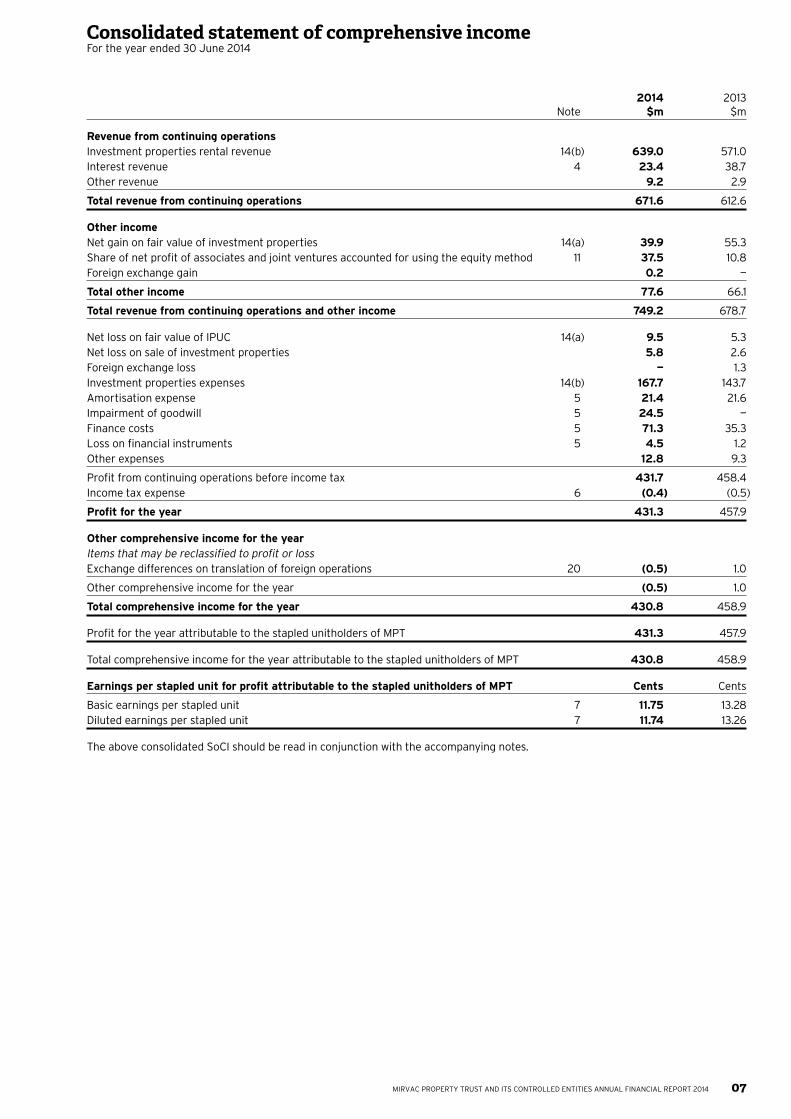
2014 2013 Note $m $m
Revenue from continuing operationsInvestment properties rental revenue 14(b) 639.0 571.0Interest revenue 4 23.4 38.7Other revenue 9.2 2.9
Total revenue from continuing operations 671.6 612.6
Other incomeNet gain on fair value of investment properties 14(a) 39.9 55.3Share of net profit of associates and joint ventures accounted for using the equity method 11 37.5 10.8Foreign exchange gain 0.2 —
Total other income 77.6 66.1
Total revenue from continuing operations and other income 749.2 678.7
Net loss on fair value of IPUC 14(a) 9.5 5.3Net loss on sale of investment properties 5.8 2.6Foreign exchange loss — 1.3Investment properties expenses 14(b) 167.7 143.7Amortisation expense 5 21.4 21.6Impairment of goodwill 5 24.5 —Finance costs 5 71.3 35.3Loss on financial instruments 5 4.5 1.2Other expenses 12.8 9.3
Profit from continuing operations before income tax 431.7 458.4Income tax expense 6 (0.4) (0.5)
Profit for the year 431.3 457.9
Other comprehensive income for the yearItems that may be reclassified to profit or lossExchange differences on translation of foreign operations 20 (0.5) 1.0
Other comprehensive income for the year (0.5) 1.0
Total comprehensive income for the year 430.8 458.9
Profit for the year attributable to the stapled unitholders of MPT 431.3 457.9
Total comprehensive income for the year attributable to the stapled unitholders of MPT 430.8 458.9
Earnings per stapled unit for profit attributable to the stapled unitholders of MPT Cents Cents
Basic earnings per stapled unit 7 11.75 13.28Diluted earnings per stapled unit 7 11.74 13.26
The above consolidated SoCI should be read in conjunction with the accompanying notes.
Consolidated statement of comprehensive incomeFor the year ended 30 June 2014
08 MIRVAC PROPERTY TRUST AND ITS CONTROLLED ENTITIES ANNUAL FINANCIAL REPORT 2014
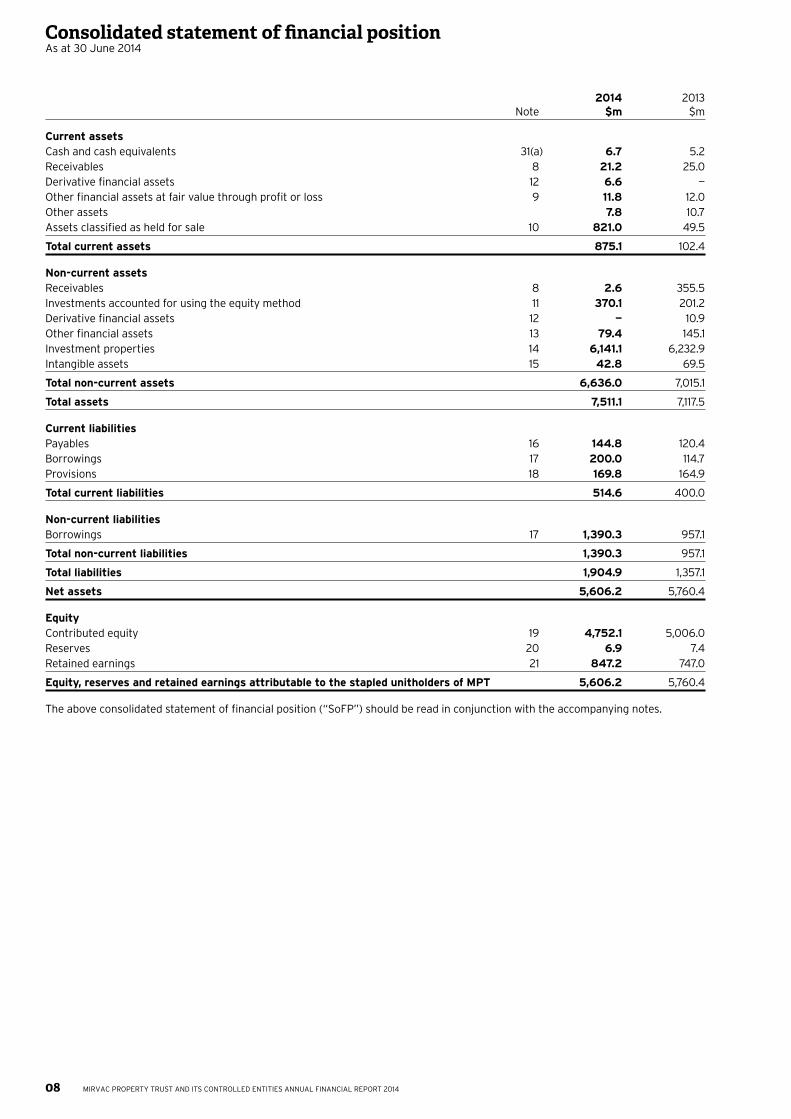
2014 2013 Note $m $m
Current assetsCash and cash equivalents 31(a) 6.7 5.2Receivables 8 21.2 25.0Derivative financial assets 12 6.6 —Other financial assets at fair value through profit or loss 9 11.8 12.0Other assets 7.8 10.7Assets classified as held for sale 10 821.0 49.5
Total current assets 875.1 102.4
Non-current assetsReceivables 8 2.6 355.5Investments accounted for using the equity method 11 370.1 201.2Derivative financial assets 12 — 10.9Other financial assets 13 79.4 145.1Investment properties 14 6,141.1 6,232.9Intangible assets 15 42.8 69.5
Total non-current assets 6,636.0 7,015.1
Total assets 7,511.1 7,117.5
Current liabilitiesPayables 16 144.8 120.4Borrowings 17 200.0 114.7Provisions 18 169.8 164.9
Total current liabilities 514.6 400.0
Non-current liabilitiesBorrowings 17 1,390.3 957.1
Total non-current liabilities 1,390.3 957.1
Total liabilities 1,904.9 1,357.1
Net assets 5,606.2 5,760.4
EquityContributed equity 19 4,752.1 5,006.0Reserves 20 6.9 7.4Retained earnings 21 847.2 747.0
Equity, reserves and retained earnings attributable to the stapled unitholders of MPT 5,606.2 5,760.4
The above consolidated statement of financial position (“SoFP”) should be read in conjunction with the accompanying notes.
Consolidated statement of financial positionAs at 30 June 2014
09MIRVAC PROPERTY TRUST AND ITS CONTROLLED ENTITIES ANNUAL FINANCIAL REPORT 2014
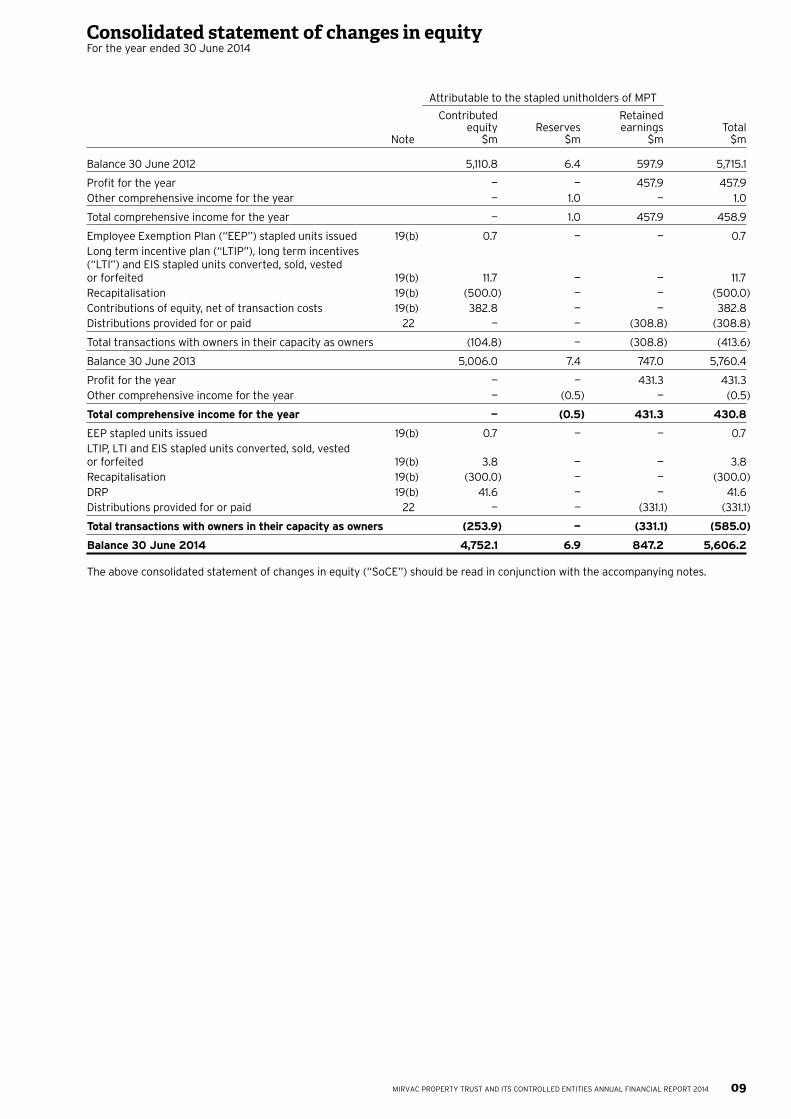
Consolidated statement of changes in equityFor the year ended 30 June 2014
Attributable to the stapled unitholders of MPT
Contributed Retained equity Reserves earnings Total Note $m $m $m $m
Balance 30 June 2012 5,110.8 6.4 597.9 5,715.1
Profit for the year — — 457.9 457.9Other comprehensive income for the year — 1.0 — 1.0
Total comprehensive income for the year — 1.0 457.9 458.9
Employee Exemption Plan (“EEP”) stapled units issued 19(b) 0.7 — — 0.7Long term incentive plan (“LTIP”), long term incentives (“LTI”) and EIS stapled units converted, sold, vested or forfeited 19(b) 11.7 — — 11.7Recapitalisation 19(b) (500.0) — — (500.0)Contributions of equity, net of transaction costs 19(b) 382.8 — — 382.8Distributions provided for or paid 22 — — (308.8) (308.8)
Total transactions with owners in their capacity as owners (104.8) — (308.8) (413.6)
Balance 30 June 2013 5,006.0 7.4 747.0 5,760.4
Profit for the year — — 431.3 431.3Other comprehensive income for the year — (0.5) — (0.5)
Total comprehensive income for the year — (0.5) 431.3 430.8
EEP stapled units issued 19(b) 0.7 — — 0.7LTIP, LTI and EIS stapled units converted, sold, vested or forfeited 19(b) 3.8 — — 3.8Recapitalisation 19(b) (300.0) — — (300.0)DRP 19(b) 41.6 — — 41.6Distributions provided for or paid 22 — — (331.1) (331.1)
Total transactions with owners in their capacity as owners (253.9) — (331.1) (585.0)
Balance 30 June 2014 4,752.1 6.9 847.2 5,606.2
The above consolidated statement of changes in equity (“SoCE”) should be read in conjunction with the accompanying notes.
10 MIRVAC PROPERTY TRUST AND ITS CONTROLLED ENTITIES ANNUAL FINANCIAL REPORT 2014
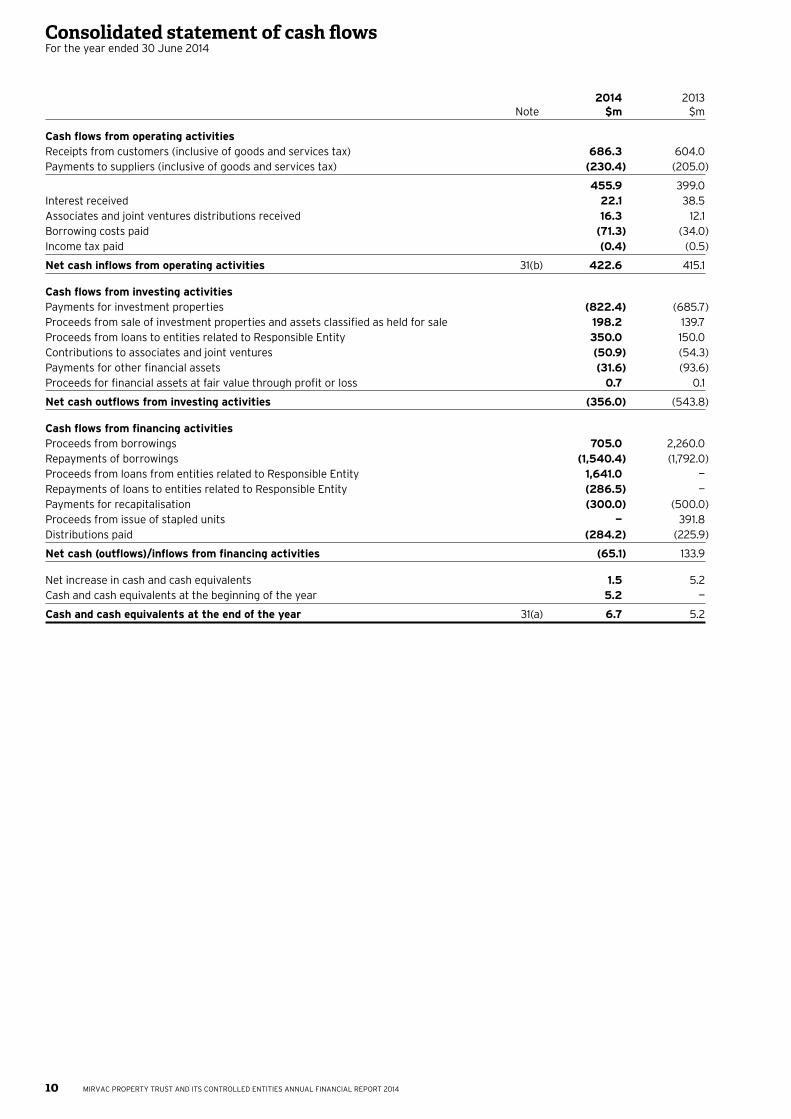
2014 2013 Note $m $m
Cash flows from operating activitiesReceipts from customers (inclusive of goods and services tax) 686.3 604.0Payments to suppliers (inclusive of goods and services tax) (230.4) (205.0)
455.9 399.0Interest received 22.1 38.5Associates and joint ventures distributions received 16.3 12.1Borrowing costs paid (71.3) (34.0)Income tax paid (0.4) (0.5)
Net cash inflows from operating activities 31(b) 422.6 415.1
Cash flows from investing activitiesPayments for investment properties (822.4) (685.7)Proceeds from sale of investment properties and assets classified as held for sale 198.2 139.7Proceeds from loans to entities related to Responsible Entity 350.0 150.0Contributions to associates and joint ventures (50.9) (54.3)Payments for other financial assets (31.6) (93.6)Proceeds for financial assets at fair value through profit or loss 0.7 0.1
Net cash outflows from investing activities (356.0) (543.8)
Cash flows from financing activitiesProceeds from borrowings 705.0 2,260.0Repayments of borrowings (1,540.4) (1,792.0)Proceeds from loans from entities related to Responsible Entity 1,641.0 —Repayments of loans to entities related to Responsible Entity (286.5) —Payments for recapitalisation (300.0) (500.0)Proceeds from issue of stapled units — 391.8Distributions paid (284.2) (225.9)
Net cash (outflows)/inflows from financing activities (65.1) 133.9
Net increase in cash and cash equivalents 1.5 5.2Cash and cash equivalents at the beginning of the year 5.2 —
Cash and cash equivalents at the end of the year 31(a) 6.7 5.2
Consolidated statement of cash flowsFor the year ended 30 June 2014
11MIRVAC PROPERTY TRUST AND ITS CONTROLLED ENTITIES ANNUAL FINANCIAL REPORT 2014
1 Summary of significant accounting policiesThe principal accounting policies adopted in the preparation of these consolidated financial statements are set out below. These policies have been consistently applied to all the years presented, unless otherwise stated. The financial statements of the consolidated entity consist of the consolidated financial statements of MPT and its controlled entities.
a) Mirvac – stapled securitiesA Mirvac stapled security comprises one Mirvac Limited share “stapled” to one MPT unit to create a single listed security traded on the ASX. The stapled securities cannot be traded or dealt with separately. The entities forming the stapled group entered into a Deed of Cooperation which provided that the members consider the interests of Mirvac as a whole, when entering into any agreement or arrangement, or carrying out any act. This Deed of Cooperation means that members of the stapled group, where permitted by law, will carry out activities with other members on a cost recovery basis, thereby maintaining the best interests of Mirvac as a whole.
The two Mirvac entities comprising the stapled group, remain separate legal entities in accordance with the Corporations Act 2001, and are each required to comply with the reporting and disclosure requirements of Australian Accounting Standards (“AAS”) and the Corporations Act 2001. In accordance with AAS, Mirvac Limited has been deemed the parent entity of MPT. The stapled security structure will cease to operate on the first to occur of:
— Mirvac Limited or MPT resolving by special resolution in general meeting and in accordance with its Constitution to terminate the stapling provisions; or
— the commencement of the winding up of Mirvac Limited or MPT.
The ASX reserves the right (but without limiting its absolute discretion) to remove one or more entities with stapled securities from the official list if any of their securities cease to be stapled together, or any equity securities of the same class are issued by one entity which are not stapled to equivalent securities in the other entity or entities.
b) Basis of preparationThese general purpose financial statements have been prepared in accordance with AAS, other authoritative pronouncements of the Australian Accounting Standards Board (“AASB”), Urgent Issues Group Interpretations and the Corporations Act 2001.
i) Compliance with International Financial Reporting Standards (“IFRS”)
The consolidated financial statements of the consolidated entity also comply with IFRS as issued by the International Accounting Standards Board (“IASB”).
ii) Historical cost conventionThese financial statements have been prepared under the historical cost convention, as modified by the revaluation of available-for-sale financial assets, financial assets and liabilities (including derivative instruments) at fair value through profit or loss and investment properties.
iii) Critical accounting estimatesThe preparation of financial statements in conformity with AAS requires the use of certain critical accounting estimates. It also requires management to exercise its judgement in the process of applying the consolidated entity’s accounting policies. The areas involving a higher degree of judgement or complexity, or areas where assumptions and estimates are significant to the financial statements, are disclosed in note 2.
iv) Comparative informationWhere necessary, comparative information has been reclassified to achieve consistency in disclosure with current year amounts and other disclosures.
v) Rounding of amountsThe Trust is an entity of the kind referred to in Class Order 98/100 issued by ASIC, relating to the “rounding off” of amounts in the financial statements. Amounts in the financial statements have been rounded off to the nearest tenth of a million dollars in accordance with that class order.
vi) Goods and services tax (“GST”)Revenues, expenses and assets are recognised net of the amount of associated GST, unless the GST incurred is not recoverable from the taxation authority. In this case, it is recognised as part of the cost of acquisition of the asset or as part of the expense. Receivables and payables are stated inclusive of the amount of GST receivable or payable. The net amount of GST recoverable from, or payable to, the taxation authority is included with other receivables or payables in the consolidated SoFP. Cash flows are presented on a gross basis. The GST components of cash flows arising from investing or financing activities which are recoverable from or payable to the taxation authority, are presented as operating cash flow.
vii) New and amended standards adopted by the consolidated entity
The consolidated entity has applied the following standards and amendments for the first time for their annual reporting period commencing 1 July 2013:
— AASB 10 Consolidated Financial Statements, AASB 11 Joint Arrangements, AASB 12 Disclosure of Interests in Other Entities, AASB 128 Investments in Associates and Joint Ventures, AASB 127 Separate Financial Statements and AASB 2011-7 Amendments to Australian Accounting Standards arising from the Consolidation and Joint Arrangements Standards;
— AASB 2012-10 Amendments to Australian Accounting Standards – Transition Guidance and Other Amendments which provides an exemption from the requirement to disclose the impact of the change in accounting policy on the current period;
— AASB 13 Fair Value Measurement and AASB 2011-8 Amendments to Australian Accounting Standards arising from AASB 13;
— AASB 2012-5 Amendments to Australian Accounting Standards arising from Annual Improvements 2009-2011 Cycle; and
— AASB 2011-4 Amendments to Australian Accounting Standards to Remove Individual Key Management Personnel (“KMP”) Disclosure Requirements from AASB 124 Related Party Disclosures.
The adoption of the above standards only affected the disclosures in the notes to the financial statements.
c) Principles of consolidationi) Controlled entitiesControlled entities are all entities (including structured entities) over which the consolidated entity has control. The consolidated entity controls an entity when the Trust is exposed to, or has rights to, variable returns from its involvement with the entity and has the ability to affect those returns through its power to direct the activities of the entity. Controlled entities are fully consolidated from the date on which control is transferred to the Trust. They are deconsolidated from the date that control ceases. The acquisition method of accounting is used to account for the business combinations undertaken by the consolidated entity (refer to note 1(h)). Unrealised losses are also eliminated unless the transaction provides evidence of the impairment of the asset transferred. Accounting policies of controlled entities have been changed where necessary to ensure consistency with the policies adopted by the consolidated entity. Non-controlling interests in the results and equity of controlled entities are shown separately in the consolidated SoCI, consolidated SoFP and consolidated SoCE.
Notes to the consolidated financial statements
12
Notes to the consolidated financial statements
MIRVAC PROPERTY TRUST AND ITS CONTROLLED ENTITIES ANNUAL FINANCIAL REPORT 2014
vi) Structured entitiesA structured entity is an entity that has been designed so that voting or similar rights are not the dominant factor in deciding who controls the entity. The consolidated entity considers that all funds and trusts in which it currently has an investment to be structured entities. Depending on the consolidated entity’s power over the activities of the entity and its exposure to and ability to influence its own returns, it may consolidate the entity. In other cases it may sponsor or have exposure to such an entity but not consolidate it.
The consolidated entity invests in a number of funds and trusts. These investments are open-end and closed-end investment funds and trusts which invest in industrial and infrastructure real estate for the purpose of capital appreciation and/or to earn investment income. The investees finance their operations through borrowings and through equity issues. Material unconsolidated structured entities include the following:
— Mirvac Industrial Trust; and— JF Infrastructure Yield Fund.
d) Segment reportingOperating segments are reported in a manner consistent with the internal reporting provided to the chief operating decision maker (“CODM”). The CODM, who is responsible for allocating resources and assessing performance of the operating segments, has been identified as the executive leadership team (“ELT”).
e) Foreign currency translationi) Functional and presentation currencyItems included in the financial statements of each of the consolidated entity’s entities are measured using the currency of the primary economic environment in which the entity operates (”functional currency”). The consolidated financial statements are presented in Australian currency, which is MPT’s functional and presentation currency.
ii) Transactions and balancesForeign currency transactions are translated into the functional currency using the exchange rates prevailing at the dates of the transactions. Foreign exchange gains and losses resulting from the settlement of such transactions and from the translation at year end exchange rates of monetary assets and liabilities denominated in foreign currencies are recognised in profit or loss, except when deferred in equity as qualifying cash flow hedges and qualifying net investment hedges or they are attributable to part of the net investment in a foreign operation. Translation differences on non monetary financial assets and liabilities held at fair value are reported as part of the fair value gain or loss using the exchange rate applicable at the date fair value is determined. Translation differences on non monetary financial assets and liabilities such as equities held at fair value through profit or loss are recognised in profit or loss as part of the fair value gain or loss. Translation differences on non monetary financial assets such as equities classified as available-for-sale financial assets are included in a fair value reserve in equity.
iii) Foreign controlled entitiesThe results and financial position of entities (none of which has the currency of a hyperinflationary economy) that have a functional currency different from the presentation currency are translated into the presentation currency as follows:
— assets and liabilities at the end of the year are translated at the closing rate at the end of the year;
— income and expenses for each consolidated SoCI are translated at average exchange rates (unless this is not a reasonable approximation of the cumulative effect of the rate prevailing on the transaction dates, in which case income and expenses are translated at the dates of the transactions); and
— all resulting exchange differences are recognised in other comprehensive income.
1 Summary of significant accounting policies / continued
ii) AssociatesAssociates are all entities over which the consolidated entity has significant influence but not control or joint control, generally accompanying a holding of between 20 per cent and 50 per cent of the voting rights. Investments in associates are accounted for in the consolidated financial statements using the equity method of accounting (see (iv) below), after initially being recognised at cost.
iii) Joint arrangementsUnder AASB 11 Joint Arrangements investments in joint arrangements are classified as either joint operations or joint ventures. The classification depends on the contractual rights and obligations of each investor, rather than the legal structure of the joint arrangement. The consolidated entity has assessed the nature of its joint arrangements and determined that it only has joint ventures. Interests in joint ventures are accounted for using the equity method (see (iv) below), after initially being recognised at cost in the consolidated SoFP.
iv) Equity methodUnder the equity method of accounting, the investments are initially recognised at cost and adjusted thereafter to recognise the consolidated entity’s share of the post-acquisition profits or losses of the investee in profit or loss, and the consolidated entity’s share of movements in other comprehensive income of the investee in other comprehensive income. Dividends received or receivable from associates and joint ventures are recognised as a reduction in the carrying amount of the investment.
When the consolidated entity’s share of losses in an equity-accounted investment equals or exceeds its interest in the entity, including any other unsecured receivables, the consolidated entity does not recognise further losses, unless it has incurred obligations or made payments on behalf of the other entity.
v) Changes in ownership interestsThe consolidated entity treats transactions with NCI that do not result in a loss of control as transactions with equity owners of the consolidated entity. A change in ownership interest results in an adjustment between the carrying amounts of the controlling interest and NCI to reflect their relative interests in the controlled entity. Any difference between the amount of the adjustment to NCI and any consideration paid or received is recognised in a separate reserve within equity attributable to the stapled unitholders of the consolidated entity.
When the consolidated entity ceases to have control, joint control or significant influence, any retained interest in the entity is remeasured to its fair value with the change in carrying amount recognised in profit or loss. The fair value is the initial carrying amount for the purpose of subsequently accounting for the retained interest as an associate, joint venture or financial asset. In addition, any amounts previously recognised in other comprehensive income in respect of that entity are accounted for as if the consolidated entity had directly disposed of the related assets or liabilities. This may mean that amounts previously recognised in other comprehensive income are reclassified to profit or loss. If the ownership interest in an associate or joint venture is reduced but joint control or significant influence is retained, only a proportionate share of the amounts previously recognised in other comprehensive income are reclassified to profit or loss where appropriate.
13MIRVAC PROPERTY TRUST AND ITS CONTROLLED ENTITIES ANNUAL FINANCIAL REPORT 2014
h) Business combinationsThe acquisition method of accounting is used to account for all business combinations, regardless of whether equity instruments or other assets are acquired. The consideration transferred for the acquisition of a controlled entity comprises the fair values of the assets transferred, the liabilities incurred and the equity interests issued by the consolidated entity.
The consideration transferred also includes the fair value of any contingent consideration arrangement and the fair value of any pre-existing equity interest in the controlled entity. Acquisition-related costs are expensed as incurred. Identifiable assets acquired and liabilities and contingent liabilities assumed in a business combination are, with limited exceptions, measured initially at their fair values at the acquisition date. On an acquisition-by-acquisition basis, the consolidated entity recognises any NCI in the acquiree either at fair value or at the NCI’s proportionate share of the acquiree’s net identifiable assets.
The excess of the consideration transferred, the amount of any NCI in the acquiree and the acquisition-date fair value of any previous equity interest in the acquiree over the fair value of the consolidated entity’s share of the net identifiable assets acquired is recorded as goodwill. If those amounts are less than the fair value of the net identifiable assets of the controlled entity acquired and the measurement of all amounts has been reviewed, the difference is recognised directly in profit or loss as a discount on business combination. Where settlement of any part of cash consideration is deferred, the amounts payable in the future are discounted to their present value as at the date of exchange. The discount rate used is the Trust’s incremental borrowing rate, being the rate at which a similar borrowing could be obtained from an independent financier under comparable terms and conditions. Contingent consideration is classified either as equity or a financial liability. Amounts classified as a financial liability are subsequently remeasured to fair value with changes in fair value recognised in profit or loss.
If the business combination is achieved in stages, the acquisition date carrying value of the consolidated entity’s previously held equity interest in the controlled entity is remeasured to fair value at the acquisition date. Any gains or losses arising from such remeasurement are recognised in profit or loss.
i) Impairment of assetsGoodwill and intangible assets that have an indefinite useful life are not subject to amortisation and are tested annually for impairment or more frequently if events or changes in circumstances indicate that they might be impaired. Other assets are tested for impairment whenever events or changes in circumstances indicate that the carrying amount may not be recoverable. An impairment loss is recognised for the amount by which the asset’s carrying amount exceeds its recoverable amount. The recoverable amount is the higher of an asset’s fair value less costs to sell, and value in use. In assessing value in use, the estimated future cash flows are discounted to their present value using the post-tax discount rate that reflects current market assessments of both the time value of money and the risk specific to the asset for which the estimates of future cash flows have not been adjusted. An impairment loss is recognised for the amount by which the asset’s (or cash generating unit (“CGU”)) carrying amount exceeds its recoverable amount. For the purpose of assessing impairment, assets are grouped at the lowest levels for which there are separately identifiable cash flows which are largely independent of the cash inflows from other assets or groups of assets (CGUs). The lowest level at which the consolidated entity allocates and monitors goodwill is at the primary reporting segments level (refer to note 3).
1 Summary of significant accounting policies / continued
On consolidation, exchange differences arising from the translation of any net investment in foreign entities, borrowings and other financial instruments designated as hedges of such investments, are recognised in other comprehensive income. When a foreign controlled entity is sold or any borrowings forming part of the net investment are repaid, a proportionate share of such exchange differences is reclassified to profit or loss, as part of the gain or loss on sale where applicable.
Goodwill and fair value adjustments arising on the acquisition of a foreign entity are treated as assets and liabilities of the foreign entities and translated at the closing rate.
f) Revenue recognitionRevenue is measured at the fair value of the consideration received or receivable. Amounts disclosed as revenue are net of returns, trade allowances and duties and taxes paid. The consolidated entity recognises revenue when the amount of revenue can be reliably measured, it is probable that future economic benefits will flow to the entity and specific criteria have been met for each of the consolidated entity’s activities as described below. The consolidated entity bases its estimates on historical results, taking into consideration the type of customer, the type of transaction and the specifics of each arrangement.
Revenue is recognised for the major business activities as follows:
i) Rental incomeRental revenue for operating leases is recognised on a straight line basis over the term of the lease, except when an alternative basis is more representative of the pattern of service rendered through the provision of the leased premises. Lease incentives offered under operating leases are amortised on a straight line basis in profit or loss.
ii) Recoverable outgoingsRecovery of outgoings as specified in lease agreements is accrued on an estimated basis and adjusted when the actual amounts are invoiced to the respective tenants.
iii) InterestInterest revenue is brought to account when earned, taking into account the effective yield on the financial asset.
iv) Dividends/distributionsDividends/distributions are recognised as revenue when the right to receive payment is established. This applies even if they are paid out of pre-acquisition profits. However, the investment may need to be tested for impairment as a consequence.
v) Government grantsGrants from the government are recognised at their fair value where there is a reasonable assurance that the grant will be received and the consolidated entity will comply with all attached conditions. Government grants relating to costs are deferred and recognised in profit or loss over the period necessary to match them with the costs that they are intended to compensate.
g) Income taxUnder current legislation, the Trust is not liable for income tax, provided that the unitholders are presently entitled to the income of the Trust as determined in accordance with the Trust’s Constitution. Tax allowances for building and plant and equipment depreciation are distributed to the stapled unitholders in the form of a tax deferred component of the distribution.
The Trust has a controlled entity based in the USA and is therefore subject to Federal and state taxes in the USA on earnings and profits. A deferred tax liability is recognised based on the temporary difference between the carrying amount of the assets and their associated tax cost base.
14
Notes to the consolidated financial statements
MIRVAC PROPERTY TRUST AND ITS CONTROLLED ENTITIES ANNUAL FINANCIAL REPORT 2014
A disposal group is a component of the entity that has been disposed of or is classified as held for sale and that represents a separate major line of business or geographical area of operations, is part of a single coordinated plan to dispose of such a line of business or area of operations, or is a subsidiary acquired exclusively with a view to resale. The results of a disposal group are shown as discontinued operations and are presented separately in the consolidated SoCI. The comparatives in the consolidated SoCI are restated to include the profit or loss of the disposal group in discontinued operations.
m) Investments and other financial assetsi) ClassificationThe consolidated entity classifies its financial assets in the following categories: financial assets at fair value through profit or loss, loans and receivables, held-to-maturity investments and available-for-sale financial assets. The classification depends on the purpose for which the investments were acquired. Management determines the classification of its investments at initial recognition and in the case of assets classified as held to maturity, re-evaluates this designation at the end of each year.
Financial assets at fair value through profit or lossFinancial assets classified as held for trading are included in the category “financial assets at fair value through profit or loss”. Financial assets are classified as held for trading if they are acquired for the purpose of selling in the near term. Derivatives are also categorised as held for trading unless they are designated as hedges. Assets in this category are classified as current assets if they are expected to be settled within 12 months; otherwise, they are classified as non-current.
Loans and receivablesLoans and receivables are non-derivative financial assets with fixed or determinable payments that are not quoted in an active market. They arise when the consolidated entity provides money, goods or services directly to a debtor with no intention of selling the receivable. They are included in current assets, except for those with maturities greater than 12 months after the end of the year which are classified as non-current assets. Loans and receivables are included in receivables in the consolidated statement of financial position.
Held to maturity investmentsHeld to maturity investments are non-derivative financial assets with fixed or determinable payments and fixed maturities that the consolidated entity’s management has the positive intention and ability to hold to maturity. If the consolidated entity were to sell other than an insignificant amount of held to maturity financial assets, the whole category would be tainted and reclassified as available-for-sale. Held to maturity financial assets are included in non-current assets, except for those maturities less than 12 months from the end of the year, which are classified as current assets.
Available-for-sale financial assetsAvailable-for-sale financial assets, comprising principally marketable equity securities, are non-derivatives that are either designated in this category or not classified in any of the other categories. They are included in non-current assets unless the investment matures or management intends to dispose of the investment within 12 months of the end of the year. Investments are designated as available-for-sale if they do not have fixed maturities and fixed or determinable payments and management intends to hold them for the medium to long term.
1 Summary of significant accounting policies / continued
j) Cash and cash equivalentsFor the purpose of presentation in the consolidated statement of cash flows, cash and cash equivalents includes cash on hand, deposits held at call with financial institutions, other short term, highly liquid investments with original maturities of three months or less that are readily convertible to known amounts of cash and which are subject to an insignificant risk of changes in value and bank overdrafts. Bank overdrafts are shown within borrowings in current liabilities on the consolidated SoFP.
k) Trade receivablesTrade receivables are recognised initially at fair value and subsequently measured at amortised cost using the effective interest method, less provision for impairment. Collectability of trade receivables is reviewed on an ongoing basis. Receivables which are known to be uncollectible are written off. A provision for impairment of trade receivables is established when there is objective evidence that the consolidated entity will not be able to collect all amounts due according to the original terms of receivables. The amount of the provision is the difference between the asset’s carrying amount and the present value of estimated future cash flows, discounted at the effective interest rate.
Cash flows relating to short term receivables are not discounted if the effect of discounting is immaterial. The amount of the provision is recognised in profit or loss. When a trade receivable for which an impairment provision had been recognised becomes uncollectible in a subsequent period, it is written off against the provision account. Subsequent recoveries of amounts previously written off are credited against other expenses in profit or loss.
l) Non-current assets (or disposal groups) classified as held for sale
Non-current assets (or disposal groups) are classified as held for sale if their carrying amount will be recovered principally through a sale transaction rather than through continuing use and a sale is considered highly probable. They are measured at the lower of their carrying amount and fair value less costs to sell, except for assets such as deferred tax assets, financial assets and investment properties that are carried at fair value and contractual rights under insurance contracts, which are specifically exempt from this requirement. An impairment loss is recognised for any initial or subsequent write-down of the asset (or disposal group) to fair value less costs to sell. A gain is recognised for any subsequent increases in fair value less costs to sell of an asset (or disposal group), but not in excess of any cumulative impairment loss previously recognised. A gain or loss not previously recognised by the date of the sale of the non-current asset (or disposal group) is recognised at the date of derecognition.
Non-current assets (including those that are part of a disposal group) are not depreciated or amortised while they are classified as held for sale. Interest and other expenses attributable to the liabilities of a disposal group classified as held for sale continue to be recognised. Non-current assets classified as held for sale and the assets of a disposal group classified as held for sale are presented separately from other assets in the consolidated SoFP. The liabilities of a disposal group classified as held for sale are presented separately from other liabilities in the consolidated SoFP.
15MIRVAC PROPERTY TRUST AND ITS CONTROLLED ENTITIES ANNUAL FINANCIAL REPORT 2014
v) ImpairmentThe consolidated entity assesses at the end of each year whether there is objective evidence that a financial asset or group of financial assets is impaired. A financial asset or a group of financial assets is impaired and impairment losses are incurred only if there is objective evidence of impairment as a result of one or more events that occurred after the initial recognition of the asset (“loss event”) and that loss event (or events) has an impact on the estimated future cash flows of the financial asset or group of financial assets that can be reliably estimated. In the case of equity investments classified as available-for-sale, a significant or prolonged decline in the fair value of the security below its cost is considered an indicator that the assets are impaired.
Assets carried at amortised costFor loans and receivables, the amount of the loss is measured as the difference between the asset’s carrying amount and the present value of estimated future cash flows (excluding future credit losses that have not been incurred) discounted at the financial asset’s original effective interest rate. The carrying amount of the asset is reduced and the amount of the loss is recognised in profit or loss. If a loan or held-to-maturity investment has a variable interest rate, the discount rate for measuring any impairment loss is the current effective interest rate determined under the contract. As a practical expedient, the consolidated entity may measure impairment on the basis of an instrument’s fair value using an observable market price. If, in a subsequent period, the amount of the impairment loss decreases and the decrease can be related objectively to an event occurring after the impairment was recognised (such as an improvement in the debtor’s credit rating), the reversal of the previously recognised impairment loss is recognised in profit or loss. Impairment testing of trade receivables is described in note 1(k).
Assets classified as available-for-saleIf there is objective evidence of impairment for available-for-sale financial assets, the cumulative loss – measured as the difference between the acquisition cost and the current fair value, less any impairment loss on that financial asset previously recognised in profit or loss – is removed from equity and recognised in profit or loss. Impairment losses on equity instruments that were recognised in profit or loss are not reversed through profit or loss in a subsequent period. If the fair value of a debt instrument classified as available-for-sale increases in a subsequent period and the increase can be objectively related to an event occurring after the impairment loss was recognised in profit or loss, the impairment loss is reversed through profit or loss.
n) Derivatives and hedging activitiesDerivatives are initially recognised at fair value on the date a derivative contract is entered into and are subsequently remeasured to their fair value at each reporting date. The method of recognising the resulting gain or loss depends on whether the derivative is designated as a hedging instrument, and if so, the nature of the item being hedged. The consolidated entity designates certain derivatives as either (1) hedges of the fair value of recognised assets, liabilities or firm commitments (“fair value hedges”); or (2) hedges of highly probable forecast transactions (“cash flow hedges”). The consolidated entity documents at the inception of the transaction the relationship between hedging instruments and hedged items, as well as its risk management objective and strategy for undertaking various hedge transactions. The consolidated entity also documents its assessment, both at hedge inception and on an ongoing basis, of whether the derivatives that are used in hedging transactions have been and will continue to be highly effective in offsetting changes in fair values or cash flows of hedged items. The fair value of derivative financial instruments used for hedging purposes are disclosed in note 12 The full fair value of a hedging derivative is classified as a non-current asset or liability when the remaining maturity of the hedged item is more than 12 months; it is classified as a current asset or liability when the remaining maturity of the hedged item is less than 12 months.
1 Summary of significant accounting policies / continued
ii) ReclassificationThe consolidated entity may choose to reclassify a non-derivative trading financial asset out of the held-for-trading category if the financial asset is no longer held for the purpose of selling it in the near term. Financial assets other than loans and receivables are permitted to be reclassified out of the held-for-trading category only in rare circumstances arising from a single event that is unusual and highly unlikely to recur in the near term. In addition, the consolidated entity may choose to reclassify financial assets that would meet the definition of loans and receivables out of the held-for-trading or available-for-sale categories if the consolidated entity has the intention and ability to hold these financial assets for the foreseeable future or until maturity at the date of reclassification. Reclassifications are made at fair value as of the reclassification date. Fair value becomes the new cost or amortised cost as applicable, and no reversals of fair value gains or losses recorded before the reclassification date are subsequently made. Effective interest rates for financial assets reclassified to loans and receivables and held-to-maturity categories are determined at the reclassification date. Further increases in estimates of cash flows adjust effective interest rates prospectively.
iii) Recognition and derecognitionRegular way purchases and sales of investments are recognised on trade date, being the date on which the consolidated entity commits to purchase or sell the asset. Financial assets are derecognised when the rights to receive cash flows from the financial assets have expired or have been transferred and the consolidated entity has transferred substantially all the risks and rewards of ownership. When units classified as available-for-sale are sold, the accumulated fair value adjustments recognised in other comprehensive income are reclassified to profit or loss as gains and losses from investment units.
iv) MeasurementAt initial recognition, the consolidated entity measures a financial asset at its fair value plus, in the case of a financial asset not at fair value through profit or loss, transaction costs that are directly attributable to the acquisition of the financial asset. Transaction costs of financial assets carried at fair value through profit or loss are expensed in profit or loss. Loans and receivables and held-to-maturity investments are subsequently carried at amortised cost using the effective interest method.
Available-for-sale financial assets and financial assets at fair value through profit or loss are subsequently carried at fair value. Gains or losses arising from changes in the fair value of the “financial assets at fair value through profit or loss” category are presented in profit or loss within other income or other expenses in the period in which they arise. Dividend income from financial assets at fair value through profit or loss is recognised in profit or loss as part of revenue from continuing operations when the consolidated entity’s right to receive payments is established. Interest income from these financial assets is included in the net gain/(loss). Changes in the fair value of monetary securities denominated in a foreign currency and classified as available-for-sale are analysed between translation differences resulting from changes in amortised cost of the security and other changes in the carrying amount of the security. The translation differences related to changes in the amortised cost are recognised in profit or loss, and other changes in carrying amount are recognised in other comprehensive income. Changes in the fair value of other monetary and non-monetary securities classified as available-for-sale are recognised in other comprehensive income. Details of how the fair value of financial instruments is determined are disclosed in note 2(vi).
16
Notes to the consolidated financial statements
MIRVAC PROPERTY TRUST AND ITS CONTROLLED ENTITIES ANNUAL FINANCIAL REPORT 2014
q) Investment propertiesi) Investment propertiesInvestment properties are properties held for long term rental yields and for capital appreciation. Investment properties are carried at fair value with any gain or loss arising from a change in fair value recognised in consolidated SoCI. The carrying amount of the investment properties recorded in the consolidated SoFP includes components relating to lease incentives.
Investment properties also include properties that are under construction for future use as investment properties. These are carried at fair value unless the fair value cannot yet be reliably determined. Where that is the case, the property will be accounted for at cost until either the fair value becomes reliably determinable or construction is complete. The fair value of IPUC is determined by using estimation models including discounted cash flows (“DCF”) and residual valuations. The estimated value of future assets is based on the expected future income from the project, using current yields of similar completed properties. The remaining expected costs of completion plus risk adjusted development margin are deducted from the estimated future asset value.
ii) Investment properties under redevelopmentExisting investment properties being redeveloped for continued future use are carried at fair value.
iii) Lease incentivesLease incentives provided under an operating lease by the consolidated entity as lessor are recognised on a straight line basis against rental income. As these incentives are repaid out of future lease payments, they are recognised as an asset in the consolidated SoFP as a component of the carrying amount of investment properties and amortised over the lease period. Where the investment property is supported by a valuation that incorporates the value of lease incentives, the investment property is revalued back to the valuation amount after the lease incentive amortisation has been charged as an expense.
r) Intangible assetsi) GoodwillGoodwill represents the excess of the cost of an acquisition over the fair value of the consolidated entity’s share of the net identifiable assets of the acquired controlled entity, associate or joint venture at the date of acquisition. Goodwill on acquisitions of controlled entities is included in intangible assets. Goodwill on acquisition of associates and joint ventures is included in the carrying value of investments in associates or joint ventures. Goodwill acquired in business combinations is not amortised. Instead, goodwill is tested for impairment annually or more frequently if events or changes in circumstances indicate that it might be impaired, and is carried at cost less accumulated impairment losses. Gains and losses on the disposal of an entity include the carrying amount of goodwill relating to the entity sold. Goodwill is allocated to CGUs for the purpose of impairment testing. The allocation is made to those CGUs or groups of CGUs that are expected to benefit from the business combination in which the goodwill arose, identified according to operating segments (refer to note 3).
s) Trade and other payablesThese amounts represent liabilities for goods and services provided to the consolidated entity prior to the end of the year which are unpaid. The amounts are unsecured and are usually paid within 30 days of recognition. Trade and other payables are presented as current liabilities unless payment is not due within 12 months from the reporting date. They are recognised initially at fair value and subsequently measured at amortised cost using the effective interest method.
1 Summary of significant accounting policies / continued
i) Fair value hedgesChanges in the fair value derivatives that are designated and qualify as fair value hedges are recorded in profit or loss, together with any changes in the fair value of the hedged asset or liability that are attributable to the hedged risk. The gain or loss relating to the effective portion of interest rate swaps hedging fixed rate borrowings is recognised in profit or loss within finance costs, together with changes in the fair value of the hedged fixed rate borrowings attributable to interest rate risk. The gain or loss relating to the ineffective portion is recognised in profit or loss within other income or other expenses. If the hedge no longer meets the criteria for hedge accounting, the adjustment to the carrying amount of a hedged item for which the effective interest method is used is amortised to profit or loss over the period to maturity using a recalculated effective interest rate.
ii) Cash flow hedgesThe effective portion of changes in the fair value of derivatives that are designated and qualify as cash flow hedges is recognised in other comprehensive income and accumulated in reserves in equity. The gain or loss relating to the ineffective portion is recognised immediately in profit or loss. Amounts accumulated in equity are reclassified to profit or loss in the periods when the hedged item will affect profit or loss (for instance, when the forecast sale that is hedged takes place). However, when the forecast transaction that is hedged results in the recognition of a non-financial asset (for example, inventories) or a non-financial liability, the gains and losses previously deferred in equity are transferred from equity and included in the measurement of the initial cost or carrying amount of the asset or liability. When a hedging instrument expires or is sold or terminated, or when a hedge no longer meets the criteria for hedge accounting, any cumulative gain or loss existing in equity at that time remains in equity and is recognised when the forecast transaction is ultimately recognised in profit or loss. When a forecast transaction is no longer expected to occur, the cumulative gain or loss that was reported in equity is immediately transferred to profit or loss.
iii) Derivatives that do not qualify for hedge accountingCertain derivative instruments do not qualify for hedge accounting. Changes in the fair value of any derivative instrument that does not qualify for hedge accounting are recognised immediately in profit or loss.
o) Fair value estimationWhere financial assets and liabilities are carried at fair value, the fair value is based on assumptions of future events and involves significant estimates. The basis of valuation is set out in note 28.
p) Convertible notesThe consolidated entity invests in convertible notes issued by trusts where the consolidated entity also has an investment accounted for using the equity method. Convertible notes are issued to fund the development costs of investment property currently under construction held by the trusts. During the year, Mirvac 8 Chifley Trust’s investment property 8 Chifley reached practical completion and all convertible notes issued from the Mirvac 8 Chifley Trust were converted to ordinary equity.
17MIRVAC PROPERTY TRUST AND ITS CONTROLLED ENTITIES ANNUAL FINANCIAL REPORT 2014
x) Earnings per stapled uniti) Basic earnings per stapled unitBasic earnings per stapled unit are calculated by dividing the profit attributable to unitholders of the Trust by the weighted average number of ordinary stapled units outstanding during the year. In calculating basic earnings per stapled unit, stapled units issued under the EIS have been excluded from the weighted average number of stapled units.
ii) Diluted earnings per stapled unitDiluted earnings per stapled unit adjusts the figures used in the determination of basic earnings per stapled unit to take into account the after income tax effect of interest and other financing costs associated with dilutive potential ordinary stapled units (including those stapled units issued under the EIS) and the weighted average number of stapled units assumed to have been issued for no consideration in relation to dilutive potential ordinary stapled units.
y) Parent entity financial informationThe financial information for the parent entity, Mirvac Property Trust, disclosed in note 33 has been prepared on the same basis as the consolidated financial statements, except as set out below:
i) Investments in controlled entities, associates and joint ventures
Investments in controlled entities, associates and joint ventures are accounted for at cost in the financial statements of the Trust. Dividends/distributions received from associates and joint ventures are recognised in the parent entity’s profit or loss, rather than being deducted from the carrying amount of these investments.
ii) Financial guaranteesWhere the parent entity has provided financial guarantees in relation to loans and payables of controlled entities for no compensation, the fair values of these guarantees are accounted for as contributions and recognised as part of the cost of the investment.
z) New accounting standards and interpretationsCertain new accounting standards and interpretations have been published that are not mandatory for the 30 June 2014 year. The consolidated entity’s assessment of the impact of these new standards and interpretations is set out below:
i) AASB 9 Financial InstrumentsThis standard addresses the classification, measurement and derecognition of financial assets and financial liabilities. Since December 2013, it also sets out new rules for hedge accounting. The standard only permits the recognition of fair value gains and losses in other comprehensive income if they relate to equity investments that are not held for trading. Fair value gains and losses on available-for-sale debt investments, for example, will therefore have to be recognised directly in profit or loss. In the current reporting period, the consolidated entity did not recognise any such gains in other comprehensive income and did not hold any available-for-sale debt investments. There will be no impact on the consolidated entity’s accounting for financial liabilities, as the new requirements only affect the accounting for financial liabilities that are designated at fair value through profit or loss and the consolidated entity does not have any such liabilities. The consolidated entity has not yet decided when to adopt AASB 9.
This standard must be applied for financial years commencing on or after 1 January 2017.
There are no other standards that are not yet effective and that are expected to have a material impact on the entity in the current or future year and on foreseeable future transactions.
1 Summary of significant accounting policies / continued
t) Borrowings and borrowing costsBorrowings are initially recognised at fair value, net of transaction costs incurred. Borrowings are subsequently measured at amortised cost. Any difference between the proceeds (net of transaction costs) and the redemption amount is recognised in profit or loss over the period of the borrowings using the effective interest method. Fees paid on the establishment of loan facilities, which are not an incremental cost relating to the actual drawdown of the facility, are recognised as prepayments and amortised on a straight line basis over the term of the facility. Borrowings are removed from the consolidated SoFP when the obligation specified in the contract is discharged, cancelled or expired. Borrowings are classified as current liabilities unless the consolidated entity has an unconditional right to defer settlement of the liability for at least 12 months after the end of the year. Borrowing costs incurred for the construction of any qualifying asset are capitalised during the period of time that is required to complete and prepare the asset for its intended use or sale. Other borrowing costs are expensed.
u) ProvisionsProvisions for legal claims, contracts and make good obligations are recognised when the consolidated entity has a present legal or constructive obligation as a result of past events, it is probable that an outflow of resources will be required to settle the obligation and the amount has been reliably estimated. Provisions are not recognised for future operating losses. Where there are a number of similar obligations, the likelihood that an outflow will be required in settlement is determined by considering the class of obligations as a whole. A provision is recognised even if the likelihood of an outflow with respect to any one item included in the same class of obligations may be small. Provisions are measured at the present value of management’s best estimate of the expenditure required to settle the present obligation at the end of the year. The discount rate used to determine the present value reflects current market assessments of the time value of money and the risks specific to the liability. The increase in the provision due to the passage of time is recognised as interest expense.
v) Contributed equityOrdinary stapled units are classified as equity. Incremental costs directly attributable to the issue of new units or options are shown in equity as a deduction, net of tax, from the proceeds. Incremental costs directly attributable to the issue of new units or options, or for the acquisition of a business, are not included in the cost of the acquisition as part of the purchase consideration. In accordance with AASB 2 Share-based Payment, units issued as part of the LTI plan and EIS are not classified as ordinary stapled units, until such time as the employee loans are fully repaid or the employee leaves Mirvac. If the consolidated entity reacquires its own equity instruments, for example, as the result of a security buy-back, those instruments are deducted from equity and the associated stapled units are cancelled. No gain or loss is recognised in profit or loss and the consideration paid including any directly attributable incremental costs (net of income taxes) is recognised directly in equity.
w) DistributionsProvision is made for the amount of any distribution declared at or before the end of the year but not distributed by the end of the year.
18
Notes to the consolidated financial statements
MIRVAC PROPERTY TRUST AND ITS CONTROLLED ENTITIES ANNUAL FINANCIAL REPORT 2014
2 Critical accounting judgements and estimatesJudgements and estimates are continually evaluated, based on historical experience and other factors, including expectations of future events that may have a financial impact and are believed to be reasonable under the circumstances.
a) Critical judgements in applying MPT’s accounting policiesThe following are the critical judgements that management has made in the process of applying the consolidated entity’s accounting policies and that have the most significant effect on the amounts recognised in the financial statements:
i) Fair value estimationWhere financial assets and liabilities are carried at fair value, the fair value is based on assumptions of future events and involves significant estimates. The basis of valuation is set out in note 1(o); however, the fair values of derivatives reported at the end of the year may differ if there is volatility in market rates, indexes, equity prices or foreign exchange rates in future periods.
b) Key sources of estimation uncertaintyIn preparing the financial statements, management is required to make estimations and assumptions. The following are the key assumptions concerning the future and other key sources of estimation uncertainty at the end of the year, that have a significant risk of causing material adjustment to the carrying amounts of assets and liabilities within the next year:
i) Impairment of goodwillThe consolidated entity annually tests whether goodwill has suffered any impairment, in accordance with the accounting policy stated in note 1(r). Determining whether goodwill is impaired requires an estimation of the value in use of the CGUs to which goodwill has been allocated. The value in use calculation requires the entity to estimate the future cash flows expected to arise from each CGU and a suitable discount rate in order to calculate the net present value (“NPV”). The carrying amount of goodwill at the end of the year was $42.8m (2013: $69.5m). $24.5m impairment loss was recognised during the year in relation to the pending sale of 50 per cent of 275 Kent Street, Sydney NSW $2.2m of impairment was recognised as a selling costs of 54–60 Talavera Road, North Ryde NSW (2013: $nil). For further details refer to note 15.
ii) Estimated impairment of investments accounted for using the equity method
The investments are tested for impairment, by comparing recoverable amounts (higher of value in use, and fair value less costs to sell) with the carrying amounts, whenever there is indication that the investment may be impaired. In determining the value in use of the investment, the consolidated entity estimates the present value of the estimated future cash flows expected to arise from distributions to be received from the investment and from its ultimate disposal. Details of the assumptions used by management in assessing impairment are provided in note 11(f).
iii) Fair value of investments not traded in active marketsThe fair value of investments not traded in an active market is determined by the unit price as advised by the fund manager. The unit price is determined by the NPV calculations using future cash flows and an appropriate post-tax discount rate Refer to note 28). The carrying value of investments not traded in an active market determined using the above techniques and assumptions is $11.8m (2013: $12.0m) and is disclosed as other financial assets at fair value through profit or loss (refer to note 9).
1 Summary of significant accounting policies / continued
aa) Changes in accounting policiesAs explained in note 1(b)(vii) above, the consolidated entity has adopted a number of new or revised accounting standards this year that have resulted in changes in accounting policies and adjustments to the amounts recognised in the financial statements.
i) Consolidated financial statements and joint arrangementsAASB 10 Consolidated Financial Statements was issued in August 2011 and replaces the guidance on control and consolidation in AASB 127 Consolidated and Separate Financial Statements and in Interpretation 112 Consolidation – Special Purpose Entities. The consolidated entity has reviewed its investments in other entities to assess whether the conclusion to consolidate is different under AASB 10 than under AASB 127. No differences were found and therefore no adjustments to any of the carrying amounts in the financial statements are required as a result of the adoption of AASB 10.
Under AASB 11 Joint Arrangements, investments in joint arrangements are classified as either joint operations or joint ventures depending on the contractual rights and obligations of each investor. The consolidated entity has assessed the nature of its joint arrangements and determined to have only joint ventures. As a result of this assessment, a few of the Trust’s interests in associates have been reclassified as interests in joint ventures; however, there is no material impact to the consolidated SoFP during the reporting period.
The consolidated entity’s accounting for its interests in joint ventures was not affected by the adoption of the new standard since the consolidated had already applied the equity method in accounting for these interests. As required under AASB 11, the change in policy has been applied retrospectively, however, there is no impact to the consolidated SoFP as at 30 June 2014.
ii) Fair value measurementAASB 13 Fair Value Measurement aims to improve consistency and reduce complexity by providing a precise definition of fair value and a single source of fair value measurement and disclosure requirements for use across AAS. The standard does not extend the use of fair value accounting but provides guidance on how it should be applied where its use is already required or permitted by other AAS.
Previously, the fair value of financial liabilities (including derivatives) was measured on the basis that the financial liability would be settled or extinguished with the counterparty. The adoption of AASB 13 has clarified that fair value is an exit price notion, and as such, the fair value of financial liabilities should be determined based on a transfer value to a third party market participant. The change in policy has been applied retrospectively; however, there is not impact to the consolidated SoFP.
19MIRVAC PROPERTY TRUST AND ITS CONTROLLED ENTITIES ANNUAL FINANCIAL REPORT 2014
3 Segmental informationSegment results include items directly attributable to a segment as well as those that can be allocated on a reasonable basis. Unallocated items mainly comprise financing and other borrowing costs, indirect investments, other income and expenses. The consolidated entity operates predominantly in one geographic segment, Australia.
Segment results are now reported in a manner that is consistent with the internal reporting provided to the CODM. The CODM that makes strategic decisions for the consolidated entity has been identified as the ELT. The ELT allocates resources to and assesses the performance of the operating segments of the consolidated entity. Net operating income is considered a key indicator of analysis when evaluating the consolidated entity’s ability to pay distributions to stapled unitholders.
a) Descriptions of business segmentsIndividual business segments have been identified on the basis of grouping individual products or services subject to similar risks and returns.
The main business segments of the consolidated entity are the investment in properties which are leased to third parties for the following uses:
— office office accommodation;
— retail retail accommodation;
— industrial factories and other industrial use accommodation;
— other hotel and car park facilities accommodation; and
— unallocated not attributed directly to one of the above segments.
b) Inter-segment transfersSegment revenues, expenses and results include transfers between segments. Such transfers are on an arm’s length basis and eliminated on consolidation.
c) Comparative informationWhen necessary, comparative information has been reclassified to achieve consistency in disclosure in current year amounts and other disclosures.
d) Operating profitOperating profit is a financial measure which is not prescribed by AAS and represents the profit under AAS adjusted for specific non-cash items and significant items which management considers to reflect the core earnings of the consolidated entity.
e) Segment liabilitiesThe amounts provided to the ELT with respect to total liabilities are measured in a manner consistent with that of the financial statements. These liabilities are allocated based on the operations of the segment. The consolidated entity’s borrowings and derivative financial instruments are not considered to be segment liabilities but rather are managed by the Mirvac Group Treasury function.
f) Geographical analysisThe consolidated entity operates predominantly in Australia.
2 Critical accounting judgements and estimates / continued
iv) Valuation of investment propertiesThe consolidated entity uses judgement in respect of the fair values of investment properties. Investment properties are revalued by external valuers on a rotation basis with approximately one half of the portfolio being valued annually. Investment properties which are not subject to an external valuation at the end of the reporting period are fair valued internally by management. The assumptions used in the estimations of fair values include expected future market rentals, discount rates, market prices and economic conditions. The reported fair values of investment properties reflect the market conditions at the end of the year. While this represents the best estimation of fair value at the reporting date, actual sale prices achieved (should the investment properties be sold) may be higher or lower than the most recent valuation. This is particularly relevant in periods of market illiquidity or uncertainty. Major assumptions used in valuation of investment properties are disclosed in note 14. The carrying value at the end of the year for investment properties was $6,141.1m (2013: $6,232.9m). Details on investment properties are provided in note 14.
v) Valuation of IPUCIPUC are valued at fair value. There are generally no active markets for IPUC and fair value is considered to be the estimated market price that would be paid for the partially completed property, reflecting the expectations of market participants of the value of the property when complete less deductions for the estimated costs to complete with appropriate adjustments for risk and profit. The fair value is determined on the basis of either DCF or residual methods. Both methods require consideration of the project risks which are relevant to the development process, including but not limited to construction and letting risks. The estimated value of future assets is based on the expected future income from the project, using current yields of similar completed properties. The net loss on fair value of IPUC was $9.5m (2013: $5.3m). The carrying value of $126.0m (2013: $74.9m) at the end of the year is included in investment properties (refer to note 14).
vi) Valuation of derivatives and other financial instrumentsThe consolidated entity uses judgement in selecting the appropriate valuation technique for financial instruments not quoted in an active market. Valuation of derivative financial instruments involves assumptions based on quoted market rates adjusted for specific features of the instrument. The valuations of any financial instrument may change in the event of market volatility. The valuation techniques are discussed in detail at note 28 and have been developed in compliance with requirements of AASB 139 Financial Instruments: Recognition and Measurement.
vii) Classification of investments in structured entities as an associate/joint venture
The consolidated entity holds 14 per cent of Mirvac Industrial Trust. The Trust equity accounts for this investment as an associate even though it owns less than 20 per cent of the voting or potential voting power due to the fact that it has significant influence over this entity as the Responsible Entity is Mirvac Funds Management Limited, a related party of the Responsible Entity of the Trust.
The Trust holds 25 per cent of Australian Sustainable Forestry Investment 1&2. The Trust equity accounts for this investment as a joint venture even though it owns 25 per cent of the voting or potential voting power due to the fact that major decisions affecting the joint venture require unanimous approval from each investor in the joint venture.
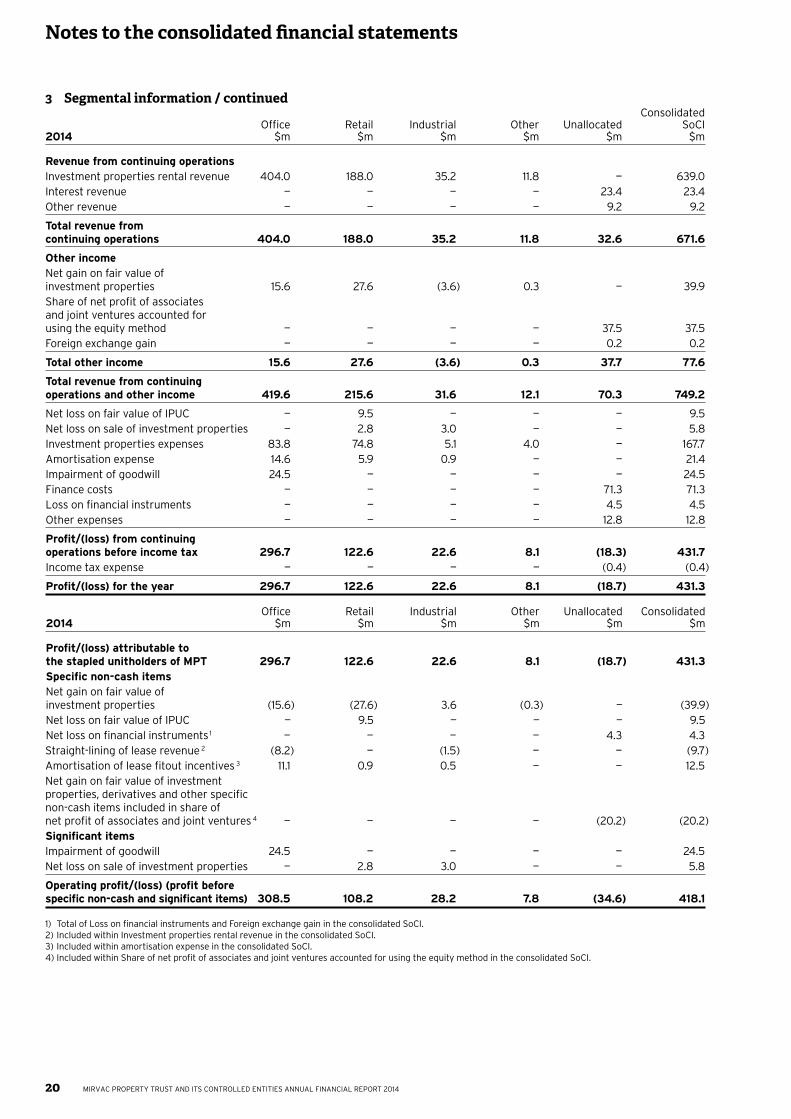
20
Notes to the consolidated financial statements
MIRVAC PROPERTY TRUST AND ITS CONTROLLED ENTITIES ANNUAL FINANCIAL REPORT 2014
3 Segmental information / continued Consolidated Office Retail Industrial Other Unallocated SoCI 2014 $m $m $m $m $m $m
Revenue from continuing operationsInvestment properties rental revenue 404.0 188.0 35.2 11.8 — 639.0Interest revenue — — — — 23.4 23.4Other revenue — — — — 9.2 9.2
Total revenue from continuing operations 404.0 188.0 35.2 11.8 32.6 671.6
Other incomeNet gain on fair value of investment properties 15.6 27.6 (3.6) 0.3 — 39.9Share of net profit of associates and joint ventures accounted for using the equity method — — — — 37.5 37.5Foreign exchange gain — — — — 0.2 0.2
Total other income 15.6 27.6 (3.6) 0.3 37.7 77.6
Total revenue from continuing operations and other income 419.6 215.6 31.6 12.1 70.3 749.2
Net loss on fair value of IPUC — 9.5 — — — 9.5Net loss on sale of investment properties — 2.8 3.0 — — 5.8Investment properties expenses 83.8 74.8 5.1 4.0 — 167.7Amortisation expense 14.6 5.9 0.9 — — 21.4Impairment of goodwill 24.5 — — — — 24.5Finance costs — — — — 71.3 71.3Loss on financial instruments — — — — 4.5 4.5Other expenses — — — — 12.8 12.8
Profit/(loss) from continuing operations before income tax 296.7 122.6 22.6 8.1 (18.3) 431.7Income tax expense — — — — (0.4) (0.4)
Profit/(loss) for the year 296.7 122.6 22.6 8.1 (18.7) 431.3
Office Retail Industrial Other Unallocated Consolidated 2014 $m $m $m $m $m $m
Profit/(loss) attributable to the stapled unitholders of MPT 296.7 122.6 22.6 8.1 (18.7) 431.3Specific non-cash itemsNet gain on fair value of investment properties (15.6) (27.6) 3.6 (0.3) — (39.9)Net loss on fair value of IPUC — 9.5 — — — 9.5Net loss on financial instruments 1 — — — — 4.3 4.3Straight-lining of lease revenue 2 (8.2) — (1.5) — — (9.7)Amortisation of lease fitout incentives 3 11.1 0.9 0.5 — — 12.5Net gain on fair value of investment properties, derivatives and other specific non-cash items included in share of net profit of associates and joint ventures 4 — — — — (20.2) (20.2)Significant itemsImpairment of goodwill 24.5 — — — — 24.5Net loss on sale of investment properties — 2.8 3.0 — — 5.8
Operating profit/(loss) (profit before specific non-cash and significant items) 308.5 108.2 28.2 7.8 (34.6) 418.1
1) Total of Loss on financial instruments and Foreign exchange gain in the consolidated SoCI.2) Included within Investment properties rental revenue in the consolidated SoCI.3) Included within amortisation expense in the consolidated SoCI.4) Included within Share of net profit of associates and joint ventures accounted for using the equity method in the consolidated SoCI.
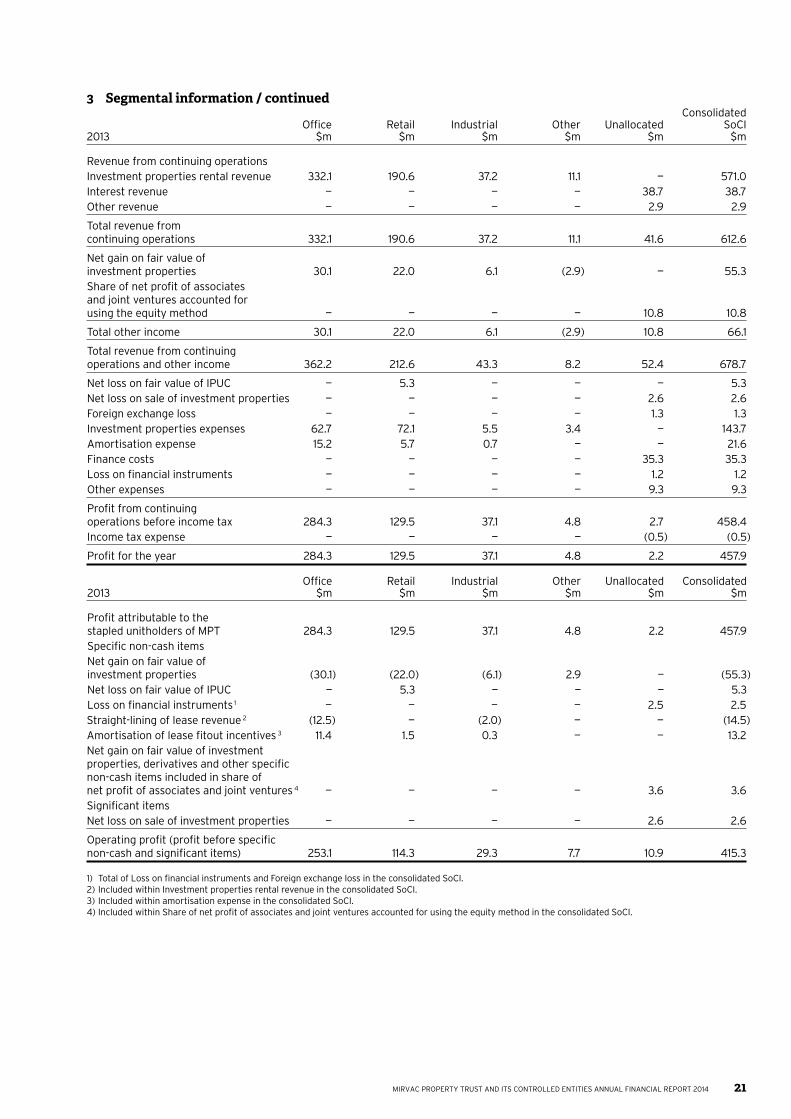
21MIRVAC PROPERTY TRUST AND ITS CONTROLLED ENTITIES ANNUAL FINANCIAL REPORT 2014
3 Segmental information / continued Consolidated Office Retail Industrial Other Unallocated SoCI 2013 $m $m $m $m $m $m
Revenue from continuing operationsInvestment properties rental revenue 332.1 190.6 37.2 11.1 — 571.0Interest revenue — — — — 38.7 38.7Other revenue — — — — 2.9 2.9
Total revenue from continuing operations 332.1 190.6 37.2 11.1 41.6 612.6
Net gain on fair value of investment properties 30.1 22.0 6.1 (2.9) — 55.3Share of net profit of associates and joint ventures accounted for using the equity method — — — — 10.8 10.8
Total other income 30.1 22.0 6.1 (2.9) 10.8 66.1
Total revenue from continuing operations and other income 362.2 212.6 43.3 8.2 52.4 678.7
Net loss on fair value of IPUC — 5.3 — — — 5.3Net loss on sale of investment properties — — — — 2.6 2.6Foreign exchange loss — — — — 1.3 1.3Investment properties expenses 62.7 72.1 5.5 3.4 — 143.7Amortisation expense 15.2 5.7 0.7 — — 21.6Finance costs — — — — 35.3 35.3Loss on financial instruments — — — — 1.2 1.2Other expenses — — — — 9.3 9.3
Profit from continuing operations before income tax 284.3 129.5 37.1 4.8 2.7 458.4Income tax expense — — — — (0.5) (0.5)
Profit for the year 284.3 129.5 37.1 4.8 2.2 457.9
Office Retail Industrial Other Unallocated Consolidated 2013 $m $m $m $m $m $m
Profit attributable to the stapled unitholders of MPT 284.3 129.5 37.1 4.8 2.2 457.9Specific non-cash itemsNet gain on fair value of investment properties (30.1) (22.0) (6.1) 2.9 — (55.3)Net loss on fair value of IPUC — 5.3 — — — 5.3Loss on financial instruments 1 — — — — 2.5 2.5Straight-lining of lease revenue 2 (12.5) — (2.0) — — (14.5)Amortisation of lease fitout incentives 3 11.4 1.5 0.3 — — 13.2Net gain on fair value of investment properties, derivatives and other specific non-cash items included in share of net profit of associates and joint ventures 4 — — — — 3.6 3.6Significant itemsNet loss on sale of investment properties — — — — 2.6 2.6
Operating profit (profit before specific non-cash and significant items) 253.1 114.3 29.3 7.7 10.9 415.3
1) Total of Loss on financial instruments and Foreign exchange loss in the consolidated SoCI.2) Included within Investment properties rental revenue in the consolidated SoCI.3) Included within amortisation expense in the consolidated SoCI.4) Included within Share of net profit of associates and joint ventures accounted for using the equity method in the consolidated SoCI.
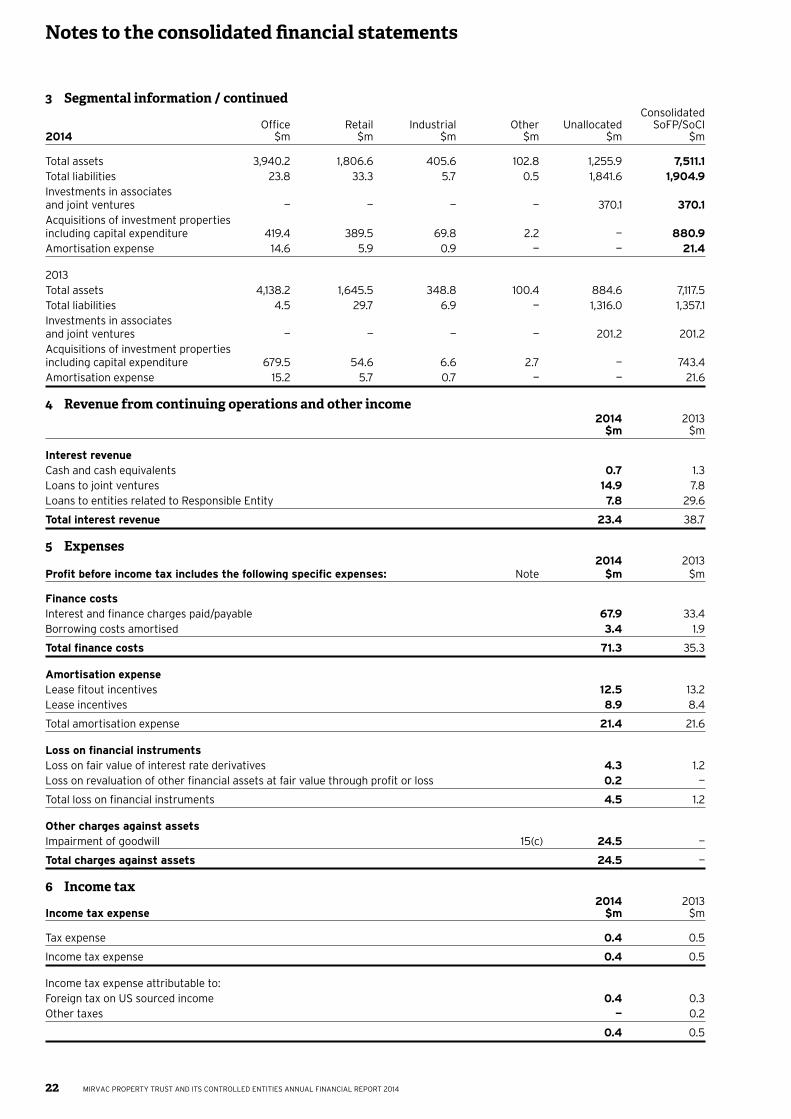
22
Notes to the consolidated financial statements
MIRVAC PROPERTY TRUST AND ITS CONTROLLED ENTITIES ANNUAL FINANCIAL REPORT 2014
3 Segmental information / continued Consolidated Office Retail Industrial Other Unallocated SoFP/SoCI 2014 $m $m $m $m $m $m
Total assets 3,940.2 1,806.6 405.6 102.8 1,255.9 7,511.1Total liabilities 23.8 33.3 5.7 0.5 1,841.6 1,904.9Investments in associates and joint ventures — — — — 370.1 370.1Acquisitions of investment properties including capital expenditure 419.4 389.5 69.8 2.2 — 880.9Amortisation expense 14.6 5.9 0.9 — — 21.4
2013Total assets 4,138.2 1,645.5 348.8 100.4 884.6 7,117.5Total liabilities 4.5 29.7 6.9 — 1,316.0 1,357.1Investments in associates and joint ventures — — — — 201.2 201.2Acquisitions of investment properties including capital expenditure 679.5 54.6 6.6 2.7 — 743.4Amortisation expense 15.2 5.7 0.7 — — 21.6
4 Revenue from continuing operations and other income 2014 2013 $m $m
Interest revenueCash and cash equivalents 0.7 1.3Loans to joint ventures 14.9 7.8Loans to entities related to Responsible Entity 7.8 29.6
Total interest revenue 23.4 38.7
5 Expenses 2014 2013 Profit before income tax includes the following specific expenses: Note $m $m
Finance costsInterest and finance charges paid/payable 67.9 33.4Borrowing costs amortised 3.4 1.9
Total finance costs 71.3 35.3
Amortisation expenseLease fitout incentives 12.5 13.2Lease incentives 8.9 8.4
Total amortisation expense 21.4 21.6
Loss on financial instrumentsLoss on fair value of interest rate derivatives 4.3 1.2Loss on revaluation of other financial assets at fair value through profit or loss 0.2 —
Total loss on financial instruments 4.5 1.2
Other charges against assetsImpairment of goodwill 15(c) 24.5 —
Total charges against assets 24.5 —
6 Income tax 2014 2013 Income tax expense $m $m
Tax expense 0.4 0.5
Income tax expense 0.4 0.5
Income tax expense attributable to:Foreign tax on US sourced income 0.4 0.3Other taxes — 0.2
0.4 0.5
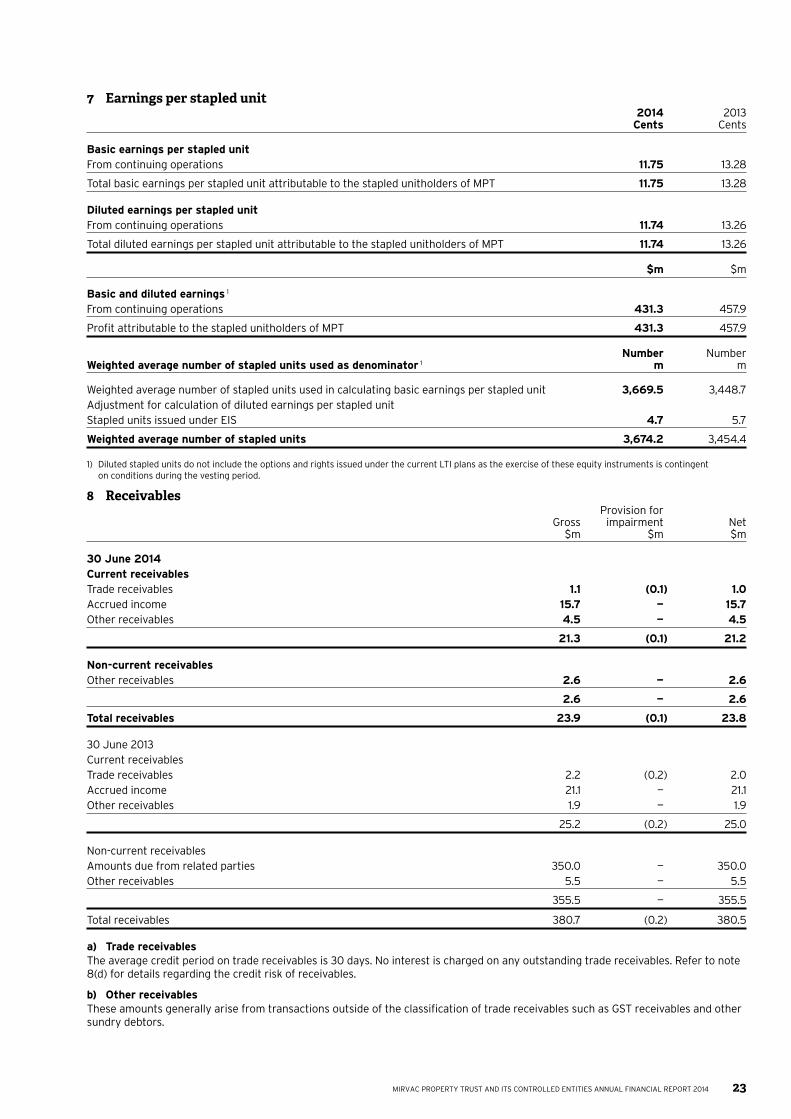
23MIRVAC PROPERTY TRUST AND ITS CONTROLLED ENTITIES ANNUAL FINANCIAL REPORT 2014
7 Earnings per stapled unit 2014 2013 Cents Cents
Basic earnings per stapled unitFrom continuing operations 11.75 13.28
Total basic earnings per stapled unit attributable to the stapled unitholders of MPT 11.75 13.28
Diluted earnings per stapled unitFrom continuing operations 11.74 13.26
Total diluted earnings per stapled unit attributable to the stapled unitholders of MPT 11.74 13.26
$m $m
Basic and diluted earnings 1
From continuing operations 431.3 457.9
Profit attributable to the stapled unitholders of MPT 431.3 457.9
Number Number Weighted average number of stapled units used as denominator 1 m m
Weighted average number of stapled units used in calculating basic earnings per stapled unit 3,669.5 3,448.7Adjustment for calculation of diluted earnings per stapled unitStapled units issued under EIS 4.7 5.7
Weighted average number of stapled units 3,674.2 3,454.4
1) Diluted stapled units do not include the options and rights issued under the current LTI plans as the exercise of these equity instruments is contingent on conditions during the vesting period.
8 Receivables Provision for Gross impairment Net $m $m $m
30 June 2014Current receivablesTrade receivables 1.1 (0.1) 1.0Accrued income 15.7 — 15.7Other receivables 4.5 — 4.5
21.3 (0.1) 21.2
Non-current receivablesOther receivables 2.6 — 2.6
2.6 — 2.6
Total receivables 23.9 (0.1) 23.8
30 June 2013Current receivablesTrade receivables 2.2 (0.2) 2.0Accrued income 21.1 — 21.1Other receivables 1.9 — 1.9
25.2 (0.2) 25.0
Non-current receivablesAmounts due from related parties 350.0 — 350.0Other receivables 5.5 — 5.5
355.5 — 355.5
Total receivables 380.7 (0.2) 380.5
a) Trade receivablesThe average credit period on trade receivables is 30 days. No interest is charged on any outstanding trade receivables. Refer to note 8(d) for details regarding the credit risk of receivables.
b) Other receivablesThese amounts generally arise from transactions outside of the classification of trade receivables such as GST receivables and other sundry debtors.
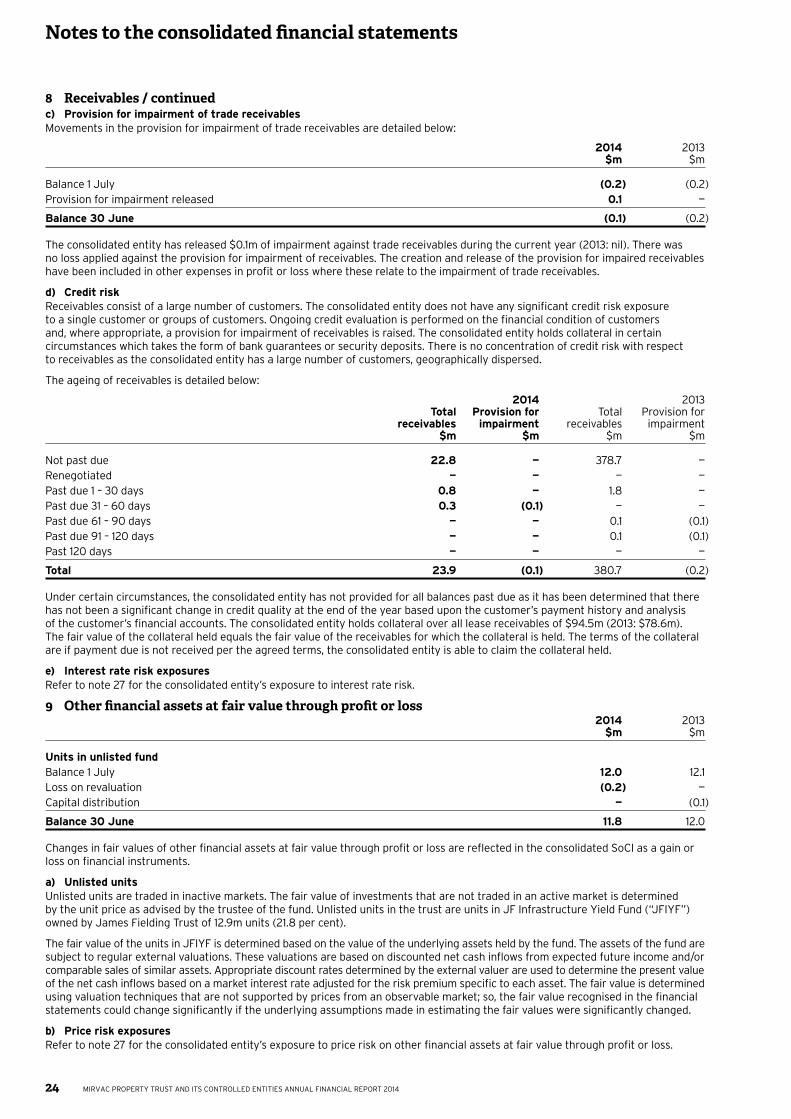
24
Notes to the consolidated financial statements
MIRVAC PROPERTY TRUST AND ITS CONTROLLED ENTITIES ANNUAL FINANCIAL REPORT 2014
8 Receivables / continuedc) Provision for impairment of trade receivablesMovements in the provision for impairment of trade receivables are detailed below:
2014 2013 $m $m
Balance 1 July (0.2) (0.2)Provision for impairment released 0.1 —
Balance 30 June (0.1) (0.2)
The consolidated entity has released $0.1m of impairment against trade receivables during the current year (2013: nil). There was no loss applied against the provision for impairment of receivables. The creation and release of the provision for impaired receivables have been included in other expenses in profit or loss where these relate to the impairment of trade receivables.
d) Credit riskReceivables consist of a large number of customers. The consolidated entity does not have any significant credit risk exposure to a single customer or groups of customers. Ongoing credit evaluation is performed on the financial condition of customers and, where appropriate, a provision for impairment of receivables is raised. The consolidated entity holds collateral in certain circumstances which takes the form of bank guarantees or security deposits. There is no concentration of credit risk with respect to receivables as the consolidated entity has a large number of customers, geographically dispersed.
The ageing of receivables is detailed below:
2014 2013 Total Provision for Total Provision for receivables impairment receivables impairment $m $m $m $m
Not past due 22.8 — 378.7 —Renegotiated — — — —Past due 1 – 30 days 0.8 — 1.8 —Past due 31 – 60 days 0.3 (0.1) — —Past due 61 – 90 days — — 0.1 (0.1)Past due 91 – 120 days — — 0.1 (0.1)Past 120 days — — — —
Total 23.9 (0.1) 380.7 (0.2)
Under certain circumstances, the consolidated entity has not provided for all balances past due as it has been determined that there has not been a significant change in credit quality at the end of the year based upon the customer’s payment history and analysis of the customer’s financial accounts. The consolidated entity holds collateral over all lease receivables of $94.5m (2013: $78.6m). The fair value of the collateral held equals the fair value of the receivables for which the collateral is held. The terms of the collateral are if payment due is not received per the agreed terms, the consolidated entity is able to claim the collateral held.
e) Interest rate risk exposuresRefer to note 27 for the consolidated entity’s exposure to interest rate risk.
9 Other financial assets at fair value through profit or loss 2014 2013 $m $m
Units in unlisted fundBalance 1 July 12.0 12.1Loss on revaluation (0.2) —Capital distribution — (0.1)
Balance 30 June 11.8 12.0
Changes in fair values of other financial assets at fair value through profit or loss are reflected in the consolidated SoCI as a gain or loss on financial instruments.
a) Unlisted unitsUnlisted units are traded in inactive markets. The fair value of investments that are not traded in an active market is determined by the unit price as advised by the trustee of the fund. Unlisted units in the trust are units in JF Infrastructure Yield Fund (“JFIYF”) owned by James Fielding Trust of 12.9m units (21.8 per cent).
The fair value of the units in JFIYF is determined based on the value of the underlying assets held by the fund. The assets of the fund are subject to regular external valuations. These valuations are based on discounted net cash inflows from expected future income and/or comparable sales of similar assets. Appropriate discount rates determined by the external valuer are used to determine the present value of the net cash inflows based on a market interest rate adjusted for the risk premium specific to each asset. The fair value is determined using valuation techniques that are not supported by prices from an observable market; so, the fair value recognised in the financial statements could change significantly if the underlying assumptions made in estimating the fair values were significantly changed.
b) Price risk exposuresRefer to note 27 for the consolidated entity’s exposure to price risk on other financial assets at fair value through profit or loss.
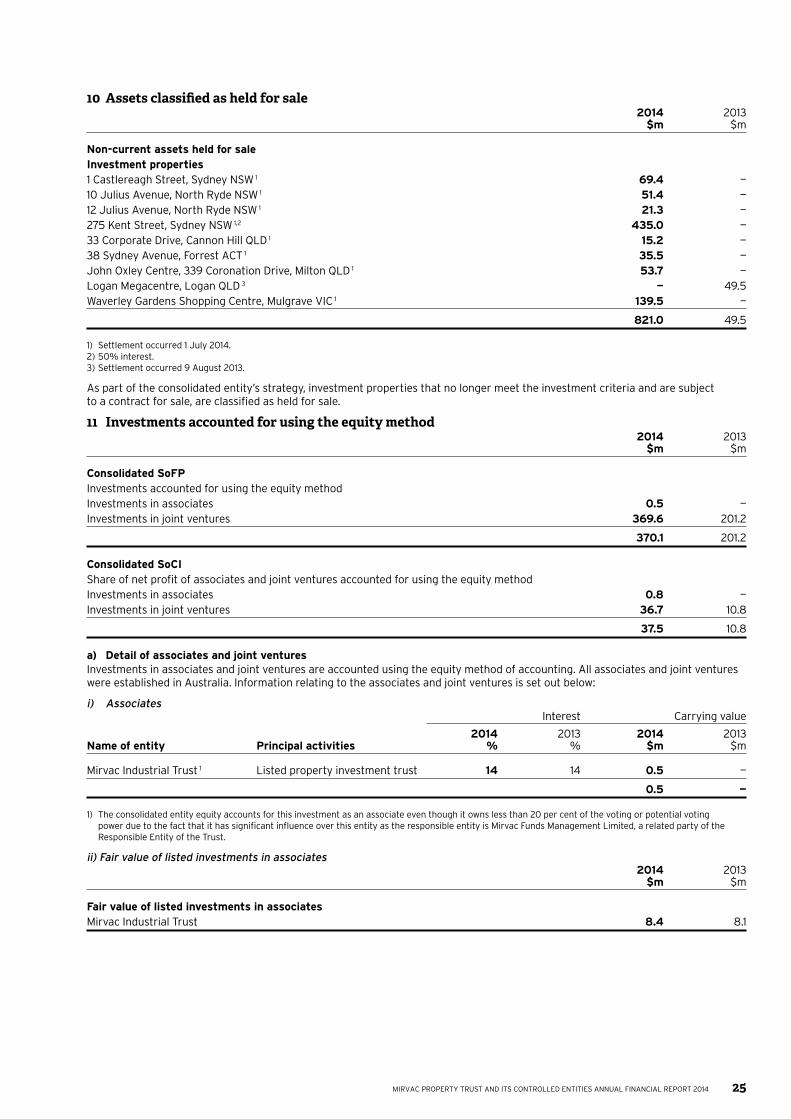
25MIRVAC PROPERTY TRUST AND ITS CONTROLLED ENTITIES ANNUAL FINANCIAL REPORT 2014
10 Assets classified as held for sale 2014 2013 $m $m
Non-current assets held for saleInvestment properties1 Castlereagh Street, Sydney NSW 1 69.4 —10 Julius Avenue, North Ryde NSW 1 51.4 —12 Julius Avenue, North Ryde NSW 1 21.3 —275 Kent Street, Sydney NSW 1,2 435.0 —33 Corporate Drive, Cannon Hill QLD 1 15.2 —38 Sydney Avenue, Forrest ACT 1 35.5 —John Oxley Centre, 339 Coronation Drive, Milton QLD 1 53.7 —Logan Megacentre, Logan QLD 3 — 49.5Waverley Gardens Shopping Centre, Mulgrave VIC 1 139.5 —
821.0 49.5
1) Settlement occurred 1 July 2014.2) 50% interest.3) Settlement occurred 9 August 2013.
As part of the consolidated entity’s strategy, investment properties that no longer meet the investment criteria and are subject to a contract for sale, are classified as held for sale.
11 Investments accounted for using the equity method 2014 2013 $m $m
Consolidated SoFPInvestments accounted for using the equity methodInvestments in associates 0.5 —Investments in joint ventures 369.6 201.2
370.1 201.2
Consolidated SoCIShare of net profit of associates and joint ventures accounted for using the equity methodInvestments in associates 0.8 —Investments in joint ventures 36.7 10.8
37.5 10.8
a) Detail of associates and joint venturesInvestments in associates and joint ventures are accounted using the equity method of accounting. All associates and joint ventures were established in Australia. Information relating to the associates and joint ventures is set out below:
i) Associates Interest Carrying value
2014 2013 2014 2013 Name of entity Principal activities % % $m $m
Mirvac Industrial Trust 1 Listed property investment trust 14 14 0.5 —
0.5 —
1) The consolidated entity equity accounts for this investment as an associate even though it owns less than 20 per cent of the voting or potential voting power due to the fact that it has significant influence over this entity as the responsible entity is Mirvac Funds Management Limited, a related party of the Responsible Entity of the Trust.
ii) Fair value of listed investments in associates 2014 2013 $m $m
Fair value of listed investments in associatesMirvac Industrial Trust 8.4 8.1
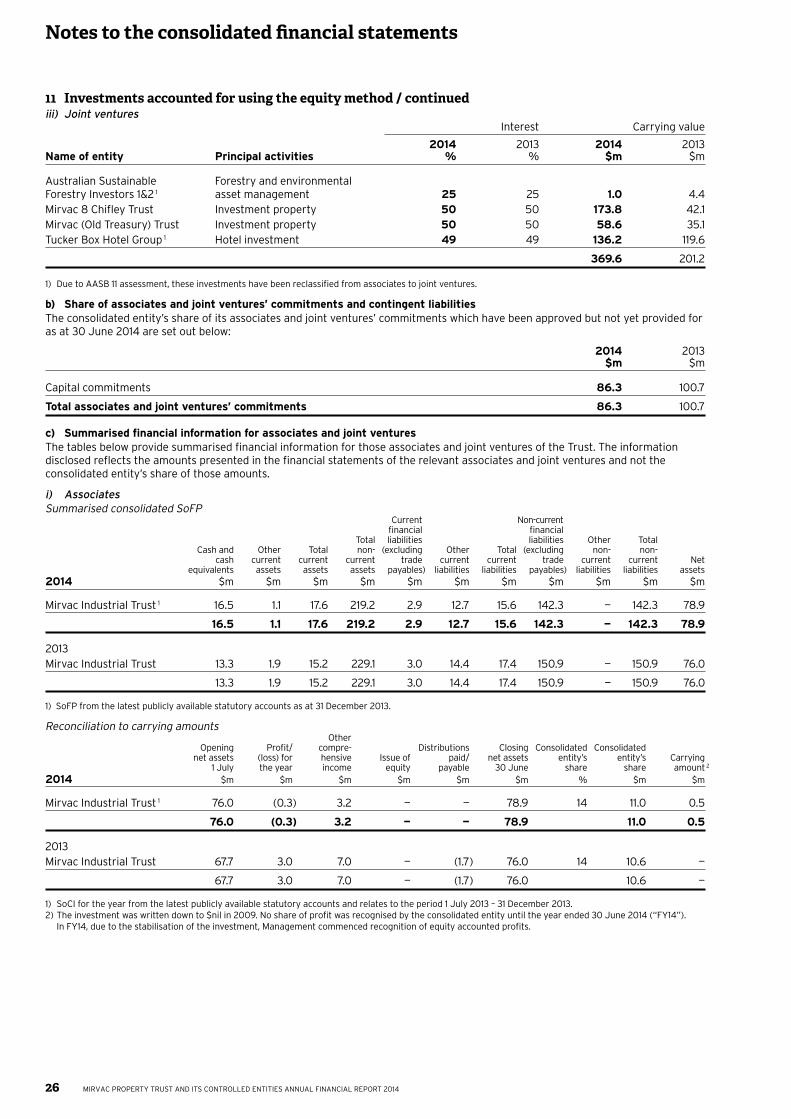
26
Notes to the consolidated financial statements
MIRVAC PROPERTY TRUST AND ITS CONTROLLED ENTITIES ANNUAL FINANCIAL REPORT 2014
11 Investments accounted for using the equity method / continuediii) Joint ventures Interest Carrying value
2014 2013 2014 2013 Name of entity Principal activities % % $m $m
Australian Sustainable Forestry and environmental Forestry Investors 1&2 1 asset management 25 25 1.0 4.4Mirvac 8 Chifley Trust Investment property 50 50 173.8 42.1Mirvac (Old Treasury) Trust Investment property 50 50 58.6 35.1Tucker Box Hotel Group 1 Hotel investment 49 49 136.2 119.6
369.6 201.2
1) Due to AASB 11 assessment, these investments have been reclassified from associates to joint ventures.
b) Share of associates and joint ventures’ commitments and contingent liabilitiesThe consolidated entity’s share of its associates and joint ventures’ commitments which have been approved but not yet provided for as at 30 June 2014 are set out below:
2014 2013 $m $m
Capital commitments 86.3 100.7
Total associates and joint ventures’ commitments 86.3 100.7
c) Summarised financial information for associates and joint venturesThe tables below provide summarised financial information for those associates and joint ventures of the Trust. The information disclosed reflects the amounts presented in the financial statements of the relevant associates and joint ventures and not the consolidated entity’s share of those amounts.
i) AssociatesSummarised consolidated SoFP Current Non-current financial financial Total liabilities liabilities Other Total Cash and Other Total non- (excluding Other Total (excluding non- non- cash current current current trade current current trade current current Net equivalents assets assets assets payables) liabilities liabilities payables) liabilities liabilities assets 2014 $m $m $m $m $m $m $m $m $m $m $m
Mirvac Industrial Trust 1 16.5 1.1 17.6 219.2 2.9 12.7 15.6 142.3 — 142.3 78.9
16.5 1.1 17.6 219.2 2.9 12.7 15.6 142.3 — 142.3 78.9
2013 Mirvac Industrial Trust 13.3 1.9 15.2 229.1 3.0 14.4 17.4 150.9 — 150.9 76.0
13.3 1.9 15.2 229.1 3.0 14.4 17.4 150.9 — 150.9 76.0
1) SoFP from the latest publicly available statutory accounts as at 31 December 2013.
Reconciliation to carrying amounts Other Opening Profit/ compre- Distributions Closing Consolidated Consolidated net assets (loss) for hensive Issue of paid/ net assets entity’s entity’s Carrying 1 July the year income equity payable 30 June share share amount 2 2014 $m $m $m $m $m $m % $m $m
Mirvac Industrial Trust 1 76.0 (0.3) 3.2 — — 78.9 14 11.0 0.5
76.0 (0.3) 3.2 — — 78.9 11.0 0.5
2013Mirvac Industrial Trust 67.7 3.0 7.0 — (1.7) 76.0 14 10.6 —
67.7 3.0 7.0 — (1.7) 76.0 10.6 —
1) SoCI for the year from the latest publicly available statutory accounts and relates to the period 1 July 2013 – 31 December 2013.2) The investment was written down to $nil in 2009. No share of profit was recognised by the consolidated entity until the year ended 30 June 2014 (“FY14”).
In FY14, due to the stabilisation of the investment, Management commenced recognition of equity accounted profits.
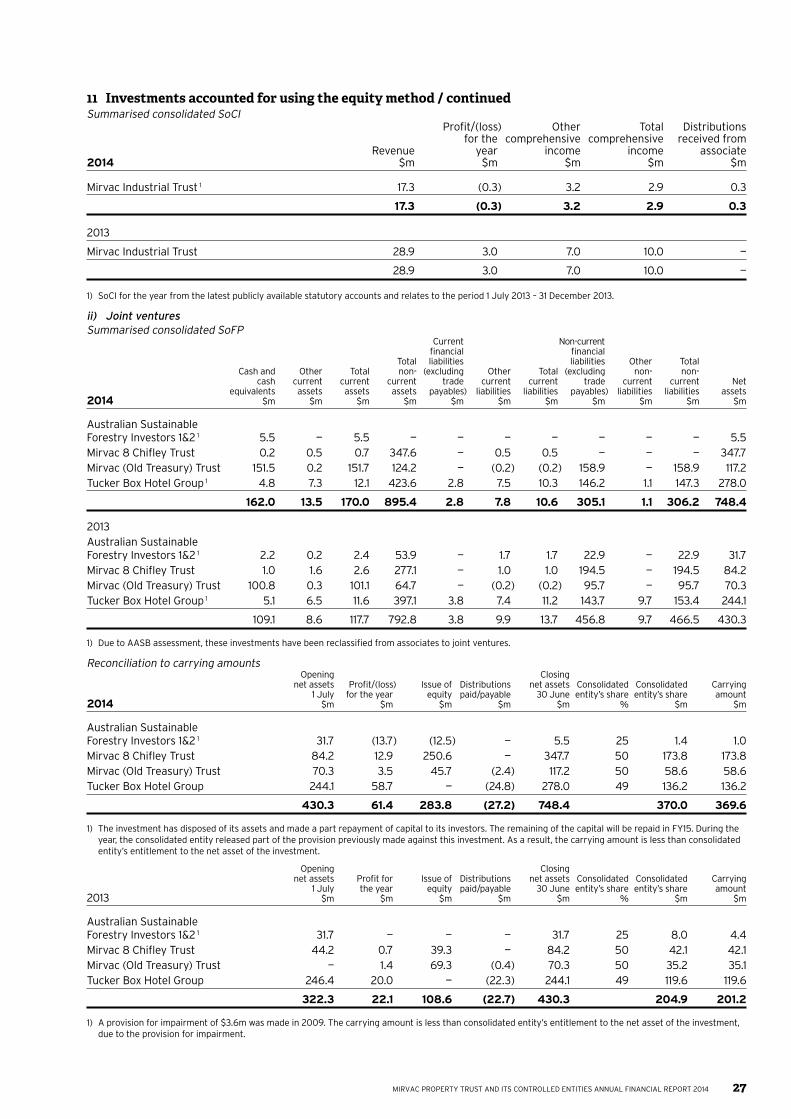
27MIRVAC PROPERTY TRUST AND ITS CONTROLLED ENTITIES ANNUAL FINANCIAL REPORT 2014
11 Investments accounted for using the equity method / continuedSummarised consolidated SoCI Profit/(loss) Other Total Distributions for the comprehensive comprehensive received from Revenue year income income associate 2014 $m $m $m $m $m
Mirvac Industrial Trust 1 17.3 (0.3) 3.2 2.9 0.3
17.3 (0.3) 3.2 2.9 0.3
2013
Mirvac Industrial Trust 28.9 3.0 7.0 10.0 —
28.9 3.0 7.0 10.0 —
1) SoCI for the year from the latest publicly available statutory accounts and relates to the period 1 July 2013 – 31 December 2013.
ii) Joint venturesSummarised consolidated SoFP Current Non-current financial financial Total liabilities liabilities Other Total Cash and Other Total non- (excluding Other Total (excluding non- non- cash current current current trade current current trade current current Net equivalents assets assets assets payables) liabilities liabilities payables) liabilities liabilities assets 2014 $m $m $m $m $m $m $m $m $m $m $m
Australian Sustainable Forestry Investors 1&2 1 5.5 — 5.5 — — — — — — — 5.5 Mirvac 8 Chifley Trust 0.2 0.5 0.7 347.6 — 0.5 0.5 — — — 347.7 Mirvac (Old Treasury) Trust 151.5 0.2 151.7 124.2 — (0.2) (0.2) 158.9 — 158.9 117.2 Tucker Box Hotel Group 1 4.8 7.3 12.1 423.6 2.8 7.5 10.3 146.2 1.1 147.3 278.0
162.0 13.5 170.0 895.4 2.8 7.8 10.6 305.1 1.1 306.2 748.4
2013 Australian Sustainable Forestry Investors 1&2 1 2.2 0.2 2.4 53.9 — 1.7 1.7 22.9 — 22.9 31.7 Mirvac 8 Chifley Trust 1.0 1.6 2.6 277.1 — 1.0 1.0 194.5 — 194.5 84.2 Mirvac (Old Treasury) Trust 100.8 0.3 101.1 64.7 — (0.2) (0.2) 95.7 — 95.7 70.3 Tucker Box Hotel Group 1 5.1 6.5 11.6 397.1 3.8 7.4 11.2 143.7 9.7 153.4 244.1
109.1 8.6 117.7 792.8 3.8 9.9 13.7 456.8 9.7 466.5 430.3
1) Due to AASB assessment, these investments have been reclassified from associates to joint ventures.
Reconciliation to carrying amounts Opening Closing net assets Profit/(loss) Issue of Distributions net assets Consolidated Consolidated Carrying 1 July for the year equity paid/payable 30 June entity’s share entity’s share amount 2014 $m $m $m $m $m % $m $m
Australian Sustainable Forestry Investors 1&2 1 31.7 (13.7) (12.5) — 5.5 25 1.4 1.0 Mirvac 8 Chifley Trust 84.2 12.9 250.6 — 347.7 50 173.8 173.8 Mirvac (Old Treasury) Trust 70.3 3.5 45.7 (2.4) 117.2 50 58.6 58.6 Tucker Box Hotel Group 244.1 58.7 — (24.8) 278.0 49 136.2 136.2
430.3 61.4 283.8 (27.2) 748.4 370.0 369.6
1) The investment has disposed of its assets and made a part repayment of capital to its investors. The remaining of the capital will be repaid in FY15. During the year, the consolidated entity released part of the provision previously made against this investment. As a result, the carrying amount is less than consolidated entity’s entitlement to the net asset of the investment.
Opening Closing net assets Profit for Issue of Distributions net assets Consolidated Consolidated Carrying 1 July the year equity paid/payable 30 June entity’s share entity’s share amount 2013 $m $m $m $m $m % $m $m
Australian Sustainable Forestry Investors 1&2 1 31.7 — — — 31.7 25 8.0 4.4 Mirvac 8 Chifley Trust 44.2 0.7 39.3 — 84.2 50 42.1 42.1 Mirvac (Old Treasury) Trust — 1.4 69.3 (0.4) 70.3 50 35.2 35.1 Tucker Box Hotel Group 246.4 20.0 — (22.3) 244.1 49 119.6 119.6
322.3 22.1 108.6 (22.7) 430.3 204.9 201.2
1) A provision for impairment of $3.6m was made in 2009. The carrying amount is less than consolidated entity’s entitlement to the net asset of the investment, due to the provision for impairment.
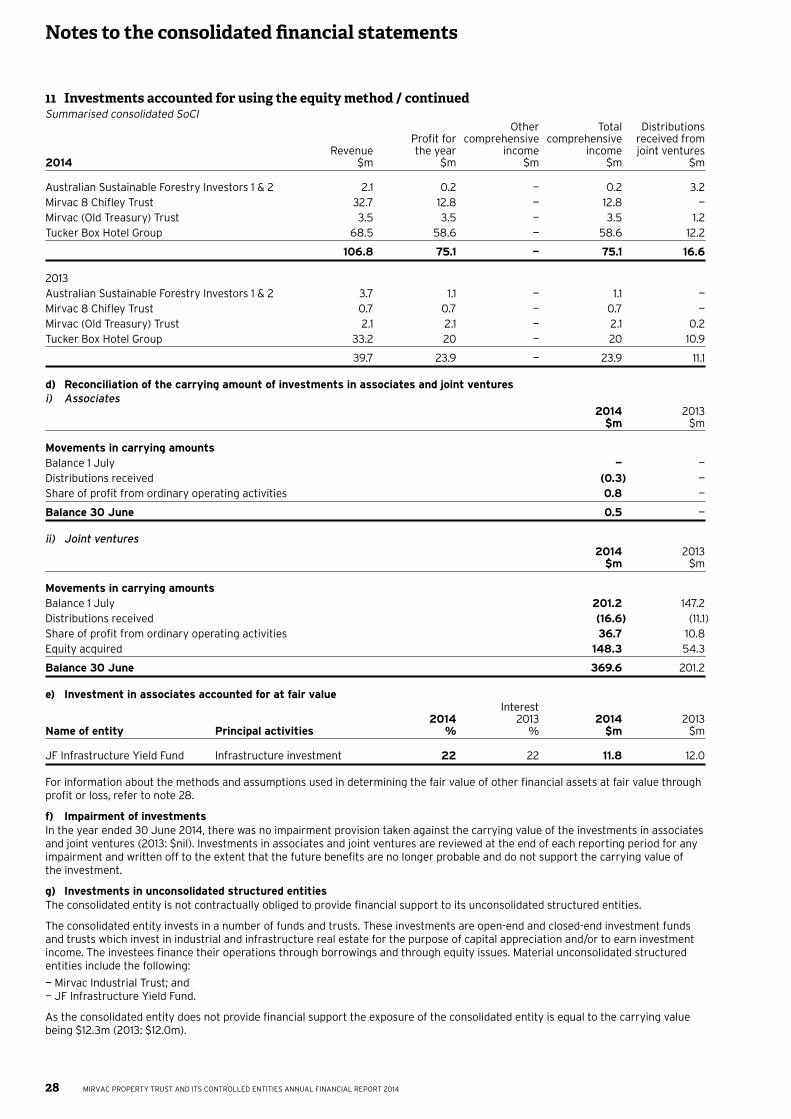
28
Notes to the consolidated financial statements
MIRVAC PROPERTY TRUST AND ITS CONTROLLED ENTITIES ANNUAL FINANCIAL REPORT 2014
11 Investments accounted for using the equity method / continuedSummarised consolidated SoCI Other Total Distributions Profit for comprehensive comprehensive received from Revenue the year income income joint ventures 2014 $m $m $m $m $m
Australian Sustainable Forestry Investors 1 & 2 2.1 0.2 — 0.2 3.2Mirvac 8 Chifley Trust 32.7 12.8 — 12.8 —Mirvac (Old Treasury) Trust 3.5 3.5 — 3.5 1.2Tucker Box Hotel Group 68.5 58.6 — 58.6 12.2
106.8 75.1 — 75.1 16.6
2013 Australian Sustainable Forestry Investors 1 & 2 3.7 1.1 — 1.1 —Mirvac 8 Chifley Trust 0.7 0.7 — 0.7 —Mirvac (Old Treasury) Trust 2.1 2.1 — 2.1 0.2Tucker Box Hotel Group 33.2 20 — 20 10.9
39.7 23.9 — 23.9 11.1
d) Reconciliation of the carrying amount of investments in associates and joint venturesi) Associates 2014 2013 $m $m
Movements in carrying amountsBalance 1 July — —Distributions received (0.3) —Share of profit from ordinary operating activities 0.8 —
Balance 30 June 0.5 —
ii) Joint ventures 2014 2013 $m $m
Movements in carrying amountsBalance 1 July 201.2 147.2Distributions received (16.6) (11.1)Share of profit from ordinary operating activities 36.7 10.8Equity acquired 148.3 54.3
Balance 30 June 369.6 201.2
e) Investment in associates accounted for at fair value Interest 2014 2013 2014 2013 Name of entity Principal activities % % $m $m
JF Infrastructure Yield Fund Infrastructure investment 22 22 11.8 12.0
For information about the methods and assumptions used in determining the fair value of other financial assets at fair value through profit or loss, refer to note 28.
f) Impairment of investmentsIn the year ended 30 June 2014, there was no impairment provision taken against the carrying value of the investments in associates and joint ventures (2013: $nil). Investments in associates and joint ventures are reviewed at the end of each reporting period for any impairment and written off to the extent that the future benefits are no longer probable and do not support the carrying value of the investment.
g) Investments in unconsolidated structured entitiesThe consolidated entity is not contractually obliged to provide financial support to its unconsolidated structured entities.
The consolidated entity invests in a number of funds and trusts. These investments are open-end and closed-end investment funds and trusts which invest in industrial and infrastructure real estate for the purpose of capital appreciation and/or to earn investment income. The investees finance their operations through borrowings and through equity issues. Material unconsolidated structured entities include the following:
— Mirvac Industrial Trust; and— JF Infrastructure Yield Fund.
As the consolidated entity does not provide financial support the exposure of the consolidated entity is equal to the carrying value being $12.3m (2013: $12.0m).
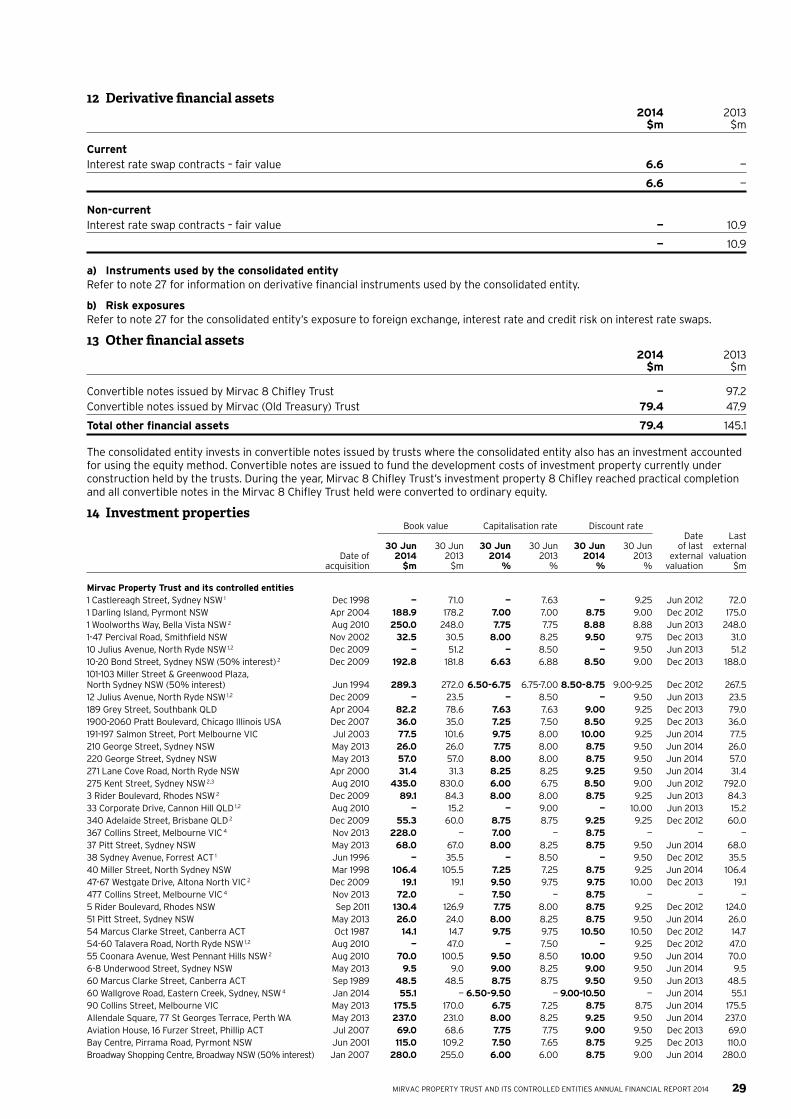
29MIRVAC PROPERTY TRUST AND ITS CONTROLLED ENTITIES ANNUAL FINANCIAL REPORT 2014
12 Derivative financial assets 2014 2013 $m $m
CurrentInterest rate swap contracts – fair value 6.6 —
6.6 —
Non-currentInterest rate swap contracts – fair value — 10.9
— 10.9
a) Instruments used by the consolidated entityRefer to note 27 for information on derivative financial instruments used by the consolidated entity.
b) Risk exposuresRefer to note 27 for the consolidated entity’s exposure to foreign exchange, interest rate and credit risk on interest rate swaps.
13 Other financial assets 2014 2013 $m $m
Convertible notes issued by Mirvac 8 Chifley Trust — 97.2Convertible notes issued by Mirvac (Old Treasury) Trust 79.4 47.9
Total other financial assets 79.4 145.1
The consolidated entity invests in convertible notes issued by trusts where the consolidated entity also has an investment accounted for using the equity method. Convertible notes are issued to fund the development costs of investment property currently under construction held by the trusts. During the year, Mirvac 8 Chifley Trust’s investment property 8 Chifley reached practical completion and all convertible notes in the Mirvac 8 Chifley Trust held were converted to ordinary equity.
14 Investment properties Book value Capitalisation rate Discount rate Date Last 30 Jun 30 Jun 30 Jun 30 Jun 30 Jun 30 Jun of last external Date of 2014 2013 2014 2013 2014 2013 external valuation acquisition $m $m % % % % valuation $m
Mirvac Property Trust and its controlled entities1 Castlereagh Street, Sydney NSW 1 Dec 1998 — 71.0 — 7.63 — 9.25 Jun 2012 72.01 Darling Island, Pyrmont NSW Apr 2004 188.9 178.2 7.00 7.00 8.75 9.00 Dec 2012 175.01 Woolworths Way, Bella Vista NSW 2 Aug 2010 250.0 248.0 7.75 7.75 8.88 8.88 Jun 2013 248.01-47 Percival Road, Smithfield NSW Nov 2002 32.5 30.5 8.00 8.25 9.50 9.75 Dec 2013 31.010 Julius Avenue, North Ryde NSW 1,2 Dec 2009 — 51.2 — 8.50 — 9.50 Jun 2013 51.210-20 Bond Street, Sydney NSW (50% interest) 2 Dec 2009 192.8 181.8 6.63 6.88 8.50 9.00 Dec 2013 188.0101-103 Miller Street & Greenwood Plaza, North Sydney NSW (50% interest) Jun 1994 289.3 272.0 6.50-6.75 6.75-7.00 8.50-8.75 9.00-9.25 Dec 2012 267.512 Julius Avenue, North Ryde NSW 1,2 Dec 2009 — 23.5 — 8.50 — 9.50 Jun 2013 23.5189 Grey Street, Southbank QLD Apr 2004 82.2 78.6 7.63 7.63 9.00 9.25 Dec 2013 79.01900-2060 Pratt Boulevard, Chicago Illinois USA Dec 2007 36.0 35.0 7.25 7.50 8.50 9.25 Dec 2013 36.0191-197 Salmon Street, Port Melbourne VIC Jul 2003 77.5 101.6 9.75 8.00 10.00 9.25 Jun 2014 77.5210 George Street, Sydney NSW May 2013 26.0 26.0 7.75 8.00 8.75 9.50 Jun 2014 26.0220 George Street, Sydney NSW May 2013 57.0 57.0 8.00 8.00 8.75 9.50 Jun 2014 57.0271 Lane Cove Road, North Ryde NSW Apr 2000 31.4 31.3 8.25 8.25 9.25 9.50 Jun 2014 31.4275 Kent Street, Sydney NSW 2,3 Aug 2010 435.0 830.0 6.00 6.75 8.50 9.00 Jun 2012 792.03 Rider Boulevard, Rhodes NSW 2 Dec 2009 89.1 84.3 8.00 8.00 8.75 9.25 Jun 2013 84.333 Corporate Drive, Cannon Hill QLD 1,2 Aug 2010 — 15.2 — 9.00 — 10.00 Jun 2013 15.2340 Adelaide Street, Brisbane QLD 2 Dec 2009 55.3 60.0 8.75 8.75 9.25 9.25 Dec 2012 60.0367 Collins Street, Melbourne VIC 4 Nov 2013 228.0 — 7.00 — 8.75 — — —37 Pitt Street, Sydney NSW May 2013 68.0 67.0 8.00 8.25 8.75 9.50 Jun 2014 68.038 Sydney Avenue, Forrest ACT 1 Jun 1996 — 35.5 — 8.50 — 9.50 Dec 2012 35.540 Miller Street, North Sydney NSW Mar 1998 106.4 105.5 7.25 7.25 8.75 9.25 Jun 2014 106.447-67 Westgate Drive, Altona North VIC 2 Dec 2009 19.1 19.1 9.50 9.75 9.75 10.00 Dec 2013 19.1477 Collins Street, Melbourne VIC 4 Nov 2013 72.0 — 7.50 — 8.75 — — —5 Rider Boulevard, Rhodes NSW Sep 2011 130.4 126.9 7.75 8.00 8.75 9.25 Dec 2012 124.051 Pitt Street, Sydney NSW May 2013 26.0 24.0 8.00 8.25 8.75 9.50 Jun 2014 26.054 Marcus Clarke Street, Canberra ACT Oct 1987 14.1 14.7 9.75 9.75 10.50 10.50 Dec 2012 14.754-60 Talavera Road, North Ryde NSW 1,2 Aug 2010 — 47.0 — 7.50 — 9.25 Dec 2012 47.055 Coonara Avenue, West Pennant Hills NSW 2 Aug 2010 70.0 100.5 9.50 8.50 10.00 9.50 Jun 2014 70.06-8 Underwood Street, Sydney NSW May 2013 9.5 9.0 9.00 8.25 9.00 9.50 Jun 2014 9.560 Marcus Clarke Street, Canberra ACT Sep 1989 48.5 48.5 8.75 8.75 9.50 9.50 Jun 2013 48.560 Wallgrove Road, Eastern Creek, Sydney, NSW 4 Jan 2014 55.1 — 6.50-9.50 — 9.00-10.50 — Jun 2014 55.190 Collins Street, Melbourne VIC May 2013 175.5 170.0 6.75 7.25 8.75 8.75 Jun 2014 175.5Allendale Square, 77 St Georges Terrace, Perth WA May 2013 237.0 231.0 8.00 8.25 9.25 9.50 Jun 2014 237.0Aviation House, 16 Furzer Street, Phillip ACT Jul 2007 69.0 68.6 7.75 7.75 9.00 9.50 Dec 2013 69.0Bay Centre, Pirrama Road, Pyrmont NSW Jun 2001 115.0 109.2 7.50 7.65 8.75 9.25 Dec 2013 110.0Broadway Shopping Centre, Broadway NSW (50% interest) Jan 2007 280.0 255.0 6.00 6.00 8.75 9.00 Jun 2014 280.0
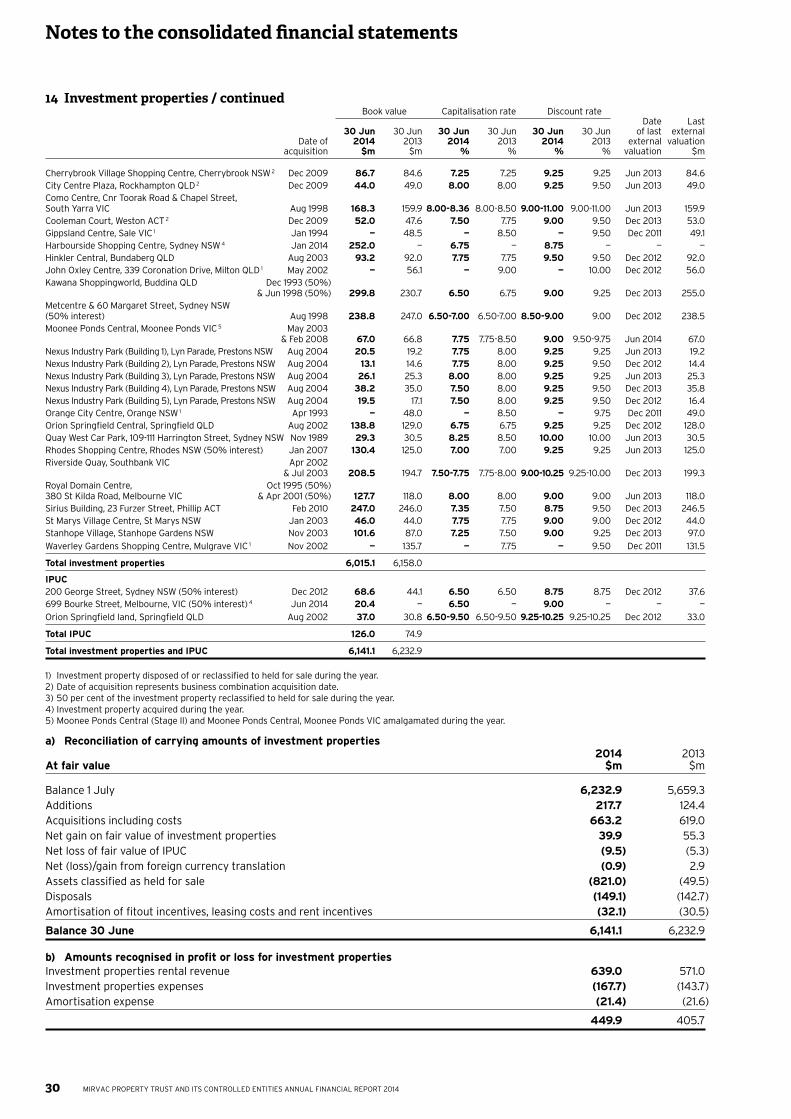
30
Notes to the consolidated financial statements
MIRVAC PROPERTY TRUST AND ITS CONTROLLED ENTITIES ANNUAL FINANCIAL REPORT 2014
14 Investment properties / continued Book value Capitalisation rate Discount rate Date Last 30 Jun 30 Jun 30 Jun 30 Jun 30 Jun 30 Jun of last external Date of 2014 2013 2014 2013 2014 2013 external valuation acquisition $m $m % % % % valuation $m
Cherrybrook Village Shopping Centre, Cherrybrook NSW 2 Dec 2009 86.7 84.6 7.25 7.25 9.25 9.25 Jun 2013 84.6City Centre Plaza, Rockhampton QLD 2 Dec 2009 44.0 49.0 8.00 8.00 9.25 9.50 Jun 2013 49.0Como Centre, Cnr Toorak Road & Chapel Street, South Yarra VIC Aug 1998 168.3 159.9 8.00-8.36 8.00-8.50 9.00-11.00 9.00-11.00 Jun 2013 159.9Cooleman Court, Weston ACT 2 Dec 2009 52.0 47.6 7.50 7.75 9.00 9.50 Dec 2013 53.0Gippsland Centre, Sale VIC 1 Jan 1994 — 48.5 — 8.50 — 9.50 Dec 2011 49.1Harbourside Shopping Centre, Sydney NSW 4 Jan 2014 252.0 — 6.75 — 8.75 — — —Hinkler Central, Bundaberg QLD Aug 2003 93.2 92.0 7.75 7.75 9.50 9.50 Dec 2012 92.0John Oxley Centre, 339 Coronation Drive, Milton QLD 1 May 2002 — 56.1 — 9.00 — 10.00 Dec 2012 56.0Kawana Shoppingworld, Buddina QLD Dec 1993 (50%) & Jun 1998 (50%) 299.8 230.7 6.50 6.75 9.00 9.25 Dec 2013 255.0Metcentre & 60 Margaret Street, Sydney NSW (50% interest) Aug 1998 238.8 247.0 6.50-7.00 6.50-7.00 8.50-9.00 9.00 Dec 2012 238.5Moonee Ponds Central, Moonee Ponds VIC 5 May 2003 & Feb 2008 67.0 66.8 7.75 7.75-8.50 9.00 9.50-9.75 Jun 2014 67.0Nexus Industry Park (Building 1), Lyn Parade, Prestons NSW Aug 2004 20.5 19.2 7.75 8.00 9.25 9.25 Jun 2013 19.2Nexus Industry Park (Building 2), Lyn Parade, Prestons NSW Aug 2004 13.1 14.6 7.75 8.00 9.25 9.50 Dec 2012 14.4Nexus Industry Park (Building 3), Lyn Parade, Prestons NSW Aug 2004 26.1 25.3 8.00 8.00 9.25 9.25 Jun 2013 25.3Nexus Industry Park (Building 4), Lyn Parade, Prestons NSW Aug 2004 38.2 35.0 7.50 8.00 9.25 9.50 Dec 2013 35.8Nexus Industry Park (Building 5), Lyn Parade, Prestons NSW Aug 2004 19.5 17.1 7.50 8.00 9.25 9.50 Dec 2012 16.4Orange City Centre, Orange NSW 1 Apr 1993 — 48.0 — 8.50 — 9.75 Dec 2011 49.0Orion Springfield Central, Springfield QLD Aug 2002 138.8 129.0 6.75 6.75 9.25 9.25 Dec 2012 128.0Quay West Car Park, 109-111 Harrington Street, Sydney NSW Nov 1989 29.3 30.5 8.25 8.50 10.00 10.00 Jun 2013 30.5Rhodes Shopping Centre, Rhodes NSW (50% interest) Jan 2007 130.4 125.0 7.00 7.00 9.25 9.25 Jun 2013 125.0Riverside Quay, Southbank VIC Apr 2002 & Jul 2003 208.5 194.7 7.50-7.75 7.75-8.00 9.00-10.25 9.25-10.00 Dec 2013 199.3Royal Domain Centre, Oct 1995 (50%) 380 St Kilda Road, Melbourne VIC & Apr 2001 (50%) 127.7 118.0 8.00 8.00 9.00 9.00 Jun 2013 118.0Sirius Building, 23 Furzer Street, Phillip ACT Feb 2010 247.0 246.0 7.35 7.50 8.75 9.50 Dec 2013 246.5St Marys Village Centre, St Marys NSW Jan 2003 46.0 44.0 7.75 7.75 9.00 9.00 Dec 2012 44.0Stanhope Village, Stanhope Gardens NSW Nov 2003 101.6 87.0 7.25 7.50 9.00 9.25 Dec 2013 97.0Waverley Gardens Shopping Centre, Mulgrave VIC 1 Nov 2002 — 135.7 — 7.75 — 9.50 Dec 2011 131.5
Total investment properties 6,015.1 6,158.0
IPUC200 George Street, Sydney NSW (50% interest) Dec 2012 68.6 44.1 6.50 6.50 8.75 8.75 Dec 2012 37.6699 Bourke Street, Melbourne, VIC (50% interest) 4 Jun 2014 20.4 — 6.50 — 9.00 — — —Orion Springfield land, Springfield QLD Aug 2002 37.0 30.8 6.50-9.50 6.50-9.50 9.25-10.25 9.25-10.25 Dec 2012 33.0
Total IPUC 126.0 74.9
Total investment properties and IPUC 6,141.1 6,232.9
1) Investment property disposed of or reclassified to held for sale during the year.2) Date of acquisition represents business combination acquisition date.3) 50 per cent of the investment property reclassified to held for sale during the year.4) Investment property acquired during the year.5) Moonee Ponds Central (Stage ll) and Moonee Ponds Central, Moonee Ponds VIC amalgamated during the year.
a) Reconciliation of carrying amounts of investment properties 2014 2013 At fair value $m $m
Balance 1 July 6,232.9 5,659.3Additions 217.7 124.4Acquisitions including costs 663.2 619.0Net gain on fair value of investment properties 39.9 55.3Net loss of fair value of IPUC (9.5) (5.3)Net (loss)/gain from foreign currency translation (0.9) 2.9Assets classified as held for sale (821.0) (49.5)Disposals (149.1) (142.7)Amortisation of fitout incentives, leasing costs and rent incentives (32.1) (30.5)
Balance 30 June 6,141.1 6,232.9
b) Amounts recognised in profit or loss for investment propertiesInvestment properties rental revenue 639.0 571.0Investment properties expenses (167.7) (143.7)Amortisation expense (21.4) (21.6)
449.9 405.7
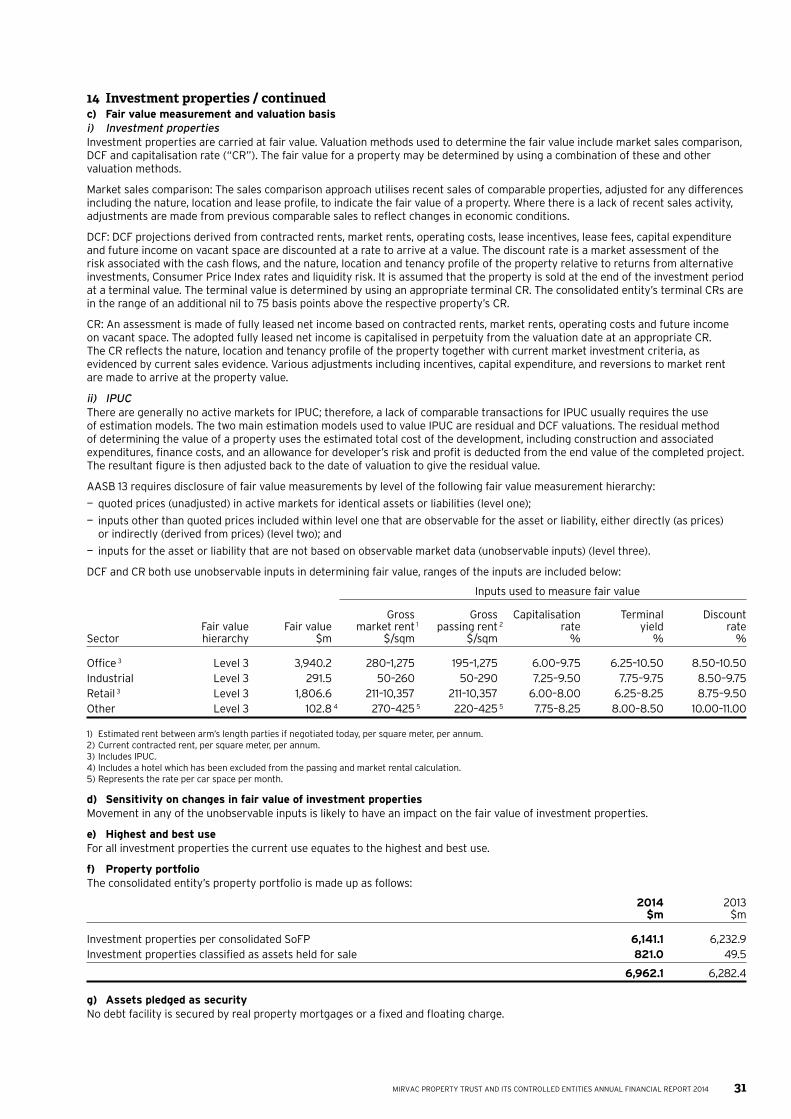
31MIRVAC PROPERTY TRUST AND ITS CONTROLLED ENTITIES ANNUAL FINANCIAL REPORT 2014
14 Investment properties / continuedc) Fair value measurement and valuation basisi) Investment propertiesInvestment properties are carried at fair value. Valuation methods used to determine the fair value include market sales comparison, DCF and capitalisation rate (“CR”). The fair value for a property may be determined by using a combination of these and other valuation methods.
Market sales comparison: The sales comparison approach utilises recent sales of comparable properties, adjusted for any differences including the nature, location and lease profile, to indicate the fair value of a property. Where there is a lack of recent sales activity, adjustments are made from previous comparable sales to reflect changes in economic conditions.
DCF: DCF projections derived from contracted rents, market rents, operating costs, lease incentives, lease fees, capital expenditure and future income on vacant space are discounted at a rate to arrive at a value. The discount rate is a market assessment of the risk associated with the cash flows, and the nature, location and tenancy profile of the property relative to returns from alternative investments, Consumer Price Index rates and liquidity risk. It is assumed that the property is sold at the end of the investment period at a terminal value. The terminal value is determined by using an appropriate terminal CR. The consolidated entity’s terminal CRs are in the range of an additional nil to 75 basis points above the respective property’s CR.
CR: An assessment is made of fully leased net income based on contracted rents, market rents, operating costs and future income on vacant space. The adopted fully leased net income is capitalised in perpetuity from the valuation date at an appropriate CR. The CR reflects the nature, location and tenancy profile of the property together with current market investment criteria, as evidenced by current sales evidence. Various adjustments including incentives, capital expenditure, and reversions to market rent are made to arrive at the property value.
ii) IPUCThere are generally no active markets for IPUC; therefore, a lack of comparable transactions for IPUC usually requires the use of estimation models. The two main estimation models used to value IPUC are residual and DCF valuations. The residual method of determining the value of a property uses the estimated total cost of the development, including construction and associated expenditures, finance costs, and an allowance for developer’s risk and profit is deducted from the end value of the completed project. The resultant figure is then adjusted back to the date of valuation to give the residual value.
AASB 13 requires disclosure of fair value measurements by level of the following fair value measurement hierarchy:
— quoted prices (unadjusted) in active markets for identical assets or liabilities (level one);
— inputs other than quoted prices included within level one that are observable for the asset or liability, either directly (as prices) or indirectly (derived from prices) (level two); and
— inputs for the asset or liability that are not based on observable market data (unobservable inputs) (level three).
DCF and CR both use unobservable inputs in determining fair value, ranges of the inputs are included below:
Inputs used to measure fair value
Gross Gross Capitalisation Terminal Discount Fair value Fair value market rent 1 passing rent 2 rate yield rate Sector hierarchy $m $/sqm $/sqm % % %
Office 3 Level 3 3,940.2 280–1,275 195–1,275 6.00–9.75 6.25–10.50 8.50–10.50Industrial Level 3 291.5 50–260 50–290 7.25–9.50 7.75–9.75 8.50–9.75Retail 3 Level 3 1,806.6 211–10,357 211–10,357 6.00–8.00 6.25–8.25 8.75–9.50Other Level 3 102.8 4 270–425 5 220–425 5 7.75–8.25 8.00–8.50 10.00–11.00
1) Estimated rent between arm’s length parties if negotiated today, per square meter, per annum.2) Current contracted rent, per square meter, per annum.3) Includes IPUC.4) Includes a hotel which has been excluded from the passing and market rental calculation. 5) Represents the rate per car space per month.
d) Sensitivity on changes in fair value of investment propertiesMovement in any of the unobservable inputs is likely to have an impact on the fair value of investment properties.
e) Highest and best useFor all investment properties the current use equates to the highest and best use.
f) Property portfolioThe consolidated entity’s property portfolio is made up as follows:
2014 2013 $m $m
Investment properties per consolidated SoFP 6,141.1 6,232.9Investment properties classified as assets held for sale 821.0 49.5
6,962.1 6,282.4
g) Assets pledged as securityNo debt facility is secured by real property mortgages or a fixed and floating charge.
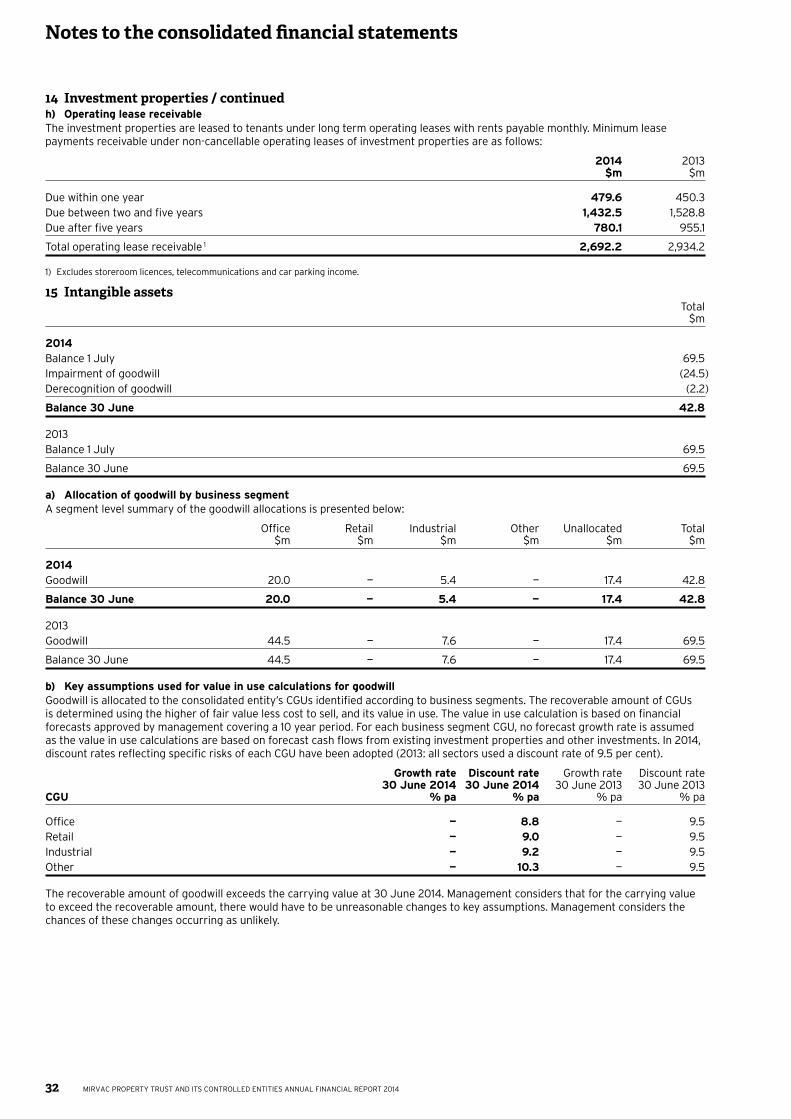
32
Notes to the consolidated financial statements
MIRVAC PROPERTY TRUST AND ITS CONTROLLED ENTITIES ANNUAL FINANCIAL REPORT 2014
14 Investment properties / continuedh) Operating lease receivableThe investment properties are leased to tenants under long term operating leases with rents payable monthly. Minimum lease payments receivable under non-cancellable operating leases of investment properties are as follows:
2014 2013 $m $m
Due within one year 479.6 450.3Due between two and five years 1,432.5 1,528.8Due after five years 780.1 955.1
Total operating lease receivable 1 2,692.2 2,934.2
1) Excludes storeroom licences, telecommunications and car parking income.
15 Intangible assets Total $m
2014Balance 1 July 69.5Impairment of goodwill (24.5)Derecognition of goodwill (2.2)
Balance 30 June 42.8
2013Balance 1 July 69.5
Balance 30 June 69.5
a) Allocation of goodwill by business segmentA segment level summary of the goodwill allocations is presented below:
Office Retail Industrial Other Unallocated Total $m $m $m $m $m $m
2014Goodwill 20.0 — 5.4 — 17.4 42.8
Balance 30 June 20.0 — 5.4 — 17.4 42.8
2013Goodwill 44.5 — 7.6 — 17.4 69.5
Balance 30 June 44.5 — 7.6 — 17.4 69.5
b) Key assumptions used for value in use calculations for goodwillGoodwill is allocated to the consolidated entity’s CGUs identified according to business segments. The recoverable amount of CGUs is determined using the higher of fair value less cost to sell, and its value in use. The value in use calculation is based on financial forecasts approved by management covering a 10 year period. For each business segment CGU, no forecast growth rate is assumed as the value in use calculations are based on forecast cash flows from existing investment properties and other investments. In 2014, discount rates reflecting specific risks of each CGU have been adopted (2013: all sectors used a discount rate of 9.5 per cent).
Growth rate Discount rate Growth rate Discount rate 30 June 2014 30 June 2014 30 June 2013 30 June 2013 CGU % pa % pa % pa % pa
Office — 8.8 — 9.5Retail — 9.0 — 9.5Industrial — 9.2 — 9.5Other — 10.3 — 9.5
The recoverable amount of goodwill exceeds the carrying value at 30 June 2014. Management considers that for the carrying value to exceed the recoverable amount, there would have to be unreasonable changes to key assumptions. Management considers the chances of these changes occurring as unlikely.
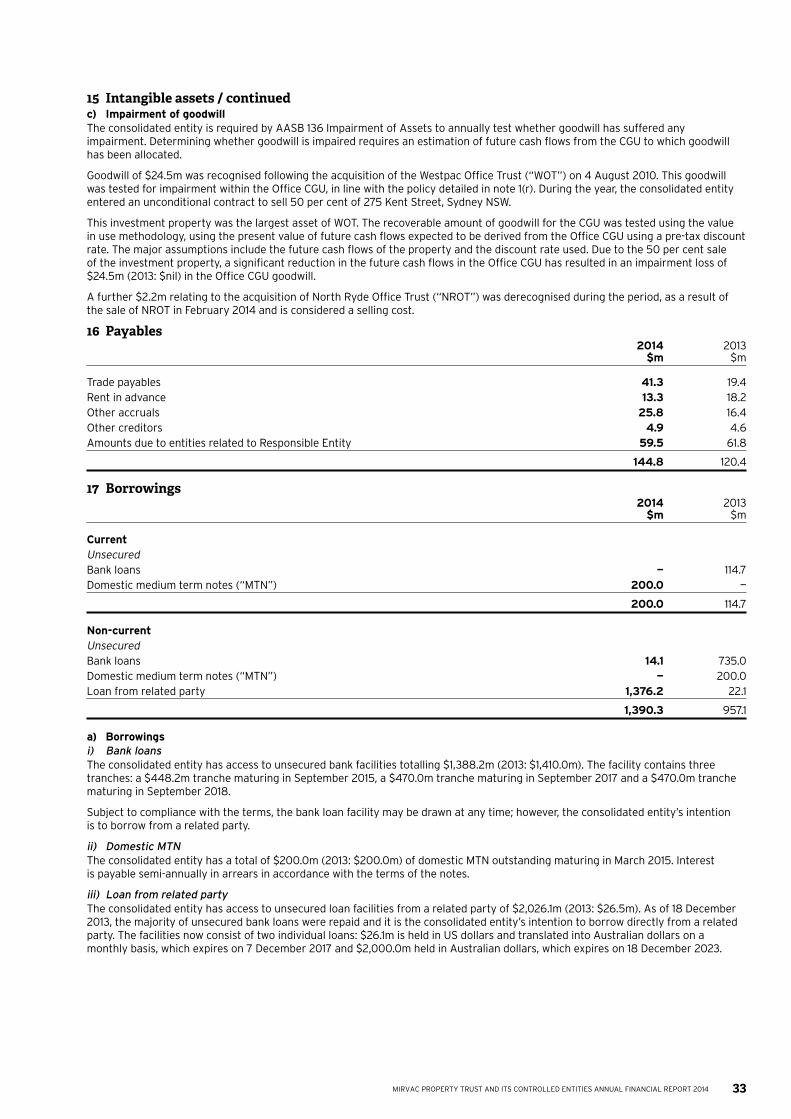
33MIRVAC PROPERTY TRUST AND ITS CONTROLLED ENTITIES ANNUAL FINANCIAL REPORT 2014
15 Intangible assets / continuedc) Impairment of goodwillThe consolidated entity is required by AASB 136 Impairment of Assets to annually test whether goodwill has suffered any impairment. Determining whether goodwill is impaired requires an estimation of future cash flows from the CGU to which goodwill has been allocated.
Goodwill of $24.5m was recognised following the acquisition of the Westpac Office Trust (“WOT”) on 4 August 2010. This goodwill was tested for impairment within the Office CGU, in line with the policy detailed in note 1(r). During the year, the consolidated entity entered an unconditional contract to sell 50 per cent of 275 Kent Street, Sydney NSW.
This investment property was the largest asset of WOT. The recoverable amount of goodwill for the CGU was tested using the value in use methodology, using the present value of future cash flows expected to be derived from the Office CGU using a pre-tax discount rate. The major assumptions include the future cash flows of the property and the discount rate used. Due to the 50 per cent sale of the investment property, a significant reduction in the future cash flows in the Office CGU has resulted in an impairment loss of $24.5m (2013: $nil) in the Office CGU goodwill.
A further $2.2m relating to the acquisition of North Ryde Office Trust (“NROT”) was derecognised during the period, as a result of the sale of NROT in February 2014 and is considered a selling cost.
16 Payables 2014 2013 $m $m
Trade payables 41.3 19.4Rent in advance 13.3 18.2Other accruals 25.8 16.4Other creditors 4.9 4.6Amounts due to entities related to Responsible Entity 59.5 61.8
144.8 120.4
17 Borrowings 2014 2013 $m $m
CurrentUnsecuredBank loans — 114.7Domestic medium term notes (“MTN”) 200.0 —
200.0 114.7
Non-currentUnsecuredBank loans 14.1 735.0Domestic medium term notes (“MTN”) — 200.0Loan from related party 1,376.2 22.1
1,390.3 957.1
a) Borrowingsi) Bank loansThe consolidated entity has access to unsecured bank facilities totalling $1,388.2m (2013: $1,410.0m). The facility contains three tranches: a $448.2m tranche maturing in September 2015, a $470.0m tranche maturing in September 2017 and a $470.0m tranche maturing in September 2018.
Subject to compliance with the terms, the bank loan facility may be drawn at any time; however, the consolidated entity’s intention is to borrow from a related party.
ii) Domestic MTNThe consolidated entity has a total of $200.0m (2013: $200.0m) of domestic MTN outstanding maturing in March 2015. Interest is payable semi-annually in arrears in accordance with the terms of the notes.
iii) Loan from related partyThe consolidated entity has access to unsecured loan facilities from a related party of $2,026.1m (2013: $26.5m). As of 18 December 2013, the majority of unsecured bank loans were repaid and it is the consolidated entity’s intention to borrow directly from a related party. The facilities now consist of two individual loans: $26.1m is held in US dollars and translated into Australian dollars on a monthly basis, which expires on 7 December 2017 and $2,000.0m held in Australian dollars, which expires on 18 December 2023.
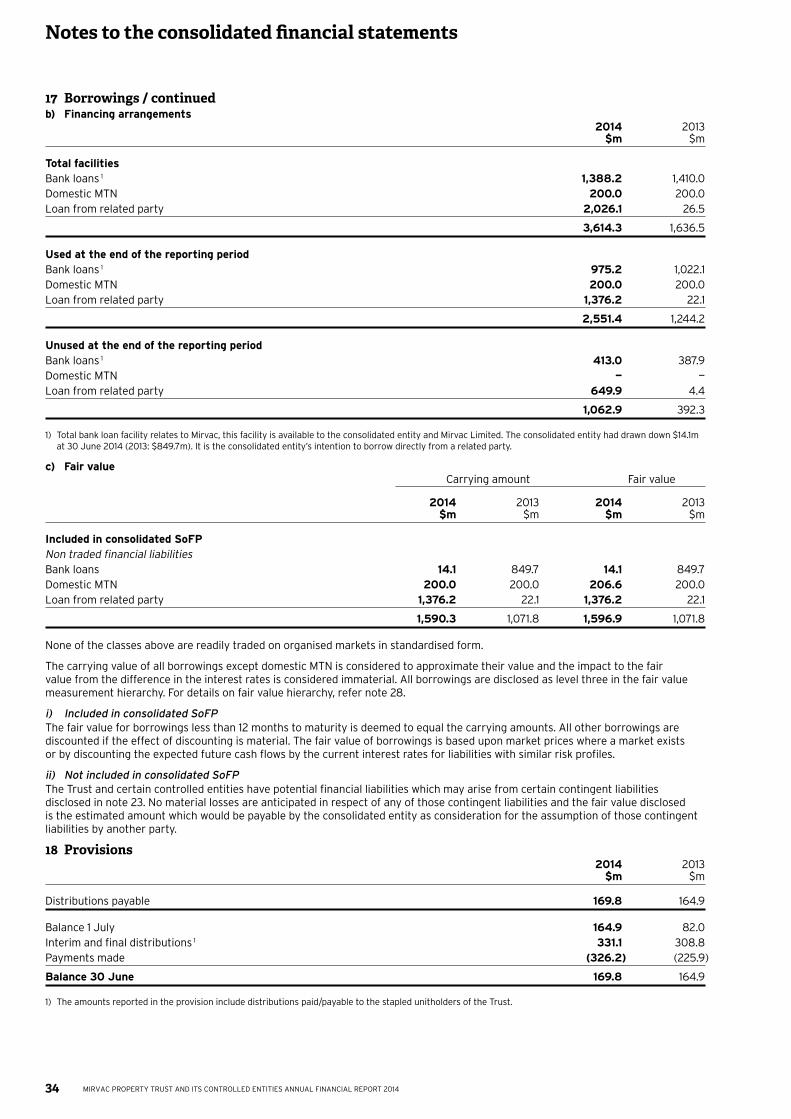
34
Notes to the consolidated financial statements
MIRVAC PROPERTY TRUST AND ITS CONTROLLED ENTITIES ANNUAL FINANCIAL REPORT 2014
17 Borrowings / continuedb) Financing arrangements 2014 2013 $m $m
Total facilitiesBank loans 1 1,388.2 1,410.0Domestic MTN 200.0 200.0Loan from related party 2,026.1 26.5
3,614.3 1,636.5
Used at the end of the reporting periodBank loans 1 975.2 1,022.1Domestic MTN 200.0 200.0Loan from related party 1,376.2 22.1
2,551.4 1,244.2
Unused at the end of the reporting periodBank loans 1 413.0 387.9Domestic MTN — —Loan from related party 649.9 4.4
1,062.9 392.3
1) Total bank loan facility relates to Mirvac, this facility is available to the consolidated entity and Mirvac Limited. The consolidated entity had drawn down $14.1m at 30 June 2014 (2013: $849.7m). It is the consolidated entity’s intention to borrow directly from a related party.
c) Fair value Carrying amount Fair value
2014 2013 2014 2013 $m $m $m $m
Included in consolidated SoFPNon traded financial liabilitiesBank loans 14.1 849.7 14.1 849.7Domestic MTN 200.0 200.0 206.6 200.0Loan from related party 1,376.2 22.1 1,376.2 22.1
1,590.3 1,071.8 1,596.9 1,071.8
None of the classes above are readily traded on organised markets in standardised form.
The carrying value of all borrowings except domestic MTN is considered to approximate their value and the impact to the fair value from the difference in the interest rates is considered immaterial. All borrowings are disclosed as level three in the fair value measurement hierarchy. For details on fair value hierarchy, refer note 28.
i) Included in consolidated SoFPThe fair value for borrowings less than 12 months to maturity is deemed to equal the carrying amounts. All other borrowings are discounted if the effect of discounting is material. The fair value of borrowings is based upon market prices where a market exists or by discounting the expected future cash flows by the current interest rates for liabilities with similar risk profiles.
ii) Not included in consolidated SoFPThe Trust and certain controlled entities have potential financial liabilities which may arise from certain contingent liabilities disclosed in note 23. No material losses are anticipated in respect of any of those contingent liabilities and the fair value disclosed is the estimated amount which would be payable by the consolidated entity as consideration for the assumption of those contingent liabilities by another party.
18 Provisions 2014 2013 $m $m
Distributions payable 169.8 164.9
Balance 1 July 164.9 82.0Interim and final distributions 1 331.1 308.8Payments made (326.2) (225.9)
Balance 30 June 169.8 164.9
1) The amounts reported in the provision include distributions paid/payable to the stapled unitholders of the Trust.
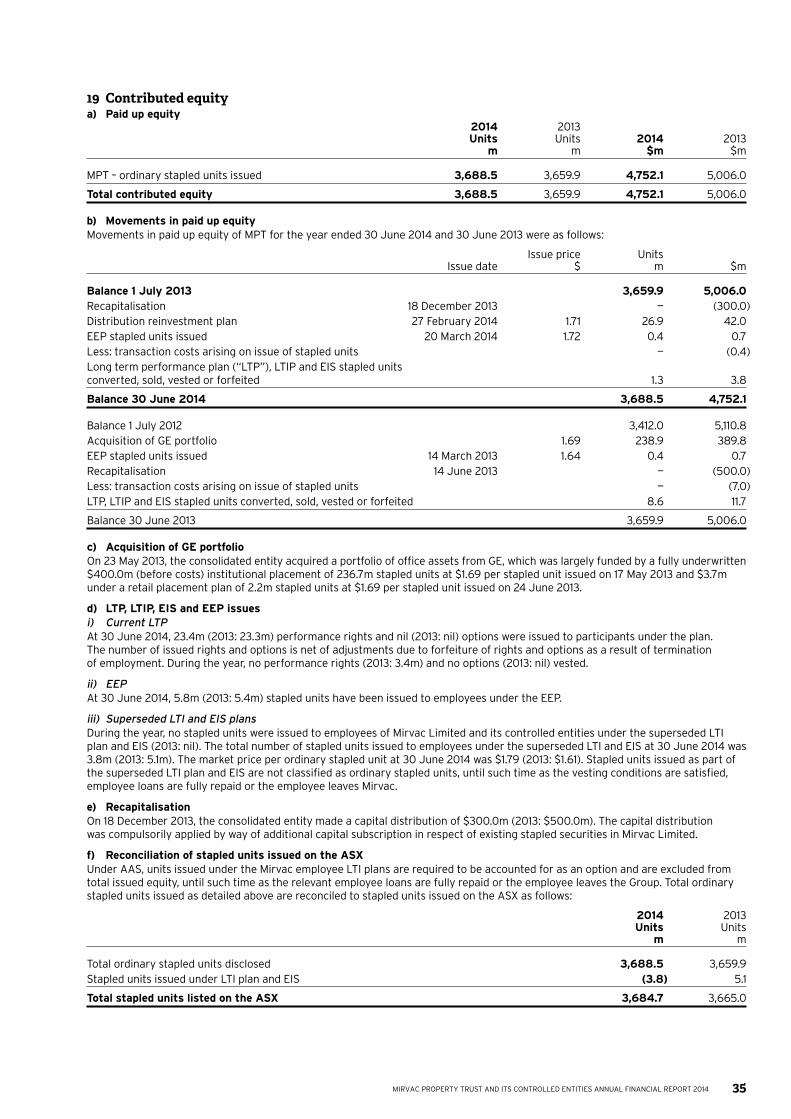
35MIRVAC PROPERTY TRUST AND ITS CONTROLLED ENTITIES ANNUAL FINANCIAL REPORT 2014
19 Contributed equitya) Paid up equity 2014 2013 Units Units 2014 2013 m m $m $m
MPT – ordinary stapled units issued 3,688.5 3,659.9 4,752.1 5,006.0
Total contributed equity 3,688.5 3,659.9 4,752.1 5,006.0
b) Movements in paid up equityMovements in paid up equity of MPT for the year ended 30 June 2014 and 30 June 2013 were as follows:
Issue price Units Issue date $ m $m
Balance 1 July 2013 3,659.9 5,006.0Recapitalisation 18 December 2013 — (300.0)Distribution reinvestment plan 27 February 2014 1.71 26.9 42.0EEP stapled units issued 20 March 2014 1.72 0.4 0.7Less: transaction costs arising on issue of stapled units — (0.4)Long term performance plan (“LTP”), LTIP and EIS stapled units converted, sold, vested or forfeited 1.3 3.8
Balance 30 June 2014 3,688.5 4,752.1
Balance 1 July 2012 3,412.0 5,110.8Acquisition of GE portfolio 1.69 238.9 389.8EEP stapled units issued 14 March 2013 1.64 0.4 0.7Recapitalisation 14 June 2013 — (500.0)Less: transaction costs arising on issue of stapled units — (7.0)LTP, LTIP and EIS stapled units converted, sold, vested or forfeited 8.6 11.7
Balance 30 June 2013 3,659.9 5,006.0
c) Acquisition of GE portfolioOn 23 May 2013, the consolidated entity acquired a portfolio of office assets from GE, which was largely funded by a fully underwritten $400.0m (before costs) institutional placement of 236.7m stapled units at $1.69 per stapled unit issued on 17 May 2013 and $3.7m under a retail placement plan of 2.2m stapled units at $1.69 per stapled unit issued on 24 June 2013.
d) LTP, LTIP, EIS and EEP issuesi) Current LTPAt 30 June 2014, 23.4m (2013: 23.3m) performance rights and nil (2013: nil) options were issued to participants under the plan. The number of issued rights and options is net of adjustments due to forfeiture of rights and options as a result of termination of employment. During the year, no performance rights (2013: 3.4m) and no options (2013: nil) vested.
ii) EEPAt 30 June 2014, 5.8m (2013: 5.4m) stapled units have been issued to employees under the EEP.
iii) Superseded LTI and EIS plansDuring the year, no stapled units were issued to employees of Mirvac Limited and its controlled entities under the superseded LTI plan and EIS (2013: nil). The total number of stapled units issued to employees under the superseded LTI and EIS at 30 June 2014 was 3.8m (2013: 5.1m). The market price per ordinary stapled unit at 30 June 2014 was $1.79 (2013: $1.61). Stapled units issued as part of the superseded LTI plan and EIS are not classified as ordinary stapled units, until such time as the vesting conditions are satisfied, employee loans are fully repaid or the employee leaves Mirvac.
e) RecapitalisationOn 18 December 2013, the consolidated entity made a capital distribution of $300.0m (2013: $500.0m). The capital distribution was compulsorily applied by way of additional capital subscription in respect of existing stapled securities in Mirvac Limited.
f) Reconciliation of stapled units issued on the ASXUnder AAS, units issued under the Mirvac employee LTI plans are required to be accounted for as an option and are excluded from total issued equity, until such time as the relevant employee loans are fully repaid or the employee leaves the Group. Total ordinary stapled units issued as detailed above are reconciled to stapled units issued on the ASX as follows:
2014 2013 Units Units m m
Total ordinary stapled units disclosed 3,688.5 3,659.9Stapled units issued under LTI plan and EIS (3.8) 5.1
Total stapled units listed on the ASX 3,684.7 3,665.0
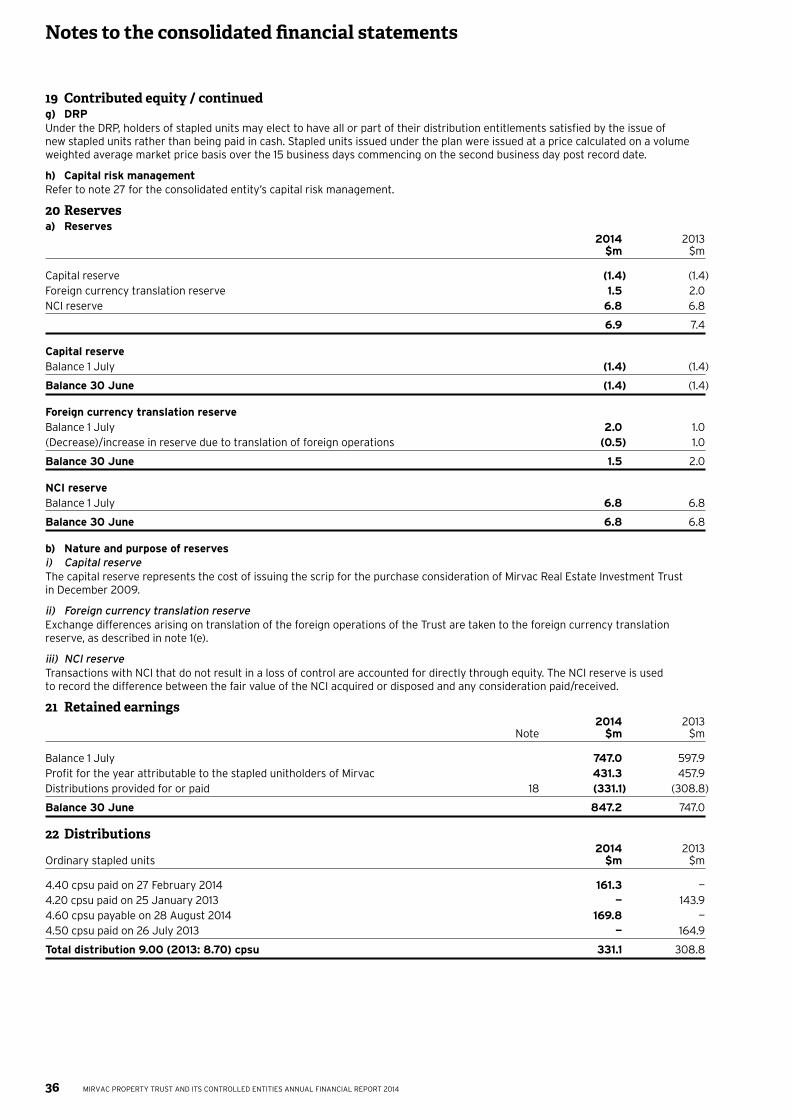
36
Notes to the consolidated financial statements
MIRVAC PROPERTY TRUST AND ITS CONTROLLED ENTITIES ANNUAL FINANCIAL REPORT 2014
19 Contributed equity / continuedg) DRPUnder the DRP, holders of stapled units may elect to have all or part of their distribution entitlements satisfied by the issue of new stapled units rather than being paid in cash. Stapled units issued under the plan were issued at a price calculated on a volume weighted average market price basis over the 15 business days commencing on the second business day post record date.
h) Capital risk managementRefer to note 27 for the consolidated entity’s capital risk management.
20 Reservesa) Reserves 2014 2013 $m $m
Capital reserve (1.4) (1.4)Foreign currency translation reserve 1.5 2.0NCI reserve 6.8 6.8
6.9 7.4
Capital reserveBalance 1 July (1.4) (1.4)
Balance 30 June (1.4) (1.4)
Foreign currency translation reserveBalance 1 July 2.0 1.0(Decrease)/increase in reserve due to translation of foreign operations (0.5) 1.0
Balance 30 June 1.5 2.0
NCI reserveBalance 1 July 6.8 6.8
Balance 30 June 6.8 6.8
b) Nature and purpose of reservesi) Capital reserveThe capital reserve represents the cost of issuing the scrip for the purchase consideration of Mirvac Real Estate Investment Trust in December 2009.
ii) Foreign currency translation reserveExchange differences arising on translation of the foreign operations of the Trust are taken to the foreign currency translation reserve, as described in note 1(e).
iii) NCI reserveTransactions with NCI that do not result in a loss of control are accounted for directly through equity. The NCI reserve is used to record the difference between the fair value of the NCI acquired or disposed and any consideration paid/received.
21 Retained earnings 2014 2013 Note $m $m
Balance 1 July 747.0 597.9Profit for the year attributable to the stapled unitholders of Mirvac 431.3 457.9Distributions provided for or paid 18 (331.1) (308.8)
Balance 30 June 847.2 747.0
22 Distributions 2014 2013 Ordinary stapled units $m $m
4.40 cpsu paid on 27 February 2014 161.3 —4.20 cpsu paid on 25 January 2013 — 143.94.60 cpsu payable on 28 August 2014 169.8 —4.50 cpsu paid on 26 July 2013 — 164.9
Total distribution 9.00 (2013: 8.70) cpsu 331.1 308.8
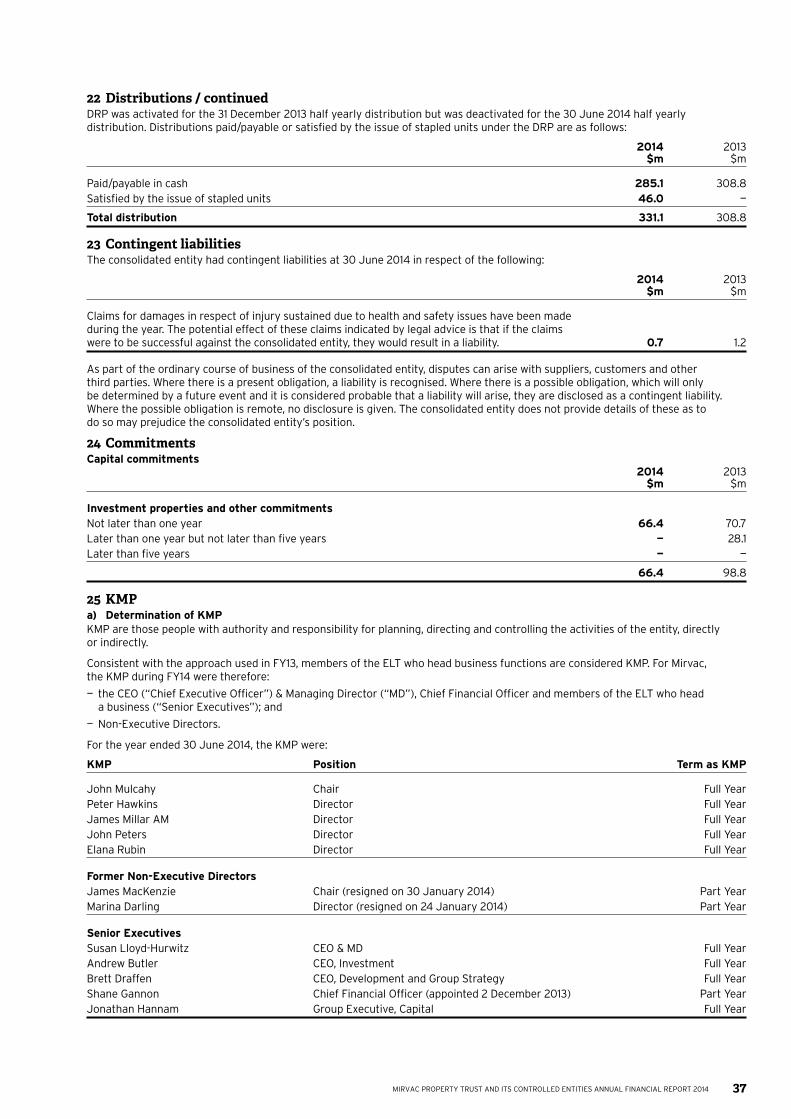
37MIRVAC PROPERTY TRUST AND ITS CONTROLLED ENTITIES ANNUAL FINANCIAL REPORT 2014
22 Distributions / continuedDRP was activated for the 31 December 2013 half yearly distribution but was deactivated for the 30 June 2014 half yearly distribution. Distributions paid/payable or satisfied by the issue of stapled units under the DRP are as follows:
2014 2013 $m $m
Paid/payable in cash 285.1 308.8Satisfied by the issue of stapled units 46.0 —
Total distribution 331.1 308.8
23 Contingent liabilitiesThe consolidated entity had contingent liabilities at 30 June 2014 in respect of the following:
2014 2013 $m $m
Claims for damages in respect of injury sustained due to health and safety issues have been made during the year. The potential effect of these claims indicated by legal advice is that if the claims were to be successful against the consolidated entity, they would result in a liability. 0.7 1.2
As part of the ordinary course of business of the consolidated entity, disputes can arise with suppliers, customers and other third parties. Where there is a present obligation, a liability is recognised. Where there is a possible obligation, which will only be determined by a future event and it is considered probable that a liability will arise, they are disclosed as a contingent liability. Where the possible obligation is remote, no disclosure is given. The consolidated entity does not provide details of these as to do so may prejudice the consolidated entity’s position.
24 CommitmentsCapital commitments 2014 2013 $m $m
Investment properties and other commitmentsNot later than one year 66.4 70.7Later than one year but not later than five years — 28.1Later than five years — —
66.4 98.8
25 KMPa) Determination of KMPKMP are those people with authority and responsibility for planning, directing and controlling the activities of the entity, directly or indirectly.
Consistent with the approach used in FY13, members of the ELT who head business functions are considered KMP. For Mirvac, the KMP during FY14 were therefore:
— the CEO (“Chief Executive Officer”) & Managing Director (“MD”), Chief Financial Officer and members of the ELT who head a business (“Senior Executives”); and
— Non-Executive Directors.
For the year ended 30 June 2014, the KMP were:
KMP Position Term as KMP
John Mulcahy Chair Full YearPeter Hawkins Director Full YearJames Millar AM Director Full YearJohn Peters Director Full YearElana Rubin Director Full Year
Former Non-Executive DirectorsJames MacKenzie Chair (resigned on 30 January 2014) Part YearMarina Darling Director (resigned on 24 January 2014) Part Year
Senior ExecutivesSusan Lloyd-Hurwitz CEO & MD Full YearAndrew Butler CEO, Investment Full YearBrett Draffen CEO, Development and Group Strategy Full YearShane Gannon Chief Financial Officer (appointed 2 December 2013) Part YearJonathan Hannam Group Executive, Capital Full Year
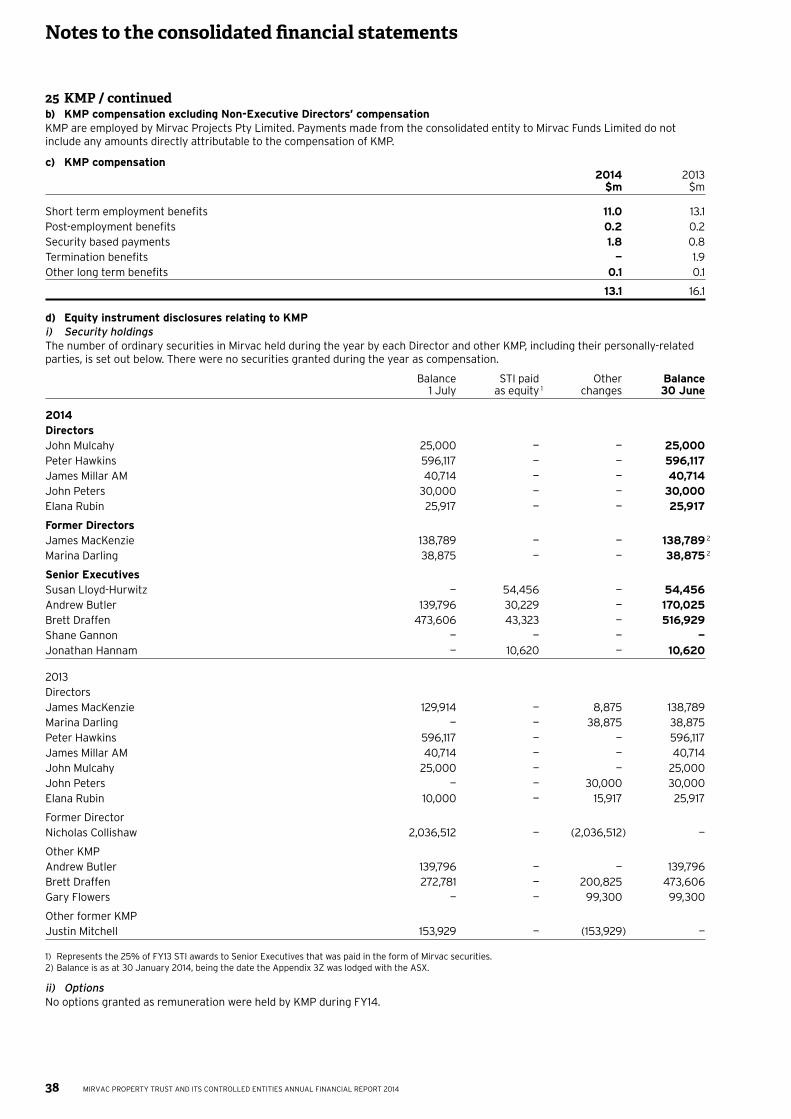
38
Notes to the consolidated financial statements
MIRVAC PROPERTY TRUST AND ITS CONTROLLED ENTITIES ANNUAL FINANCIAL REPORT 2014
25 KMP / continuedb) KMP compensation excluding Non-Executive Directors’ compensationKMP are employed by Mirvac Projects Pty Limited. Payments made from the consolidated entity to Mirvac Funds Limited do not include any amounts directly attributable to the compensation of KMP.
c) KMP compensation 2014 2013 $m $m
Short term employment benefits 11.0 13.1Post-employment benefits 0.2 0.2Security based payments 1.8 0.8Termination benefits — 1.9Other long term benefits 0.1 0.1
13.1 16.1
d) Equity instrument disclosures relating to KMPi) Security holdingsThe number of ordinary securities in Mirvac held during the year by each Director and other KMP, including their personally-related parties, is set out below. There were no securities granted during the year as compensation.
Balance STI paid Other Balance 1 July as equity 1 changes 30 June
2014DirectorsJohn Mulcahy 25,000 — — 25,000Peter Hawkins 596,117 — — 596,117James Millar AM 40,714 — — 40,714John Peters 30,000 — — 30,000Elana Rubin 25,917 — — 25,917
Former DirectorsJames MacKenzie 138,789 — — 138,789 2
Marina Darling 38,875 — — 38,875 2
Senior ExecutivesSusan Lloyd-Hurwitz — 54,456 — 54,456Andrew Butler 139,796 30,229 — 170,025Brett Draffen 473,606 43,323 — 516,929Shane Gannon — — — —Jonathan Hannam — 10,620 — 10,620
2013DirectorsJames MacKenzie 129,914 — 8,875 138,789Marina Darling — — 38,875 38,875Peter Hawkins 596,117 — — 596,117James Millar AM 40,714 — — 40,714John Mulcahy 25,000 — — 25,000John Peters — — 30,000 30,000Elana Rubin 10,000 — 15,917 25,917
Former DirectorNicholas Collishaw 2,036,512 — (2,036,512) —
Other KMPAndrew Butler 139,796 — — 139,796Brett Draffen 272,781 — 200,825 473,606Gary Flowers — — 99,300 99,300
Other former KMPJustin Mitchell 153,929 — (153,929) —
1) Represents the 25% of FY13 STI awards to Senior Executives that was paid in the form of Mirvac securities.2) Balance is as at 30 January 2014, being the date the Appendix 3Z was lodged with the ASX.
ii) OptionsNo options granted as remuneration were held by KMP during FY14.
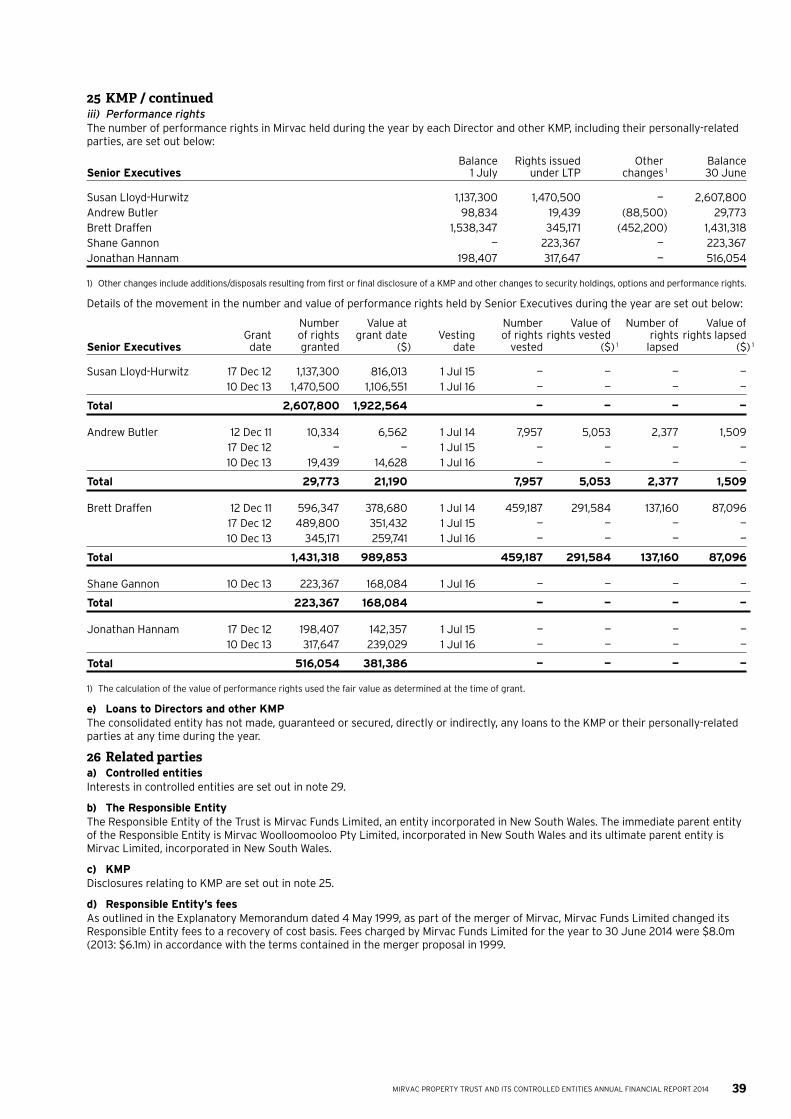
39MIRVAC PROPERTY TRUST AND ITS CONTROLLED ENTITIES ANNUAL FINANCIAL REPORT 2014
25 KMP / continuediii) Performance rightsThe number of performance rights in Mirvac held during the year by each Director and other KMP, including their personally-related parties, are set out below:
Balance Rights issued Other Balance Senior Executives 1 July under LTP changes 1 30 June
Susan Lloyd-Hurwitz 1,137,300 1,470,500 — 2,607,800Andrew Butler 98,834 19,439 (88,500) 29,773Brett Draffen 1,538,347 345,171 (452,200) 1,431,318Shane Gannon — 223,367 — 223,367Jonathan Hannam 198,407 317,647 — 516,054
1) Other changes include additions/disposals resulting from first or final disclosure of a KMP and other changes to security holdings, options and performance rights.
Details of the movement in the number and value of performance rights held by Senior Executives during the year are set out below:
Number Value at Number Value of Number of Value of Grant of rights grant date Vesting of rights rights vested rights rights lapsed Senior Executives date granted ($) date vested ($) 1 lapsed ($) 1
Susan Lloyd-Hurwitz 17 Dec 12 1,137,300 816,013 1 Jul 15 — — — — 10 Dec 13 1,470,500 1,106,551 1 Jul 16 — — — —
Total 2,607,800 1,922,564 — — — —
Andrew Butler 12 Dec 11 10,334 6,562 1 Jul 14 7,957 5,053 2,377 1,509 17 Dec 12 — — 1 Jul 15 — — — — 10 Dec 13 19,439 14,628 1 Jul 16 — — — —
Total 29,773 21,190 7,957 5,053 2,377 1,509
Brett Draffen 12 Dec 11 596,347 378,680 1 Jul 14 459,187 291,584 137,160 87,096 17 Dec 12 489,800 351,432 1 Jul 15 — — — — 10 Dec 13 345,171 259,741 1 Jul 16 — — — —
Total 1,431,318 989,853 459,187 291,584 137,160 87,096
Shane Gannon 10 Dec 13 223,367 168,084 1 Jul 16 — — — —
Total 223,367 168,084 — — — —
Jonathan Hannam 17 Dec 12 198,407 142,357 1 Jul 15 — — — — 10 Dec 13 317,647 239,029 1 Jul 16 — — — —
Total 516,054 381,386 — — — —
1) The calculation of the value of performance rights used the fair value as determined at the time of grant.
e) Loans to Directors and other KMPThe consolidated entity has not made, guaranteed or secured, directly or indirectly, any loans to the KMP or their personally-related parties at any time during the year.
26 Related partiesa) Controlled entitiesInterests in controlled entities are set out in note 29.
b) The Responsible EntityThe Responsible Entity of the Trust is Mirvac Funds Limited, an entity incorporated in New South Wales. The immediate parent entity of the Responsible Entity is Mirvac Woolloomooloo Pty Limited, incorporated in New South Wales and its ultimate parent entity is Mirvac Limited, incorporated in New South Wales.
c) KMPDisclosures relating to KMP are set out in note 25.
d) Responsible Entity’s feesAs outlined in the Explanatory Memorandum dated 4 May 1999, as part of the merger of Mirvac, Mirvac Funds Limited changed its Responsible Entity fees to a recovery of cost basis. Fees charged by Mirvac Funds Limited for the year to 30 June 2014 were $8.0m (2013: $6.1m) in accordance with the terms contained in the merger proposal in 1999.
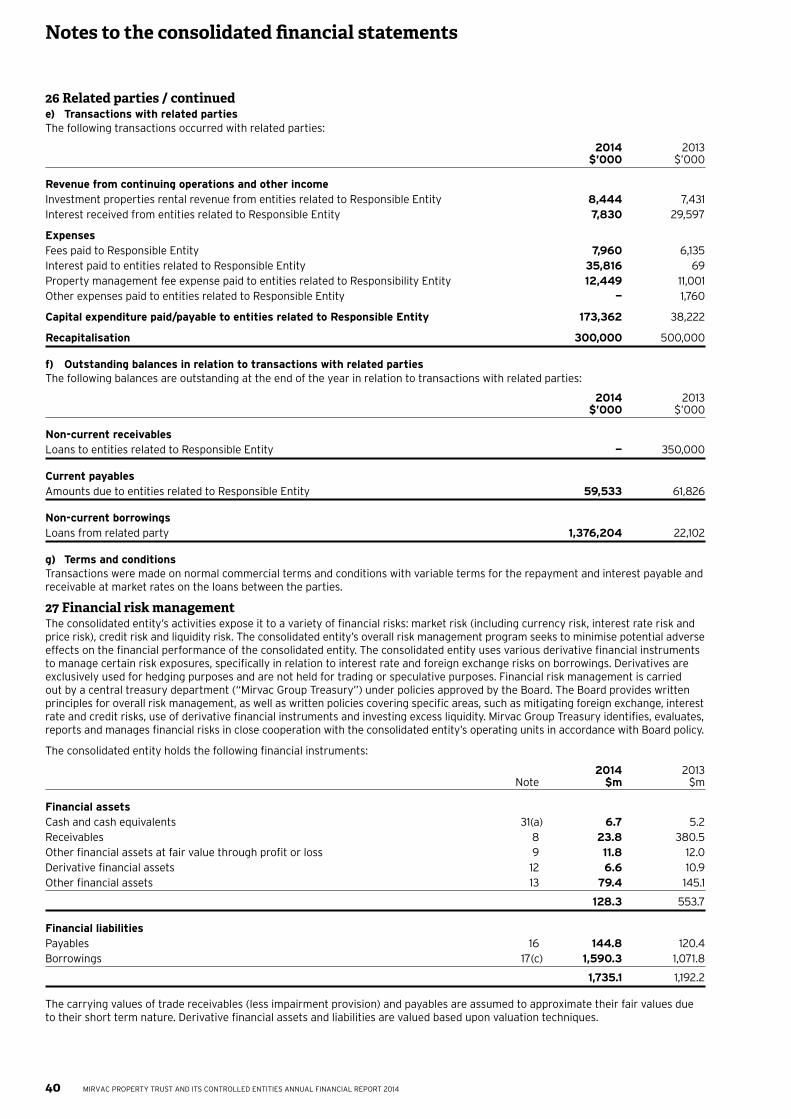
40
Notes to the consolidated financial statements
MIRVAC PROPERTY TRUST AND ITS CONTROLLED ENTITIES ANNUAL FINANCIAL REPORT 2014
26 Related parties / continuede) Transactions with related partiesThe following transactions occurred with related parties:
2014 2013 $’000 $’000
Revenue from continuing operations and other incomeInvestment properties rental revenue from entities related to Responsible Entity 8,444 7,431Interest received from entities related to Responsible Entity 7,830 29,597
ExpensesFees paid to Responsible Entity 7,960 6,135Interest paid to entities related to Responsible Entity 35,816 69Property management fee expense paid to entities related to Responsibility Entity 12,449 11,001Other expenses paid to entities related to Responsible Entity — 1,760
Capital expenditure paid/payable to entities related to Responsible Entity 173,362 38,222
Recapitalisation 300,000 500,000
f) Outstanding balances in relation to transactions with related partiesThe following balances are outstanding at the end of the year in relation to transactions with related parties:
2014 2013 $’000 $’000
Non-current receivablesLoans to entities related to Responsible Entity — 350,000
Current payablesAmounts due to entities related to Responsible Entity 59,533 61,826
Non-current borrowingsLoans from related party 1,376,204 22,102
g) Terms and conditionsTransactions were made on normal commercial terms and conditions with variable terms for the repayment and interest payable and receivable at market rates on the loans between the parties.
27 Financial risk managementThe consolidated entity’s activities expose it to a variety of financial risks: market risk (including currency risk, interest rate risk and price risk), credit risk and liquidity risk. The consolidated entity’s overall risk management program seeks to minimise potential adverse effects on the financial performance of the consolidated entity. The consolidated entity uses various derivative financial instruments to manage certain risk exposures, specifically in relation to interest rate and foreign exchange risks on borrowings. Derivatives are exclusively used for hedging purposes and are not held for trading or speculative purposes. Financial risk management is carried out by a central treasury department (“Mirvac Group Treasury”) under policies approved by the Board. The Board provides written principles for overall risk management, as well as written policies covering specific areas, such as mitigating foreign exchange, interest rate and credit risks, use of derivative financial instruments and investing excess liquidity. Mirvac Group Treasury identifies, evaluates, reports and manages financial risks in close cooperation with the consolidated entity’s operating units in accordance with Board policy.
The consolidated entity holds the following financial instruments:
2014 2013 Note $m $m
Financial assetsCash and cash equivalents 31(a) 6.7 5.2Receivables 8 23.8 380.5Other financial assets at fair value through profit or loss 9 11.8 12.0Derivative financial assets 12 6.6 10.9Other financial assets 13 79.4 145.1
128.3 553.7
Financial liabilitiesPayables 16 144.8 120.4Borrowings 17(c) 1,590.3 1,071.8
1,735.1 1,192.2
The carrying values of trade receivables (less impairment provision) and payables are assumed to approximate their fair values due to their short term nature. Derivative financial assets and liabilities are valued based upon valuation techniques.
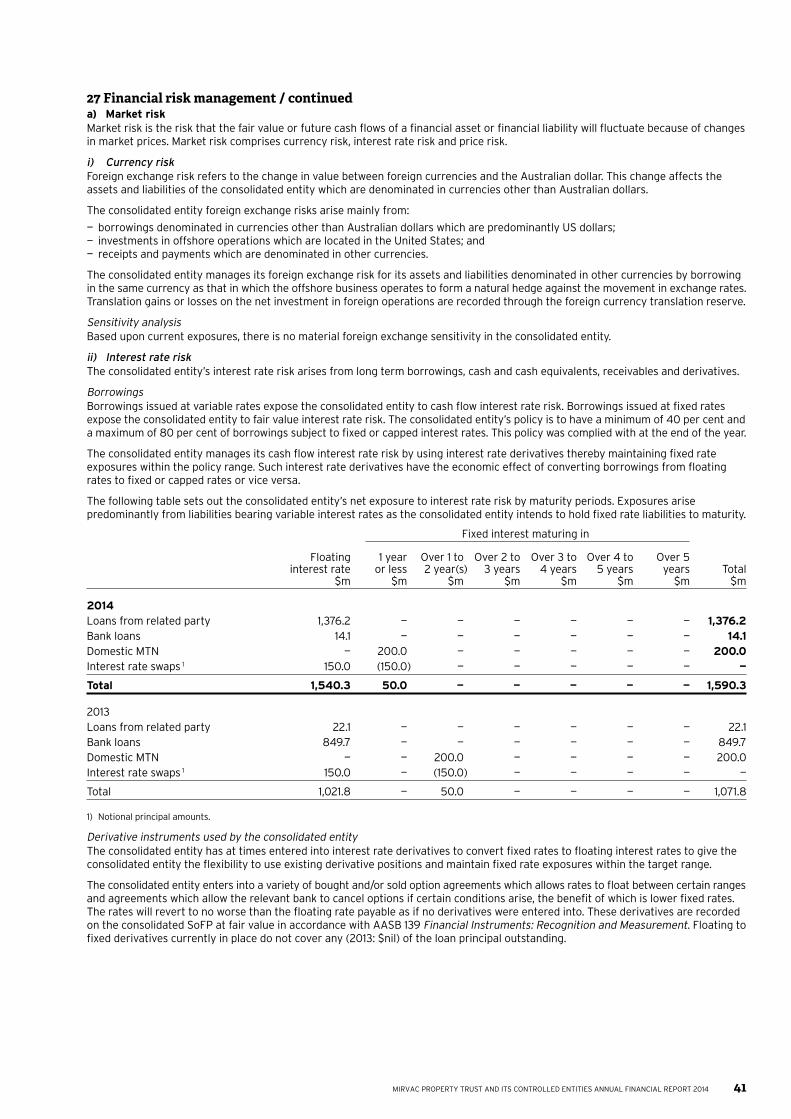
41MIRVAC PROPERTY TRUST AND ITS CONTROLLED ENTITIES ANNUAL FINANCIAL REPORT 2014
27 Financial risk management / continueda) Market riskMarket risk is the risk that the fair value or future cash flows of a financial asset or financial liability will fluctuate because of changes in market prices. Market risk comprises currency risk, interest rate risk and price risk.
i) Currency riskForeign exchange risk refers to the change in value between foreign currencies and the Australian dollar. This change affects the assets and liabilities of the consolidated entity which are denominated in currencies other than Australian dollars.
The consolidated entity foreign exchange risks arise mainly from:
— borrowings denominated in currencies other than Australian dollars which are predominantly US dollars;— investments in offshore operations which are located in the United States; and— receipts and payments which are denominated in other currencies.
The consolidated entity manages its foreign exchange risk for its assets and liabilities denominated in other currencies by borrowing in the same currency as that in which the offshore business operates to form a natural hedge against the movement in exchange rates. Translation gains or losses on the net investment in foreign operations are recorded through the foreign currency translation reserve.
Sensitivity analysisBased upon current exposures, there is no material foreign exchange sensitivity in the consolidated entity.
ii) Interest rate riskThe consolidated entity’s interest rate risk arises from long term borrowings, cash and cash equivalents, receivables and derivatives.
BorrowingsBorrowings issued at variable rates expose the consolidated entity to cash flow interest rate risk. Borrowings issued at fixed rates expose the consolidated entity to fair value interest rate risk. The consolidated entity’s policy is to have a minimum of 40 per cent and a maximum of 80 per cent of borrowings subject to fixed or capped interest rates. This policy was complied with at the end of the year.
The consolidated entity manages its cash flow interest rate risk by using interest rate derivatives thereby maintaining fixed rate exposures within the policy range. Such interest rate derivatives have the economic effect of converting borrowings from floating rates to fixed or capped rates or vice versa.
The following table sets out the consolidated entity’s net exposure to interest rate risk by maturity periods. Exposures arise predominantly from liabilities bearing variable interest rates as the consolidated entity intends to hold fixed rate liabilities to maturity.
Fixed interest maturing in
Floating 1 year Over 1 to Over 2 to Over 3 to Over 4 to Over 5 interest rate or less 2 year(s) 3 years 4 years 5 years years Total $m $m $m $m $m $m $m $m
2014Loans from related party 1,376.2 — — — — — — 1,376.2Bank loans 14.1 — — — — — — 14.1Domestic MTN — 200.0 — — — — — 200.0Interest rate swaps 1 150.0 (150.0) — — — — — —
Total 1,540.3 50.0 — — — — — 1,590.3
2013Loans from related party 22.1 — — — — — — 22.1Bank loans 849.7 — — — — — — 849.7Domestic MTN — — 200.0 — — — — 200.0Interest rate swaps 1 150.0 — (150.0) — — — — —
Total 1,021.8 — 50.0 — — — — 1,071.8
1) Notional principal amounts.
Derivative instruments used by the consolidated entityThe consolidated entity has at times entered into interest rate derivatives to convert fixed rates to floating interest rates to give the consolidated entity the flexibility to use existing derivative positions and maintain fixed rate exposures within the target range.
The consolidated entity enters into a variety of bought and/or sold option agreements which allows rates to float between certain ranges and agreements which allow the relevant bank to cancel options if certain conditions arise, the benefit of which is lower fixed rates. The rates will revert to no worse than the floating rate payable as if no derivatives were entered into. These derivatives are recorded on the consolidated SoFP at fair value in accordance with AASB 139 Financial Instruments: Recognition and Measurement. Floating to fixed derivatives currently in place do not cover any (2013: $nil) of the loan principal outstanding.
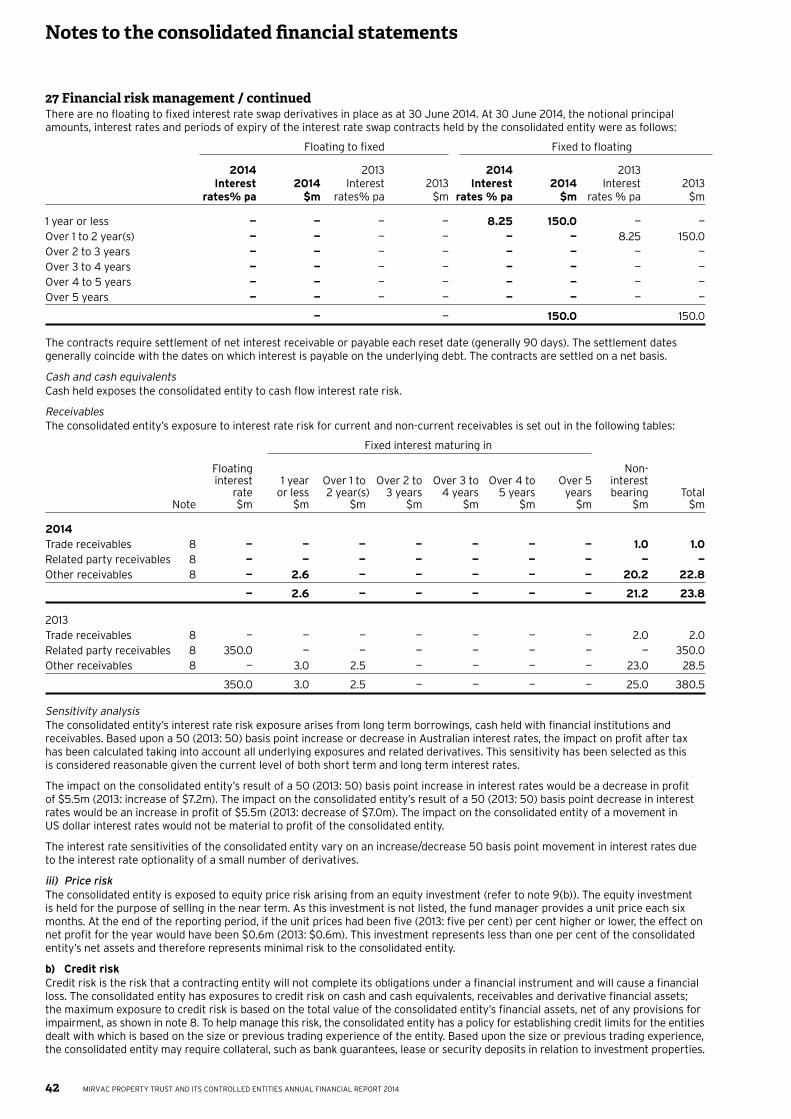
42
Notes to the consolidated financial statements
MIRVAC PROPERTY TRUST AND ITS CONTROLLED ENTITIES ANNUAL FINANCIAL REPORT 2014
27 Financial risk management / continuedThere are no floating to fixed interest rate swap derivatives in place as at 30 June 2014. At 30 June 2014, the notional principal amounts, interest rates and periods of expiry of the interest rate swap contracts held by the consolidated entity were as follows:
Floating to fixed Fixed to floating
2014 2013 2014 2013 Interest 2014 Interest 2013 Interest 2014 Interest 2013 rates% pa $m rates% pa $m rates % pa $m rates % pa $m
1 year or less — — — — 8.25 150.0 — —Over 1 to 2 year(s) — — — — — — 8.25 150.0Over 2 to 3 years — — — — — — — —Over 3 to 4 years — — — — — — — —Over 4 to 5 years — — — — — — — —Over 5 years — — — — — — — —
— — 150.0 150.0
The contracts require settlement of net interest receivable or payable each reset date (generally 90 days). The settlement dates generally coincide with the dates on which interest is payable on the underlying debt. The contracts are settled on a net basis.
Cash and cash equivalentsCash held exposes the consolidated entity to cash flow interest rate risk.
ReceivablesThe consolidated entity’s exposure to interest rate risk for current and non-current receivables is set out in the following tables:
Fixed interest maturing in
Floating Non- interest 1 year Over 1 to Over 2 to Over 3 to Over 4 to Over 5 interest rate or less 2 year(s) 3 years 4 years 5 years years bearing Total Note $m $m $m $m $m $m $m $m $m
2014Trade receivables 8 — — — — — — — 1.0 1.0Related party receivables 8 — — — — — — — — —Other receivables 8 — 2.6 — — — — — 20.2 22.8
— 2.6 — — — — — 21.2 23.8
2013Trade receivables 8 — — — — — — — 2.0 2.0Related party receivables 8 350.0 — — — — — — — 350.0Other receivables 8 — 3.0 2.5 — — — — 23.0 28.5
350.0 3.0 2.5 — — — — 25.0 380.5
Sensitivity analysisThe consolidated entity’s interest rate risk exposure arises from long term borrowings, cash held with financial institutions and receivables. Based upon a 50 (2013: 50) basis point increase or decrease in Australian interest rates, the impact on profit after tax has been calculated taking into account all underlying exposures and related derivatives. This sensitivity has been selected as this is considered reasonable given the current level of both short term and long term interest rates.
The impact on the consolidated entity’s result of a 50 (2013: 50) basis point increase in interest rates would be a decrease in profit of $5.5m (2013: increase of $7.2m). The impact on the consolidated entity’s result of a 50 (2013: 50) basis point decrease in interest rates would be an increase in profit of $5.5m (2013: decrease of $7.0m). The impact on the consolidated entity of a movement in US dollar interest rates would not be material to profit of the consolidated entity.
The interest rate sensitivities of the consolidated entity vary on an increase/decrease 50 basis point movement in interest rates due to the interest rate optionality of a small number of derivatives.
iii) Price riskThe consolidated entity is exposed to equity price risk arising from an equity investment (refer to note 9(b)). The equity investment is held for the purpose of selling in the near term. As this investment is not listed, the fund manager provides a unit price each six months. At the end of the reporting period, if the unit prices had been five (2013: five per cent) per cent higher or lower, the effect on net profit for the year would have been $0.6m (2013: $0.6m). This investment represents less than one per cent of the consolidated entity’s net assets and therefore represents minimal risk to the consolidated entity.
b) Credit riskCredit risk is the risk that a contracting entity will not complete its obligations under a financial instrument and will cause a financial loss. The consolidated entity has exposures to credit risk on cash and cash equivalents, receivables and derivative financial assets; the maximum exposure to credit risk is based on the total value of the consolidated entity’s financial assets, net of any provisions for impairment, as shown in note 8. To help manage this risk, the consolidated entity has a policy for establishing credit limits for the entities dealt with which is based on the size or previous trading experience of the entity. Based upon the size or previous trading experience, the consolidated entity may require collateral, such as bank guarantees, lease or security deposits in relation to investment properties.
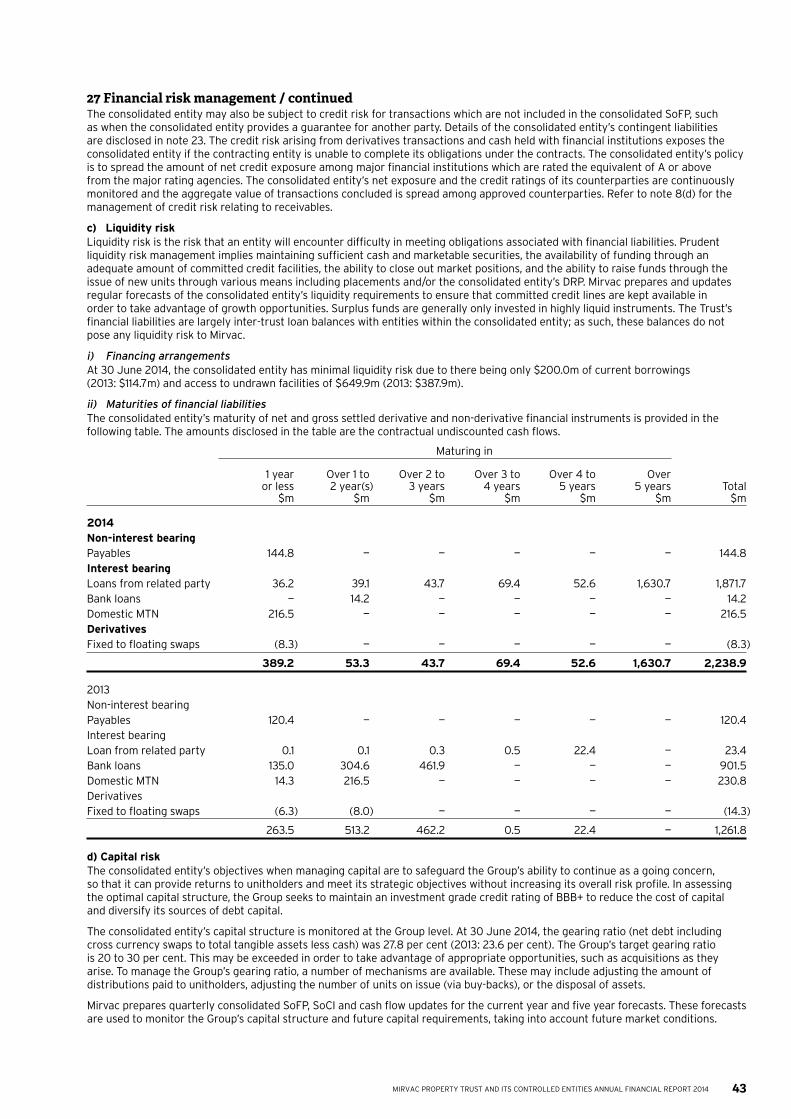
43MIRVAC PROPERTY TRUST AND ITS CONTROLLED ENTITIES ANNUAL FINANCIAL REPORT 2014
27 Financial risk management / continuedThe consolidated entity may also be subject to credit risk for transactions which are not included in the consolidated SoFP, such as when the consolidated entity provides a guarantee for another party. Details of the consolidated entity’s contingent liabilities are disclosed in note 23. The credit risk arising from derivatives transactions and cash held with financial institutions exposes the consolidated entity if the contracting entity is unable to complete its obligations under the contracts. The consolidated entity’s policy is to spread the amount of net credit exposure among major financial institutions which are rated the equivalent of A or above from the major rating agencies. The consolidated entity’s net exposure and the credit ratings of its counterparties are continuously monitored and the aggregate value of transactions concluded is spread among approved counterparties. Refer to note 8(d) for the management of credit risk relating to receivables.
c) Liquidity riskLiquidity risk is the risk that an entity will encounter difficulty in meeting obligations associated with financial liabilities. Prudent liquidity risk management implies maintaining sufficient cash and marketable securities, the availability of funding through an adequate amount of committed credit facilities, the ability to close out market positions, and the ability to raise funds through the issue of new units through various means including placements and/or the consolidated entity’s DRP. Mirvac prepares and updates regular forecasts of the consolidated entity’s liquidity requirements to ensure that committed credit lines are kept available in order to take advantage of growth opportunities. Surplus funds are generally only invested in highly liquid instruments. The Trust’s financial liabilities are largely inter-trust loan balances with entities within the consolidated entity; as such, these balances do not pose any liquidity risk to Mirvac.
i) Financing arrangementsAt 30 June 2014, the consolidated entity has minimal liquidity risk due to there being only $200.0m of current borrowings (2013: $114.7m) and access to undrawn facilities of $649.9m (2013: $387.9m).
ii) Maturities of financial liabilitiesThe consolidated entity’s maturity of net and gross settled derivative and non-derivative financial instruments is provided in the following table. The amounts disclosed in the table are the contractual undiscounted cash flows.
Maturing in
1 year Over 1 to Over 2 to Over 3 to Over 4 to Over or less 2 year(s) 3 years 4 years 5 years 5 years Total $m $m $m $m $m $m $m
2014Non-interest bearingPayables 144.8 — — — — — 144.8Interest bearingLoans from related party 36.2 39.1 43.7 69.4 52.6 1,630.7 1,871.7Bank loans — 14.2 — — — — 14.2Domestic MTN 216.5 — — — — — 216.5DerivativesFixed to floating swaps (8.3) — — — — — (8.3)
389.2 53.3 43.7 69.4 52.6 1,630.7 2,238.9
2013Non-interest bearingPayables 120.4 — — — — — 120.4Interest bearingLoan from related party 0.1 0.1 0.3 0.5 22.4 — 23.4Bank loans 135.0 304.6 461.9 — — — 901.5Domestic MTN 14.3 216.5 — — — — 230.8DerivativesFixed to floating swaps (6.3) (8.0) — — — — (14.3)
263.5 513.2 462.2 0.5 22.4 — 1,261.8
d) Capital riskThe consolidated entity’s objectives when managing capital are to safeguard the Group’s ability to continue as a going concern, so that it can provide returns to unitholders and meet its strategic objectives without increasing its overall risk profile. In assessing the optimal capital structure, the Group seeks to maintain an investment grade credit rating of BBB+ to reduce the cost of capital and diversify its sources of debt capital.
The consolidated entity’s capital structure is monitored at the Group level. At 30 June 2014, the gearing ratio (net debt including cross currency swaps to total tangible assets less cash) was 27.8 per cent (2013: 23.6 per cent). The Group’s target gearing ratio is 20 to 30 per cent. This may be exceeded in order to take advantage of appropriate opportunities, such as acquisitions as they arise. To manage the Group’s gearing ratio, a number of mechanisms are available. These may include adjusting the amount of distributions paid to unitholders, adjusting the number of units on issue (via buy-backs), or the disposal of assets.
Mirvac prepares quarterly consolidated SoFP, SoCI and cash flow updates for the current year and five year forecasts. These forecasts are used to monitor the Group’s capital structure and future capital requirements, taking into account future market conditions.
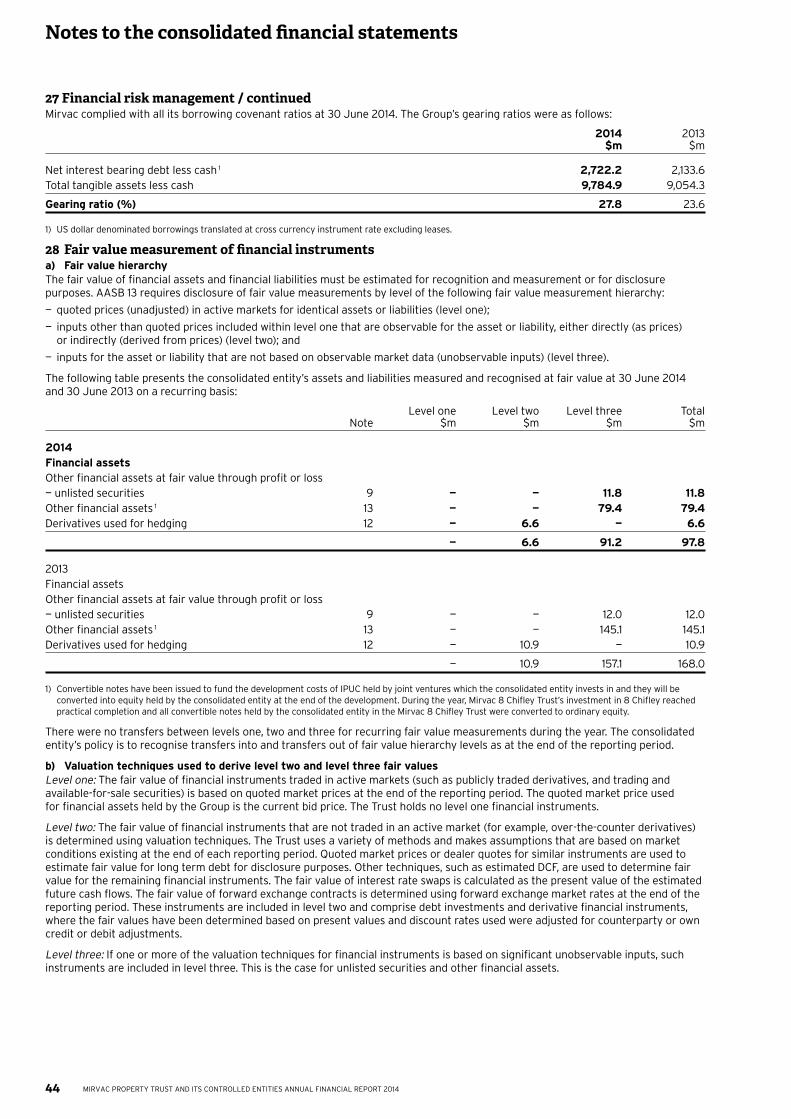
44
Notes to the consolidated financial statements
MIRVAC PROPERTY TRUST AND ITS CONTROLLED ENTITIES ANNUAL FINANCIAL REPORT 2014
27 Financial risk management / continuedMirvac complied with all its borrowing covenant ratios at 30 June 2014. The Group’s gearing ratios were as follows:
2014 2013 $m $m
Net interest bearing debt less cash 1 2,722.2 2,133.6Total tangible assets less cash 9,784.9 9,054.3
Gearing ratio (%) 27.8 23.6
1) US dollar denominated borrowings translated at cross currency instrument rate excluding leases.
28 Fair value measurement of financial instrumentsa) Fair value hierarchyThe fair value of financial assets and financial liabilities must be estimated for recognition and measurement or for disclosure purposes. AASB 13 requires disclosure of fair value measurements by level of the following fair value measurement hierarchy:
— quoted prices (unadjusted) in active markets for identical assets or liabilities (level one);
— inputs other than quoted prices included within level one that are observable for the asset or liability, either directly (as prices) or indirectly (derived from prices) (level two); and
— inputs for the asset or liability that are not based on observable market data (unobservable inputs) (level three).
The following table presents the consolidated entity’s assets and liabilities measured and recognised at fair value at 30 June 2014 and 30 June 2013 on a recurring basis:
Level one Level two Level three Total Note $m $m $m $m
2014Financial assetsOther financial assets at fair value through profit or loss— unlisted securities 9 — — 11.8 11.8Other financial assets 1 13 — — 79.4 79.4Derivatives used for hedging 12 — 6.6 — 6.6
— 6.6 91.2 97.8
2013Financial assetsOther financial assets at fair value through profit or loss— unlisted securities 9 — — 12.0 12.0Other financial assets 1 13 — — 145.1 145.1Derivatives used for hedging 12 — 10.9 — 10.9
— 10.9 157.1 168.0
1) Convertible notes have been issued to fund the development costs of IPUC held by joint ventures which the consolidated entity invests in and they will be converted into equity held by the consolidated entity at the end of the development. During the year, Mirvac 8 Chifley Trust’s investment in 8 Chifley reached practical completion and all convertible notes held by the consolidated entity in the Mirvac 8 Chifley Trust were converted to ordinary equity.
There were no transfers between levels one, two and three for recurring fair value measurements during the year. The consolidated entity’s policy is to recognise transfers into and transfers out of fair value hierarchy levels as at the end of the reporting period.
b) Valuation techniques used to derive level two and level three fair valuesLevel one: The fair value of financial instruments traded in active markets (such as publicly traded derivatives, and trading and available-for-sale securities) is based on quoted market prices at the end of the reporting period. The quoted market price used for financial assets held by the Group is the current bid price. The Trust holds no level one financial instruments.
Level two: The fair value of financial instruments that are not traded in an active market (for example, over-the-counter derivatives) is determined using valuation techniques. The Trust uses a variety of methods and makes assumptions that are based on market conditions existing at the end of each reporting period. Quoted market prices or dealer quotes for similar instruments are used to estimate fair value for long term debt for disclosure purposes. Other techniques, such as estimated DCF, are used to determine fair value for the remaining financial instruments. The fair value of interest rate swaps is calculated as the present value of the estimated future cash flows. The fair value of forward exchange contracts is determined using forward exchange market rates at the end of the reporting period. These instruments are included in level two and comprise debt investments and derivative financial instruments, where the fair values have been determined based on present values and discount rates used were adjusted for counterparty or own credit or debit adjustments.
Level three: If one or more of the valuation techniques for financial instruments is based on significant unobservable inputs, such instruments are included in level three. This is the case for unlisted securities and other financial assets.
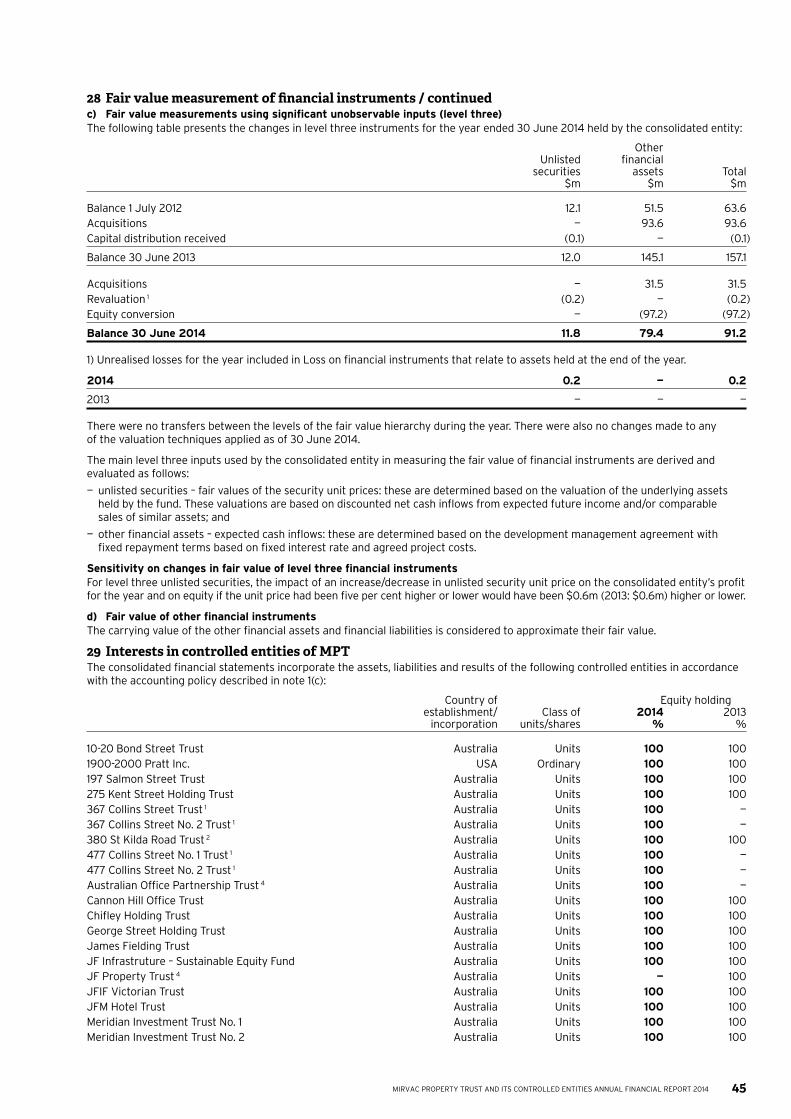
45MIRVAC PROPERTY TRUST AND ITS CONTROLLED ENTITIES ANNUAL FINANCIAL REPORT 2014
28 Fair value measurement of financial instruments / continuedc) Fair value measurements using significant unobservable inputs (level three)The following table presents the changes in level three instruments for the year ended 30 June 2014 held by the consolidated entity:
Other Unlisted financial securities assets Total $m $m $m
Balance 1 July 2012 12.1 51.5 63.6Acquisitions — 93.6 93.6Capital distribution received (0.1) — (0.1)
Balance 30 June 2013 12.0 145.1 157.1
Acquisitions — 31.5 31.5Revaluation 1 (0.2) — (0.2)Equity conversion — (97.2) (97.2)
Balance 30 June 2014 11.8 79.4 91.2
1) Unrealised losses for the year included in Loss on financial instruments that relate to assets held at the end of the year.
2014 0.2 — 0.2
2013 — — —
There were no transfers between the levels of the fair value hierarchy during the year. There were also no changes made to any of the valuation techniques applied as of 30 June 2014.
The main level three inputs used by the consolidated entity in measuring the fair value of financial instruments are derived and evaluated as follows:
— unlisted securities – fair values of the security unit prices: these are determined based on the valuation of the underlying assets held by the fund. These valuations are based on discounted net cash inflows from expected future income and/or comparable sales of similar assets; and
— other financial assets – expected cash inflows: these are determined based on the development management agreement with fixed repayment terms based on fixed interest rate and agreed project costs.
Sensitivity on changes in fair value of level three financial instrumentsFor level three unlisted securities, the impact of an increase/decrease in unlisted security unit price on the consolidated entity’s profit for the year and on equity if the unit price had been five per cent higher or lower would have been $0.6m (2013: $0.6m) higher or lower.
d) Fair value of other financial instrumentsThe carrying value of the other financial assets and financial liabilities is considered to approximate their fair value.
29 Interests in controlled entities of MPTThe consolidated financial statements incorporate the assets, liabilities and results of the following controlled entities in accordance with the accounting policy described in note 1(c):
Country of Equity holding establishment/ Class of 2014 2013 incorporation units/shares % %
10-20 Bond Street Trust Australia Units 100 1001900-2000 Pratt Inc. USA Ordinary 100 100197 Salmon Street Trust Australia Units 100 100275 Kent Street Holding Trust Australia Units 100 100367 Collins Street Trust 1 Australia Units 100 —367 Collins Street No. 2 Trust 1 Australia Units 100 —380 St Kilda Road Trust 2 Australia Units 100 100477 Collins Street No. 1 Trust 1 Australia Units 100 —477 Collins Street No. 2 Trust 1 Australia Units 100 —Australian Office Partnership Trust 4 Australia Units 100 —Cannon Hill Office Trust Australia Units 100 100Chifley Holding Trust Australia Units 100 100George Street Holding Trust Australia Units 100 100James Fielding Trust Australia Units 100 100JF Infrastruture – Sustainable Equity Fund Australia Units 100 100JF Property Trust 4 Australia Units — 100JFIF Victorian Trust Australia Units 100 100JFM Hotel Trust Australia Units 100 100Meridian Investment Trust No. 1 Australia Units 100 100Meridian Investment Trust No. 2 Australia Units 100 100
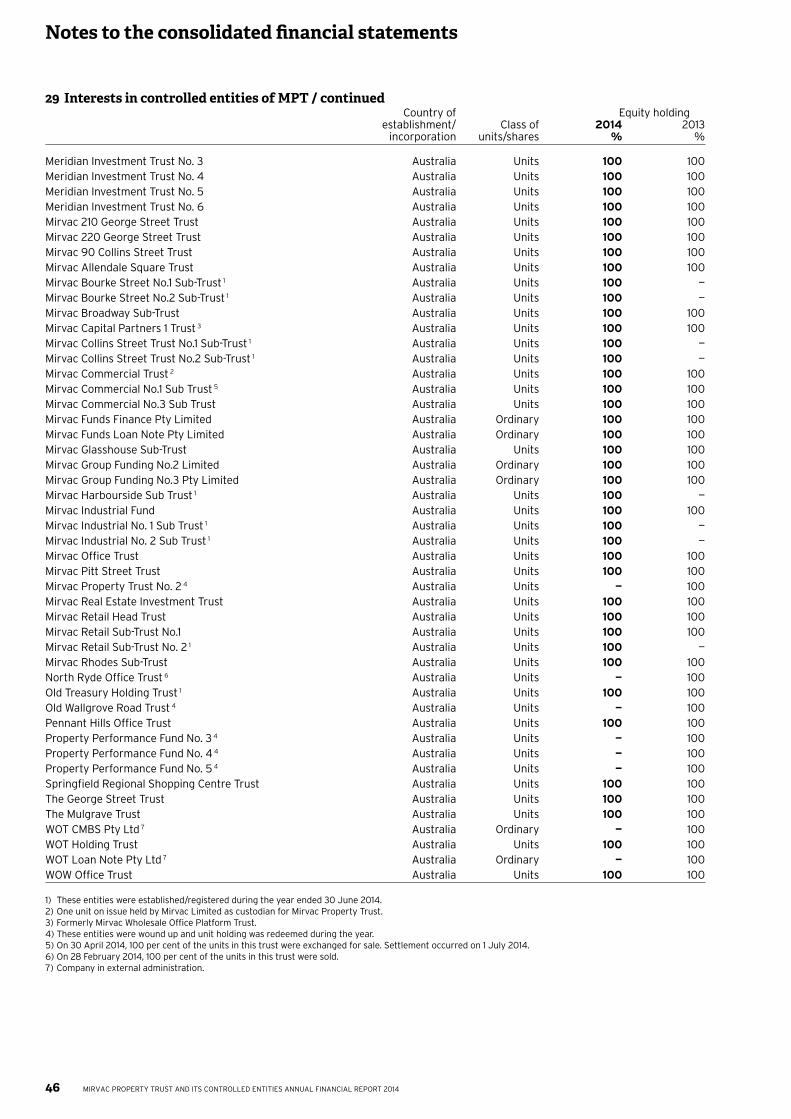
46
Notes to the consolidated financial statements
MIRVAC PROPERTY TRUST AND ITS CONTROLLED ENTITIES ANNUAL FINANCIAL REPORT 2014
29 Interests in controlled entities of MPT / continued Country of Equity holding establishment/ Class of 2014 2013 incorporation units/shares % %
Meridian Investment Trust No. 3 Australia Units 100 100Meridian Investment Trust No. 4 Australia Units 100 100Meridian Investment Trust No. 5 Australia Units 100 100Meridian Investment Trust No. 6 Australia Units 100 100Mirvac 210 George Street Trust Australia Units 100 100Mirvac 220 George Street Trust Australia Units 100 100Mirvac 90 Collins Street Trust Australia Units 100 100Mirvac Allendale Square Trust Australia Units 100 100Mirvac Bourke Street No.1 Sub-Trust 1 Australia Units 100 —Mirvac Bourke Street No.2 Sub-Trust 1 Australia Units 100 —Mirvac Broadway Sub-Trust Australia Units 100 100Mirvac Capital Partners 1 Trust 3 Australia Units 100 100Mirvac Collins Street Trust No.1 Sub-Trust 1 Australia Units 100 —Mirvac Collins Street Trust No.2 Sub-Trust 1 Australia Units 100 —Mirvac Commercial Trust 2 Australia Units 100 100Mirvac Commercial No.1 Sub Trust 5 Australia Units 100 100Mirvac Commercial No.3 Sub Trust Australia Units 100 100Mirvac Funds Finance Pty Limited Australia Ordinary 100 100Mirvac Funds Loan Note Pty Limited Australia Ordinary 100 100Mirvac Glasshouse Sub-Trust Australia Units 100 100Mirvac Group Funding No.2 Limited Australia Ordinary 100 100Mirvac Group Funding No.3 Pty Limited Australia Ordinary 100 100Mirvac Harbourside Sub Trust 1 Australia Units 100 —Mirvac Industrial Fund Australia Units 100 100Mirvac Industrial No. 1 Sub Trust 1 Australia Units 100 —Mirvac Industrial No. 2 Sub Trust 1 Australia Units 100 —Mirvac Office Trust Australia Units 100 100Mirvac Pitt Street Trust Australia Units 100 100Mirvac Property Trust No. 2 4 Australia Units — 100Mirvac Real Estate Investment Trust Australia Units 100 100Mirvac Retail Head Trust Australia Units 100 100Mirvac Retail Sub-Trust No.1 Australia Units 100 100Mirvac Retail Sub-Trust No. 2 1 Australia Units 100 —Mirvac Rhodes Sub-Trust Australia Units 100 100North Ryde Office Trust 6 Australia Units — 100Old Treasury Holding Trust 1 Australia Units 100 100Old Wallgrove Road Trust 4 Australia Units — 100Pennant Hills Office Trust Australia Units 100 100Property Performance Fund No. 3 4 Australia Units — 100Property Performance Fund No. 4 4 Australia Units — 100Property Performance Fund No. 5 4 Australia Units — 100Springfield Regional Shopping Centre Trust Australia Units 100 100The George Street Trust Australia Units 100 100The Mulgrave Trust Australia Units 100 100WOT CMBS Pty Ltd 7 Australia Ordinary — 100WOT Holding Trust Australia Units 100 100WOT Loan Note Pty Ltd 7 Australia Ordinary — 100WOW Office Trust Australia Units 100 100
1) These entities were established/registered during the year ended 30 June 2014.2) One unit on issue held by Mirvac Limited as custodian for Mirvac Property Trust.3) Formerly Mirvac Wholesale Office Platform Trust.4) These entities were wound up and unit holding was redeemed during the year.5) On 30 April 2014, 100 per cent of the units in this trust were exchanged for sale. Settlement occurred on 1 July 2014.6) On 28 February 2014, 100 per cent of the units in this trust were sold.7) Company in external administration.
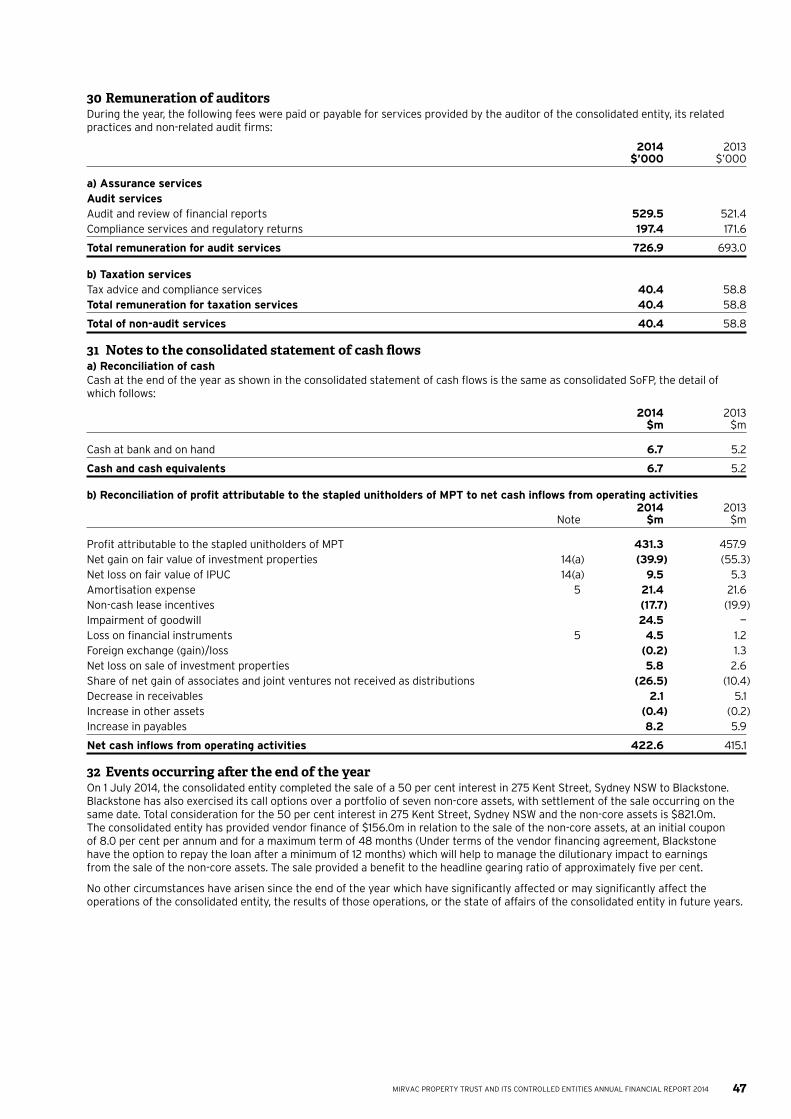
47MIRVAC PROPERTY TRUST AND ITS CONTROLLED ENTITIES ANNUAL FINANCIAL REPORT 2014
30 Remuneration of auditorsDuring the year, the following fees were paid or payable for services provided by the auditor of the consolidated entity, its related practices and non-related audit firms:
2014 2013 $’000 $’000
a) Assurance servicesAudit servicesAudit and review of financial reports 529.5 521.4Compliance services and regulatory returns 197.4 171.6
Total remuneration for audit services 726.9 693.0
b) Taxation servicesTax advice and compliance services 40.4 58.8Total remuneration for taxation services 40.4 58.8
Total of non-audit services 40.4 58.8
31 Notes to the consolidated statement of cash flowsa) Reconciliation of cashCash at the end of the year as shown in the consolidated statement of cash flows is the same as consolidated SoFP, the detail of which follows:
2014 2013 $m $m
Cash at bank and on hand 6.7 5.2
Cash and cash equivalents 6.7 5.2
b) Reconciliation of profit attributable to the stapled unitholders of MPT to net cash inflows from operating activities 2014 2013 Note $m $m
Profit attributable to the stapled unitholders of MPT 431.3 457.9Net gain on fair value of investment properties 14(a) (39.9) (55.3)Net loss on fair value of IPUC 14(a) 9.5 5.3Amortisation expense 5 21.4 21.6Non-cash lease incentives (17.7) (19.9)Impairment of goodwill 24.5 —Loss on financial instruments 5 4.5 1.2Foreign exchange (gain)/loss (0.2) 1.3Net loss on sale of investment properties 5.8 2.6Share of net gain of associates and joint ventures not received as distributions (26.5) (10.4)Decrease in receivables 2.1 5.1Increase in other assets (0.4) (0.2)Increase in payables 8.2 5.9
Net cash inflows from operating activities 422.6 415.1
32 Events occurring after the end of the yearOn 1 July 2014, the consolidated entity completed the sale of a 50 per cent interest in 275 Kent Street, Sydney NSW to Blackstone. Blackstone has also exercised its call options over a portfolio of seven non-core assets, with settlement of the sale occurring on the same date. Total consideration for the 50 per cent interest in 275 Kent Street, Sydney NSW and the non-core assets is $821.0m. The consolidated entity has provided vendor finance of $156.0m in relation to the sale of the non-core assets, at an initial coupon of 8.0 per cent per annum and for a maximum term of 48 months (Under terms of the vendor financing agreement, Blackstone have the option to repay the loan after a minimum of 12 months) which will help to manage the dilutionary impact to earnings from the sale of the non-core assets. The sale provided a benefit to the headline gearing ratio of approximately five per cent.
No other circumstances have arisen since the end of the year which have significantly affected or may significantly affect the operations of the consolidated entity, the results of those operations, or the state of affairs of the consolidated entity in future years.
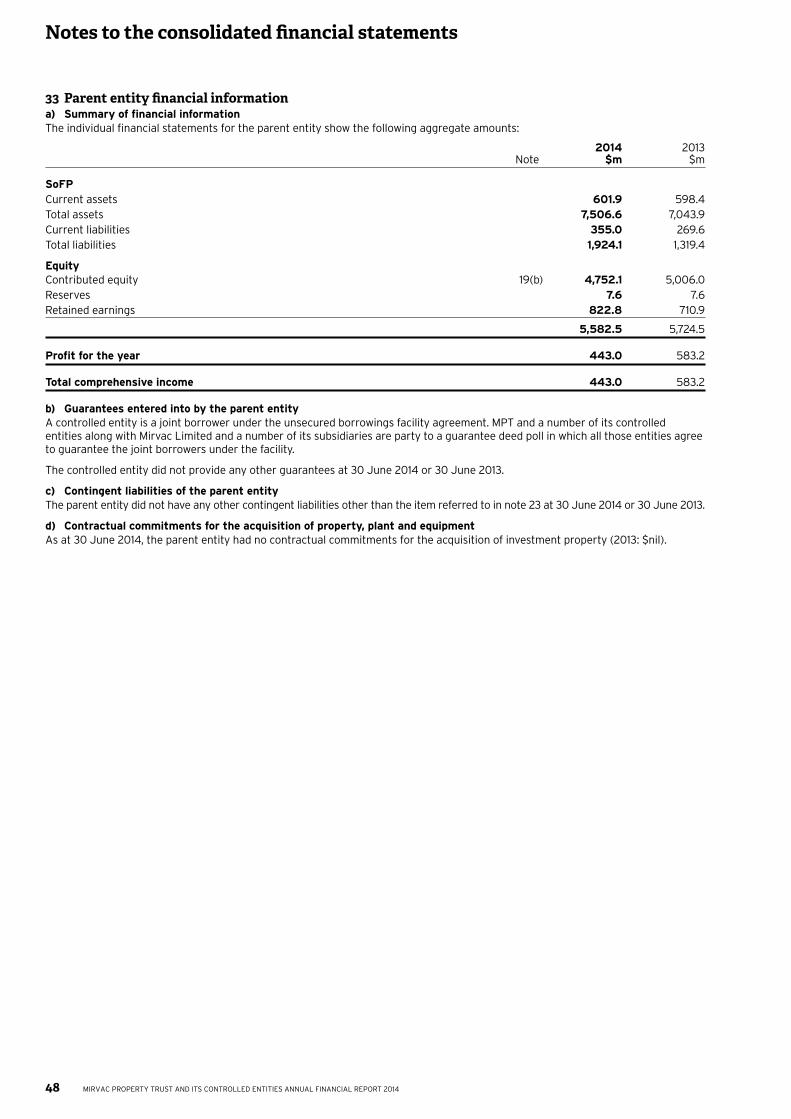
48
Notes to the consolidated financial statements
MIRVAC PROPERTY TRUST AND ITS CONTROLLED ENTITIES ANNUAL FINANCIAL REPORT 2014
33 Parent entity financial informationa) Summary of financial informationThe individual financial statements for the parent entity show the following aggregate amounts:
2014 2013 Note $m $m
SoFPCurrent assets 601.9 598.4Total assets 7,506.6 7,043.9Current liabilities 355.0 269.6Total liabilities 1,924.1 1,319.4
EquityContributed equity 19(b) 4,752.1 5,006.0Reserves 7.6 7.6Retained earnings 822.8 710.9
5,582.5 5,724.5
Profit for the year 443.0 583.2
Total comprehensive income 443.0 583.2
b) Guarantees entered into by the parent entityA controlled entity is a joint borrower under the unsecured borrowings facility agreement. MPT and a number of its controlled entities along with Mirvac Limited and a number of its subsidiaries are party to a guarantee deed poll in which all those entities agree to guarantee the joint borrowers under the facility.
The controlled entity did not provide any other guarantees at 30 June 2014 or 30 June 2013.
c) Contingent liabilities of the parent entityThe parent entity did not have any other contingent liabilities other than the item referred to in note 23 at 30 June 2014 or 30 June 2013.
d) Contractual commitments for the acquisition of property, plant and equipmentAs at 30 June 2014, the parent entity had no contractual commitments for the acquisition of investment property (2013: $nil).
49MIRVAC PROPERTY TRUST AND ITS CONTROLLED ENTITIES ANNUAL FINANCIAL REPORT 2014
In the Directors’ opinion:
a) the financial statements and notes set out on pages 07 to 48 are in accordance with the Corporations Act 2001, including:
i) complying with Accounting Standards, the Corporations Regulations 2001 and other mandatory professional reporting requirements; and
ii) giving a true and fair view of the consolidated entity’s financial position as at 30 June 2014 and of its performance for the financial year ended on that date; and
b) there are reasonable grounds to believe that the consolidated entity will be able to pay its debts as and when they become due and payable.
Note 1(b) confirms that the financial statements also comply with IFRS as issued by the IASB.
The Directors have been given the declarations by the CEO/MD and the Chief Financial Officer required by section 295A of the Corporations Act 2001.
This declaration is made in accordance with a resolution of the Directors.
Susan Lloyd-HurwitzDirector
Sydney21 August 2014
Directors’ declaration
50 MIRVAC PROPERTY TRUST AND ITS CONTROLLED ENTITIES ANNUAL FINANCIAL REPORT 2014
Independent auditor’s report to the unitholders of Mirvac Property Trust
Report on the financial reportWe have audited the accompanying financial report of Mirvac Property Trust (the Trust), which comprises the statement of financial position as at 30 June 2014, the statement of comprehensive income, statement of changes in equity and statement of cash flows for the year ended on that date, a summary of significant accounting policies, other explanatory notes and the directors’ declaration for the Mirvac Property Trust Group (the consolidated entity). The consolidated entity comprises the Trust and the entities it controlled at year’s end or from time to time during the financial year.
Directors’ responsibility for the financial reportThe directors of Mirvac Funds Limited as responsible entity for Mirvac Property Trust are responsible for the preparation of the financial report that gives a true and fair view in accordance with Australian Accounting Standards and the Corporations Act 2001 and for such internal control as the directors determine is necessary to enable the preparation of the financial report that is free from material misstatement, whether due to fraud or error. In note 1, the directors also state, in accordance with Accounting Standard AASB 101 Presentation of Financial Statements, that the financial statements comply with International Financial Reporting Standards.
Auditor’s responsibilityOur responsibility is to express an opinion on the financial report based on our audit. We conducted our audit in accordance with Australian Auditing Standards. These Auditing Standards require that we comply with relevant ethical requirements relating to audit engagements and plan and perform the audit to obtain reasonable assurance whether the financial report is free from material misstatement.
An audit involves performing procedures to obtain audit evidence about the amounts and disclosures in the financial report. The procedures selected depend on the auditor’s judgement, including the assessment of the risks of material misstatement of the financial report, whether due to fraud or error. In making those risk assessments, the auditor considers internal control relevant to the consolidated entity’s preparation and fair presentation of the financial report in order to design audit procedures that are appropriate in the circumstances, but not for the purpose of expressing an opinion on the effectiveness of the entity’s internal control. An audit also includes evaluating the appropriateness of accounting policies used and the reasonableness of accounting estimates made by the directors, as well as evaluating the overall presentation of the financial report.
We believe that the audit evidence we have obtained is sufficient and appropriate to provide a basis for our audit opinion.
PricewaterhouseCoopers, ABN 52 780 433 757 Darling Park Tower 2, 201 Sussex Street, GPO BOX 2650, SYDNEY NSW 1171 DX 77 Sydney, Australia T +61 2 8266 0000, F +61 2 8266 9999, www.pwc.com.au
Liability limited by a scheme approved under Professional Standards Legislation
51MIRVAC PROPERTY TRUST AND ITS CONTROLLED ENTITIES ANNUAL FINANCIAL REPORT 2014
Independent auditor’s report to the unitholders of Mirvac Property Trust
IndependenceIn conducting our audit, we have complied with the independence requirements of the Corporations Act 2001.
Auditor’s opinionIn our opinion:
(a) the financial report of Mirvac Property Trust is in accordance with the Corporations Act 2001, including:
(i) giving a true and fair view of the consolidated entity’s financial position as at 30 June 2014 and of its performance for the year ended on that date; and
(ii) complying with Australian Accounting Standards (including the Australian Accounting Interpretations) and the Corporations Regulations 2001;
(b) the financial report and notes also comply with International Financial Reporting Standards as disclosed in note 1.
PricewaterhouseCoopers
Matthew Lunn SydneyPartner 21 August 2014
52 MIRVAC PROPERTY TRUST AND ITS CONTROLLED ENTITIES ANNUAL FINANCIAL REPORT 2014
Registered office/Principal officeMirvac Group (comprising Mirvac Limited ABN 92 003 280 699 and Mirvac Funds Limited ABN 70 002 561 640, AFSL 233 121 as responsible entity of MPT ARSN 086 780 645)
Level 26 60 Margaret Street Sydney NSW 2000
Telephone +61 2 9080 8000 Facsimile +61 2 9080 8111
www.mirvac.com
Securities exchange listingMirvac is listed on the ASX (ASX code: MGR)
DirectorsJohn Mulcahy (Chair)Susan Lloyd-Hurwitz (CEO/MD)Peter HawkinsJames Millar AMJohn PetersElana Rubin
Company SecretariesNatalie AllenSean Ward
Stapled security registryLink Market Services Limited Level 12 680 George Street Sydney NSW 2000
Securityholder enquiriesTelephone 1800 356 444 (within Australia) or outside Australia + 61 2 8280 7107 (outside Australia)
www.linkmarketservices.com.au
Correspondence should be sent to:Mirvac Group C/- Link Market Services Limited Locked Bag 14 Sydney South NSW 1235
Further investor information can be located in the Investor Centre tab on Mirvac’s website at www.mirvac.com.
AuditorPricewaterhouseCoopers 201 Sussex Street Sydney NSW 2000
Annual General Meeting (“AGM”)Mirvac Group’s 2014 AGM will be held at 10.00am (Australian Eastern Daylight Time) on Thursday, 20 November 2014 at the Swissotel Sydney, Level 8, 68 Market Street, Sydney NSW 2000.
Directory
Environmentally Responsible PaperThis report is printed on ecoStar, an environmentally responsible paper made carbon neutral and manufactured from Forest Stewardship Council (“FSC”) certified 100 per cent post consumer recycled paper, in a process chlorine free environment under the ISO 14001 environmental management system. The greenhouse gas emissions of the manufacturing process, including transportation of the finished product to the paper suppliers warehouse, have been measured by the Edinburgh Centre for Carbon Management and offset by the CarbonNeutral Company.
Electronic version of Annual ReportAn electronic version of this report is available on Mirvac’s website at www.mirvac.com.
Securityholders who do not require a printed Annual Report, or who receive more than one copy due to multiple holdings, can help reduce the number of copies printed by advising the registry in writing of changes to their report mailing preferences.
Securityholders who choose not to receive printed reports will continue to receive all other securityholder information, including Notices of Meetings.
Paper made from recycled material
RECYCLED