Embed Size (px)
Citation preview
Stewart approachof acid-base disorders inIntensive Care patients
Miriam Moviat

This thesis was financially supported by: Wetenschapsfonds Jeroen Bosch Ziekenhuis, Fresenius Kabi Netherlands BV and Fresenius Medical Care Netherlands BV
Cover illustration: Carine Huizenga-Janssen, 's-HertogenboschCover design and lay-out: In Zicht Grafisch Ontwerp, ArnhemPrinted by: Ipskamp Drukkers, Enschede
© M. Moviat 2012All rights reserved. No part of this publication may be reproduced or transmitted in any form or by any means, electronic or mechanical, by print or otherwise, without permission in writing from the author
Stewart approachof acid-base disorders inIntensive Care patients
Proefschrift
ter verkrijging van de graad van doctor aan de Radboud Universiteit Nijmegen
op gezag van rector magnificus prof. mr. S.C.J.J. Kortmann,volgens besluit van het college van decanen
in het openbaar te verdedigen op vrijdag 18 januari 2013om 13.00 uur precies
door
Miriam Moviatgeboren op 25 oktober 1971
te Eindhoven

Promotoren Prof. dr. P. Pickkers Prof. dr. J.G. van der Hoeven
Copromotor Dr. P.H.J. van der Voort Manuscriptcommissie Prof. dr. J.F.M. Wetzels, voorzitter Prof. dr. H. Willems Prof. dr. A.B. Groeneveld (Erasmus MC)

Table of contents
Chapter 1 Introduction and outline of the thesis 9
Part I Stewart approach of metabolic acidosis in the ICU 21
Chapter 2 Conventional or physicochemical approach in 23 intensive care unit patients with metabolic acidosis Critical Care 2003; 7:R41-R45
Chapter 3 Contribution of various metabolites to the “unmeasured” 35 anions in critically ill patients with metabolic acidosis Critical Care Medicine 2008; 36:752–758
Chapter 4 Impaired renal function is associated with greater 55 urinary strong ion differences in critically ill patients with metabolic acidosis Journal of Critical Care 2012; 27(3): 255-260
Part II Stewart approach of metabolic alkalosis in the ICU 71
Chapter 5 Acetazolamide-mediated decrease in strong ion 73 difference accounts for the correction of metabolic alkalosis in critically ill patients Critical Care 2006, 10:R14
Part III Stewart analysis of apparent normal acid base state in the ICU 89
Chapter 6 Stewart analysis of apparent normal acid base state in the critically ill: 91 a complex mixed acid base disorder or an adaptive response? Submitted
Chapter 7 Summary and general discussion 113
Chapter 8 Nederlandse samenvatting 129
Dankwoord 141
Curriculum Vitae 144

Introduction and outline of the thesis
Chapter 1

11
INTRODUCTION AND OUTLINE OF THE THESIS
1General introduction
Acid-base abnormalities are common and clinically relevant in critically ill patients1,2. For example, severe metabolic acidosis has great impact on organ function and is clearly associated with adverse outcome3. Also metabolic alkalosis exerts adverse effects on cardiovascular, pulmonary and metabolic function4 and is associated with increased ICU mortality5. Although metabolic acid-base abnormalities are often related to the underlying disease, a significant proportion is iatrogenic6. A thorough understanding of acid base physiology and pathophysiology is essential to the critical care physician. Diagnosis of the cause of an acid-base derangement enables the clinician to identify markers of outcome and institute or avoid specific treatments.
Systematic approaches for the diagnosis of acid base disordersA systematic approach is essential in the diagnosis of acid-base disorders7. Several approaches to interpret acid-base derangements have been developed since the beginning of the past century8. Each approach differs only in the assessment of the metabolic component6. All approaches agree with respect to the respiratory component, represented by the PaCO2, an independent variable influencing pH. The influence of carbon dioxide on pH is clarified by the equilibrium reaction describing how carbon dioxide combines with water to form carbonic acid (H2CO3):
CO2 + H2O H2CO3 H+ + HCO3–
The traditional approach to acid-base disorders developed from the work of Henderson and Hasselbalch in 19169 is still the most widely used in clinical practice10. They introduced the well-known Henderson-Hasselbalch equation:
[HCO3–]
pH= 6.1 + log 0.03 x PaCO2
The use of [HCO3-] to describe the metabolic component of an acid-base disturbance
is easy to apply in common clinical problems. However, as can be noticed from the carbonic acid equilibrium reaction, changes in PaCO2 will inevitably cause a change in [HCO3
-]. Therefore, other methods of assessing the metabolic component, by standardising to a normal PaCO2 value, have been developed after the original work of Henderson and Hasselbalch. The ‘base excess method’ of Siggaard- Andersen11, introduced in 1958, is now commonly used in blood gas analysers to overcome this issue. Base excess is defined as the change in strong acid or base

12 13
CHAPTER 1 INTRODUCTION AND OUTLINE OF THE THESIS
1Peter Stewart died in 1993 and therefore has not been able to enjoy the popularity his original work has gained. The Stewart approach enables the clinician to identify and quantify all contributing metabolic and respiratory factors in an acid-base disorder. This thesis focuses on this physico-chemical approach and its application in critically ill patients with metabolic derangements. In this thesis, this approach will be referred to as the ‘Stewart approach’.
The Stewart approach
The Stewart approach relies on the fundamental principles of conservation of both mass and electroneutrality. Moreover, central to the understanding of this approach is the fact that the human body provides an extensive, essentially inexhaustible source of H+ ions because of its high water content, which is always partially dissociated in H+ and OH- 10,14,18. According to this approach, only 3 independent variables can change the extent of dissociation of water, and thereby [H+] and thus blood pH: the strong ion difference (SID), the total amount of weak acids (mainly phosphate and albumin), and PaCO2. Based on the principles of electroneutrality and conservation of mass, the strong ion difference (SID) represents the net balance between strong (fully dissociated) cations and strong anions in plasma according to the following formula (all concentrations in mEq/L):
SID = [Na+]+ [K+]+ [Ca2+]+ [Mg2+]– ([Cl–]+ [lactate–])
Decreases in the strong ion difference (such as those occurring in hyperchloremia, hyperlactatemia or dilution) lead to an increase in the dissociation of water, to maintain electroneutrality, and thereby to a fall in the pH. The opposite happens if the strong ion difference increases. Normal values of SID in healthy human subjects are 38-42 mEq/L6,22-25.
Obviously, the human body cannot be charged positively or negatively. The formula of SID does not take into account the negative charge of weak acids and other weak anions present in blood. Therefore, this is named the ‘apparent strong ion difference’ (SIDapp). Calculation of the anionic effects of albumin was made possible by the work of Figge et al.19,20 The sum of the charges of the weak acids (serum albumin and phosphate) and bicarbonate, representing the effective strong ion difference (SIDeff) is described in the following equation:
SIDeff = (2.46 x 10⁻⁸ x PaCO2 (mm Hg)/10-pH) + ([albumin in g/L] x 0.123 x (pH – 0.631)) + ([phosphate in mmol/L] x (0.309 x pH – 0.469))
needed to restore pH of plasma in vitro to normal at normal PaCO2. To improve the accuracy of the base excess, the formula was adjusted in 1963, assuming a standard hemoglobin concentration of 5 g/L to compensate for bicarbonate’s large apparent volume of distribution12. This formula of standard base excess more accurately predicts the quantity of strong acid or base required restore the pH of plasma in-vivo to normal at normal PaCO2. Unfortunately, clinical interpretation of serial measurements of the (standard) base excess in a critically ill patient is difficult, for example when simultaneous large alterations in hemoglobin concentration and/or PaCO2 are present. In summary, traditional approaches provide a quantification of the metabolic component of an acid-base disorder. However, it is recognized that the traditional approaches of both Henderson Hasselbalch and Siggaard-Andersen are inadequate to fully understand the cause of a metabolic derangement10,13,14. Knowledge about the cause of the derangement is vital in the treatment of critically ill patients, as well as a thorough understanding of the compensatory mechanisms of the body. The ‘anion gap concept’ was developed to give more insight in the cause of a metabolic acidosis by demonstrating or excluding the presence of unmeasured anions:
Anion gap (AG) = [Na+] + [K+] – [Cl–] – [HCO3–]
Normal values of the AG vary (depending on the local laboratory) between 8 and 12 mEq/L and represent the net charge of all unmeasured positively and negatively charged serum ions and proteins. In case of a metabolic acidosis, an increased AG indicates the presence of unmeasured anions.
However, the usefulness of the AG is limited because of various confounding factors15. Its main drawback is that only four electrolytes are measured and incorporated in its calculation. Values of other charged components are assumed to be normal, but, especially in critically ill patients, this is frequently not the case. The most important example is albumin, which is the most abundant negatively charged serum protein. The majority of critically ill patients is hypoalbuminemic16. In these patients, the normal value of the AG decreases and this needs to be corrected for, either by adjusting the normal range or by correcting the calculated anion gap for albumin levels17. If this is not appreciated, it may lead to a false interpretation of the AG as being normal.
Because of the limited value of the AG in the analysis of complex metabolic acid-base derangements, the quantitative physico-chemical approach first described by Stewart in 198118 and later modified by Figge et al19,20, has gained interest during the past decade, especially in the critical care literature10,14,21.

14 15
CHAPTER 1 INTRODUCTION AND OUTLINE OF THE THESIS
1Interpretation of metabolic acid base derangements according to the Stewart approachAccording to the physicochemical theory, metabolic acidosis can only be the result of decreases in SIDapp (mainly due to hyperchloremia, hyperlactatemia and dilution13), increases in the SIG (unmeasured anions), or increases in the concentration of weak acids (hyperalbuminemia, which is described31 but extremely rare, and hy-perphosphatemia). Likewise, metabolic alkalosis can only be the result of increases in the SIDapp (mainly due to hypochloremia and contraction of plasma volume) or decreases in the concentrations of the main weak acids. Primary hypoproteinaemic alkalosis is described in critically ill patients32. However, critically ill patients with hypoalbuminemia often have a normal pH due to concurrent reduced SIDapp
33. Critically ill patients often have complex acid base abnormalities with co-existence of the above-mentioned abnormalities. Therefore, the Stewart approach may be of additional value compared to the more conventional approaches. For example, using the Stewart approach, the cause of metabolic acidosis in critically ill patients with acute renal failure has been identified and quantified: it is a result of the balance between the acidifying effect of increased SIG and hyperphosphatemia and the smaller alkalinizing effect of hypoalbuminemia34. The Stewart approach not only enables us to identify these contributing factors, but also makes it clear to what extent each factor influences pH.
Regulation of pH according to the Stewart approachBy understanding that only PaCO2, strong ion difference and the total concentration of weak acids can independently influence pH, the Stewart approach also gives insight in the way the human body can regulate it. No physiological mechanism is known to control concentrations of weak acids for acid-base purposes10 and concentrations of the weak acids are primarily dependent of other mechanisms (like calcium homeostasis in case of phosphate). So, apart from adjusting PaCO2 by alveolar ventilation, the only possible mechanism to correct pH in case of an acid-base disturbance is by regulation of the SIDapp. Plasma [Na+] is mainly controlled for the purpose of maintaining intravascular volume and osmolality and [K+] is tightly regulated to ensure appropriate cardiac and neuromuscular function10. Therefore, by adjusting urinary excretion of chloride (accompanied by NH4
+), without the simultaneous excretion of a strong cation, this is most likely how the kidneys can regulate plasma SIDapp and pH13,14.
In summary, the Stewart approach provides a robust strategy for studying acid-base disorders and can provide important insights into metabolic derangements. However, due to its complexity, its implementation at the bedside is cumbersome and this has limited its clinical applicability.
Normally, values of SIDapp and SIDeff are nearly equal (according to the law of electro-neutrality), as no significant amounts of unmeasured anions, other than lactate, are present in the blood during physiological circumstances in the absence of disease. However, in critically ill patients, unmeasured ions are likely to increase due to for example impaired clearance secondary to renal or hepatic failure. Unmeasured anions represent the “gap” between apparent and effective strong ion difference. When present, they are responsible for dissociation of water and a fall in pH. This gap is called the ‘strong ion gap’ (SIG) and is calculated by the following formula:
SIG = SIDapp – SIDeff
The positively and negatively charged components of SIDapp and SIDeff in human plasma are illustrated in figure 1.
In critically ill patients, an increased SIG, indicating an increased amount of strong unmeasured anions other than lactate, is present in for example renal failure (uremic toxins)26, hepatic failure 27, ketoacidosis, intoxications and sepsis 28. Like lactate, it might be a marker of tissue hypoperfusion and/or tissue damage in for example post cardiac arrest patients as well 29,30. However, assessment of the SIG at the bedside is complex, mainly due to the complicated calculation of SIDeff.
Figure 1 Schematic representation of the cationic (left) and anionic (left) contributors to the different Stewart parameters. For reasons of clarity, the relative quantities of the components do not completely represent actual values.
Na+
K+
lactate–
HCO3–
SIDapp SIDeff
SIG
PO4–
Alb–
Ca2+
Mg2+
Cl–

16 17
CHAPTER 1 INTRODUCTION AND OUTLINE OF THE THESIS
1References
1. Gauthier PM, Szerlip HM. Metabolic acidosis in the intensive care unit. Critical care clinics 2002;18:289-308, vi.
2. Gunnerson KJ. Clinical review: the meaning of acid-base abnormalities in the intensive care unit part I - epidemiology. Crit Care 2005;9:508-16.
3. Gunnerson KJ, Saul M, He S, Kellum JA. Lactate versus non-lactate metabolic acidosis: a retrospective outcome evaluation of critically ill patients. Crit Care 2006;10:R22.
4. Hodgkin JE, Soeprono FF, Chan DM. Incidence of metabolic alkalemia in hospitalized patients. Critical care medicine 1980;8:725-8.
5. Anderson LE, Henrich WL. Alkalemia-associated morbidity and mortality in medical and surgical patients. Southern medical journal 1987;80:729-33.
6. Gunnerson KJ, Kellum JA. Acid-base and electrolyte analysis in critically ill patients: are we ready for the new millennium? Current opinion in critical care 2003;9:468-73.
7. Kraut JA, Madias NE. Metabolic acidosis: pathophysiology, diagnosis and management. Nature reviews Nephrology 2010;6:274-85.
8. Story DA. Bench-to-bedside review: a brief history of clinical acid-base. Crit Care 2004;8:253-8.9. Hasselbalch KA. Die Berechnung der Wasserstoffzahl des Blutes aus der freien und gebundenen
Kohlensaure desselben und die Sauerstoffbindung des Blutes als Function der Wasserstofzahl. Biochemische Zeitschrift 1916;78:112-44.
10. Sirker AA, Rhodes A, Grounds RM, Bennett ED. Acid-base physiology: the ‘traditional’ and the ‘modern’ approaches. Anaesthesia 2002;57:348-56.
11. Siggard-Andersen O. EK. A micro method for determination of pH, carbon dioxide tension, base excess and standard bicarbonate in capillary blood. Scandinavian Journal of Clinical and Laboratory Investigation 1960;12:172-76.
12. Siggaard-Andersen O. Titratable acid or base of body fluids. Annals of the New York Academy of Sciences 1966;133:41-58.
13. Kellum JA. Metabolic acidosis in the critically ill: lessons from physical chemistry. Kidney international Supplement 1998;66:S81-6.
14. Kellum JA. Determinants of blood pH in health and disease. Crit Care 2000;4:6-14.15. Salem MM, Mujais SK. Gaps in the anion gap. Archives of internal medicine 1992;152:1625-9.16. Vincent JL. Relevance of albumin in modern critical care medicine. Best practice & research Clinical
anaesthesiology 2009;23:183-91.17. Figge J, Jabor A, Kazda A, Fencl V. Anion gap and hypoalbuminemia. Critical care medicine
1998;26:1807-10.18. Stewart PA. Modern quantitative acid-base chemistry. Canadian journal of physiology and
pharmacology 1983;61:1444-61.19. Figge J, Rossing TH, Fencl V. The role of serum proteins in acid-base equilibria. The Journal of
laboratory and clinical medicine 1991;117:453-67.20. Figge J, Mydosh T, Fencl V. Serum proteins and acid-base equilibria: a follow-up. The Journal of
laboratory and clinical medicine 1992;120:713-9.21. Fencl V, Jabor A, Kazda A, Figge J. Diagnosis of metabolic acid-base disturbances in critically ill
patients. American journal of respiratory and critical care medicine 2000;162:2246-51.22. Park M, Taniguchi LU, Noritomi DT, Liborio AB, Maciel AT, Cruz-Neto LM. Clinical utility of standard
base excess in the diagnosis and interpretation of metabolic acidosis in critically ill patients. Brazilian journal of medical and biological research = Revista brasileira de pesquisas medicas e biologicas / Sociedade Brasileira de Biofisica [et al] 2008;41:241-9.
23. Nagaoka D, Nassar Junior AP, Maciel AT, et al. The use of sodium-chloride difference and chloride-sodium ratio as strong ion difference surrogates in the evaluation of metabolic acidosis in critically ill patients. Journal of critical care 2010;25:525-31.
24. Gunnerson KJ, Srisawat N, Kellum JA. Is there a difference between strong ion gap in healthy volunteers and intensive care unit patients? Journal of critical care 2010;25:520-4.
Aims and outline of this thesis
The aim of this thesis was to perform clinical studies using the Stewart approach to explore acid base disorders in critically ill patients, with a distinct focus on metabolic derangements and the role of renal function.
In the first part of this thesis, several aspects of the etiology of metabolic acidosis in the ICU are discussed. In chapter 2, the nature of metabolic acidosis in ICU patients is explored. The traditional approach is compared with the Stewart approach with respect to diagnostic performance and applicability at the bedside. In chapter 3, we searched for the nature of strong unmeasured anions, which represent a frequent, but unidentified, cause of metabolic acidosis in the ICU with prognostic implications. In chapter 4, the role of renal dysfunction in the etiology of metabolic acidosis is examined.
In the second part of this thesis, the Stewart approach of metabolic alkalosis in the ICU is discussed. In chapter 5, a quantitative analysis of the effects of a therapeutic intervention in metabolic alkalosis, administration of acetazolamide, in the ICU is presented. Effects on urinary excretion as well as serum acid base variables are discussed.
In the third part of the thesis, several aspects of ICU patients with an apparent normal acid base state are described. In chapter 6, we described Stewart parameters in critically ill patients with apparent normal acid base state according to the traditional approach. We investigated whether a normal pH, BE and PaCO2 represent a truly normal acid base state or a mixed metabolic acid base disorder in these patients. Furthermore, we explored the kinetics of acid-base parameters of ICU patients who develop a normal pH during the first week of admission. Finally, several contributing factors to mixed acid base disorders according to Stewart were identified.
Finally this thesis is concluded with a summary and a general discussion of the findings in chapter 7.

18 19
CHAPTER 1 INTRODUCTION AND OUTLINE OF THE THESIS
125. Antonini B, Piva S, Paltenghi M, Candiani A, Latronico N. The early phase of critical illness is a progressive acidic state due to unmeasured anions. European journal of anaesthesiology 2008;25:566-71.
26. Kellum JA, Kramer DJ, Pinsky MR. Strong ion gap: a methodology for exploring unexplained anions. Journal of critical care 1995;10:51-5.
27. Naka T, Bellomo R, Morimatsu H, et al. Acid-base balance in combined severe hepatic and renal failure: a quantitative analysis. The International journal of artificial organs 2008;31:288-94.
28. Mallat J, Michel D, Salaun P, Thevenin D, Tronchon L. Defining metabolic acidosis in patients with septic shock using Stewart approach. The American journal of emergency medicine 2011.
29. Funk GC, Doberer D, Sterz F, et al. The strong ion gap and outcome after cardiac arrest in patients treated with therapeutic hypothermia: a retrospective study. Intensive care medicine 2009;35:232-9.
30. Makino J, Uchino S, Morimatsu H, Bellomo R. A quantitative analysis of the acidosis of cardiac arrest: a prospective observational study. Crit Care 2005;9:R357-62.
31. Wang F, Butler T, Rabbani GH, Jones PK. The acidosis of cholera. Contributions of hyperproteinemia, lactic acidemia, and hyperphosphatemia to an increased serum anion gap. The New England journal of medicine 1986;315:1591-5.
32. McAuliffe JJ, Lind LJ, Leith DE, Fencl V. Hypoproteinemic alkalosis. The American journal of medicine 1986;81:86-90.
33. Wilkes P. Hypoproteinemia, strong-ion difference, and acid-base status in critically ill patients. J Appl Physiol 1998;84:1740-8.
34. Rocktaeschel J, Morimatsu H, Uchino S, et al. Acid-base status of critically ill patients with acute renal failure: analysis based on Stewart-Figge methodology. Crit Care 2003;7:R60.

Stewart approach of metabolic acidosis in the ICU
Part I
Conventional or physicochemical approach in intensive care unit patients with metabolic acidosis
Miriam Moviat, Frank van Haren, Hans van der Hoeven
Critical Care 2003; 7:R41-R45
Chapter 2

24 25
CHAPTER 2 CONVENTIONAL OR PHYSICOCHEMICAL APPROACH IN ICU PATIENTS WITH METABOLIC ACIDOSIS
2Introduction
Metabolic acidosis is one of the most frequent acid–base disorders occurring in the intensive care unit (ICU)1. It may contribute to the morbidity and mortality associated with shock, although it may also have some protective effects. Traditional approaches are often inadequate to explain the complexity of acid–base derangements in critically ill patients. The physicochemical approach described by Stewart is based on two major principles: electroneutrality and conservation of mass2,3. According to this theory, there are three variables that independently determine the hydrogen ion concentration. These variables are the strong ion difference, the total concentration of nonvolatile weak acid (primarily serum proteins and phosphate), and the carbon dioxide tension (PCO2)4,5. Although the Stewart approach may give a better understanding of the mechanisms that underlie an acid–base disorder, it is more time consuming than conventional methods and is therefore less convenient in daily practice6. The purpose of the present study was to compare two different methods of quantifying metabolic acidosis in patients admitted to an ICU. We were especially interested in whether acid–base analysis according to the physicochemical approach could result in important changes in diagnosis, and therefore in therapy. We hypothesised that a less time-consuming method such as the lactate-corrected and albumin-corrected anion gap would be as efficient as the calculations according to the physicochemical approach in identifying the major causes of metabolic acidosis: hyperchloremia, hyperlactate-mia and the presence of other unmeasured strong anions.
Methods
The study was conducted in a single, mixed medical and surgical ICU of the Jeroen Bosch Hospital, ‘s-Hertogenbosch, The Netherlands from August 2001 until February 2002. The local medical ethical committee waived informed consent.
We studied 50 consecutive patients who were either admitted with a metabolic acidosis or who developed a metabolic acidosis during their stay in the ICU. Metabolic acidosis was defined as a standard base excess (SBE) ≤ –5. In all patients we measured pH, arterial oxygen tension, arterial carbon dioxide tension (PaCO2), sodium, potassium, chloride, magnesium, calcium, lactate, creatinine, urea, phosphate and albumin in a single arterial blood sample. Bicarbonate was calculated using the Henderson–Hasselbach equation (pH=6.1+log ([HCO3–
]/0.0301 PaCO2) and the SBE using the Siggaard–Andersen formulae. The urine was screened for the presence of ketones in every patient. The anion gap (AG) was
Summary
Introduction Metabolic acidosis is the most frequent acid–base disorder in the intensive care unit. The optimal analysis of the underlying mechanisms is unknown.
Aim To compare the conventional approach with the physicochemical approach in quantifying complicated metabolic acidosis in patients in the intensive care unit.
Patients and methods We included 50 consecutive patients with a metabolic acidosis (standard base excess ≤–5). We measured sodium, potassium, calcium, magnesium, chloride, lactate, creatinine, urea, phosphate, albumin, pH, and arterial carbon dioxide and oxygen tensions in every patient. We then calculated HCO3–, the base excess, the anion gap, the albumin-corrected anion gap, the apparent strong ion difference, the effective strong ion difference and the strong ion gap.
Results Most patients had multiple underlying mechanisms explaining the metabolic acidosis. Unmeasured strong anions were present in 98%, hyperchloremia was present in 80% and elevated lactate levels were present in 62% of patients. Calculation of the anion gap was not useful for the detection of hyperlactatemia. There was an excellent relation between the strong ion gap and the albumin- corrected and lactate-corrected anion gap (r2=0.934), with a bias of 1.86 and a precision of 0.96.
Conclusion Multiple underlying mechanisms are present in most intensive care unit patients with a metabolic acidosis. These mechanisms are reliably determined by measuring the lactate-corrected and albumin-corrected anion gap. Calculation of the more time-consuming strong ion gap according to Stewart is therefore unnecessary.

26 27
CHAPTER 2 CONVENTIONAL OR PHYSICOCHEMICAL APPROACH IN ICU PATIENTS WITH METABOLIC ACIDOSIS
2
Urine samples were positive for ketones in six patients. Hyperchloremia (serum chloride ≥110mmol/l) was present in 40 patients (80%), and hyperlactatemia (serum lactate ≥2mmol/l) was present in 31 patients (62%). The contributions of the three main causes of metabolic acidosis (hyperchloremia, hyperlactatemia and increased
calculated with the formula AG=[Na+]+[K+]–[Cl–]–[HCO3–]. The anion gap corrected for albumin and lactate (AGcorr) was calculated with the formula AGcorr=AG+0.25x(40–[albumin])–lactate7. The apparent strong ion difference (SIDapp) was calculated using the formula SIDapp=[Na+]+[K+]+[Ca2+]+[Mg2+]–[Cl–]–[lactate–]. The effective strong ion difference (SIDeff) was calculated using the formula SIDeff=(2.46 x 10⁻⁸ x PaCO2 (mm Hg)/10-pH) + ([albumin in g/L] x 0.123 x (pH – 0.631)) + ([phosphate in mmol/L] x (0.309 x pH – 0.469)). The strong ion gap (SIG) was calculated by subtracting the effective strong ion difference from the apparent strong ion difference: SIG=SIDapp–SIDeff.
The serum reference range for a normal AG in our laboratory is 4–12 mmol/l (Aeroset 2002; Abbott, Hoofddorp, the Netherlands). AG>12mmol/l was considered elevated. SIG>0 points to the presence of unmeasured strong anions and was considered abnormal8. Fluid resuscitation was performed with isotonic 0.9% NaCl or short acting starch products (chloride concentration 154 mmol/l). Polygeline colloidal fluids were not used because they not only increase serum chloride levels, but probably also increase the SIG9.
Acute Physiology and Chronic Health Evaluation II data were collected for each patient for the first 24 hours after admission. A decrease in renal function was defined as a creatinine concentration > 110 μmol/l for males and > 100 μmol/l for females. All patients were followed up to determine the 28-day survival.
Results are reported as the mean±standard deviation or the median (25th percentile, 75th percentile) depending on the distribution of the data. We performed linear regression analysis to compare the SIG with the AGcorr. We calculated the bias (the mean difference between the two methods) after subtracting 12 from the AGcorr and the precision (the standard deviation of the bias). The limits of agreement were defined by ±2 standard deviations10.
Results
Fifty patients were enrolled in the study. Patient characteristics are presented in Table 1, and acid–base and electrolyte data for the study population are presented in Table 2.
Twenty-nine patients had evidence of a decreased renal function.
Table 1 Patient characteristics
Age (years) 65 (26-89)
Sex (male/female) 26/24
Acute Physiology and Chronic Health Evaluation II 22 (9-43)
Mechanical ventilation (%) 92
Standardised mortality ratio 0.90
Hospital mortality (%) 38
Diagnosis
Septic shock 22
Hypovolemic shock 15
Cardiogenic shock 9
Other 4
Data presented as median (interquartile range)
Table 2 Acid-base and electrolyte data
pH 7.30 (7.21, 7.33)
Arterial carbon dioxide tension (mmHg) 37 (29, 42)
Standard base excess -9 (-11, -7)
Sodium (mmol/l) 138 (135, 141)
Potassium (mmol/l) 4 (3.5, 4.4)
Chloride (mmol/l) 114 (110, 117)
Lactate (mmol/l) 2.3 (1.4, 3.0)
Albumin (g/l) 16 (13, 19)
Strong ion gap (mEq/l) 3.6 (2.0, 6.0)
Data presented as median (interquartile range)
28 29
CHAPTER 2 CONVENTIONAL OR PHYSICOCHEMICAL APPROACH IN ICU PATIENTS WITH METABOLIC ACIDOSIS
2
Discussion
The main finding of the present study was the excellent relationship between the AGcorr and the SIG in patients with a metabolic acidosis admitted to the ICU (r2=0.934). Furthermore, unmeasured strong anions excluding lactate were almost universally present in this unselected patient group, as was hyperchloremia.
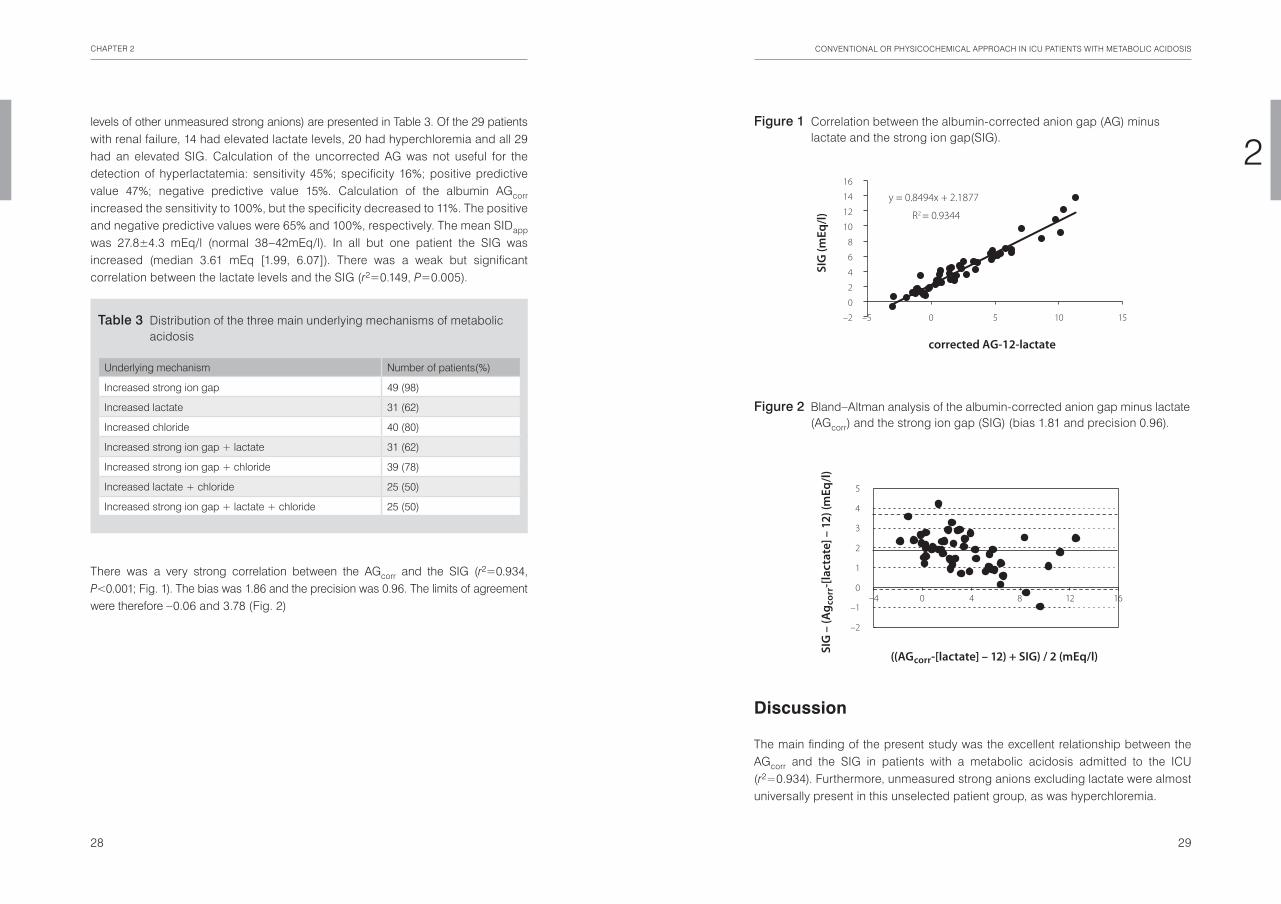
levels of other unmeasured strong anions) are presented in Table 3. Of the 29 patients with renal failure, 14 had elevated lactate levels, 20 had hyperchloremia and all 29 had an elevated SIG. Calculation of the uncorrected AG was not useful for the detection of hyperlactatemia: sensitivity 45%; specificity 16%; positive predictive value 47%; negative predictive value 15%. Calculation of the albumin AGcorr increased the sensitivity to 100%, but the specificity decreased to 11%. The positive and negative predictive values were 65% and 100%, respectively. The mean SIDapp was 27.8±4.3 mEq/l (normal 38–42mEq/l). In all but one patient the SIG was increased (median 3.61 mEq [1.99, 6.07]). There was a weak but significant correlation between the lactate levels and the SIG (r2=0.149, P=0.005).
There was a very strong correlation between the AGcorr and the SIG (r2=0.934, P<0.001; Fig. 1). The bias was 1.86 and the precision was 0.96. The limits of agreement were therefore –0.06 and 3.78 (Fig. 2)
Table 3 Distribution of the three main underlying mechanisms of metabolic acidosis
Underlying mechanism Number of patients(%)
Increased strong ion gap 49 (98)
Increased lactate 31 (62)
Increased chloride 40 (80)
Increased strong ion gap + lactate 31 (62)
Increased strong ion gap + chloride 39 (78)
Increased lactate + chloride 25 (50)
Increased strong ion gap + lactate + chloride 25 (50)
Figure 1 Correlation between the albumin-corrected anion gap (AG) minus lactate and the strong ion gap(SIG).
Figure 2 Bland–Altman analysis of the albumin-corrected anion gap minus lactate (AGcorr) and the strong ion gap (SIG) (bias 1.81 and precision 0.96).
y = 0.8494x + 2.1877
R2 = 0.9344
–2
0
2
4
6
8
10
12
14
16
–5 0 5 10 15
corrected AG-12-lactate
SIG
(mEq
/l)
–4 0 4 8 12 16
–2
–1
0
1
2
3
4
5
((AGcorr-[lactate] – 12) + SIG) / 2 (mEq/l)SIG
– (A
g cor
r-[la
ctat
e] –
12)
(mEq
/l)

30 31
CHAPTER 2 CONVENTIONAL OR PHYSICOCHEMICAL APPROACH IN ICU PATIENTS WITH METABOLIC ACIDOSIS
2There is no proof to date that the use of a more balanced resuscitation fluid will result in a better patient outcome. Kellum showed that a balanced resuscitation fluid (Hextend®, Abbott, Chicago, IL, USA), chloride concentration 124mmol/l) resulted in a better short-term survival in a rat sepsis model compared with isotonic saline15. Waters and colleagues compared isotonic saline with lactated Ringer’s solution in patients undergoing abdominal aortic aneurysm repair16. Patients in the normal saline group developed a more severe acidosis and received a larger volume of platelet transfusion. However, there were no differences in the duration of mechanical ventilation, the ICU stay, the hospital stay and the incidence of complications. Furthermore, the use of Ringer’s lactate has been associated with postoperative hypercapnic acidosis and hyponatremia17. Therefore, the importance of resuscitation-induced hyperchloremic acidosis remains to be determined. Hyper-lactatemia was the third cause of metabolic acidosis in the present study. Considering the high number of patients with sepsis, this is not surprising. The importance of hyperlactatemia as a marker of shock and its prognostic significance are well known. We demonstrated that a normal AG does not exclude the presence of hyper lactatemia (sensitivity 45%, negative predictive value 15%). Although the sensitivity of the AGcorr for the detection of hyperlactatemia increased to 100%, it was not specific (11%). Therefore, determination of the (corrected) AG is not a good substitute for the direct measurement of lactate in patients with a metabolic acidosis in the ICU. As expected, there was a weak but significant correlation between lactate levels and the SIG. This weak correlation was especially pronounced in patients with normal or slightly elevated lactate levels.
Several weaknesses of the present study should be mentioned. We only studied patients with a clear metabolic acidosis (SBE ≤ –5), and the SIG and lactate levels of patients with a normal or marginally normal SBE are therefore unknown. Furthermore, although the patients were included immediately when the SBE became ≤ –5, changes over time may have influence over the type of acidosis detected.
Conclusion
The present study demonstrates that multiple underlying mechanisms are present in most ICU patients with a metabolic acidosis. These mechanisms are reliably determined by measuring the lactate-corrected and albumin-corrected anion gap. Calculation of the more time-consuming strong ion gap according to Stewart, although a gold standard, is therefore unnecessary for clinical purposes. Further studies should focus on the nature and importance of the unmeasured strong anions that are almost universally present in these patients.
A positive SIG indicating the presence of unmeasured strong anions was reliably detected by the AGcorr. Durward and colleagues studied 540 children, of whom 240 developed a metabolic acidosis6. In their study, unmeasured strong anions were also the main component of tissue acids. In accordance with the present study, the AGcorr had the best discriminatory ability (area under curve 0.95) and the tightest determination coefficient for the detection of tissue acids (r2=0.86). Durward and colleagues also found a weak but significant inverse correlation between the total amount of tissue acids and the chloride: sodium ratio. A chloride:sodium ratio > 0.79 was able to exclude a raised tissue acid level with a positive predictive value of 81% and a likelihood ratio of 4.5. The upper normal range for the chloride:sodium ratio in our hospital is 0.79. Thirty-eight (76%) patients had a chloride: sodium ratio > 0.79 in our study. This is in agreement with our definition of hyperchloremia using an absolute level of 110 mmol/l (80% hyperchloremia). We also found a significant negative correlation between the amount of unmeasured strong anions and the chloride:sodium ratio (r2=0.54, P<0.001). The unmeasured strong anions involved in the SIG remain largely unidentified. These anions appear, for example, in the circulation during sepsis and liver failure, and may be a variety of organic and inorganic compounds8. The use of urea-linked polygelines, for example, as the priming fluid for the extracorporeal circuit during cardiac surgery has also been shown to increase the SIG9. They represent approximately 5.6 mEq anions per 500 ml fluid. Also, the (over)use of several medications such as salicylates and penicillin can be a cause of a positive SIG. The importance of a raised SIG in clinical practice, however, is unknown. Cusack and colleagues recently showed that the pH and SBE were better outcome predictors than the SIG in a group of mixed medical and surgical ICU patients11. Furthermore, normal levels for the SIG in critically ill patients are unknown. We defined SIG>0 as abnormal but these data were based on measurements in healthy volunteers8. Cusack and colleagues found a much higher SIG in critically ill patients but they provide no separate data for the patients with a normal SBE. If we assume that normal AG ≤12mEq/l, the intercept in Figure 1 suggests that the normal SIG in our critically ill patients is close to 2mEq/l.
A significant part of the acidosis in the present patients is probably related to the resuscitation with isotonic saline and starch products. This can be deduced from the frequent occurrence of hyperchloremia in our patients in relation to the plasma sodium concentration. Both have a chloride concentration of 154 mmol/l. This results in a reduction of the strong ion difference, which in turn produces an increase in the number of hydrogen ions to preserve electrical neutrality. The term ‘dilutional acidosis’ used in relation to high volume resuscitation should therefore be abandoned. Hyperchloremic acidosis after fluid resuscitation is a well-known phenomenon in the ICU12-14. The clinical consequences, however, are unknown.

32 33
CHAPTER 2 CONVENTIONAL OR PHYSICOCHEMICAL APPROACH IN ICU PATIENTS WITH METABOLIC ACIDOSIS
2References
1. Gauthier PM, Szerlip HM. Metabolic acidosis in the intensive care unit. Critical care clinics 2002;18:289-308.
2. Stewart PA. Modern quantitative acid-base chemistry. Canadian journal of physiology and pharmacology 1983;61:1444-61.
3. Kellum JA. Determinants of blood pH in health and disease. Crit Care 2000;4:6-14.4. Wilkes P. Hypoproteinemia, strong-ion difference, and acid-base status in critically ill patients. J Appl
Physiol 1998;84:1740-8.5. Figge J, Rossing TH, Fencl V. The role of serum proteins in acid-base equilibria. The Journal of
laboratory and clinical medicine 1991;117:453-67.6. Durward A, Skellett S, Mayer A, Taylor D, Tibby SM, Murdoch IA. The value of the chloride: sodium ratio
in differentiating the aetiology of metabolic acidosis. Intensive care medicine 2001;27:828-35.7. Figge J, Jabor A, Kazda A, Fencl V. Anion gap and hypoalbuminemia. Critical care medicine 1998;
26:1807-10.8. Kellum JA, Kramer DJ, Pinsky MR. Strong ion gap: a methodology for exploring unexplained anions.
Journal of critical care 1995;10:51-5.9. Hayhoe M, Bellomo R, Liu G, McNicol L, Buxton B. The aetiology and pathogenesis of cardiopulmo-
nary bypass-associated metabolic acidosis using polygeline pump prime. Intensive care medicine 1999;25:680-5.
10. Bland JM, Altman DG. Statistical methods for assessing agreement between two methods of clinical measurement. Lancet 1986;1:307-10.
11. Cusack RJ, Rhodes A, Lochhead P, et al. The strong ion gap does not have prognostic value in critically ill patients in a mixed medical/surgical adult ICU. Intensive care medicine 2002;28:864-9.
12. Prough DS, White RT. Acidosis associated with perioperative saline administration: dilution or delusion? Anesthesiology 2000;93:1167-9.
13. Liskaser FJ, Bellomo R, Hayhoe M, et al. Role of pump prime in the etiology and pathogenesis of cardiopulmonary bypass-associated acidosis. Anesthesiology 2000;93:1170-3.
14. Rehm M, Orth V, Scheingraber S, Kreimeier U, Brechtelsbauer H, Finsterer U. Acid-base changes caused by 5% albumin versus 6% hydroxyethyl starch solution in patients undergoing acute normovolemic hemodilution: a randomized prospective study. Anesthesiology 2000;93:1174-83.
15. Kellum JA. Fluid resuscitation and hyperchloremic acidosis in experimental sepsis: improved short-term survival and acid-base balance with Hextend compared with saline. Critical care medicine 2002;30:300-5.
16. Waters JH, Gottlieb A, Schoenwald P, Popovich MJ, Sprung J, Nelson DR. Normal saline versus lactated Ringer’s solution for intraoperative fluid management in patients undergoing abdominal aortic aneurysm repair: an outcome study. Anesthesia and analgesia 2001;93:817-22.
17. Takil A, Eti Z, Irmak P, Yilmaz Gogus F. Early postoperative respiratory acidosis after large intravascular volume infusion of lactated ringer’s solution during major spine surgery. Anesthesia and analgesia 2002;95:294-8.

Contribution of various metabolites to the “unmeasured” anions in critically ill patients with metabolic acidosis
Miriam Moviat, Anniek Terpstra, Wim Ruitenbeek, Leo A.J. Kluijtmans, Peter Pickkers, Hans van der Hoeven
Crit Care Med 2008; 36:752–758
Chapter 3

36 37
CHAPTER 3 CONTRIBUTION OF VARIOUS METABOLITES TO THE SIG IN CRITICALLY ILL ACIDOTIC PATIENTS
3Introduction
Metabolic acidosis is the most frequently observed acid-base disorder occurring in the intensive care unit (ICU)1. The physicochemical approach described by Stewart provides a precise way of quantifying metabolic acidosis and gives insight into the main underlying mechanisms2,3. This approach states that changes in blood pH are regulated by three independent variables: partial pressure of carbon dioxide (PaCO2), strong ion difference and total weak acid concentrations 4,5. PaCO2 determines the pH by chemical equilibrium and is dependent on alveolar ventilation and metabolic CO2 production. The apparent strong ion difference (SIDapp) is the difference between the sum of all measured strong cations and strong anions. The effective strong ion difference (SIDeff) represents the effect of the weak acids albumin and inorganic phosphate on the balance of electrical charges in plasma. The difference between the calculated SIDapp and SIDeff constitutes the strong ion gap (SIG). Obviously, this calculated SIG is only an estimation of the real strong ion gap as only the most abundant ions are measured and used for its calculation. In healthy humans the SIG equals zero. In critically ill patients a high SIG, defined as >2 mEq/L 6, indicates the accumulation of ‘unmeasured’ anions in blood as a cause of acidosis. There is a strong correlation between the SIG and the albumin and lactate corrected anion gap7. Lactic acidosis has clearly been associated with increased mortality in critically ill patients8 and recent studies suggest that the presence of a high SIG is associated with adverse outcome as well9,10. Many studies have highlighted the presence of ‘unmeasured’ anions in critically ill patients, but only few have attempted to address their chemical nature. Rarely, high concentrations of pyroglutamic acid cause SIG acidosis11,12. ‘Balanced’ fluids used during cardiopulmonary bypass13 and colloids containing gelatin are known to elevate the SIG14. Recently, intermediates of the tricarboxylic acid cycle (TCA cycle) have been proposed to contribute to the generation of a high SIG and (corrected) anion gap15.
Considering the diversity of diseases associated with an increased SIG or (corrected) anion gap like sepsis16, hepatic dysfunction2,11,12, (cardiogenic) shock17 and renal failure3, the nature of the ‘unmeasured’ anions is likely to cover a broad spectrum. We hypothesized that organic acids, amino acids and uric acid might explain a significant part of the SIG, because most of these compounds are negatively charged at physiological pH. Insight into the nature of the SIG may help clinicians to clarify the cause of metabolic acidosis in their severely ill patients. The present explorative study intended to estimate the contributions of amino acids, uric acid and organic acids to the increased SIG in critically ill patients with a metabolic acidosis. Considering the strong correlation between SIG and the more traditional (albumin and lactate corrected) anion gap, the results of this study apply to both.
Summary
Objective The physicochemical approach, described by Stewart to investigate the acid-base balance, contains the strong ion gap (SIG), a quantitative measure of ‘unmeasured’ anions, which strongly correlates to the corrected anion gap. The chemical nature of these anions is for the most part unknown. We hypothesised that amino acids, uric acid and organic acids could contribute to the SIG.
Design Prospective observational study.
Setting Intensive Care Department of an academic hospital.
Patients Consecutive ICU patients (n=31) with metabolic acidosis, defined as a pH <7.35 and a base excess ≤-5 mmol/L.
Interventions A single arterial blood sample was collected.
Measurements The SIG was calculated and two groups were compared: patients with SIG ≤2 mEq/L and patients with SIG ≥5 mEq/L. ‘Unmeasured’ anions were examined by ion-exchange column chromatography, reverse-phase high performance liquid chromatography (HPLC) and gas chromatography/mass spectrometry (GC-MS) measuring amino acids, uric acid and organic acids respectively.
Main Results Comparison of patient characteristics of both SIG groups showed that age, gender, APACHE II, pH, base excess and lactate were not statistically significantly different. Renal insufficiency, sepsis and mortality were more prominent in the SIG ≥5 mEq/L group (n=12, median SIG=8.3 mEq/L). Concentrations of the anionic compounds aspartic acid, uric acid, succinic acid, pyroglutamic acid, p-hydroxyphenyllactic acid and the semi-quantified organic acid homovanillic acid were all statistically significantly elevated in the SIG ≥5 mEq/L group compared to the SIG ≤2 mEq/L group (n=8, median SIG=0.6 mEq/L). Overall, the averaged difference between both SIG groups in total anionic amino acids, uric acid and organic acids concentrations contributed to the SIG for respectively 0.07% (5 μEq/L, P=NS), 2.2% (169 μEq/L, P=0.021) and 5.6% (430 μEq/L, P=0.025).
Conclusions Amino acids, uric acid and organic acids together accounted for only 7.9% of the SIG in ICU patients with metabolic acidosis.

38 39
CHAPTER 3 CONTRIBUTION OF VARIOUS METABOLITES TO THE SIG IN CRITICALLY ILL ACIDOTIC PATIENTS
3for the concentrations of albumin (g/L) and phosphate (mmol/L), whereas PaCO2 is expressed in mmHg.
To determine the influence of ‘unmeasured’ anions to the increased SIG, patients were prospectively divided into 3 groups based on their SIG value (see Figure 1): SIG ≤ 2.0 mEq/L (the ‘low or normal SIG group’), 2.0 mEq/L < SIG < 5.0 mEq/L (the ‘intermediate SIG group’) and SIG ≥ 5.0 mEq/L (the ‘high SIG group’). With these SIG cut-off values we previously found that acidotic critically ill patients were approximately equally divided over the three SIG groups7. Subsequently, amino acids, uric acid and organic acids were measured (semi-)quantitatively in the low and high SIG groups. The relative contribution of the concentration of a measured anion to the SIG was calculated by dividing the ∆ mean measured anion concentration by the ∆ mean SIG concentration (∆SIG). In this calculation, ∆ represents the difference between the high and low (or normal) SIG groups.
Amino acid and uric acid analysisAmino acid determination was based on ion-exchange column chromatography, which was performed on an AminoTac JLC-500/V amino acid analyzer (JEOL Ltd., Tokyo, Japan), using lithium buffers and ninhydrin reagent. Plasma samples of 100 μL were applied in a standard procedure with aminoethylcystine as internal standard and commercial mixtures of amino acids for quantification. Uric acid concentrations were measured on a reverse-phase high-performance liquid chromatography (HPLC) system, applying detection by photodiode array absorbance. Hereby, WatersTM Alliance 2695 Separations Module and WatersTM 996 Photodiode Array Detector (Waters Corporation, Milford, MA, USA) were employed. Two buffers were
Materials and methods
PatientsThis study was conducted in the mixed medical and surgical intensive care unit of the Radboud University Nijmegen Medical Centre, The Netherlands. The local medical ethical committee allowed the study and waived the need for informed consent, since there was no interference with routine clinical care.
We studied 31 consecutive adult patients who were either admitted with a metabolic acidosis or who developed a metabolic acidosis during their stay in the ICU. Metabolic acidosis was defined as a pH < 7.35 and a standard base excess (SBE) ≤ -5 mmol/L. All patients had an arterial line in situ. Acute Physiology and Chronic Health Evaluation (APACHE) II data were collected for each patient for the first 24 hours after admission. Data of fluid intake and output and relevant medication were retrieved from patient charts. ‘Hyperchloremic’ acidosis is defined as a ratio of the plasma chloride to plasma sodium concentrations exceeding laboratory reference ranges > 0.7918. Lactic acidosis is defined as a lactate concentration >2.2 mmol/L. Acute renal failure (ARF) is defined as creatinine levels > 150 μmol/L and/or a 1.5-fold rise as compared to baseline values. All patients were followed up to determine their survival in the ICU.
MeasurementsIn each patient pH, partial pressures of oxygen and carbon dioxide (PaO2 and PaCO2) and concentrations of sodium, potassium, chloride, magnesium, calcium, lactate, creatinine, urea, phosphate and albumin were measured in a single arterial blood sample. Simultaneously, an arterial blood sample was collected in a 3 mL lithium heparin tube for analysis of ‘unmeasured’ anions. This sample was cooled on ice immediately, centrifuged at 4°C and 1500 g for 10 minutes and stored at -80°C until analysis.
CalculationsThe bicarbonate concentration was calculated using the Henderson-Hasselbalch equation (pH = 6.1 + log ([HCO3
-]/0.0301 PaCO2) and the SBE using the Siggaard- Andersen formulae. The apparent strong ion difference (SIDapp) was calculated using the formula SIDapp = [Na+] + [K+] + [Ca2+] + [Mg2+] - [Cl-] - [lactate-]. The effective strong ion difference (SIDeff) was calculated using the formula SIDeff = (2.46 x 10⁻⁸ x PaCO2 /10-pH) + ([albumin] x 0.123 x (pH – 0.631)) + ([phosphate] x (0.309 x pH – 0.469)). The SIG was calculated by subtracting the effective strong ion difference from the apparent strong ion difference: SIG = SIDapp – SIDeff
3. All above-mentioned concentrations are expressed in milliequivalents per liter, except
Figure 1 Unmeasured anions during metabolic acidosis.
pH<7.35 and BE ≤ –5n=31
SIG ≥ 5“high”n=12
SIG ≤ 2“low”n=8
2<SIG<5“intermediate”
n=11
Sepsis +n=6
Sepsis –n=6

40 41
CHAPTER 3 CONTRIBUTION OF VARIOUS METABOLITES TO THE SIG IN CRITICALLY ILL ACIDOTIC PATIENTS
3Results
Thirty-one patients were included in the study. Baseline clinical and acid-base-re-lated characteristics of the low and high SIG groups are shown in Table 1. Data of the intermediate SIG group (2.0 mEq/L < SIG < 5.0 mEq/L, n=11) are not shown. Both groups were comparable with respect to age, gender, APACHE II, blood pH and SBE. In the high SIG group incidence of sepsis and renal insufficiency was significantly higher and there was a trend towards higher mortality (P=0.068).
used: buffer 1: 75% 0.05 mol/L KH2PO4, 25% methanol and buffer 2: 98% 0.025 mol/L KH2PO4, 2% buffer 1. Sample volume was 50 μL plasma.
Organic acid analysisOrganic acids were quantified by comparing the obtained signal with a calibration curve of the pure compound. Some organic acids, for which no calibration curve had been obtained to allow quantification, were determined semi-quantitatively using the area under the curve. Organic acids were quantified by gas chromatography with flame-ionization detection (FID) on a HP 6890 Gas Chromatograph (Agilent, Amstelveen, The Netherlands) and a 8000 Top Gas Chromatograph and Trace Mass Spectrometer Plus (InterSciences Inc., Breda, The Netherlands) were used to verify the identity of all organic acids reported. The columns CP-Sil 8 CB and CP-Sil 19 CB (Varian Inc., Middelburg, The Netherlands) were utilized. For the analysis, 750 μL plasma was pre-treated by adding 100 μL internal standard (=3.8 mmol/L 4-phenylbutyric acid), 100 μL 15 mg/mL ascorbic acid and a few droplets of 10% HCl to set the pH between 1 and 2. This mixture was adjusted to a volume of 3 mL with SETH buffer (0.25 mol/L sucrose, 2 mmol/L EDTA, 10 mmol/L Tris and 5x10⁴ units heparin/L) and saturated with approximately 0.5 gram NaCl. Subsequently, this mixture was extracted twice with 12.5 mL ethylacetate each time, after which both ethylacetate fractions were combined for further work-up. The samples were dried and N,O-bis (trimethylsilyl) trifluroacetamide (BSTFA) plus 1% trimethylchlo-rosilane (TMCS) (Pierce, Etten-Leur, The Netherlands) and chloroform 1:1 were added for derivatisation (1 hr at 60°C). Samples were loaded onto the GC and GC-MS machines.
1H-NMR spectroscopyPlasma samples of 4 patients were subjected to 1H-nuclear magnetic resonance (proton NMR) spectroscopy as decribed before19 to analyse compounds not identified in the amino acid analysis. Additionally, 1H-NMR spectroscopy was used to quantify intermediates of the TCA cycle in these samples. The volume of the ultrafiltrate was 200 or 300 μL.
StatisticsConcentrations of the investigated acidic compounds were compared between the high and low SIG groups. In all cases the Mann-Whitney U test was applied for statistical significance (accepted at P<0.05), since the group sizes were relatively small. For nominal data the chi-square test was applied. Since this was an explorative study, we did not correct for multiple testing. The median (Md) and interquartile range (IQR: 25th percentile–75th percentile) were used to summarize the data.
Table 1 Baseline clinical and acid-base-related characteristics of ICU patients with metabolic acidosis divided according to their SIG
SIG ≤2.0 μEq/L(n=8)
SIG ≥5.0 μEq/L (n=12)
Median (interquartile range)*
Median (interquartile range)*
P value
SIG, mEq/L 0.9 (0.04–1.59) 7.3 (5.62–9.61) <0.001a
Age, years 64.9 (31.9–75.5) 68.4 (57.5–74.6) 0.671
Male gender, n (%) 6 (75) 7 (58) 0.444
APACHE II 19 (16–25) 23 (20–29) 0.131
Mortality, n (%) 0 (0) 4 (33) 0.068
Predicted death rate 0.31 (0.22–0.52) 0.46 (0.34–0.68) 0.131
ARF, n (%) 0 (0) 9 (75) 0.006a
Sepsis, n (%) 0 (0) 6 (50) 0.017a
pH 7.31 (7.26–7.35) 7.29 (7.22–7.33) 0.353
SBE, mmol/L -6.1 (-7.5– -5.5) -9.0 (-10.0– -5.8) 0.105
PaCO2, mm Hg 39 (36–46) 39 (32–43) 0.485
SIDapp, mEq/L 27.1 (25.1–29.1) 33.1 (30.6–35.6) 0.002a
Lactate, mmol/L 1.9 (1.3–2.5) 1.5 (1.0–2.5) 0.263
Albumin, g/L 18 (15–20) 15 (11–22) 0.416
Phosphate, mmol/L 1.04 (0.99–1.17) 1.79 (1.43–2.26) 0.009a
Plasma creatinine, μmol/L 84 (73–93) 217 (109–307) 0.006a
‘Hyperchloremia’, n (%) 8 (100) 11 (92) 0.402
Hyperlactatemia, n (%) 2 (25) 3 (25) 1.000
APACHE, Acute Physiology and Chronic Health Evaluation; ARF, acute renal failure; SBE, standard base excess; SIDapp, apparent strong ion difference. Data provided as median (interquartile range) unless otherwise noted. aStatistically significant.

42 43
CHAPTER 3 CONTRIBUTION OF VARIOUS METABOLITES TO THE SIG IN CRITICALLY ILL ACIDOTIC PATIENTS
3Amino acid analysisTable 2 shows the plasma amino acids concentrations in the high and low SIG groups expressed in μmol/L. The total amino acids concentration is defined as the sum of single amino acid concentrations per patient. Aspartic acid, isoleucine and ornithine showed statistically significantly higher concentrations in the high SIG group compared to the low SIG group. The tryptophan concentration was significantly lower in the high SIG group. At physiological pH aspartic acid and glutamic acid are monovalent anions. The other amino acids have either no or a positive charge in blood (http://research.chem.psu.edu/brpgroup/pKa). Aspartic acid and glutamic acid together contributed 0.07% to the ∆SIG (7.7 mEq/L), as listed in Table 4.
Organic acid analysisTable 3 shows plasma concentrations of the most important organic acids (expressed in μmol/L) in the high and low SIG groups. The total organic acids concentration is defined as the sum of the listed single organic acids concentrations per patient. Concentrations of succinic acid, pyroglutamic acid and p-hydroxyphe-nyllactic acid were significantly elevated in the high SIG group compared to the low SIG group, but contributed each less than 0.2% to the ∆SIG. Total organic acids concentrations were significantly elevated in the high SIG group compared to the low SIG group and contributed 5.6% to the ∆SIG (see Table 4). In one patient, who was in a prolonged fasted state at ICU admission, a 3-hydroxybutyric acid concentration of 3.9 mmol/L was observed, which corresponded to 25% (3.9 mEq/L) of the SIG of this patient (15.9 mEq/L). No other organic acids concentrations of this magnitude were observed.
Semi-quantitative analysis of organic acidsAmong the semi-quantified organic acids homovanillic acid (P=0.022) was significantly elevated in the high SIG group compared to the low SIG group, whereas palmitic acid (P=0.025) and stearic acid (P=0.037) were significantly lower. There were no differences in the areas under the curve of several other components of the organic acid spectrum between both groups, for instance in patients to whom acetaminophen was administered (every patient in the low SIG group and to 6 out of 12 patients in the high SIG group).
Uric acid analysisConcentrations of monovalent uric acid (see Table 3) were significantly elevated in the high SIG group compared to the low SIG group and contributed 2.2% to the ∆SIG (see Table 4).
Table 2 Plasma amino acids concentrations (μmol/L) in ICU patients with metabolic acidosis divided according to their strong ion gap (SIG)
Amino acids SIG ≤2.0 μEq/L (n=8)
SIG ≥5.0 μEq/L (n=12)
Median (interquartile range)
Median (interquartile range)
P value
Taurine 36 (19-54) 36 (23-52) 0.817
Aspartic acid* 4 (3-4) 9 (5-12) 0.001c
Hydroxyproline 6 (3-9) 6 (4-14) 0.216
Threonine 85 (65-100) 80 (54-96) 0.817
Serine 52 (43-74) 48 (43-68) 0.643
Asparagine 41 (38-45) 45 (31-60) 0.817
Glutamic acid* 36 (23-49) 27 (17-60) 0.396
Glutamine 474 (429-614) 569 (446-637) 0.396
Proline 100 (74-151) 129 (95-218) 0.165
Glycine 135 (128-148) 176 (122-237) 0.190
Alanine 290 (236-328) 244 (153-307) 0.190
Citrulline** 17 (14-33) 23 (20-45) 0.097
Valine 165 (136-177) 183 (151-223) 0.190
Cystine 43 (32-57) 50 (35-105) 0.247
Methionine 15 (13-19) 17 (15-29) 0.334
Isoleucine 33 (27-40) 45 (38-61) 0.023c
Leucine 84 (70-91) 87 (81-123) 0.247
Tyrosine 54 (43-68) 57 (45-68) 0.758
Phenylalanine 63 (53-70) 84 (52-103) 0.190
Ornithine** 24 (18-44) 59 (44-82) 0.003c
Histidine 73 (57-93) 64 (57-76) 0.440
Lysine** 140 (128-161) 128 (114-168) 0.355
3-Methylhistidine 11 (5-20) 22 (12-28) 0.064
Tryptophan 22 (17-26) 13 (10-15) 0.002c
Arginine** 51 (38-71) 48 (40-68) 0.908
Total amino acids 1977 (1907-2616) 2336 (1828-2763) 0.537
Total anionic amino acids, μEq/L
39 (27-53) 35 (31-72) 0.643
The compounds are listed in the order of their elution time. Amino acid predominantly present in *monovalent anion form or in **monovalent cation form at pH 7.0-7.5. c statistically significant
44 45
CHAPTER 3 CONTRIBUTION OF VARIOUS METABOLITES TO THE SIG IN CRITICALLY ILL ACIDOTIC PATIENTS
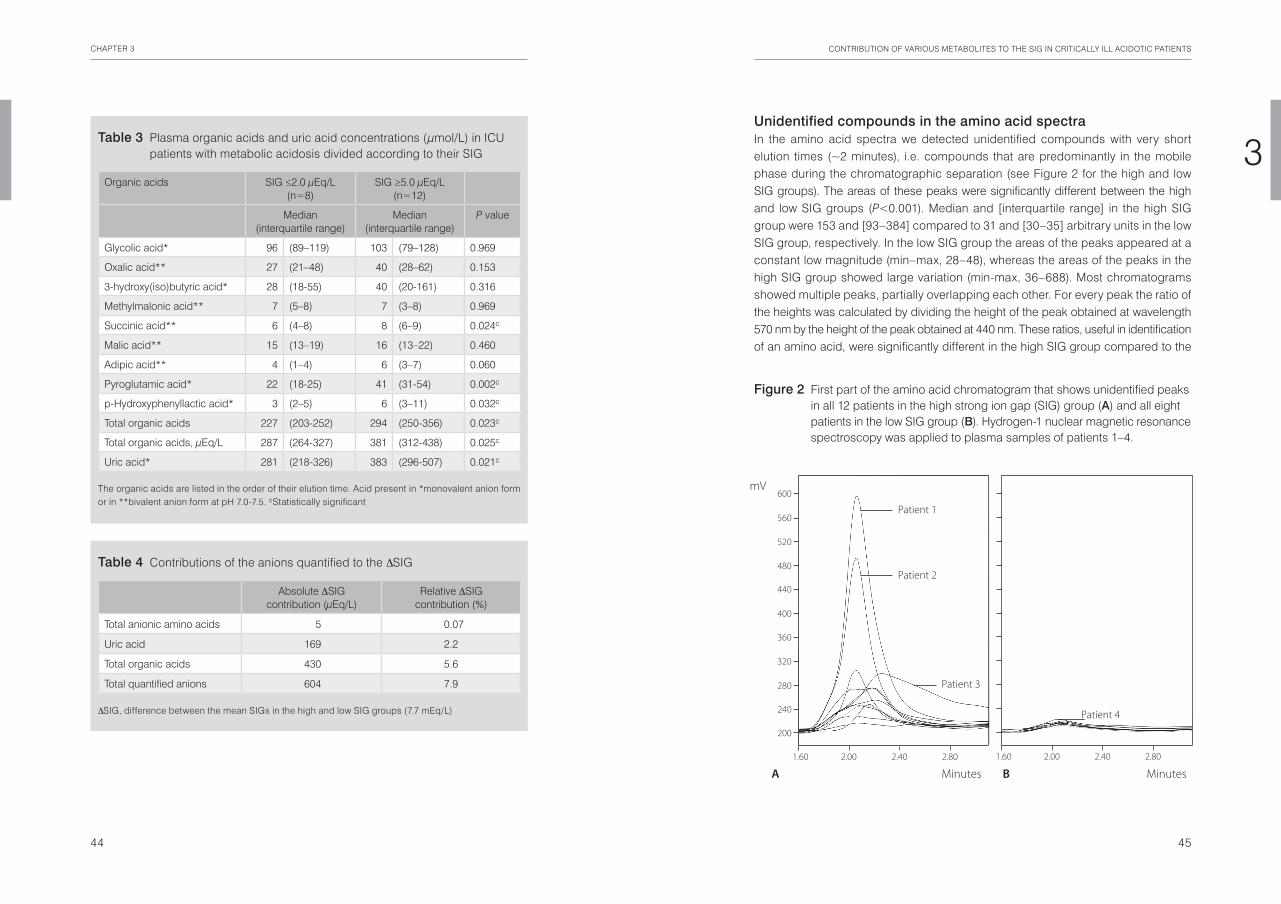
3Unidentified compounds in the amino acid spectraIn the amino acid spectra we detected unidentified compounds with very short elution times (~2 minutes), i.e. compounds that are predominantly in the mobile phase during the chromatographic separation (see Figure 2 for the high and low SIG groups). The areas of these peaks were significantly different between the high and low SIG groups (P<0.001). Median and [interquartile range] in the high SIG group were 153 and [93–384] compared to 31 and [30–35] arbitrary units in the low SIG group, respectively. In the low SIG group the areas of the peaks appeared at a constant low magnitude (min–max, 28–48), whereas the areas of the peaks in the high SIG group showed large variation (min-max, 36–688). Most chromatograms showed multiple peaks, partially overlapping each other. For every peak the ratio of the heights was calculated by dividing the height of the peak obtained at wavelength 570 nm by the height of the peak obtained at 440 nm. These ratios, useful in identification of an amino acid, were significantly different in the high SIG group compared to the
Table 3 Plasma organic acids and uric acid concentrations (μmol/L) in ICU patients with metabolic acidosis divided according to their SIG
Organic acids SIG ≤2.0 μEq/L (n=8)
SIG ≥5.0 μEq/L (n=12)
Median (interquartile range)
Median (interquartile range)
P value
Glycolic acid* 96 (89–119) 103 (79–128) 0.969
Oxalic acid** 27 (21–48) 40 (28–62) 0.153
3-hydroxy(iso)butyric acid* 28 (18-55) 40 (20-161) 0.316
Methylmalonic acid** 7 (5–8) 7 (3–8) 0.969
Succinic acid** 6 (4–8) 8 (6–9) 0.024c
Malic acid** 15 (13–19) 16 (13–22) 0.460
Adipic acid** 4 (1–4) 6 (3–7) 0.060
Pyroglutamic acid* 22 (18-25) 41 (31-54) 0.002c
p-Hydroxyphenyllactic acid* 3 (2–5) 6 (3–11) 0.032c
Total organic acids 227 (203-252) 294 (250-356) 0.023c
Total organic acids, μEq/L 287 (264-327) 381 (312-438) 0.025c
Uric acid* 281 (218-326) 383 (296-507) 0.021c
The organic acids are listed in the order of their elution time. Acid present in *monovalent anion form or in **bivalent anion form at pH 7.0-7.5. cStatistically significant
Table 4 Contributions of the anions quantified to the ∆SIG
Absolute ∆SIG contribution (μEq/L)
Relative ∆SIG contribution (%)
Total anionic amino acids 5 0.07
Uric acid 169 2.2
Total organic acids 430 5.6
Total quantified anions 604 7.9
∆SIG, difference between the mean SIGs in the high and low SIG groups (7.7 mEq/L)
Figure 2 First part of the amino acid chromatogram that shows unidentified peaks in all 12 patients in the high strong ion gap (SIG) group (A) and all eight patients in the low SIG group (B). Hydrogen-1 nuclear magnetic resonance spectroscopy was applied to plasma samples of patients 1–4.
360
280
320
240
200
440
400
600
560
520
480
Minutes Minutes
2.40 1.60 2.00 2.80 2.40 1.60 2.00 2.80
mV
A B
Patient 1
Patient 2
Patient 4
Patient 3

46 47
CHAPTER 3 CONTRIBUTION OF VARIOUS METABOLITES TO THE SIG IN CRITICALLY ILL ACIDOTIC PATIENTS
3
Concentrations of p-hydroxyphenyllactic acid were significantly increased in the presence of sepsis: median [interquartile range] 11 [7–11] vs. 4 [2–5] μmol/L, P=0.016. Concentrations (in μmol/L) of other metabolites were significantly decreased in septic patients compared to patients without sepsis in the high SIG group: glutamic acid (19 [12–27] vs. 49 [28–87], P=0.016), glycolic acid (86 [78–103] vs. 120 [100–149], P=0.037) and adipic acid (4 [2–5] vs. 7 [5–9], P=0.043).
To determine whether or not the above-mentioned metabolites contributed to the SIG, septic patients were compared to patients of the low SIG group. Note that none of the patients in the low SIG group suffered from sepsis. Concentrations of p-hydroxyphenyllactic acid (P=0.005) were significantly higher in patients with sepsis in the high SIG group compared to patients in the low SIG group and contributed 0.09% to the ∆SIG in these patients, corresponding to 6 μEq/L.
Furthermore, in the organic acid profile we observed a peak, co-eluting with the TCA cycle intermediate fumaric acid, that, by mass-spectrometric analysis, could
low SIG group (Md [IQR]): 1.9 [1.4–3.3] to 0.9 [0.7–1.0], respectively, with P=0.001, which suggests different ninhydrin-positive compounds in both groups. These ratios and elution times did not match with the parameters of any known amino acid or other known ninhydrin-positive compound. The quantitative contribution of the unidentified compounds to the ∆SIG could be estimated roughly by comparing their signal to the signal of amino acids reacting well or poorly with ninhydrin. For this aim glycine and sarcosine were used, respectively, to obtain a range of the ∆SIG contribution of the unidentified compounds. Accordingly, the estimated contribution of these unidentified compounds to ∆SIG ranged from 0 to 1.7% (132 μEq/L) in case of monovalent anions.
1H-NMR spectroscopyIn an attempt to identify some of the unknown peaks plasma samples of 4 selected patients (assigned as ‘Patient 1’ to ‘Patient 4’, see Figure 2) were subjected to 1H-NMR analysis. Selection of these patients was based on the shape and size of their unknown peaks in the amino acid chromatogram. Both ‘Patient 1’ and ‘Patient 2’ of the high SIG group (SIG: 10.0 and 6.8 mEq/L respectively) showed a large peak in the amino acid spectrum, each probably reflecting a single compound (area, ratio, retention time (RT): 688, 3.6, 2.06 min and 483, 3.0, 2.05 min, respectively). Figure 3 shows the 1H-NMR spectrum of ‘Patient 1’. In this spectrum resonances of multiple, overlapping compounds between 1.2 and 1.08 parts per million (ppm) were observed, but could not be identified. Interestingly, ‘Patient 2’ also showed resonances of multiple, overlapping compounds between 1.2 and 1.08 ppm. These resonances were absent in the 1H-NMR spectrum of the control ‘Patient 4’ of the low SIG group (SIG: 0.5 mEq/L), who showed a small peak in the amino acid spectrum (area, ratio, RT: 34, 1.1, 2.08 min). In ‘Patient 3’ a very broad peak was observed, the composition of it could not be determined in the NMR analysis. No additional known compounds with high concentrations could be detected by 1H-NMR spectroscopy.
Various intermediates of the TCA cycle could be quantified. In all 4 plasma samples concentrations of trivalent citrate and isocitrate were less than 45 μEq/L, concentrations of bivalent alpha-ketoglutarate, fumarate and malate were less than 30 μEq/L and concentrations of bivalent succinate did not exceed 12 μEq/L.
Metabolites associated with the presence of sepsisIn order to explore the presence of ‘unmeasured’ anions specific for sepsis, concentrations of the investigated anionic compounds were compared between septic patients (n=6) and non-septic patients (n=6) in the high SIG group. Between these groups, serum creatinine concentrations were not statistically different (P=0.688).
Figure 3 Hydrogen-1 nuclear magnetic resonance spectrum of patient 1 that depicts resonances of multiple, overlapping, unidentified compounds, with chemical shifts between 1.2 and 1.08 ppm labeled as unknown. *1, mainly glucose; *2, pyruvic acid; *3, acetone; *4, threonine.
0.8 0.8 1.0 1.0 1.2 1.2 1.4 1.4 1.6 1.6 1.8 1.8 2.0 2.0 2.2 2.2 2.4 2.4 2.6 2.6 2.8 2.8 3.0 3.0 3.2 3.2 3.4 3.4 3.6 3.6 3.8 3.8 4.0 4.0 4.2 4.2 4.4 4.4 ppm
creatinine
creatine
creatinine
creatine
alanine
lactate
citric acid
glucose
lysine
glutamine
*1
lactate
acetate
valine
unknown
*2
*3
*4

48 49
CHAPTER 3 CONTRIBUTION OF VARIOUS METABOLITES TO THE SIG IN CRITICALLY ILL ACIDOTIC PATIENTS
3Total organic acids concentrations were significantly higher in the high SIG group and their relative contribution to the SIG was 5.6%. In our study, TCA cycle intermediate succinic acid was significantly elevated in the high SIG group as compared to the low SIG group, but accounted for only 0.07% of the increased SIG. This is in contrast to a recent publication that reports increased concentrations of intermediates of the TCA cycle in acidotic patients, which contributed on average 3 mEq/L to the (uncorrected) anion gap15. In that study, mean concentrations of succinic acid in the 4 patient groups ranged from 126 μEq/L to 358 μEq/L compared to 90 μEq/L in the healthy controls. Remarkably, in the control group, mean levels of succinic acid as well as concentrations of isocitrate and malate substantially exceeded reference ranges from literature20. The suggested explanation of the accumulation of TCA cycle intermediates by the mechanism of accelerated amino acid catabolism would imply distinct patterns of altered amino acid concentrations, which was not supported by the results of our study. Moreover, in our study, all intermediates of the TCA cycle quantified with 1H-NMR spectroscopy corresponded to the published reference ranges. Also, concentrations of isocitrate and citrate obtained by gas chromatography were not extremely elevated.
In our analysis of organic acids, that was limited to an analysis of compounds with a retention time of less than 30 minutes, we also observed the quantitatively most important fatty acids palmitic acid, stearic acid, oleic acid and linoleic acid. However, the relatively high pKa values of these fatty acids, ranging from 8.28-10.1521, preclude a significant contribution to the SIG.
SIG metabolic acidosis can be caused by exogenous compounds in administered fluids, medications and nutrients. The extent to which they contribute to the SIG is largely unknown. For example, gelatins, which are comprised of negatively charged polypeptides, are a known source of ‘unmeasured’ anions14. In our study, none of the patients were treated with gelatine-containing fluids. However, various drugs were administered to the patients in this study that may have contributed to the increased SIG. Many drugs derivatives will be detected in the organic acid analyses, but strongly polar components may remain in the water phase during extraction with ethylacetate. Anion-containing drugs like beta-lactam antibiotics, which are administered intravenously, are known to be responsible for SIG acidosis when they accumulate in blood due to decreased metabolic clearance. Several studies showed that pyroglutamic acidemia (5-oxoprolinuria) was associated with administration of acetaminophen and antibiotics like flucloxacillin, decreased liver function or glutathione reserve, sepsis and female sex12,22,23. Likely, this rare cause of SIG acidosis is multi-factorial. In our study, it is unlikely that the administration of acetaminophen is a major causal factor in the presence of an increased SIG, since
be attributed to an antibiotic or antibiotic-derived metabolite. This peak was only observed in 5 patients from the high SIG group who suffered from sepsis and were treated with different antibiotics.
Discussion
The objective of this study was to explore the nature of ‘unmeasured’ anions by using different chromatography and mass spectrometry techniques, which are able to detect hundreds of different compounds. In addition, 1H-NMR spectroscopy was performed in selected samples, because this technique can identify (and quantify) a large range of proton containing components. Despite this elaborate attempt only 7.9% of the difference in SIG between the low (or normal) and high SIG groups could be explained by the presence of high concentrations of amino acids, uric acid and organic acids in critically ill patients with metabolic acidosis. However, patients in the high SIG group indeed have significant abnormalities in concentrations of aminoacids and other organic acids as compared to patients in the low SIG group. Even though these abnormalities cannot quantitatively explain the differences in SIG, they do support the view that metabolic derangements exist in patients with high SIG. For example, concentrations of the amino acids aspartic acid, isoleucine and ornithine were significantly elevated in the high SIG group compared to the low SIG group. However, the sum of all the amino acid concentrations was not significantly different between the low and high SIG groups. At physiological blood pH, aspartic and glutamic acid are in their monovalent anion version and together contributed only 0.07% to the increased SIG. Their contribution in the low and high SIG groups was 43 and 49 μEq/L respectively. On the opposite site, the basic amino acids citrulline, ornithine, lysine and arginine, being monovalent cations at physiological blood pH, together contributed 253 and 289 μEq/L in the low and high SIG groups respectively. Thus, in our study, the amino acids did not contribute to the clarification of the SIG.
Strikingly, the amount of unidentified compounds with short elution time was obviously larger in the high SIG group. Not only the quantity but also the nature of the ninhydrine positive compounds seems to be different from that in the low SIG group. As these compounds elute very fast, they may contain a sulfo- or phospho-residue. Unfortunately, we were unable to identify these compounds by 1H-NMR investigation. These compounds may originate from an exogenous source like medication or be the result of altered metabolic pathways because of the underlying disease process or a tissue hypoxic state.

50 51
CHAPTER 3 CONTRIBUTION OF VARIOUS METABOLITES TO THE SIG IN CRITICALLY ILL ACIDOTIC PATIENTS
3Because our study aimed to identify ‘unmeasured’ anions in a general group of critically ill acidotic patients, we did not select patients with a special diagnosis or condition other than metabolic acidosis. This implies that a fairly large variety of different causes potentially determined the increase in SIG. Because of this heterogeneity, relevant elevations of one or more random compounds in one patient may go unnoticed. For example, an extremely high concentration of the ketone body 3-hydroxybutyric acid was only noticed in one patient. Nevertheless, no high concentrations were observed for any of the other quantified acids in any patient, which makes it unlikely that measured anions which would contribute substantially to the SIG were missed.
In conclusion, the present study demonstrates that amino acids, uric acid and organic acids together accounted for only 7.9% of the SIG in ICU patients with a metabolic acidosis. This study excludes many potent ‘unmeasured’ anions as major contributors of the SIG. The variety in significantly elevated anions in the presence of a high SIG may be indicative of several concomitant etiologies of strong ion gap metabolic acidosis.
no differences were found in acetaminophen levels between acetaminophen-treat-ed patients from the low and high SIG group. Also, although pyroglutamic acid levels in the high SIG group were significantly higher, their relative contribution to the SIG was limited, namely 0.2%. Probably, the pyroglutamic acidemia in our patients is explained by multiple factors like co-administered antibiotics and decreased glutathione reserve. In some individuals we observed a compound co-eluting with fumaric acid, which corresponds to an antibiotic or an antibiotic-derivative and was only detected in five patients from the high SIG group. The relative contribution of this compound to the SIG seems small (<0.5%), although the valency of this compound is unknown. It seems nevertheless unlikely that the antibiotics (or antibiotic-derivatives) contribute more than a few percent to the increased SIG.
Clinical and acid-base characteristics of patients in this study correspond well to those previously reported in literature. For example, in the high SIG group there was a significantly higher prevalence of sepsis and acute renal failure as compared with the low SIG group. This suggests that these conditions are associated with an increased production or decreased clearance of ‘unmeasured’ anions. Although we found p-hydroxyphenyllactic acid to be statistically significantly increased in patients with sepsis in the high SIG group as compared to patients in the low SIG group, this anion only accounted for 0.09% to the increased SIG. The association between a high SIG and renal insufficiency is well known and various so-called uremic compounds have been proposed to be responsible for the increase in SIG24. The analysis of organic acids in the present study excluded many uremic toxins, including orotic acid, oxalic acid, kynurenic acid and thymine, as major contributors to the increased SIG. Uric acid is a water soluble low molecular weight solute and potent uremic toxin, which was significantly elevated in the high SIG group compared to the low SIG group. As a single compound, uric acid was responsible for the largest relative contribution to the SIG, namely 2.2%. The content of positive charges caused by creatinine in its form of monovalent creatininium ions was higher in the high SIG group than the low SIG group (217 vs 84 μEq/L). The effect of these ‘unmeasured’ cations is a reduction of the relative contribution of the measured anions in our study to the SIG. Although our study is not designed to establish the prognostic value of the presence of a high SIG in acidotic ICU patients, the higher mortality in this group (33 vs 0%) is evident. This observation is in agreement with a recently published study10 that reports a better discriminating power of a high SIG (>5 mEq/L) for mortality than other established outcome predicters like lactate and Injury Severity Score.

52 53
CHAPTER 3 CONTRIBUTION OF VARIOUS METABOLITES TO THE SIG IN CRITICALLY ILL ACIDOTIC PATIENTS
3References
1. Gauthier PM, Szerlip HM. Metabolic acidosis in the intensive care unit. Critical care clinics 2002;18:289-308, vi.
2. Kellum JA, Kramer DJ, Pinsky MR. Strong ion gap: a methodology for exploring unexplained anions. Journal of critical care 1995;10:51-5.
3. Kellum JA. Clinical review: reunification of acid-base physiology. Crit Care 2005;9:500-7.4. Kellum JA. Determinants of blood pH in health and disease. Crit Care 2000;4:6-14.5. Stewart PA. Modern quantitative acid-base chemistry. Canadian journal of physiology and
pharmacology 1983;61:1444-61.6. Kellum JA. Closing the gap on unmeasured anions. Crit Care 2003;7:219-20.7. Moviat M, van Haren F, van der Hoeven H. Conventional or physicochemical approach in intensive
care unit patients with metabolic acidosis. Crit Care 2003;7:R41-5.8. Gunnerson KJ. Clinical review: the meaning of acid-base abnormalities in the intensive care unit part I
- epidemiology. Crit Care 2005;9:508-16.9. Dondorp AM, Chau TT, Phu NH, et al. Unidentified acids of strong prognostic significance in severe
malaria. Critical care medicine 2004;32:1683-8.10. Kaplan LJ, Kellum JA. Initial pH, base deficit, lactate, anion gap, strong ion difference, and strong ion
gap predict outcome from major vascular injury. Critical care medicine 2004;32:1120-4.11. Mizock BA, Belyaev S, Mecher C. Unexplained metabolic acidosis in critically ill patients: the role of
pyroglutamic acid. Intensive care medicine 2004;30:502-5.12. Dempsey GA, Lyall HJ, Corke CF, Scheinkestel CD. Pyroglutamic acidemia: a cause of high anion gap
metabolic acidosis. Critical care medicine 2000;28:1803-7.13. Liskaser FJ, Bellomo R, Hayhoe M, et al. Role of pump prime in the etiology and pathogenesis of
cardiopulmonary bypass-associated acidosis. Anesthesiology 2000;93:1170-3.14. Hayhoe M, Bellomo R, Liu G, McNicol L, Buxton B. The aetiology and pathogenesis of cardiopulmo-
nary bypass-associated metabolic acidosis using polygeline pump prime. Intensive care medicine 1999;25:680-5.
15. Forni LG, McKinnon W, Lord GA, Treacher DF, Peron JM, Hilton PJ. Circulating anions usually associated with the Krebs cycle in patients with metabolic acidosis. Crit Care 2005;9:R591-5.
16. Kellum JA, Bellomo R, Kramer DJ, Pinsky MR. Hepatic anion flux during acute endotoxemia. J Appl Physiol 1995;78:2212-7.
17. Makino J, Uchino S, Morimatsu H, Bellomo R. A quantitative analysis of the acidosis of cardiac arrest: a prospective observational study. Crit Care 2005;9:R357-62.
18. Durward A, Skellett S, Mayer A, Taylor D, Tibby SM, Murdoch IA. The value of the chloride: sodium ratio in differentiating the aetiology of metabolic acidosis. Intensive care medicine 2001;27:828-35.
19. Engelke UF, Kremer B, Kluijtmans LA, et al. NMR spectroscopic studies on the late onset form of 3-methylglutaconic aciduria type I and other defects in leucine metabolism. NMR in biomedicine 2006;19:271-8.
20. Hoffmann GF, Seppel CK, Holmes B, et al. Quantitative organic acid analysis in cerebrospinal fluid and plasma: reference values in a pediatric population. Journal of chromatography 1993;617:1-10.
21. Kanicky JR, Shah DO. Effect of degree, type, and position of unsaturation on the pKa of long-chain fatty acids. Journal of colloid and interface science 2002;256:201-7.
22. Croal BL, Glen AC, Kelly CJ, Logan RW. Transient 5-oxoprolinuria (pyroglutamic aciduria) with systemic acidosis in an adult receiving antibiotic therapy. Clinical chemistry 1998;44:336-40.
23. Pitt JJ, Hauser S. Transient 5-oxoprolinuria and high anion gap metabolic acidosis: clinical and biochemical findings in eleven subjects. Clinical chemistry 1998;44:1497-503.
24. Vanholder R, De Smet R, Glorieux G, et al. Review on uremic toxins: classification, concentration, and interindividual variability. Kidney international 2003;63:1934-43.

Impaired renal function is associated with greater urinary strong ion differences in critically ill patients with metabolic acidosis
Miriam Moviat, Anniek Terpstra, Hans van der Hoeven, Peter Pickkers
Journal of Critical Care 2012; 27(3): 255-260
Chapter 4

56 57
CHAPTER 4 IMPAIRED RENAL FUNCTION IS ASSOCIATED WITH GREATER URINARY STRONG ION DIFFERENCES
4Introduction
Metabolic acidosis is a frequent disorder in intensive care unit (ICU) patients that contributes to mortality1. The quantitative physicochemical approach to acid-base disorders originally described by Stewart2 states that ionic charge equivalence influences acid-base chemistry. The apparent strong ion difference (SIDapp) is the difference between the main strong cations and anions concentrations measured in plasma. The effective strong ion difference (SIDeff) is determined by the contribution of weak acids to the electrical charge equilibrium in plasma. The difference between the SIDapp and SIDeff, the strong ion gap (SIG), should equal zero. A positive value for the SIG indicates the presence of unmeasured strong anions. According to the Stewart approach, only 3 factors independently influence pH, namely, the SIDapp value, PaCO2, and the concentration of weak acids3,4. The factors that contribute to metabolic acidosis and are specific for acute renal failure (ARF) in ICU patients are lower SIDapp values, higher SIG values, and higher concentrations of the weak acid phosphate4. Applying the physicochemical principles of Stewart, the primary defense mechanism against acidosis in healthy subjects is increasing their SIDapp values by renal excretion of chloride without a strong cation4,5. The importance of this mechanism and how it is influenced by renal function in critically ill patients is unknown. We hypothesized that, in critically ill patients with renal dysfunction and metabolic acidosis, impaired urinary excretion of the strong anion chloride contributes to acidosis.
Methods
Study populationThis prospective observational study was conducted in a multidisciplinary ICU. The local medical ethical committee waived the need for informed consent. Sixty-five consecutive, adult, critically ill patients with a metabolic acidosis defined as pH less than 7.35 and base excess (BE) of −5 or less, present at admission or developed during their stay, were enrolled. Acute Physiology and Chronic Health Evaluation (APACHE) II data were collected for the first 24 hours after admission.
Fluid resuscitation was performed by discretion of the treating physician with isotonic saline or short-acting starch products (sodium and chloride concentration 154 mmol/L).
Summary
Purpose Urinary excretion of chloride corrects metabolic acidosis, but this may be hampered in patients with impaired renal function. We explored the effects of renal function on acid-base characteristics and urinary strong ion excretion using the Stewart approach in critically ill patients with metabolic acidosis.
Materials and Methods We examined the plasma and urine chemistry in 65 critically ill (mixed medical and surgical) patients with metabolic acidosis. The apparent strong ion difference, effective strong ion difference, strong ion gap, and urinary simplified strong ion difference (urinary SID) were calculated. Linear regression analyses were used (1) to assess whether plasma creatinine concentrations were related to urinary SIDs values, adjusted for blood pH levels, and (2) to determine whether urinary SID values were associated with blood pH levels.
Results Creatinine concentrations were positively and significantly (P<0 .001) associated with urinary SIDs values, adjusted for pH levels. Urinary simplified strong ion difference values were inversely and significantly (P<0 .001) related to pH levels.
Conclusions In critically ill patients with metabolic acidosis, impaired renal function was associated with greater urinary SIDs. Subsequently, the higher urinary SIDs values were related to lower pH levels, illustrating the importance of renal chloride excretion to correct for acidosis.

58 59
CHAPTER 4 IMPAIRED RENAL FUNCTION IS ASSOCIATED WITH GREATER URINARY STRONG ION DIFFERENCES
4log-transformed plasma creatinine concentration = ln(plasma creatinineconcen-tration − 34.0) and (b) the log-transformed blood pH level = −ln(−blood pH level + 7.35). In addition, we further adjusted the model for the potential confounders plasma SIDapp, plasma simplified SID, and plasma SIG values separately because they may be related to renal function and the urinary excretion of chloride.
To assess whether urinary SIDs values were related to blood pH levels, simple linear regression analysis was applied. The urinary SIDs values were natural log transformed to achieve a normal distribution using the lnskew0 function in Stata: –ln(–urinary SIDs value + 42.5). To characterize the relation between plasma creatinine concentrations and determinants of blood pH levels, the Spearman rank correlation (rS) was used. The relations were presented by box plots with plasma creatinine cutoff values of 100, 200, and 300 μmol/L, which we defined before conducting the analysis. In addition, multivariate linear regression analyses were used to examine whether creatinine concentrations were associated with SIDapp values independently of pH levels and, second, to assess whether creatinine concentrations were related to SIG values independently of the presence of sepsis.All analyses were performed with the use of Stata software, version 10.1 (StataCorp LP, College Station, Tex). P<0 .05 was considered statistically significant, and 2-sided tests of hypotheses were used throughout.
Results
Clinical characteristics and laboratory parametersThe characteristics of the ICU patients, with metabolic acidosis, are summarized in Table 1. Patients were aged between 17 and 90 years and APACHE II scores ranged from 7 to 43. Patients were predominantly diagnosed with sepsis. In Table 2 the laboratory parameters are presented. The difference between the 25th and 75th percentiles of the creatinine concentrations was approximately 140 μmol/L. In the logistic-regression analysis, concentrations of plasma creatinine were a positive predictor of sepsis (odds ratio per 140 μmol/L increase in creatinine values: 2.87; 95% confidence interval (CI): 1.36, 6.07; P<0.01).
Association between renal function and urinary simplified SID valuesIn the linear regression model of the urinary SIDs, the log transformed plasma creatinine concentrations (β coefficient: 16.6; 95% CI: 7.7, 25.5; P<0.001) were positively and significantly associated with urinary SIDs values, adjusted for log transformed blood pH levels. The correlation between the independent variables in the regression model did not reach statistical significance (P=0.06). Figure 1
MeasurementsIn each patient, a single arterial blood sample was collected. In this sample, pH, partial pressures of oxygen and carbon dioxide (PaO2 and PaCO2), and plasma concentrations of ionized calcium and lactate were measured on a blood gas analyzer (RapidLab; Bayer Diagnostics, Breda, The Netherlands). Plasma concentrations of sodium, potassium, and chloride were analyzed using an ion-selective electrode on an Aeroset (Abbott Diagnostics, Hoofddorp, The Netherlands); and plasma concentrations of magnesium, creatinine (in micromole per liter), urea, phosphate, and albumin were measured on an Aeroset. Bicarbonate was calculated using the Henderson-Hasselbalch equation (pH=6.1+log ([HCO3
–] /0.0301 PaCO2) and the standard base excess (SBE) using the Siggaard-Andersen formulae. The apparent (SIDapp = [Na+]+[K+]+[Ca2+]+[Mg2+]–[Cl–]–[lactate–]) and effective strong ion difference (SIDeff = (2.46 x 10⁻⁸ x PaCO2 /10-pH) + ([albumin] x 0.123 x (pH – 0.631)) + ([phosphate] x (0.309 x pH – 0.469)) and strong ion gap (SIG = SIDapp – SIDeff) were calculated.
In addition, the plasma simplified SID (plasma SIDs) was calculated: [Na+] −[Cl−] in plasma. All mentioned concentrations are expressed in milliquivalent per liter, except for the concentrations of albumin (gram per liter), phosphate (millimole per liter) and PaCO2 (millimeters of mercury).
The main urinary strong ions sodium and chloride were measured in a single urine sample on an Aeroset at the time of blood gas analysis. Subsequently, the urinary simplified strong ion difference (urinary SIDs) (milliequivalent per liter) was calculated: [Na+] − [Cl–].
Statistical analysisContinuous variables were described by the mean and SD or the median and interquartile range (IQR) for variables with skewed distributions. Logistic regression was used to estimate the association between plasma creatinine concentrations and sepsis status. Multivariate linear regression analysis was performed to determine whether plasma creatinine concentrations (the independent variable as a measure of renal function) were related to urinary SIDs values (as a measure of the net urinary charge excretion of the main strong ions sodium and chloride). The model was adjusted for the potential confounder blood pH level. We hypothesized lower pH levels to be related to declined renal function and, second, to increase renal chloride excretion to elevate the plasma SIDapp value and normalize the pH level6. To satisfy the statistical assumptions of the regression model, both independent variables were natural log transformed to achieve normal distributions using the lnskew0 function in Stata. This yielded the following equations: (a) the

60 61
CHAPTER 4 IMPAIRED RENAL FUNCTION IS ASSOCIATED WITH GREATER URINARY STRONG ION DIFFERENCES
4
Associations between creatinine concentrations and determinants of pH levelsCreatinine concentrations were positively associated with: plasma SIDapp values (rS=0.36; p<0.01), concentrations of the weak acid phosphate (rS=0.57; P<0.0001) and plasma SIG values (rS=0.50; P<0.0001; all in mEq/L). Box plots of these relations are shown in Figure 3. After adjusting for blood pH levels, creatinine concentrations remained positively and significantly related to SIDapp values, as estimated by the linear regression model. In the linear regression model of the plasma SIG, creatinine concentrations remained positively associated with SIG values (P<0.001), after adjustment for sepsis status (P=0.92). Furthermore, creatinine concentrations were inversely related to concentrations of plasma chloride (rS= −0.59; P<0.0001; mmol/L).
illustrates the relation between the measured creatinine and urinary SIDs values, and the estimated relation between these variables according to the regression model. After further adjusting the regression model for plasma SIDapp and plasma simplified SID values separately, the log transformed creatinine concentrations remained positively and significantly related to urinary SIDs values. Adjustment for plasma SIG values resulted in a borderline significant (P=0.07) positive association between log transformed creatinine concentrations and urinary SIDs values.
Association between urinary simplified SID values and pH levelsIn the linear regression model of blood pH, the log transformed urinary SIDs values (–0.090; 95% CI: –0.134, –0.046; P<0.001) were inversely and significantly related to pH levels. Figure 2 shows the relation between the measured urinary SIDs and pH values, and the estimated relation between these variables according to the regression model.
Table 1 Demographic, Clinical and Outcome Data of ICU Patients with Metabolic Acidosis
Variable n (%)
N 65
Age (yr)* 70 (57-75)
Sex [male] 35 (54%)
APACHE II score* 19 (16-26)
Mortality 21 (32%)
Diagnosis
Sepsis 24 (37%)
Trauma / bleeding 10 (15%)
Cardiogenic shock 14 (22%)
Surgical 10 (15%)
Other 7 (11%)
* Results of this variable are presented as median (interquartile range).
Table 2 Laboratory Parameters in ICU Patients with Metabolic Acidosis
Variable Median IQR Range
Creatinine (μmol/L) 153 92-234 50-602
pH 7.28 7.21- 7.31 6.91-7.34
SBE (mmol/L) −9 −11 to−6 −25 to −5
PaCO2 (mm Hg) 39 35-43 22-74
Sodium (mmol/L or mEq/L)* 138 ± 5 124-149
Potassium (mmol/L or mEq/L)* 4.2 ± 0.7 1.7-6.0
Chloride (mmol/L or mEq/L) 113 110-117 93-124
Lactate (mmol/L or mEq/L) 2.1 1.4-3.0 0.8 -11.8
SIDapp (mEq/L) 29 27-33 20-44
Albumin (g/L) 16 13-18 6-34
Phosphate (mmol/L) 1.1 1.0-1.7 0.4-2.7
SIDeff (mEq/L) 25 21-27 11-30
SIG (mEq/L) 5.6 3.7-8.0 −1.9 to 16.1
Urinary sodium (mmol/L or mEq/L) 51 20-85 5-168
Urinary chloride (mmol/L or mEq/L) 75 32-110 14-192
Urinary SIDs (mEq/L) −12 −29 to −3 −152 to 29
SBE indicates standard base excess * Results of this variable are presented as mean ± SD and range.

62 63
CHAPTER 4 IMPAIRED RENAL FUNCTION IS ASSOCIATED WITH GREATER URINARY STRONG ION DIFFERENCES
4Figure 1 Scatterplot of the measured plasma creatinine concentrations and
urinary simplified strong ion differences (SIDs) overlayed with the estimated relation between these variables according to the linear regression model, for blood pH levels of 7.16, 7.28 and 7.33, which are the 10th percentile, median and 90th percentile of the pH distribution, respectively. The point estimates of the associations and, for the median pH value, also the 95% CI limits of the point estimate are presented.
Figure 2 Scatterplot of the measured urinary simplified strong ion differences (SIDs) and blood pH levels, overlayed with the estimated relation between these variables according to the linear regression model. The relation is presented by the point estimate and its 95% CI limits. Only ICU patients with pH levels lower than 7.35 (see reference line) were included in the study.
−150
−100
−50
0
50
Urin
ary
SID
s (m
Eq
/L)
0 200 400 600
Plasma creatinine concentration (micromol/L)
Observed dataEstimated relation, using regression estimates:Upper limit of 95% CI, for pH [median] = 7.28Point estimate, for pH [p10] = 7.16Point estimate, for pH [median] = 7.28Point estimate, for pH [p90] = 7.33Lower limit of 95% CI, for pH [median] = 7.28
Legend:
6.8
7
7.2
7.4
7.6
Blo
od p
H le
vel
−150 −100 −50 0 50
Urinary SIDs (mEq/L)
Observed dataEstimated relation, using regression estimates:Upper limit of 95% CI of point estimatePoint estimateLower limit of 95% CI of point estimate
Legend:

64 65
CHAPTER 4 IMPAIRED RENAL FUNCTION IS ASSOCIATED WITH GREATER URINARY STRONG ION DIFFERENCES
4
Discussion
In this study, we examined the effect of renal function on urinary strong ion excretion and plasma acid-base status in critically ill patients with metabolic acidosis. In these patients, higher plasma creatinine concentrations were significantly associated with greater urinary simplified SID values. Subsequently, greater urinary SIDs values were significantly related to lower blood pH levels. Therefore, less urinary strong anion excretion during impaired renal function appears to represent a determinant of the metabolic acidosis in these patients.
The kidney plays a central role in the body’s handling of chloride and sodium. In normal subjects, 80% of the sodium filtered by the glomerulus is resorbed with chloride and 20% is exchanged for potassium and hydrogen which allows chloride clearance7. During metabolic acidosis the absolute renal chloride clearance (by co-excretion with NH4
+ produced by metabolism of glutamine) should increase6. In this way, every chloride ion filtered, but not reabsorbed, increases the plasma SID3 and subsequently corrects acidosis. Accordingly, in our sample, less strong anion excretion during impaired renal function is probably caused by impaired NH4
+
generation from glutamine metabolism. Thus, this probably reflects an inadequate
Figure 3 Box plots of A) plasma SIDapp values, B) concentrations of the weak acid phosphate, and C) plasma SIG values (all in mEq/L) for plasma creatinine concentration groups with cutoff values of 100, 200 and 300 μmol/L.
Figure 3 Continued.
20
25
30
35
40
45
SID
app (
mE
q/L
)
50−98 104−199 210−281 325−602
Plasma creatinine concentration (micromol/L)
A
1
2
3
4
5
Wea
k ac
id p
hosp
hate
(m
Eq
/L)
50−98 104−199 210−281 325−602
Plasma creatinine concentration (micromol/L)
B
0
5
10
15
SIG
(m
Eq
/L)
50−98 104−199 210−281 325−602
Plasma creatinine concentration (micromol/L)
C

66 67
CHAPTER 4 IMPAIRED RENAL FUNCTION IS ASSOCIATED WITH GREATER URINARY STRONG ION DIFFERENCES
4renal chloride excretion in response to acidosis. This was previously described in patients with chronic renal failure and distal renal tubular acidosis8, but to our knowledge, not in critically ill patients in relation to renal function.
Theoretically, the significantly greater urinary SIDs values in relation to declined renal function in our study may also partly reflect greater renal excretion of unmeasured anions, as higher plasma SIG values (as a result of extra renal causes such as sepsis or keto-acidosis) may result in more negatively charged glomerular filtrates because of filtered unmeasured anions. As a result, the excretion of chloride ions may be hampered for a given renal function. However, our observation of higher SIG values in association with impaired renal function is most likely the consequence of an attenuated urinary excretion of unmeasured anions. Therefore, it appears unlikely that unmeasured anions in the urine account for the impaired urinary excretion of chloride in patients with impaired renal function. In addition, the confounding effect of the plasma SIG was assessed and only slightly attenuated the estimated effect of renal function on the urinary SIDs in our sample.
Quantitative plasma analysis of the variables that independently determine the pH level revealed two other points. First, the significantly higher SIG and weak acid phosphate values in patients with higher creatinine concentrations accounted for a greater acidifying effect. This finding is consistent with a previous report that compared ICU patients with acute renal failure with ICU controls without ARF4. As discussed above, the significantly greater SIG values in association with declined renal function in our study may be explained by a decreased renal clearance of unmeasured anions. A possible candidate is sulphate, as described in prior studies9,10. Although sepsis has been associated with the appearance of strong ions in several reports11,12, in our study, the presence of sepsis was not associated with higher SIG values for a given creatinine concentration. This may indicate that increased plasma SIG values in ICU patients with sepsis are primarily caused by impaired renal function. Second, plasma SIDapp values were significantly higher in patients with declined renal function. Still, the SIDapp values in our study sample (range: 20 to 44 mEq/L) were lower than SIDapp values reported in non-acidotic ICU controls (mean ± SD: 45±4 mEq/L)4 and SIDapp values in normal subjects (42±2 mEq/L)12. As higher levels of plasma SIDapp and simplified SID may in itself increase the urinary SIDs value, the relation between plasma creatinine and urinary SIDs
values was adjusted for the plasma SIDapp and simplified SID values separately, in addition to the adjustment for pH levels. The correction for plasma simplified SID values only slightly attenuated the estimated effect of renal function on urinary SIDs values. However, adjustment for SIDapp values did not alter the relation to a relevant extent.
Our observation of significantly higher plasma SIDapp values and significantly lower plasma chloride concentrations in relation to declined renal function can only be explained by a less liberal fluid policy in patients with elevated creatinine concentrations, given their impaired chloride excretion. No specific protocol for fluid treatment was prescribed and balanced solutions were not used at the time. Our study was not aimed at addressing the effects of volume and composition of fluid therapy on acid-base chemistry in relation to renal function. Therefore, data on fluid, sodium and chloride intake and output were not recorded.
Two other limitations of our study should be addressed. First, we defined renal function as a single measurement of the plasma creatinine concentration and not as the actual glomerular filtration rate (GFR). However, the logarithmic relation between urinary SIDs values and creatinine concentrations resembles the relation between GFR and creatinine concentrations. This suggests a linear relation between GFR and the renal capacity to excrete strong anions. Second, we defined the urinary simplified SID as the difference between urinary sodium and chloride concentrations, not taking into account other electrolytes in the urine. We feel this simplification is justified, because sodium and chloride are the most abundant strong ions in the extracellular compartment and, therefore, the most important determinants of the strong ion difference13,14. Because plasma sodium controls intravascular volume and osmolality and given that plasma potassium is important for cardiac and neuromuscular function, plasma chloride appears to represent the strong ion that the kidney uses to regulate acid-base status without interfering with other important homeostatic processes. In accordance, using urinary chloride alone instead of the urinary simplified SID in examining the effect of renal function on urinary chloride excretion yielded similar results (data not shown). Despite these limitations, to our knowledge, our study is the first to examine urinary strong ion excretion and acid-base status in relation to renal function in critically ill patients.In conclusion, declined renal function was associated with greater urinary simplified strong ion differences in critically ill patients with metabolic acidosis. Subsequently, higher urinary simplified SID values were associated with lower blood pH levels. This may suggest that in critically ill patients with metabolic acidosis impaired renal function is related to the urinary excretion of inadequate amounts of plasma chloride to correct for acidosis. Accordingly, chloride loading by means of massive unbalanced volume resuscitation may lead to more pronounced acidosis in these patients.
68 69
CHAPTER 4 IMPAIRED RENAL FUNCTION IS ASSOCIATED WITH GREATER URINARY STRONG ION DIFFERENCES
4References
1. Moviat M, van Haren F, van der Hoeven H. Conventional or physicochemical approach in intensive care unit patients with metabolic acidosis. Crit Care 2003;7:R41-5.
2. Stewart PA. Modern quantitative acid-base chemistry. Canadian journal of physiology and pharmacology 1983;61:1444-61.
3. Kellum JA. Determinants of blood pH in health and disease. Crit Care 2000;4:6-14.4. Rocktaeschel J, Morimatsu H, Uchino S, et al. Acid-base status of critically ill patients with acute renal
failure: analysis based on Stewart-Figge methodology. Crit Care 2003;7:R60.5. Ring T, Frische S, Nielsen S. Clinical review: Renal tubular acidosis--a physicochemical approach. Crit
Care 2005;9:573-80.6. Koeppen BM. The kidney and acid-base regulation. Advances in physiology education 2009;33:275-81.7. Koch SM, Taylor RW. Chloride ion in intensive care medicine. Critical care medicine 1992;20:227-40.8. Kim GH, Han JS, Kim YS, Joo KW, Kim S, Lee JS. Evaluation of urine acidification by urine anion gap
and urine osmolal gap in chronic metabolic acidosis. American journal of kidney diseases : the official journal of the National Kidney Foundation 1996;27:42-7.
9. Liborio AB, da Silva Alexandre C, Noritomi DT, Andrade L, Seguro AC. Impact of chloride balance in acidosis control: the Stewart approach in hemodialysis critically ill patients. Journal of critical care 2006;21:333-8.
10. Kirschbaum B. Sulfate regulation: native kidney vs dialysis. The International journal of artificial organs 1999;22:591-2.
11. Moviat M, Terpstra AM, Ruitenbeek W, Kluijtmans LA, Pickkers P, van der Hoeven JG. Contribution of various metabolites to the “unmeasured” anions in critically ill patients with metabolic acidosis. Critical care medicine 2008;36:752-8.
12. Noritomi DT, Soriano FG, Kellum JA, et al. Metabolic acidosis in patients with severe sepsis and septic shock: a longitudinal quantitative study. Critical care medicine 2009;37:2733-9.
13. Story DA, Morimatsu H, Bellomo R. Strong ions, weak acids and base excess: a simplified Fencl-Stewart approach to clinical acid-base disorders. British journal of anaesthesia 2004;92:54-60.
14. Durward A, Skellett S, Mayer A, Taylor D, Tibby SM, Murdoch IA. The value of the chloride: sodium ratio in differentiating the aetiology of metabolic acidosis. Intensive care medicine 2001;27:828-35.

Stewart approach of metabolic alkalosis in the ICU
Part II

Acetazolamide-mediated decrease in strong ion difference accounts for the correction of metabolic alkalosis in critically ill patients
Miriam Moviat, Peter Pickkers, Hans van der Hoeven.
Critical Care 2006, 10:R14
Chapter 5

74 75
CHAPTER 5 ACETAZOLAMIDE-MEDIATED DECREASE IN STRONG ION DIFFERENCE CORRECTS METABOLIC ALKALOSIS
5Introduction
Metabolic alkalosis is a common acid–base disturbance in the intensive care unit (ICU) that is associated with increased ICU mortality and morbidity1,2, with adverse effects on cardiovascular, pulmonary and metabolic function3,4. Additionally, such patients are characterized by compensatory alveolar hypoventilation, which can result in delayed weaning from mechanical ventilation. Options for treatment aimed at correcting metabolic alkalosis are fluid and potassium replacement, and administration of ammonium chloride, hydrochloric acid, or acetazolamide5. These therapeutic interventions potentially increase minute ventilation, allowing patients to be weaned more rapidly6.
An advanced understanding of acid–base physiology is central to the practice of critical care medicine. Although it is not difficult to quantify the degree of metabolic alkalosis, it is more challenging to identify the cause of a metabolic alkalosis and determine the actions that must be taken to correct it. The method of quantifying and qualifying an acid–base disturbance, as described by Stewart, relies on the accepted physicochemical principles of conservation of mass and electroneutrali-ty7,8. According to Stewart, three variables independently determine the serum hydrogen concentration. These variables are the partial carbon dioxide tension (PaCO2), the total concentration of nonvolatile weak acids (primarily serum proteins and phosphate), and the apparent strong ion difference (SIDapp)9. The Stewart approach, in contrast to other approaches, allows us to quantify an acid–base derangement as well as determine its cause.
The kidneys are the most important regulators of SIDapp for acid–base purposes. The concentration of strong ions in plasma can be altered by adjusting absorption from glomerular filtrate or secretion into the tubular lumen from plasma. In this respect, administration of the carbonic anhydrase inhibitor acetazolamide during metabolic alkalosis could modulate plasma pH by influencing the urinary excretion of various strong ions. Because plasma sodium controls intravascular volume and osmolality, and because plasma potassium is important for cardiac and neuromuscular function, plasma chloride appears to represent the strong ion that the kidney uses to regulate acid–base status without interfering with other important homeostatic processes7. Furthermore, the basic physicochemical principles imply that a change in bicarbonate concentration is not a cause but merely a co-phenomenon of an acid–base disturbance such as metabolic alkalosis.
Summary
Introduction Metabolic alkalosis is a commonly encountered acid-base derangement in the ICU. Treatment with the carbonic anhydrase inhibitor acetazolamide is indicated in selected cases. According to the quantitative approach described by Stewart, correction of serum pH due to carbonic anhydrase inhibition in the proximal tubule cannot be explained by excretion of bicarbonate. Using the Stewart approach, we studied the mechanism of action of acetazolamide in critically ill patients with a metabolic alkalosis.
Methods Fifteen consecutive ICU patients with metabolic alkalosis (pH ≥ 7.48 and HCO3 ≥ 28 mmol/l) were treated with a single administration of 500 mg acetazolamide intravenously. Serum levels of strong ions, creatinine, lactate, weak acids, pH and PaCO2 were measured at 0, 12, 24, 48 and 72 hours. Main strong ions of the urine and pH were measured at 0, 3, 6, 12, 24, 48 and 72 hours. Apparent strong ion difference (SIDapp), strong ion gap, sodium-chloride effect and the urinary SID were calculated. Data were analyzed by comparing baseline variables and the time dependent changes by one way analysis of variance for repeated measures.
Results After a single administration of acetazolamide, correction of serum pH (from 7.49 ± 0.01 to 7.46 ± 0.01; P=0.001) was maximal at 24 hours and sustained during the period of observation. The parallel decrease in partial carbon dioxide tension was not significant (from 5.7 ± 0.2 to 5.3 ± 0.2 kPa; P= 0.08) and there was no significant change in total concentration of weak acids. Serum SIDapp decreased significantly (from 41.5 ± 1.3 to 38.0 ± 1.0 mEq/l; P= 0.03) due to an increase in serum chloride (from 105 ± 1.2 to 110 ± 1.2 mmol/l; P< 0.0001). The decrease in serum SIDapp was explained by a significant increase in the urinary excretion of sodium without chloride during the first 24 hours (increase in urinary SID: from 48.4 ± 15.1 to 85.3 ± 7.7; P= 0.02).
Conclusions A single dose of acetazolamide effectively corrects metabolic alkalosis in critically ill patients by decreasing the serum SIDapp. This effect is completely explained by the increased renal excretion ratio of sodium to chloride, resulting in an increase in serum chloride.

76 77
CHAPTER 5 ACETAZOLAMIDE-MEDIATED DECREASE IN STRONG ION DIFFERENCE CORRECTS METABOLIC ALKALOSIS
5Experimental designWe measured pH, arterial oxygen tension, arterial PCO2 (PaCO2), sodium, potassium, chloride, magnesium, calcium, lactate, creatinine, urea, phosphate and albumin in a single arterial blood sample before acetazolamide was administered (t = 0) and 12, 24, 48 and 72 hours later (t = 12, t = 24, t = 48 and t = 72). Urine samples were taken before acetazolamide was administered, and 3, 6, 12, 24, 48 and 72 hours later. In these samples pH was measured immediately. Urine was stored at -80°C, and sodium, chloride, potassium and creatinine were measured in a single batch at the end of the study.
Data analysis, calculations and statisticsBicarbonate was calculated using the Henderson–Hasselbalch equation (pH = 6.1 + log [HCO3-]/0.0301 x PaCO2]) and the standard base excess was calculated using the Siggaard–Andersen formula. The apparent SID (SIDapp) was calculated using the equation SIDapp = [Na+] + [K+] + [Ca2+] + [Mg2+] - [Cl-] - [lactate-]. The effective SID (SIDeff) was calculated using the equation SIDeff = (2.46 x 10⁻⁸ x PaCO2 (mm Hg)/10-pH) + ([albumin in g/L] x 0.123 x (pH – 0.631)) + ([phosphate in mmol/L] x (0.309 x pH – 0.469)). The strong ion gap (SIG) was calculated using the equation SIG = SIDapp - SIDeff 10. The sodium–chloride effect was calculated using the formula [Na+]- [Cl-] - 3811. Urinary electrolytes to creatinine ratios and sodium to chloride ratios were calculated, as was the urinary SID using the following equation: urinary SID = [Na+] + [K+] - [Cl-].
The effects of acetazolamide were analyzed by comparing baseline variables and time-dependent changes using oneway analysis of variance with repeated measures. Power analysis was based on a presumed standard deviation of 15% for the measured end-points. A change of 10% was considered clinically relevant. With α = 0.05, we calculated that a sample size of 14 would be needed to achieve a power of 80%. Therefore, 15 patients were included.
Data are expressed as mean ± standard error unless otherwise specified. P< 0.05 was considered statistically significant.
Results
PatientsPatient characteristics are presented in Table 1, and baseline acid–base and electrolyte data are presented in Table 2. Of the patients studied, 87% were mechanically ventilated (all in an assisted mode of ventilation in which spontaneous breathing
Acetazolamide decreases proximal tubular bicarbonate reabsorption by up to 80% through inhibition of carbonic anhydrase in the luminal borders of renal proximal tubule cells, and it is often effectively used in the treatment of metabolic alkalosis in the ICU. However, the mechanism of action of acetazolamide remains unclear. According to the basic physicochemical principles mentioned above, retention of bicarbonate cannot causally be related to correction of serum pH, and acetazolamide- induced effects must be explained by modulation of the urinary excretion of strong ions.
We hypothesized that acetazolamide, by inhibiting carbonic anhydrase in the proximal tubules, causes excretion of strong cations (along with bicarbonate) and retention of chloride, and in this way decreases the serum SIDapp. Subsequently, the decrease in SIDapp will correct an alkalosis by causing dissociation of water and formation of hydrogen ions. The purpose of the present study was to determine the mechanism of action of acetazolamide in critically ill patients with a metabolic alkalosis according to the physicochemical principles described by Stewart.
Methods
PatientsThe local ethics committee granted approval for the study and, because the indication for acetazolamide was based on clinical grounds, waived the need for informed consent. This prospective study was set in the multidisciplinary ICU of theRadboud University Nijmegen Medical Centre, Nijmegen, The Netherlands.
We studied 15 consecutive ICU patients with a metabolic alkalosis (defined as pH ≥ 7.48) and serum bicarbonate of 28 mmol/L or greater. All patients had an arterial line in situ. Patients clinically suspected of having volume contraction (for example cold extremities, blood pressure increase during passive leg raising), hypokalaemia serum potassium ≤ 3.4 mmol/L), nasogastric tube drainage greater than 50 cc/hour, renal insufficiency (creatinine clearance <20 ml/min and/or renal replacement therapy), or intolerance or allergy to acetazolamide or sulfonamides were excluded. Also excluded were patients who were treated with intravenous acetazolamide or sodium bicarbonate during the previous 72 hours. Acute Physiology and Chronic Health Evaluation II score was calculated and recorded for each patient for the first 24 hours after admission. Data on fluid intake and output, ventilator settings, and relevant medications such as diuretics and steroids were also recorded. After inclusion, patients received a single dose acetazolamide (500 mg as an intravenous push).

78 79
CHAPTER 5 ACETAZOLAMIDE-MEDIATED DECREASE IN STRONG ION DIFFERENCE CORRECTS METABOLIC ALKALOSIS
5
P= 0.15; Figure 1). Serum SIDapp decreased significantly during the period of observation (from 41.5 ± 1.3 mEq/l to 38.0 ± 1.0 mEq/l; P= 0.03) because of an increase in serum chloride (from 105 ± 1.2 mmol/l to 110 ± 1.2 mmol/l; P< 0.0001, figure 2). There was a strong relation between the serum SIDapp and the sodium–chloride effect (R2= 0.99; P< 0.001), indicating that the observed changes in SIDapp are completely accounted for by changes in serum sodium and/or chloride and not other strong ions. The decrease in serum SIDapp was caused by a significant increase in the urinary excretion of sodium without chloride during the first 24 hours (change in urinary [Na]/[Cl]: from 1.3 ± 0.3 to 2.5 ± 0.5; P= 0.02), resulting in an increase in urinary SID (see Effects of acetazolamide on Stewart’s parameters in urine, below). In the patients studied here, there was no relevant SIG (mean baseline value 2.11 ± 0.81 mEq/L), and it exhibited no change after administration of acetazolamide (3.13 ± 0.48; P= 0.43).
activity was fully possible). Although 47% of the patients were treated with diuretics, none exhibited clinical symptoms of hypovolaemia. Furthermore, low urinary chloride excretion (< 20 mmol/l), which is indicative of hypovolaemia in patients who do not use diuretics, was present in only one patient.
Intravenous and enteral intake of sodium chloride, as well as ventilator settings and diuretic dose, were not changed during the study period.
Effects of acetazolamide on Stewart’s parameters in bloodAfter administration of acetazolamide, correction of serum pH (7.49 ± 0.01 to 7.46 ± 0.01; P= 0.001) was maximal at 24 hours and was sustained during the period of observation (Figure 1). The parallel decrease in PaCO2 was not significant (from 5.7 ± 0.2 to 5.3 ± 0.2 kPa; P= 0.08). There was no significant change in the total concentration of weak acids. When values of weak acids were expressed as values contributing to the electrical charge equilibrium in plasma (see formula for SIDeff), phosphate decreased from 2.14 ± 0.11 mEq/l to 1.94 ± 0.10 mEq/L (P= 0.02), and albumin remained unchanged (from 4.65 ± 0.30 mEq/l to 4.87 ± 0.35 mEq/L;
Table 1 Patient characteristics
Characteristic Value
Age (years; mean [range]) 67 (35-79)
Sex (male/female; n) 10/5
APACHE II score (mean [range]) 21 (12-30)
Mechanical ventilation (%) 87
Diuretics (%) 47
Standardized mortality ratio 0.57
Hospital mortality (%) 20
Diagnosis
Dissecting/ruptured aorta 2
Postoperative bleeding 2
Sepsis 4
Open heart surgery 4
Cardiogenic shock 1
Neurological disease 2
Shown are demographic data of all patients. APACHE: Acute Physiology and Chronic Health Evaluation
Table 2 Acid-base and electrolyte data
Acid-base and electrolyte data Baseline T=24
pH 7.49 (7.48-7.51) 7.46 (7.44-7.48)
PaCO2 (kPa) 5.7 (5.1-6.1) 5.3 (4.9–5.9)
Bicarbonate (mmol/L) 31.5 (29.5–33.7) 28.6 (26.3–30.3)
Sodium (mmol/L) 141 (139–145) 142 (139–145)
Potassium (mmol/L) 3.7 (3.7–4) 3.8 (3.4–3.9)
Chloride (mmol/L) 106 (102–107) 108 (107–110)
Creatinine (μmol/L) 64 (49–95) 65 (49–101)
Lactate (mmol/L) 1.4 (1.2–1.8) 1.5 (1.2–1.7)
Albumine (g/L) 16 (14–20) 17 (15–20)
SIDapp (mEq/L) 41.7 (39.1–44.0) 39.4 (36.4–41.4)
SIDeff (mEq/L) 39.0 (37.3–40.3) 35.6 (32.9–37.7)
SIG (mEq/L) 2.4 (1.5–4.4) 3.1 (2.1–4.8)
Sodium-chloride effect (Meq/L) -2.0 (-3.5 to +0.5) -3.0 (-7.5 to -1.5)
Shown are baseline acid–base and electrolyte data (median [interquartile range]) for 15 patients before administration of 500 mg acetazolamide (baseline) and after 24 hours (t = 24). The serum apparent SID (SIDapp) was calculated using the following equation: [Na+] + [K+] + [Ca2+] + [Mg2+] - [Cl-] - [lactate-]. The serum effective SID (SIDeff) was calculated using the equation SIDeff = (2.46 x 10⁻⁸ x PaCO2 (mm Hg)/10-pH) + ([albumin in g/L] x 0.123 x (pH – 0.631)) + ([phosphate in mmol/L] x (0.309 x pH – 0.469)). The strong ion gap (SIG) was calculated using the following equation: SIG = SIDapp - SIDeff . The sodium–chloride effect was calculated using the formula [Na+] - [Cl-] - 38. PaCO2: arterial carbon dioxide tension; SID: strong ion difference; SIG: strong ion gap.

80 81
CHAPTER 5 ACETAZOLAMIDE-MEDIATED DECREASE IN STRONG ION DIFFERENCE CORRECTS METABOLIC ALKALOSIS
5parallel increase (from 48.4 ± 15.1 to 85.3 ± 7.7; P= 0.02) during the first 12 hours and a parallel decrease thereafter.
Effects of acetazolamide on Stewart’s parameters in urineUrinary pH increased significantly from 5.55 ± 0.26 to 6.13 ± 0.37 (P= 0.005) during the first 12 hours after administration of acetazolamide, and returned to pre-administration value during the next 60 hours (Figure 3). Urinary SID exhibited a
Figure 1 Time course of acetazolamide-induced changes in pH and three independent variables that determine pH.
Figure 2 Time course of acetazolamide-induced changes in serum potassium, sodium and chloride.
Effect of 500 mg acetazolamide administration (intravenous) in patients with metabolic alkalosis. Data are expressed as mean ± standard error values for 15 patients. The P values refer to the time-dependent changes analyzed using one-way analysis of variance. PaCO2: partial carbon dioxide tension; SIDapp: apparent strong ion difference.
Effect of 500 mg acetazolamide administration (intravenous) in patients with metabolic alkalosis. Serum chloride exhibited a significant increase, whereas there were no significant changes in serum potassium and sodium concentration. Data are expressed as mean ± standard error values for 15 patients. The P values refer to the time-dependent changes analyzed using one-way analysis of variance.
7,44
7,46
7,48
7,50
0 12 24 48 72
5,0
5,4
5,8
14
16
18
0,50
0,75
1,00
1,25
1,50
36
38
40
42
44
PaC
O2
Albumin
SID
app
P=0.08
Phosphate
Time (hrs)
Wea
k ac
ids
pH
P=0.15
P=0.02
P=0.03
P=0.001
Time (hrs)
134 136 138 140 142 144 146
102
104
106
108
110
112
0 12 24 48 72
P<0.0001
P=0.27
3.5
4.0
4.5
P=NSSer
um P
otas
sium
(mm
ol/L
)S
erum
Sod
ium
(mm
ol/L
)S
erum
Chl
orid
e(m
mol
/L)

82 83
CHAPTER 5 ACETAZOLAMIDE-MEDIATED DECREASE IN STRONG ION DIFFERENCE CORRECTS METABOLIC ALKALOSIS
5of the Stewart approach comes from the fact that several variables are needed. However, when these variables are absent or assumed to be normal, the approach becomes essentially indistinguishable from the more traditional descriptive methods. For example, our study does not dispute the contention that acetazolamide, through inhibition of carbonic anhydrase in the proximal tubule, increases urinary bicarbonate excretion. However, according to the Stewart approach it is not the loss of bicarbonate that determines the fall in pH, because bicarbonate is not an independent parameter. According to Stewart, it is the change in SIDapp (due to a rise in chloride) that explains the decrease in pH. In our patients, acetazolamide-induced loss of bicarbonate facilitated the renal reabsorption of chloride, while sodium could still be excreted. In other words, acetazolamide-induced bicarbonate excretion permits urinary excretion of sodium without loss of any strong anions, resulting in a lower SIDapp and thereby a decrease in pH.
Apart from the acetazolamide-induced change in SIDapp, our study demonstrates that inhibition of carbonic anhydrase does not significantly alter the other independent determinants of serum pH. In contrast, the non-significant decrease in PaCO2 and small decrease in weak acid phosphate cause the opposite effect on serum pH. The small decrease in PaCO2 in our patients can be explained by an increase in minute ventilation in response to correction of serum pH by aceta-zolamide. This increase in minute ventilation, as a result of an increased respiratory drive, was possible in an assisted mode of mechanical ventilation. Finally, the observed small increase in serum albumin does not have a significant lowering effect on serum pH and could probably be explained by the hemo-concentrating effect of diuretics during the study period.
The acetazolamide-induced decrease in SIDapp is entirely caused by a change in serum concentration of chloride, as shown by the strong relation between the SIDapp and the sodium–chloride effect. These changes in sodium and chloride are explained by an increase in urinary sodium excretion (along with a weak anion) while chloride excretion is maintained, as shown by the increased urinary sodium–chloride ratios. The intravenous and enteral salt intake of patients was unchanged during the observation period. Thus, the renal effect of acetazolamide results in a relative increase in serum chloride. Because sodium and chloride are the most abundant and therefore the most important strong ions, an increase in chloride relative to sodium will have a significant lowering effect on serum SIDapp. Stewart proposed that H+ and therefore pH cannot change unless one or more of the three independent variables (PaCO2, weak acids, and SIDapp) change. Our study demonstrates that the acetazolamide-induced effects on pH are solely mediated by a decrease in serum SIDapp through renal excretion of sodium without chloride.
Discussion
Our study is the first to demonstrate that the acetazolamide-induced correction of metabolic alkalosis in critically ill patients can completely be accounted for by a significant decrease in serum SIDapp, using the physicochemical principles described by Stewart. Although analysis using the Henderson–Hasselbalch equation is useful for describing and classifying acid–base disorders, the physico-chemical approach described by Stewart is better suited to quantifying these disorders and for generating hypotheses regarding mechanisms.
Use of the Stewart model has improved our understanding of the pathophysiology that leads to changes in acid–base balance. SIDapp, total concentration of nonvolatile weak acids, and PaCO2 are biological variables that are regulated mainly by renal tubular transport, metabolism and ventilation. The relative complexity
Figure 3 Effect acetazolamide on urinary pH and sodium-chloride ratio.
Effect of 500 mg acetazolamide administration (intravenous) in patients with metabolic alkalosis. Data are expressed as mean ± standard error values for 15 patients. The P values refer to the time-dependent changes analyzed using one-way analysis of variance.
5
6
7
8
0 3 6 48 72 24 12
0
20
40
60
80
P<0.02
P<0.005
Time (hrs)
Urin
ary
SID
pH
urin
e
84 85
CHAPTER 5 ACETAZOLAMIDE-MEDIATED DECREASE IN STRONG ION DIFFERENCE CORRECTS METABOLIC ALKALOSIS
5increased renal excretion of sodium without chloride, resulting in an increase in serum chloride and a decrease in serum SIDapp.
Although the Stewart approach has proved to be valuable in critically ill acidotic patients12-14, this paper represents the first report using the Stewart approach during metabolic alkalosis.
Our study confirms previous reports in patients with metabolic alkalosis that, despite corrected fluid and electrolyte abnormalities, a single dose of acetazolamide is an effective and safe form of therapy, with a quick onset and long duration of action5,15. Our findings suggest that the duration of the pharmacologic effect of a single administration of 500 mg acetazolamide exceeds its serum half-life (6–8 hours). This long effect is reflected by the 24-hour duration of altered urinary sodium and chloride excretion. Furthermore, after normalization of serum pH at 24 hours, this correction was sustained although urinary electrolyte excretion and pH returned to pre-administration values. Apparently, once the serum SIDapp is corrected by acetazolamide because of the increased sodium excretion without a strong anion, this new equilibrium is maintained. The Stewart approach does not help us to explain the long-lasting effects of acetazolamide, and it is unclear how the new equilibrium is maintained after correction of the SIDapp and what the regulating mechanism is that induces the permanent hyperchloraemia. The pharmacokinetics of acetazolamide in tissue (not plasma) may explain this observation. Another explanation could be that the alkalizing factors that were originally present in our patients are corrected during the course of the observation period. Although clinical suspicion of a hypovolaemic state was an exclusion criterion in our study, one of the alkalizing factors could very well be some degree of volume contraction induced by the administration of diuretics. Whatever the cause, it is highly unlikely that the presence of some degree of hypovolaemia in our patients would influence our conclusions regarding the effects – as determined using the Stewart approach – of acetazolamide on metabolic alkalosis.
The SIG – indicative of the presence of unmeasured anions, which are often present in metabolic acidosis, particularly in patients with renal failure14 – was not found to be elevated in our study, as was expected. Furthermore, administration of aceta -zolamide had no influence on the SIG.
Conclusion
Our study is the first to report the mechanism by which acetazolamide-induced correction of metabolic alkalosis in critically ill patients is mediated. Applying the quantitative biophysical principles of acid–base analysis described by Stewart, theacetazolamide-induced effects on serum pH are completely accounted for by an

86 87
CHAPTER 5 ACETAZOLAMIDE-MEDIATED DECREASE IN STRONG ION DIFFERENCE CORRECTS METABOLIC ALKALOSIS
5References
1. Anderson LE, Henrich WL. Alkalemia-associated morbidity and mortality in medical and surgical patients. Southern medical journal 1987;80:729-33.
2. Hodgkin JE, Soeprono FF, Chan DM. Incidence of metabolic alkalemia in hospitalized patients. Critical care medicine 1980;8:725-8.
3. Krintel JJ, Haxholdt OS, Berthelsen P, Brockner J. Carbon dioxide elimination after acetazolamide in patients with chronic obstructive pulmonary disease and metabolic alkalosis. Acta anaesthesio-logica Scandinavica 1983;27:252-4.
4. Berthelsen P. Cardiovascular performance and oxyhemoglobin dissociation after acetazolamide in metabolic alkalosis. Intensive care medicine 1982;8:269-74.
5. Mazur JE, Devlin JW, Peters MJ, Jankowski MA, Iannuzzi MC, Zarowitz BJ. Single versus multiple doses of acetazolamide for metabolic alkalosis in critically ill medical patients: a randomized, double-blind trial. Critical care medicine 1999;27:1257-61.
6. Berthelsen P, Gothgen I, Husum B, Jacobsen E. Oxygen uptake and carbon dioxide elimination after acetazolamide in the critically ill. Intensive care medicine 1985;11:26-9.
7. Kellum JA. Determinants of blood pH in health and disease. Crit Care 2000;4:6-14.8. Stewart PA. Modern quantitative acid-base chemistry. Canadian journal of physiology and
pharmacology 1983;61:1444-61.9. Figge J, Rossing TH, Fencl V. The role of serum proteins in acid-base equilibria. The Journal of
laboratory and clinical medicine 1991;117:453-67.10. Kellum JA, Kramer DJ, Pinsky MR. Strong ion gap: a methodology for exploring unexplained anions.
Journal of critical care 1995;10:51-5.11. Story DA, Morimatsu H, Bellomo R. Strong ions, weak acids and base excess: a simplified
Fencl-Stewart approach to clinical acid-base disorders. British journal of anaesthesia 2004;92:54-60.12. Moviat M, van Haren F, van der Hoeven H. Conventional or physicochemical approach in intensive
care unit patients with metabolic acidosis. Crit Care 2003;7:R41-5.13. Dondorp AM, Chau TT, Phu NH, et al. Unidentified acids of strong prognostic significance in severe
malaria. Critical care medicine 2004;32:1683-8.14. Rocktaeschel J, Morimatsu H, Uchino S, et al. Acid-base status of critically ill patients with acute
renal failure: analysis based on Stewart-Figge methodology. Crit Care 2003;7:R60.15. Marik PE, Kussman BD, Lipman J, Kraus P. Acetazolamide in the treatment of metabolic alkalosis in
critically ill patients. Heart & lung : the journal of critical care 1991;20:455-9.

Stewart analysis of apparent normal acid base state in the ICU
Part III

Stewart analysis of apparent normal acid base state in the critically ill: a complex mixed acid base disorder or an adaptive response?
Miriam Moviat, Femke Intven, Mark van den Boogaard, Peter van der Voort, Hans van der Hoeven, Peter Pickkers
Submitted
Chapter 6

92 93
CHAPTER 6 STEWART ANALYSIS OF APPARENT NORMAL ACID BASE STATE IN THE CRITICALLY ILL
6Introduction
Acid base disorders, predominantly metabolic acidosis, are common in critically ill patients. Their impact on morbidity and mortality, depending on both severity and cause, is substantial1. The physico-chemical approach first described by Stewart2 has gained interest in critical care literature because of its superior performance in diagnosing and quantifying complex acid base disorders in comparison with the conventional Henderson Hasselbalch approach3-6. The Stewart approach takes into account many of the electrochemical disturbances seen in critically ill patients that are not a part of the conventional approach. Essentially, the Stewart approach states that only three independent variables determine blood pH: the PaCO2, the net charge balance of all completely dissociated ions (apparent strong ion difference, SIDapp) and the total amount of weak acids, mainly albumin and phosphate.
The importance of accurately identifying and quantifying all causal factors in acid base derangements in ICU patients is increasingly appreciated. For example, numerous studies using the Stewart approach published over the past 10 years have facilitated our insight in the etiology of metabolic acidosis in ICU patients 1,4,7,8. However, in our view, two important issues remain unclear.
While normal values of Stewart parameters of healthy subjects are often reported 9-12, reference values are currently unknown for critically ill patients with normal pH, BE and PaCO2. Considering the high incidence of metabolic derangements in critically ill patients, normal values of healthy subjects probably do not apply. We hypothesize that in ICU patients with normal pH, coexisting metabolic derangements will often be present, but go unnoticed when applying the traditional approach.
Second, so far, studies largely report only single (mostly admission) values of ICU patients and do not focus on changes in response to institution of therapy and resolution of illness13. Serial measurements from the time of admission to the resuscitation and recovery phases will contribute to a better insight in the mechanisms and kinetics of acid base derangements in the critically ill 8. Thus, they will better allow to determine the role of etiological factors like renal failure, fluid policy and presence of sepsis.
The purpose of the current study was twofold. First, our objective was to describe Stewart parameters in critically ill patients without evidence of an acid base disorder according to the traditional approach and to determine the incidence of subclinical non-respiratory acid-base abnormalities in these patients. Second, we aimed to explore the kinetics of the Stewart parameters and to determine the influence of
Abstract Introduction The physico-chemical approach to acid-base disorders has gained interest in critical care literature because of its superior performance in diagnosing complex acid base disorders. However, for critically ill patients with apparently normal acid base state according to conventional criteria, normal values of the Stewart parameters are currently unknown. This study aimed to describe values of the Stewart parameters in intensive care (ICU) patients without evidence of an acid base disorder and to identify possible subclinical abnormalities.
Methods A prospective, observational study was performed in three Dutch multi-disciplinary intensive care departments. We included 312 consecutive ICU patients with normal pH (7.35≤ pH≤7.45) on day 3-5. In every patient three consecutive arterial blood samples were collected: at admission, at the day normal pH was reached and at ICU discharge. An apparently normal acid base state was defined as normal pH, -2<BE<2 and 35<PaCO2<45 mmHg. Apparent (SIDapp), effective strong ion difference (SIDeff) and strong ion gap (SIG) were calculated. Multivariate linear regression analysis was performed to analyze factors potentially associated with levels of SIDapp and SIG during normal pH. Covariates potentially relevant to the changes in acid-base state were obtained.
Results 137 patients were identified with an apparently normal acid base state. In this group, SIDapp values were 36.6±3.6 mEq/L, resulting from hyperchloremia (109±4.6 mEq/L), SIDeff values were 33.5±2.3 mEq/L, resulting from hypoalbumin-emia (24.0±6.2 g/L) and SIG values were 3.1±3.1 mEq/L. During admission, BE increased secondary to a decrease in SIG levels and, subsequently, an increase in SIDapp levels. Hypoalbuminemia was present throughout the study. Levels of SIDapp during normal pH were associated with positive ion load, chloride load and admission SIDapp (multivariate r2=0.40, P<0.001). Levels of SIG during normal pH were associated with kidney function, sepsis and SIG levels at ICU admission (multivariate r2=0.28, P<0.001).
Conclusions ICU patients with an apparently normal acid base state according to traditional criteria have an underlying mixed metabolic acid base disorder characterized by acidifying effects of a low SIDapp (due to hyperchloremia) and high SIG (both acidifying effects) and the alkalising effect of a low level of the weak acid albumin.

94 95
CHAPTER 6 STEWART ANALYSIS OF APPARENT NORMAL ACID BASE STATE IN THE CRITICALLY ILL
6Diagnostics, Hoofddorp, The Netherlands) or on a Roche/Hitachi Modular Analytics P800 chemistry analyzer (Roche Diagnostics Nederland BV, Almere, Nederland); and plasma concentrations of magnesium, creatinine, urea, phosphate, bilirubin and albumin were measured on an Aeroset. All measurements were performed on arterial blood samples collected simultaneously at the three moments during admission mentioned above.
DefinitionsIn this study, in the patients with normal pH on day 3-5, we defined a mixed acid base disorder according to the traditional approach as either abnormal PaCO2 (<35 mmHg or > 45 mmHg) or abnormal BE (< -2 mmol/L or > 2 mmol/L)1,9,14 combined with a normal pH. Patients were classified into three groups based on the presence or absence of a mixed acid base disorder at the time of normal pH using the traditional approach: an apparently ‘normal acid base state group’ (-2<BE<2 and 35 mm Hg≤PaCO2≤45 mm Hg), a ‘metabolic acidosis group’ (BE < -2) and a ‘metabolic alkalosis group’ (BE>2). The latter two groups were not classified as respiratory alkalosis and acidosis respectively, as they also contained patients with normal PaCO2 values. Furthermore, these names are chosen for reasons of clarity, as the main focus of this study is metabolic abnormalities during normal pH. Patients with no apparent metabolic abnormalities (-2<BE<2) at the time of normal pH and an abnormal PaCO2 were classified as ‘other’ and, for the same reason, excluded for further analysis. Renal failure was defined according to the RIFLE criteria15 (injury or failure). Total infused cation load was defined as the net charge of all infused strong positively charged electrolytes (sodium, potassium, magnesium and calcium) 24h before normal pH. Total infused anion load was defined as the net charge of all infused chloride 24h before normal pH. Total infused intravenous volume load was defined as the sum of all intravenously administered fluids 24h before normal pH.
CalculationsBicarbonate was calculated using the Henderson–Hasselbalch equation (pH=6.1+log ([HCO3
–]/0.0301 PaCO2) and the standard base excess (SBE) using the Siggaard–Andersen formulae. The apparent (SIDapp = [Na+]+[K+]+[Ca2+]+ [Mg2+]–[Cl–]–[lactate–]) and effective strong ion difference (SIDeff = (2.46 x 10⁻⁸ x PaCO2 /10-pH) + ([albumin] x 0.123 x (pH – 0.631)) + ([phosphate] x (0.309 x pH – 0.469)) and strong ion gap (SIG= SIDapp - SIDeff) were subsequently calculated. All mentioned concentrations are expressed in mEq/L, except for the concentrations of albumin (g/L), phosphate (mmol/L) and PaCO2 (mmHg).
several factors like renal function, fluid management and the presence of sepsis on the observed metabolic changes in acid-base balance.
Methods
Study populationThis prospective observational study was performed in three multidisciplinary ICU’s in The Netherlands (Onze Lieve Vrouwe Gasthuis in Amsterdam, Radboud University Nijmegen Medical Centre in Nijmegen and Jeroen Bosch Hospital in ‘s-Hertogenbosch). We studied 312 consecutive critically ill patients with a normal pH on day 3, 4 or 5 following ICU admission, defined as 7.35 ≤ pH ≤ 7.45. Patients were excluded if they were discharged or died before day 3. Acute Physiology and Chronic Health Evaluation (APACHE II) data and Simplified Acute Physiology Score (SAPS II) data were collected for each patient. Furthermore, modified APACHE II scores and SAPS II scores were employed in which assessment of acid-base parameters was not included. Clinical data were collected from (electronical) patient charts. Electrolytes, diuretics and volumes and composition of intravenous fluids, administered 24 h before normal pH value, were registered, as we considered this timeframe to be primarily of influence on electrolyte values at the time of normal pH. Urine output was registered 12 h before normal pH value, as this was considered a relevant time frame influencing electrolyte values at the time of normal pH. To compare acid base variables of critically ill patients with apparent normal acid base state with normal subjects, data of a previously reported healthy control group were used (n=15)12
The local medical ethical committee approved the study and waived the need for informed consent, since there was no interference with routine clinical care.
MeasurementsIn every patient we collected arterial blood samples at three consecutive moments: at ICU admission, at the day normal pH was reached (day 3,4 or 5) and at ICU discharge. If length of ICU stay exceeded seven days, the last blood sample was collected on day seven.
In the collected arterial blood samples, pH, partial pressures of oxygen and carbon dioxide (PaO2 and PaCO2), and plasma concentrations of ionized calcium and lactate were measured on a blood gas analyzer (RapidLab; Bayer Diagnostics, Breda, The Netherlands). Plasma concentrations of sodium, potassium, and chloride were analyzed using an ion-selective electrode on an Aeroset (Abbott
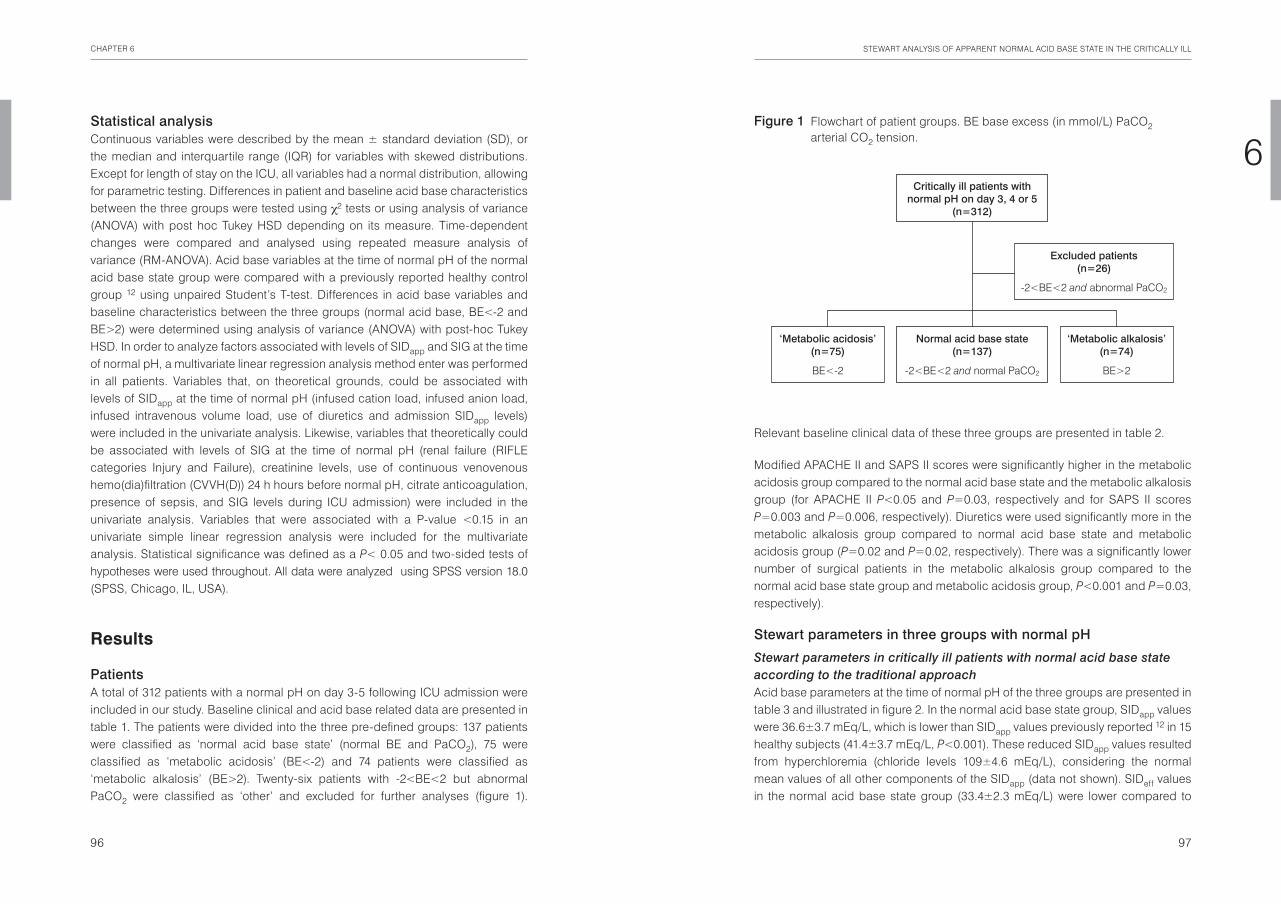
96 97
CHAPTER 6 STEWART ANALYSIS OF APPARENT NORMAL ACID BASE STATE IN THE CRITICALLY ILL
6
Relevant baseline clinical data of these three groups are presented in table 2.
Modified APACHE II and SAPS II scores were significantly higher in the metabolic acidosis group compared to the normal acid base state and the metabolic alkalosis group (for APACHE II P<0.05 and P=0.03, respectively and for SAPS II scores P=0.003 and P=0.006, respectively). Diuretics were used significantly more in the metabolic alkalosis group compared to normal acid base state and metabolic acidosis group (P=0.02 and P=0.02, respectively). There was a significantly lower number of surgical patients in the metabolic alkalosis group compared to the normal acid base state group and metabolic acidosis group, P<0.001 and P=0.03, respectively).
Stewart parameters in three groups with normal pH
Stewart parameters in critically ill patients with normal acid base state according to the traditional approachAcid base parameters at the time of normal pH of the three groups are presented in table 3 and illustrated in figure 2. In the normal acid base state group, SIDapp values were 36.6±3.7 mEq/L, which is lower than SIDapp values previously reported 12 in 15 healthy subjects (41.4±3.7 mEq/L, P<0.001). These reduced SIDapp values resulted from hyperchloremia (chloride levels 109±4.6 mEq/L), considering the normal mean values of all other components of the SIDapp (data not shown). SIDeff values in the normal acid base state group (33.4±2.3 mEq/L) were lower compared to
Statistical analysisContinuous variables were described by the mean ± standard deviation (SD), or the median and interquartile range (IQR) for variables with skewed distributions. Except for length of stay on the ICU, all variables had a normal distribution, allowing for parametric testing. Differences in patient and baseline acid base characteristics between the three groups were tested using χ2 tests or using analysis of variance (ANOVA) with post hoc Tukey HSD depending on its measure. Time-dependent changes were compared and analysed using repeated measure analysis of variance (RM-ANOVA). Acid base variables at the time of normal pH of the normal acid base state group were compared with a previously reported healthy control group 12 using unpaired Student’s T-test. Differences in acid base variables and baseline characteristics between the three groups (normal acid base, BE<-2 and BE>2) were determined using analysis of variance (ANOVA) with post-hoc Tukey HSD. In order to analyze factors associated with levels of SIDapp and SIG at the time of normal pH, a multivariate linear regression analysis method enter was performed in all patients. Variables that, on theoretical grounds, could be associated with levels of SIDapp at the time of normal pH (infused cation load, infused anion load, infused intravenous volume load, use of diuretics and admission SIDapp levels) were included in the univariate analysis. Likewise, variables that theoretically could be associated with levels of SIG at the time of normal pH (renal failure (RIFLE categories Injury and Failure), creatinine levels, use of continuous venovenous hemo(dia)filtration (CVVH(D)) 24 h hours before normal pH, citrate anticoagulation, presence of sepsis, and SIG levels during ICU admission) were included in the univariate analysis. Variables that were associated with a P-value <0.15 in an univariate simple linear regression analysis were included for the multivariate analysis. Statistical significance was defined as a P< 0.05 and two-sided tests of hypotheses were used throughout. All data were analyzed using SPSS version 18.0 (SPSS, Chicago, IL, USA).
Results
PatientsA total of 312 patients with a normal pH on day 3-5 following ICU admission were included in our study. Baseline clinical and acid base related data are presented in table 1. The patients were divided into the three pre-defined groups: 137 patients were classified as ‘normal acid base state’ (normal BE and PaCO2), 75 were classified as ‘metabolic acidosis’ (BE<-2) and 74 patients were classified as ‘metabolic alkalosis’ (BE>2). Twenty-six patients with -2<BE<2 but abnormal PaCO2 were classified as ‘other’ and excluded for further analyses (figure 1).
Figure 1 Flowchart of patient groups. BE base excess (in mmol/L) PaCO2 arterial CO2 tension.
Critically ill patients withnormal pH on day 3, 4 or 5
(n=312)
Normal acid base state(n=137)
-2<BE<2 and normal PaCO2
‘Metabolic acidosis’(n=75)
BE<-2
‘Metabolic alkalosis’(n=74)
BE>2
Excluded patients(n=26)
-2<BE<2 and abnormal PaCO2

98 99
CHAPTER 6 STEWART ANALYSIS OF APPARENT NORMAL ACID BASE STATE IN THE CRITICALLY ILL
6
healthy subjects (40.0±3.8 mEq/L, P<0.001)12. These low SIDeff values resulted from hypoalbuminemia (albumin levels 24.0±6.2 g/L), considering the normal mean bicarbonate and phosphate levels in the normal acid base state group. Lastly, SIG values in the normal acid base state group (3.1±3.2 mEq/L) were higher than levels reported in healthy subjects (1.4±1.8 mEq/L, P=0.04)12.
The etiology of mixed acid base disorders according to Stewart
SIDapp
Compared to the normal acid base state group, SIDapp levels in the metabolic acidosis group were significantly lower (P<0.001) (acidifying effect) and SIDapp levels in the metabolic alkalosis group were significantly higher (P<0.001) (alkalising effect). This difference in SIDapp levels between the groups was completely explained by the significant differences in chloride levels, as the other strong ions that constitute SIDapp were not different between groups (data not shown).
Table 1 Baseline clinical and acid-base-related characteristics of ICU patients with normal pH on day 3, 4 or 5 of admission
Overall (n=312)
Age, years, mean ± SD 63.9 ± 14.3
Male gender, n (%) 210 (67.3%)
APACHE II score, mean ± SD 20.5 ± 7.9
SAPS II score, mean ± SD 46.2 ± 16.9
Mechanical ventilation during study, n (%) 275 (88.1%)
Mechanical ventilation at normal pH, n (%) 196 (62.8%)
LOS (days), median (IQR), extreme values 5 (4-12), 3-223
Mortality, n (%) 58 (18.6%)
Sepsis, n (%) 71 (22.8%)
Surgical patient, n (%) 123 (39.4%)
Admission diagnosis, n (%)
cardiovascular 54 (17.3%)
pulmonary 67 (21.5%)
abdominal 12 (3.8%)
neurological 27 (8.7%)
Surgery, elective 69 (22.1%)
Surgery, urgent 42 (13.5%)
Surgery, trauma 12 (3.8%)
other 29 (9.3%)
CVVH(D) 24 h before normal pH, n (%) 42 (13.5%)
Citrate anticoagulation, n (%) 30 (9.6%)
pH, mean ± SD 7.34 ± 0.1
BE, mean ± SD -2.9 ± 5.49
PaCO2, mm Hg, mean ± SD 42 ± 12.6
Chloride, mean ± SD 107 ± 6
Lactate, median (IQR), extreme values 1.7 (1.1-2.6), 0.4-18.8
Plasma creatinine, μmol/L, median (IQR), extreme values 93 (73-131), 23-796
APACHE II Acute Physiology and Chronic Health Evaluation II, SAPS II Simplified Acute Physiology Score CVVH(D) Continuous Venovenous Hemo (dia) filtration
Table 2 Base line clinical characteristics of three groups with normal pH at day 3,4 or 5 according to BE
Normal acid base state(n=137)
BE < -2
(n= 75)
BE > 2
(n=74)
APACHE II score, mean ± SD 20.1 ± 7.6 22.8 ± 8.0a 19.4 ± 8.1b
APACHE II score adjusted for admission pH, mean± SD
19.3 ± 7.1 21.6 ± 7.8 18.5 ± 7.9 b
SAPS II score, mean ± SD 44.3 ± 15.7 52.4 ± 16.2a 43.9 ± 18.9b
Mortality, n (%) 29 (21.2%) 12 (16.2%) 15 (20.8%)
Sepsis, n (%) 29 (21.2%) 22 (29.3%) 15 (20.3%)
Surgical patient, n (%) 67 ( 48.9%) 29 (38.7%) 16 (21.6%)a,b
Renal failure during normal pH 59 (43.1 %) 31 (41.3%) 24 (32.4%)
Diuretics 24h before normal pH, n (%) 42 (30.7%) 22 (28.2%) 37 (50.0%)a,b
CVVH(D) 24 h before normal pH, n (%) 24 (17.5%) 6 (8%) 9 (12.2%)
Citrate anticoagulation, n (%) 18 (13.1%) 3 (4%)a 6 (8.1%)
APACHE II Acute Physiology and Chronic Health Evaluation II, SAPS II Simplified Acute Physiology Score CVVH(D) Continuous Venovenous Hemo (dia) filtration a statistically significantly different (p<0.05) compared to normal BE; b statistically significantly different (p<0.05) compared to BE <-2. Exact p values are mentioned in Results section of the text.

100 101
CHAPTER 6 STEWART ANALYSIS OF APPARENT NORMAL ACID BASE STATE IN THE CRITICALLY ILL
6
metabolic alkalosis group (acidifying effect) compared to the normal acid base state group (P<0.001).
Kinetics of Stewart parametersThe kinetics of Stewart parameters during the first week of admission prior and following normalisation of pH on three consecutive moments are presented in table 4.
Prior to normalisation of pHRegardless of acid base state during ICU admission, the same trend was noticed in all three groups. A significant rise in pH (mainly acidosis at admission with subsequent normalization of pH) is, apart from a slight decrease in PaCO2 levels, primarily associated with an increase in BE. In the normal acid base state group and metabolic alkalosis group this increase in BE (P=0.0001 and P=0.0001, respectively) is accompanied by a significant decrease in SIG levels (P=0.0001 and P=0.001) and a marginal, but significant decrease in phosphate levels (P=0.008 and P=0.003). In addition, a marginal decrease in albumin levels was observed in the metabolic alkalosis group (P=0.01). (Table 4)
SIDeff
Compared to the normal acid base state group, SIDeff levels in the metabolic acidosis group were also significantly lower (P<0.001) and SIDeff levels in the metabolic alkalosis group were significantly higher (P<0.001). This was mainly explained by the significant difference in bicarbonate levels, as the concentrations of the weak acids albumin were not significantly different and phosphate levels were only marginally different between groups.
SIGSIG levels were significantly lower (alkalising effect) in the metabolic alkalosis group compared to the metabolic acidosis group (P<0.001) and normal acid base group respectively (P=0.03). The SIG levels of the normal acid base group tended to be lower (P=0.057) compared to the metabolic acidosis group.
PaCO2
In the metabolic acidosis group PaCO2 levels were significantly lower (alkalising effect) compared to the normal acid base state group and the metabolic alkalosis group (both P<0.001). Furthermore, PaCO2 levels were significantly higher in the
Table 3 Acid base parameters of three groups during normal pH at day 3,4 or 5 according to BE
Normal acid base state(n=137)
BE < -2
(n= 75)
BE > 2
(n=74)
pH, mean ± SD 7.41 ± 0.03 7.39 ± 0.03a 7.42 ± 0.03b
PaCO2 (mmHg), mean ± SD 39 ± 3 34 ± 4a 47 ± 6a,b
BE, mean ± SD 0.1 ± 1.1 -4.1 ± 1.5a 4.9 ± 2.2a,b
SIDapp (mEq/L), mean ± SD 36.6 ± 3.7 33.2 ± 3.5a 41.2 ± 3.8a,b
Sodium (mmol/L), mean ± SD 139 ± 4.2 140 ± 6.1 140 ±4.2
Chloride (mmol/L), mean ± SD 109 ± 4.6 113 ± 6.0a 106 ± 4.7a,b
Lactate (mmol/L), median (IQR) 1.5 (1.2-1.9) 1.6 (1.2-2.0) 1.3 (1.0-1.7)
SIDeff(mEq/L), mean ± SD 33.4 ± 2.3 28.8 ± 2.7a 39.3 ± 3.3a,b
Albumin (g/L), mean ± SD 24.0 ± 6.2 23.0 ± 5.6 24.8 ± 6.5
Phosphate (mmol/L), mean ± SD 1.0 ± 0.3 1.1 ± 0.4 1.0 ± 0.3b
SIG (mEq/L), mean ± SD 3.1 ± 3.2 4.3 ± 3.5 1.8 ± 2.9a,b
a statistically significantly different (p<0.05) compared to normal BE; b statistically significantly different (p<0.05) compared to BE <-2
Figure 2 Acid base parameters at the time of normal pH, all expressed in mEq/L, in the ‘normal acid base state’ group (normal BE and PaCO2, n=137), ‘metabolic acidosis’ group (BE<-2, n=75) ‘metabolic alkalosis’ group (BE>2, n=74). * statistically significantly different (P<0.05) compared to normal BE.
0
5
15
10
20
25
30
35
Normal BE
mE
q/L
HCO3-
SIG
Alb-
SIDapp SIDapp
HCO3-
SIG
Alb-
PO4-
SIDapp
HCO3-
SIG
Alb-
BE <-2 BE>2
40
PO4-
PO4-
*
*
*
* *

102 103
CHAPTER 6 STEWART ANALYSIS OF APPARENT NORMAL ACID BASE STATE IN THE CRITICALLY ILL
6Admission SIDapp values in the metabolic acidosis group were significantly lower compared to the metabolic alkalosis group (P<0.0001), and borderline lower compared to the normal acid base state group (P=0.056). Admission SIDeff values showed similar trends (table 4).
Following normalisation of pHIn the normal acid base state and metabolic acidosis group, pH increased further following normalisation, associated with a significant increase in BE, as the slightly increasing PaCO2 levels account for a acidifying effect. This further increase in BE was accompanied by an increase in SIDapp levels (responsible for an alkalising effect). This increase in SIDapp levels was almost completely caused by a significant decrease in serum chloride levels (from 109±4.6 mmol/L to 107±3.9 mmol/L, P<0.001 in the normal acid base state group and from 114±6.1 mmol/L to 111±6.4 mmol/L, P=0.003 in the metabolic acidosis group), as well as a slight decrease in lactate levels (from 1.6±0.8 mmol/L to 1.5±0.8 mmol/L, P=0.045 in the normal acid base state group and from 1.6±0.7 mmol/L to 1.5±0.6 mmol/L, P=0.01 in the metabolic acidosis group) and an increase in calcium levels (from 1.1±0.1mmol/L to 1.2±0.1 mmol/L, P=0.008 in the normal acid base state group and from 1.1±0.2mmol/L to 1.2±0.1 mmol/L, P=0.001 in the metabolic acidosis group). Levels of the weak acid albumin did not significantly change over time and levels of phosphate only increased marginally in the normal acid base state group. Accordingly, the observed increase in SIDeff levels in the normal acid base state group and metabolic acidosis group is almost completely explained by an increase in bicarbonate levels. In the metabolic alkalosis group, no significant changes occurred in the acid base parameters following normalisation of pH, except for a marginal increase in phosphate levels (table 4).
Covariates that modulate acid-base balance
Factors associated with SIDapp
Total infused cation load, total infused chloride load, total infused volume load, diuretic use and admission SIDapp levels were univariately associated (P<0.15) with SIDapp levels during normal pH. Subsequently, multivariate regression analysis showed that SIDapp during normal pH remained significantly and independently associated with cation load, chloride load and admission SIDapp. The adjusted r2 of the model was 0.40 (standard error of estimate 3.51); P<0.001. Regression coefficients are outlined in table 5.
Table 4 Kinetics of acid base parameters during first week of ICU admission of three groups with normal pH at day 3,4 or 5 (t=2) according to BE
t=1(day 1)
t=2 (day 3,4 or 5)
t=3discharge/
day 7
Normal acid base state (n=137)
pH, mean ± SD 7.35 ± 0.09 7.41 ± 0.03a 7.43 ± 0.05a,b
PaCO2 (mmHg), mean ± SD 40 ± 9 39 ± 3 41 ± 6b
BE, mean ± SD -3.4 ± 4.6 0.1 ± 1.1a 2.3 ± 3.0a,b
SIDapp (mEq/L), mean ± SD 36 .1 ± 5.2 36.6 ± 3.7 39.3 ± 4.5a,b
SIDeff (mEq/L), mean ± SD 30.7 ± 4.6 33.4 ± 2.3a 35.8 ± 3.5a,b
Albumin (g/L), mean ± SD 24.2 ± 6.9 24.0 ± 6.2 24.1 ± 6.0
Phosphate (mmol/L), mean ± SD 1.2 ± 0.5 1.0 ± 0.3a 1.1 ± 0.3b
SIG (mEq/L), mean ± SD 5.3 ± 4.7 3.1 ± 3.2a 3.4 ± 3.6a
BE <-2 (n=75)
pH, mean ± SD 7.32 ± 0.10 7.39 ± 0.03a 7.42 ± 0.06a,b
PaCO2 (mmHg), mean ± SD 37 ± 10 34 ± 4a 37 ± 7b
BE, mean ± SD -6.0 ± 4.3 -4.1 ± 1.5a -0.6 ± 4.3a,b
SIDapp (mEq/L), mean ± SD 33.8± 6.3 33.2 ± 3.5 36.3 ± 4.8a,b
SIDeff (mEq/L), mean ± SD 27.9 ± 4.9 28.8 ± 2.7 32.5 ± 4.9a,b
Albumin (g/L), mean ± SD 24.5 ± 7.9 23.0 ± 5.7 23.2 ± 5.7
Phosphate (mmol/L), mean ± SD 1.3 ± 0.6 1.1 ± 0.4 1.1 ± 0.4
SIG (mEq/L), mean ± SD 6.0 ± 5.5 4.3 ± 3.5a 4.0 ± 3.3a
BE >2 (n=74)
pH, mean ± SD 7.35 ± 0.11 7.42 ± 0.03a 7.41 ± 0.06a
PaCO2 (mmHg), mean ± SD 50 ± 17 47 ± 6 49 ± 10
BE, mean ± SD 0.6 ± 6.6 4.9 ± 2.2a 4.8 ± 3.3a
SIDapp (mEq/L), mean ± SD 40.3 ± 6.2 41.2 ± 3.8 41.0 ± 5.2
SIDeff (mEq/L), mean ± SD 36.3 ± 7.4 39.3 ± 3.3a 39.6 ± 4.6a
Albumin (g/L), mean ± SD 26.3 ± 7.9 24.8 ± 6.5a 25.0 ± 6.4
Phosphate (mmol/L), mean ± SD 1.2 ± 0.5 1.0 ± 0.3a 1.1 ± 0.3b
SIG (mEq/L), mean ± SD 4.2 ± 5.0 1.8 ± 2.9a 1.5 ± 3.0a
a statistically significant change (p<0.05) compared to t=1; b statistically significant change p<0.05) compared to t=2

104 105
CHAPTER 6 STEWART ANALYSIS OF APPARENT NORMAL ACID BASE STATE IN THE CRITICALLY ILL
6Discussion
The main findings of this study are threefold. First, we described values of Stewart parameters in critically ill patients without evidence of acid base abnormalities according to the traditional criteria and determined the incidence of subclinical acid-base abnormalities. Second, we explored the kinetics of the acid base parameters during the first week of ICU admission, using the Stewart approach. Following ICU admission, pH rises which is largely a result of metabolic changes, indicated by an increase in BE. This increase in BE seems to be almost completely explained by a decrease in SIG levels prior to normalisation of pH and, subsequently, by an increase in SIDapp levels following normalisation of pH. Third, we identified three factors that were independently related to SIDapp levels during normal pH, namely SIDapp at ICU admission, total infused cation load and chloride load 24 hours before normal pH. Furthermore, creatinine levels, presence of sepsis and SIG levels at ICU admission were related to SIG levels during normal pH.
Stewart parameters in three groups with normal pHApproximately 50% of our studied ICU patients with normal pH had an underlying mixed acid base disorder according to criteria traditionally used (either abnormal BE and/or PaCO2). However, even critically ill patients with an apparently normal acid base state according to the conventional criteria (pH, BE and PaCO2 within the reference range) have an underlying mixed acid base disorder that emerged using the quantitative physico-chemical approach. Compared with data reported from normal subjects 9-12, this mixed metabolic disorder is characterized by a combination of a low SIDapp (due to hyperchloremia), high SIG (both acidifying effects) and a low level of the weak acid albumin (alkalising effect). Apparently, traditional methods of assessing acid base status fail to diagnose complicated acid base disorders in critically ill patients, especially in case of hypoalbuminemia or high levels of strong anions, both common findings in this patient category. Although other authors mentioned this point previously12,16, as far as we know our study is the first to report a detailed quantitative analysis of a large group of critically ill patients with an apparently normal acid base status. Moreover, considering this large group of studied patients and recognizing that the critically ill patient with normal pH, BE and PaCO2 is metabolically different from a healthy person, does not prove, but may suggest that low SIDapp, high SIG and low albumin levels could be regarded as an adaptive phenomenon during critical illness. Nevertheless, this seems unlikely, as hypoalbuminemia (an alkalising factor) is considered to be an inevitable event in critically illness and not a regulated variable for acid base purposes. Accordingly, increased SIG levels are probably a result of organ dysfuncion and the underlying disease or its therapy (see later). However, the low SIDapp values may (at least
Factors associated with SIGRenal failure during normal pH, creatinine levels during normal pH, use of CVVH(D) 24 hrs before normal pH, use of citrate anti-coagulation, SIG levels during admission and sepsis were univariately associated (P<0.15) with SIG during normal pH. After multivariate analysis, SIG during normal pH remained significantly and independently associated with creatinine during normal pH, sepsis and SIG levels at ICU admission. The adjusted r2 of the model is 0.28 (standard error of estimate 2.78; P<0.001). Regression coefficients are outlined in table 6.
Table 5 Uni- and multivariate analysis of factors associated with SIDapp levels at normal pH
Univariate analysis Multivariate analysis
B 95% CI P value B 95%CI P value
Cation load 0.251 0.135- 0.345 <0.001 0.232 0.142-0.321 <0.001
Chloride load -0.006 -0.008- -0.004 <0.001 -0.005 -0.008- -0.002 0.001
IV volume -0.001 -0.001- -0.001 <0.001
Diuretic use 2.081 1.038- 3.123 <0.001
Admission SIDapp 0.414 0.342-0.485 <0.001 0.344 0.273-0.415 <0.001
IV intravenous
Table 6 Uni- and multivariate analysis of factors associated with SIG levels at normal pH
Univariate analysis Multivariate analysis
B 95% CI P value B 95% CI P value
Renal failure 1.248 0.500- 1.996 0.001
Creatinine 0.014 0.01- 0.018 <0.001 0.009 0.005- 0.014 <0.001
CVVH(D) 1.628 0.567- 2.689 0.003
Citrate anticoagulation
1.727 0.496- 2.957 0.006
Sepsis 2.417 1.568- 3.266 <0.001 1.391 0.584-2.198 0.001
Admission SIG 0.28 0.210-0.350 <0.001 0.210 0.138-0.281 <0.001
CVVH(D) continuous venovenous hemo(dia)filtration

106 107
CHAPTER 6 STEWART ANALYSIS OF APPARENT NORMAL ACID BASE STATE IN THE CRITICALLY ILL
6factors on the observed SIDapp and SIG levels during normal pH. Using multivariate linear regression analysis, we showed that the low SIDapp levels during normal pH were independently related to admission SIDapp levels, low cation loading and high chloride loading 24 hours before normal pH. Surprisingly, dilution (expressed as electrolyte free IV volume load) and diuretic use, both significantly related to low SIDapp levels in the univariate analysis, did not maintain statistical significance following multivariate analysis. Admission SIDapp levels, cation and chloride load (the latter having opposite effects) together account for only 40 percent of the observed SIDapp levels during normal pH. Apparently, other factors not accounted for in the analysis also play a role. Potential candidates are infused volume and electrolytes in the first two days of admission, anion flux from the intracellular and interstitial (changing Gibbs-Donnan equilibrium) compartment and, as mentioned above, presumably increased renal chloride retention as an adaptive response to the alkalising factor hypoalbuminemia. SIG levels in the patients with normal pH were independently related to creatinine levels, the presence of sepsis and SIG levels during admission. Together, these three factors account for 28 percent of the observed SIG levels during normal pH. So, again, other factors not accounted for in our analysis apparently play an important role. Although SIG levels during normal pH decreased compared to their admission values, they are still elevated compared to healthy subjects. Persistent occult tissue hypoperfusion or hepatic dysfunction may account for this. Also, the administration of acetoaminophen, especially in combination with antibiotics like flucloxacillin and/or depleted glutathion reserves can cause high levels of pyroglutamic acid29. Although almost all patients were treated with 4x1 gram acetoaminophen, we did not register its use in individual patients and therefore could not relate it to their SIG levels. In 2 previous studies on the nature of high SIG levels in metabolic acidosis in ICU patients, pyroglutamic acid was not a significant contributing factor22,30. Gelatins, which are comprised of negatively charged polypeptides, are a known source of ‘unmeasured’ anions31, but were not used in our study. In general, the nature of the increased SIG in ICU patients is currently largely unknown and likely multifactorial22.
Conclusions
This is the first study decribing Stewart acid base parameters in an ICU population with no apparent acid base abnormalities. We demonstrated that our studied ICU patients with normal pH, PaCO2 and BE had an underlying mixed acid base disorder. Furthermore, our results suggest that during recovery of critical illness, the alkalizing effect of hypoalbuminemia is nullified by a low SIDapp (mainly due to hyperchloremia) and high SIG levels. Whether this should be interpreted as an
partially) reflect an appropriate renal response. Recently, several chloride carriers in the proximal tubules and distal nephron are identified that underline the role of chloride in renal acid-base regulation17. In this view, our results illustrate that in case of hypoalbuminemia, SID may be reset to a lower level in order to maintain a normal pH, as previously suggested12,18.
Kinetics of Stewart parametersExploring the dynamics of acid base parameters during the first week of ICU admission, we found that levels of SIDapp return to levels almost comparable with healthy subjects, irrespective of whether patients had a mixed acid base disorder (according to traditional criteria) or not. Additionally, following normalisation of pH, SIG levels remained higher than levels reported for healthy subjects and hypo-albuminemia persisted. This is in accordance with the recent study of Gunnerson et al, who reported the data of 15 stable ICU patients just before ICU discharge12. Apparently, in time, the main contributors to a change in acid base status in critically ill patients are, first, a decrease (but not complete normalisation) of SIG levels and, second, an increase (but not normalisation) of SIDapp levels. The contribution of the respiratory component appears to be only minor. As 63% of our patients were mechanically ventilated during normal pH, minute ventilation may, at least partially, be influenced by sedation and ventilation strategy. The decrease in SIG levels prior to normalization of pH may likely be related to (partial) resolution of disease. High (pre-resuscitation) SIG levels at ICU admission are known to be related to the presence of sepsis, renal and hepatic dysfunction and are probably a marker of tissue hypoperfusion as well19-22. Some studies23-26 found a clear association between high SIG levels and mortality while another did not27. Therefore, the prognostic significance of high SIG levels during admission remains to be determined, but is probably more relevant when pre-resuscitation values are measured4,25,27. Possibly, in our study, when pH normalized after 3 to 5 days following ICU admission, SIG levels decreased as a result of (partial) recovery of organ function or for example institution of renal replacement therapy. The increase of SIDapp levels following normalization of pH in our study is almost completely explained by a decrease in chloride levels and might be related to further recovery of organ function. For example, the ability to excrete excess chloride in urine is directly related to renal function28. Furthermore, large amounts of intravenous unbalanced fluids are unlikely to be administered in a more stable phase of disease. Unfortunately, we did not collect data of fluid in- and output following normalization of pH to support this possibility.
Covariates that modulate acid-base balanceAs mentioned, we also focused on the influence of endogenous and exogenous

108 109
CHAPTER 6 STEWART ANALYSIS OF APPARENT NORMAL ACID BASE STATE IN THE CRITICALLY ILL
6References
1. Gunnerson KJ, Saul M, He S, Kellum JA. Lactate versus non-lactate metabolic acidosis: a retrospective outcome evaluation of critically ill patients. Crit Care 2006;10:R22.
2. Stewart PA. Modern quantitative acid-base chemistry. Canadian journal of physiology and pharmacology 1983;61:1444-61.
3. Fencl V, Jabor A, Kazda A, Figge J. Diagnosis of metabolic acid-base disturbances in critically ill patients. American journal of respiratory and critical care medicine 2000;162:2246-51.
4. Kaplan LJ, Kellum JA. Initial pH, base deficit, lactate, anion gap, strong ion difference, and strong ion gap predict outcome from major vascular injury. Critical care medicine 2004;32:1120-4.
5. Dubin A, Menises MM, Masevicius FD, et al. Comparison of three different methods of evaluation of metabolic acid-base disorders. Critical care medicine 2007;35:1264-70.
6. Kaplan L. Acid-base balance analysis: a little off target. Critical care medicine 2007;35:1418-9.7. Moviat M, van Haren F, van der Hoeven H. Conventional or physicochemical approach in intensive
care unit patients with metabolic acidosis. Crit Care 2003;7:R41-5.8. Martin M, Murray J, Berne T, Demetriades D, Belzberg H. Diagnosis of acid-base derangements and
mortality prediction in the trauma intensive care unit: the physiochemical approach. The Journal of trauma 2005;58:238-43.
9. Park M, Taniguchi LU, Noritomi DT, Liborio AB, Maciel AT, Cruz-Neto LM. Clinical utility of standard base excess in the diagnosis and interpretation of metabolic acidosis in critically ill patients. Brazilian journal of medical and biological research = Revista brasileira de pesquisas medicas e biologicas / Sociedade Brasileira de Biofisica [et al] 2008;41:241-9.
10. Masevicius FD, Tuhay G, Pein MC, Ventrice E, Dubin A. Alterations in urinary strong ion difference in critically ill patients with metabolic acidosis: a prospective observational study. Critical care and resuscitation : journal of the Australasian Academy of Critical Care Medicine 2010;12:248-54.
11. Gunnerson KJ, Kellum JA. Acid-base and electrolyte analysis in critically ill patients: are we ready for the new millennium? Current opinion in critical care 2003;9:468-73.
12. Gunnerson KJ, Srisawat N, Kellum JA. Is there a difference between strong ion gap in healthy volunteers and intensive care unit patients? Journal of critical care 2010;25:520-4.
13. Tuhay G, Pein MC, Masevicius FD, Kutscherauer DO, Dubin A. Severe hyperlactatemia with normal base excess: a quantitative analysis using conventional and Stewart approaches. Crit Care 2008;12:R66.
14. Gunnerson KJ. Clinical review: the meaning of acid-base abnormalities in the intensive care unit part I - epidemiology. Crit Care 2005;9:508-16.
15. Bellomo R, Ronco C, Kellum JA, Mehta RL, Palevsky P. Acute renal failure - definition, outcome measures, animal models, fluid therapy and information technology needs: the Second International Consensus Conference of the Acute Dialysis Quality Initiative (ADQI) Group. Crit Care 2004;8:R204-12.
16. Figge J, Mydosh T, Fencl V. Serum proteins and acid-base equilibria: a follow-up. The Journal of laboratory and clinical medicine 1992;120:713-9.
17. Yunos NM, Bellomo R, Story D, Kellum J. Bench-to-bedside review: Chloride in critical illness. Crit Care 2010;14:226.
18. Wilkes P. Hypoproteinemia, strong-ion difference, and acid-base status in critically ill patients. J Appl Physiol 1998;84:1740-8.
19. Kellum JA, Bellomo R, Kramer DJ, Pinsky MR. Hepatic anion flux during acute endotoxemia. J Appl Physiol 1995;78:2212-7.
20. Makino J, Uchino S, Morimatsu H, Bellomo R. A quantitative analysis of the acidosis of cardiac arrest: a prospective observational study. Crit Care 2005;9:R357-62.
21. Kellum JA, Kramer DJ, Pinsky MR. Strong ion gap: a methodology for exploring unexplained anions. Journal of critical care 1995;10:51-5.
22. Moviat M, Terpstra AM, Ruitenbeek W, Kluijtmans LA, Pickkers P, van der Hoeven JG. Contribution of various metabolites to the “unmeasured” anions in critically ill patients with metabolic acidosis. Critical care medicine 2008;36:752-8.
adaptive response or as a complex mixed acid base disorder remains speculative. Additionally, we showed that high chloride load, low cation load and low admission SIDapp were independently related to these low SIDapp levels. Creatinine levels, the presence of sepsis at admission and admission SIG levels were independently related to high SIG levels during normal pH.

110 111
CHAPTER 6 STEWART ANALYSIS OF APPARENT NORMAL ACID BASE STATE IN THE CRITICALLY ILL
623. Dondorp AM, Chau TT, Phu NH, et al. Unidentified acids of strong prognostic significance in severe malaria. Critical care medicine 2004;32:1683-8.
24. Durward A, Tibby SM, Skellett S, Austin C, Anderson D, Murdoch IA. The strong ion gap predicts mortality in children following cardiopulmonary bypass surgery. Pediatric critical care medicine : a journal of the Society of Critical Care Medicine and the World Federation of Pediatric Intensive and Critical Care Societies 2005;6:281-5.
25. Balasubramanyan N, Havens PL, Hoffman GM. Unmeasured anions identified by the Fencl-Stewart method predict mortality better than base excess, anion gap, and lactate in patients in the pediatric intensive care unit. Critical care medicine 1999;27:1577-81.
26. Antonini B, Piva S, Paltenghi M, Candiani A, Latronico N. The early phase of critical illness is a progressive acidic state due to unmeasured anions. European journal of anaesthesiology 2008;25:566-71.
27. Rocktaeschel J, Morimatsu H, Uchino S, Bellomo R. Unmeasured anions in critically ill patients: can they predict mortality? Critical care medicine 2003;31:2131-6.
28. Moviat M, Terpstra AM, van der Hoeven JG, Pickkers P. Impaired renal function is associated with greater urinary strong ion differences in critically ill patients with metabolic acidosis. Journal of critical care 2011.
29. Dempsey GA, Lyall HJ, Corke CF, Scheinkestel CD. Pyroglutamic acidemia: a cause of high anion gap metabolic acidosis. Critical care medicine 2000;28:1803-7.
30. Mizock BA, Belyaev S, Mecher C. Unexplained metabolic acidosis in critically ill patients: the role of pyroglutamic acid. Intensive care medicine 2004;30:502-5.
31. Hayhoe M, Bellomo R, Liu G, McNicol L, Buxton B. The aetiology and pathogenesis of cardiopulmo-nary bypass-associated metabolic acidosis using polygeline pump prime. Intensive care medicine 1999;25:680-5.

Summary and general discussion
Chapter 7

115
SUMMARY AND GENERAL DISCUSSION
7In this chapter, we summarize and discuss the main findings of this thesis in the light of recent studies performed during and after the conduct of our own research. We focused on metabolic derangements, since these can be easily overlooked by the traditional Henderson-Hasselbalch approach and potentially have a significant impact on morbidity and outcome.
Chapter 1 is a short introduction to acid base disorders in the ICU patient in general and, more specifically, the Stewart approach. We conclude that, although the traditional (Henderson Hasselbalch) approach provides an accurate quantification of a metabolic acid-base derangement, the Stewart approach potentially provides an advanced insight in the mechanisms that cause it. However, due to its complexity, its clinical applicability is limited.
Part one: Etiology of metabolic acidosis in the ICU
In the first part of the thesis, we investigated the characteristics of metabolic acidosis in critically ill patients, the nature of unidentified strong anions and the influence of renal handling of strong ions.
The Stewart approach versus the traditional approachIn chapter 2, we compared a quantitative physico-chemical analysis of metabolic acidosis of 50 ICU patients with the traditional Henderson-Hasselbalch approach. We demonstrated that metabolic acidosis in ICU patients is a complex, multifactorial disorder with a high incidence of hyperchloremia, hyperlactatemia and strong ion gap acidosis. In approximately half of the cases three causes of acidosis were found simultaneously.
We showed that the traditional approach combined with an (uncorrected) anion gap lacks diagnostic sensitivity for the detection of hyperlactatemia, which obviously should not be missed. This was previously also shown in a selected group of trauma patients1. Meanwhile, following our study, this finding was confirmed several times in different cohorts of general ICU patients2-4. We showed that an albumin-corrected anion gap performs better with respect to detection of hyperlactatemia. Moreover, we found an excellent relationship between the albumin- and lactate corrected anion gap (AGcorr) and the SIG in patients with a metabolic acidosis admitted to the ICU. This means that the strong anions that contribute to acidosis, other than lactate, can be easily quantified at the bedside, avoiding the complex calculation of the SIG. More recently, the strong association between the albumin- and lactate corrected anion gap (AGcorr) and the SIG has also been confirmed in different subsets of ICU patients3-7. Potentially, this has

116 117
CHAPTER 7 SUMMARY AND GENERAL DISCUSSION
7suggested earlier in literature by Forni et al13, could not be confirmed by our study. Only succinic acid was significantly elevated in the high SIG group, but it accounted for only 0.07% of the increased SIG. Furthermore, concentrations of isocitrate and citrate obtained by gas chromatography were not relevantly elevated in the high SIG group and all intermediates of the citric acid cycle quantified with 1H-NMR spectroscopy, including acetic acid, corresponded to the published reference ranges. Accelerated amino acid catabolism would imply distinct patterns of altered amino acid concentrations, which also was not supported by the results of our study. The differences between our results and those of Forni et al. could be explained by the limited size and heterogeneity of the patient groups, analytic differences and differences in exogenously administered medications and fluids.
In spite of our efforts, so far, the source and identity of the anions representing an elevated SIG remains largely speculative. A starting point for designing future studies identifying the nature of the SIG may be the clear association of high SIG values with several specific disease states and/or its treatment. For example, unidentified drug additives and drug metabolites still remain possible candidates, considering the association of an increased SIG with hepatic dysfunction14. In our study, we detected a peak in the organic acid profile, co-eluting with the Krebs cycle intermediate fumaric acid. Using mass-spectrometric analysis, this peak could be attributed to an antibiotic or antibiotic derived metabolite. Second, the clear association of an elevated SIG with renal failure still suggests that uremic compounds, at least partially, play a role. Third, the high incidence of sepsis in the high SIG group suggests a specific role for this type of shock (or its treatment) in producing unknown negatively charged compounds. A recent study of thirty septic shock patients with metabolic acidosis confirmed the frequent presence of increased levels of unmeasured anions in this specific patient group. Seventy percent of septic shock patients showed an increased SIG, even when applying a relatively high cut-off value of 8 mEq/L7. Interestingly, in this study 23% of the patients with increased levels of unmeasured anions showed normal base excess levels because of the simultaneous presence of hypochloremia, representing an alkalizing effect. In spite of this clear association between sepsis and high levels of unmeasured anions, the source of these negatively charged compounds in sepsis is still unknown and could be related to both cellular hypoxia and specific inflammatory products. Furthermore, the association between sepsis and the presence of high levels of unmeasured anions may be confounded by concurrent renal failure in septic patients, although there was no difference in the incidence of renal failure between septic and non-septic subjects in our study. Future studies should focus on this aspect.
important clinical implications. Clinicians caring for the critically ill should be properly informed about the presence of markers of shock or specific metabolic derangements, which may have impact on the ability to identify the underlying disease and therapeutic options. Furthermore, they should be able to identify factors that may contribute to morbidity and outcome. The presence of strong anions, that contribute to the acidosis and may have an impact on outcome, can be easily and reliably detected by calculation of an AGcorr. Our study suggests that a SIG level of >2 mEq/L can be considered abnormal in critically ill patients, as normal AGcorr levels (<12 mEq/L) correlated with SIG levels < 2 mEq/L.
More and more recent studies underline the importance of the Stewart approach, also in patients with an apparently normal acid base state. In patients with pH and base excess values within the normal range, there might well be a significant underlying acidosis due to lactate or other strong anions, which is masked by a concomitant metabolic alkalosis secondary to increased SIDapp or hypoalbuminema8. In this way, a clinically relevant hyperlactatemia can be missed when the clinician confines to the traditional acid-base analysis: combined abnormalities resulting in normal pH and base excess are not necessarily equal to normal. Therefore, recent studies on this subject suggest measuring lactate levels in all admissions2, irrespective of pH and base excess.
In conclusion, at present, considering the evidence, it is generally accepted that the minimum diagnostic work-up that should be done in an ICU patient with a metabolic acidosis is calculation of an albumin corrected anion gap. In addition, measuring lactate levels is reasonable in all admissions. The nature of the strong ion gapWe investigated the nature of the unknown components that constitute the strong ion gap (SIG) in chapter 3, because its identity was unclear and a significant association with poor outcome was reported repeatedly in different subsets of ICU patients5,9-12, even in a subgroup of trauma patients with normal admission lactate6. To this end, we studied 31 consecutive critically ill patients with metabolic acidosis and compared two groups: patients with SIG of <2 mEq/L and patients with SIG of >5 mEq/L. We performed amino acid and uric acid analysis, organic acid analysis by various chromatography/mass spectrometry techniques and Hydrogen-1 Nuclear Magnetic Resonance Spectroscopy. We demonstrated that only 7.9% of the difference in SIG between the low (≤2 mEq/L) and high (≥5 mEq/L) SIG groups could be explained by the presence of high concentrations of amino acids, uric acid, and organic acids. As a single compound, uric acid was responsible for approximately one quarter of the identified SIG. The role of Krebs cycle anions,

118 119
CHAPTER 7 SUMMARY AND GENERAL DISCUSSION
7metabolic acidosis were compared with healthy volunteers19. In accordance with our results, these authors found that patients with higher urinary SID (qualified as inappropriate renal compensation) had more severe acidosis. The relation between urinary SID and renal function was not subject of this study. Also, recently, an experimental study investigating the effects of several infused crystalloids with a different SIDapp on acid-base status of healthy pigs with normal kidney function was published 20. In this study, the renal response to the infused solutions was evaluated by measuring urine output and urinary anion gap. The authors found that variations in plasma SIDapp were significantly correlated with variations in the urinary anion gap. Importantly, these changes in urinary anion gap were only related to both urinary [Na+] and [Cl-]. In contrast, urinary [K+] changes were only associated with potassium load during infusions and not with urinary anion gap changes. Again, this study confirms the important role of renal chloride excretion (relative to sodium excretion) in acid base regulation. Furthermore, recently, several chloride carriers in the proximal tubules and distal nephron are identified that illustrate the role of chloride in renal acid-base regulation21-23.
Apart from exploring the relevance of renal anion excretion in metabolic acidosis, we also confirmed that increased levels of SIG and the weak acid phosphate largely explained the acidosis of patients with renal failure. This was previously reported in a study comparing acidotic ICU patients with acute renal failure with ICU patients without renal dysfunction24. The greater SIG values associated with declined renal function are probably explained by a decreased renal clearance of these anions. The importance of renal chloride excretion to correct for acidosis has implications for clinical practice. Clinicians should be aware that, particularly in renal failure patients, massive chloride loading with unbalanced fluids like classic crystalloids and colloids is likely to induce iatrogenic hyperchloremic acidosis25. This is probably not just an irrelevant metabolic phenomenon that can be ignored, as it might contribute to alterations in inflammatory response and organ dysfunction26-
29. Moreover, a recent prospective study of severe sepsis and septic shock patients reports decreased admission inorganic ion difference (attributable to hyper-chloremia) to be independently associated with mortality30. Although up to now human clinical studies are inconclusive with respect to effects on outcome, it appears reasonable that hyperchloremic acidosis should be avoided whenever possible. Therefore, balanced fluids, which contain less chloride, are preferable, especially in renal failure patients whenever substantial volume resuscitation is indicated. So far, few studies have focused on the clinical effects of implementing a ‘balanced’ fluid strategy in critically ill patients. In a recent prospective, open label study of the effects of rigorously restricting chloride-rich fluids in a tertiary ICU, the incidence of severe metabolic acidosis decreased from 9.1% to 6.1% (with a
The association between increased SIG and unfavorable outcome, independent of lactate, is again confirmed following our report in a retrospective study of cardiac arrest patients treated with mild therapeutic hypothermia15 and even in a general ICU population with normal base excess16. Therefore, an increased SIG is likely to be a surrogate marker of tissue damage.
However, in light of all this, it is important to mention that controversy remains in the literature regarding normal values for SIG in critically ill patients, and thus, the definition of an abnormal SIG with associated adverse outcome.
The role of renal (dys)functionAccording to the quantitative physico-chemical approach of Stewart, the only possible mechanism for the kidneys to correct acidosis, whatever its cause, is increasing the serum strong ion difference by excreting chloride together with NH4
+17. This is reflected by a decreased urinary strong ion difference. Theoretically, decreased renal function could result in an impaired ability to correct pH. This concept was previously clinically studied in 12 patients with primary distal RTA (renal tubular acidosis), a genetic disorder in which renal chloride excretion is impaired18. Compared with healthy controls, these patients showed a significant increase in plasma chloride after an intravenous saline bolus, which correlated with decreased fractional chloride excretion in the urine and a decrease in plasma pH. However, until now, this concept was not studied in critically ill patients.
Therefore, in chapter 4, we examined the renal defense mechanism against acidosis by measuring urinary strong ion excretion in 65 consecutive critically ill patients suffering from metabolic acidosis. Higher plasma creatinine concentrations were significantly associated with greater urinary simplified SID values (urinary [Na+]-[Cl-]), and subsequently, these were significantly related to lower blood pH levels. These findings suggest that less urinary strong anion excretion during renal failure represents a determinant of the metabolic acidosis in these patients. This study further illustrated the central role the kidneys play in acid base regulation. As urinary chloride excretion was hampered in patients with decreased renal function in our study, we concluded that these patients fail to compensate for their acidotic state, resulting in a more pronounced and sustained acidosis in patients with impaired renal function.
Our study was the first to examine urinary strong ion excretion and acid-base status in relation to renal function in critically ill patients and illustrated the importance of renal chloride excretion to correct for acidosis. Concurrently with our study, a prospective observational study was reported in which 98 ICU patients with

120 121
CHAPTER 7 SUMMARY AND GENERAL DISCUSSION
7This was the first study in which the Stewart approach was used in ICU patients with metabolic alkalosis. Again, these results demonstrate the central role of the kidneys in acid base regulation and the utility of the Stewart approach to offer an advanced understanding. Although this study increased our insight in the renal handling of strong ions during acid base derangements and the influence of pharmacological intervention, clinical implications at the bed site may not be apparent. Interestingly however, the previously mentioned study of renal tubular acidosis (RTA) patients18 confirms our results regarding the role of the kidneys in acid base regulation. The increase in plasma chloride after intravenous chloride loading in RTA patients, but not in controls, was inversely associated with fractional excretion of chloride and correlated with blood pH. Similar to our results, the authors concluded that the metabolic acidosis was better explained by changes in urinary strong ion difference (the Stewart theory) than by changes in urinary bicarbonate excretion.
Part three: apparent normal acid base state in the ICU
In this part of the thesis, we investigated the characteristics of Stewart parameters in 312 critically ill patients with normal pH on day 3, 4 or 5 following ICU admission, described in chapter 6. We described the Stewart parameters in 137 patients with an apparently normal acid base state according to the traditional criteria (pH, PaCO2 and BE within the normal reference range). Furthermore, we explored the kinetics of the acid base parameters during the first week of ICU admission to gain insight in the way an apparently normal acid base state in critically ill patients originates and, subsequently, how it evolves.
Stewart parameters in three groups with normal pHApproximately 50% of our studied ICU patients with normal pH had an underlying mixed acid base disorder according to conventional criteria (either abnormal BE and/or PaCO2). However, even critically ill patients with an apparently normal acid base state according to these criteria (pH, PaCO2 and BE all within the reference range) had an underlying mixed acid base disorder that became apparent using the Stewart approach. Compared with data reported from normal subjects 19,34-36, this metabolic derangement was characterized by a combination of a low SIDapp (due to hyperchloremia), increased SIG (both acidifying effects) and a low level of the weak acid albumin (alkalising effect). Apparently, traditional methods of assessing acid base status fail to diagnose complicated acid base disorders in critically ill patients. Although other authors mentioned previously that acid-base differences between healthy volunteers and ICU patients are likely to be present 36,37, as far as we know our study is the first to report a detailed quantitative analysis of a large group of critically ill patients with an apparently normal acid base status.
decrease in incidence of hyperchloremia and hypernatriemia), but at the cost of an increased incidence of severe metabolic alkalosis (10.4% to 14.7%)31. So, apparently, just abandoning prescriptions of chloride-rich fluids in our intensive care unit is not the simple answer to the problem of iatrogenic acid base disorders. Probably, not only the volume but also the composition of IV fluids should be carefully titrated according to the specific, individual needs of the patient. However, whether such policy will have impact on clinical outcome is not clear at this moment. A recently published review concludes, because of the lack of convincing evidence for clinically relevant adverse effects of hyperchloremic acidosis and the limited published information on the effects of balanced solutions on outcome, that the change of routine practice to balanced colloids cannot be recommended32. Nevertheless, balanced colloids are increasingly used in Dutch hospitals.
Part two: metabolic alkalosis in the ICU
In the second part of the thesis, we focused on renal handling of strong ions during metabolic alkalosis in critically ill patients. In chapter 5, we examined the mechanism of action of the carbonic anhydrase inhibitor acetazolamide in 15 ICU patients suffering from metabolic alkalosis. Acetazolamide is clinically used to correct metabolic alkalosis, and thereby to facilitate weaning from mechanical ventilation33. To this end, we studied the urinary excretion of electrolytes and the resulting change in serum pH and Stewart parameters during the 72h after a single intravenous administration of acetazolamide. We showed that the maximal and sustained correction of serum pH after 24 h was completely explained by a significant decrease in serum SIDapp secondary to an increase in serum chloride. Through inhibition of carbonic anhydrase in the proximal tubule, reabsorption of chloride was facilitated, which was demonstrated by a significant rise in urinary SID after administration of acetazolamide. Other independent determinants of serum pH where not significantly altered apart from a small decrease in weak acid phosphate that has an opposite, alkalizing, effect on serum pH. Acetazolamide-induced loss of bicarbonate was not the cause of correction of pH (as it is a dependent parameter), but facilitated renal reabsorption of chloride, while sodium could still be excreted. The pharmacologic effect of a single dose of acetazolamide seemed to exceed its serum half-life (6–8 hours), which was reflected by the 24-hour duration of altered urinary sodium and chloride excretion. Furthermore, the correction of serum pH was sustained after 24 hours although urinary electrolyte excretion returned to pre-administration values. Apparently, the alkalizing factors that were originally present in our patients were corrected during the course of the 3 day observation period.

122 123
CHAPTER 7 SUMMARY AND GENERAL DISCUSSION
7analysis also play a role. Potential candidates include infused volume and electrolytes in the first two days of admission, anion flux from the intracellular compartment and, as mentioned above, presumably increased renal chloride retention as an adaptive response to the alkalising factor hypoalbuminemia. SIG levels in the patients with normal pH were independently related to creatinine levels, the presence of sepsis at admission and SIG levels during admission. Together, these three factors accounted for 28% of the observed high SIG levels during normal pH. So, again, other factors apparently play an important role, for example persistent occult tissue hypoperfusion or hepatic dysfunction. Also, the administration of acetaminophen, especially in combination with antibiotics like flucloxacillin and/or depleted glutathion reserves can cause high levels of pyroglutamic acid42. However, in our study described in chapter 2b as well as a previously published study43 on the nature of high SIG levels, pyroglutamic acid was not a significant contributing factor. Gelatins, which are comprised of negatively charged polypeptides, are a known source of ‘unmeasured’ anions 44, but were not used in our patients during the conduct of the study. As mentioned previously, the nature of the increased SIG in ICU patients in general is currently largely unknown and likely multifactorial 41.
In summary, we conclude that the Stewart approach to acid base balance provides more insight in the prevalence and nature of metabolic acid base derangements in critically ill patients. The more descriptive, traditional Henderson Hasselbalch approach (combined with a base excess) offers a fast bedside quantification of the metabolic component of an acid-base derangement. However, due to its simplicity and assumption of normality of relevant parameters that are often abnormal in the critically ill, clinicians not aware of these limitations will falsely diagnose the cause of complex metabolic derangements. In contrast, the Stewart approach offers a powerful tool to rigorously quantify the relative contribution of all relevant factors in a metabolic acid-base disturbance. Furthermore, it results in improved under- standing of the role of several contributing factors such as renal dysfunction and therapeutic interventions. However, the superiority of the Stewart approach in clinical practice might be debated. For example, it is more cumbersome for clinical management due its complexity. Also, opponents of the Stewart approach question the role of bicarbonate as a dependent variable not influencing pH and criticize the emphasis Stewart places on the important role of strong ions45,46. Therefore, the traditional approach is still preferred by many. However, if the role of weak acids is considered during traditional analysis of a metabolic acid-base disturbance, by using the albumin corrected anion gap, advantages of both methods are nicely combined. In this way, complex calculations at the bedside can be avoided.
Moreover, our findings suggest that low SIDapp could be viewed as an adaptive phenomenon (in response to the high SIG and low albumin levels) during critical illness. Hypoalbuminemia (an alkalising factor) is often considered to be an inevitable event in critically illness, and albumin doesn’t seem to be a regulated variable for acid base purposes. Accordingly, increased SIG levels are probably a result of organ dysfuncion and the underlying disease or its therapy (see later). However, the low SIDapp values may (at least partially) be an appropriate renal response to the alkalising effect of hypoalbuminemia. In this view, our results illustrate that in case of hypoalbuminemia SIDapp is reset to a lower level in order to maintain pH, as previously suggested 36,38. On the other hand, we cannot exclude the possibility of hypoalbuminemia being an adaptive response to the high SIG levels and/or low SIDapp levels associated with the sequellae of critical illness.
Kinetics of Stewart parametersWe found that levels of SIDapp returned to levels almost completely comparable with healthy subjects during the first week of ICU admission, irrespective of whether patients had a mixed acid base disorder (according to traditional criteria) or not. Additionally, following normalisation of pH, SIG levels remained higher than levels reported for healthy subjects and hypoalbuminemia persisted. This is in accordance with the recent study of Gunnerson et al, who reported the data of 15 stable ICU patients just before ICU discharge. The decrease in SIG levels prior to normalization of pH is probably related to (partial) resolution of disease. High (pre-resuscitation) SIG levels during admission in ICU are known to be related to the presence of sepsis, renal and hepatic dysfunction and are probably a marker of tissue hypoperfusion as well 8,39-41. Possibly, in our study, when pH is normalized, SIG levels are decreased as a result of (partial) recovery of organ function or for example institution of renal replacement therapy. The increase of SIDapp levels following normalization of pH in our study is almost completely explained by a decrease in chloride levels and might be related to further recovery of renal function. For example, the ability to excrete excess chloride in urine is related to renal function, as previously described in chapter 2c. Furthermore, large amounts of intravenous unbalanced fluids are unlikely to be administered in a more stable phase of disease.
Covariates that modulate acid-base balanceBy using multivariate linear regression analysis, we found that low SIDapp levels during normal pH were independently related to admission SIDapp levels, low cation loading and high chloride loading 24 hours before normal pH. Together, these three factors accounted for only 40% of the observed SIDapp levels during normal pH. Dilution (electrolyte free volume load) and diuretic use did not reach significance following multivariate analysis. Apparently, other factors not accounted for in the

124 125
CHAPTER 7 SUMMARY AND GENERAL DISCUSSION
7References
1. Mikulaschek A, Henry SM, Donovan R, Scalea TM. Serum lactate is not predicted by anion gap or base excess after trauma resuscitation. The Journal of trauma 1996;40:218-22; discussion 22-4.
2. Chawla LS, Shih S, Davison D, Junker C, Seneff MG. Anion gap, anion gap corrected for albumin, base deficit and unmeasured anions in critically ill patients: implications on the assessment of metabolic acidosis and the diagnosis of hyperlactatemia. BMC emergency medicine 2008;8:18.
3. Tuhay G, Pein MC, Masevicius FD, Kutscherauer DO, Dubin A. Severe hyperlactatemia with normal base excess: a quantitative analysis using conventional and Stewart approaches. Crit Care 2008;12:R66.
4. Dubin A, Menises MM, Masevicius FD, et al. Comparison of three different methods of evaluation of metabolic acid-base disorders. Critical care medicine 2007;35:1264-70.
5. Gunnerson KJ, Saul M, He S, Kellum JA. Lactate versus non-lactate metabolic acidosis: a retrospective outcome evaluation of critically ill patients. Crit Care 2006;10:R22.
6. Martin M, Murray J, Berne T, Demetriades D, Belzberg H. Diagnosis of acid-base derangements and mortality prediction in the trauma intensive care unit: the physiochemical approach. The Journal of trauma 2005;58:238-43.
7. Mallat J, Michel D, Salaun P, Thevenin D, Tronchon L. Defining metabolic acidosis in patients with septic shock using Stewart approach. The American journal of emergency medicine 2011.
8. Makino J, Uchino S, Morimatsu H, Bellomo R. A quantitative analysis of the acidosis of cardiac arrest: a prospective observational study. Crit Care 2005;9:R357-62.
9. Kaplan LJ, Kellum JA. Initial pH, base deficit, lactate, anion gap, strong ion difference, and strong ion gap predict outcome from major vascular injury. Critical care medicine 2004;32:1120-4.
10. Dondorp AM, Chau TT, Phu NH, et al. Unidentified acids of strong prognostic significance in severe malaria. Critical care medicine 2004;32:1683-8.
11. Balasubramanyan N, Havens PL, Hoffman GM. Unmeasured anions identified by the Fencl-Stewart method predict mortality better than base excess, anion gap, and lactate in patients in the pediatric intensive care unit. Critical care medicine 1999;27:1577-81.
12. Durward A, Tibby SM, Skellett S, Austin C, Anderson D, Murdoch IA. The strong ion gap predicts mortality in children following cardiopulmonary bypass surgery. Pediatric critical care medicine : a journal of the Society of Critical Care Medicine and the World Federation of Pediatric Intensive and Critical Care Societies 2005;6:281-5.
13. Forni LG, McKinnon W, Lord GA, Treacher DF, Peron JM, Hilton PJ. Circulating anions usually associated with the Krebs cycle in patients with metabolic acidosis. Crit Care 2005;9:R591-5.
14. Naka T, Bellomo R, Morimatsu H, et al. Acid-base balance in combined severe hepatic and renal failure: a quantitative analysis. The International journal of artificial organs 2008;31:288-94.
15. Funk GC, Doberer D, Sterz F, et al. The strong ion gap and outcome after cardiac arrest in patients treated with therapeutic hypothermia: a retrospective study. Intensive care medicine 2009;35:232-9.
16. Antonini B, Piva S, Paltenghi M, Candiani A, Latronico N. The early phase of critical illness is a progressive acidic state due to unmeasured anions. European journal of anaesthesiology 2008;25:566-71.
17. Kellum JA. Determinants of blood pH in health and disease. Crit Care 2000;4:6-14.18. Corey HE, Vallo A, Rodriguez-Soriano J. An analysis of renal tubular acidosis by the Stewart method.
Pediatr Nephrol 2006;21:206-11.19. Masevicius FD, Tuhay G, Pein MC, Ventrice E, Dubin A. Alterations in urinary strong ion difference in
critically ill patients with metabolic acidosis: a prospective observational study. Critical care and resuscitation : journal of the Australasian Academy of Critical Care Medicine 2010;12:248-54.
20. Langer T, Carlesso E, Protti A, et al. In vivo conditioning of acid-base equilibrium by crystalloid solutions: an experimental study on pigs. Intensive care medicine 2012;38:686-93.
21. Romero MF. Molecular pathophysiology of SLC4 bicarbonate transporters. Current opinion in nephrology and hypertension 2005;14:495-501.
22. Sindic A, Chang MH, Mount DB, Romero MF. Renal physiology of SLC26 anion exchangers. Current opinion in nephrology and hypertension 2007;16:484-90.
In spite of our research, several aspects of acid- base derangements in the critically ill, using the Stewart approach, still remain unresolved. Therefore, future studies may focus on the still largely unidentified part of the SIG, its underlying metabolic derangements and its prognostic relevance. Designing a study with a more homogeneous study population, for example by selecting only patients with a specific disease state such as renal failure may facilitate identification of part of the SIG. Furthermore, the clinical significance of hyperchloremic acidosis must be further evaluated as well as the effects of different balanced fluids in critical care with respect to clinical end points.

126 127
CHAPTER 7 SUMMARY AND GENERAL DISCUSSION
745. Siggaard-Andersen O, Fogh-Andersen N. Base excess or buffer base (strong ion difference) as measure of a non-respiratory acid-base disturbance. Acta anaesthesiologica Scandinavica Supplementum 1995;107:123-8.
46. Kurtz I, Kraut J, Ornekian V, Nguyen MK. Acid-base analysis: a critique of the Stewart and bicarbonate- centered approaches. American journal of physiology Renal physiology 2008;294:F1009-31.
23. Yunos NM, Bellomo R, Story D, Kellum J. Bench-to-bedside review: Chloride in critical illness. Crit Care 2010;14:226.
24. Rocktaeschel J, Morimatsu H, Uchino S, et al. Acid-base status of critically ill patients with acute renal failure: analysis based on Stewart-Figge methodology. Crit Care 2003;7:R60.
25. Morgan TJ, Venkatesh B, Hall J. Crystalloid strong ion difference determines metabolic acid-base change during in vitro hemodilution. Critical care medicine 2002;30:157-60.
26. Kellum JA, Song M, Almasri E. Hyperchloremic acidosis increases circulating inflammatory molecules in experimental sepsis. Chest 2006;130:962-7.
27. Kellum JA. Fluid resuscitation and hyperchloremic acidosis in experimental sepsis: improved short-term survival and acid-base balance with Hextend compared with saline. Critical care medicine 2002;30:300-5.
28. Haque IU, Huang CJ, Scumpia PO, Nasiroglu O, Skimming JW. Intravascular infusion of acid promotes intrapulmonary inducible nitric oxide synthase activity and impairs blood oxygenation in rats. Critical care medicine 2003;31:1454-60.
29. Wilcox CS. Regulation of renal blood flow by plasma chloride. The Journal of clinical investigation 1983;71:726-35.
30. Noritomi DT, Soriano FG, Kellum JA, et al. Metabolic acidosis in patients with severe sepsis and septic shock: a longitudinal quantitative study. Critical care medicine 2009;37:2733-9.
31. Yunos NM, Kim IB, Bellomo R, et al. The biochemical effects of restricting chloride-rich fluids in intensive care. Critical care medicine 2011;39:2419-24.
32. Guidet B, Soni N, Della Rocca G, et al. A balanced view of balanced solutions. Crit Care 2010;14:325.33. Berthelsen P, Gothgen I, Husum B, Jacobsen E. Oxygen uptake and carbon dioxide elimination after
acetazolamide in the critically ill. Intensive care medicine 1985;11:26-9.34. Park M, Taniguchi LU, Noritomi DT, Liborio AB, Maciel AT, Cruz-Neto LM. Clinical utility of standard
base excess in the diagnosis and interpretation of metabolic acidosis in critically ill patients. Brazilian journal of medical and biological research = Revista brasileira de pesquisas medicas e biologicas / Sociedade Brasileira de Biofisica [et al] 2008;41:241-9.
35. Gunnerson KJ, Kellum JA. Acid-base and electrolyte analysis in critically ill patients: are we ready for the new millennium? Current opinion in critical care 2003;9:468-73.
36. Gunnerson KJ, Srisawat N, Kellum JA. Is there a difference between strong ion gap in healthy volunteers and intensive care unit patients? Journal of critical care 2010;25:520-4.
37. Figge J, Mydosh T, Fencl V. Serum proteins and acid-base equilibria: a follow-up. The Journal of laboratory and clinical medicine 1992;120:713-9.
38. Wilkes P. Hypoproteinemia, strong-ion difference, and acid-base status in critically ill patients. J Appl Physiol 1998;84:1740-8.
39. Kellum JA, Bellomo R, Kramer DJ, Pinsky MR. Hepatic anion flux during acute endotoxemia. J Appl Physiol 1995;78:2212-7.
40. Kellum JA, Kramer DJ, Pinsky MR. Strong ion gap: a methodology for exploring unexplained anions. Journal of critical care 1995;10:51-5.
41. Moviat M, Terpstra AM, Ruitenbeek W, Kluijtmans LA, Pickkers P, van der Hoeven JG. Contribution of various metabolites to the “unmeasured” anions in critically ill patients with metabolic acidosis. Critical care medicine 2008;36:752-8.
42. Dempsey GA, Lyall HJ, Corke CF, Scheinkestel CD. Pyroglutamic acidemia: a cause of high anion gap metabolic acidosis. Critical care medicine 2000;28:1803-7.
43. Mizock BA, Belyaev S, Mecher C. Unexplained metabolic acidosis in critically ill patients: the role of pyroglutamic acid. Intensive care medicine 2004;30:502-5.
44. Hayhoe M, Bellomo R, Liu G, McNicol L, Buxton B. The aetiology and pathogenesis of cardiopulmo-nary bypass-associated metabolic acidosis using polygeline pump prime. Intensive care medicine 1999;25:680-5.

Nederlandse samenvattingChapter 8

131
NEDERLANDSE SAMENVATTING
8Introductie
Zuur-base stoornissen komen vaak voor bij ernstig zieke Intensive Care (IC-) patiënten en hebben, afhankelijk van de oorzaak, invloed op de ernst en de uitkomst van de ziekte. Zo heeft bijvoorbeeld een ernstig verlaagde zuurgraad als gevolg van een stoornis in de stofwisseling (een metabole acidose) een negatieve invloed op verschillende orgaanfuncties en is deze voorspellend voor een slechtere uitkomst. De Intensive Care arts moet dan ook kennis en een goed begrip hebben van de normale zuur-base regulatie en het ontstaan van afwijkingen hierin. De zuurgraad (pH) van het bloed wordt bepaald door de concentratie H+ ionen. Om de oorzaak van een zuur-base stoornis te achterhalen zijn verschillende analyse-methoden ontwikkeld sinds het begin van de 20e eeuw. Al deze methoden komen overeen wat betreft de beschrijving van de invloed van afwijkingen in de koolzuur-spanning in het bloed (PCO2) op de pH, die vooral door stoornissen in de ademhaling ontstaan. De methoden verschillen echter in de manier waarop zij de invloed van afwijkingen in de stofwisseling op de pH vaststellen: de zogenaamde metabole component. De oudste methode om de oorzaak van een zuur-base stoornis te diagnosticeren (uit 1916) komt voort uit het werk van Henderson en Hasselbalch. Deze methode, ook wel de‘traditionele’ methode genoemd, kan een stoornis in de ademhaling als oorzaak van een zuur-base stoornis goed vaststellen. Bepaling van de ernst en vooral de aard van complexe metabole stoornissen lukt met de traditionele methode echter veel minder goed. De laatste 20 jaar wint een kwantitatieve fysisch-chemische benadering van zuur-base stoornissen terrein, voor het eerst beschreven in 1980 door Peter Stewart. De Stewartmethode lijkt namelijk beter dan de traditionele methode in staat complexe metabole stoornissen te identificeren en kwantificeren. De Stewartmethode is echter wel ingewikkelder en bewerkelijker.
De Stewartmethode
Bij de zuur-base analyse volgens Stewart staat het concept centraal dat de pH van het bloed alleen kan veranderen door verandering van de mate van uiteenvallen (dissociatie) van water in H+ ionen en OH- ionen. Het menselijk lichaam bestaat voor een groot gedeelte (50-60%) uit water en is daarom een onuitputtelijke bron van H+ ionen. Daarnaast zijn voor de Stewartmethode de wetten van behoud van massa en elektroneutraliteit van belang. Verandering in de dissociatie van water (en dus verandering van pH) kan, volgens Stewart, alleen plaatsvinden door de invloed van drie onafhankelijke factoren:

132 133
CHAPTER 8 NEDERLANDSE SAMENVATTING
8Deel 1. Oorzaken van metabole acidose op de Intensive Care
volgens Stewart
De Stewartmethode versus de traditionele methodeHoofdstuk 2 beschrijft een studie waarin de oorzaken van een metabole acidose bij IC-patiënten worden onderzocht. Hierbij vergelijken we de traditionele methode met de Stewartmethode wat betreft diagnostische accuraatheid en de toepas-baarheid in de dagelijkse IC-praktijk. We stellen vast dat metabole acidose bij IC-patiënten een complex, multifactorieel ziektebeeld is. Zowel een hoog gehalte aan chloride (hyperchloremie) en lactaat (hyperlactatemie) als een verhoogde SIG (ongemeten negatief geladen deeltjes, zie boven) komen vaak voor. Bij ongeveer de helft van de patiënten zijn deze drie factoren gelijktijdig verantwoordelijk voor de acidose. De traditionele methode, gecombineerd met een (ongecorrigeerde) anion gap, blijkt te weinig gevoelig te zijn om hyperlactatemie te detecteren. Hyperlac-tatemie mag in de praktijk niet over het hoofd worden gezien. Het is namelijk meestal een uiting van te weinig zuurstofaanbod aan de weefsels (wat consequenties heeft voor de behandeling) en is voorspellend voor een slechtere uitkomst. Een ’anion gap’ gecorrigeerd voor het serum albumine kan hyperlactatemie beter detecteren. Bovendien blijkt er een zeer sterk verband te bestaan tussen een voor albumine en lactaat gecorrigeerde anion gap en de SIG bij patiënten met een metabole acidose op de IC. Zo kan dus de hoeveelheid ongemeten negatief geladen deeltjes (verantwoordelijk voor de acidose en van invloed op de uitkomst) gemakkelijk bepaald worden zonder dat de complexe berekening van de SIG nodig is. We stellen vast dat een SIG concentratie van > 2mEq/L waarschijnlijk abnormaal is bij IC patiënten, aangezien een normale (gecorrigeerde) anion gap (<12mEq/L) correleert met SIG concentraties van < 2 mEq/L.
De identiteit van de strong ion gapOndanks de duidelijke invloed op de prognose van IC-patiënten is de precieze aard van de negatief geladen deeltjes die de SIG vormen niet duidelijk. Wel is er een duidelijk verband bekend tussen verhoogde SIG en lever- en nierfalen, bloed-vergiftiging (sepsis) en diverse andere vormen van shock. In hoofdstuk 3 zoeken we naar de identiteit van de negatief geladen deeltjes die deel uit maken van de strong ion gap (SIG). Dit doen we door 2 groepen IC-patiënten met een metabole acidose met elkaar te vergelijken: een groep met een lage (<2mEq/L) SIG en een groep met een hoge (≥5 mEq/L) SIG. Door uitgebreide analyse met (onder andere) verschillende chromatografie- en massaspectometrie-technieken hebben we gezocht naar concentratieverschillen tussen de twee SIG groepen van onder andere 25 bekende aminozuren, 9 organische zuren en urinezuur. De meeste van deze stoffen zijn namelijk negatief geladen bij een fysiologische pH. Daarnaast
1. het verschil tussen positief en negatief geladen ionen die volledig opgelost zijn, zogenaamde ‘sterke’ ionen. Dit verschil wordt ‘ apparent strong ion difference’ of SIDapp genoemd
2. de hoeveelheid zwakke zuren in het bloed (vooral albumine en fosfaat)3. de hoeveelheid koolzuur in het bloed.
De SIDapp en de hoeveelheid zwakke zuren kunnen veranderen door stoornissen in het metabolisme. De SIDapp kan dalen door een relatieve afname van gemeten positief geladen deeltjes (kationen) of relatieve toename van gemeten negatief geladen deeltjes (anionen). Meestal daalt de SIDapp door een verhoogde hoeveelheid lactaat of chloride. Door een daling van de SIDapp en/of een toename van de hoeveelheid zwakke zuren dissocieert meer water en zal dus de pH dalen. Omgekeerd: als de SIDapp stijgt en/of de hoeveelheid zwakke zuren daalt dissocieert minder water en zal dus de pH stijgen. Bij gebruik van de Stewartmethode is er daarnaast nog een rol weggelegd voor de zogenaamde ‘strong ion gap’ (SIG). De SIG staat voor de hoeveelheid ongemeten negatief geladen deeltjes, stoffen die niet standaard in het bloed bepaald (kunnen) worden. Die hoeveelheid negatief geladen deeltjes is alleen te bepalen door het verschil in alle gemeten positief en negatief geladen deeltjes in het bloed te berekenen. In deze berekening zijn niet alleen de sterke ionen opgenomen, zoals in de SIDapp, maar ook de lading van bicarbonaat en de zwakke zuren. Als er na deze berekening positieve lading overblijft, is er sprake van een verhoogde SIG. Het lichaam kan immers niet positief of negatief geladen zijn (de wet van behoud van elektroneutraliteit). Een verhoogde SIG betekent dus een verhoogde hoeveelheid negatief geladen stoffen in het bloed, die leidt tot een toename van dissociatie van water (en een daling van de pH). Een verhoogde SIG heeft ook een bewezen negatieve invloed op de prognose van de IC patiënten, vooral als de verhoogde SIG vastgelegd is voor het begin van de therapie.
In dit proefschrift onderzoeken we verschillende aspecten van zuur-base stoornissen bij intensive care (IC) patiënten. Hierbij maken we gebruik van de Stewartmethode. De nadruk ligt hierbij op metabole stoornissen omdat die gemakkelijk over het hoofd gezien kunnen worden bij gebruik van de traditionele methode. Ook heeft de aard van de metabole stoornis invloed op de ernst en uitkomst van de ziekte en is kennis hierover belangrijk bij het bepalen van de juiste therapie. Dit proefschrift bestaat uit drie delen waarin achtereenvolgens aan bod komen: de analyse van IC-patienten met een verlaagde zuurgraad (metabole acidose), een verhoogde zuurgraad (metabole alkalose) en een normale pH.

134 135
CHAPTER 8 NEDERLANDSE SAMENVATTING
8we dat acidose bij nierfalen vooral veroorzaakt wordt door een verhoogde SIG en een hoge concentratie fosfaat (een zwak zuur). De verhoogde SIG wordt waarschijnlijk veroorzaakt door verminderde uitscheiding van ongemeten negatief geladen stoffen in de urine. Het belang van renale chlooruitscheiding in de regulatie van pH is relevant voor de klinische praktijk. Vooral bij patiënten met een verminderde nierfunctie zal ruimhartige toediening met ongebalanceerde vloeistoffen zoals bijvoorbeeld ‘fysiologisch zout’ zeer waarschijnlijk een hyperchloremische acidose veroorzaken. ‘Fysiologisch zout’ is een tot nu toe veel gebruikte infuusvloeistof die relatief veel chloride bevat , waardoor de SIDapp in het bloed daalt na toediening van grote hoeveelheden. Aangezien hyperchloremische acidose kan bijdragen aan veranderingen in immuunrespons en orgaandysfunctie, is dit mogelijk een klinisch relevant fenomeen. Hoewel het effect van hyperchloremische acidose op klinische eindpunten als opnameduur en mortaliteit (nog) niet duidelijk is, lijkt het logisch om het, wanneer mogelijk, te voorkomen. Tegenwoordig zijn er zogenaamde ‘gebalanceerde’ infuusvloeistoffen op de markt, waarvan de samenstelling is afgestemd op een normale SIDapp in het bloed. Potentieel zal er daarom geen acidose ontstaan als deze vloeistof in grote hoeveelheid wordt gegeven aan gezonden. Hoewel een effect op klinische uitkomsten van gebalanceerde vloeistoffen in grote groepen ernstig zieke patiënten nog niet is aangetoond, worden ze inmiddels in veel ziekenhuizen gebruikt. Het verdient waarschijnlijk de voorkeur om niet alleen het benodigde volume, maar ook de samenstelling van de infuusvloeistof te titreren op de individuele behoefte van de patiënt.
Deel 2. De Stewartbenadering van metabole alkalose op de Intensive Care
In het tweede deel van het proefschrift ligt de nadruk op renale uitscheiding van sterke ionen tijdens metabole alkalose. Bij IC-patiënten met een metabole alkalose die behandeld worden met een eenmalige intraveneuze dosis acetazolamide, een koolzuuranhydraseremmer, bestuderen we het effect op bloed- en urine waarden volgens de Stewart methode (in hoofdstuk 5). Acetazolamide wordt op de intensive care gebruikt om metabole alkalose te corrigeren en zodoende patiënten gemakkelijker te laten ontwennen van de beademing. De belangrijkste bevinding van onze studie is dat de maximale, blijvende correctie van de serum pH na een dosis acetazolamide volledig verklaard wordt door een daling van de serum SIDapp ten gevolge van een stijging van het serum chloride. De andere onafhankelijke determinanten van de pH in het bloed blijken niet te veranderen, met uitzondering van een lichte daling van het serum fosfaat die juist een alkaliniserend effect heeft. De stijging van het serum chloride na acetazolamide is te verklaren door een verhoogde reabsorptie van chloride die zich uit in een significante stijging van de
kunnen we met deze laboratoriumtechnieken potentieel honderden andere stoffen detecteren. Helaas kunnen we slechts 7.9% van het verschil in SIG tussen deze 2 groepen verklaren door de aanwezigheid van hoge concentraties negatief geladen aminozuren, urinezuur en organische zuren. Urinezuur blijkt verantwoordelijk voor ongeveer een kwart van de geïdentificeerde SIG. In het chromatogram van de aminozuren waren duidelijke pieken aanwezig in de hoge SIG groep, die niet aanwezig waren in de lage SIG groep. Nadere identificatie van deze pieken is nog niet verricht. Wel maken we aannemelijk dat ze wat lading betreft niet meer dan 1.7% aan het verschil in SIG tussen de 2 groepen kunnen bijdragen. We kunnen niet bevestigen dat verhoogde concentraties van de intermediairen van de citroenzuur-cyclus een relevante rol spelen, zoals eerder gesuggereerd in de literatuur. Alle concentraties van de citroencyclus intermediairen vallen binnen de referentiewaar-den. Samenvattend kunnen we over het grootste deel van de bron en identiteit van ongemeten anionen die deel uit maken van de SIG nog steeds alleen maar speculeren, ondanks onze inspanningen.
Toekomstige studies zouden zich kunnen richten op specifieke ziektebeelden die geassocieerd zijn met een verhoogde SIG. Door een meer homogene groep patiënten te selecteren is er wellicht meer kans om de relevante stoffen die bij deze patiënten de SIG vormen te identificeren. Bij patiënten met leverfalen zouden bijvoorbeeld (metabolieten) van medicijnen zoals antibiotica in verhoogde concentratie aanwezig kunnen zijn door verminderde afbraak. Bij patiënten met sepsis zou de verhoogde SIG verband kunnen houden met zuurstoftekort op celniveau (weefsel-schade) of met specifieke ontstekingsproducten. De associatie tussen een verhoogde SIG en slechte uitkomst is inmiddels vaak bevestigd. Dit suggereert dat een verhoogde SIG onder andere een marker is van weefselschade ten gevolge van shock.
De rol van nierfalenIn hoofdstuk 4 onderzoeken we de rol van nierfalen in het ontstaan van metabole acidose. Bij IC patiënten met een metabole acidose hebben we bloed- en urinewaarden van relevante stoffen gemeten. Volgens de Stewart approach is de enige manier waarop de nieren een acidose zouden kunnen corrigeren, ongeacht de oorzaak, de uitscheiding van chloride samen met NH4
+ . Omdat dan namelijk een sterk anion wordt uitgescheiden zonder een sterk kation stijgt de SIDapp in het bloed. In de urine daalt juist de SID door uitscheiding van chloride zonder natrium. Bij IC-patiënten met een metabole acidose is een hogere kreatinine waarde significant geassocieerd met een hogere SID in de urine. Deze hogere urine SID waarden zijn geassocieerd met een lagere pH in het bloed. We concluderen dat verminderde uitscheiding van negatieve ionen bij patiënten met nierfalen een factor is in het ontstaan van metabole acidose bij deze patiënten. Daarnaast bevestigen
136 137
CHAPTER 8 NEDERLANDSE SAMENVATTING
8geassocieerd met de nierfunctie en met de aanwezigheid van sepsis en een hoge SIG tijdens opname.
Tijdens de eerste week van IC-opname stijgt de SIDapp in het bloed tot waarden die vergelijkbaar zijn met die van gezonden. De SIG daalt gedurende de eerste week van opname (waarschijnlijk door herstel van orgaanfunctie en bijvoorbeeld het starten van nierfunctie vervangende therapie), maar blijft hoger dan de waarden bij gezonde proefpersonen. Ook de hypoalbuminemie blijft bestaan.
Samenvattend concluderen we dat de Stewartmethode meer inzicht geeft in het voorkomen en de aard van metabole zuur-base stoornissen bij IC-patiënten. Ook geeft de Stewartmethode een goede indruk van de rol van de nier bij zuur-base stoornissen. De traditionele methode heeft als voordeel dat hij sneller is en een redelijke indruk geeft van de ernst van de metabole stoornis. Complexe stoornissen kunnen met de traditionele methode echter over het hoofd gezien worden, of niet goed worden geïnterpreteerd. Wanneer er bij metabole acidose op de IC de anion gap gecorrigeerd wordt voor albumine, worden de voordelen van beide methoden gecombineerd. Toekomstige studies zouden zich kunnen richten op nog steeds grotendeels onbekende identiteit van de SIG, bijvoorbeeld door een meer geselecteerde patiëntengroep te onderzoeken. Daarnaast moet de klinische relevantie van hyper-chloremische acidose en de effecten van gebalanceerde infuusvloeistoffen op klinische eindpunten beter onderzocht worden.
urine SID. Het door acetazolamide geïnduceerde verlies van bicarbonaat in de urine is, volgens de Stewart benadering, niet de oorzaak van de pH correctie. Bicarbonaat is immers een afhankelijke parameter. Bicarbonaat verlies in de urine maakt de reabsorptie van chloride mogelijk terwijl natrium uitgescheiden kan worden, waardoor de SIDapp in het bloed daalt. Onze resultaten demonstreren de centrale rol van de nieren in de zuur-base regulatie en de bruikbaarheid van de Stewartbenadering om hier meer inzicht in te krijgen.
Deel 3. Stewartanalyse van IC-patiënten met een ogenschijnlijk normaal zuur-base evenwicht
In hoofdstuk 6 beschrijven we Stewartparameters bij IC-patiënten die, volgens de traditionele methode, ogenschijnlijk een normaal zuur-base evenwicht hebben. We wilden vaststellen of deze IC-patiënten inderdaad een volledig normaal zuurbase-evenwicht hebben, of een gecompenseerde of gemengde onderliggende afwijking in het zuurbase-evenwicht. Hiertoe onderzoeken we 312 IC-patiënten met een normale pH op dag 3,4 of 5 na opname op de intensive care. Ongeveer de helft van deze groep heeft een ogenschijnlijk volledig normaal zuur-base evenwicht (normale pH, bicarbonaat en koolzuurspanning). Na analyse volgens de Stewartmethode blijken deze patiënten, vergeleken met gezonde proefpersonen, een gemengde zuur-base stoornis te hebben: een combinatie van lage SIDapp (door hyperchloremie), verhoogde SIG en een verlaagd albumine. De eerste twee factoren hebben een verzurend effect, hetgeen wordt geneutraliseerd door een verlaagd gehalte van het zwakke zuur albumine (hypoalbuminemie). De traditionele methode zal deze gecompliceerde zuur-base stoornis niet aan het licht brengen, immers alle gemeten parameters van de bloedgas zijn normaal. Onze studie is de eerste gedetailleerde kwantitatieve analyse van een grote groep IC-patiënten met een ogenschijnlijk normaal zuur-base evenwicht. Hypoalbuminemie wordt meestal als een onvermijdelijk fenomeen gezien tijdens ernstige ziekte: een gevolg van lekkage uit de bloedbaan en verminderde aanmaak door de lever. Albumine wordt waarschijnlijk niet gereguleerd door het lichaam met het doel om het zuur-base evenwicht te handhaven. Analoog hieraan is de verhoogde SIG waarschijnlijk onder andere een gevolg van verminderde orgaanfunctie en de onderliggende ziekte. De lage SIDapp zou echter (in elk geval ten dele) een afspiegeling kunnen zijn van een aanpassing van de nier aan het alkaliserende effect van de hypoalbuminemie.
Daarnaast tonen we aan dat de lage SIDapp (tijdens normale pH) onafhankelijk geassocieerd is met een lage SIDapp tijdens opname, met een lage hoeveelheid kationen en met een hoge hoeveelheid chloride toegediend in het infuus 24 uur voorafgaand aan de meting. De hoge SIG (tijdens normale pH) was onafhankelijk

DankwoordCurriculum vitae

141
DANKWOORD
Dankwoord
Dit proefschrift is een kwestie geweest van de lange adem. Velen hebben er een bijdrage aan geleverd, al was het maar door geduld en vertrouwen te houden! Ondanks het risico dat ik iemand vergeet, wil ik toch graag een aantal mensen persoonlijk bedanken.
Prof. dr. Van der Hoeven, beste Hans, jij hebt mij al weer lang geleden in het Groot Ziekengasthuis kennis laten maken met klinisch wetenschappelijk onderzoek op de IC. Ik vergeet nooit meer hoe je mij, bij mij thuis in Den Bosch met Dirk op schoot, in 2007 liet beloven dat mijn boekje af zou komen. Alleen onder die voorwaarde mocht ik ‘terug naar Den Bosch’. Bedankt voor je voortdurende vertrouwen en rotsvaste geloof dat die promotie er echt ging komen. Zelf ben ik er niet altijd van overtuigd geweest dat ik de eindstreep zou halen, toch is nu die missie eindelijk volbracht! Ook wil ik je bedanken dat jij mij hebt ‘binnengehaald’ in de Intensive Care. Na de IC-stage in Den Bosch 12 jaar geleden was ik verkocht en heb nog elke dag plezier van mijn keuze destijds om intensivist te worden. Als een van de eerste fellows van jouw opleiding in Nijmegen, samen met vele bossche collega’s, was het een intensieve, maar geweldig leuke en leerzame tijd. Als geen ander weet jij je passie en enthousiasme voor het vak over te brengen en mensen te inspireren om het beste in zichzelf boven te halen.
Prof. Dr. Pickkers, beste Peter, jij bent een briljante wetenschapper, vol originele ideeën en met een groot vermogen anderen te motiveren en mee te laten delen in je successen en goede ingevingen. Niet voor niets al zo jong professor, met een grote club goede, gedreven en veelbelovende jonge wetenschappers om je heen, die terecht allemaal graag blijven. Ook uniek door je ‘specifieke’ humor. Ik heb grote bewondering voor jouw optimisme en tomeloze energie. Altijd zie je wel een oplossing voor problemen met data, formuleringen en ander (voor jou niet bestaand) wetenschapsleed. Zonder jou was dit proefschrift er waarschijnlijk niet geweest. Dank voor je enthousiaste begeleiding en steeds zeer waardevolle inbreng.
Dr. Van der Voort, beste Peter, hartelijk dank voor je hulp als co-promotor en belangstelling ‘op afstand’ vanuit Amsterdam. Ik ben blij dat, na alle inspanningen, ook de data uit het OLVG de basis vormen voor een mooi hoofdstuk in dit proefschrift.
Beste leden van de manuscriptcommissie: prof Wetzels, Prof Willems en prof Groeneveld, hartelijk dank voor het beoordelen van dit proefschrift.

142 143
DANKWOORD DANKWOORD
Onze verpleegkundigen wil ik bedanken voor de afname van bloed- en urinemonsters bij de eerste studie, nog in het oude GZG, en voor de fijne samenwerking de afgelopen jaren.
Murielle, jou wil ik bedanken voor je steun, vanaf de begintijd al. Mijn eerste voordracht heb ik eindeloos op jou in Barcelona mogen oefenen, tot de slappe lach aan toe.
Mijn paranimfen, dames van de elite-appeltaart-club, en goede vriendinnen: Carine en Sas, dank voor al het moois dat we samen hebben meegemaakt sinds de Maastricht-tijd. Teveel om op te noemen. Inmiddels alle drie een prachtig gezin en een carrière, wat willen we nog meer... Ik ben er hartstikke trots op dat jullie straks naast mij staan. Carine, bedankt voor je prachtige ontwerp van de cover, het was geen gemakkelijke klus met zo’n ingewikkeld en droog onderwerp! Ik ben enorm blij met het kleurrijke resultaat.
Pap en Mam, dank voor het continue vertrouwen dat jullie altijd in mij gehad hebben, en de vrijheid en kansen die ik gekregen heb.
Tenslotte, ‘last but certainly not least’, Koert, dank voor je geduld en vertrouwen. Bijna trotser op het resultaat dan ik zelf ben. Al zoveel mooie jaren samen, 2 prachtige kinderen, we zijn ons erg bewust van het geluk dat we hebben. Hopelijk wacht ons een lange toekomst. Aan ons zal het in elk geval niet liggen...
Miriam
Dr. Van den Boogaard, beste Mark, SPSS koning, ook jou ben ik veel dank verschuldigd. Het lijkt wel of jij van je werk je hobby hebt gemaakt. Steeds bereid even tussendoor een extra analyse te doen of een praktische vraag te beantwoorden, zelfs tijdens de eindsprint voor je eigen promotie, waarbij je een zeer indrukwekkend proefschrift schijnbaar moeiteloos hebt geproduceerd.
Beste Anniek, vele uren en energie stak jij in het laboratoriumwerk en vooral de soms zeer ingewikkelde statistische analyses. Het was voor jou niet altijd even gemakkelijk om aansluiting te vinden bij ons, ‘simpele’ klinische denkers. Jouw hulp is van grote waarde geweest. Mede dankzij jouw perfectionisme en doorzettingsvermogen kunnen we samen trots zijn op 2 prachtige publicaties!
Wim Ruitenbeek, Leo Kluijtmans, Udo Engelke en de analysten van het laboratorium Genetische Endocriene en Metabole Ziekten, hartelijk dank voor jullie bijdrage aan de zoektocht naar de ‘ongemeten anionen’.
Beste Femke, hartelijk dank voor alle moeite die je hebt gedaan voor de data verwerking en analyse. Heel knap hoe je dat wist te combineren met je fellow-bestaan en niet te vergeten drukke gezin. Girlpower!
Beste Tijn, mede-bosschenaar, en de andere researchverpleegkundigen in het UMC St Radboud, dank voor jullie hulp bij het verzamelen van de data. Zonder jullie was het niet te doen geweest in mijn assistenten- en fellowtijd en later vanuit Den Bosch. Hartstikke mooi dat mede door jullie inspanningen er alweer een proefschrift af is!
Mark Vermeer en Saskia Rijkenberg , ook jullie wil ik bedanken voor jullie hulp bij het verzamelen van de data in Den Bosch en Amsterdam.
Peter en Mari, ‘Statler en Waldorf’, op jullie welbekende bescheiden maar zeer deskundige manier hebben jullie mij geholpen bij het ‘toveren’ van data uit Metavision.
Judith en Leanne, hartelijk dank voor jullie betrokkenheid, kledingadviezen en niet te vergeten geweldige secretariële ondersteuning.
Mijn collega’s op de vloer: Koen, Peter, Astrid, Wim, Florens en Anne, dank voor jullie betrokkenheid en bemoedigende woorden. Ik kreeg van jullie de ruimte om mijn proefschrift af te ronden, hartelijk dank daarvoor! Peter, fijn dat voor jou de eindstreep nu ook in zicht is. Ik hoop dat we met zijn allen nog vele jaren door kunnen op onze prachtige ‘verlichte’ IC.

144
CURRICULUM VITAE
Curriculum vitae
Miriam Moviat werd geboren op 25 oktober 1971 in Eindhoven. Na afronding van het VWO aan het Bisschop Bekkers College in Eindhoven startte zij in 1990 aan de Universiteit van Maastricht met de studie geneeskunde. Na het artsexamen werkte zij vanaf 1998 als ANIOS Interne Geneeskunde in het huidige Amphia Ziekenhuis in Breda en later in het Jeroen Bosch ziekenhuis in ’s-Hertogenbosch, waar zij in 1999 met de opleiding tot internist begon (opleider Dr. Paetrick Netten). Tijdens de stage op de Intensive care in 2001 deed zij onder begeleiding van Dr. Hans van der Hoeven, internist-intensivist, wetenschappelijk onderzoek naar de oorzaak van metabole acidose bij IC patiënten. Later blijkt dit de start te zijn van het onderzoek dat uiteindelijk geresulteerd heeft in dit proefschrift. In 2002 vervolgde zij haar opleiding in het UMC St. Radboud (opleider Prof. Dr. Jos van der Meer) wat resulteerde in registratie als internist op 1 november 2005. Tijdens deze opleiding startte zij in 2004 als fellow Intensive Care (opleider Prof. Dr. Hans van der Hoeven). Na registratie als internist-intensivist in September 2006 werkte zij vervolgens als staflid op de afdeling Intensive Care van het UMC St. Radboud. Sinds december 2007 is zij weer werkzaam in het Jeroen Bosch ziekenhuis in ’s-Hertogenbosch, nu als staflid op de Intensive Care.Zij woont samen met Koert Efting Dijkstra in ’s-Hertogenbosch. Zij hebben 2 kinderen: Dirk (2007) en Eefje (2010).