Embed Size (px)
Citation preview
NASA Technical Memorandum 107197
Mir Cooperative Solar Array ProjectAccelerated Life Thermal Cycling Test
David J. HoffmanLewis Research Center
Cleveland, Ohio
and
David A. Scheiman
NYMA, Inc.
Brook Park, Ohio
April 1996
National Aeronautics and
Space Administration
Trade name_ or manufacturers' names are used in this report for identification
only. This usage does not constitute an official e_lorsement, either exWessed
of implied, by the National Aeronautics and Space Administration.
TABLE OF CONTENTS
TEST OBJECTIVE ................................................................ 1
TEST ARTICLES DESCRIPTION .................................................. 1
TEST FACILITY DESCRIPTION ................................................... 2
TEST PROCEDURE .............................................................. 3
Experimental SetUp ....................................................... 3Test Measurements ........................................................ 4
Products .................................................................. 4
TEST RESULTS ................................................................. 5
Summary of Final Results .................................................. 5
Review of the Significant Events ............................................ 5
Detailed Status At 1,500 Cycles .............................................. 5
Test Resumption .......................................................... 7
Review of the Significant Findings .......................................... 9
ELEVATED TEMPERATURE DEGRADATION .................................... 10
Background .............................................................. 10
Full Coupon Elevated Temperature Electrical Tests .......................... 10
Failure Isolation: Individual Cell Elevated Temperature Tests ................ 11Possible Causes ........................................................... 12
Summary ................................................................ 15
CONCLUSION ................................................................. 16

TEST OBJECTIVE
The objective of this test was to place samples of the Mir Cooperative Solar Array (MCSA)
through rapid thermal cycling (+80 °C to -100 °C) in order to detect gross design flaws or
other weaknesses associated with the integration of the U.S. solar cell modules with the
Russian support structure. The primary failure criterion was no detectable power loss over
24,000 thermal cycles, equivalent to four years in low earth orbit (the test equipment can
detect a degradation in power of about 2%, or slightly less). A secondary subjective
criterion was that any structural or mechanical changes resulting from thermal cycling
should not be of such a nature or degree which would compromise the MCSA design life.
Two MCSA solar array "mini" panel test articles, one with support rings and one without
rings, were simultaneously put through 24,000 thermal cycles. This was considered a
development test.
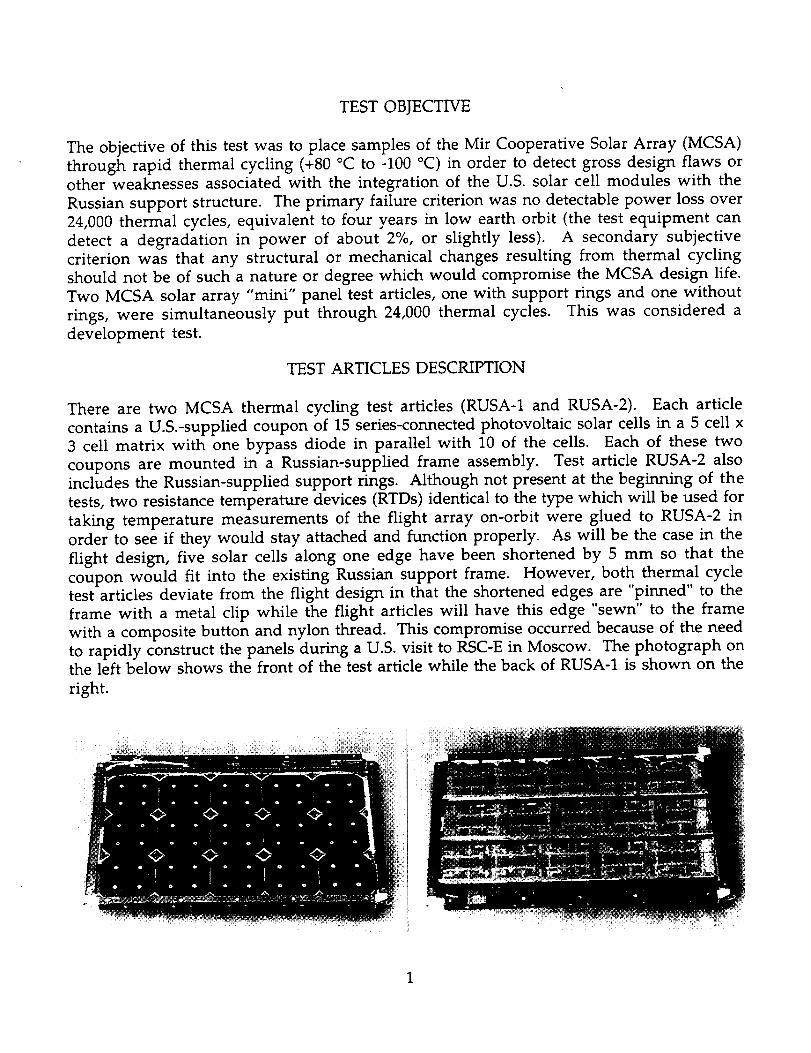
TEST ARTICLES DESCRIPTION
There are two MCSA thermal cycling test articles (RUSA-1 and RUSA-2). Each article
contains a U.S.-supplied coupon of 15 series-connected photovoltaic solar cells in a 5 cell x
3 cell matrix with one bypass diode in parallel with 10 of the cells. Each of these two
coupons are mounted in a Russian-supplied frame assembly. Test article RUSA-2 alsoincludes the Russian-supplied support rings. Although not present at the beginning of the
tests, two resistance temperature devices (RTDs) identical to the type which will be used for
taking temperature measurements of the flight array on-orbit were glued to RUSA-2 in
order to see if they would stay attached and function properly. As will be the case in the
flight design, five solar cells along one edge have been shortened by 5 mm so that the
coupon would fit into the existing Russian support frame. However, both thermal cycletest articles deviate from the flight design in that the shortened edges are "pinned" to the
frame with a metal clip while the flight articles will have this edge "sewn" to the frame
with a composite button and nylon thread. This compromise occurred because of the need
to rapidly construct the panels during a U.S. visit to RSC-E in Moscow. The photograph onthe left below shows the front of the test article while the back of RUSA-1 is shown on the
right.
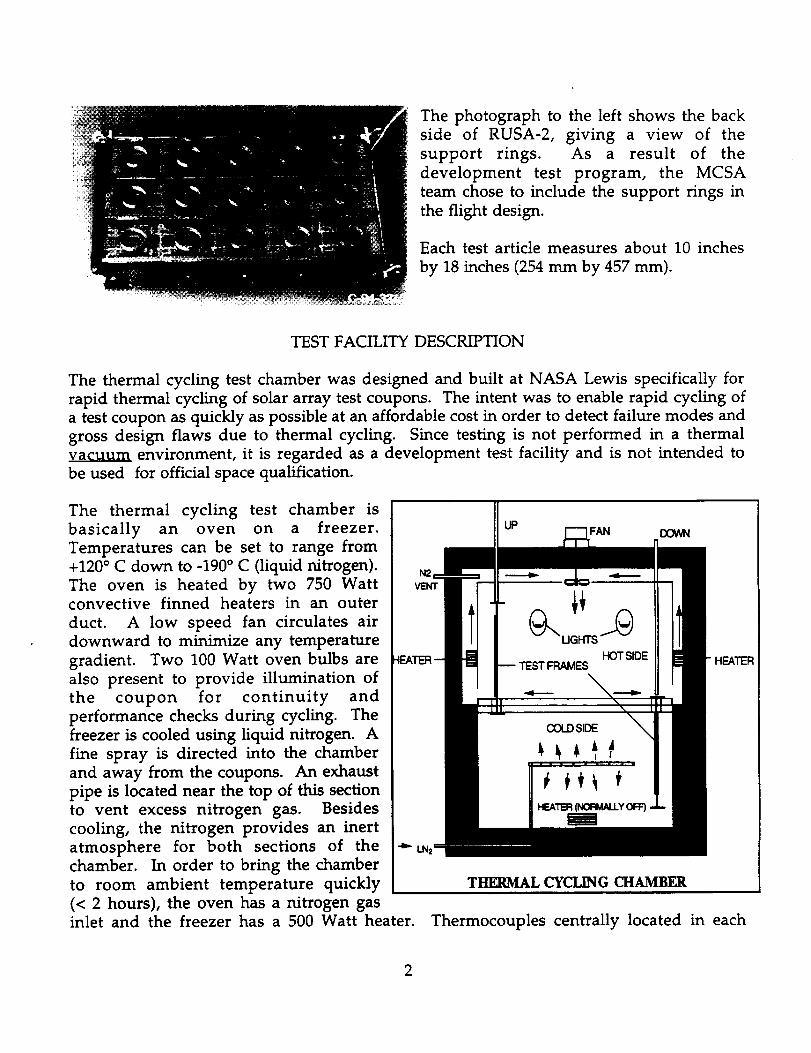
The photograph to the left shows the back
side of RUSA-2, giving a view of the
support rings. As a result of the
development test program, the MCSA
team chose to include the support rings in
the flight design.
Each test article measures about 10 inches
by 18 inches (254 mm by 457 ram).
TEST FACILITY DESCRIPTION
The thermal cycling test chamber was designed and built at NASA Lewis specifically for
rapid thermal cycling of solar array test coupons. The intent was to enable rapid cycling of
a test coupon as quickly as possible at an affordable cost in order to detect failure modes and
gross design flaws due to thermal cycling. Since testing is not performed in a thermal
vacuum environment, it is regarded as a development test facility and is not intended to
be used for official space qualification.
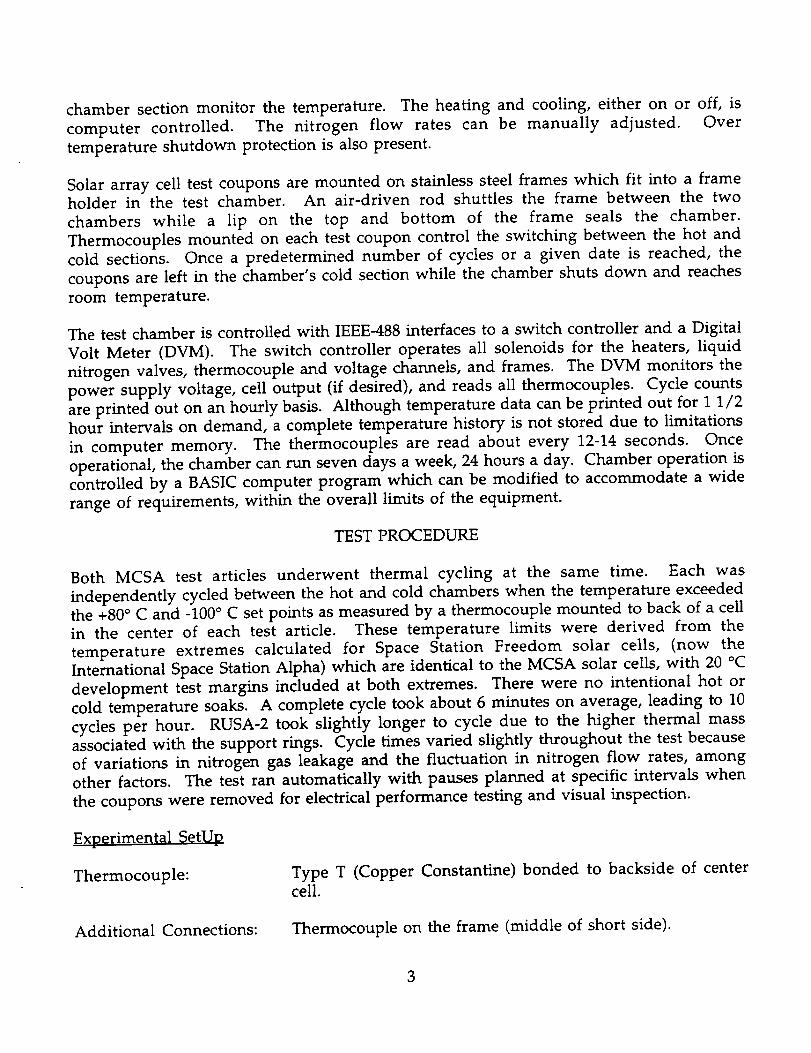
The thermal cycling test chamber is
basically an oven on a freezer.
Temperatures can be set to range from
+120 ° C down to -190 ° C (liquid nitrogen).
The oven is heated by two 750 Watt
convective finned heaters in an outer
duct. A low speed fan circulates air
downward to minimize any temperature
gradient. Two 100 Watt oven bulbs are
also present to provide illumination of
the coupon for continuity and
performance checks during cycling. The
freezer is cooled using liquid nitrogen. A
fine spray is directed into the chamber
and away from the coupons. An exhaust
pipe is located near the top of this section
to vent excess nitrogen gas. Besides
cooling, the nitrogen provides an inert
atmosphere for both sections of the
chamber. In order to bring the chamber
to room ambient temperature quickly
(< 2 hours), the oven has a nitrogen gasinlet and the freezer has a 500 Watt heater.
UPFAN
THERMAL CYCLING CHAMBER
HEATER
Thermocouples centrally located in each
2
chamber section monitor the temperature. The heating and cooling, either on or off, is
computer controlled. The nitrogen flow rates can be manually adjusted. Over
temperature shutdown protection is also present.
Solar array cell test coupons are mounted on stainless steel frames which fit into a frame
holder in the test chamber. An air-driven rod shuttles the frame between the two
chambers while a lip on the top and bottom of the frame seals the chamber.
Thermocouples mounted on each test coupon control the switching between the hot and
cold sections. Once a predetermined number of cycles or a given date is reached, the
coupons are left in the chamber's cold section while the chamber shuts down and reaches
room temperature.
The test chamber is controlled with IEEE-488 interfaces to a switch controller and a Digital
Volt Meter (DVM). The switch controller operates all solenoids for the heaters, liquid
nitrogen valves, thermocouple and voltage channels, and frames. The DVM monitors the
power supply voltage, cell output (if desired), and reads all thermocouples. Cycle counts
are printed out on an hourly basis. Although temperature data can be printed out for 1 1/2
hour intervals on demand, a complete temperature history is not stored due to limitations
in computer memory. The thermocouples are read about every 12-14 seconds. Once
operational, the chamber can run seven days a week, 24 hours a day. Chamber operation is
controlled by a BASIC computer program which can be modified to accommodate a wide
range of requirements, within the overall limits of the equipment.
TEST PROCEDURE
Both MCSA test articles underwent thermal cycling at the same time. Each was
independently cycled between the hot and cold chambers when the temperature exceeded
the +80 ° C and -100 ° C set points as measured by a thermocouple mounted to back of a cell
in the center of each test article. These temperature limits were derived from the
temperature extremes calculated for Space Station Freedom solar cells, (now the
International Space Station Alpha) which are identical to the MCSA solar cells, with 20 °C
development test margins included at both extremes. There were no intentional hot or
cold temperature soaks. A complete cycle took about 6 minutes on average, leading to 10
cycles per hour. RUSA-2 took slightly longer to cycle due to the higher thermal mass
associated with the support rings. Cycle times varied slightly throughout the test because
of variations in nitrogen gas leakage and the fluctuation in nitrogen flow rates, among
other factors. The test ran automatically with pauses planned at specific intervals when
the coupons were removed for electrical performance testing and visual inspection.
Experimental _etUp
Thermocouple: Type T (Copper Constantine) bonded to backside of centercell.
Additional Connections: Thermocouple on the frame (middle of short side).
3
Frame Size: 12 inches x 20 inches
Chamber #3, Frames 1 and 3
Switching Temperature: <-100 ° C to >+80 ° C (same as Space Station Freedom coupons)
Chamber Temperatures: Cold Side at a constant -120 ° C
Hot Side at a constant +100 ° C
Cycle Time: 6 to 8 minutes or 200 per day
Test Measurements
Electrical performance was measured initially at room temperature with the test articlesremoved from the chamber:
1) Current/Voltage curves on entire 15-cell string using LAPSS100 Flash Simulator.
2) Dark Diode check on bypass diode using TEK 370A curve tracer plotted on paper andstored in files.
Visual inspection/mapping was performed under 1-10X magnification. The following list
indicates the type of phenomena which could be detected:
-breaks or cracks in the cell surface
-breaks or cracks in the coverglass
-voids or open areas (lack of adhesive)-wrinkles in the interconnects or blanket
-evidence of adhesive migration or elongation
-any other nonconformity; bubbles, peeling, delamination.
Photographs were taken at the beginning and end of the test, and at one point in the test
where significant physical changes occurred, as will be described later.
Products
Two current/voltage curves (as a consistency check) from the flash test were produced at
the completion of each major cycle interval from which the following performance
parameters were reported:
Isc Imax Pmax Efficiency Voc Vmax Fill Factor P/Po
For both the front and back sides, a map of flaws found as a result of the visual inspection
were updated after the completion of each set of cycles and recorded on a paper image of
the test coupon. Brief status reports were written at each major cycle interval.
4
TEST RESULTS
Summary of Final Results
After 24,000 thermal cycles between +80 °C and -100 °C, no measurable electrical
degradation was detected in either test article during room temperature illuminated
"flash" tests. Electrical degradation was detected at elevated temperatures in the test article
with support rings (RUSA-2), traced to a single cell (#4). This degradation is most likely
the result of a combination of deviations of the test article from the flight design and
damage from facility-induced shocks experienced in the early phases of testing, and not as a
result of thermal cycling. There was degradation in some of the structural aspects of both
test articles, again most likely due to the test artifacts just mentioned, but the overall
integrity of the solar cell coupon-to-support frame interface was not compromised.
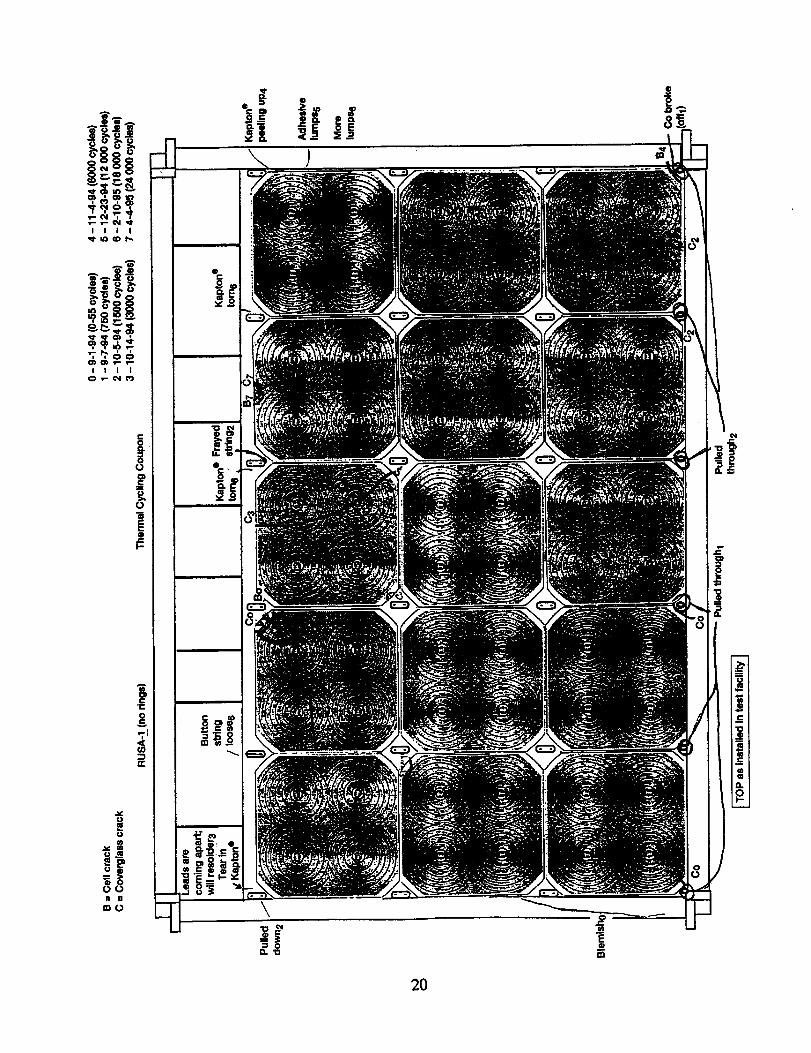
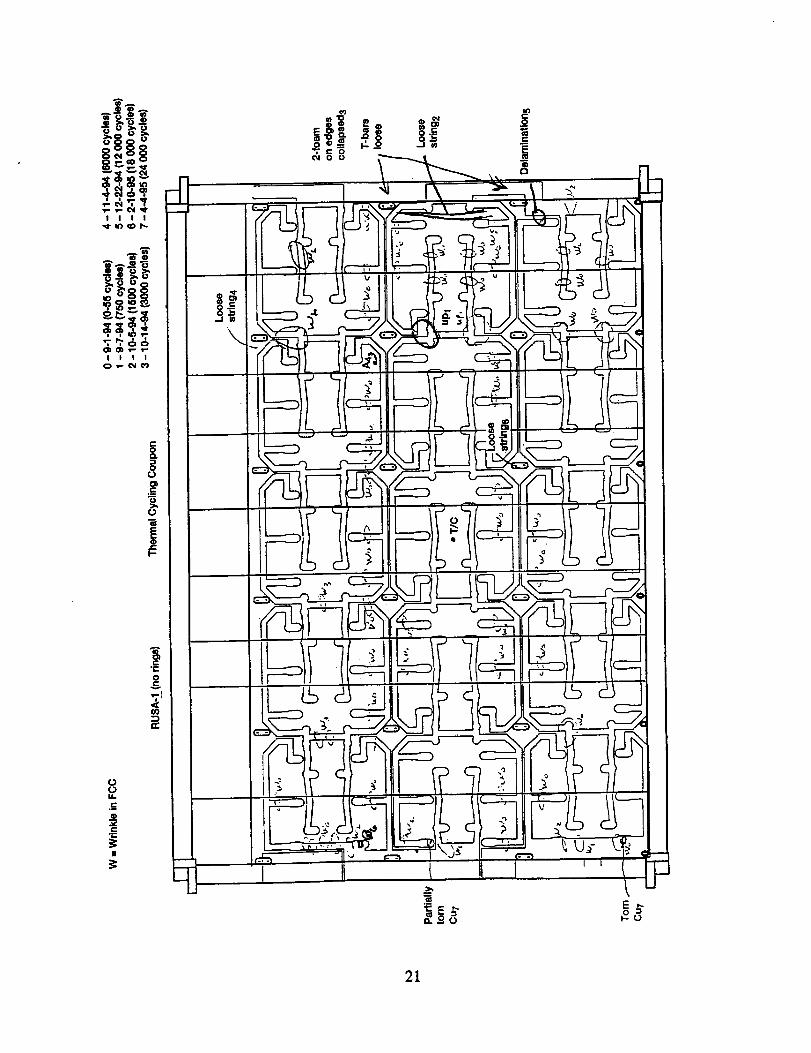
The visual inspection diagrams and "flash" illuminated electrical test results at specific
points throughout the test are given at the end of this report.
Review qf the $ie'nificant Events
RUSA-1 = test article without support rings.
RUSA-2 = test article with support rings.
Date4 Aug. '94 0
EventTesting began. Each test article had cells with cracks prior to testing.1 cracked cell on RUSA-1 and 2 on RUSA-2
5 Aug. '94 55 Testing suspended - cold chamber refrigerant supply problem.
31 Aug. '94 55 Testing resumed.
7 Sept. '94 750 No room temperature electrical degradation.
Short edge pins tear Kapton: 3 places on RUSA-1;1 place on RUSA-2
14 Sept. '94 1,500 Visual inspection revealed a number changes in some of the
mechanical PPM/frame attachment points and support structure on
both articles. Since most of the significant developments in the test
program occurred at this point, a detailed status is given below.
Detailed Statu_ At 1,500 Cycles
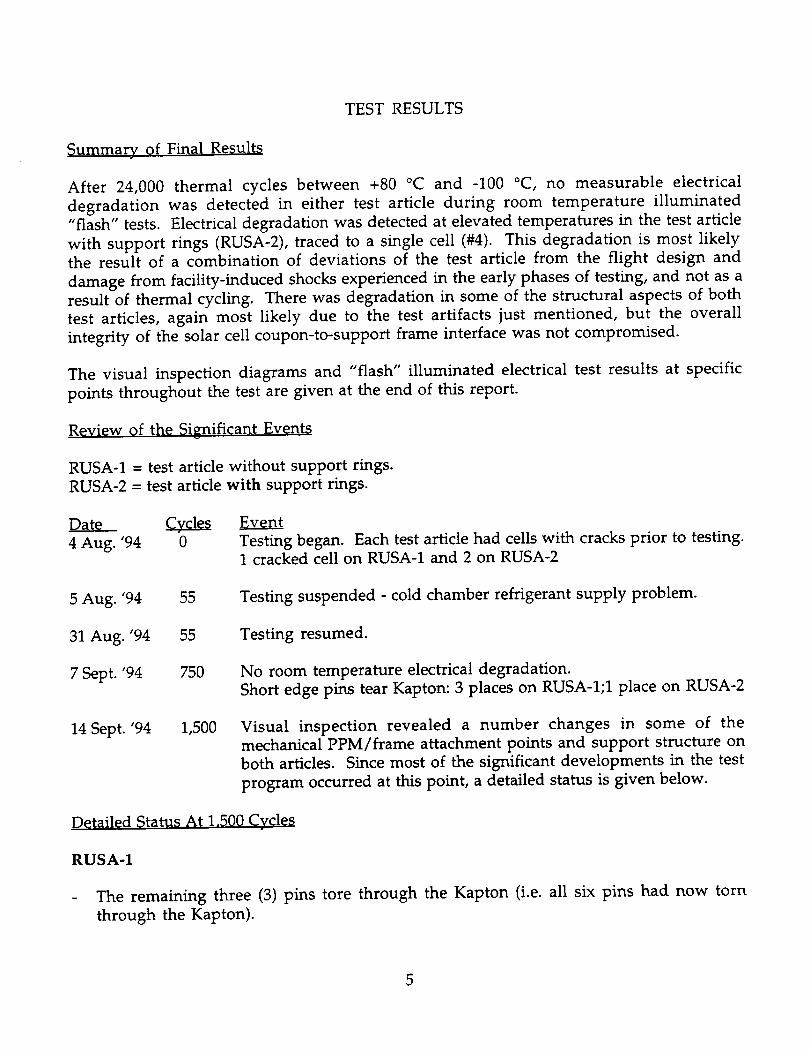
RUSA-1
The remaining three (3) pins tore through the Kapton (i.e. all six pins had now torn
through the Kapton).
5
The 15-cell coupon had shifted "down" in the frame; from 0 mm on the top left side to
3 mm on the top right.
The top two of the three T-bars had come loose (lost adhesion) from the C-channelframe.
Most of the styrofoam spacer inserts in the C-channel had deteriorated.
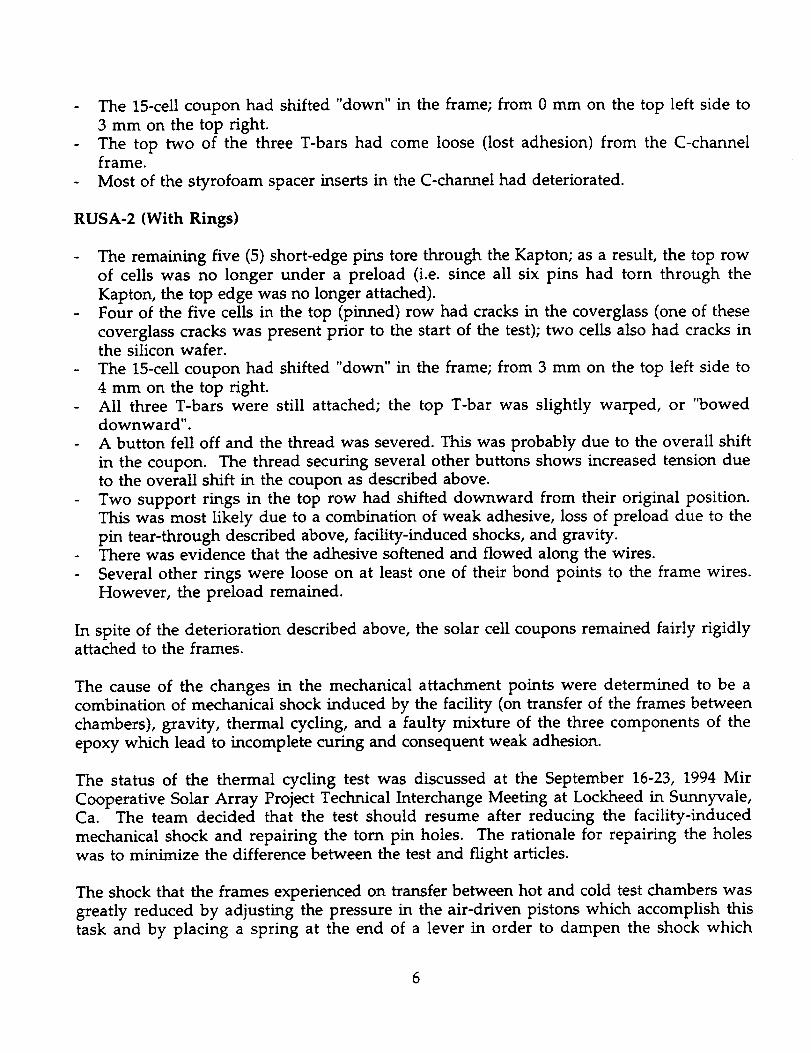
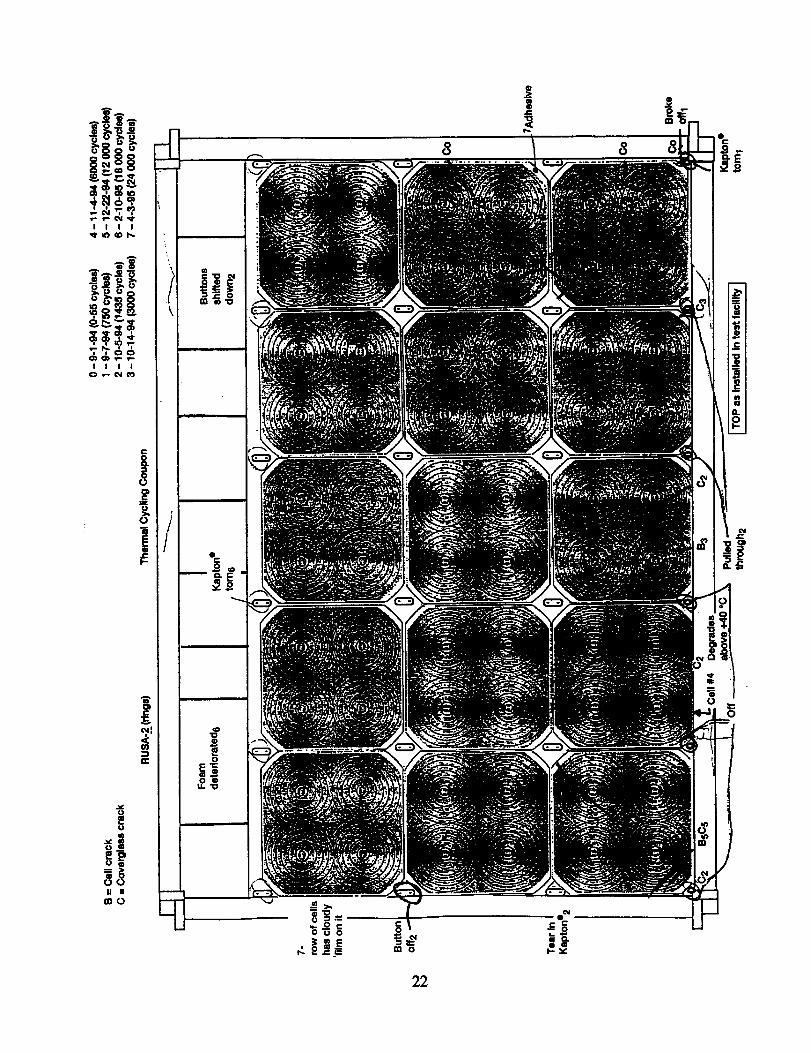
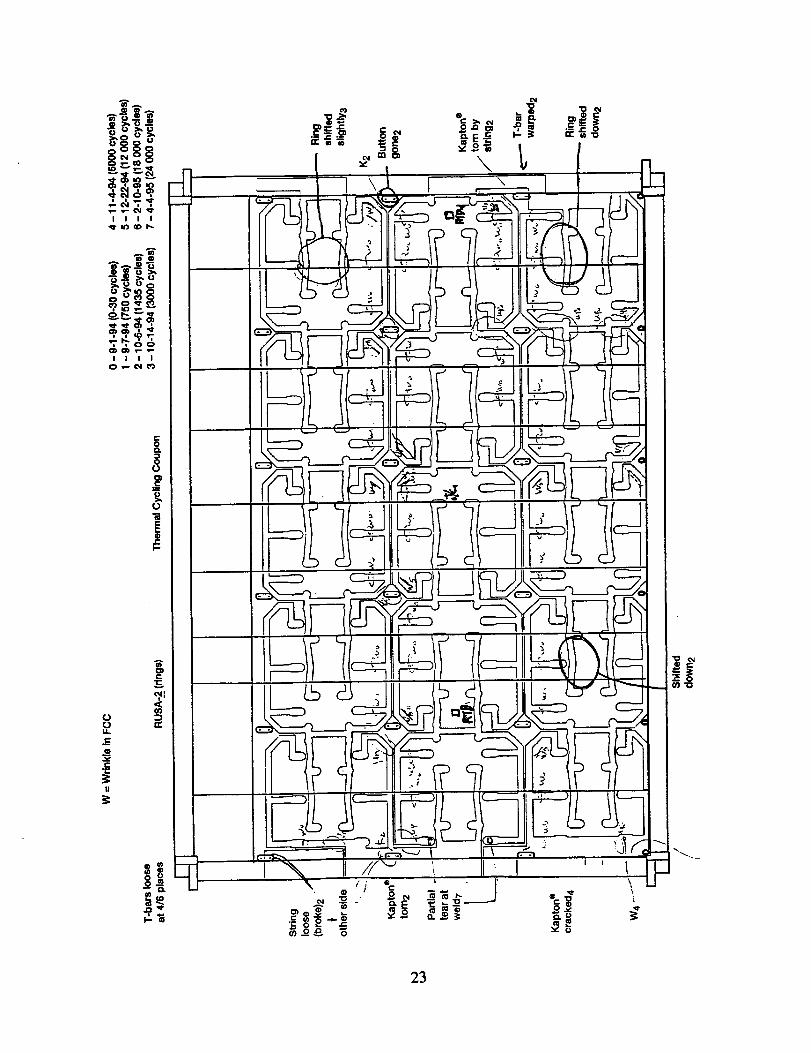
RUSA-2 (With Rings)
The remaining five (5) short-edge pins tore through the Kapton; as a result, the top row
of cells was no longer under a preload (i.e. since all six pins had torn through the
Kapton, the top edge was no longer attached).
Four of the five cells in the top (pinned) row had cracks in the coverglass (one of these
coverglass cracks was present prior to the start of the test); two cells also had cracks inthe silicon wafer.
The 15-cell coupon had shifted "down" in the frame; from 3 mm on the top left side to
4 mm on the top right.
All three T-bars were still attached; the top T-bar was slightly warped, or "boweddownward".
A button fell off and the thread was severed. This was probably due to the overall shift
in the coupon. The thread securing several other buttons shows increased tension due
to the overall shift in the coupon as described above.
Two support rings in the top row had shifted downward from their original position.
This was most likely due to a combination of weak adhesive, loss of preload due to the
pin tear-through described above, facility-induced shocks, and gravity.
There was evidence that the adhesive softened and flowed along the wires.
Several other rings were loose on at least one of their bond points to the frame wires.
However, the preload remained.
In spite of the deterioration described above, the solar cell coupons remained fairly rigidlyattached to the frames.
The cause of the changes in the mechanical attachment points were determined to be a
combination of mechanical shock induced by the facility (on transfer of the frames between
chambers), gravity, thermal cycling, and a faulty mixture of the three components of the
epoxy which lead to incomplete curing and consequent weak adhesion.
The status of the thermal cycling test was discussed at the September 16-23, 1994 Mir
Cooperative Solar Array Project Technical Interchange Meeting at Lockheed in Sunnyvale,
Ca. The team decided that the test should resume after reducing the facility-induced
mechanical shock and repairing the torn pin holes. The rationale for repairing the holes
was to minimize the difference between the test and flight articles.
The shock that the frames experienced on transfer between hot and cold test chambers was
greatly reduced by adjusting the pressure in the air-driven pistons which accomplish this
task and by placing a spring at the end of a lever in order to dampen the shock which
6
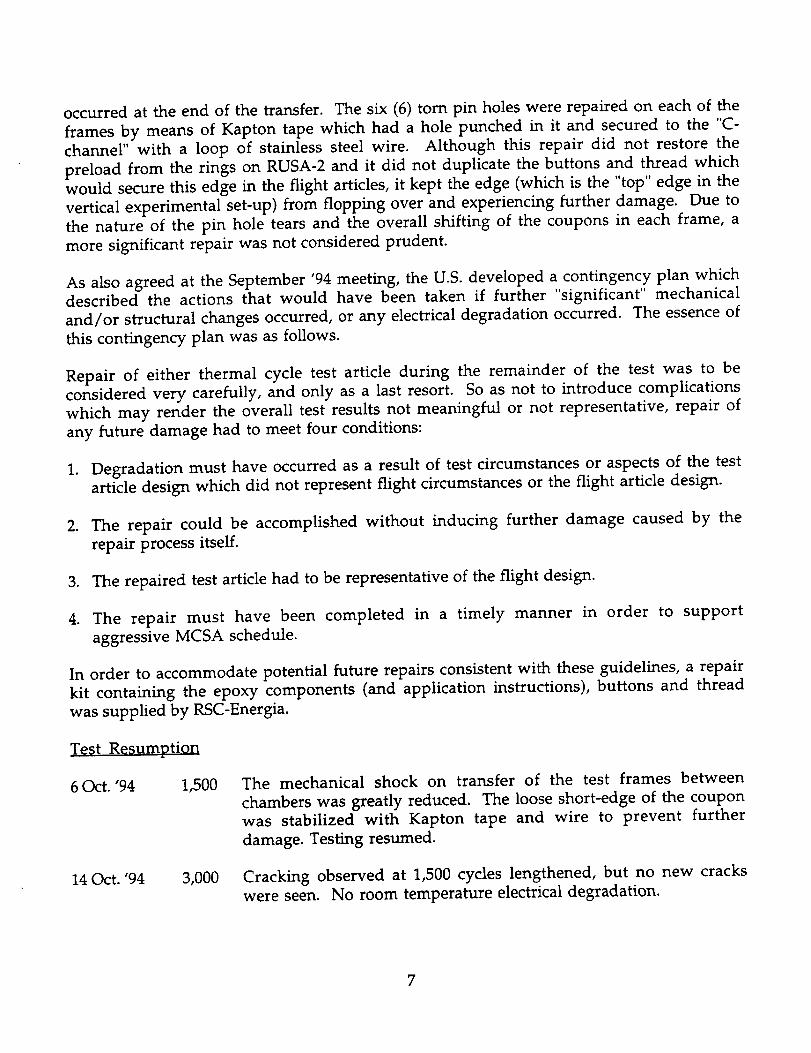
occurred at the end of the transfer. The six (6) torn pin holes were repaired on each of the
frames by means of Kapton tape which had a hole punched in it and secured to the "C-
channel" with a loop of stainless steel wire. Although this repair did not restore the
preload from the rings on RUSA-2 and it did not duplicate the buttons and thread which
would secure this edge in the flight articles, it kept the edge (which is the "top" edge in the
vertical experimental set-up) from flopping over and experiencing further damage. Due to
the nature of the pin hole tears and the overall shifting of the coupons in each frame, a
more significant repair was not considered prudent.
As also agreed at the September '94 meeting, the U.S. developed a contingency plan which
described the actions that would have been taken if further "significant" mechanical
and/or structural changes occurred, or any electrical degradation occurred. The essence of
this contingency plan was as follows.
Repair of either thermal cycle test article during the remainder of the test was to be
considered very carefully, and only as a last resort. So as not to introduce complications
which may render the overall test results not meaningful or not representative, repair of
any future damage had to meet four conditions:
1. Degradation must have occurred as a result of test circumstances or aspects of the test
article design which did not represent flight circumstances or the flight article design.
2. The repair could be accomplished without inducing further damage caused by the
repair process itself.
3. The repaired test article had to be representative of the flight design.
4. The repair must have been completed in a timely manner in order to support
aggressive MCSA schedule.
In order to accommodate potential future repairs consistent with these guidelines, a repair
kit containing the epoxy components (and application instructions), buttons and thread
was supplied by RSC-Energia.
Test Resumption
6 Oct. '94 1,500 The mechanical shock on transfer of the test frames between
chambers was greatly reduced. The loose short-edge of the coupon
was stabilized with Kapton tape and wire to prevent further
damage. Testing resumed.
14 Oct. '94 3,000 Cracking observed at 1,500 cycles lengthened, but no new cracks
were seen. No room temperature electrical degradation.
7
8 Nov. '94 6,000
11 Nov. '94
21 Nov. '94 7,500
20 Dec. '94 12,000
9 Feb. '95 18,000
15 Feb. '95
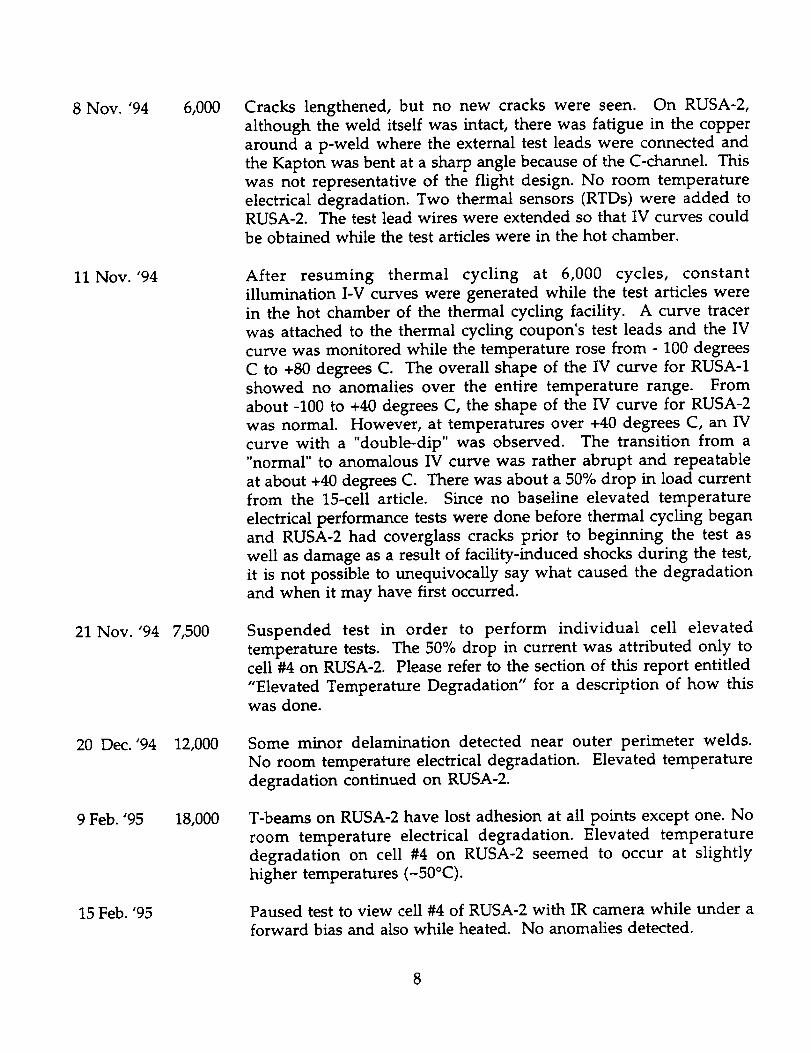
Cracks lengthened, but no new cracks were seen. On RUSA-2,
although the weld itself was intact, there was fatigue in the copper
around a p-weld where the external test leads were connected and
the Kapton was bent at a sharp angle because of the C-channel. This
was not representative of the flight design. No room temperature
electrical degradation. Two thermal sensors (RTDs) were added toRUSA-2. The test lead wires were extended so that IV curves could
be obtained while the test articles were in the hot chamber.
After resuming thermal cycling at 6,000 cycles, constant
illumination I-V curves were generated while the test articles were
in the hot chamber of the thermal cycling facility. A curve tracer
was attached to the thermal cycling coupon's test leads and the IV
curve was monitored while the temperature rose from - 100 degrees
C to +80 degrees C. The overall shape of the IV curve for RUSA-1
showed no anomalies over the entire temperature range. From
about -100 to +40 degrees C, the shape of the IV curve for RUSA-2
was normal. However, at temperatures over +40 degrees C, an IV
curve with a "double-dip" was observed. The transition from a
"normal" to anomalous IV curve was rather abrupt and repeatable
at about +40 degrees C. There was about a 50% drop in load current
from the 15-cell article. Since no baseline elevated temperature
electrical performance tests were done before thermal cycling began
and RUSA-2 had coverglass cracks prior to beginning the test as
well as damage as a result of facility-induced shocks during the test,
it is not possible to unequivocally say what caused the degradation
and when it may have first occurred.
Suspended test in order to perform individual cell elevated
temperature tests. The 50% drop in current was attributed only to
cell #4 on RUSA-2. Please refer to the section of this report entitled
"Elevated Temperature Degradation" for a description of how thiswas done.
Some minor delamination detected near outer perimeter welds.
No room temperature electrical degradation. Elevated temperature
degradation continued on RUSA-2.
T-beams on RUSA-2 have lost adhesion at all points except one. No
room temperature electrical degradation. Elevated temperature
degradation on cell #4 on RUSA-2 seemed to occur at slightly
higher temperatures (-50°C).
Paused test to view cell #4 of RUSA-2 with IR camera while under a
forward bias and also while heated. No anomalies detected.
17Feb. '95 19,150 Testing resumed.
25Mar. '95 24,000 Testing completed. A large crack was found in the coverglass of acell on RUSA-1. Also, copper fatigue was seen in the welds onRUSA-1 along with partial tearing around the perimeter of theweld. This occurred where the edge of the coupon is inside the C-channel. No room temperature electrical degradation. Elevatedtemperature degradation on cell #4 on RUSA-2 continued to occur,with the onset again occurring at around 40 °C. The "area loss"power degradation seems to be isolated to the "upper half" of thecell. This was discovered by measuring the electrical output of thetest article while shading half of cell #4 along with elevating itstemperature.
Review of..the Significant Findings
1) Problems associated with fastening the short edge of the PPM with "pins" first seen in
the development acoustic tests were also experienced in the initial phase of thermal
cycling. The effects were made worse by the facility-induced shocks which occurred in
the beginning.
2) Problems with softening and flowing of the adhesive illustrated the importance of
properly mixing the adhesive and allowing it to fully cure.
3) The "button" falling off sometime prior to 1,500 cycles resulted in RSC deciding to
double-tie the buttons and use two coatings of lacquer to seal them.
4) Even though the electrical tabs in the flight design are not attached to wiring in the
same way as the thermal test articles, the fatigue in a p-weld observed on RUSA-2 after
6,000 cycles illustrates the need for careful routing of the tabs. In the flight design, the
extended electrical tabs will be "looped" underneath the PPM in the C-channel and
connected to wiring. Care should be taken to ensure that the radius of curvature in
electrical tab loop is not too extreme, especially where it comes off the PPM (near the P-
welds).
5) Electrical illumination tests while RUSA-2 was in the hot chamber revealed elevated
temperature degradation to occur rather abruptly between 40 - 50 °C. This illustrated
the importance of checking for electrical degradation in solar cells over the entire
operating range of temperatures. That is, checking for electrical degradation only at
room temperature, as traditionally done in the U.S., may not be sufficient after the solar
cells have been exposed to environmental stresses.
6) Electrical illumination tests at room temperature performed with one-half of a solar
cell shadowed reveal the same IV curve shape as the curve seen at elevated
9
temperature. This implies that the problem is associated with an "area loss"
phenomenon. The cause of this is unknown.
Despite the problems with the frame adhesive and damage induced by the facility shocks,
there was no degradation in the electrical performance of RUSA-1 and there was no
significant degradation in the integrity of the PPM/structural support interface after 24,000
thermal cycles.
Despite the same problems with the frame adhesive and damage induced by the facility
shocks for RUSA-2, there was no significant degradation in the integrity of the
PPM/structural support interface after 24,000 thermal cycles. There was no significant
delamination due to the force exerted on the cells by the support rings. The degradation in
the electrical performance above 40 to 50 °C is most likely not due to thermal cyclingeffects.
ELEVATED TEMPERATURE DEGRADATION
The accelerated life thermal cycling test reached the 1-year equivalent life point of 6,000
thermal cycles (-100°C to +80°C) on 31 October 1994. Up until this point in the test, room
temperature "flash" illumination electrical tests revealed no degradation in the power
output of either 15-celi coupon test article. However, since Lockheed (LMSC) confirmed
RSC-Energia's report of degraded electrical power output (experienced as a result of Panel
#2 development test activity in Russia) in PPM #2 only at elevated temperatures, it was
decided to perform elevated temperature electrical performance tests on the thermal
cycling test articles. This was done on Thursday, November 10, 1994 at a count of about
6,400 cycles.
Full Coupon Elevated Temperature Electrical Tests
The NASA Lewis thermal cycling facility has the capability of obtaining constant
illumination electrical performance data (current-voltage or IV curves) while the test
articles are in the hot chamber of the facility. Illumination is provided by two 100 watt
incandescent light bulbs. Current-voltage characteristics are obtained with a
programmable curve tracer via four-wire measurements. Since the intensity and
spectrum of the light provided by the incandescent bulbs are not representative of solarinsolation conditions on-orbit at air mass zero, the absolute IV measurements are not in
themselves meaningful. However, the relative shape of the IV curves can revealanomalous behavior.
IV curves were obtained for both RUSA-1 and RUSA-2 over a wide range of temperatures
(approximately -10°C to +75°C). The IV curves for RUSA-1 showed normal characteristics.
However, the IV curves for RUSA-2 showed about a 50% drop in current for temperatures
above +40°C. Since these tests were performed while thermal cycling was in progress (the
10
test articles reside for approximately 3 minutes in each chamber, either hot or cold) and an
IV curve trace is more or less instantaneous, it was possible to monitor the IV curve
through most of the temperature range. The 50% drop in current was rather abrupt and
very consistent at the +40°C point.
Failure Isolation: Individual Cell Elevated Temperature Tests
On November 21, 1994 at a cycle count of about 7,500 RUSA-2 was removed from the test
facility in order to isolate the cause of the electrical power degradation. The plan was to
heat individual cells above +40°C one at a time, perform a flash illumination electrical test
(i.e. "flash test"), and look for the "double-dip" or "stairstep" characteristic in the IV curve.
This was the same process that LMSC used to isolate the failure on PPM#2.
First, a room temperature (25°C) flash test of the entire 15-cell coupon gave a baseline IV
curve. Then each cell was heated to about +80°C, as measured by a thermocouple in
surface contact with the coverglass in the middle of the cell. This was done with a small,
focussed hot-air heat gun. When the thermocouple read near +80°C, the heat gun was
removed and a flash test of the entire 15-cell coupon was quickly performed. The
thermocouple reading at the moment of flash was recorded on the IV plots. This process
was repeated for all 15 cells.
The current-limiting phenomenon was isolated to one of the shortened cells along the top
pinned edge of the coupon: the fourth cell from the left (cell #4). All other cells hadnormal I-V curves.
Flash tests were performed over a range of temperatures for cell #4. The onset of
degradation begins near +40°C with a "softening" of the IV curve. Softening of the curve
continued at +50°C while the current limiting effects began to be seen at +60°C and were
most pronounced at +70°C.
As for the physical condition of cell#4, inspection with an unaided eye from a number of
different angles revealed at least two fairly large cracks in the coverglass. A portion of one
of the cracks appeared also to be in the silicon wafer itself. A detailed visual inspection
revealed many cracks, both in the coverglass and the silicon wafer. Also, this row of cells
was no longer under any preload due to the pins having torn through the Kapton.
After the testing described above, RUSA-2 was placed back into the test facility and thermal
cycling was resumed on both articles on November 21, 1994. High temperature IV curves
were obtained while the test articles were in the hot chamber prior to removing them
from the facility for routine inspections at the 12,000, 18,000 and 24,000 cycle points. In
addition, individual cell elevated temperature tests were performed on RUSA-2 for
comparison with the baseline obtained at the 7,500 cycle point.
At this point, it was decided by the MCSA U.S. IPT to alter the "failure criterion" for
RUSA-2. Since the damage to cell #4 was most likely caused by a combination of test
article deviations (i.e. the pinned edge tear-through and glue softening) and facility
11
problems not related to thermal cycling, the team decided to monitor the performance of
only the bottom two rows of cells (10 total) on RUSA-2 for the remainder of the test.
Possible Causes
NASA Lewis has discussed various types of solar cell degradation phenomena in a memo
entitled "Thermal Cycling of RUSA-2 (rings) 15 Cell Solar Array Coupon: Loss of
Power/Current at Elevated Temperature" by Dave Scheiman dated 13 January 1995. This
memo was distributed to the MCSA Integrated Product Team in February 1995. Since we
believe the elevated temperature degradation results from artifacts of the test not related to
thermal cycling effects, only the highlights of this discussion will be given here.
Supplemental testing at NASA Lewis has shown that the observed anomaly appears to bedue to a loss of area in the cell rather than a change in shunt or series resistance alone. The
evidence for this will be present below.
Electrical output of a solar cell is defined by a current vs. voltage (IV) curve. The
parameters of the curve, all affected by cell quality, are listed below.
IS c ..-
Voc
Pmax =
Imax =
Vmax =
F.F. =
Short Circuit Current (0 volts); Related to cell area and illumination intensity
Open Circuit Voltage (0 amps); Related to cell material (bandgap).Maximum Power (Knee of Curve); Related to series and shunt resistances.
Current at Maximum Power
Voltage at Maximum Power
Fill Factor; Defines the "squareness" of the curve, 1 is ideal. Prnax / (Voc * Isc )
Efficiency= (Power Out / Power In)
A solar cell is equivalent to a large area diode. It has a thin negative (N) top layer, a thick
positive (P) bottom layer, capacitance, series resistance, and shunt resistance. The solarcells used in the MCSA have 6 P welds and 4 N welds and extensive grid lines on both the
front and back sides of the cell. Physical damage to a cell could affect its electrical output in
different ways, from no effect at all to various degrees:
1) No effect at all: Cracks that break a cell cleanly do not cause any performance loss
provided there is an unchanged current path to a front and back contact. The ceils used
in the MCSA could easily be broken into 4 smaller cells (quadrants) in parallel. The
loss in power would be negligible.
2) Increased Series Resistance: Cracks in a cell which prevent proper current flow to the
nearest contact (weld) pad tend to increase series resistance. A crack of this type must
not only be through the cell but also sever the grid lines. Grid lines are optimized to
compromise series resistance and shadowing (blockage). They are also optimized to
direct current to a contact pad. Because all the grids are connected, loss of a contact pad
(weld) will result in increased current at another contact pad, limiting the power loss
12
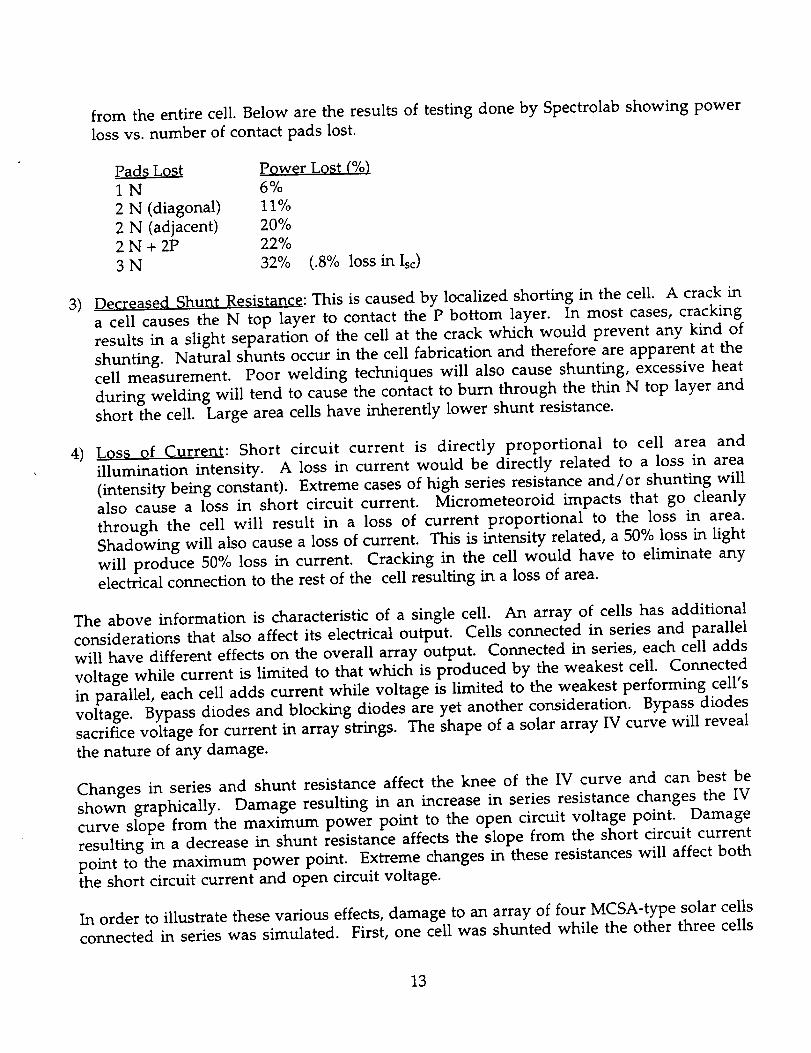
from the entire cell. Below are the results of testing done by Spectrolab showing power
loss vs. number of contact pads lost.
Pads Lost Power Lo_t (%)1 N 6%
2 N (diagonal) 11%
2 N (adjacent) 20%2 N + 2P 22%
3 N 32% (.8% loss in Is¢)
3) Decreased Shunt Resistance: This is caused by localized shorting in the cell. A crack in
a cell causes the N top layer to contact the P bottom layer. In most cases, cracking
results in a slight separation of the cell at the crack which would prevent any kind of
shunting. Natural shunts occur in the cell fabrication and therefore are apparent at the
cell measurement. Poor welding techniques will also cause shunting, excessive heat
during welding will tend to cause the contact to burn through the thin N top layer and
short the ceil. Large area cells have inherently lower shunt resistance.
4) Loss of Current: Short circuit current is directly proportional to cell area and
illumination intensity. A loss in current would be directly related to a loss in area
(intensity being constant). Extreme cases of high series resistance and/or shunting will
also cause a loss in short circuit current. Micrometeoroid impacts that go cleanly
through the cell will result in a loss of current proportional to the loss in area.
Shadowing will also cause a loss of current. This is intensity related, a 50% loss in light
will produce 50% loss in current. Cracking in the cell would have to eliminate any
electrical connection to the rest of the cell resulting in a loss of area.
The above information is characteristic of a single cell. An array of cells has additional
considerations that also affect its electrical output. Cells connected in series and parallel
will have different effects on the overall array output. Connected in series, each cell adds
voltage while current is limited to that which is produced by the weakest cell. Connected
in parallel, each cell adds current while voltage is limited to the weakest performing cell's
voltage. Bypass diodes and blocking diodes are yet another consideration. Bypass diodes
sacrifice voltage for current in array strings. The shape of a solar array IV curve will reveal
the nature of any damage.
Changes in series and shunt resistance affect the knee of the IV curve and can best be
shown graphically. Damage resulting in an increase in series resistance changes the IV
curve slope from the maximum power point to the open circuit voltage point. Damage
resulting in a decrease in shunt resistance affects the slope from the short circuit current
point to the maximum power point. Extreme changes in these resistances will affect both
the short circuit current and open circuit voltage.
In order to illustrate these various effects, damage to an array of four MCSA-type solar cells
connected in series was simulated. First, one cell was shunted while the other three cells
13
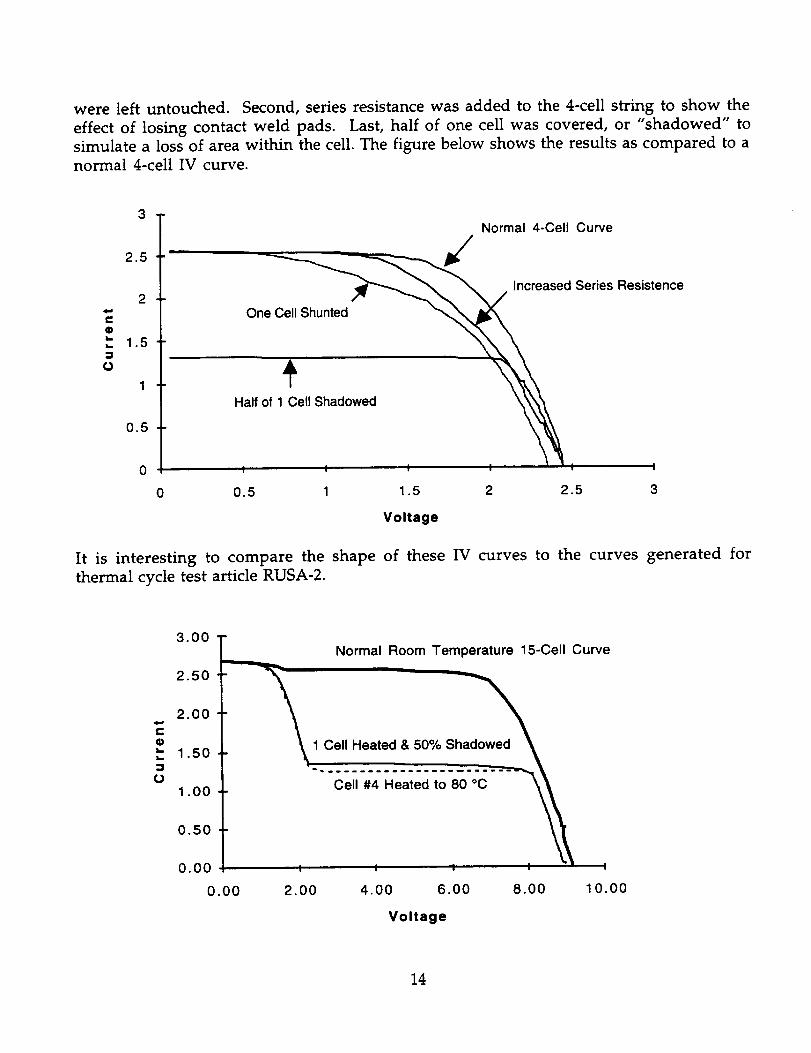
were left untouched. Second, series resistance was added to the 4-cell string to show the
effect of losing contact weld pads. Last, half of one cell was covered, or "shadowed" to
simulate a loss of area within the cell. The figure below shows the results as compared to a
normal 4-cell IV curve.
O
o
2.5
1.5
0.5
0
Normal 4-Cell Curve
/0 Increased Series Resistence
ialf °f 1 Cell Si ad° ,I
0 0.5 1 1.5 2 2.5 3
Voltage
It is interesting to compare the shape of these IV curves to the curves generated for
thermal cycle test article RUSA-2.
O
o
3.00
2.50
2.00
1.50
1.00
0.50
0.00
0.00
Normal Room Temperature 15-Cell Curve
_ 1 Cell Heated & 50% Sh_
ce' c2.00 4.00 6.00 8.00 10.00
Voltage
14
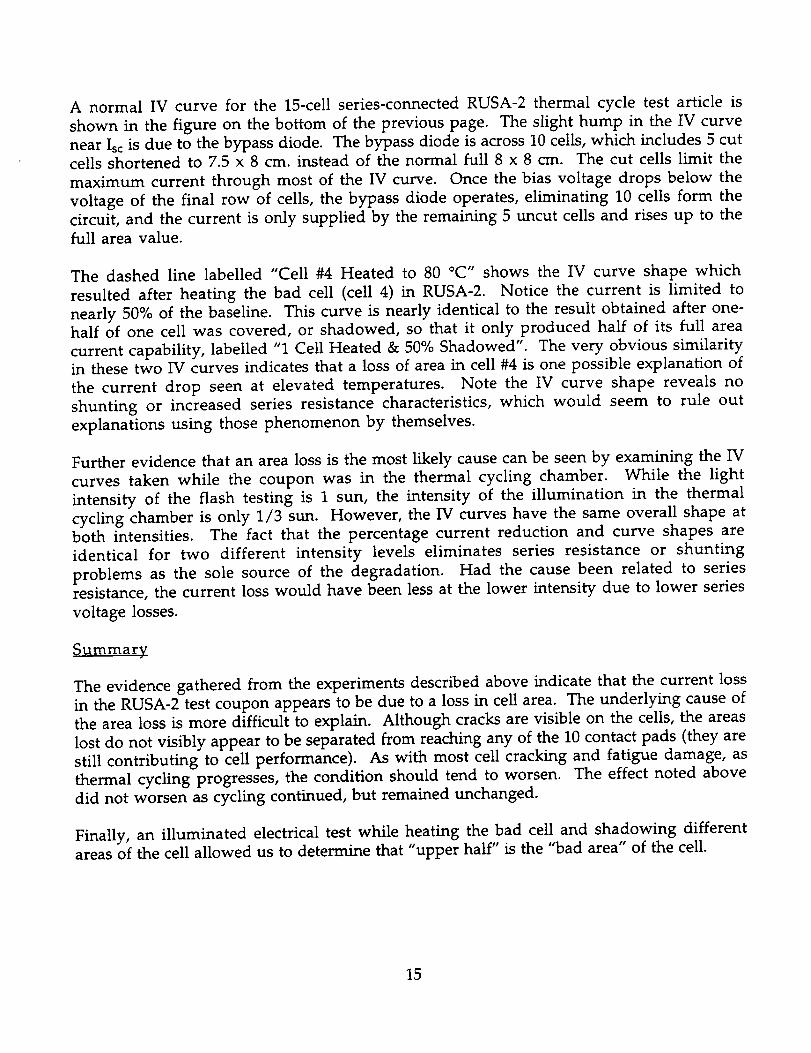
A normal IV curve for the 15-cell series-connected RUSA-2 thermal cycle test article is
shown in the figure on the bottom of the previous page. The slight hump in the IV curve
near Is¢ is due to the bypass diode. The bypass diode is across 10 cells, which includes 5 cut
cells shortened to 7.5 x 8 cm. instead of the normal full 8 x 8 cm. The cut cells limit the
maximum current through most of the IV curve. Once the bias voltage drops below the
voltage of the final row of cells, the bypass diode operates, eliminating 10 cells form the
circuit, and the current is only supplied by the remaining 5 uncut cells and rises up to the
full area value.
The dashed line labelled "Cell #4 Heated to 80 °C" shows the IV curve shape which
resulted after heating the bad cell (cell 4) in RUSA-2. Notice the current is limited to
nearly 50% of the baseline. This curve is nearly identical to the result obtained after one-half of one cell was covered, or shadowed, so that it only produced half of its full area
current capability, labelled "1 Cell Heated & 50% Shadowed". The very obvious similarityin these two IV curves indicates that a loss of area in cell #4 is one possible explanation of
the current drop seen at elevated temperatures. Note the IV curve shape reveals no
shunting or increased series resistance characteristics, which would seem to rule out
explanations using those phenomenon by themselves.
Further evidence that an area loss is the most likely cause can be seen by examining the IV
curves taken while the coupon was in the thermal cycling chamber. While the light
intensity of the flash testing is 1 sun, the intensity of the illumination in the thermal
cycling chamber is only 1/3 sun. However, the IV curves have the same overall shape atboth intensities. The fact that the percentage current reduction and curve shapes are
identical for two different intensity levels eliminates series resistance or shunting
problems as the sole source of the degradation. Had the cause been related to seriesresistance, the current loss would have been less at the lower intensity due to lower series
voltage losses.
Summary
The evidence gathered from the experiments described above indicate that the current loss
in the RUSA-2 test coupon appears to be due to a loss in cell area. The underlying cause of
the area loss is more difficult to explain. Although cracks are visible on the cells, the areas
lost do not visibly appear to be separated from reaching any of the 10 contact pads (they are
still contributing to cell performance). As with most cell cracking and fatigue damage, as
thermal cycling progresses, the condition should tend to worsen. The effect noted above
did not worsen as cycling continued, but remained unchanged.
Finally, an illuminated electrical test while heating the bad cell and shadowing different
areas of the cell allowed us to determine that "upper half" is the "bad area" of the cell.
15
CONCLUSION
In eight months time, this test successfully demonstrated the equivalent of four years of
low earth orbit thermal cycling, a total of 24,000 cycles, on two samples of the Mir
Cooperative Solar Array. As a result of this test, changes were made to improve some
aspects of the solar cell coupon-to-support frame interface. It is unfortunate that the test's
validity was somewhat compromised due to deviations in the test articles and the initial
difficulties with the test facility. However, most of the physical changes and the electrical
degradation at elevated temperatures was most likely due only to these initial problems,
not related to thermal cycling. Since there was no significant degradation in the structural
integrity of the test articles and no electrical degradation (not including the one cell
damaged early and removed from consideration), it can reasonably be concluded from the
results of this test that the integration of the U.S. PPMs with the Russian support structure
will be able to withstand at least 24,000 thermal cycles (4 years on-orbit).
16
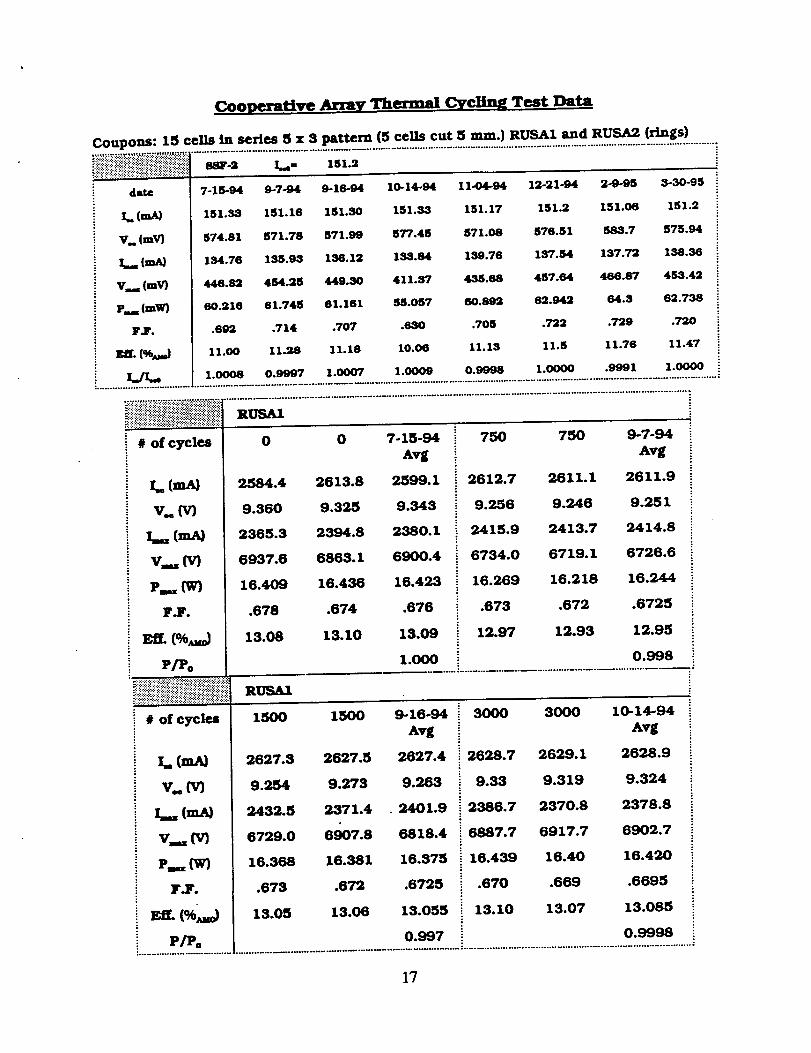
Cooperative Array Thermal Cyclin_ Test Data.
Coupons: 15 cells in series 5 • 3 pattern (5 cells cut 5 mm.) RUSAI and RUSA2 (rings)
7-15-94 9-7-94 9-16-94 16-14-94 II_D4.94 12-21.94 2-9-98 3-30-95
151.33 151.16 151.30 151.33 151.17 151.2 151.06 151.2
574.81 571.76 571.99 877.48 871.08 576.51 583.7 575.94
134.76 135.93 136.12 133.94 139.76 137.54 137.72 138.36
446.82 454.25 449.30 411.37 438.08 457.94 466.67 453.42
60.216 61.745 61.161 58.067 60.892 62.942 64.3 62.738
.692 .714 .707 .630 .705 .722 .729 .720
11.00 11.28 11.18 10.06 11.13 11.5 11.76 11.47
date
I. (m_
V. (mV_
I.. (m_
v.._ {mV)
P.. (row)
F.F.
: _ 1.0008 0.9997 1.0007 1.0009 0.9998 1.0000 .9991 1.0000: ................................................................................................................................... • ........................................................ . ............................
__i_%%_%_%i%%%%"i_'%.................................................................................................................................................................. iiiiiiiiiiii!!i i !i:iiiiiiiii ii! ii!iii!!iiiii!
# of cycles 0 0 7-15-94 750 750
I.. _._A)
v.t_
V... (V)
P_.. (W)
F.F.
P/Po
iiiiiiiiiiiiiiii iiiiiiiiiiiiiii!iiiiiiiiiiiiiiiiiiiiiiiiiii!i# of cycles
_. (m_
v.(v)
z_. (_
v... (v)
P_.. (w)
F.F.
Avg
2584.4 2613.8 2599.1
9.360 9.325 9.343
2365.3 2394.8 2380.1
6937.6 6863. I 6900.4
16.409 16.436 16.423
• 678 .674 .676
13.08 13.10 13.09
1.000
9-7-94
Avg
2612.7 2611.1 2611.9
9.256 9.246 9.251
2415.9 2413.7 2414.8
6734.0 6719.1 6726.6
16.269 16.218 16.244
.673 .672 .6725
12.97 12.93 12.95
0.998
RUSA1
1500 I_ 3000 30009-16-94
Avg
2627.3 2627.5 2627.4
9.254 9.273 9.263
2432.5 2371.4 2401.9
6729.0 6907.8 6818.4
16.368 16.381 16.375
.67'3 .672 .6725
13.05 13.06 13.055
0.997
10-14-94
Avg
2626.7 2629. I 2628.9
9.33 9.319 9.324
2386.7 2370.8 2378.8
6887.7 6917.7 6902.7
16.439 16.40 16.420
•670 .669 .6695
13.10 13.07 13.085
0.9998
17
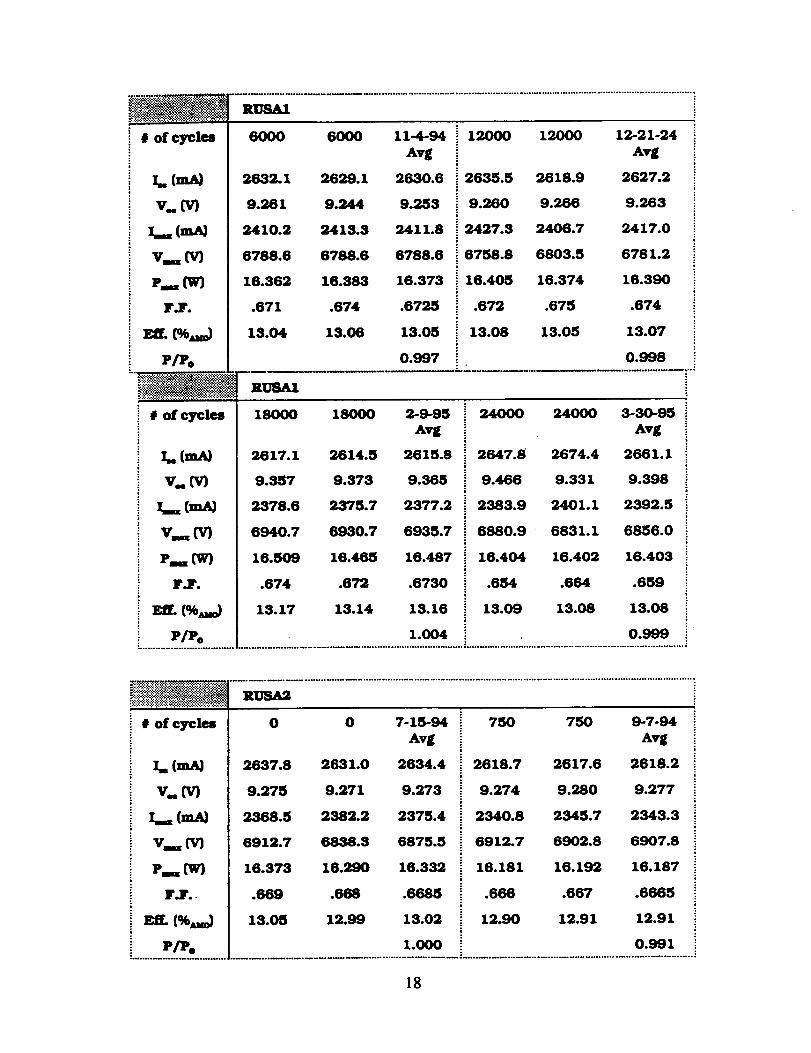
# of cycles 6000 6000 11-4-94 12000 12000 12-21-24
j.. (m_
v.(v}
_.. (:A}
v1(v)
Pm(w)
F.F.
P/'Po
•"___.:_..,.-. _ '
# of cycles
Avg
2632.1 2629.1 2630.6
9.261 9.244 9.253
2410.2 2413.3 2411.8
6788.6 6788.6 6788.6
16.362 16.383 16.373
.671 .674 .6725
13.04 13.06 13.05
0.997
Avg
2635.5 2618.9 2627.2
9.260 9.266 9.263
2427.3 2406.7 2417.0
6758.8 6803.5 6781.2
16.405 16.374 16.390
•672 .675 .674
13.08 13.05 13.07
0.998
I.. (m_
v.(v)
(_
v_.. (v)
Pm(W}
F.F.
P/Po
RUSAI
1800O 180OO 24OOO 24OOO2-9-95
Avg
2617.1 2614.5 2615.8
9.357 9.373 9.365
2378.6 2375.7 2377.2
6940.7 6930.7 6935.7
16.509 16.465 16.487
.674 .672 .6730
13.17 13.14 13.16
1.004
3-30-95
Avg
2647.8 2674.4 2661.1
9.466 9.331 9.398
2383.9 2401.1 2392.5
6880.9 6831.1 6856.0
16.404 16.402 16.403
.654 .664 .659
13.09 13.08 13.08
0.999
.=;:_!_:!._!_-._!..':._:_:_._: _.. -_._
:!:!:_.!_:!:_!_.'.'_.!:!::::;:@__.::$_._:.._::::__..:_:_
# of cycles 0 0 7-15-94 750 750 9-7-94
_.. (m_
v.(v)
(m_
v..._ ('v)
P_.. (w)
F.F..
.......... ......
Avg
2637.8 2631.0 2634.4
9.275 9.271 9.273
2388.5 2382.2 2375.4
6912.7 6838.3 6875.5
16.373 16.290 16.332
.669 .668 .6685
13.05 12.99 13.02
Avg
2618.7 2617.6 2618.2
9.274 9.280 9.277
2340.8 2345.7 2343.3
6912.7 6902.8 6907.8
16.181 16.192 16.187
.666 .667 .6665
12.90 12.91 12.91
1.000 0.991
18
........................ o .................................. _ ..................................................................................................
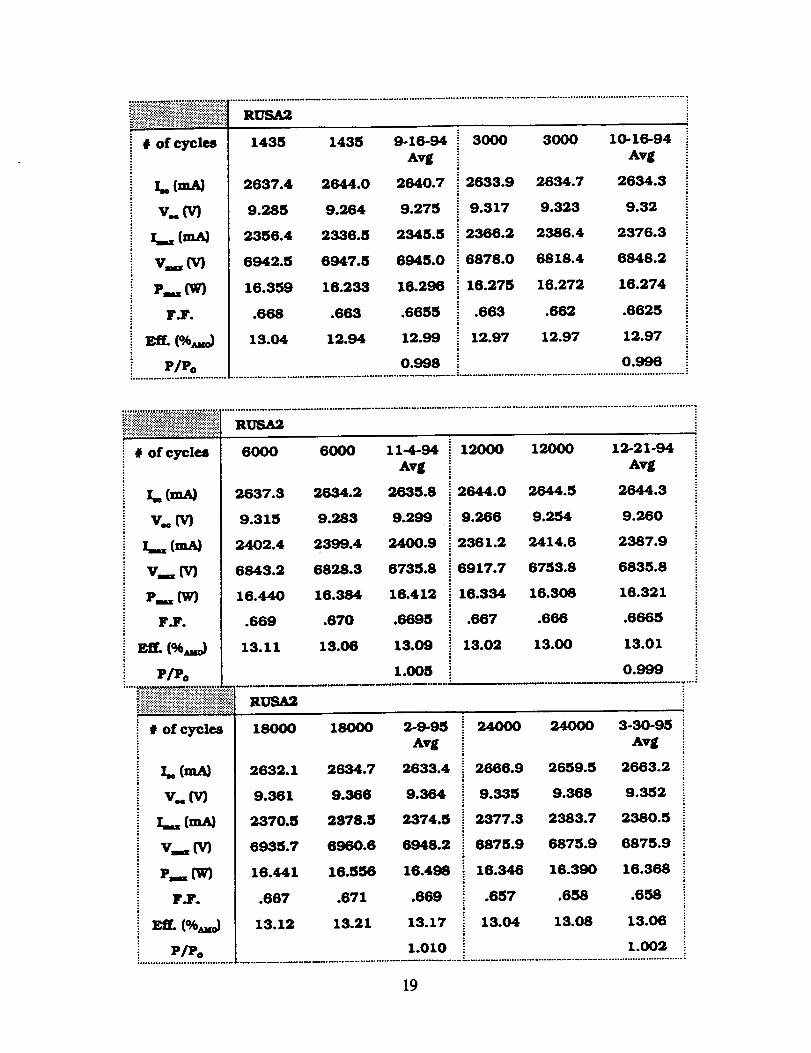
# of cycles 1435 1435 9-16-94 3000 3000 10-16-94
Avg
2637.4 2644.0 2640.7
9.285 9.284 9.275
2356.4 2336.5 2345.5
6942.5 6947.5 6945.0
16.359 16.233 16.296
.666 .663 .6655
13.04 12.94 12.99
0.998
I.. (mA}
V../'v')
V.... (V)
P_. (W)
F.F.
P/Po
Avg
2633.9 2634.7 2634.3
9.317 9.323 9.32
2366.2 2386.4 2376.3
6878.0 6818.4 6848.2
16.275 16.272 16.274
•663 .662 .6625
12.97 12.97 12.97
0.996
f..;.Tr._.t;_.;;_._:/.;; A ;:_:::. • ...................... _ ......................................... , ........................................................................................
# of cycles 6000 6000 11-4-94 ! 12000 12000 12-21-94
V.(V)
P..= (W)
FAr.
P[Po.....__._
iiiiiiiiiiiiiiiiiiiiiiiiiiiiii!iiiiiiiiiiiliiiiiiiiiiiil
# of cycles
_.. (m_
v.(v)
(ma}
v_.. (v)
P=.. (W}
F.Fo
_[- (%,_,o)
P/Po
avg
2637.3 2634.2 2635.8
9.315 9.283 9.299
2402.4 2399.4 2400.9
6643.2 6828.3 6735.8
16.440 16.384 16.412
.669 .670 .6695
13.11 13.06 13.09
1.005
RUSA2
18000 18000 2-9-95
Avg
2632.1 2634.7 2633.4
9.361 9.366 9.364
2370.5 2378.5 2374.5
6935.7 6960.6 6948.2
16.441 16.556 16.498
•667 .671 .669
13.12 13.21 13.17
1.010
2644.0
•1 9._6
2361.2
6917.7
16.334
.667
13.02
Avg
2644.5 2644.3
9.254 9.260
2414.6 2387.9
6753.8 6835.8
16.308 16.321
.666 .6665
13.00 13.01
0.999
24000 24000 3-30-95
Avg
2666.9 2659.5 2663.2
9.335 9.368 9.352
2377.3 2383.7 2380.5
6875.9 6875.9 6875.9
16.346 16.390 16.366
.657 .658 .658
13.04 13.08 13.06
1.002
19
IIII
2O
E@
m
IIII
IIII
¢.-
I8
o
I
ee
.E
U
2]
_oU_u 8 _
IIII
_T¸I I I
C
f.)
r.
Z)n"
@II H
W@
2
8
e
(.]
1
m !
22
_0 U
I I I I
"It II') fO I',,-
IIII
C0O.
0o
u"a
0
t,-
w
,<CO
o n"U.
r-
I!
23
I FormAopro_e_REPORT DOCUMENTATION PAGE o_ so.ozo_lssPut_c reportingbur¢km!_ th0` coUm_n of k_ormmiont, Iknmed to average 1 hourper req:m_e. _duding ttmbrrm tot revtmdngInmmctionm.March_g _ data _urc_Oethedn8 and _ the dam maded, w_d ¢ZmlNd_ md _ the =oaecem of inlommtm. Send oemmm_ regaling mb burden--tknato _ any ether mpect d tht.¢_kctkxl of )nfofmito_ Indu¢_ tug_ for mduc_ thll burckm,to Wih_ Headqtmrtl_ Service. Dklcmfato lot k#om_bon Opeca_onsand Reports. 1215 JdlmlmnDavis H_lmmy. Su_o 1204. Arington. VA 222_2-43G_ and to the Otf_e of M_ and Budg_ Papenmrk _ Pro_ (0704-0188). Wmt_ DC 2060_
1. AGENCY USE ONLY (Leave b/ank) 2. REPORT DATE
April19(_4. TITLE AND SUBTITLE
Mir Cooperative Solar Array ProjectAcce]emed I_c _ Cycling Test
e. Atrm(_s)
David J. Hoffman and David A. Scheiman
7. PERFOmaNGORGAN_.A'nONNAME(S)AN/)ADDRESS(ES)
National Aeronautics and Space AdministrationLewis Research Center
Cleveland, Ohio 44135-3191
9. SPONSOFUNGAK)NIT_ AGENCY NAME(S) AND ADDRESS(ES)
National Aeronautics and Space AdminisWationWashington,D.C. 20546-0001
REpowr TIPS ,_o DATESCOVEREDTechnical Memorandum
5. FUNDING NUMBERS
WU-478-12--10
8. PERFORImNG OFiGANG[ATIONREPORT NUMBER
E-10177
10. SPONSORING/MONITORINGAGENCY REPORT NUMBER
NASA TM- 107197
11. SUPPLEMENTARY NOTES
David J. Hoffman, NASA Lewis Resem_h Center, and David A. Scheiman, NYMA, Inc., 2001 Aerospace Parkway, BrookPark, Ohio 44142 (work performed under NASA Conwact NAS3-27186). Respons_lc person, David J. Hoffman, PowerSystem Project Office, NASA Lewis Research Center, organization code 6910, (216) 433-2445.
12a. DI STRIBUTION/AVAILABILITY STATEMENT
Unclassified -Unlimited
Subject Categca'ies 18 and 20
This publication is available from the NASA Center for Aea'oSpsce Information. (301) 621-0390.
12b. DISTRIBUTION CODE
13. ABSTRACT (U*Jdmum 200 words)
Tbe Mir Cooperative Solar Array (MCSA) project was a joint U.SJRussian effort to build a photovoltaic (PV) solar arrayand deliver it to the Russian space station M/r. The MCSA will be used to increase the electrical power on M/r andprovide PV array performance data in suplxxt of Phase I of the International Space Station. The MCSA was brought toM/r by space shuttle At/ant/s in November 1995. This relxxt describes an accelerated thermal life cycle test which wasperformed on two samples of the MCSA. In eight months time, two MCSA solar array "mini" panel test articles weresimultaneously put through 24,000 thermal cycles. There was no significantdegradation in the slructural integrity of thetest articles and no electrical degradation, not including one cell damaged early and removed from consideration. Thenature of the performance degradation caused by this one cell is briefly discussed. As a result of this test, changes weremade to improve some aspects of the solar cell coupon-to-support frame interface on the flight uniL It was concludedfrom the results that the integration of the U.S. solar cell modules with the Russian support su'ncture would be able towithstand at least 24,000 thermal cycles (4 years on-orbit). This was considered a successful development test.
14. SUBJECT TERMS
Photovoltaic; Thermal cycling;Mir
17. SECUPJTY CUA$..q4FiCATION 18. SECURfiN CLASSIFICATION
OF REPORT OF THIS PAGE
Unclassified Unclassified
NSN 7540-01-280-5500
19. SECURrrY CLASSIFICATION
OF ABSTRACT
Unclassified
15. NUMBER OF PAGES
2616. PRICE CODE
A0320. UMITA'nON OF ABSTRACT
Standard Form 2ge (Rev. 2-89)
Prescribed by ANSI SKI. Z39-18298-102

o___,_o _o
_ oO¢ _.
_:_ _-_-I do _' =
0
z _0 _
"n
e-


![Research Article Cooperative Strategies for Maximum-Flow ...downloads.hindawi.com/journals/mpe/2016/2349712.pdf · Saha et al. [ ] used two price promotion policies, MIR ... hensive](https://img.pdfslide.us/doc/110x75/5f4e8ffbb0806e7e143508ed/research-article-cooperative-strategies-for-maximum-flow-saha-et-al-used.jpg)


![[Array, Array, Array, Array, Array, Array, Array, Array, Array, Array, Array, Array]](https://img.pdfslide.us/doc/110x75/56816460550346895dd63b8b/array-array-array-array-array-array-array-array-array-array-array.jpg)