Embed Size (px)
Citation preview

MINUTES OF THE 75th MEETING OF THE FORUM OF REGULATORS (FOR)
(Through Video Conferencing) Day/Date: Friday, 30th April, 2021
The meeting was chaired by Shri P.K.Pujari, Chairperson, Central Electricity
Regulatory Commission (CERC) and Forum of Regulators (FOR). He welcomed all
the members of the Forum to the 75th meeting of the FOR. He welcomed Shri
Vishwajeet Khanna who had taken charge as the Chairperson of Punjab State
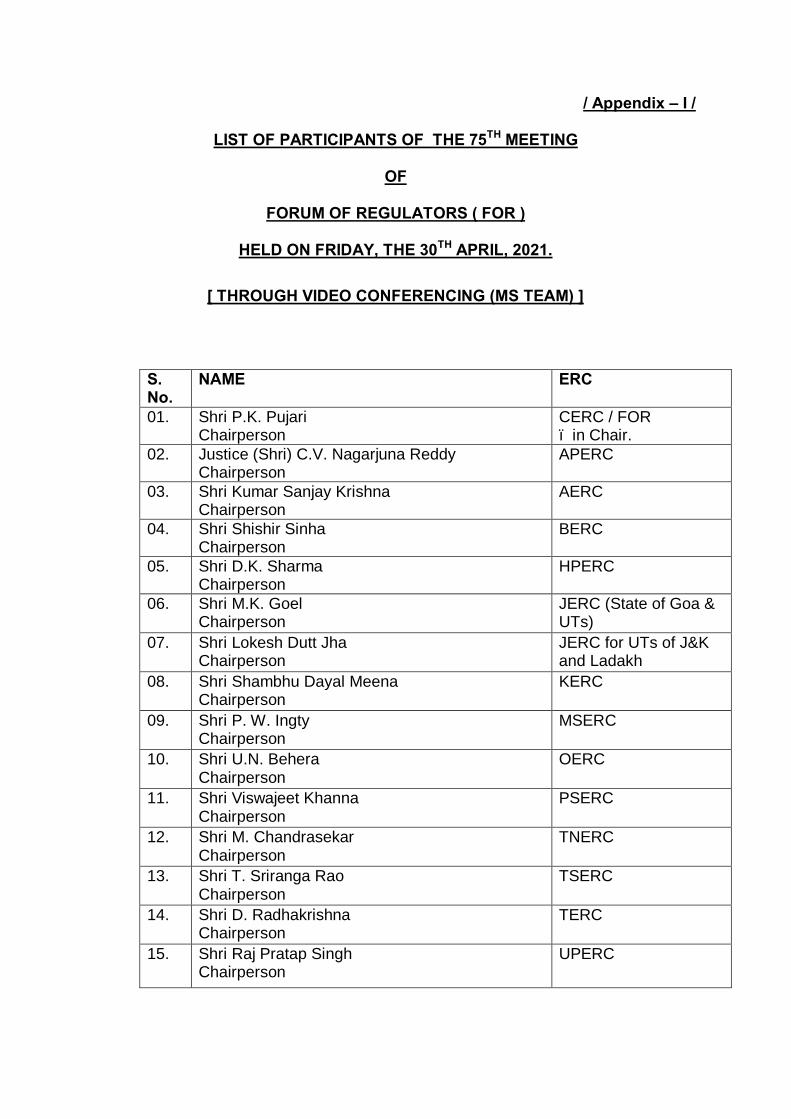
Electricity Regulatory Commission. The list of participants is at Appendix–I.
Chairperson, FOR/CERC appraised the Forum that the meeting had been
convened for discussing the Report of the FoR Working Group on “Factors affecting
retail tariff and ways to address them.”
Thereafter, the Forum took up the agenda items for consideration.
AGENDA ITEM NO.1: Confirmation of minutes of 74th meeting of the Forum of Regulators
With respect to the agenda proposed by Chairperson WBERC on the
requirement of preparing Model Regulations for addressing the issue of import of
power by discoms from captive generators located within/outside the State through
Open access, the Forum in the 74th FOR meeting had decided that the individual
SERCs would take appropriate action in accordance with their respective
regulations. However, some Chairpersons felt that it would be useful if Model
Regulations are prepared, which could bring uniformity. After deliberation, it was
decided that a Working Group (WG) may be constituted to examine the issue and
suggest Model Regulations. It was decided that the Working Group would be chaired
by Chairperson of UPERC and Chairpersons of ERCs of Delhi, Tripura,
Maharashtra, Odisha, West Bengal and Tamil Nadu would be members. With the
above amendments, the Forum approved the minutes of the 74th Meeting of FOR
held on 9th April, 2021.
AGENDA ITEM NO.2: Report of FOR Working Group on “Factors Affecting Retail Tariff and Ways to Address Them”
The Report of the FoR WG on “Factors affecting retail tariff and ways to
address them” was placed before the Forum for approval and adoption. The report
was considered in detail and after detailed deliberations was adopted with following
changes.
Proposed norms for disposal and transportation of fly ash
Chairperson, UPERC apprised the Forum that disposal and transportation of
fly ash are to be done free of cost by the thermal power projects, as per the latest
circular of the Ministry of Environment, Forest and Climate Change (MoEF&CC). The
previous limit of 100 km is being extended to 300 km. If transportation cost is
subsumed in the power purchase cost (PPC), it would increase the retail tariff.
Chairperson, OERC stated that in order to do an analysis of the costs associated
with transportation of fly ash, one needs to take stock of the present level of fly ash
in different plants, the data for which may be available with CEA. Chairperson,
WBERC mentioned that transportation would have a significant impact on the retail
tariff. After discussion it was decided to incorporate in the report the impact on
account the new notified norms for disposal and transportation of fly ash.
Transmission Charges
Chairperson, OERC stated that while STU charges have remained constant
or have increased only marginally over the past decade or so, CTU charges have
increased substantially. He observed such a divergence should not happen,that
given that the expansion of both intra-state and inter-state transmission network
occurs according to the same demand projection.
Shri I. S. Jha, Member, CERC observed that the difference in the CAGR for
CTU charges and STU charges over the years only indicates that adequate
investments have not been made in the state network . He added that transmission
is complementary to generation expansion and demand growth. While about 200
GW generation capacity addition has taken place in the last decade, the demand as
projected has not grown. Also, the transmission system is planned based on future
demand and taking into consideration issues like Right of Way (RoW)
Chairperson, UPERC seconded the point of Member, CERC in that
transmission expansion has occurred with the future in consideration. However, he
went on to add that the (n-1-1) and (n-1) criteria have added to the transmission
cost. He also stated that in the past 4-5 years, although demand has increased,
energy consumption has remained fairly constant.
Shri I. S. Jha, Member, CERC reiterated that demand has not increased as
per the forecast. When the high capacity corridor was planned, the regulatory
approval did not consider (n-1). This was based on the understanding that 30-40% of
the projected generation might not come up, and reliability would be introduced
automatically. He further explained that the degree of investment seen in
transmission segment in the last decade (the development phase of the national
grid) is not likely to be repeated in the coming decade (the existing infrastructure is
expected to work efficiently for the next few years).
Chairperson, HPERC pointed out that PGCIL has a standardised design for
400 kV substations – with 6 bays, which are often not utilised by the States. States
on the contrary make yearly payment to PGCIL for non-utilisation of these bays. He
suggested that the bays and substations should be designed as per the requirement
of the concerned state. In response to this, Shri I. S. Jha, Member, CERC explained
that, owing to delay on the part of States in constructing bays a few years ago, it had
been decided at the level of RPCs that 2 bays would be added whenever a
transformer is added in the regional scheme (transformers are added on the request
of States). However, recently CERC has directed the CTU to review the
standardised design and normative values and have State-specific or region-specific
substation designs (number of bays).
Chief (Engineering), CERC added that in the 12th Plan, only 44% of the
expected increase was witnessed in terms of peak demand and only 50% increase
in terms of energy demand. Hence, there is a shortage of about 50% of the expected
demand in the Plan period. With generation being a delicensed activity and
transmission being a regulated activity, with non-discriminatory OA, such gaps are
likely if the demand does not increase as expected.
Chairperson, WBERC observed that the WG was focused on measures to
reduce retail tariff for end consumers. The issues involved are coal supply, coal
contracts, generation forecast (not commensurate with the demand forecasts), wide
variation in transmission costs (due to increased investments), etc. The burden of all
this is ultimately borne by the end consumers.
Chairperson, UPERC suggested that future planning of transmission should
be demand based, rather than supply-based as is at present. There should be a
scientific method of assessing the demand of every region and planning should flow
from there, he added. He also suggested that for tariff-based competitive bidding
(TBCB), rather than having a monetary threshold of Rs. 100 crores, minimum 220 kV
should be considered.
Chairperson, OERC added that Bihar and Jharkhand had gone for TBCB.
However, in these States, costs increased, contrary to general opinion that TBCB
leads to cost reduction. Shri I. S. Jha, Member, CERC added that a number of
factors come into play in bidding, as a result of which tariff discovered through TBCB
can be lower or higher compared to that on cost plus basis. .
Chief (Regulatory Affairs), CERC mentioned that in future, transmission
planning should be based on accurate demand forecasts, and DISCOMs and STUs
should do due diligence in demand forecasting. Chairperson, WBERC mentioned
that the RPCs are responsible for this activity and they should be made more
accountable, responsible and responsive. Chairperson, FOR/CERC mentioned that
the CERC Transmission Planning Regulations, 2018 mandates the requirement of
explicit approval of RPCs for transmission planning. It was pointed out that WBERC
has directed DISCOMs to get approval of the ERC before approaching the RPC in
the matter of demand forecast. Chairperson, UPERC added that in UP, the STU
makes a detailed (project-wise) 5-year business plan and gets approval of the ERC.
He mentioned that RPCs are responsible for technical approval, the State
Empowered Committee for administrative approval, while the SERCs look into the
financial aspects for regulatory approval (w.r.t. tariff).
After discussion, it was decided that the report should include the following: (i)
demand growth not following the projection (leading to stranded transmission assets)
has been a factor responsible for increase in per unit CTU charges over the years;
(ii) in future, transmission planning should be based on accurate demand forecasts,
and DISCOMs and STUs should do due diligence in demand forecasting; and (iii) the
comparison between cost plus based transmission projects and competitively bid
transmission projects should be on the basis of comparable tariff.
O&M Cost
Chairperson, HPERC stated that the O&M expenses vary from State to State.
Hence, there should be a Committee on benchmarking O&M expenses on normative
basis by taking into consideration factors such as the geographic location of the
State etc. He stated that DISCOMs are not often capable of reducing these
expenses on their own due to external interference. Chairperson, UPERC opined
that the ERCs should rely on the regulatory accounts of DISCOMs and not on their
Profit-Loss (P&L) account. The regulatory account takes into consideration the
normative parameters fixed by the ERC, which are based on State specific factors
like geographical location etc.
New Environmental Norms
Chairperson, UPERC pointed out that apart from the capital cost of FGD,
annual O&M expenses should also be taken into account. Chief (RA), CERC clarified
that the impact assessment done in the report does factor in O&M expenses.
GCV of Coal
Chairperson UPERC observed that MoP should look into the issue of third
party sampling of GCV of coal. He further added that CERC may consider
empanelment of independent and technically qualified agencies/labs for third party

sampling of GCV of coal. There was general agreement on the issue and it was
decided to incorporate in the report a recommendation regarding CERC empanelling
independent agencies/labs for third part sampling of GCV of coal.
Return on Equity
Shri I. S. Jha, Member, CERC suggested that reduction in RoE should be
recommended, but determination of normative RoE should be left to the respective
ERCs. Chairperson, UPERC suggested that instead of recommending a particular
ROE, the principle of determination of such RoE (such as G-Sec rate plus a risk
premium) for different businesses should be recommended. Chairperson, UPERC
suggested that RoE should be linked to G-Sec rates instead of MCLR so as to avoid
passing on the inefficiencies of the bank to the consumers. He suggested that 10-
year G-Sec rate should be used as reference. Furthermore, for DISCOMs, RoE
should be allowed only on the equity invested on productive assets (assets which
have made their way to the regulatory account and which are present in the net fixed
asset list). Chairperson, WBERC stated that as per section 61 of the Act, CERC
regulations on generation and transmission act as guidelines to be followed by
SERCs. Furthermore, distribution business falls under the jurisdiction of SERCs.
After detailed discussion, it was decided to suitably include in the report the
recommendation regarding principles for determination of ROE (10-year G-Sec rate
plus a risk premium).
Depreciation
Chairperson, UPERC suggested that the methodology (straight line method)
should be mentioned clearly. He also suggested that other clarifications must also be
made, especially as to how the recommended depreciation rate is arrived at with
increasing depreciation period. It was agreed to suitably incorporate these
suggestions in the report.
Growing share of RE
Chairperson, WBERC mentioned that initially RE was planned as distributed
generation resources so as to minimise the requirement of evacuation infrastructure.
He added that most of the States have nominated the DISCOMs as the Nodal
Agency for RE on the premises that RE would be promoted as distributed generation
resources. It was decided to suitably incorporate the suggestion in the report.
Other issues
Chairperson, UPERC, in reference to best practices for cost reduction,
suggested that the SCED should be recommended at State level only when it results
in a reduction of consumer tariff.
On the issue of trading margin, it was agreed that trading margin should be
capped by both CERC and SERCs and that DISCOMs should adhere to these caps
while giving consent to bids for procurement through traders.
It was also unanimously agreed that all the future projects, except hydro
generation projects and nuclear power projects, should be set up only through the
competitive bidding route, as stipulated in MoP’s guidelines.
The Report on “Factors affecting retail tariff and ways to address them”, after
incorporating the suggestions as agreed during the meeting, is finalised and attached at Annexure–I. The Report as finalised (Annexure-I) is unanimously
approved and adopted by the Forum. It was decided that the same may be placed in
the website of FOR.
Conclusion
The Forum appreciated the efforts made by the Working Group in finalising
the report on “Factors affecting retail tariff and ways to address them” which provides
a deep insight into the issues at stake in the context of retail tariff for consumers.

At the end of the meeting, Chief (Regulatory Affairs), CERC thanked all the
members for their valuable inputs. He also thanked the FOR Secretariat for their
efforts in organising the FOR meeting online.
The meeting ended with vote of thanks to the Chair.
*******
/ Appendix – I /
LIST OF PARTICIPANTS OF THE 75TH MEETING
OF
FORUM OF REGULATORS ( FOR )
HELD ON FRIDAY, THE 30TH APRIL, 2021.
[ THROUGH VIDEO CONFERENCING (MS TEAM) ]
S. No.
NAME ERC
01. Shri P.K. Pujari Chairperson
CERC / FOR – in Chair.
02. Justice (Shri) C.V. Nagarjuna Reddy Chairperson
APERC
03. Shri Kumar Sanjay Krishna Chairperson
AERC
04. Shri Shishir Sinha Chairperson
BERC
05. Shri D.K. Sharma Chairperson
HPERC
06. Shri M.K. Goel Chairperson
JERC (State of Goa & UTs)
07. Shri Lokesh Dutt Jha Chairperson
JERC for UTs of J&K and Ladakh
08. Shri Shambhu Dayal Meena Chairperson
KERC
09. Shri P. W. Ingty Chairperson
MSERC
10. Shri U.N. Behera Chairperson
OERC
11. Shri Viswajeet Khanna Chairperson
PSERC
12. Shri M. Chandrasekar Chairperson
TNERC
13. Shri T. Sriranga Rao Chairperson
TSERC
14. Shri D. Radhakrishna Chairperson
TERC
15. Shri Raj Pratap Singh Chairperson
UPERC
16. Shri D.P. Gairola Officiating Chairperson/Member (Law)
UERC
17. Shri Sutirtha Bhattacharya Chairperson
WBERC
18. Shri Ramesh Kumar Choudhary Member
BERC
19. Shri Arun Kumar Sharma Member
CSERC
20. Shri Naresh Sardana Member
HERC
21. Shri S.C. Dinkar Member
RERC
22. Dr. Sushanta K. Chatterjee Chief (RA)
CERC
SPECIAL INVITEES
23. Shri Indu Shekhar Jha
Member CERC
24. Shri Pravas Kumar Singh Member
CERC
25. Shri Vijay Menghani Chief (Engg.)
CERC
OTHERS
26. Ms. Rashmi S. Nair Dy. Chief (RA)
CERC
27. Mr. Sanjeev Tinjan, Asst Chief (RA)
CERC
28 Ms Rashmi Saurav Research Associate
CERC
27. Shri Suresh Gehani Director
ABPS
28. Shri Tarun Aggarwal
ABPS
29. Shri Ramit Malhotra Associate Director
KPMG
30. Shri Surya KPMG

1 | P a g e
Secretariat: Central Electricity Regulatory Commission
Chanderlok Building, 36 Janpath, New Delhi
Annexure-I

2 | P a g e
Table of contents
1. Introduction............................................................................................................................ 4
2. Analysis ................................................................................................................................... 6
2.1. Details of Analysis...........................................................................................................6
2.1.1 Power Purchase Cost ...............................................................................................6
2.1.2. Transmission Charge................................................................................................7
2.1.3. Fixed Cost related factors ........................................................................................8
3. Recommendations ................................................................................................................ 11
3.1. External Factors............................................................................................................ 11
3.1.1. Coal ...................................................................................................................... 11
3.1.2. Railway freight ...................................................................................................... 12
3.1.3. Clean Energy Cess.................................................................................................. 12
3.1.4. New Environmental Norms .................................................................................... 13
3.1.5. New Norms for disposal and transportation of fly ash ............................................. 13
3.2. Internal Factors ............................................................................................................ 14
3.2.1. High transmission costs ......................................................................................... 14
3.2.2. Generation assets are also stranded. Old gas plants are too expensive and fixed costs
are being paid without any utilization. .................................................................................. 14
3.2.3. Return on equity allowed to Generation / Transmission and distribution companies
needs to be made more realistic and at par with interest rates............................................... 15
3.2.4. Impact of depreciation on tariff.............................................................................. 16
3.2.5. Growing share of Renewable Energy ...................................................................... 16
3.2.6. Right Energy mix and right mix of long term, medium term and short term PPAs – Best
practices …………………………………………………………………………………………………………………………………17
3.2.7. Cost optimisation through greater use of market – Best practices ............................ 17
3.2.8. Trading Margin be curtailed ................................................................................... 17
3.2.9. Waiver of water usage charges for Hydro Projects ................................................... 18
3.2.10. Distribution level efficiency in operation................................................................. 18
3.2.11. Other suggestions ................................................................................................. 18
4. Summary of Recommendations.......................................................................................... 19
4.1. External Factors............................................................................................................ 19

3 | P a g e
4.1.1. Coal ...................................................................................................................... 19
4.1.2. Railway freight ...................................................................................................... 19
4.1.3. Clean Energy Cess.................................................................................................. 20
4.1.4. New Environmental Norms .................................................................................... 20
4.1.5. New Norms for disposal and transportation of fly ash ............................................. 20
4.2. Internal Factors ............................................................................................................ 20
4.2.1. High transmission costs ......................................................................................... 20
4.2.2. Generation assets are also stranded. Old gas plants are too expensive now and fixed
costs are being paid without any utilization. .......................................................................... 21
4.2.3. Return on equity allowed to Generation/ Transmission and distribution companies
needs to be made more realistic and at par with interest rates............................................... 21
4.2.4. Impact of depreciation on tariff.............................................................................. 22
4.2.5. Growing Share of Renewable Energy ...................................................................... 22
4.2.6. Right Energy mix and right mix of long term, medium term and short term PPAs – Best
practices …………………………………………………………………………………………………………………………………22
4.2.7. Cost optimisation through greater use of market – Best practices ............................ 23
4.2.8. Trading Margin be curtailed ................................................................................... 23
4.2.9. Waiver of water usage charges for Hydro Projects................................................... 23
4.2.10. Distribution level efficiency in operation................................................................. 23
4.2.11. Other suggestions ................................................................................................. 24
4 | P a g e
1. Introduction
The Forum of Regulators (FOR), in its Special Meeting held on 16.10.2020 deliberated on various
factors leading to high cost of power, several of which are beyond the control of the electricity
regulators and felt the need to analyse and evolve measures towards reduction or at least
containment of retail tariff. The FOR also decided to form a Working Group (WG) to look into the
issues raised during the meeting.
Accordingly, this Working Group was constituted with the following composition:-
Chairperson, Punjab State Electricity Regulatory Commission – Chairperson
Chairperson, Gujarat Electricity Regulatory Commission – Member
Chairperson, West Bengal Regulatory Commission – Member
Chairperson, Odisha Regulatory Commission – Member
Chairperson, Tamil Nadu Regulatory Commission – Member
Chairperson, Joint Electricity Regulatory Commission (Goa &UTs) – Member
Chief, (Regulatory Affairs), Central Electricity Regulatory Commission-Convener
The broad scope of work of the Working Group included the following:-
a) Analysis of various components of power purchase cost (PPC) and their impact on retail
tariff.
b) Analysis of external factors (i.e. factors external to electricity sector) and internal factors
(across the value chain of generation, transmission and distribution) impacting retail tariff.
c) To suggest measures for addressing the issues arising out of the analysis from (a) & (b)
above.
d) Any other matter related and incidental to the above.
A copy of the order constituting the Working Group is enclosed as Annexure - I
The first meeting of the WG was held on 2nd November 2020 (minutes enclosed as Annexure II).
The second meeting was held on 7th December 2020 (minutes enclosed as Annexure III). The

5 | P a g e
3rd, 4th and 5th meeting for finalizing the recommendations were held on 11th December 2020, 28th
December 2020 and 30th December 2020 respectively through virtual mode.
In the first meeting, the WG decided that the factors impacting retail tariff were to be examined in
detail and for this purpose, the possibility of seeking the assistance of consultants who could help
in terms of simulation of data be explored. Accordingly, the services of a consortium of
consultants- M/s KPMG, M/s ABPS and CER of IIT Kanpur were made available to the WG with
the approval of the Chairperson, FOR. This consortium was already assisting FOR under the PSR
program under the aegis of an MOU between the Government of India and the Government of
UK. The consultants carried out simulation of data for 12 States, namely Andhra Pradesh, Assam,
Bihar, Gujarat, Haryana, Jharkhand, Karnataka, Kerala, Madhya Pradesh, Odisha, Uttar Pradesh
and Uttarakhand. Cumulatively, these States account for 50% of the total energy consumed in the
country.
A detailed presentation was made by the consulting agencies highlighting the respective
contribution of various factors in the Average Cost of Service (ACoS) which forms the basis for
the determination of retail tariff. The presentation made by the consulting agencies has been
provided at Annexure-IV(a), IV(b), IV (C), IV (d) and IV (e) to this report. Various data sets as
in the presentation were noted by the Working Group and after further discussions on various
aspects including the factors highlighted by the consulting agencies, the WG arrived at the
findings and recommendations which were presented to the Forum of Regulators for
consideration.
The Forum deliberated the report in detail in its 75th Meeting held on 30th April, 2021 and
finalized the recommendations as outlined in subsequent sections.

6 | P a g e
2. Analysis
Based on the details of the analysis of data for 12 States, the WG found that the PPC accounts for
about 67% - 78% of the ARR, followed by transmission charges and the O&M expenses.
Transmission charges are seen to be contributing in the range of 9.5% - 13.5% and O&M
expenses in the range of about 6% - 21%. Accordingly, the WG felt the need to deep dive into the
factors of PPC, transmission charges, O&M charges and other factors.
2.1. Details of Analysis
The details of analysis carried out have been provided below:
2.1.1 Power Purchase Cost
Since the PPC is the greatest contributor to the costs in the ARR, further analysis was undertaken
in terms of the contribution of the sub components of PPC such as fuel cost, railway freight
charges, distribution losses etc., The following insights emerged:-
In the power purchase cost for sample station, the contribution of coal price has been in the
range of 25%, rail freight at 41%, road transportation charges at 11%, clean energy cess at
11% and others at 12%.
The Impact analysis of clean energy cess was also made. It was found that clean energy
cess has increased over time, from Rs 50 per tonne in June, 2010 to Rs 400 per tonne of
coal since March 2016. The total impact of coal cess on the power sector is around Rs
25000 Crore per year during last 3 years. Presently, the impact assessment shows that a
reduction in clean energy cess of Rs 100 per metric tonne (MT) would lead to a saving of
about 6 paisa per unit which would translate into a saving of 3% of the Average Cost of
Supply (ACoS). Similarly, a reduction of Rs 50 per MT of clean energy cess would lead to
a saving of 3 paisa per unit.
The next element examined was the impact of GCV loss. The GCV loss has a direct
impact on the overall energy charges. The GCV loss due to grade slippage between “as
billed” and “as received” has been in the range of approximately 600 kCal/ kg. Analysis
7 | P a g e
reveals that every 100 Kcal/ kg saving in GCV loss would translate into a saving of energy
charges in the range of 3%. Thus, this is an important area which deserves immediate
attention and can substantially reduce the retail tariff for electricity consumers.
On the coal price front, it was revealed that the prices of G11 to G14 grade of coal (used
for generation in power plants) have increased since FY 2016, the increase being in the
range of 13% - 18%. It was also revealed that this increase in price was 28% higher in
comparison to the estimated price increase based on the weighted average of WPI and CPI.
The analysis of the railway freight charges revealed that for coal and coke, freight charges
have increased twice during the calendar year 2018, the increase being 21% in January
2018 and 9% in November 2018. The increase in railway freight charges in November
2018 was 30% higher as compared to the estimated increase computed based on weighted
average of WPI and CPI.
Thus, both Coal and Railway freight issues are external factors which need to be regulated.
2.1.2. Transmission Charge
Another important element in the power purchase cost is the transmission charge. The data
analysis revealed that a huge investment has been made in the inter-state transmission sector in the
past 10 years.
The annual transmission charges for inter-state transmission have increased from Rs 9,000 crore
in FY 2011-12 to more than Rs 39,000 crore in the FY 2019-20 translating into a CAGR 21%
during this period. Per unit charges for energy transmitted through interstate transmission system
have increased at a CAGR of 15% over the same period.
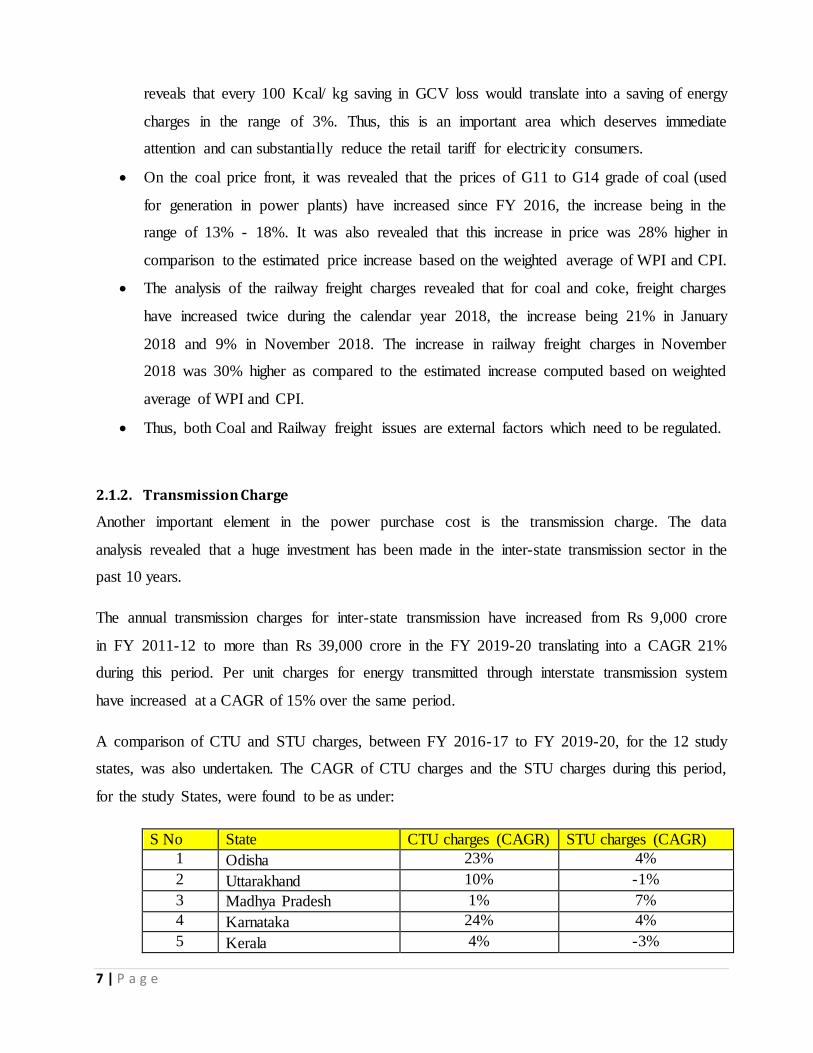
A comparison of CTU and STU charges, between FY 2016-17 to FY 2019-20, for the 12 study
states, was also undertaken. The CAGR of CTU charges and the STU charges during this period,
for the study States, were found to be as under:
S No State CTU charges (CAGR) STU charges (CAGR)
1 Odisha 23% 4%
2 Uttarakhand 10% -1%
3 Madhya Pradesh 1% 7%
4 Karnataka 24% 4%
5 Kerala 4% -3%

8 | P a g e
S No State CTU charges (CAGR) STU charges (CAGR)
6 Jharkhand 9% 32%
7 Assam 0% 7%
8 Uttar Pradesh 25% 3%
9 Gujarat 11% 10%
10 Haryana 40% 3%
11 Bihar 6% 63%
12 Andhra Pradesh 59% 18%
The analysis shows that the inter-State transmission system was designed for projected peak
demand of 2,01,000 MW for FY 2019-20 whereas the actual peak demand for the same year
turned out to be 1,84,000 MW. Actual energy requirement in FY 2019-20 was 1,290 BU as
against the projection of 1,400 BU. Similar trends are seen in previous years as well. Demand not
increasing as per projections is one of the reasons for higher per unit transmission charge.
Another important finding that emerged is that competition in the transmission service
procurement has led to substantial decrease in overall costs. Recent trends of competitive bidding
in transmission reveal that the levelised tariffs for competitively bid projects have been lower than
those on cost plus basis.
It was also noted that green corridor related energy transmission costs are being loaded on to the
CTU cost.
The group also felt that the central transmission utility works are taken up without the SERCs
being apprised of the plan at any stage, This needs to be remedied.
2.1.3. Fixed Cost related factors
The impact of other factors on the retail tariff including the fixed cost elements (RoE, O&M and
depreciation cost) was then taken up.
A comparison of the RoE allowed by different States for generation, transmission and distribution
revealed that the post-tax RoE has been in the range of 14% - 16%. An analysis was also made
regarding the prevailing cost of debt and it was found that the lending rate has been on the lower
side for quite some time. While the RoE has an element of risk premium, the data analysis
9 | P a g e
revealed the need for reconsidering the RoE keeping in view the prevailing prime lending rate and
10 - year G-Sec rate. The contribution of RoE on generation, transmission and distribution, in
respect of 12 States were studied. It transpired that if the RoE was reduced from 15.5% to 14%,
there would be reduction of 2 paisa per unit of retail tariff and if it was reduced further to the level
of 12%, it will lead to a reduction of 7 paisa per unit of retail tariff.
The next issue which was examined in detail was depreciation cost. Regulatory practices in other
sectors on this front were also analysed. The impact/contribution of depreciation on overall ARR
was presented. It emerged that if the loan repayment period considered for depreciation is
extended from 12 years to 15 years, it would decrease the ACoS by 8 paisa per unit of retail tariff.
Further, if the depreciation rate is reduced to 4.3%, considering the loan period of 15 years to
repay 65% of the capital cost, the reduction in retail tariff could be in the range of 10 paisa.
Analysis of internal factors was also undertaken. It revealed that substantial savings can be made
if distribution losses are reduced. The impact of O&M charges and interest and finance charges
were also analysed. It revealed that the approved O&M expenses for the FY 2020-21 in the 12
study States ranged between 6% -21%. For example, in Assam the O&M charge was in the range
of Re 1 per unit of energy handled by the Discom. The O&M charges of the generator of the study
States varied in the range of 10% -16%. The interest and financing charges for the study States
varied in the range of approximately 1% - 9%. For example, in Kerala, the interest and financing
charges were about 50 paisa per unit of energy handled. There is a significant scope of reducing
AT&C losses by better reactive power management as has been adopted in Tamil Nadu. Details
have been provided in Annexure-V.
Apart from the above factors, other external factors, especially the impact of under-utilisation of
assets and the impact of compliance of environmental norms were also undertaken. It was
revealed that retiring inefficient old plants which have been in use for more than 30 years would
reduce the energy charges by 4% - 23%. For the Flue Gas Desulfurisation (FGD) components,
estimate was made based on the benchmark capital cost provided by CEA and operational and
financial norms provided by CERC. The total impact of FGD was computed to be in the range of
about 24 paisa per unit of the energy.
The Ministry of Environment, Forest and Climate Change vide its Draft Notification dated 22nd
April 2021 seeks to make the Thermal Power Plants (TPPs) responsible for 100% utilisation of

10 | P a g e
ash (fly ash and bottom ash) generated by it for eco-friendly purposes like manufacturing of brick
/blocks/tiles, cement manufacturing, road construction etc. As per the draft notification every coal
or lignite based TPPs shall ensure that loading, unloading, transport, storage and disposal of ash is
done in an environmentally sound manner and that all precautions to prevent air and water
pollution are taken.
The Draft Notification also stipulates that all agencies (Government, Semi Government and
Private) engaged in construction activities such as road laying, road and flyover embankments,
shoreline protection structures in coastal districts and dams within 300 km from the lignite/coal
based TPPs shall mandatorily utilise ash in these activities, provided it is delivered at the project
site free of cost and transportation cost is borne by such coal/lignite based thermal power plants.
Hence, as per the Draft notification, the cost of transportation of fly ash is to be borne by TPPs,
which will have substantial impact on cost of generation on thermal power plants. Assuming an
average generation of 250 gm/kwh and ash transportation cost of Rs 2-3/MT/300km, the total
impact on cost of generation works out to be around 15-23 paise/unit for 300 km of ash
transportation.
11 | P a g e
3. Recommendations
The WG, based on the details of the analysis for 12 States, observed that PPC is the largest
contributor to the average cost of supply, having on an average more than 70% share in the cost
for a distribution company. Following PPC, transmission charges and O&M Expenses have a
major share. The WG delved deep into these factors and found that several of them are external to
the electricity sector and need intervention of the Central Government/agencies. There are internal
factors, equally important, deserving attention. Accordingly, the WG has made recommendations
under these two broad heads, viz., external and internal, thereby highlighting the need for a
coordinated effort by the Centre and the States to address the issue of high retail tariff.
3.1. External Factors
3.1.1. Coal
Coal cost is a major contributor in PPC. The increase in coal price was 28% higher in comparison
to the estimated price increase based on the weighted average of WPI and CPI. It has also been
observed that a number of inefficiencies of the coal sector are being passed on to the power sector.
There is significant grade slippage (exceeding 600 Kcal/kg in many cases), the cost of which is
borne by electricity consumers. As evident from the analysis, every 100 Kcal/ kg saving in GCV
loss would translate into energy charges saving of approximately 5 paise per unit. Hence, it is
recommended that the coal sector be brought under an independent regulator at the earliest.
Regulation of coal sector is required to stem inefficiency and improve performance so that
consumers (of coal) including the power sector, benefit.
Coupled with this, is the need for the electricity regulators to monitor and suitably regulate Station
Heat Rate (SHR) and GCV of coal based power plants. These two factors, if regulated properly,
can reduce energy charge significantly. GCV should not be allowed on “as fired” basis as is still
being done by several States. Rather, it should be based on “as received” basis or “as billed” plus
margin of errors (due to transportation and other losses) as payment is made to the coal companies
on the basis of billed GCV. Third party assessment/measurement of GCV is important. There is an

12 | P a g e
urgent need for evolving a proper sampling and measurement mechanism to control the grade
slippage and GCV losses. CERC should empanel a list of independent technically qualified
agencies/labs for this purpose.
As per the fuel supply agreement (FSA) between the coal supplier and the generators, the coal
supplier does not provide any compensation for surface moisture of coal upto 7% in dry season
and 9% in wet season. Full compensation should be provided for the surface moisture as it has no
heat value
Thus, Ministry of Power and Ministry of Coal need to find out a solution to the issue of grade
slippage and losses due to moisture content. Coal pricing needs to be regulated as in other sectors,
since it is virtually a monopoly.
3.1.2. Railway freight
Another considerably significant portion of the PPC is contributed by railway freight. There has
been an increase of 40% in the railway freight charges in the past 4 years The increase in freight
charges has been unbridled and significantly higher than what WPI/CPI could justify. It is
suggested that the RoE for railways be regulated. Railways should also be brought under an
independent regulatory body as they enjoy monopoly position. The Central Government may also
consider subsidizing railway freight for a distance beyond 750 kms.
3.1.3. Clean Energy Cess
Clean energy cess has increased from Rs. 50/- per ton in June 2010 to Rs. 400/- per ton at present,
thereby impacting retail tariff.
The total impact of Clean Energy cess since FY 2010-11 based on the coal consumption each year
for the power sector is shown in the table below:
S. No. Year Coal Consumption for the Power
Sector (Million metric tonne)
Clean Energy Cess (Rs Crore)
1 2010-11 396 990
2 2011-12 438 2,188
3 2012-13 485 2,427

13 | P a g e
S. No. Year Coal Consumption for the Power Sector (Million metric tonne)
Clean Energy Cess (Rs Crore)
4 2013-14 493 2,466
5 2014-15 498 3,733
6 2015-16 518 9,492
7 2016-17 535 19,618
8 2017-18 608 24,320
9 2018-19 629 25,144
10 2019-20 622 24,883 Source(Coal Consumption): MOSPI(Energy Statistics,2019)
With the increasing investment in renewables, the rationale for continuation of this cess needs
review. If it is to be continued then it is recommended that the proceeds from this cess be
ploughed back to the electricity sector to mitigate the incremental cost on account of new
environmental norms as per contribution made by each State.
3.1.4. New Environmental Norms
With the implementation of new environmental norms, the cost per unit of energy is going to
increase substantially. This increase in cost should be compensated from the clean energy cess
which has been collected from the consumers of the electricity sector. This cess should be used to
reduce retail tariff impact as a result of FGD installation in the thermal plants.
3.1.5. New Norms for disposal and transportation of fly ash
As per the draft notification dated 22nd April, 2021, issued by the Ministry of Environment, Forest
and Climate Change, the cost of transportation of fly ash is to be borne by the thermal power
plants (TPPs), which will have substantial impact on cost of generation on thermal power plants.
Assuming an average generation of 250 gm/kwh and ash transportation cost of Rs 2-3/MT/300km,
the total impact on cost of generation works out to be around 15-23 paise/ unit for 300 km of ash
transportation. As this will have substantial impact on cost of generation and hence on consumer
tariff, it is recommended that the cost of transportation of fly ash be partially borne by the Central/
State Government.

14 | P a g e
3.2. Internal Factors
3.2.1. High transmission costs
There has been huge investment in inter-state transmission but utilization of the assets has not
been commensurate with the investment. Reliability of supply and market access have definitely
increased due to construction of transmission systems but the disconnect in planning is obvious.
Owing to the under-utilisation of transmission assets, a high cost is being paid by the consumers.
The retail electricity consumers should not be burdened with the monetary implications arising
due to forecasts of transmission planners, especially when the forecasts have not been fully
achieved resulting in low or partial use of the system. It is recommended that in future,
transmission planning should be based on accurate demand forecasts by discoms and STUs.
The Central Government should share the cost of the stranded assets, by utilising the clean energy
cess. As the cess is being collected from power sector, it should be used to provide relief to the
sector.
As per the Tariff Policy, tariff of all new transmission projects, including state owned projects,
should be determined on the basis of a competitive bidding process for projects, costing above a
threshold limit which shall be decided by the SERCs. Some SERCs (like Punjab and Bihar) have
defined threshold limit for this purpose. It is recommended that all SERCs should decide a
normative threshold above which projects be selected through tariff based competitive bidding.
It is also suggested that FOR may also have a special meeting on this issue to work out a solution.
3.2.2. Generation assets are also stranded. Old gas plants are too expensive and fixed costs
are being paid without any utilization.
As in the case of transmission assets, the fixed cost of stranded generation assets is being paid for
by the consumers without getting any benefit. The stranded costs (in respect of 12 States studied),
due to under-utilisation of generation assets have been provided at the table below
S No. State Year Surplus Energy
(MU)
Fixed Cost for Surplus
Energy (Rs Crore)
1 Odisha FY 2020-21 5,941 348
2 Uttarakhand FY 2020-21 (536) NIL
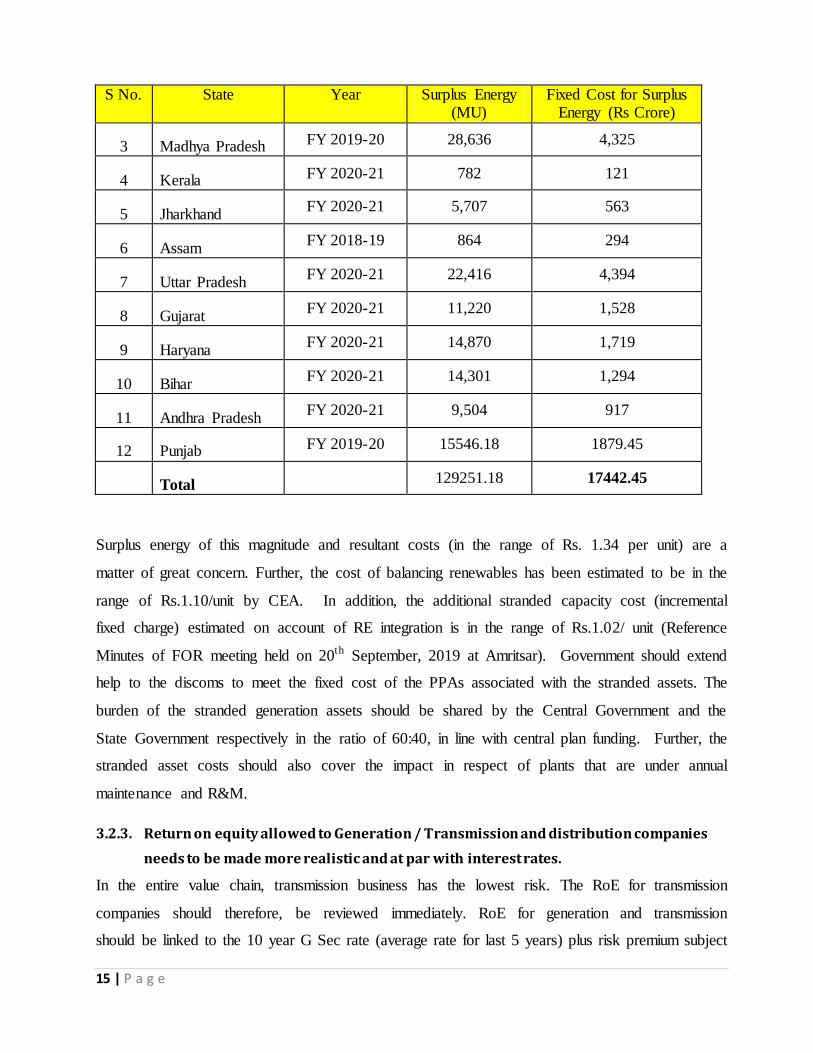
15 | P a g e
S No. State Year Surplus Energy (MU)
Fixed Cost for Surplus Energy (Rs Crore)
3 Madhya Pradesh FY 2019-20 28,636 4,325
4 Kerala FY 2020-21 782 121
5 Jharkhand FY 2020-21 5,707 563
6 Assam FY 2018-19 864 294
7 Uttar Pradesh FY 2020-21 22,416 4,394
8 Gujarat FY 2020-21 11,220 1,528
9 Haryana FY 2020-21 14,870 1,719
10 Bihar FY 2020-21 14,301 1,294
11 Andhra Pradesh FY 2020-21 9,504 917
12 Punjab FY 2019-20 15546.18 1879.45
Total 129251.18 17442.45
Surplus energy of this magnitude and resultant costs (in the range of Rs. 1.34 per unit) are a
matter of great concern. Further, the cost of balancing renewables has been estimated to be in the
range of Rs.1.10/unit by CEA. In addition, the additional stranded capacity cost (incremental
fixed charge) estimated on account of RE integration is in the range of Rs.1.02/ unit (Reference
Minutes of FOR meeting held on 20th September, 2019 at Amritsar). Government should extend
help to the discoms to meet the fixed cost of the PPAs associated with the stranded assets. The
burden of the stranded generation assets should be shared by the Central Government and the
State Government respectively in the ratio of 60:40, in line with central plan funding. Further, the
stranded asset costs should also cover the impact in respect of plants that are under annual
maintenance and R&M.
3.2.3. Return on equity allowed to Generation / Transmission and distribution companies
needs to be made more realistic and at par with interest rates.
In the entire value chain, transmission business has the lowest risk. The RoE for transmission
companies should therefore, be reviewed immediately. RoE for generation and transmission
should be linked to the 10 year G Sec rate (average rate for last 5 years) plus risk premium subject

16 | P a g e
to a cap as may be decided by Appropriate Commission. For a discom, the RoE could be fixed
based on the risk premium assessed by the State Commission . Income tax reimbursement should
be limited to the RoE component only.
Performance of Distribution licensees has a significant impact on retail tariff for the consumers.
Therefore there is a need to link recovery of RoE with the performance of the utilities, based on
indicators such as supply availability, network availability, AT&C loss reduction.
3.2.4. Impact of depreciation on tariff
Depreciation rate should be rationalized and the period of depreciation should be extended.
Depreciation period could be extended to 15 years from 12 years and the rate could be 4.3% based
on straight line method for the first 15 years and the remaining depreciation to be recovered
during the balance useful life. Accumulated depreciation, over and above debt repayment, should
be used to reduce the equity base for RoE.
3.2.5. Growing share of Renewable Energy
Although green power is available at ₹ 2.5/unit or less now, the costs of transmission and
balancing cost are eating into the benefits it could have brought. Initially, the renewable power
policy laid emphasis on distributed generation which could have avoided transmission asset
creation. However, the current focus seems to have shifted to large scale renewable projects. In
the large RE segment, hybrid renewable (combination of wind and solar), round the clock (RTC)
schedulable power and renewable with energy storage should be encouraged, which could lead to
better utilization of transmission assets. Apart from large scale renewable projects, focus in future
should also be on distributed generation that would minimize transmission infrastructure and
would help reduce the cost.
17 | P a g e
3.2.6. Right Energy mix and right mix of long term, medium term and short term PPAs – Best
practices
DISCOMs willing to exit from PPAs of old plants that have outlived their life or are very costly
should not be tied to BPSA. Furthermore, 25 years life of PPAs for new projects contracted
through competitive bidding is too long and shorter duration PPAs with exit clause should be
promoted. It should also be ensured that the exit clause is not very stringent.
3.2.7. Cost optimisation through greater use of market – Best practices
There is a lot of scope for reduction of power purchase cost if Merit order dispatch (MoD) is
followed strictly and power market and other platforms are used for optimisation of power
procurement. This exercise needs to be followed by all States by making a comparison of their
own generation variable cost with the likely power exchange price and procuring power from the
exchange if the latter is lower. Some of the best practices in this context have been provided at
Annexure-VI. Also, the Security Constrained Economic Despatch (SCED) framework which
has yielded substantial savings at the national level, should be adopted in States, provided it brings
benefit to the consumers in terms of overall tariff.
SLDCs should be given independent status and it should be their responsibility to ensure merit
order dispatch of electricity on day ahead and real time basis. Merit order must be prepared by
SLDC every month based on the actual fuel prices of the last month.
3.2.8. Trading Margin be curtailed
Trading margin, as stipulated by CERC, can be made more equitable. Although the current
average trading margin lies within approximately 3-4 paise/unit, the ceiling of 7 paise/unit
provided by CERC, along with the “as per mutually negotiated” clause is being misused by public
sector traders. CERC should look into the matter and cap the same at 2 paise/unit. Similar cap can
be specified by SERCs and discoms should be directed to adhere to this cap while giving consent
to bids for procurement through any trader.
18 | P a g e
3.2.9. Waiver of water usage charges for Hydro Projects
The matter of waiver of water usage charges for hydro projects may be taken up by the FOR and
MoP.
3.2.10. Distribution level efficiency in operation
There is a significant scope of reducing AT&C losses by better reactive power management as has
been adopted in Tamil Nadu. Further, the SERCs should provide for long term trajectory for loss
reduction and ensure that the trajectory is adhered to by the Discoms strictly. AT&C loss
reduction has the potential of reducing the retail tariff significantly.
A common regulation also needs to be brought in to curtail the losses of DISCOMs. Losses above
the prescribed should not be allowed and the gains accruing from over achievement of loss
reduction targets should be shared with the consumers. In Odisha, for instance a 10-year loss
reduction trajectory has been fixed by the regulator as part of the privatisation strategy.
3.2.11. Other suggestions
All future generation projects, except hydro power projects and nuclear power projects should be
set up only through competitive bidding.
The norms for O&M Expenses should be made more stringent by CERC. The norms of interest
on working capital should also be reviewed by CERC keeping in view the current realities of
decreasing level of PLF resulting in reduced fuel stock requirement, etc.
19 | P a g e
4. Summary of Recommendations
The recommendations, as suggested by the WG, to address the issues related to retail tariff of
electricity have been summarised below:
4.1. External Factors
4.1.1. Coal
Coal sector be brought under an independent regulator at the earliest.
Electricity regulators should monitor and suitably regulate SHR and GCV of coal
based power plants.
GCV should not be allowed on “as fired” basis. Rather, it should be based on “as
received” basis or “as billed” plus margin of errors (due to transportation and other
losses). Third party assessment/measurement of GCV is important. CERC should
empanel a list of independent technically qualified agencies/ labs for this purpose.
There is an urgent need for evolving a proper sampling and measurement mechanism
to control the grade slippage and GCV losses.
Full compensation should be provided by the coal company for surface moisture in
coal as it has no heat value. Ministry of Power and Ministry of Coal need to find out a
solution to the issue of grade slippage and losses due to moisture content.
4.1.2. Railway freight
Railways should be brought under an independent regulatory body as they enjoy
monopoly position and are still unregulated at present.
RoE for railways should be regulated.
Central Government may consider subsidizing railway freight for coal for a
distance beyond 750 kms
20 | P a g e
4.1.3. Clean Energy Cess
With due regard to the increasing investment in renewable, the rationale for
continuation of this cess needs review. There is a strong case for reduction in clean
energy cess.
Proceeds from this cess be ploughed back to the electricity sector to mitigate
incremental cost on account of new environmental norms as per contribution made
by each State.
4.1.4. New Environmental Norms
With the implementation of new environmental norms, the cost per unit of energy
is certainly going to increase. This increase in cost should be compensated from the
clean energy cess.
The energy cess should be used to reduce retail tariff impact as a result of FGD
installation in the thermal plants.
4.1.5. New Norms for disposal and transportation of fly ash
Proposed norms for disposal and transportation of fly ash will have substantial
impact on cost of generation and hence on consumers tariff. It is recommended that
the cost of transportation of fly ash be partially borne by the Central/ State
Government.
4.2. Internal Factors
4.2.1. High transmission costs
It is recommended that in future, transmission planning should be based on
accurate demand forecasts by discoms and STUs.
The retail electricity consumers should be compensated for the monetary
implications arising due to under-utilisation of transmission assets.
The Central Government should share the cost of the stranded transmission assets
by utilising the clean energy cess.

21 | P a g e
Tariff policy provides that tariff of all new transmission projects including state
owned projects, costing above a normative threshold limit which shall be decided
by the ERCs, should be determined on the basis of a competitive bidding process.
All SERCs should decide threshold limit (say, 100 Crore or so) above which
projects be selected through tariff based competitive bidding.
4.2.2. Generation assets are also stranded. Old gas plants are too expensive now and fixed
costs are being paid without any utilization.
Government should extend help to discoms to meet the fixed cost of the PPAs
associated with the stranded assets.
The burden of the stranded generation assets should be shared by the Central
Government and the State Government respectively in the ratio of 60:40, in line
with central plan funding.
Further, the stranded asset costs should also cover the impact in respect of plants
that are under annual maintenance and R&M.
4.2.3. Return on equity allowed to Generation/ Transmission and distribution companies
needs to be made more realistic and at par with interest rates.
RoE for generation and transmission should be linked to the 10 year G Sec rate
(average rate for the previous 5 years) plus risk premium subject to a cap as may
be decided by appropriate Commission.
For a discom, the RoE could be fixed based on the risk premium assessed by the
State Commission. Income tax reimbursement should be limited to the RoE
component only.
Performance of Distribution licensees has a significant impact on retail tariff for
the consumers. Therefore, there is a need to link recovery of RoE with the
performance of the utilities, based on the indicators such as supply availability,
network availability, AT&C loss reduction .
22 | P a g e
4.2.4. Impact of depreciation on tariff
Depreciation rate should be rationalized and the period of initial higher
depreciation rate be extended to 15 years from 12 years.
The rate of depreciation should be 4.3% for the first 15 years based on straight line
method, instead of around 5.28% for the first 12 years and the remaining
depreciation should be recovered during the balance useful life.
Accumulated depreciation, over and above debt repayment, should be used to
reduce the equity base for RoE after debt repayment is over.
4.2.5. Growing Share of Renewable Energy
In the large RE segment, hybrid renewable (combination of wind and solar) and
renewable with energy storage should be encouraged, which could lead to better
utilization of transmission assets.
Apart from large scale renewable projects, the focus, in future, should be on
distributed generation (preferably in agriculture segment) that would minimize the
requirement for transmission infrastructure and would help reduce the cost.
The expenditure to meet statutory requirements (for instance, costs towards
meeting environmental norms) should not be passed on completely to the
consumers. Instead, the clean energy cess should be utilized to meet these
requirements.
4.2.6. Right Energy mix and right mix of long term, medium term and short term PPAs – Best
practices
DISCOMs willing to exit from PPAs of old plants, that have outlived their life or
are very costly, should not be tied to BPSA.
25 years life of PPAs for new projects contracted through competitive bidding is
too long and shorter duration PPAs with exit clause should be promoted. It should
also be ensured that the exit clause is not very stringent.
23 | P a g e
4.2.7. Cost optimisation through greater use of market – Best practices
There is a lot of scope for reduction of power purchase cost if Merit order dispatch
(MoD) is followed strictly and power market and other platforms are used for
optimisation of power procurement. This exercise needs to be followed by all the
States.
The Security Constrained Economic Despatch (SCED) framework should be
adopted in States for cost optimization, provided it brings benefit to the consumers
in terms of overall tariff.
SLDCs should be given independent status. It should be their responsibility to
ensure merit order dispatch of electricity on day ahead and real time basis. Merit
order must be prepared by SLDC every month based on the actual fuel prices of
last month.
4.2.8. Trading Margin be curtailed
Trading margin, as stipulated by CERC, can be made more equitable. It should be
capped at 2 paise per unit.
Similar cap can be specified by SERCs and discoms should be directed to adhere to
this cap while giving consent to bids for procurement through any trader.
4.2.9. Waiver of water usage charges for Hydro Projects
The matter of waiver of water usage charges may be taken up by the FOR and MoP
with the respective State Governments.
4.2.10. Distribution level efficiency in operation
There is a significant scope of reducing AT&C losses by better reactive power
management as has been adopted in Tamil Nadu.
SERCs should specify long term trajectory for loss reduction and ensure that the
trajectory is adhered to by the Discoms strictly.
24 | P a g e
A common regulation needs to be brought in to curtail the losses of DISCOMs.
Losses above a pre-specified limit should not be allowed, and the gains accruing
from over achievement of loss reduction targets should be shared with the
consumers.
4.2.11. Other suggestions
All future generation projects, except hydro power projects and nuclear power
projects should be set up through competitive bidding.
The norms for O&M Expenses should be made more stringent by CERC.
The norms of interest on working capital should also be reviewed by CERC
keeping in view the current realities of decreasing level of PLF resulting in reduced
fuel stock requirement, etc.

FORUM OF REGULATORS (FOR)
C/o. CENTRAL ELECTRICITY REGULATORY COMMISSION (CERC)
3rd & 4th Floor, Chandralok Building, 36, Janpath, New Delhi 110 001
☎: 011-23353503/23752958
Ref : RA-11018(11)/2/2020-CERC Date : 27
th October 2020
Subject: Constitution of FOR Working Group on “Analysis of factors impacting
Retail Tariff and Measures to address them”.
The Forum of Regulators, in its Special Meeting held on 16.10.2020 deliberated on various
factors leading to high cost of power, several of which are beyond the control of the electricity
regulators and felt the need to analyse and evolve measures towards reduction or at least
containment of retail tariff. The Forum also decided to form a working group to look into the
issues raised during the meeting (relevant extracts from the minutes of meeting enclosed for
reference).
2. Accordingly, the Working Group has been constituted by the competent authority with the
following the composition:-
Chairperson, Punjab State Electricity Regulatory Commission – Chairperson
Chairperson, Gujarat Electricity Regulatory Commission – Member
Chairperson, West Bengal Regulatory Commission – Member
Chairperson, Odisha Regulatory Commission – Member
Chairperson, Tamil Nadu Regulatory Commission – Member
Chairperson, Joint Electricity Regulatory Commission (Goa &UTs) – Member
Chief, (Regulatory Affairs), Central Electricity Regulatory Commission – Convenor
The Secretariat of the Forum of Regulators would provide secretariat services to this
Working Group.
3. The Terms of Reference of the Working Group are as under: -
a. Analysis of various components of power purchase cost and their impact on retail tariff.
b. Analysis of external factors (external to electricity sector) and internal factors (across the
value chain of generation, transmission and distribution) impacting retail tariff.
c. Suggest measures for addressing the issues arising out of the analysis from (a) & (b)
above.
d. Any other matter related and incidental to the above.
Cont…..
-2-
4. The Working Group may co-opt Chairperson/ Member of any other SERC and/or any other
expert(s) as deemed fit. The Working Group may also avail the services of a consultant/
consulting-firm/ research organisation in the process of examining the issues related to the subject
matter.
5. The Working Group may submit the report within one month, for consideration of the
Forum.
Encl: a/a
Sd/-
(Sanoj Kumar Jha) Secretary
Copy to:
Members of the Working Group
Copy for information to:
a. Sr Executive to Chairperson, CERC / FOR
b. Sr. PPS to Secretary, CERC c. PS to Chief (RA), CERC

MINUTES OF THE SPECIAL MEETING OF THE
FORUM OF REGULATORS (FOR)
(Through Video Conferencing)
Day/Date: Friday, 16th October, 2020
The meeting was chaired by Shri P.K.Pujari, Chairperson, Central Electricity
Regulatory Commission (CERC) and Forum of Regulators (FOR). He welcomed all
the members of the Forum to the Special Meeting convened at a short notice. The
list of participants is at Appendix - I.
Chairperson, CERC apprised the Forum that the special meeting has been
convened at a short notice at the request of the FOR members so as to discuss
issues relating to impact of various factors on retail tariff and measures to address
them and reduce the retail tariff.
Thereafter, the Forum took up the agenda items for consideration.
AGENDA ITEM NO.1: CONFIRMATION OF MINUTES OF 73rd MEETING OF
FORUM OF REGULATORS
The Forum considered and endorsed the minutes of the 73rd Meeting of FOR
which was held on 21st & 29th September, 2020.
AGENDA ITEM NO.2: PROPOSAL TO FORM A SUB-GROUP IN THE FOR TO
SUGGEST MEASURES FOR REDUCING RETAIL TARIFF
A reference was received from Chairperson, WBERC to discuss the issues
relating to factors impacting the retail electricity tariffs and with a request to form a
sub-group in FOR to analyse the same and make suitable recommendations. The
said reference highlighted various factors leading to high cost of power, several of
which are beyond the control of the electricity regulators. There is, therefore, a need
to analyse and evolve measures towards reduction or at least containment of retail
tariff. WBERC Chairperson added that the Hon'ble Minister of Power, during his
interaction with a group of select State electricity regulators a few days back, had
touched upon the issues concerning the retail tariff and regulatory process related
thereto. And hence, he deemed it fit to bring the same to the knowledge of the FOR,
so that FOR can take a view on the matter.
The following transpired during discussion on the reference from WBERC.
Power purchase cost constitutes 70% of the retail tariff, and in turn is
dependent on cost of coal, taxation and railway freight. Quality of coal, grade
slippages, increasing railway freight are major concerns, more so in view of
monopoly position of the concerned entities and absence of independent regulators
for these sectors, namely coal and railways. The cost of inefficiencies of these
sectors gets passed on to the Discoms and ultimately is borne by the electricity
consumers. These cost of inefficiencies is beyond the regulatory jurisdiction of the
electricity regulators.
The current fuel supply agreements and rail transport agreements are
totally one sided. There is a need to rewrite these contracts on commercial
principles. The Ministry of Power is required to take this issue up with Ministry of
Coal and Ministry of Railways.
Factors like high transmission charges, higher ROE, front loaded
depreciation are also contributing to increase in retail tariffs for consumers, which
need to be relooked.
Stranded assets and lower PLF, especially as a result of increasing
renewable, are resulting in fixed cost liability for the distribution companies.
There is a need to address the governance structure of the distribution
utilities.
Compliance of new environmental norms will cause severe strain on
the finances of the Discoms. Ministry of Power may consider subsidising the FGD
projects from the clean energy cess.
There is a need to evolve a framework for retiring old plants.
Discoms need to work out the right energy mix, right approach for
power procurement on long term basis and cost optimisation through greater use of
market.
Chairperson , FOR/ CERC suggested that considering the various issues
raised by Forum Members, a Working Group may be constituted to look into all such
issues. After discussion, it was decided to form the Working Group with Chairperson
of PSERC as Chair and Chairpersons of ERCs of West Bengal, Odisha, Gujarat,
Tamil Nadu and JERC (Goa & UTs) as memebers. The Group may be assisted by
FOR Secretariat and other experts as may be co-opted by the Group.
CONCLUSION:
At the end of the meeting, Secretary, FOR/CERC thanked everyone for
participation and the officials and staff of the FOR Secretariat for their efforts in
organizing the virtual meeting.
The meeting ended with a vote of thanks to the Chair.
******

1
MINUTES OF THE 1stMEETINGOF THE
FOR WORKING GROUP ON “ANALYSIS OF FACTORS IMPACTING RETAIL
TARIFF AND MEASURES TO ADDRESS THEM”
(Through Video Conferencing)
Day / Date : Monday, 2nd November, 2020
List of Participants : At Appendix -I (Enclosed)
Chairperson, Punjab Electricity Regulatory Commission (PSERC) and the
Chairperson of the Working Group welcomed members to the first meeting which was being
held on virtual mode. She proposed that Smt Anjuli Chandra, Member PSERC who has the
background of having worked in CEA may be co-opted as member of the Working Group.
This was endorsed by the members of the Group.
Chief (RA), CERC and convenor of the Working Group, apprised the members about
the mandate of the Working Group, which included analysing various components of power
purchase cost and their impact on retailtariff; analysis of external factors (external to
electricity sector) and internal factors (across the value chain of generation, transmission and
distribution) impacting retail tariff and suggest measures for addressing the issues arising out
such analysis. He also informed the members about the ongoing studies on related subject
being conducted by consultants for the Forum of Regulators under the PSR program between
Government of India and Government of UK. He further added that as the mandate of the
Working Group involved detailed data analysis and simulations, there might be a need for
seeking assistance from some agencies/consultants. He added that currently, M/s KPMG, M/s
ABPS and CER IITK are offering their support under the PSR program (being funded by
DFID).
A presentation on ” Study on Analysis of Histrorical Trend of Electricity Tariffs for
Uttarakhand and Madhya Pradesh” (Annexure-I) was arranged in this context.
Representatives of M/s ABPS made the presentationa and briefed the Working Group about
change in average cost of supply (ACoS) over the years and various internal and external
factors contributing to change in ACoS.

2
Chairperson, GERC observed that primarily, external factors contribute to change in
ACoS and about 70%- 80% of variation / increase in cost is due to price of coal, freight and
cess. Chairperson, OERC raised the issues relating to GCV and moisture content in coal and
their impact on electricity consumers. Chairperson, TNERC stated that there is huge grade
slippage in coal supply and that the actual GCV is not as per the invoice and this issue needs
to be addressed.
Member, PSERC stated that State-wise comparison of O&M Charges and PGCIL
Charges should be made. Chairperson, OERC raised the issue of high transmission charges
and emphasized the need for regulatory consent from the concerned Commission before
creation of inter-State transmission assets. Chairperson, PSERC stated that trading margin of
7 paisa per unit charged by CPSUs such as NTPC and SECI is not justified and proposed to
address the same in the recommendation of the Working Group. Chairperson, GERC
suggested that overall incentives for generation, transmission and distribution need be re-
looked. Chairperson, PSERC brought to the notice of the Working Group that all hydro
power plants are currently giving 12% - 13% free power to the home State. Similarly, J&K
has also been levying water charges since 1971. She requested the Working Group to
examine these issues.
Chairperson, OERC stated that technical loss is a major factor and suggested that
there should be a study to find out various methods to reduce technical losses. Chairperson
TNERC referred to his suggestions about capacitor bank as a low cost solution to reduce
losses and requested that this aspect must be included in the recommendations of the Group.
He had shared a presentation in this regard (Annexure-II). Chairperson, JERC (Goa& UTs)
suggested that the Working Group may also identify the external and internal factors for data
analysis and recommend methods for cost reduction.
Decision:
Based on the discussion, the following were agreed:
Smt Anjuli Chandra, Member PSERC who has the background of having worked in
CEA be co-opted as member of the Working Group.

3
The following issues were identified for detailed examination:
A. Since power purchase costs accounts for between 70-80% of the ARR/retail tariff, the
factors affecting this segment needs to be looked at
a) Coal - Its cost is unregulated being a monopoly item - Its quality is not the best and grade slippages are not accounted for properly
inspite of third party interventions - Linkages are not the most economically rationalised - Costs are increased and add ons (evacuation charges etc) are one sided
b) Railway freight – Not regulated and a monopoly
- Transit losses are one sided determination c) Taxes d) Details of current fuel supply agreements and railway transport agreements need to be
looked at e) High transmission costs
– POC - Stranded transmission assets - Reg Committees have encouraged expansion of transmission assets without
the knowledge or approval of SERCs f) Generation assets also stranded. Old gas plants are too expensive now and fixed costs
are being paid without any requirement g) Return on equity allowed to Generation / Transmission and distribution companies
needs to be made more realistic and at par with interest rates. Statewise RoE to be studies and a reasonable rate be suggested
h) Impact of depreciation on tariff i) Underutilisation of assets
– Reasons (different in different States) - Lower PLF - Non-availability of fuel (gas) - Quantification and suggestions for future
j) Growing share of Renewable energy - Stranding of assets - More expensive - Effect on Discom’s liabilities - Quantification
k) Incentives both for generation and transmission needs to be looked at. In a surplus situation, these are not required
l) Right Energy mix and right mix of long term, medium term and short term PPAs – Best practices
m) Cost optimisation through greater use of market – Best practices n) New environmental norms
- Impact on tariff - Recommendations in CES Study
o) Trading margins be curtailed
4
p) Free power to Hydro States and water charges
B. Internal factors - AT&C losses - Reactive power management
The services of the consultants assisting CERC/FOR under the PSR program be solicited
to conduct a sensitivity analysis of each of the factors identified and for data analysis and
simulation of the same after due approval of Chairperson, FOR/CERC.
Chairperson, PSERC also suggested that the timeline for submission of report by the
Working Group be extended considering the necessity of collection of data and its
analysis and simulations. This was unanimously endorsed and FOR Secretariat was
advised to take suitable action in this regard with the approval of Chairperson FOR.
The meeting concluded with vote of thanks to the Chair.
******

5
/ APPENDIX – I /
LIST OF PARTICIPANTS WHO ATTENDED THE 1ST MEETING
OF
FOR WORKING GROUP ON “ANALYSIS OF FACTORS IMPACTING RETAIL
TARIFF AND MEASURES TO ADDRESS THEM”
HELD ON MONDAY, THE 2ND NOVEMBER, 2020.
S. No.
NAME ERC
01. Ms. Kusumjit Sidhu Chairperson
PSERC
02. Shri Anand Kumar Chairperson
GERC
03. Shri M.K. Goel Chairperson
JERC (State of Goa & UTs)
04. Shri U.N. Behera Chairperson
OERC
05. Shri M. Chandrasekar Chairperson
TNERC
06. Shri Sutirtha Bhattacharya Chairperson
WBERC
07. Ms.Anjuli Chandra Member
PSERC
08. Dr. Sushanta K. Chatterjee Chief (RA)
CERC
09. Ms. Rashmi Somasekharan Nair Dy. Chief (RA)
CERC
10. Shri Arun Kumar Assistant Secretary
FOR
11. Shri Manvendra Pratap Research Officer
CERC
SPECIAL INVITEES
12. Shri Suresh Gehani, Director ABPS Infrastructure Advisory
Private Limited 13 Shri Nitesh Tyagi ABPS Infrastructure Advisory
Private Limited 14 Shri Tarun Aggarwal ABPS Infrastructure Advisory
Private Limited *****
1
Minutes of the 2nd
Meeting of the FOR Working Group on “Analysis of Factors
Impacting Retail Tariff and Measures to Address Them”
(Through Video Conferencing)
Day / Date: Monday, 7th
December, 2020
Chairperson, PSERC and Chairperson of the Working Group welcomed all members to the
second meeting and requested Chief (RA), CERC and Convenor of the meeting to briefly
update the Working Group on the deliberations in the previous meeting. List of participants is
placed at Appendix -I (Enclosed).
Chief (RA), CERC informed the Working Group that the observations made by Chairperson,
WBERC in the previous meeting regarding the trading margin were inadvertently missed out
in the minutes and could be incoporated in the minutes of this meeting. WBERC Chair
reiterated that trading margin is in the domain of CERC and that CERC should consider
fixing trading margin for long-term trade as well. The Working Group was also informed
that the request of the Group for extension of time for submission of report and of technical
assistance of consultants (consortium of KPMG, ABPS and CER/IITK) under the PSR
program, was endorsed by the Chairperson of FOR.
Thereafter, representatives of M/s KPMG and M/s ABPS presented the ”Study on Analysis of
Key Factors Impacting Electricity Tariffs” (Annexure-I) for select 12 States (copy enclosed).
The presentation covered a detailed analysis on the impact of various components of
average cost of supply (ACoS), including power purchase cost, transmission charges, fixed
cost elements, coal prices, railway transport costs, transmission charges, RoE, competitive
bidding in generation projects, benchmarking capital costs of FGD, capital cost,
underutilisation of gencos, old thermal power plants, interest and finance charges, O&M
charges, etc on the tariff.
1. TRANSMISSION COSTS:
Chairperson, OERC observed that the per unit power purchase cost excluding transmission
charges has increased over the last three years. Chairperson, OERC and Chairperson GERC
remarked that the analysis reveals FY 2016-17 as an exceptional year and suggested that
2
either it can be excluded from the study or the three years previous to 2016-17 could be
included for analysis purpose. Chairperson, PSERC observed that some States have very low
transmission charges as compared to others and it needs to be cross checked whether the
tables including both CTU and STU charges uniformly. She further suggested that as the
study is for the ACoS of the Discoms, only intra-State transmission charges should be
considered while inter-State charges could ideally be included in the power purchase cost.
Chairperson, OERC added that for the State of Odisha, transmission charges as shown in the
presentation seem to be only the STU charges and that the CTU charges might have been
included in power purchase cost.
Chief (RA), CERC stated that transmission charges have been segregated both for CTU and
STU and the power purchase cost for the purpose of this study is the energy cost at bus bar of
the generating stations. On the issue of transmission charges, Chairperson, OERC suggested
to separately present STU charges for the States and energy handled by STU and total CTU
charges and energy handled by CTU . Chairperson, WBERC added that the STU revenue
curve of the State is almost flat but the CTU revenue curve is increasing very steeply. This
has an implication on the energy charge and hence needs to be analysed in detail.
Coordinator (CER), IITK stated that there is a regulatory backlog. He informed that the net
profit margin of PGCIL is in the range of 28% to 29% and for NTPC the same is in the range
of 10% to13% over the last five years. When it comes to competitive bidding PGCIL is
quoting @ 50% of its own regulated costs .
The consultants stated that planning for creation of transmission and generation infrastructure
is done to meet anticipated future demand growth . However, if the corresponding growth in
demand and generation does not happen, the impact on account of such sunk costs increases.
Chief (RA) , CERC added that there was no denying the fact that there has been significant
investment on inter-state transmission during the last decade. However, it might not be fair to
compare the cost of transmission on per unit basis. If the assets are created and investment is
made, the resultant costs have to be recovered irrespective of their usage. Partner , KPMG
stated that transmission infrastructure is created in the country as a whole and all States get
intangible benefits from it. It is also required for the development of a unified centralised
3
electricity market at the national level. A mention was made of the changes in the CERC
regulations on inter-state transmisssion charges and losses.
Chairperson, OERC stated that energy demand forecast of the discom is the basic data which
is used by the STU and CTU for the creation of transmission infrastructure. He informed that
for the State of Odisha, STU charges have been in the range of Re. 0.25 per unit for the last
six years, CTU charges have grown at a CAGR of 17.2%. Thus, there appears to be some gap
in forecasting and planning which needs to be looked into as this has huge implication for the
States as far as tariff is concerned.
Member, PSERC stated that there is a difference in approach to investment decision for inter-
state and intra-state transmission projects. Partial loading of green energy corridor may be
one of the reasons for high transmission cost.
Partner, KPMG stated that the nature of infrastructure at CTU and STU is quite different as
both have different objectives. Generally all infrastructure projects are built after due process
and planning criteria. Transmission infrastructure is planned and built in advance and some
temporary gaps in utilisation can happen. For example, there was a delay in construction of
North-Eastern hydro projects while the transmission network came up before hand. Thus,
comparing the inter State power flows including from hydro and RE with the State level
flows can lead to fallacious conclusions. As the country has changed to a single frequency,
and costs are indeed high, a clinical analysis needs to be carried to understand whether there
were inefficiencies or other factors impacting costs of inter State transmission works.
Chairperson, JERC (Goa &UT) stated that the cost of infrastructure should be borne by the
participants and participating States. He added that unless the infrastructure exists, power
cannot flow. Transmission investment should be seen with a holistic perspective. Coordinator
(CER), IITK informed that parameters for generation plants have been constant for the past
10 years and suggested that competitive bidding process for the development of transmission
and generation assets at the national and State level will help to bring in cost-efficiency and
should be the way forward for future projects.

4
Chairperson WBERC stated that the SERCs need to take call as to how much costs can be
borne, if such transmission costs are equitably distributed. While initially, the postage stamp
method was being followed, the method has now changed and Chairperson, CERC had
assured the FOR members that an equitable system would come into effect and requested all
SERCs to wait till end of January 2021 to assess the impact. He agreed with Coordinator,
CER, IITK that return of more than 15% for transmission is quite high as there is no risk in
the business.
Chairperson, TNERC stated that in future, distributed generation should be opted for. He
informed that Tamil Nadu has an RPO of 9000 MW of which 5000 MW is remaining to be
achieved. He opined that establishment of small-scale solar plants can be encouraged as it
will exclude transmission costs because the same will be connected to feeders and big
transmission lines will not be required. Chairperson, OERC suggested that the STU and CTU
data should be analysed as there may be various reasons causing such variation. Member,
PSERC added that projects which are not awarded on competitive basis are generally allotted
to PGCIL based on their emergency and hence this also needs to be looked into if costs have
to be reduced.
2. COAL
On the issue of coal grade slippage and GCV loss as presented through the Maharashtra case
study, Chairperson, OERC enquired about the methods and procedure followed for
sampling of coal for testing and suggested that the matter being very serious and impacting
the bottom line of the generating company deserves immediate intervention. Chairperson,
WBERC explained that as the nature of coal is different in different mines, there is a
difference in GCV of coal depending on type of mining. He informed that unless the coal is
washed, it will have major calorific differences. He further stated that the methods followed
for testing and sampling are dated and a comprehensive view needs to be taken on how to
frame a regulation which includes recommendation on the method of testing and drawing
samples for testing.
3. O&M CHARGES
On the issue of O&M charges, Chairperson, PSERC suggested that a comparative statement
of the best practices and measures in different States should be prepared.

5
4. ROE
On the issue of RoE, Coordinator, CER, IITK mentioned that as per the CER study
(Annexure-II) using CAPM and multi-factor models and using comprehensive data for over
125 infrastructure companies between 1998-2018, it was estimated that the cost of equity for
the conventional generation sector is in the range of 12.86% to 16.52%, on post-tax basis.
WG. Chairperson, PSERC advised Coordinator, CER to circulate the study so as to discuss
the same during the next meeting
5. STRANDED ASSETS – COSTS
Chairperson, OERC remarked that there were some points which were discussed during the
previous meeting and the same were not covered in the presentation. For instance, costs of
huge stranded generation assets that have an impact on ACoS. He therefore suggested to
include this in the analysis. He added that such costs should be quantified in the tariff and
suggestions should be made. He also underscored the need for rationalisation of transmission
costs.
Chairperson, WBERC informed the group that, in his letter to Chairperson, CERC (which led
to the formation of this working group), he had referred to incremental cost on account of
under-utilisation of assets where the fixed cost is to be borne by the Discoms without getting
commensurate benefit from the assets. He also suggested that this aspect should be analysed
and recommendation be made as to whether the Central and State Govt can share such costs.
The high fixed cost as a result of under-utilisation of assets and high tariff of transmission
network is an outcome of wrong forecast and the consumer should be protected from the
impact of such wrong forecast. He also stated that stranded asset is a major issue and both
Centre and State should insulate the consumer from fixed cost liabilities without getting
energy. Chairperson, OERC suggested that the stranded assets cost may not be reflecting in
the book of accounts of Discom. He stated that In Orissa, the stranded assets cost is reflected
in the books of accounts of GRIDCO only.
Chief (RA), CERC informed that the aspect of cost of stranded assets has been covered with
reference to 12 States covered in the analysis. However, further study will be carried out to
factor in the concerns raised by Chairperson, WBERC and OERC. He also added that a
6
separate working group of FOR has already been formed to address the larger issue of
resource adequacy.
6. OLD COAL BASED PLANTS
On the issue of retirement of old coal-based plants, Partner, KPMG stated that phasing out
such plants can lead to reduction in costs.
The group thanked M/s KPMG, ABPS for the presentation and decided to hold another
meeting to discuss the factors affecting the tariff and suggest measures to reduce the impact
of the same.
The meeting ended with vote of thanks to the Chair.
*****

7
/ APPENDIX – I /
LIST OF PARTICIPANTS OF THE 2nd
MEETING OF
FOR WORKING GROUP ON “ANALYSIS OF FACTORS IMPACTING RETAIL
TARIFF AND MEASURES TO ADDRESS THEM”
MONDAY, THE 7th
DECEMBER, 2020.
S.
No.
NAME ERC
01. Ms. Kusumjit Sidhu
Chairperson
PSERC – In Chair
02. Shri Anand Kumar
Chairperson
GERC
03. Shri M.K. Goel
Chairperson
JERC (State of Goa &
UTs)
04. Shri U.N. Behera
Chairperson
OERC
05. Shri M. Chandrasekar
Chairperson
TNERC
06. Shri Sutirtha Bhattacharya
Chairperson
WBERC
07. Ms.Anjuli Chandra
Member
PSERC
08. Dr. Sushanta K. Chatterjee
Chief (RA)
CERC
09. Ms. Rashmi Somasekharan Nair
Dy. Chief (RA)
CERC
SPECIAL INVITEES
10. Shri Anish De, Partner KPMG India
11. Shri Ramit Malhotra KPMG India
12. Shri Archit Arora KPMG India
13. Shri Suresh Gehani, Director ABPS Infrastructure Advisory
Private Limited
14. Shri Mrinal Navendu ABPS Infrastructure Advisory
Private Limited
15. Shri Tarun Aggarwal ABPS Infrastructure Advisory
Private Limited
16. Shri Anoop Singh,
Coordinator, CER
IIT Kanpur
17. Shri Kewal Singh IIT Kanpur
18. Shri Shreeyash IIT Kanpur
19. Shri Sumit Verma IIT Kanpur
8
20. Shri Rakesh Shukla IIT Kanpur
21 Shri P.P. Kulkarni IIT Kanpur
22 Shri Himanshu Anand IIT Kanpur
23 Shri Sanjeev Tinjan
Asst. Chief (RA)
CERC
24 Shri Ravindra Kadam
Advisor (RE)
CERC
25 Shri Saurabh Derhgaven
Principal Research Officer
CERC
36 Shri Manvendra Pratap
Research Officer
CERC
Key Factors Impacting Study on Analysis of
Electricity Tariffs
11th December 2020
Background and objective 01
02
03
Structure of the discussion
Analysis of select parameters
Contents
04 Conclusion
2

Retail supply tariffs are designed to recover the cost incurred across the entire value chain i.e.
generation, transmission, distribution and retail supply.
It depends on multiple factors such as like cost of generation- fixed costs including O&M expenses, fuel
expense, taxes and duties, etc., cost of transmission- capital and operating costs, Return on Equity
(ROE), network maintenance expenses, etc. and cost of distribution- network development, O&M,
distribution losses, metering, billing & collection expenses, etc.
Hence, it is proposed to conduct a study on “Analysis of key factors impacting electricity tariffs” to
identify measures to reduce retail supply tariffs
Background and objective
The proposed study will:
a) Identify the impact of key external and internal factors on electricity tariff including the likely impact of
recent developments in the sector, and
b) Suggest policy and regulatory measures to reduce electricity tariffs
3

4
Structure of discussion
Transmission
charges
Power purchase
cost
2 3
5
Actual energy
demand vis-à-vis
planned
Inter-state annual
transmission
charges at the
national level over
the last 10 years
Tariff discovered
through competitive
bidding
Distribution
Losses
O&M Expenses
Interest and
finance charges
Compliance of new
environmental norms
Retiring of old power
plants
Maharashtra case
study: MOD
Guidelines
Stranded Capacity
Trading margin
Share of PPC in
approved ACoS
Break up of PPC
Cost and quality
of coal, grade
slippages, railway
freight and taxes
Clean Energy
Cess
Components of Average Cost of Supply (ACoS)
Internal
factors
Other
factors
6
1
Fixed cost
elements
4
Return on Equity
Depreciation costs

Power
purchase cost

Share of PPC in approved
ACoS

7
Power purchase trend
PPC (excluding transmission charges) accounts for ~67% to 78% of the total ACoS for 12 states* over the last 4 years
Source: Tariff orders issued by respective state commissions for the last 5 years
The power purchase costs has reduced marginally over the last 4 years. The share of PPC in approved ACoS has
reduced from 78% to 67%.
*The selected 12 states identified in consultation with the FOR account for 50% of the total consumption in the country
Hypothesis: PPC constitutes major share of ACoS and the share has not increased over the last 4 years
State-wise PPC excluding TC for last 4 years ACoS ABR gap for last 4 years
81.1%
75.3%
72.1%
69.4%
FY 2016-17 FY 2017-18 FY 2018-19 FY 2019-20
Change (in %) in share of PPC in approved ACoS (excluding interest cost) over the last 4 years
4.52
4.34
4.42 4.43
FY 2016-17 FY 2017-18 FY 2018-19 FY 2019-20
Per unit power purchase cost excluding transmission charges (12 states) for the last four years (in Rs./kWh)
78.5%
72.7%
69.8%
67.1%
FY 2016-17 FY 2017-18 FY 2018-19 FY 2019-20
Change (in %) in share of PPC in approved ACoS (12 states) over the last 4 years

12.6% 12.9% 15.6% 14.5%
64.0% 64.1% 63.9%
59.2%
13.2% 12.7% 13.1%
11.7% 2.6%
2.2% 2.6% 2.1% 3.2%
2.4% 2.4% 2.3%
1.4% 1.2% 1.4%
1.2%
3.0% 4.5% 1.0% 9.0%
FY 2016-17 FY 2017-18 FY 2018-19 FY 2019-20
Madhya Pradesh
10.9% 9.0% 8.2% 8.4%
77.0% 77.8% 80.3% 79.0%
12.5% 13.5% 9.7% 11.8% 0.9% 0.9% 1.3% 1.4%
2.6% 3.2% 2.3% 2.2%
2.4% 2.4% 2.3%
2.2%
-6.4% -6.8% -4.1% -5.0%
FY 2016-17 FY 2017-18 FY 2018-19 FY 2019-20
Uttarakhand
Share of cost components (in %) of ARR
Source: Tariff orders issued by respective state commissions for the last 4 years;
Change in share of cost components over the last 4 years
The share of O&M expenses has reduced
marginally over the last 4 years
The share of transmission charges and O&M
expenses has reduced whereas the share of
PPC has increased
The share of PPC and transmission charges has
reduced in last 4 years whereas the share of
O&M expenses and other elements has
increased
O&M Expenses PPC Transmission Charges Return on Equity Net Interest & Finance Charges Depreciation Other elements
10.1% 10.5% 10.6% 11.4%
69.0% 65.2% 64.1% 67.2%
12.4% 11.0% 11.8%
12.5%
0.5% 0.6% 1.0%
0.9% 5.1% 5.2% 5.2%
5.3% 2.0% 2.4% 2.5%
2.8% 0.9% 5.0% 4.8%
0.0%
FY 2016-17 FY 2017-18 FY 2018-19 FY 2019-20
Karnataka
Share of cost components (in %) of ARR
Source: Tariff orders issued by respective state commissions for the last 4 years;
Change in share of cost components over the last 4 years
The share of PPC and transmission charges
has reduced whereas share of O&M has
increased over the last 4 year
The share of PPC has reduced significantly
whereas share of transmission charges, net
interest and finance charges and O&M Expenses
has increased marginally over the years
The share of PPC and transmission charges has
reduced significantly whereas share of interest
and finance charges and O&M expenses has
increased over the years
11.7% 13.0% 16.8% 16.4%
69.2% 67.5% 59.1% 57.4%
13.2% 13.3%
10.7% 10.3% 0.6%
0.6%
1.9% 1.7%
8.7% 9.0%
9.7% 9.1%
0.5% 0.5%
0.5% 0.6%
-3.9% -4.1%
1.3% 4.5%
FY 2016-17 FY 2017-18 FY 2018-19 FY 2019-20
Kerala
6.4% 6.7% 7.6% 7.3%
86.0% 78.5% 75.9% 77.1%
4.9%
5.2% 6.9% 6.7% 1.3%
2.7% 3.3% 3.1%
2.2% 5.5% 3.8% 4.3%
1.8% 3.6% 4.8% 3.5%
-2.6% -2.2% -2.3% -2.0%
FY 2016-17 FY 2017-18 FY 2018-19 FY 2019-20
Jharkhand
16.4% 17.0% 17.2% 20.5%
72.4% 70.7% 70.3% 65.8%
10.0% 11.4% 11.8% 11.5%
0.4% 0.4% 0.4%
0.3% 2.6% 2.1% 2.3%
2.1%
1.8% 1.9% 2.1% 2.2%
-3.5% -3.5% -4.0% -2.3%
FY 2016-17 FY 2017-18 FY 2018-19 FY 2019-20
Odisha
O&M Expenses PPC Transmission Charges Return on Equity Net Interest & Finance Charges Depreciation Other elements

5.7% 6.8% 6.1% 8.3%
89.2%
70.3% 76.8% 71.2%
8.8%
12.0% 12.7%
11.8% 0.4%
4.3% 2.6% 4.4%
1.7% 6.4% 2.5%
5.4%
0.0% 3.5% 1.6% 2.3%
-5.8% -3.3% -2.3% -3.5%
FY 2016-17 FY 2017-18 FY 2018-19 FY 2019-20
Bihar
Share of cost components (in %) of ARR
Source: Tariff orders issued by respective state commissions for the last 4 years;
Change in share of cost components over the last 4 years
The share of PPC has reduced whereas the
share of transmission charges has increased
The share of transmission charges, net interest
and finance charges and O&M expenses has
increased whereas the share of PPC has
reduced significantly in the state
The share of transmission charges has
increased whereas the share of PPC and O&M
expenses have reduced
19.3% 15.6% 18.4% 18.8%
72.5%
57.0% 56.5% 68.3%
13.4%
21.4% 20.3%
16.1%
0.6% 0.5% 0.5%
0.5% 1.6% 1.2% 1.0%
0.4% 0.3%
0.4% 0.5%
0.3%
-7.7%
4.0% 2.8%
-4.4%
FY 2016-17 FY 2017-18 FY 2018-19 FY 2019-20
Assam
10.3% 10.4% 9.8% 10.5%
86.5% 79.9%
73.9% 73.6%
9.0% 12.3%
11.7% 12.3% 0.0%
1.5%
0.0%
0.0%
0.6% 1.9%
2.7% 2.4%
2.4% 2.4%
2.1% 2.2%
-8.9% -8.5%
-0.2%
-1.0%
FY 2016-17 FY 2017-18 FY 2018-19 FY 2019-20
Haryana
O&M Expenses PPC Transmission Charges Return on Equity Net Interest & Finance Charges Depreciation Other elements
Share of cost components (in %) of ARR
Source: Tariff orders issued by respective state commissions for the last 4 years;
Change in share of cost components over the last 4 years
The share of PPC has reduced over the years
whereas the share of transmission charge and
O&M expense has increased
The share of PPC has reduced whereas the
transmission charge and other expenses has
increased over the years
The share of transmission charges and PPC has
reduced over the years whereas the O&M
expenses has increased over the last 4 years
5.0% 4.9% 4.9% 7.0%
75.3% 74.7% 74.3% 73.3%
11.8% 12.0% 12.2% 12.4% 2.8%
2.9% 3.0%
2.9% 2.2% 2.2% 2.2%
2.0%
4.2% 4.5% 4.7%
3.6%
-1.3% -1.2% -1.4% -1.1%
FY 2016-17 FY 2017-18 FY 2018-19 FY 2019-20
Gujarat
*For the state of Andhra Pradesh, net ARR is estimated as sum of PPC, transmission charges and other elements of ARR
4.7% 9.8% 11.3% 12.4%
80.3% 74.8% 72.0%
65.4%
8.3% 7.2% 7.6% 11.5%
0.1% 2.5% 2.3% 2.6%
4.6% 4.0% 5.7% 5.9%
2.3% 1.9% 1.3% 2.5%
FY 2016-17 FY 2017-18 FY 2018-19 FY 2019-20
Uttar Pradesh
O&M Expenses PPC Transmission Charges Return on Equity Net Interest & Finance Charges Depreciation Other elements
79.4% 77.4% 76.8% 73.9%
5.2% 6.3% 6.9% 8.8%
15.4% 16.3% 16.3% 17.3%
FY 2016-17 FY 2017-18 FY 2018-19 FY 2019-20
Andhra Pradesh*

Summary: Power purchase trend Hypothesis: PPC constitutes major share of ACoS and the share has not increased over the last 4 years
PPC accounted for ~67% to 78% of the ACoS over the last 4 years for 12 states. However, per
unit PPC has reduced during the same period.
o Share of PPC in approved ACoS has reduced across states (except for the states of
Uttarakhand)
• In Uttarakhand, the share of PPC has increased mainly on account of new PPAs with gas-
based power plants
Major reason for reduction in share of PPC is the increase in contribution of other cost
components (such as O&M costs, depreciation, ROE, etc.) to the approved ACoS

Power purchase break-up,
cost and quality of coal,
grade slippages, increasing
taxes, railway freight
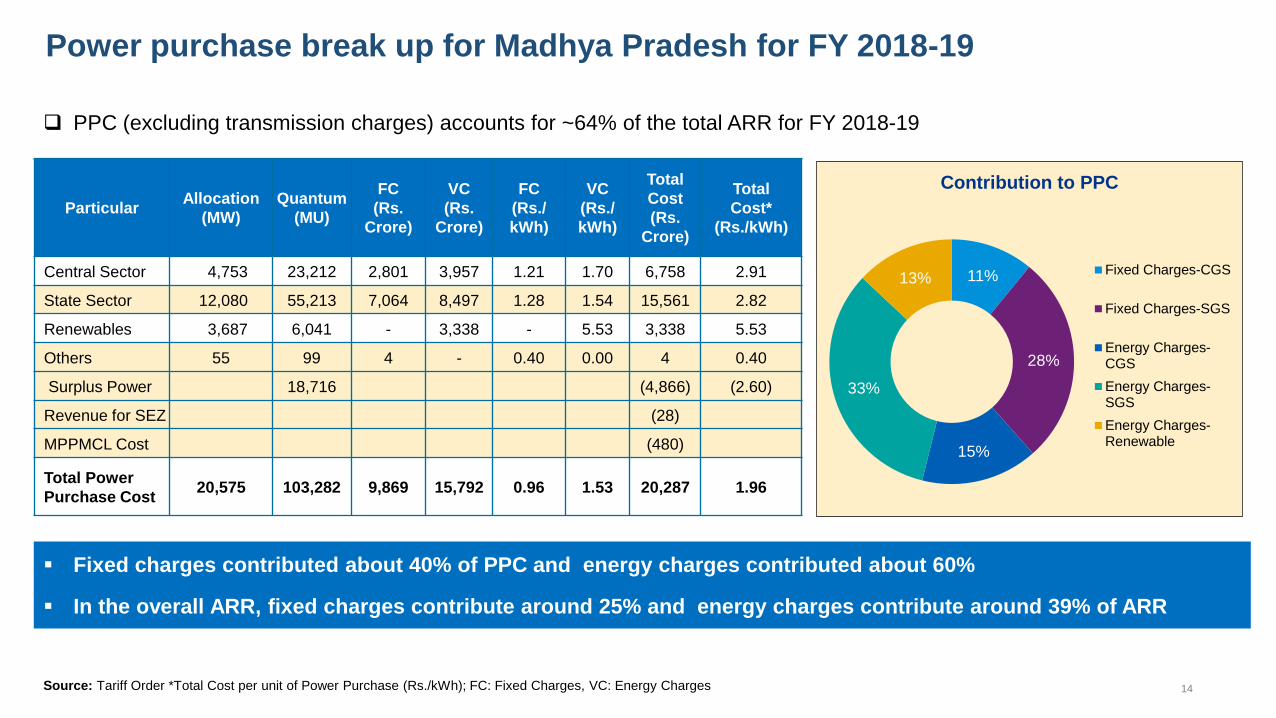
14
Power purchase break up for Madhya Pradesh for FY 2018-19
PPC (excluding transmission charges) accounts for ~64% of the total ARR for FY 2018-19
Fixed charges contributed about 40% of PPC and energy charges contributed about 60%
In the overall ARR, fixed charges contribute around 25% and energy charges contribute around 39% of ARR
Source: Tariff Order *Total Cost per unit of Power Purchase (Rs./kWh); FC: Fixed Charges, VC: Energy Charges
Particular Allocation
(MW)
Quantum
(MU)
FC
(Rs.
Crore)
VC
(Rs.
Crore)
FC
(Rs./
kWh)
VC
(Rs./
kWh)
Total
Cost
(Rs.
Crore)
Total
Cost*
(Rs./kWh)
Central Sector 4,753 23,212 2,801 3,957 1.21 1.70 6,758 2.91
State Sector 12,080 55,213 7,064 8,497 1.28 1.54 15,561 2.82
Renewables 3,687 6,041 - 3,338 - 5.53 3,338 5.53
Others 55 99 4 - 0.40 0.00 4 0.40
Surplus Power 18,716 (4,866) (2.60)
Revenue for SEZ (28)
MPPMCL Cost (480)
Total Power
Purchase Cost 20,575 103,282 9,869 15,792 0.96 1.53 20,287 1.96
11%
28%
15%
33%
13%
Contribution to PPC
Fixed Charges-CGS
Fixed Charges-SGS
Energy Charges-CGS
Energy Charges-SGS
Energy Charges-Renewable
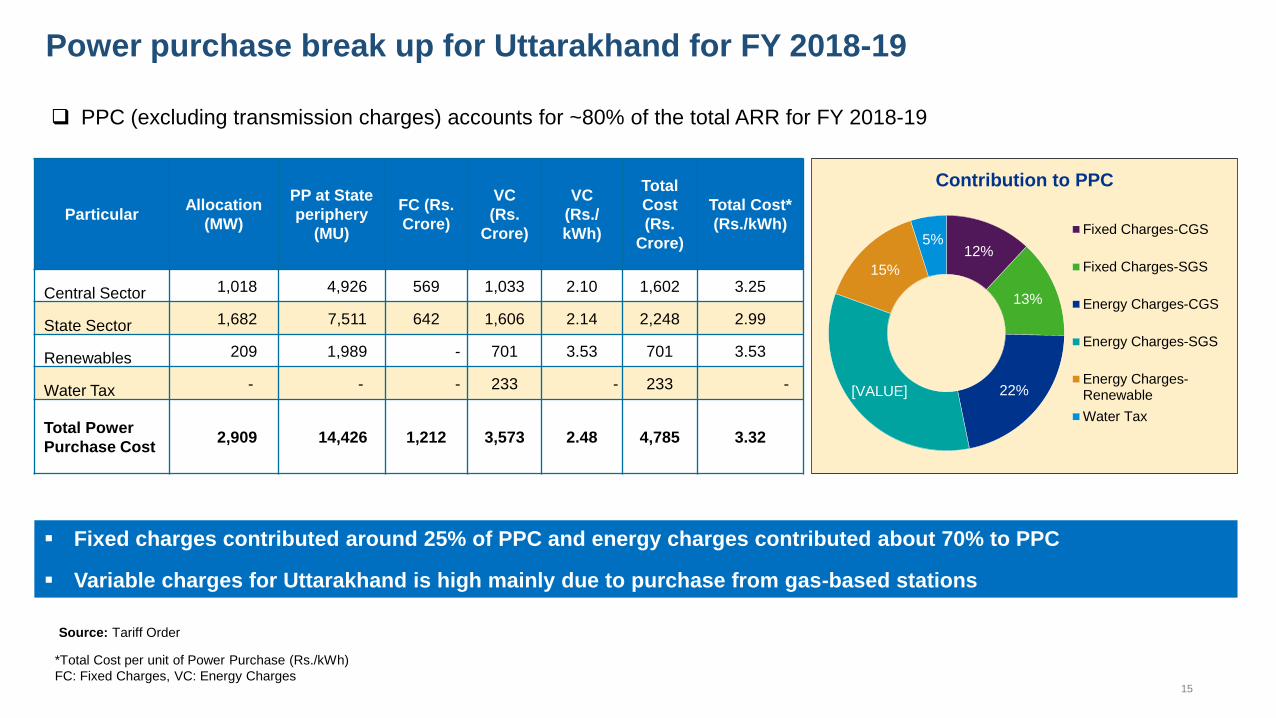
15
Power purchase break up for Uttarakhand for FY 2018-19
PPC (excluding transmission charges) accounts for ~80% of the total ARR for FY 2018-19
Fixed charges contributed around 25% of PPC and energy charges contributed about 70% to PPC
Variable charges for Uttarakhand is high mainly due to purchase from gas-based stations
Source: Tariff Order
Particular Allocation
(MW)
PP at State
periphery
(MU)
FC (Rs.
Crore)
VC
(Rs.
Crore)
VC
(Rs./
kWh)
Total
Cost
(Rs.
Crore)
Total Cost*
(Rs./kWh)
Central Sector 1,018 4,926 569 1,033 2.10 1,602 3.25
State Sector 1,682 7,511 642 1,606 2.14 2,248 2.99
Renewables 209 1,989 - 701 3.53 701 3.53
Water Tax - - - 233 - 233 -
Total Power
Purchase Cost 2,909 14,426 1,212 3,573 2.48 4,785 3.32
*Total Cost per unit of Power Purchase (Rs./kWh)
FC: Fixed Charges, VC: Energy Charges
12%
13%
22% [VALUE]
15%
5%
Contribution to PPC
Fixed Charges-CGS
Fixed Charges-SGS
Energy Charges-CGS
Energy Charges-SGS
Energy Charges-Renewable
Water Tax

16
Coal price hike Hypothesis: Cost of coal for TPPs has increased disproportionately as compared to other
cost components
Coal Grade GCV (Kcal/Kg) Coal Price (Rs/Tonne)
June 2013- May 2016 June 2016- Dec 2017 Jan 2018- present
G1 Above 7000 Price shall be increased by Rs. 150/- per tonne over and above the
price applicable for GCV band exceeding 6700 but not exceeding
7000 Kcal/Kg, for increase in GCV by every 100 Kcal/Kg
Price shall be increased by Rs. 100/- per tonne over and above the
price applicable for GCV band exceeding 6700 but not exceeding
7000 Kcal/Kg, for increase in GCV by every 100 Kcal/Kg
G2 6701-7000 4870 3450 3288
G3 6401-6700 3890 3210 3144
G4 6101-6400 3490 3000 3000
G5 5801-6100 2800 2750 2737
G6 5501-5800 1600 1900 2317
G7 5201-5500 1400 1600 1926
G8 4901-5200 1250 1420 1465
G9 4601-4900 970 1100 1140
G10 4301-4600 860 980 1024
G11 4001-4300 700 810 955
G12 3701-4000 660 760 886
G13 3401-3700 610 720 817
G14 3101-3400 550 650 748
G15 2801-3100 510 600 590
G16 2501-2800 450 530 504
G17 2201-2500 400 470 447
• Price per tonne for most grades of coal has increased since January 2018, directly impacting power purchase cost
of power distribution companies
Coal price for CIL subsidiaries and NEC except WCL; Source: http://www.coal.nic.in,
Coal grade used for electricity generation • Increase in G11 – G14 Grade in Jan 2018 with respect to June 2016 is in range of 13-18%
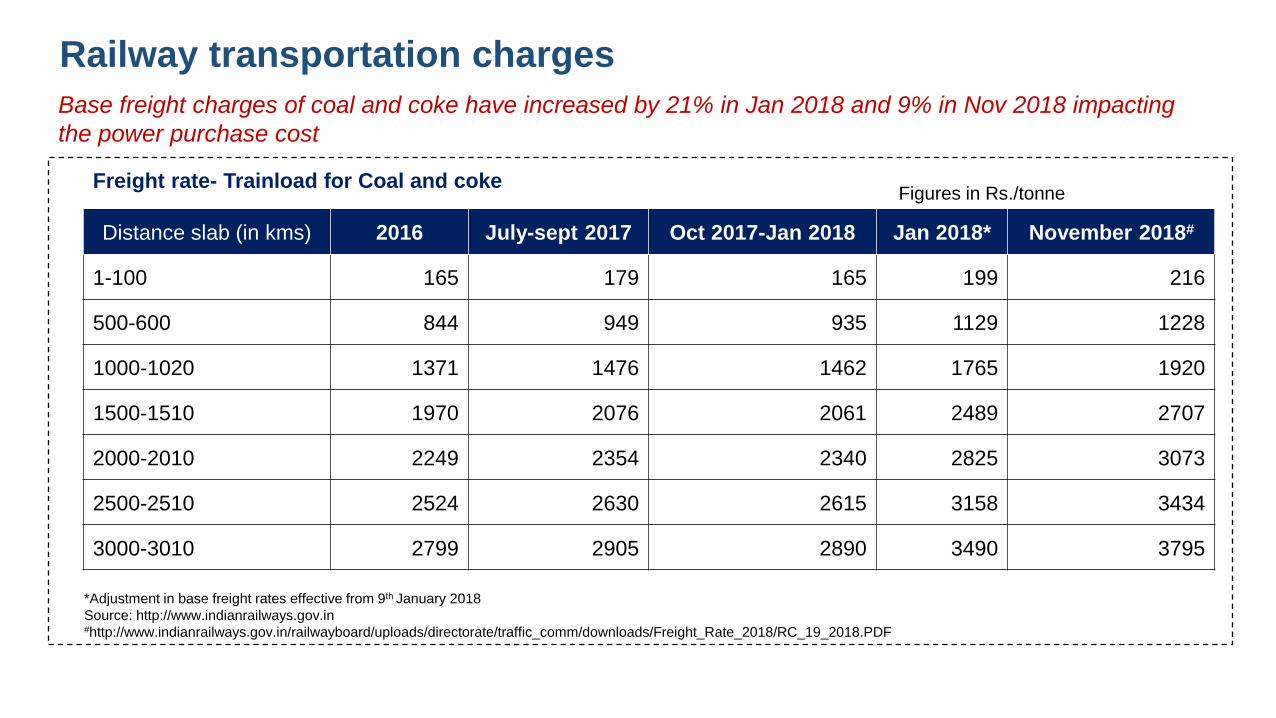
Railway transportation charges
Base freight charges of coal and coke have increased by 21% in Jan 2018 and 9% in Nov 2018 impacting
the power purchase cost
Distance slab (in kms) 2016 July-sept 2017 Oct 2017-Jan 2018 Jan 2018* November 2018#
1-100 165 179 165 199 216
500-600 844 949 935 1129 1228
1000-1020 1371 1476 1462 1765 1920
1500-1510 1970 2076 2061 2489 2707
2000-2010 2249 2354 2340 2825 3073
2500-2510 2524 2630 2615 3158 3434
3000-3010 2799 2905 2890 3490 3795
Figures in Rs./tonne Freight rate- Trainload for Coal and coke
*Adjustment in base freight rates effective from 9th January 2018
Source: http://www.indianrailways.gov.in #http://www.indianrailways.gov.in/railwayboard/uploads/directorate/traffic_comm/downloads/Freight_Rate_2018/RC_19_2018.PDF

18
Indicative coal prices and railway freight
650
700
750
800
850
900
950
1000
Ma
r-16
Ap
r-1
6
Ma
y-1
6
Jun
-16
Jul-
16
Au
g-1
6
Se
p-1
6
Oct-
16
No
v-1
6
De
c-1
6
Jan
-17
Fe
b-1
7
Ma
r-17
Ap
r-1
7
Ma
y-1
7
Jun
-17
Jul-
17
Au
g-1
7
Se
p-1
7
Oct-
17
No
v-1
7
De
c-1
7
Jan
-18
Fe
b-1
8
Ma
r-18
Comparison of actual coal prices (in Rs./Tonne) vis-à-vis indicative prices linked to inflation
810
700
955
720
723 741
747
Actual Coal Price
Weighted average of
WPI and CPI
WPI
June 2016 January 2018
Comparison of actual coal prices and railway freight vis-à-vis indicative prices linked to inflation
Railway freight for distance slab 1000-1020 km considered for the analysis
Source: Inflation Rate: WPI index (https://rbidocs.rbi.org.in/rdocs/AnnualReport/PDFs/4TCE9C7C09660A43A7824384F0E4661D7F.PDF)
O&M charges (http://www.cercind.gov.in/2020/orders/496-TT-2019.pdf)
• Actual coal prices were about ~28% higher in Jan‟ 2018 as
compared to price based on WPI and wt. avg. of WPI & CPI
1300
1400
1500
1600
1700
1800
1900
2000
Ma
r-1
7
Ap
r-17
Ma
y-1
7
Jun
-17
Jul-
17
Au
g-1
7
Se
p-1
7
Oct-
17
Nov-1
7
Dec-1
7
Jan
-18
Fe
b-1
8
Ma
r-1
8
Ap
r-18
Ma
y-1
8
Jun
-18
Jul-
18
Au
g-1
8
Se
p-1
8
Oct-
18
Nov-1
8
Dec-1
8
Jan
-19
Comparison of actual railway freight (in Rs./Tonne) vis-à-vis indicative prices linked to inflation
• Actual railway freight was about ~30% higher in Nov‟ 2018 as
compared to freight based on WPI and wt. avg. of WPI & CPI
July 2017 Jan’ 2018 Nov’ 2018
1920
1765
1371
1476 1462
Oct’ 2017
1411
1416 1463
1471
Apr’ 2018
Actual railway freight
Apr 2016 Apr 2017
741
747
810
Weighted average of
WPI and CPI
WPI
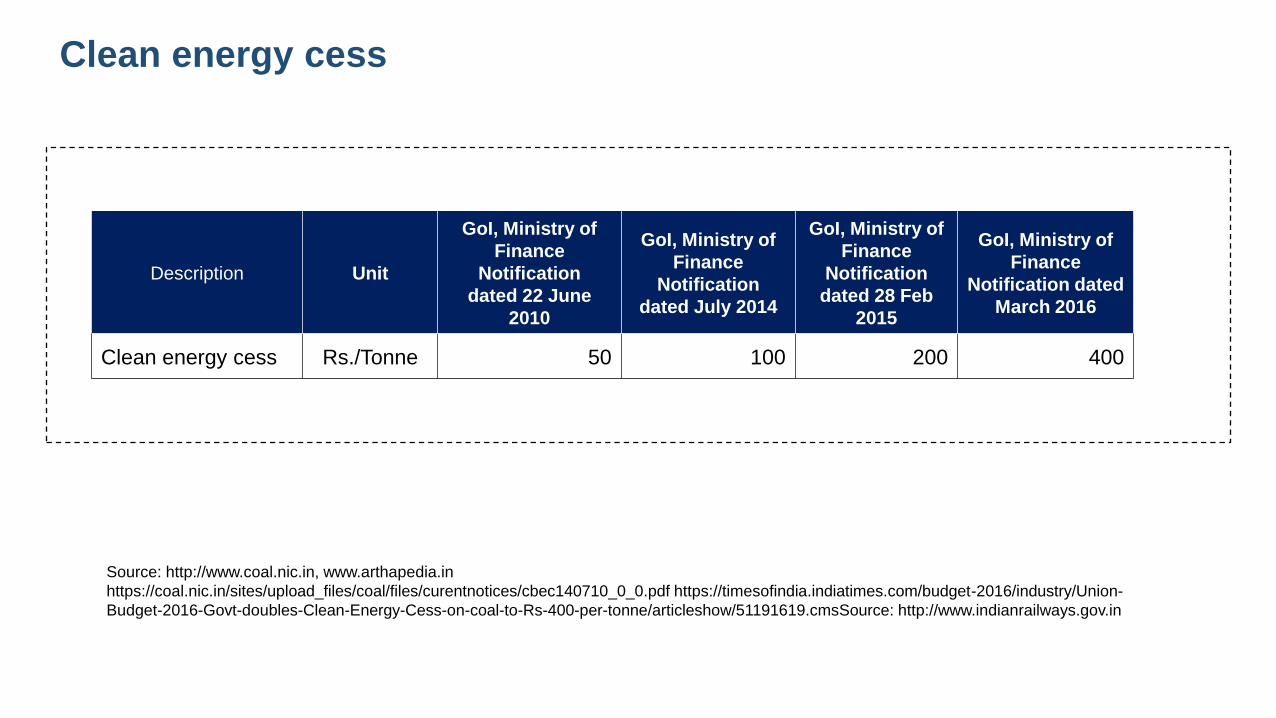
Clean energy cess
Source: http://www.coal.nic.in, www.arthapedia.in
https://coal.nic.in/sites/upload_files/coal/files/curentnotices/cbec140710_0_0.pdf https://timesofindia.indiatimes.com/budget-2016/industry/Union-
Budget-2016-Govt-doubles-Clean-Energy-Cess-on-coal-to-Rs-400-per-tonne/articleshow/51191619.cmsSource: http://www.indianrailways.gov.in
Description Unit
GoI, Ministry of
Finance
Notification
dated 22 June
2010
GoI, Ministry of
Finance
Notification
dated July 2014
GoI, Ministry of
Finance
Notification
dated 28 Feb
2015
GoI, Ministry of
Finance
Notification dated
March 2016
Clean energy cess Rs./Tonne 50 100 200 400
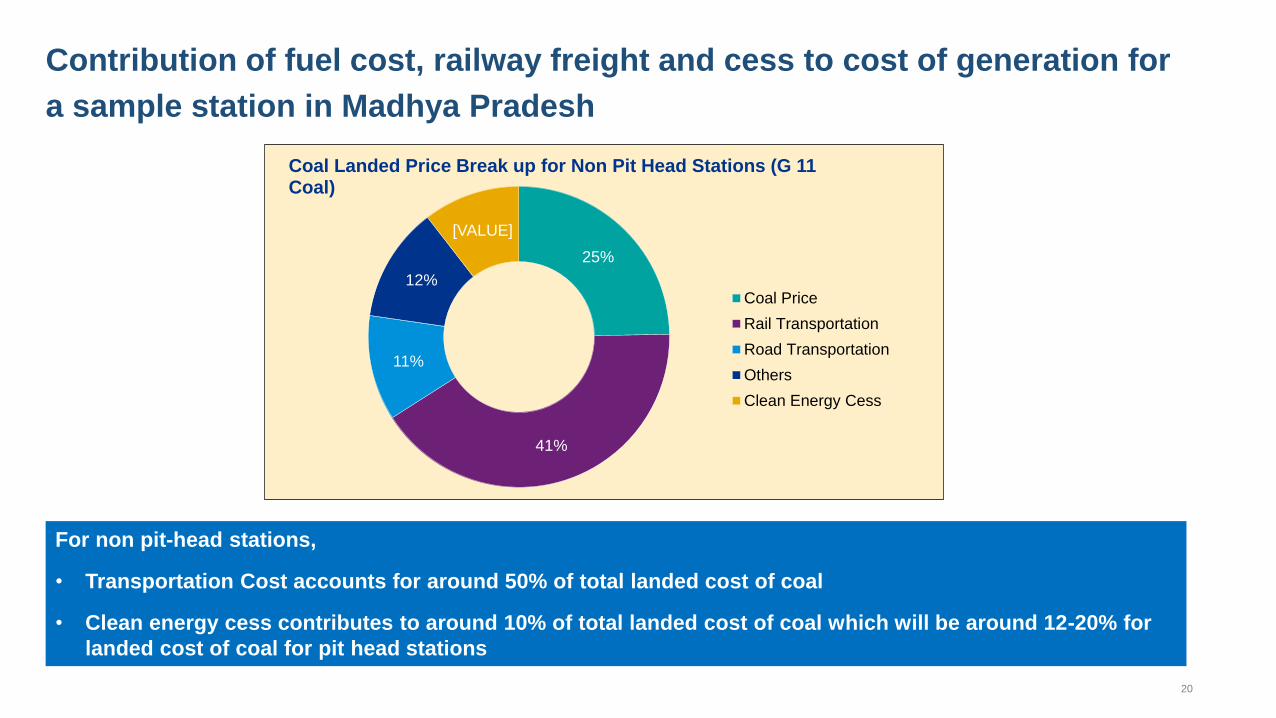
20
Contribution of fuel cost, railway freight and cess to cost of generation for
a sample station in Madhya Pradesh
For non pit-head stations,
• Transportation Cost accounts for around 50% of total landed cost of coal
• Clean energy cess contributes to around 10% of total landed cost of coal which will be around 12-20% for
landed cost of coal for pit head stations
25%
41%
11%
12%
[VALUE]
Coal Landed Price Break up for Non Pit Head Stations (G 11 Coal)
Coal Price
Rail Transportation
Road Transportation
Others
Clean Energy Cess
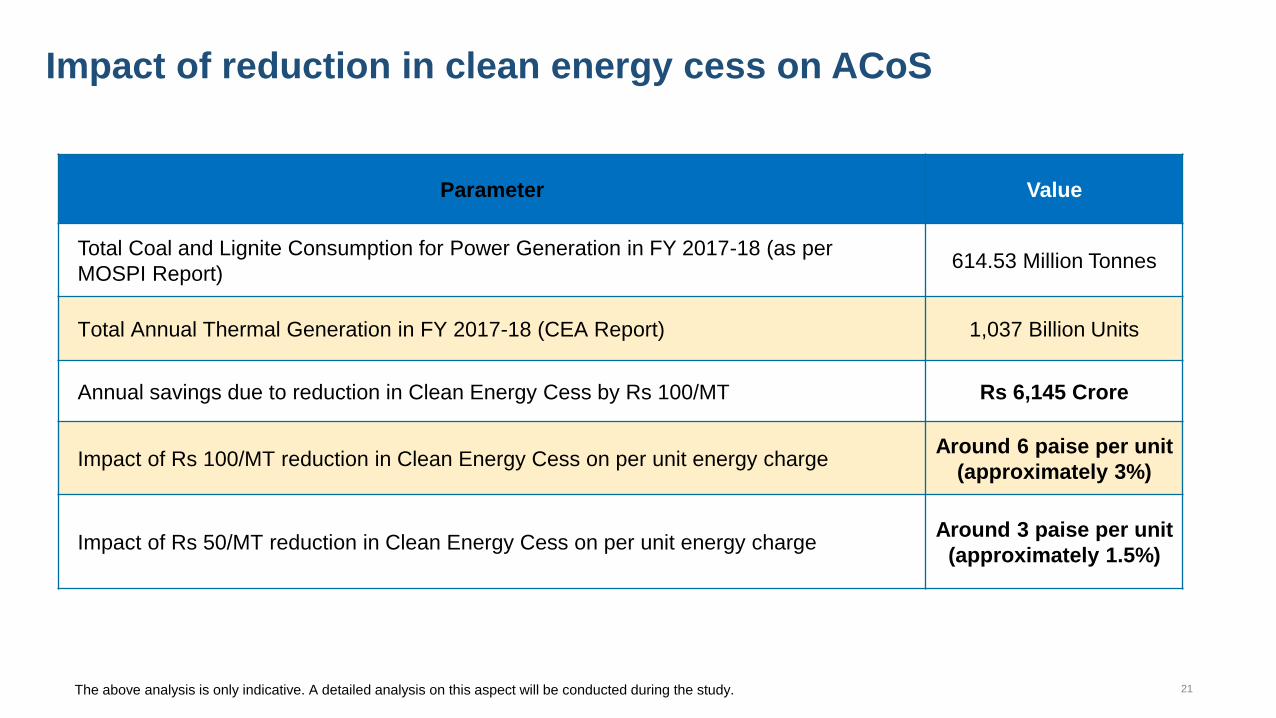
21
Impact of reduction in clean energy cess on ACoS
Parameter Value
Total Coal and Lignite Consumption for Power Generation in FY 2017-18 (as per
MOSPI Report) 614.53 Million Tonnes
Total Annual Thermal Generation in FY 2017-18 (CEA Report) 1,037 Billion Units
Annual savings due to reduction in Clean Energy Cess by Rs 100/MT Rs 6,145 Crore
Impact of Rs 100/MT reduction in Clean Energy Cess on per unit energy charge Around 6 paise per unit
(approximately 3%)
Impact of Rs 50/MT reduction in Clean Energy Cess on per unit energy charge Around 3 paise per unit
(approximately 1.5%)
The above analysis is only indicative. A detailed analysis on this aspect will be conducted during the study.

22
Coal GCV loss: Maharashtra case study
Actual GCV for FY 2018-19 (MSPGCL)
It can be observed from the data that the total GCV loss between as billed basis and as received basis is 662 Kcal/kg, which
consists of 362 kcal/kg on account of Grade Slippage and 300 kcal/kg on account of Moisture loss.
MERC Tariff Regulations 2019 specifies that the GCV loss between GCV as billed and GCV as received would be allowed at
actuals subject to maximum of 300 kcal/kg.
Source
GCV (at
Loading
End - EB) in
kcal/kg
GCV As
Received
(EB) in
kcal/kg
Grade
Slippage
(kcal/kg)
GCV As Received
(After
Moisture
Correction) in
kcal/kg
Moisture
Loss
(kcal/kg)
Total GCV
Loss
(kcal/kg)
Quantum
(MT)
Proportion
(%)
A B C=B-A D E=B-D F=C+E
WCL 3954 3575 379 3270 305 684 2,58,69,068 74.0%
MCL 3514 3364 150 3086 278 428 27,03,647 7.7%
SECL 3921 3688 233 3343 345 578 16,39,826 4.7%
SECL 4083 3651 432 3380 271 703 47,48,426 13.6%
MSPGCL-Wtd.
Avg. 3936 3574 362 3274 300 662 3,49,60,968

23
Coal GCV loss: Maharashtra case study
Actual GCV for FY 2019-20 (April to Oct 2019.)
GCV loss between As Billed and As Received is 808 kcal/kg for MSPGCL as a whole, comprising 495 kcal/kg towards Grade
Slippage and 313 kcal/kg towards moisture correction.
The GCV loss for FY 2019-20(April to October) is higher than FY 2018-19,because losses are higher during the monsoon season.
Source
GCV (at
Loading End
-EB) in
kcal/kg
GCV As
Received (EB)
in kcal/kg
Grade
Slippage
(kcal/kg)
GCV As Received
(After Moisture
Correction) in
kcal/kg
Moistu
re Loss
(kcal/k
g)
Total GCV
Loss
(kcal/kg)
Quantum
(MT)
Proportion
(%)
A B C=B-A D E=B-D F=C+E
WCL 4115 3491 624 3168 323 947 12,993,932 72.0%
MCL 3537 3565 -28 3225 340 312 1,390,724 7.7%
SECL 3814 3752 62 3404 348 410 732,058 4.1%
SCCL 3430 3149 281 2900 249 530 2,938,306 16.3%
MSPGCL-Wtd.
Avg. 3947 3452 495 3138 313 808 18,055,020
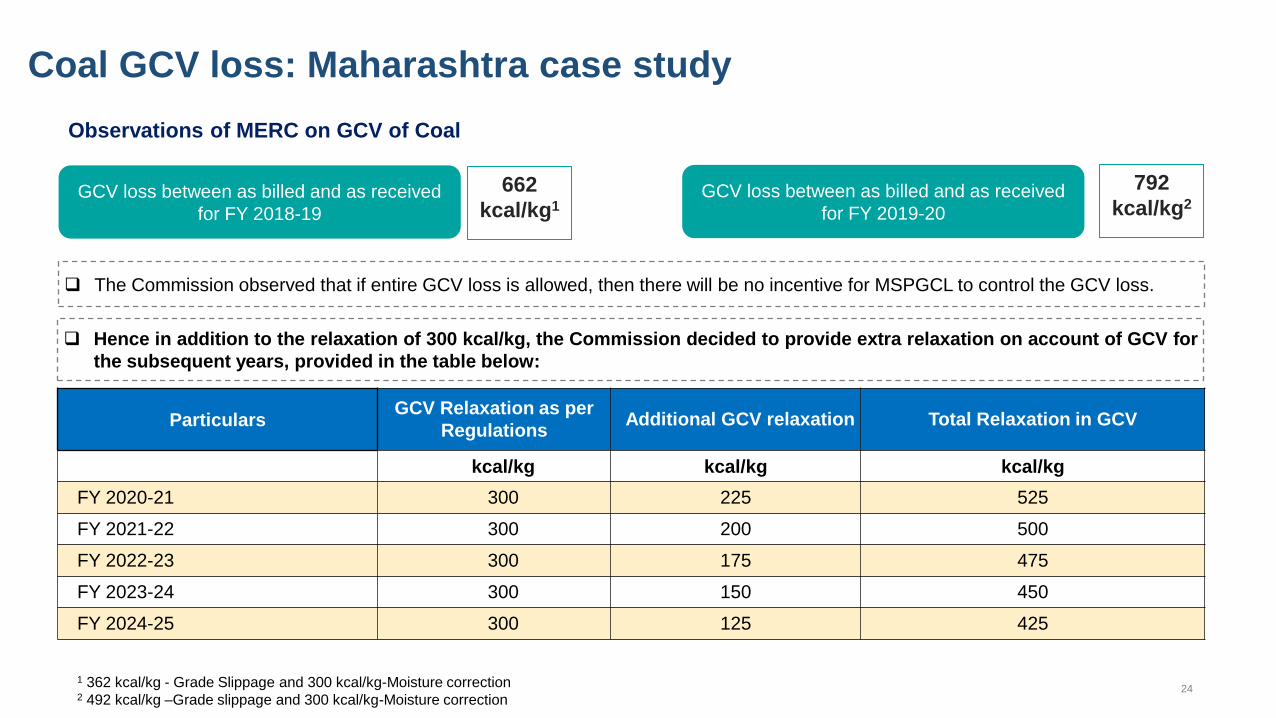
24
Particulars GCV Relaxation as per
Regulations Additional GCV relaxation Total Relaxation in GCV
kcal/kg kcal/kg kcal/kg
FY 2020-21 300 225 525
FY 2021-22 300 200 500
FY 2022-23 300 175 475
FY 2023-24 300 150 450
FY 2024-25 300 125 425
Observations of MERC on GCV of Coal
Coal GCV loss: Maharashtra case study
GCV loss between as billed and as received
for FY 2018-19
662
kcal/kg1 GCV loss between as billed and as received
for FY 2019-20
792
kcal/kg2
1 362 kcal/kg - Grade Slippage and 300 kcal/kg-Moisture correction 2 492 kcal/kg –Grade slippage and 300 kcal/kg-Moisture correction
The Commission observed that if entire GCV loss is allowed, then there will be no incentive for MSPGCL to control the GCV loss.
Hence in addition to the relaxation of 300 kcal/kg, the Commission decided to provide extra relaxation on account of GCV for
the subsequent years, provided in the table below:
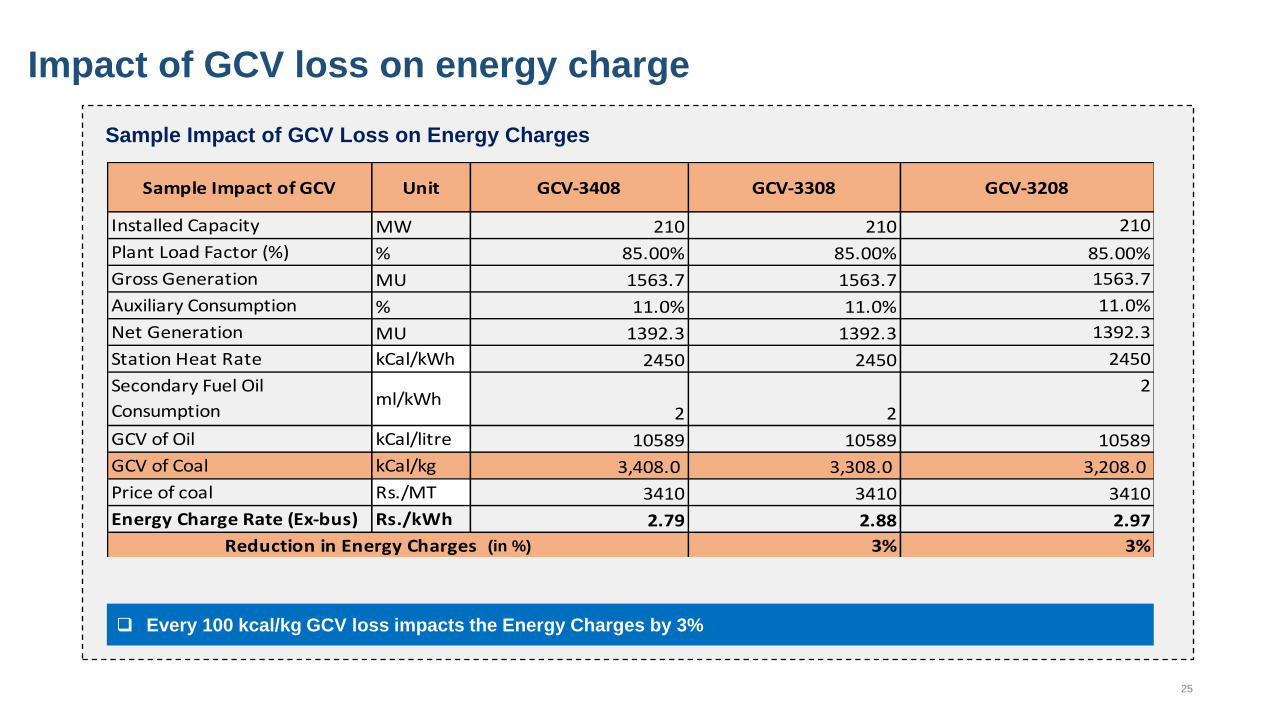
25
Impact of GCV loss on energy charge
Sample Impact of GCV Loss on Energy Charges
Sample Impact of GCV Unit GCV-3408 GCV-3308 GCV-3208
Installed Capacity MW 210 210 210
Plant Load Factor (%) % 85.00% 85.00% 85.00%
Gross Generation MU 1563.7 1563.7 1563.7
Auxiliary Consumption % 11.0% 11.0% 11.0%
Net Generation MU 1392.3 1392.3 1392.3
Station Heat Rate kCal/kWh 2450 2450 2450
Secondary Fuel Oil
Consumptionml/kWh
2 2
2
GCV of Oil kCal/litre 10589 10589 10589
GCV of Coal kCal/kg 3,408.0 3,308.0 3,208.0
Price of coal Rs./MT 3410 3410 3410
Energy Charge Rate (Ex-bus) Rs./kWh 2.79 2.88 2.97
3% 3%Reduction in Energy Charges (Rs./kWh)
Every 100 kcal/kg GCV loss impacts the Energy Charges by 3%
(in %)

Transmission
charges
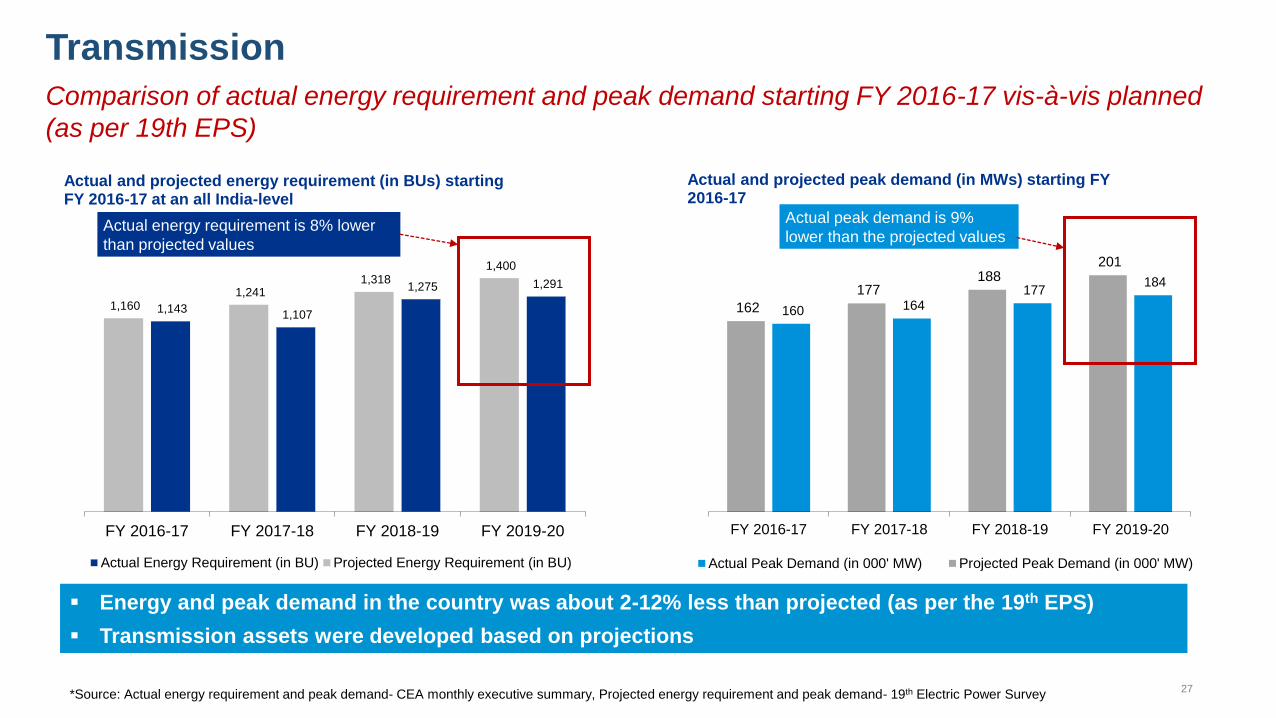
27
184 177
164 160
201 188
177
162
FY 2019-20FY 2018-19FY 2017-18FY 2016-17
Actual and projected peak demand (in MWs) starting FY 2016-17
Actual Peak Demand (in 000' MW) Projected Peak Demand (in 000' MW)
Transmission
1,291 1,275
1,107 1,143
1,400 1,318
1,241 1,160
FY 2019-20FY 2018-19FY 2017-18FY 2016-17
Actual and projected energy requirement (in BUs) starting FY 2016-17 at an all India-level
Actual Energy Requirement (in BU) Projected Energy Requirement (in BU)
*Source: Actual energy requirement and peak demand- CEA monthly executive summary, Projected energy requirement and peak demand- 19th Electric Power Survey
Energy and peak demand in the country was about 2-12% less than projected (as per the 19th EPS)
Transmission assets were developed based on projections
Actual energy requirement is 8% lower
than projected values
Actual peak demand is 9%
lower than the projected values
Comparison of actual energy requirement and peak demand starting FY 2016-17 vis-à-vis planned
(as per 19th EPS)

28
Transmission capacity
*Source: CEA monthly executive summary
Historical trend of transmission capacity
368 391 414 425
741
827 900
968
2016-17 2017-18 2018-19 2019-20
Cumulative transmission assets (inter-state and intra-state)
Transmission Lines ('000 CKM)
Transformation Capacity ('000 MVA)
11,669
9,210
8,590
4,489
9,751
9,279
8,290
5,747
2016-17
2017-18
2018-19
2019-20
Inter-state transmission capacity addition vis-à-vis planned
Capacity addition planned at center level Capacity addition at center level
Transmission capacity has increased as planned with 5% CAGR Growth (CKM) in lines and 9% CAGR Growth in
transformation capacity

29
Transmission charges
*Source: CEA monthly executive summary
Voltage wise capacity addition vis-à-vis planned
Capacity addition of 400 kV transmission lines accounted for 43% of the cumulative addition over the last 4
years
23,384
26,300 28,013
26,938
22,647
22,437
23,621
11,664
2,597 2,618 4,927 3,819
5,006 6,995
4,927
3,819
6,285 6,750 6,019 3,044
10,768
10,657 11,424 13,813
9,672 9,146
6,798
3,775
5,013
6,030 6,735 5,487
6,690 6,541 10,804
4,845
Planned Actual Planned Actual Planned Actual Planned Actual
2016-17 2016-17 2017-18 2017-18 2018-19 2018-19 2019-20 2019-20
Voltage-wise addition to the transmission lines (in CKM) over the last 4 years
800 kV 500 kV 765 kV 400 kV 220 kV
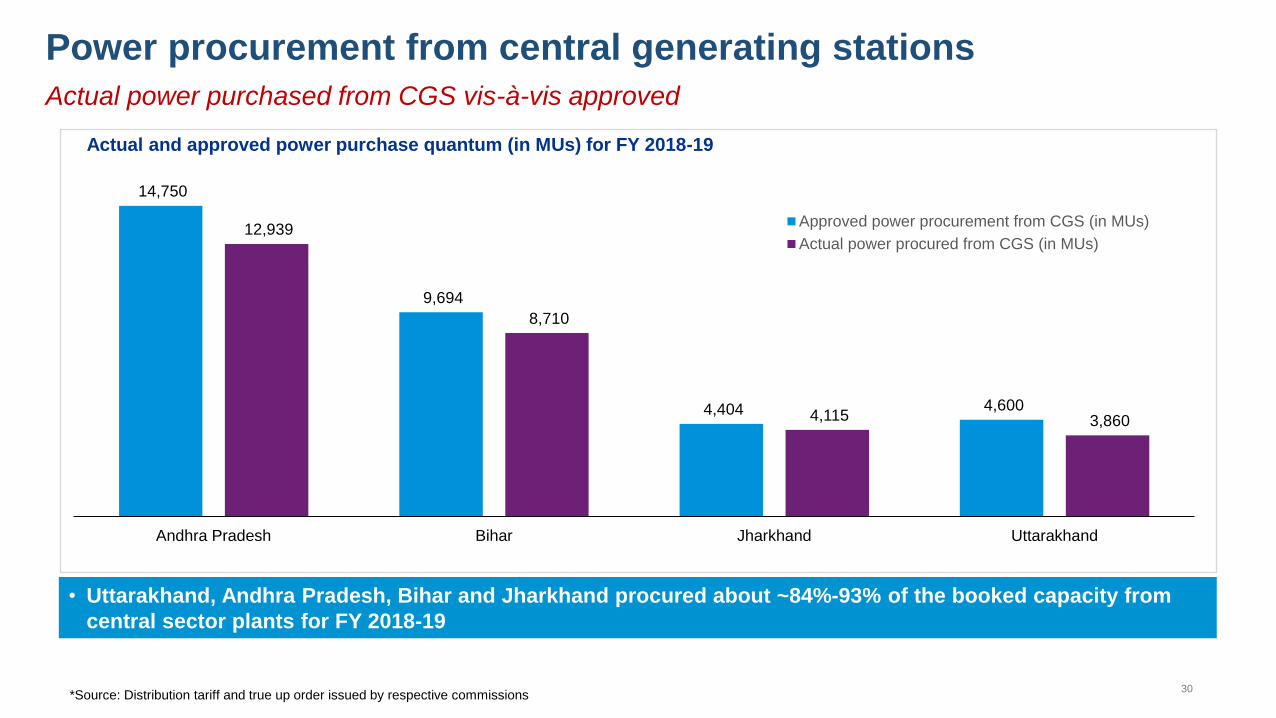
30
Power procurement from central generating stations
*Source: Distribution tariff and true up order issued by respective commissions
Actual power purchased from CGS vis-à-vis approved
• Uttarakhand, Andhra Pradesh, Bihar and Jharkhand procured about ~84%-93% of the booked capacity from
central sector plants for FY 2018-19
14,750
9,694
4,404 4,600
12,939
8,710
4,115 3,860
Andhra Pradesh Bihar Jharkhand Uttarakhand
Actual and approved power purchase quantum (in MUs) for FY 2018-19
Approved power procurement from CGS (in MUs)
Actual power procured from CGS (in MUs)
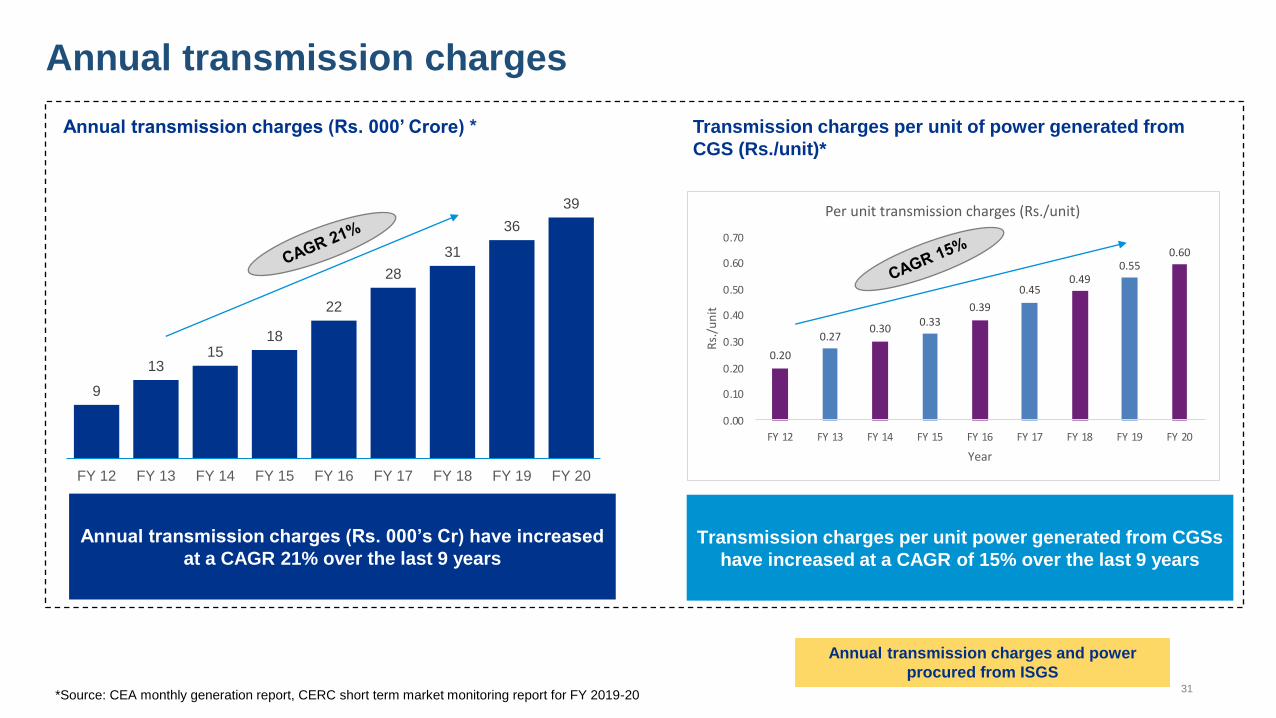
31
Annual transmission charges
*Source: CEA monthly generation report, CERC short term market monitoring report for FY 2019-20
Annual transmission charges and power
procured from ISGS
Annual transmission charges (Rs. 000’ Crore) * Transmission charges per unit of power generated from
CGS (Rs./unit)*
Annual transmission charges (Rs. 000’s Cr) have increased
at a CAGR 21% over the last 9 years Transmission charges per unit power generated from CGSs
have increased at a CAGR of 15% over the last 9 years
9
13 15
18
22
28
31
36
39
FY 12 FY 13 FY 14 FY 15 FY 16 FY 17 FY 18 FY 19 FY 20
0.20
0.270.30
0.330.39
0.450.49
0.550.60
0.00
0.10
0.20
0.30
0.40
0.50
0.60
0.70
FY 12 FY 13 FY 14 FY 15 FY 16 FY 17 FY 18 FY 19 FY 20
Rs.
/un
it
Year
Per unit transmission charges (Rs./unit)
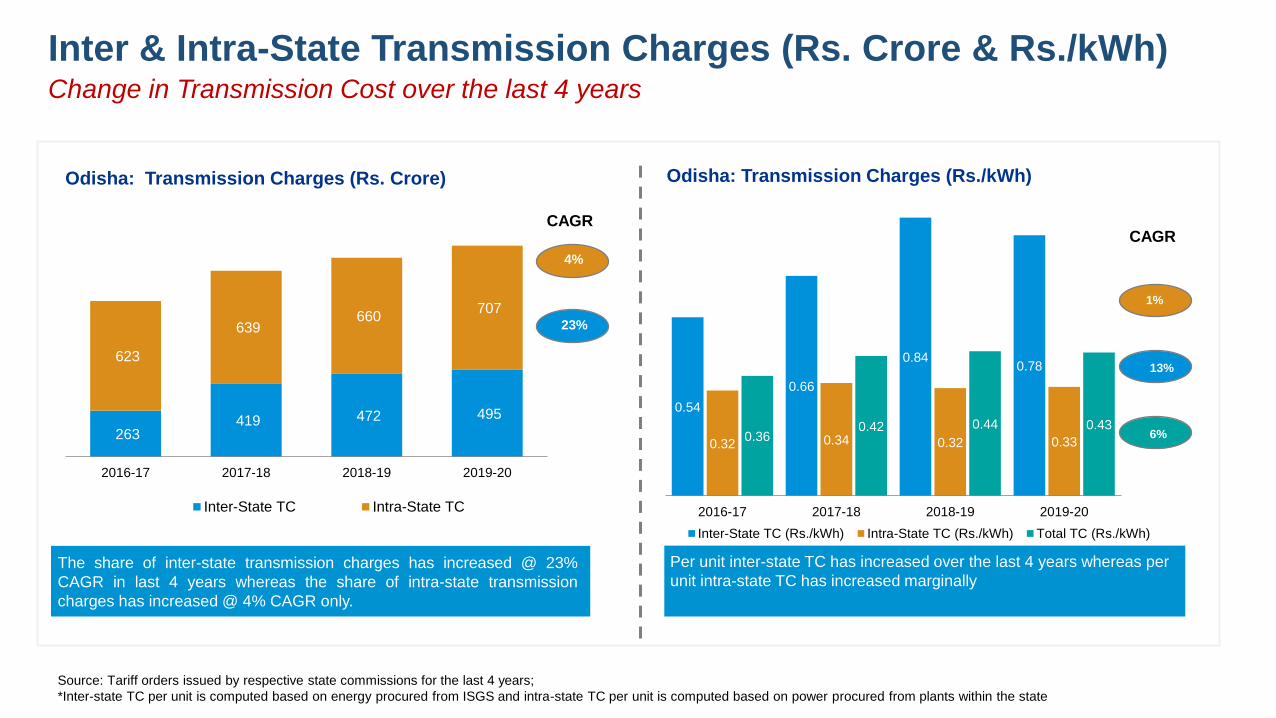
0.54
0.66
0.84 0.78
0.32 0.34 0.32 0.33 0.36 0.42 0.44 0.43
2016-17 2017-18 2018-19 2019-20
Odisha: Transmission Charges (Rs./kWh)
Inter-State TC (Rs./kWh) Intra-State TC (Rs./kWh) Total TC (Rs./kWh)
CAGR
0%
1%
6%
13%
Inter & Intra-State Transmission Charges (Rs. Crore & Rs./kWh) Change in Transmission Cost over the last 4 years
The share of inter-state transmission charges has increased @ 23%
CAGR in last 4 years whereas the share of intra-state transmission
charges has increased @ 4% CAGR only.
Per unit inter-state TC has increased over the last 4 years whereas per
unit intra-state TC has increased marginally
263 419 472 495
623
639 660
707
2016-17 2017-18 2018-19 2019-20
Odisha: Transmission Charges (Rs. Crore)
Inter-State TC Intra-State TC
4%
23%
CAGR
Source: Tariff orders issued by respective state commissions for the last 4 years;
*Inter-state TC per unit is computed based on energy procured from ISGS and intra-state TC per unit is computed based on power procured from plants within the state

Transmission charges Hypothesis: Regulated transmission tariff is higher than that discovered through competitive bidding
Scheme Name
Tariff discovered through Competitive Bidding Levelized Cost
as per CERC
(Rs. Crore)
Difference in
levelized costs
(in %) Project Cost
(Rs. Crore)
Line Length
(in km)
Levelized Cost of L1
Bidder (Rs. Crore)
Transmission System (TS) Gadarwara
STPS (2 x 800 MW) of NTPC (Part-B) 3,683 489 257 527 51%
TS Gadarwara STPS (2 x 800 MW) of
NTPC (Part-A) 4,071 538 290 593 51%
TS Strengthening Vindhyachal-V 2,845 383 211 421 50%
Khargone TPP 1320MW 2,137 466 159 310 49%
Construction of Ajmer (PG)-Phagi 765
kV D/C line 872 132 61 118 48%
Construction of 765/400/220kV GIS
Substation, Rampur and
400/220/132kV GIS Substation,
Sambhal with Transmission Lines
1,094 72 103 187 45%
Levelized cost discovered through competitive bidding for RECTPCL projects
Tariffs being discovered through competitive bidding are significantly lower than the tariffs approved by the
central regulator

Summary: Transmission charges
Transmission infrastructure was developed based on demand projections
Inter-state transmission capacity was booked by state utilities based on anticipated demand
Reduction in procurement from central sector plants as compared with capacity allocated has led to reduced
utilization of inter-state transmission assets (short-term)
ATC per unit power procured from central sector stations have increased significantly over the last 9 years
Further, tariff discovered through competitive bidding is significantly lower than regulated tariff. SERCs
may consider following competitive bidding route to reduce transmission costs and ACoS.
As per the Tariff policy 2016, “intra-state transmission projects shall be developed by State Government through
competitive bidding process for projects costing above a threshold limit which shall be decided by the SERCs”
The state of Rajasthan has implemented competitive bidding process for transmission projects through RVPNL
Hypothesis: Interstate transmission charges have increased over the last 4 years and during this period pan
India market has also improved, enhancing reliability of grid operations (intangible benefits for all stakeholders)

Fixed Cost
Elements

Return on Equity

ROE for generation, transmission and distribution companies Hypothesis: Change in norms for estimation of ROE, may lead to significant reduction in electricity tariffs
*Reduction in RoE by 1% given the station is declared under COD without commissioning of any of the RGMO or FGMO, data telemetry, communication system up to
load dispatch center or protection system based on the report submitted by the respective RLDC.
Rate of RoE approved through various control periods by CERC
2001-2004
2004-2009
2009-2014
2014-2019
2019-2024
ROE fixed @ 16%
• Premium of 5% over risk free rate
ROE revised to 14%
• ROE revised to 15.5% mainly on account of
• Increase in PLR of SBI and other PSU banks, and
• Increase in 10-year G-Sec yield
ROE retained @ 15.5%
ROE retained @ 15.5%*
• ROE for storage type hydro stations fixed
@16.50% • Reduction in risk free rates and
premium
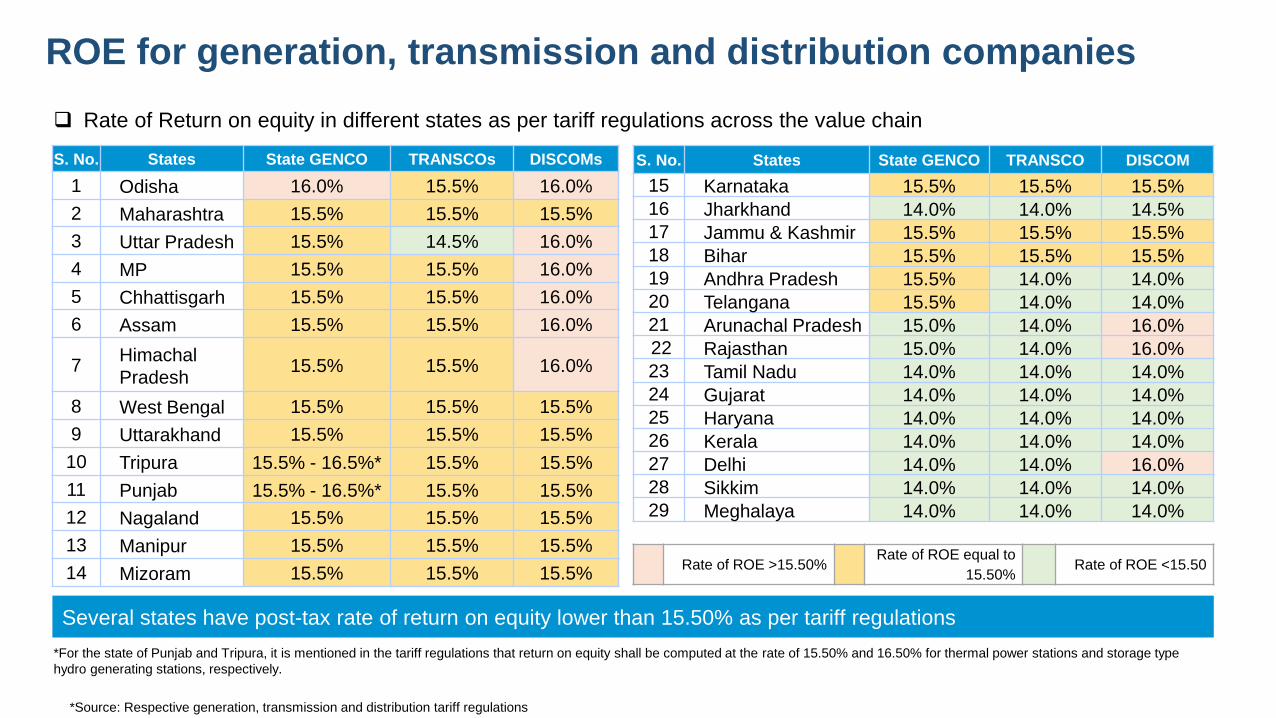
ROE for generation, transmission and distribution companies
S. No. States State GENCO TRANSCOs DISCOMs
1 Odisha 16.0% 15.5% 16.0%
2 Maharashtra 15.5% 15.5% 15.5%
3 Uttar Pradesh 15.5% 14.5% 16.0%
4 MP 15.5% 15.5% 16.0%
5 Chhattisgarh 15.5% 15.5% 16.0%
6 Assam 15.5% 15.5% 16.0%
7 Himachal
Pradesh 15.5% 15.5% 16.0%
8 West Bengal 15.5% 15.5% 15.5%
9 Uttarakhand 15.5% 15.5% 15.5%
10 Tripura 15.5% - 16.5%* 15.5% 15.5%
11 Punjab 15.5% - 16.5%* 15.5% 15.5%
12 Nagaland 15.5% 15.5% 15.5%
13 Manipur 15.5% 15.5% 15.5%
14 Mizoram 15.5% 15.5% 15.5%
Rate of Return on equity in different states as per tariff regulations across the value chain
S. No. States State GENCO TRANSCO DISCOM
15 Karnataka 15.5% 15.5% 15.5%
16 Jharkhand 14.0% 14.0% 14.5%
17 Jammu & Kashmir 15.5% 15.5% 15.5%
18 Bihar 15.5% 15.5% 15.5%
19 Andhra Pradesh 15.5% 14.0% 14.0%
20 Telangana 15.5% 14.0% 14.0%
21 Arunachal Pradesh 15.0% 14.0% 16.0%
22 Rajasthan 15.0% 14.0% 16.0%
23 Tamil Nadu 14.0% 14.0% 14.0%
24 Gujarat 14.0% 14.0% 14.0%
25 Haryana 14.0% 14.0% 14.0%
26 Kerala 14.0% 14.0% 14.0%
27 Delhi 14.0% 14.0% 16.0%
28 Sikkim 14.0% 14.0% 14.0%
29 Meghalaya 14.0% 14.0% 14.0%
*For the state of Punjab and Tripura, it is mentioned in the tariff regulations that return on equity shall be computed at the rate of 15.50% and 16.50% for thermal power stations and storage type
hydro generating stations, respectively.
Rate of ROE >15.50% Rate of ROE equal to
15.50% Rate of ROE <15.50
Several states have post-tax rate of return on equity lower than 15.50% as per tariff regulations
*Source: Respective generation, transmission and distribution tariff regulations

Government securities (G-Sec) yield and prime lending rates
It can be observed that the primary lending rate and the G-Sec Rates have shown a declining trend over the years.
Source: Source: SBI Website (PLR); CERC Explanatory Memorandum 2019 (G-Sec Rates)
7.92% 8.52% 8.36% 8.45% 8.51%
7.89%
7.16% 7.76%
6.69%
5.97%
13.25%
14.50% 14.55% 14.75% 14.60% 14.45% 13.85%
13.45% 13.70%
12.15%
0.00%
2.00%
4.00%
6.00%
8.00%
10.00%
12.00%
14.00%
16.00%
2 0 1 1 2 0 1 2 2 0 1 3 2 0 1 4 2 0 1 5 2 0 1 6 2 0 1 7 2 0 1 8 2 0 1 9 2 0 2 0 ( U P T O N O V )
PRIME LENDING RATE AND G-SEC RATE
G-Sec Rate Prime Lending Rate
All time low PLR since
2011
Lowest G-sec rate
since 2004
The rate of return on equity might be reviewed considering the present market expectations and risk perception of
power sector for new projects
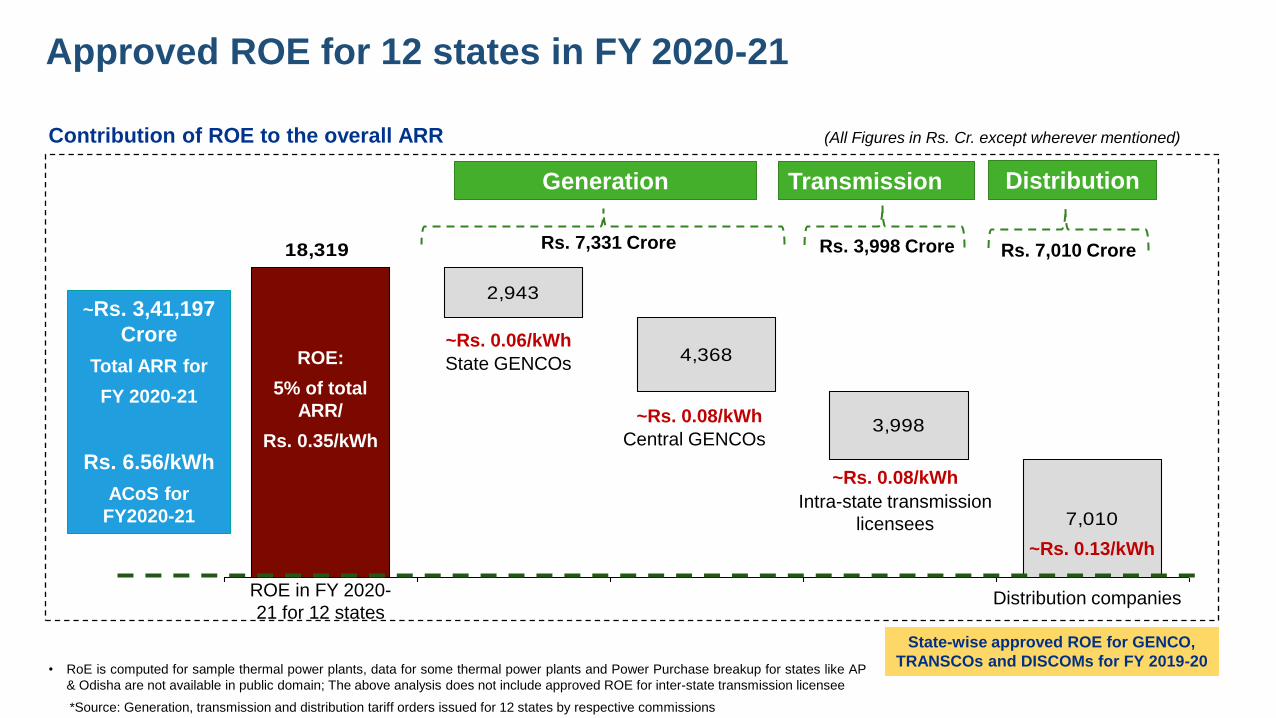
2,943
4,368
3,998
7,010
18,319
Total Segment A Segment B Segment C Segment E
Approved ROE for 12 states in FY 2020-21
ROE in FY 2020-
21 for 12 states Distribution companies
Intra-state transmission
licensees
State GENCOs
Generation Distribution Transmission
Central GENCOs
(All Figures in Rs. Cr. except wherever mentioned)
ROE:
5% of total
ARR/
Rs. 0.35/kWh
~Rs. 0.06/kWh
~Rs. 0.13/kWh
~Rs. 0.08/kWh
~Rs. 0.08/kWh
• RoE is computed for sample thermal power plants, data for some thermal power plants and Power Purchase breakup for states like AP
& Odisha are not available in public domain; The above analysis does not include approved ROE for inter-state transmission licensee
Contribution of ROE to the overall ARR
~Rs. 3,41,197
Crore
Total ARR for
FY 2020-21
Rs. 6.56/kWh
ACoS for
FY2020-21
Rs. 7,331 Crore Rs. 3,998 Crore Rs. 7,010 Crore
State-wise approved ROE for GENCO,
TRANSCOs and DISCOMs for FY 2019-20
*Source: Generation, transmission and distribution tariff orders issued for 12 states by respective commissions

Impact of change in the rate of ROE on ACoS
7.87 7.49 7.34 7.20 7.05
6.87 6.59 6.43
5.77 5.53
5.30
4.79
7.84 7.48
7.30 7.17 7.01 6.87 6.54 6.42
5.72 5.49
5.29
4.77
7.80 7.47
7.25 7.13 6.94 6.84
6.48 6.39
5.67 5.45
5.24
4.76
Assam Haryana Uttar Pradesh Karnataka Bihar Andhra Pradesh MadhyaPradesh
Kerala Jharkhand Uttarakhand Gujarat Odisha
Existing ACoS ACoS @ 14% ROE ACoS @ 12% ROE
Reduction in ACoS is computed at 14%/12% rate of return or on actual rate whichever is lower; Reduction in ACoS has been rounded off to two decimal places 1 For the state of Andhra Pradesh, the commission has approved 14% ROE for generation, transmission and distribution companies for 2020-21 2 For the state of Haryana, the Commission has not allowed ROE for DISCOMs for 2020-21 due to the unprecedented situation emanating from the COVID-19 pandemic and the resulting
restriction/lockdown ordered by Central Government/State Government
• Reduction of approved rate of ROE to 12% would reduce ACoS by ~Rs. 3,474 Crore/Rs. 0.07/kWh (1.0%)
• Reduction of approved rate of ROE to 14% would reduce ACoS by ~ Rs. 1,230 Crore/ Rs. 0.02/kWh (0.4%)
For the tariff period 2019-24, the Commission has approved post tax base rate of 15.5%
Reduction in ACoS (in Rs./kWh) for 12 states at 14% and 12% rate of ROE during FY 2020-21
1 2

Impact of reduction in rate of RoE
Outages
1. Reduction in profit
2. Weak balance sheet
3. Increase in cost of debt (Rd)
4. Increase in ACoS
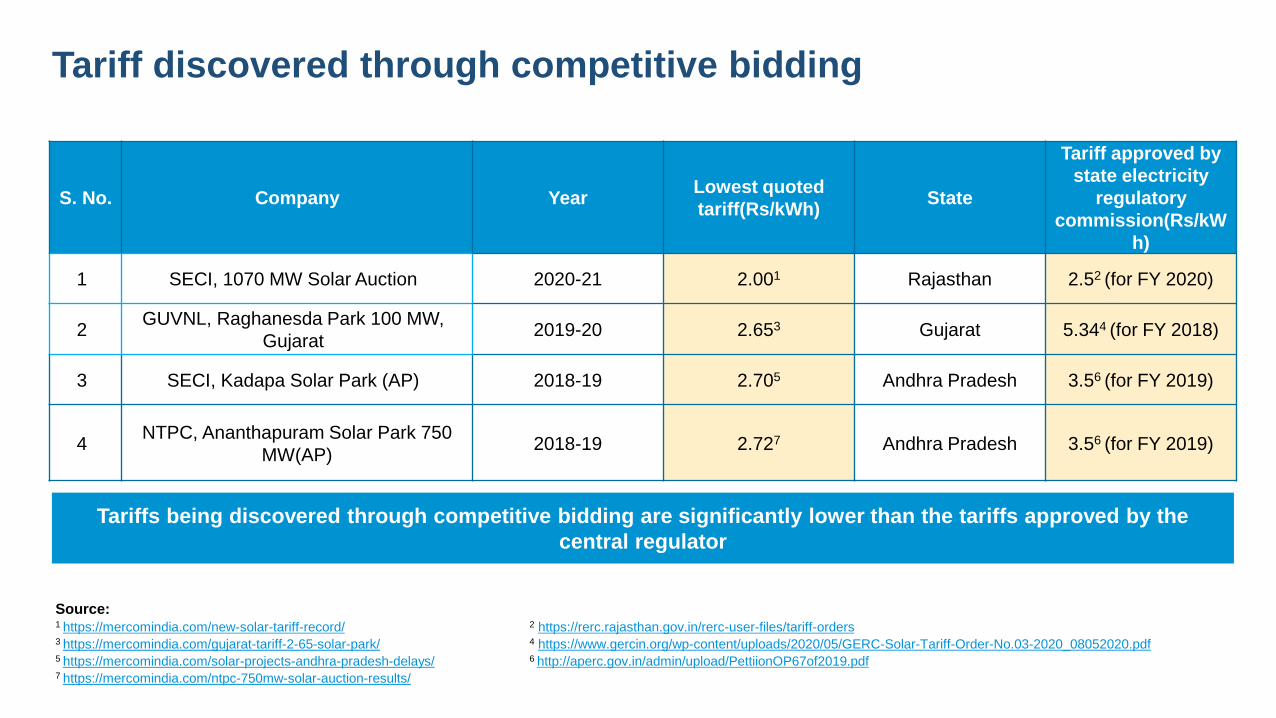
Tariff discovered through competitive bidding
Source: 1 https://mercomindia.com/new-solar-tariff-record/ 2 https://rerc.rajasthan.gov.in/rerc-user-files/tariff-orders 3 https://mercomindia.com/gujarat-tariff-2-65-solar-park/ 4 https://www.gercin.org/wp-content/uploads/2020/05/GERC-Solar-Tariff-Order-No.03-2020_08052020.pdf 5 https://mercomindia.com/solar-projects-andhra-pradesh-delays/ 6 http://aperc.gov.in/admin/upload/PettiionOP67of2019.pdf 7 https://mercomindia.com/ntpc-750mw-solar-auction-results/
S. No. Company Year Lowest quoted
tariff(Rs/kWh) State
Tariff approved by
state electricity
regulatory
commission(Rs/kW
h)
1 SECI, 1070 MW Solar Auction 2020-21 2.001 Rajasthan 2.52 (for FY 2020)
2 GUVNL, Raghanesda Park 100 MW,
Gujarat 2019-20 2.653 Gujarat 5.344 (for FY 2018)
3 SECI, Kadapa Solar Park (AP) 2018-19 2.705 Andhra Pradesh 3.56 (for FY 2019)
4 NTPC, Ananthapuram Solar Park 750
MW(AP) 2018-19 2.727 Andhra Pradesh 3.56 (for FY 2019)
Tariffs being discovered through competitive bidding are significantly lower than the tariffs approved by the
central regulator

Depreciation cost

Depreciation cost Hypothesis: Change in norms for estimation of depreciation, may lead to significant reduction in
electricity tariffs
The depreciation reserve is created to fully meet the debt service obligation and is a major component of the annual
fixed cost across the value chain.
Regulatory
Framework
• Straight Line Method (SLM) of depreciation has been used in all the previous four tariff periods.
• Useful lives of all types of generating stations and transmission systems except gas-based generating
stations have remained same in all the tariff periods.
Other Provisions
• In 2001 and 2004 Tariff Regulations, the Commission had adopted the provision of Advance Against
Depreciation (AAD) in order to ensure enough cash flows to meet loan repayment obligations
• However, the 2009 Tariff Regulations dispensed with the provision of AAD.
• The depreciation rate was worked out by considering normative repayment period of 12 years to repay the
long-term loan (70% of the capital cost).
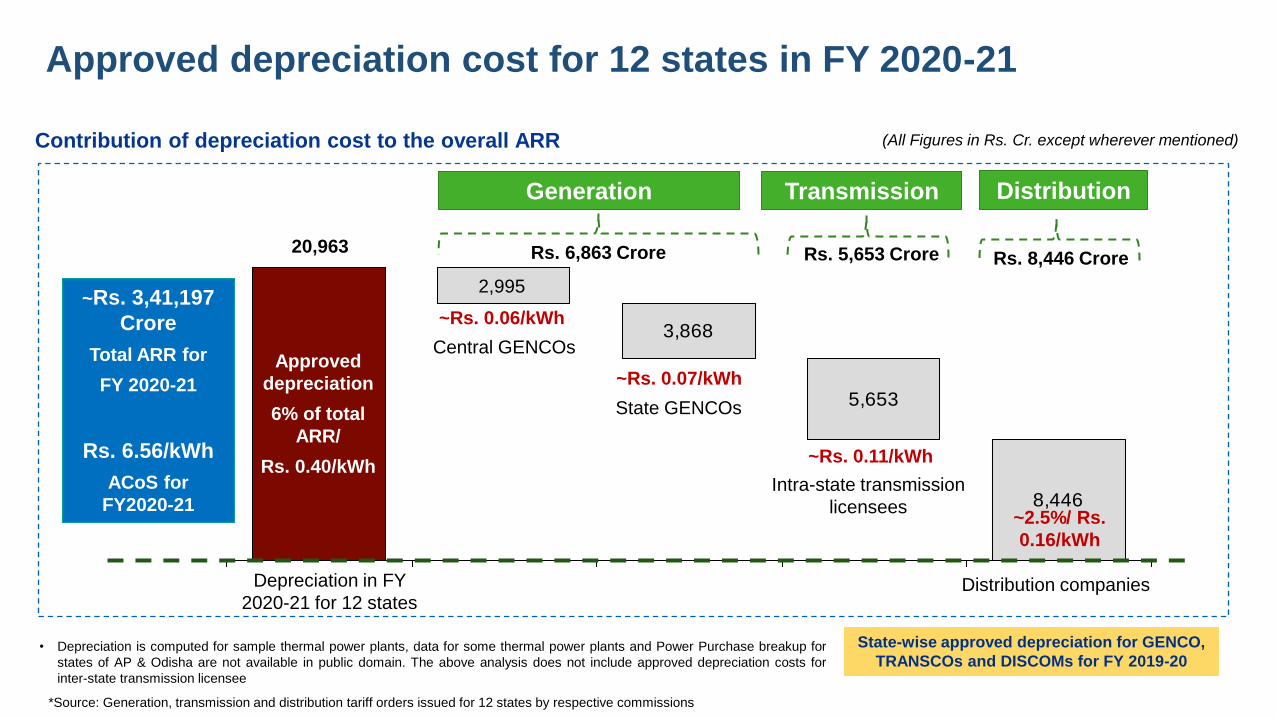
Approved depreciation cost for 12 states in FY 2020-21
2,505
3,868
5,653
8,446
20,473
Total Segment A Segment B Segment C Segment E
~Rs. 3,41,197
Crore
Total ARR for
FY 2020-21
Rs. 6.56/kWh
ACoS for
FY2020-21
Contribution of depreciation cost to the overall ARR
Depreciation in FY
2020-21 for 12 states Distribution companies
Intra-state transmission
licensees
State GENCOs
Generation Distribution Transmission
Central GENCOs
~Rs. 0.06/kWh
~2.5%/ Rs.
0.16/kWh
~Rs. 0.07/kWh
~Rs. 0.11/kWh
Approved
depreciation
6% of total
ARR/
Rs. 0.40/kWh
(All Figures in Rs. Cr. except wherever mentioned)
• Depreciation is computed for sample thermal power plants, data for some thermal power plants and Power Purchase breakup for
states of AP & Odisha are not available in public domain. The above analysis does not include approved depreciation costs for
inter-state transmission licensee
2,995
Rs. 6,863 Crore Rs. 5,653 Crore Rs. 8,446 Crore 20,963
State-wise approved depreciation for GENCO,
TRANSCOs and DISCOMs for FY 2019-20
*Source: Generation, transmission and distribution tariff orders issued for 12 states by respective commissions

Impact of change in the rate of depreciation on ACoS
As per the prevailing norms, depreciation rate is estimated by considering loan repayment
period of 12 years to repay the loan (70% of the capital cost)
Reduction of depreciation rate to 4.67% (considering loan repayment period of 15 years to
repay 70% of the capital cost) would reduce ACoS by ~Rs. 3,500-4,000 Crore/ Rs.
0.08kWh (1.2%)
Reduction of depreciation rate to 4.34% (considering loan repayment period of 15 years to
repay 65% of the capital cost) would reduce ACoS by ~Rs. 4,500-4,800 Crore/ Rs.
0.10kWh (1.4%)
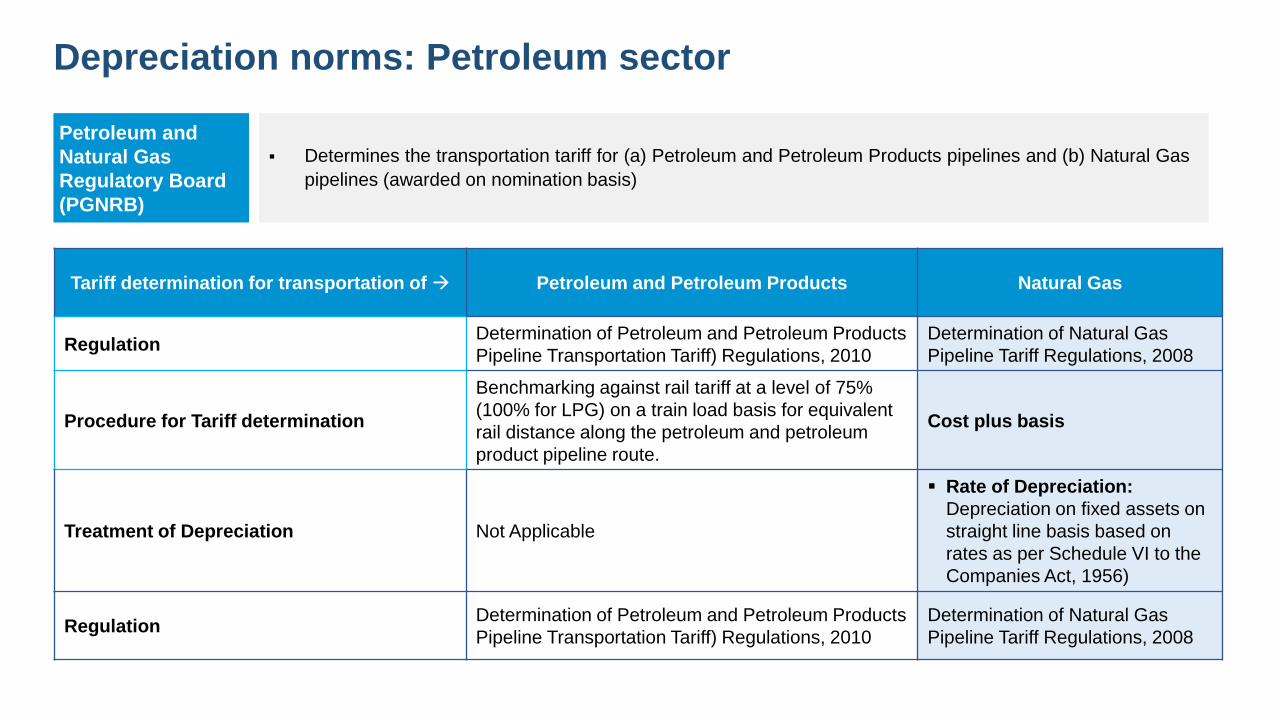
Depreciation norms: Petroleum sector
Petroleum and
Natural Gas
Regulatory Board
(PGNRB)
Determines the transportation tariff for (a) Petroleum and Petroleum Products pipelines and (b) Natural Gas
pipelines (awarded on nomination basis)
Tariff determination for transportation of Petroleum and Petroleum Products Natural Gas
Regulation Determination of Petroleum and Petroleum Products
Pipeline Transportation Tariff) Regulations, 2010
Determination of Natural Gas
Pipeline Tariff Regulations, 2008
Procedure for Tariff determination
Benchmarking against rail tariff at a level of 75%
(100% for LPG) on a train load basis for equivalent
rail distance along the petroleum and petroleum
product pipeline route.
Cost plus basis
Treatment of Depreciation Not Applicable
Rate of Depreciation:
Depreciation on fixed assets on
straight line basis based on
rates as per Schedule VI to the
Companies Act, 1956)
Regulation Determination of Petroleum and Petroleum Products
Pipeline Transportation Tariff) Regulations, 2010
Determination of Natural Gas
Pipeline Tariff Regulations, 2008

Depreciation rationalization – Case study of Uttar Pradesh
Fixed Asset
Register (FAR)
The main objective of FAR is to hold accurate information about each asset. So that asset can be utilized
when it is required. Moreover, this register also assists in tracking the asset value and depreciation value
also.
The Transmission and Distribution Licensees to be
directed to maintain proper and updated Fixed Asset
Registers.
In case, proper FAR is not maintained certain
component of depreciation may be dis-allowed or
withheld.
Typically, FAR is not maintained because of
which it is not possible to carry out the
prudence check that the deprecation on any
asset is not claimed beyond permissible limit
of 90% of cost of Asset

Depreciation rationalization – Case study of Uttar Pradesh
Uttar Pradesh Electricity Regulatory Commission
1
2
• Subsequently next year, UPERC while reprimanding Distribution Companies and Transmission company over the
issue of non-maintenance of fixed asset registers had withheld 20% of the allowable depreciation for FY 2013-14
(Order dated May 31, 2013) citing the APTEL orders in Appeal No. 121 of 2010 & I.A. No.83 of 2011 and ordered
that the same would be released for recovery through tariff, upon submission of fixed asset registers. Further, 25%
depreciation of FY 2014-15, 30% in FY 2015-16 & FY 2016-17 was withheld of the percentage of net allowable
depreciation.
UPERC in their Tariff orders for FY 2012-13 mentioned that “Components of the ARR viz., depreciation, allowable interest on debt
and return on equity are adversely affected by inadvertent misrepresentations of capital assets creation numbers.”
In the same tariff order UPERC further submitted that “…the Commission is severely hindered in its task of undertaking prudence
check of ARR components viz., depreciation, and allowable interest on debt and return on equity. On account of lack of details of
fixed assets register, the Commission has assessed depreciation based on wt. avg. depreciation rates…”
In FY 2013-14, UPERC withheld 20% of the allowable depreciation and mentioned that same may be allowed upon submission of FAR.
Further, 25% depreciation of FY 2014-15, 30% in FY 2015-16 & FY 2016-17 was withheld due to non submission of FAR
During the True-up for FY 2014-15 the DISCOMs submitted the FAR up to FY 2014-15 on June 21st, 2017.
The commission noted, that there was a delay in submission of FAR (submitted on August‟16 instead of November‟ 13 as directed by
UPERC). Consequently the UPERC withheld the 20% of the allowable depreciation for FY 2013-14.
During True-up of FY 2014-15, FY 2015-16 and FY 2016-17 the commission has allowed the withheld 25% depreciation, as the DISCOMs
has submitted the FAR at the time of true-up

Analysis of
internal factors

Approved distribution losses Hypothesis: Change in approved distribution losses may lead to significant reduction in electricity tariffs
Distribution loss*
• The approved distribution losses for 12 states for FY 2020-
21 varied in the range 12-18% (excluding Andhra Pradesh-
~9% and Odisha- ~21%)
Approved distribution loss (%) for licensees of 12 states for FY
2020-21 and impact on ACoS
21.2
18.4
15.9 15.5 15.0 14.0 14.0
12.9 12.2 12.0 12.0
8.8
Reduction in ACoS (Rs/kWh) on account of change in rate of
distribution loss
7.9
7.2 7.2 7.0
6.6 6.6 6.5
5.5
4.8
7.6
6.8
7.1 6.9
6.4 6.3 6.4
5.4
4.1 4.0
4.5
5.0
5.5
6.0
6.5
7.0
7.5
8.0
8.5
ACoS at approved Distribution Loss
ACoS at recommended Distribution Loss
• Reduction of approved rate of Distribution losses to 12%
would reduce ACoS by Rs. 0-0.66 /kWh/ (3%)
*Distribution loss does not include inter-state and intra-state transmission losses
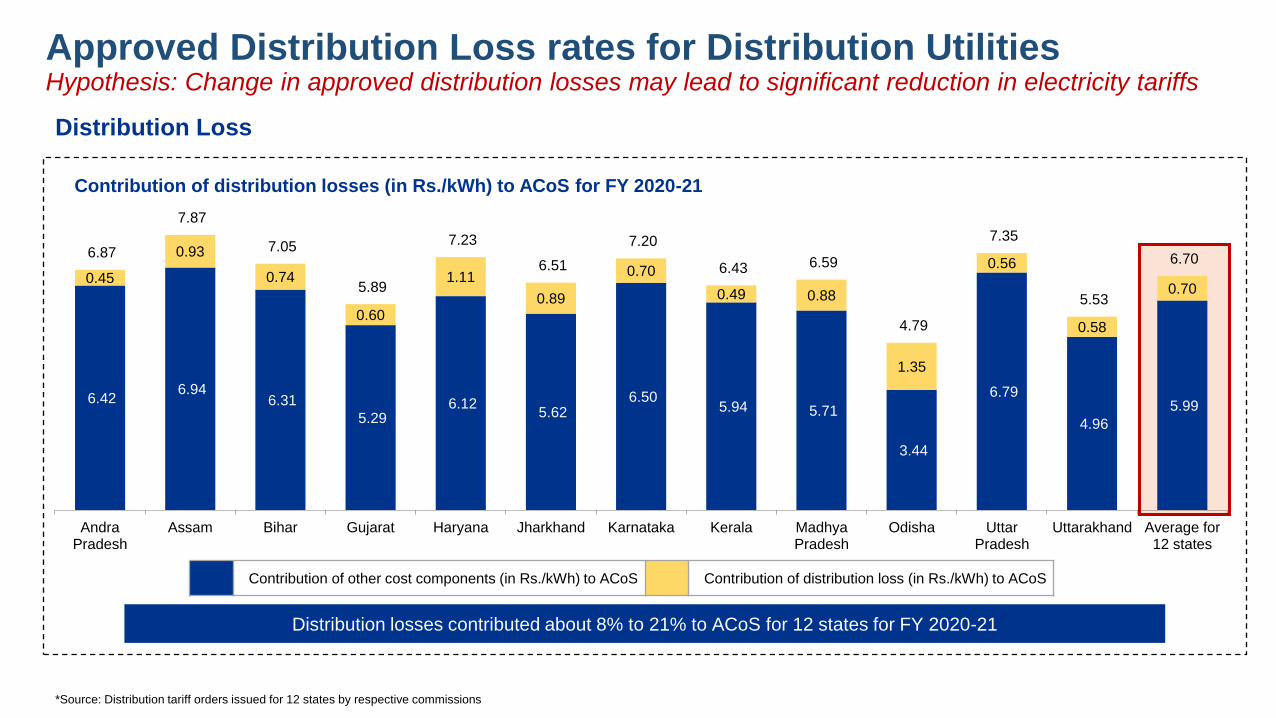
6.42 6.94
6.31
5.29 6.12
5.62 6.50
5.94 5.71
3.44
6.79
4.96
5.99
0.45
0.93
0.74
0.60
1.11
0.89
0.70
0.49 0.88
1.35
0.56
0.58
0.70
6.87
7.87
7.05
5.89
7.23
6.51
7.20
6.43 6.59
4.79
7.35
5.53
6.70
AndraPradesh
Assam Bihar Gujarat Haryana Jharkhand Karnataka Kerala MadhyaPradesh
Odisha UttarPradesh
Uttarakhand Average for12 states
Contribution of distribution losses (in Rs./kWh) to ACoS for FY 2020-21
Approved Distribution Loss rates for Distribution Utilities
Distribution Loss
Hypothesis: Change in approved distribution losses may lead to significant reduction in electricity tariffs
Distribution losses contributed about 8% to 21% to ACoS for 12 states for FY 2020-21
Contribution of other cost components (in Rs./kWh) to ACoS Contribution of distribution loss (in Rs./kWh) to ACoS
*Source: Distribution tariff orders issued for 12 states by respective commissions

1,036 940
804 767 762 718
595
483 411 374
301
O&M Expenses for distribution companies
O&M Charges
Approved O&M Expense for licensees of 12 states for FY
2020-21*
Expenditure on O&M (Rs) per 1000 units of energy
handled by DISCOMs#
*Latest available TO is used for states wherein FY21 TO is not available
1.04 0.94
0.80 0.77 0.76 0.72 0.59
0.48 0.41 0.37
0.30
16.4% 17.3%
21.3%
14.5% 12.5% 11.4% 10.4%
8.4% 7.3% 8.0% 6.1%
-6.0%
-1.0%
4.0%
9.0%
14.0%
19.0%
-
0.20
0.40
0.60
0.80
1.00
1.20
1.40
Approved Net O&M charges (Rs/kWh) O&M Charges as % of Total ARR
• Norms for approval of O&M expenses are based on
historical cost performance of individual metrics such as
total expense on lines per unit of line length created.
• Initiatives and field level best practices undertaken by better
performing states (Gujarat, Uttarakhand, etc.) might be
disseminated across states for reduction in O&M costs
#Expenditure on O&M shows a wide range of variation from Rs. 301 (Gujarat) to Rs 1,036 (Assam) per 1000 units of energy handled. This is mainly on account of variation in factors such as Number of Consumers,
Network length and expanse, HT/LT ratio and age of infrastructure .
*Source: Distribution tariff orders issued for 12 states by respective commissions
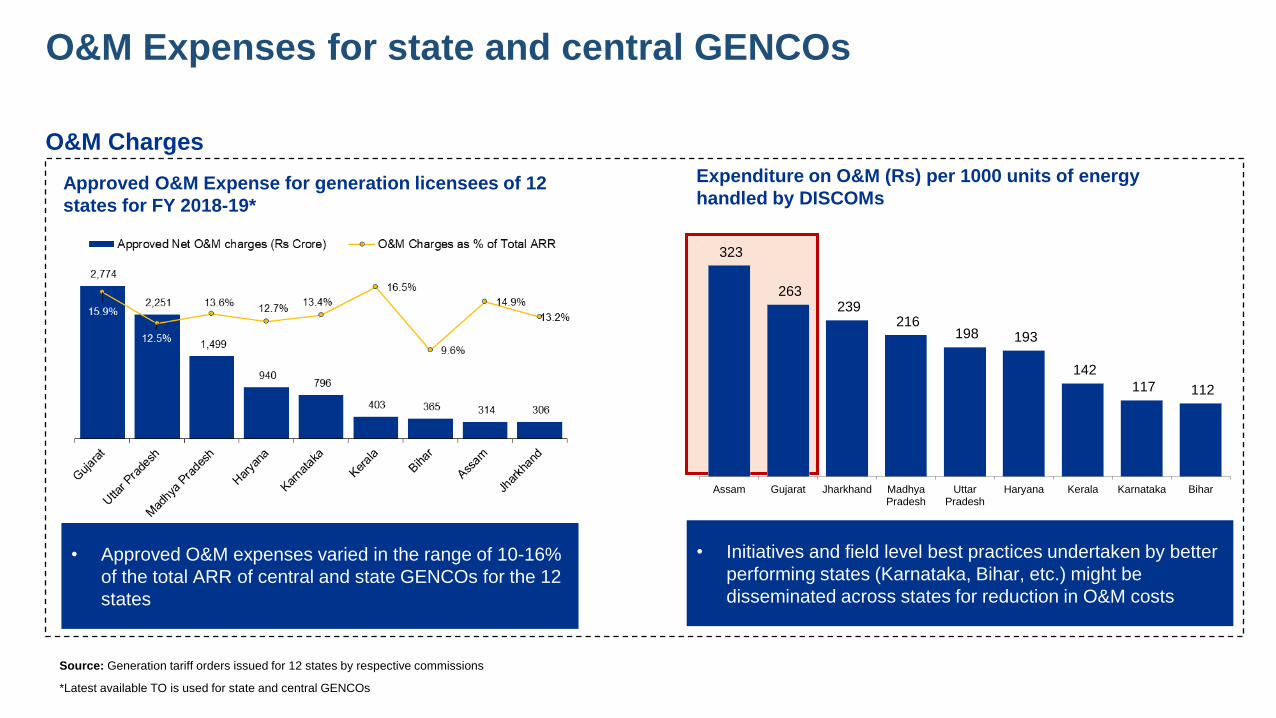
323
263 239
216 198 193
142
117 112
-
50
100
150
200
250
300
350
Assam Gujarat Jharkhand MadhyaPradesh
UttarPradesh
Haryana Kerala Karnataka Bihar
O&M Expenses for state and central GENCOs
O&M Charges
Approved O&M Expense for generation licensees of 12
states for FY 2018-19*
Expenditure on O&M (Rs) per 1000 units of energy
handled by DISCOMs
Source: Generation tariff orders issued for 12 states by respective commissions
*Latest available TO is used for state and central GENCOs
• Approved O&M expenses varied in the range of 10-16%
of the total ARR of central and state GENCOs for the 12
states
• Initiatives and field level best practices undertaken by better
performing states (Karnataka, Bihar, etc.) might be
disseminated across states for reduction in O&M costs
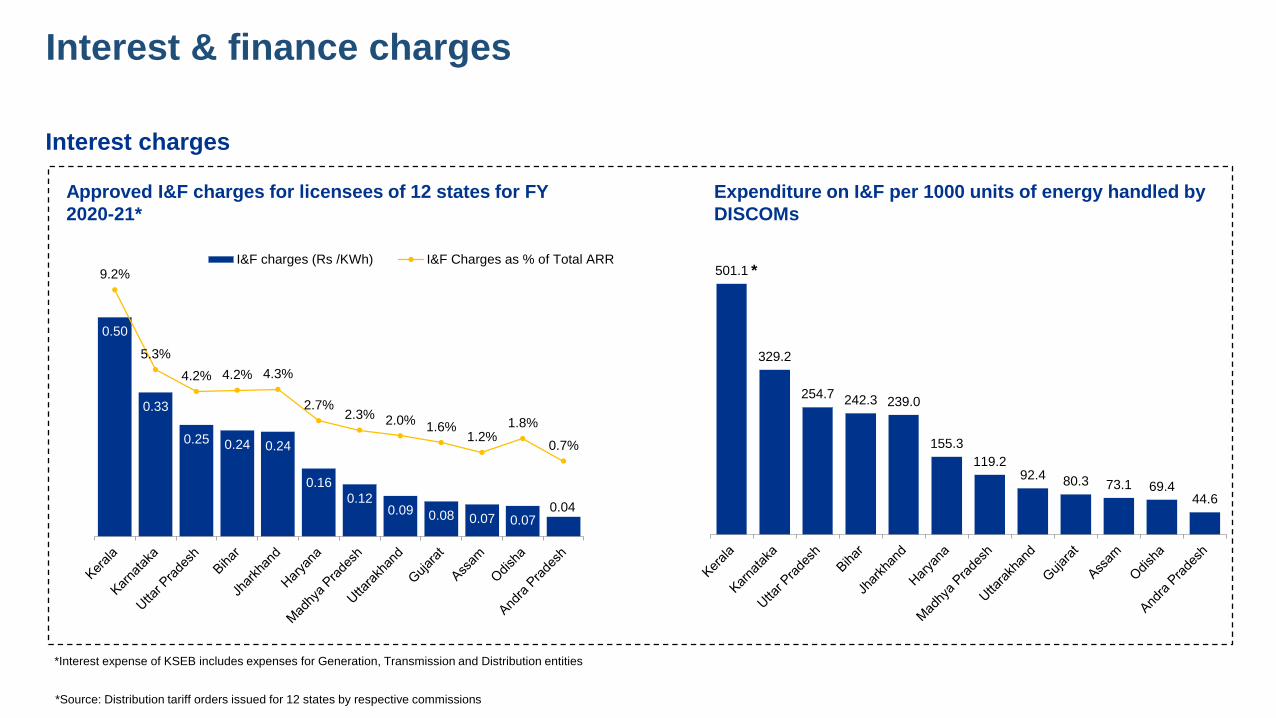
Interest & finance charges
Interest charges
Approved I&F charges for licensees of 12 states for FY
2020-21*
Expenditure on I&F per 1000 units of energy handled by
DISCOMs
*Interest expense of KSEB includes expenses for Generation, Transmission and Distribution entities
0.50
0.33
0.25 0.24 0.24
0.16
0.12 0.09 0.08 0.07 0.07
0.04
9.2%
5.3%
4.2% 4.2% 4.3%
2.7% 2.3% 2.0%
1.6% 1.2%
1.8%
0.7%
-3.0%
-1.0%
1.0%
3.0%
5.0%
7.0%
9.0%
0.00
0.10
0.20
0.30
0.40
0.50
0.60I&F charges (Rs /KWh) I&F Charges as % of Total ARR
501.1
329.2
254.7 242.3 239.0
155.3
119.2 92.4 80.3 73.1 69.4
44.6
*
*Source: Distribution tariff orders issued for 12 states by respective commissions

Other factors

Impact of retiring old coal
based TPPs & impact of
under-utilization of
generating stations
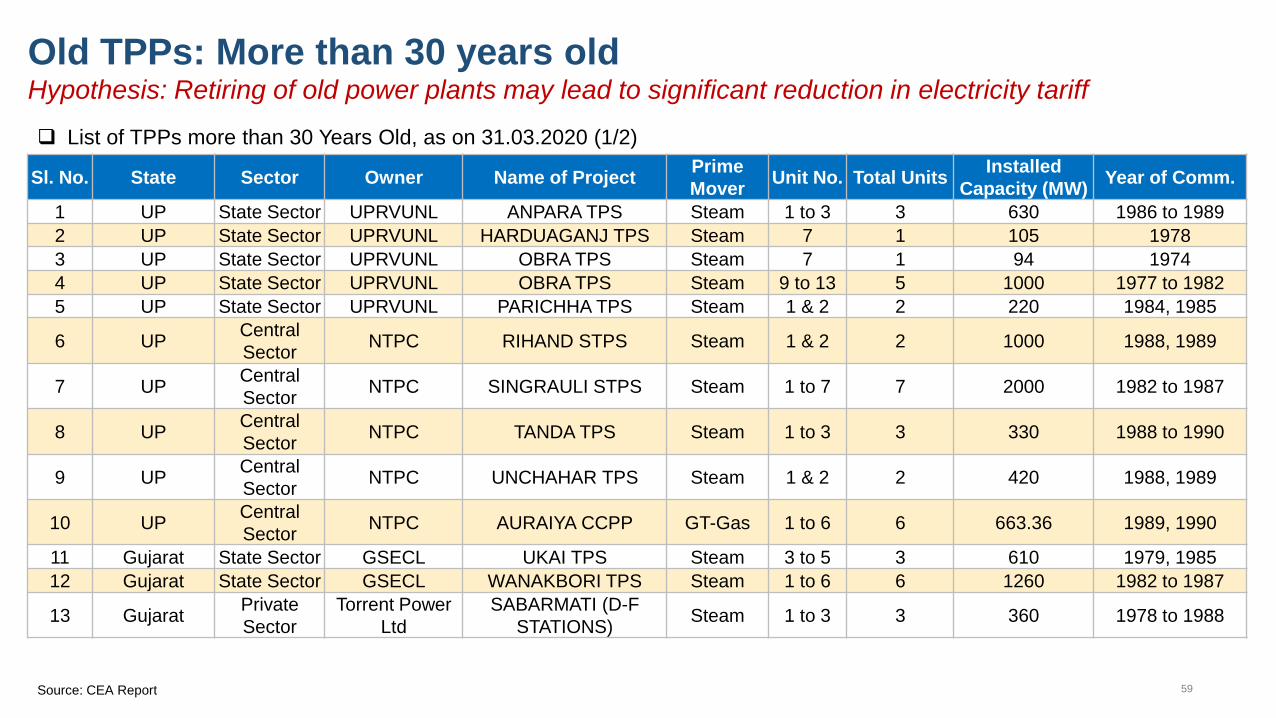
59
Old TPPs: More than 30 years old Hypothesis: Retiring of old power plants may lead to significant reduction in electricity tariff
List of TPPs more than 30 Years Old, as on 31.03.2020 (1/2)
Sl. No. State Sector Owner Name of Project Prime
Mover Unit No. Total Units
Installed
Capacity (MW) Year of Comm.
1 UP State Sector UPRVUNL ANPARA TPS Steam 1 to 3 3 630 1986 to 1989
2 UP State Sector UPRVUNL HARDUAGANJ TPS Steam 7 1 105 1978
3 UP State Sector UPRVUNL OBRA TPS Steam 7 1 94 1974
4 UP State Sector UPRVUNL OBRA TPS Steam 9 to 13 5 1000 1977 to 1982
5 UP State Sector UPRVUNL PARICHHA TPS Steam 1 & 2 2 220 1984, 1985
6 UP Central
Sector NTPC RIHAND STPS Steam 1 & 2 2 1000 1988, 1989
7 UP Central
Sector NTPC SINGRAULI STPS Steam 1 to 7 7 2000 1982 to 1987
8 UP Central
Sector NTPC TANDA TPS Steam 1 to 3 3 330 1988 to 1990
9 UP Central
Sector NTPC UNCHAHAR TPS Steam 1 & 2 2 420 1988, 1989
10 UP Central
Sector NTPC AURAIYA CCPP GT-Gas 1 to 6 6 663.36 1989, 1990
11 Gujarat State Sector GSECL UKAI TPS Steam 3 to 5 3 610 1979, 1985
12 Gujarat State Sector GSECL WANAKBORI TPS Steam 1 to 6 6 1260 1982 to 1987
13 Gujarat Private
Sector
Torrent Power
Ltd
SABARMATI (D-F
STATIONS) Steam 1 to 3 3 360 1978 to 1988
Source: CEA Report

60
Old TPPs: More than 30 years old Hypothesis: Retiring of Old Power Plants may lead to significant reduction in Electricity Tariff
List of TPPs more than 30 Years Old, as on 31.03.2020 (2/2)
Sl.
No. State Sector Owner Name of Project
Prime
Mover Unit No. Total Units
Installed Capacity
(MW)
Year of
Comm.
14 MP State Sector MPPGCL SATPURA TPS Steam 6 to 9 4 800 1979 to 1984
15 MP Central
Sector NTPC VINDHYACHAL STPS Steam 1 to 5 5 1050 1987 to 1990
16 AP State Sector APGENCO Dr. N.TATA RAO TPS Steam 1 to 4 4 840 1979 to 1990
17 Karnataka State Sector KPCL RAICHUR TPS Steam 1 & 2 2 420 1985, 1986
18 Bihar Central
Sector NTPC BARAUNI TPS Steam 6 & 7 2 210 1983
19 Bihar Central
Sector KBUNL MUZAFFARPUR TPS Steam 1 & 2 2 220 1985
20 Odisha Central
Sector NTPC TALCHER (OLD) TPS Steam 1 to 6 6 460 1967 to 1983
21 Assam State Sector APGCL NAMRUP CCPP GT-Gas 2 to 6, 8 6 99 1965 to 1985
Thermal Plants for 12 states selected for Study > 30 Years Old 12,791
Installed Capacity (MW)
Total All India Thermal + Hydro + Nuclear (MW) AS ON 31.03.2020 283,078 100%
Total All India Thermal (MW) AS ON 31.03.2020 230,600 81%
All India Thermal Plants > 30 Years Old (MW) 27,334 12%
Thermal Plants for 12 states selected for Study > 30 Years Old (MW) 12,791 6%
Source: CEA Report
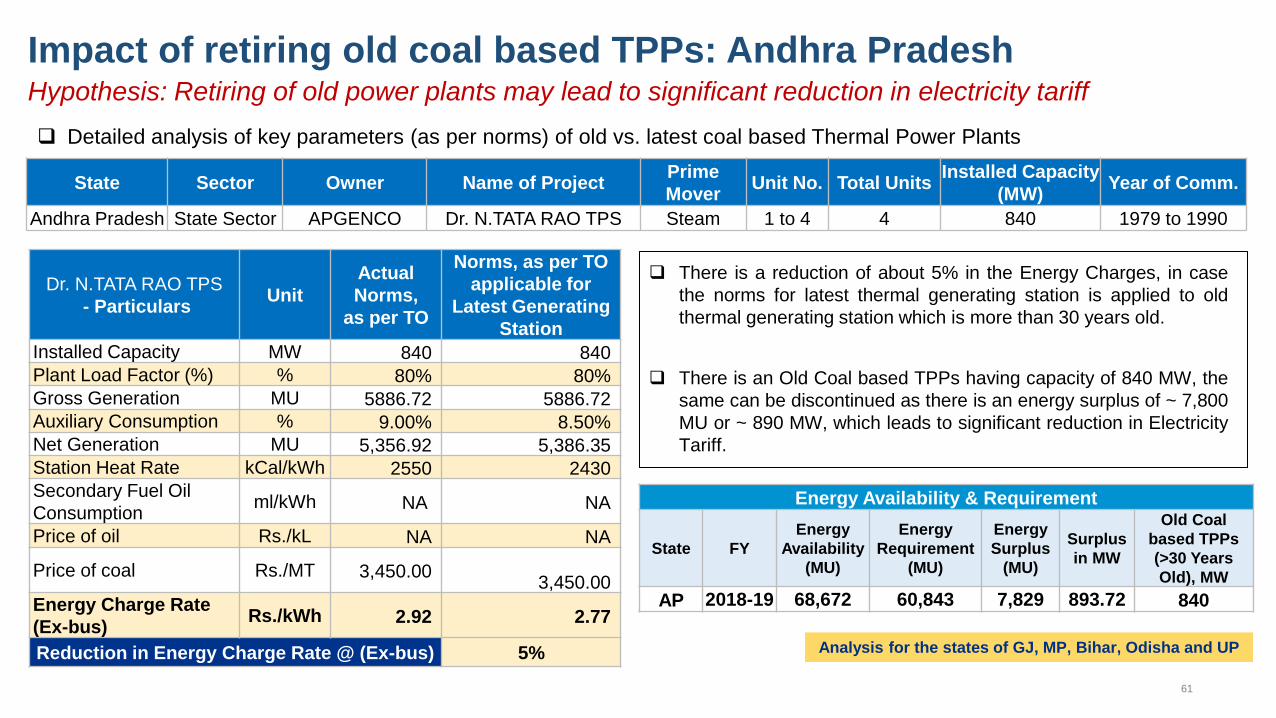
61
Impact of retiring old coal based TPPs: Andhra Pradesh Hypothesis: Retiring of old power plants may lead to significant reduction in electricity tariff
Detailed analysis of key parameters (as per norms) of old vs. latest coal based Thermal Power Plants
State Sector Owner Name of Project Prime
Mover Unit No. Total Units
Installed Capacity
(MW) Year of Comm.
Andhra Pradesh State Sector APGENCO Dr. N.TATA RAO TPS Steam 1 to 4 4 840 1979 to 1990
Dr. N.TATA RAO TPS
- Particulars Unit
Actual
Norms,
as per TO
Norms, as per TO
applicable for
Latest Generating
Station
Installed Capacity MW 840 840
Plant Load Factor (%) % 80% 80%
Gross Generation MU 5886.72 5886.72
Auxiliary Consumption % 9.00% 8.50%
Net Generation MU 5,356.92 5,386.35
Station Heat Rate kCal/kWh 2550 2430
Secondary Fuel Oil
Consumption ml/kWh NA NA
Price of oil Rs./kL NA NA
Price of coal Rs./MT 3,450.00
3,450.00
Energy Charge Rate
(Ex-bus) Rs./kWh 2.92 2.77
Reduction in Energy Charge Rate @ (Ex-bus) 5%
Energy Availability & Requirement
State FY
Energy
Availability
(MU)
Energy
Requirement
(MU)
Energy
Surplus
(MU)
Surplus
in MW
Old Coal
based TPPs
(>30 Years
Old), MW
AP 2018-19 68,672 60,843 7,829 893.72 840
There is a reduction of about 5% in the Energy Charges, in case
the norms for latest thermal generating station is applied to old
thermal generating station which is more than 30 years old.
There is an Old Coal based TPPs having capacity of 840 MW, the
same can be discontinued as there is an energy surplus of ~ 7,800
MU or ~ 890 MW, which leads to significant reduction in Electricity
Tariff.
Analysis for the states of GJ, MP, Bihar, Odisha and UP

Impact of under-
utilization of generating
stations

63
Impact of under-utilization of generating stations Hypothesis: Optimal utilization of TPPs may lead to reduction in electricity tariffs
Shortage of coal 1
Generating plants running on technical
minimum due to higher energy availability. 2
Not following Merit Order Dispatch
properly 3
Targets set by Ministry of Power for RE
procurement 4
Reason for under-utilization of generating station
Issue of coal shortage and technical minimum can be handled by retiring old coal based TPP as discussed in
previous section. States like Madhya Pradesh, Gujarat, Andhra Pradesh etc. are surplus states.
Recently, MERC has issued guidelines for operation of Merit Order Dispatch under availability-based tariff
order. Other states can examine the same in their state as per their Energy Gap scenario. Detailed regarding
the guidelines issued by MERC are provided in subsequent slides. Proper implementation of MOD can improve
the utilization of Generating Station.
Procurement of Renewable Energy is one of the reason for under-utilization of Generating Stations.
64
Maharashtra Electricity Regulatory Commission (MERC) issued guidelines for operation of Merit Order Despatch (MOD)
under availability-based tariff order. These guidelines came into effect from the month of April 2019.
The following key aspects have been identified and addressed in the guidelines:
Guidelines for Zero Schedule instructions to the Generating
Units.
Guidelines for Reserve Shut Down (RSD) instructions to
the Generating Units.
• Periodicity and date of preparation of MOD stack. • Guidelines for capacity declaration by Generating units
• Basis of preparation of MOD stack, including the variable
charge to be considered
• Identification of Must Run Stations, and guidelines for
operating Hydro Stations
• Guidelines for operating the Generating Units. • Technical Minimum of Generating Units.
Maharashtra: Merit Order Dispatch (MOD) guidelines
Other aspects:
Detailed Guidelines

Installed Capacity, Peak
Demand and Stranded
Capacity
Installed Capacity & Peak Demand (GW) Comparison of Region Wise Installed Capacity and Peak Demand (FY 2018-19)
In FY 2018-19, the total IC was 356 GW and the Peak Demand Met was 175 GW. Out of 356 GW IC around 78 GW is from RE which is infirm in nature
Due to less availability of fuel for Gas Stations and seasonal variations for Hydro Stations, these stations cannot be relied upon to meet the Peak Demand;
During different times of the year , there are numerous outages of Coal based Power Plants due to technical issues, no fuel availability etc.
Further , the Installed capacity of Coal Stations also include auxiliary Consumption. Hence, the entire coal based installed capacity cannot be contributed to
meet the demand;
Due to the above-mentioned issues, the total Installed Capacity is adequate to meet the Peak Demand of the country with some reserve margin
51.9
74.3
46.8
27.5
5.8
10.8
6.5 1.6
1.8
3.3
19.7
7.5
11.8
4.9
14.2
23.1
38.6
1.4
93.2
117.6
107.0
33.9
4.3
NR WR SR ER NER
Region-Wise Installed Capacity (IC) (in GW)
Coal Gas Nuclear Hydro Renewable Grand Total
64.8
58.1
49.6
23.0
3.0
37.2 41.1
35.6
16.7
1.7
NR WR SR ER NER
Region-Wise Max. and Min. Demand (in GW)
Max.Demand
Min.Demand
Total IC: 356 GW
Coal*: 201.3 GW
Gas: 24.9 GW
Nuclear: 6.8 GW
Hydro: 44.4 GW
Renewable: 77.6 GW
* Coal including Lignite and Diesel
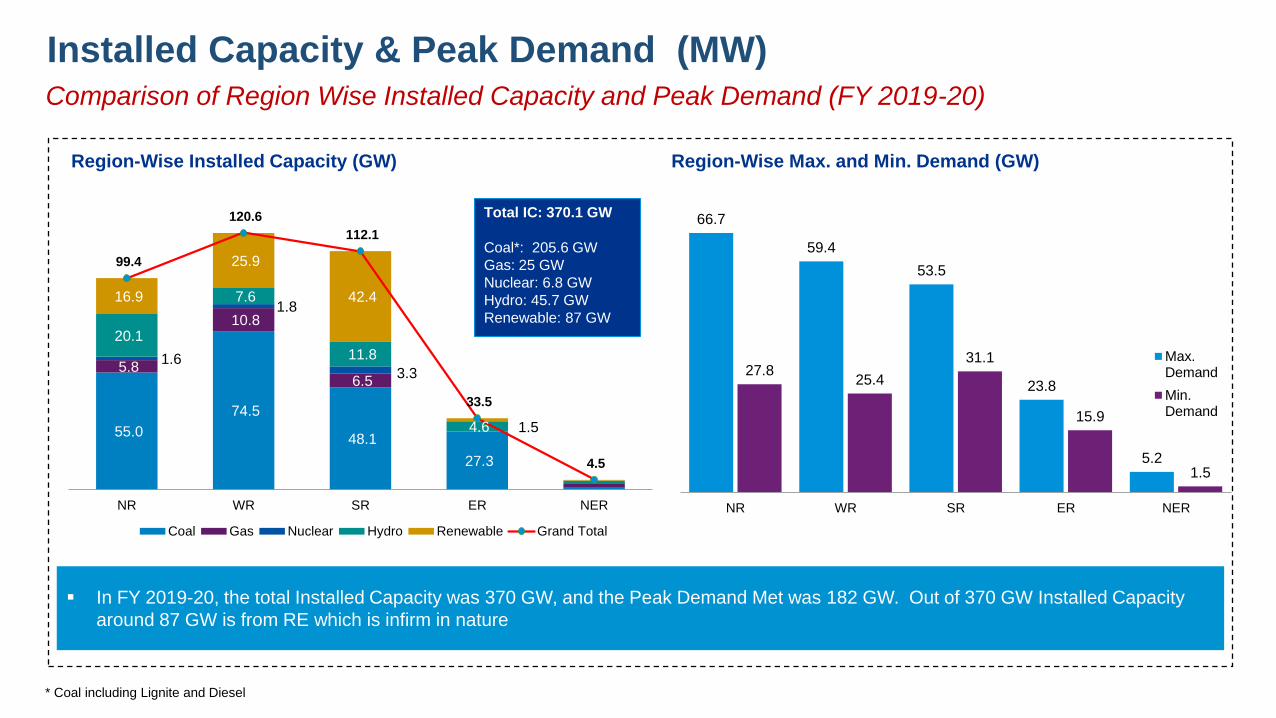
Comparison of Region Wise Installed Capacity and Peak Demand (FY 2019-20)
55.0
74.5
48.1
27.3
5.8
10.8
6.5
1.6
1.8
3.3
20.1
7.6
11.8
4.6
16.9
25.9
42.4
1.5
99.4
120.6
112.1
33.5
4.5
NR WR SR ER NER
Region-Wise Installed Capacity (GW)
Coal Gas Nuclear Hydro Renewable Grand Total
Total IC: 370.1 GW
Coal*: 205.6 GW
Gas: 25 GW
Nuclear: 6.8 GW
Hydro: 45.7 GW
Renewable: 87 GW
66.7
59.4
53.5
23.8
5.2
27.8 25.4
31.1
15.9
1.5
NR WR SR ER NER
Region-Wise Max. and Min. Demand (GW)
Max.Demand
Min.Demand
Installed Capacity & Peak Demand (MW)
* Coal including Lignite and Diesel
In FY 2019-20, the total Installed Capacity was 370 GW, and the Peak Demand Met was 182 GW. Out of 370 GW Installed Capacity
around 87 GW is from RE which is infirm in nature

Compliance of new
environmental norms
69
Benchmarking of capital cost for FGD-capital cost specified by CEA
• In the Notification dated 7 December, 2015, CEA has specified an indicative capex cost
in Rs. lakh/MW for FGD installation for various unit sizes and it is discovered through
open competitive bidding for the projects already awarded
• This capex is “Base Cost” only with cost of new chimney and does not include Taxes-
Duties and IDC
• CEA has specified that the Base Cost may further vary as per the following conditions:
– Increase in no. of Units will reduce the capex because of common facilities.
– Range of SO2 removal
– Chimney Layout such as using existing chimney as wet stack, new wet stack with
single or multi flue cans, Chimney above absorber, provision of temporary chimney
for making existing chimney operational and chimney material
– Choice of Corrosion protection lining in chimney, absorber and other sections of
FGD.
• Also, the cost may further come down in future due to increased number of
vendors/suppliers as the market matures.
FGD Base Cost specified by CEA
Capacity Group
(MW)
CAPEX
(Rs. Lakh/MW)
210 45
250
300 43.5
500 40.5
525
600 37
660
800 30
830

Benchmarking of capital cost for FGD- capital cost considered by
CERC/SERCs
• For benchmarking of FGD cost, the cost estimates
projected by the other generating stations for
installing FGD system may be referred as shown in
the Table
• CERC has considered the Capital Cost range of Rs.
43 to 75 lakh/MW for various Central generating
stations
• MERC has considered the Capital Cost of Rs. 65
lakh/MW for Tiroda TPS
• UPERC has considered the Capital Cost of Rs. 1.29
Crore/MW for Rosa plant
Cost specified by CSE
• The Centre of Science and Environment (CSE),
New Delhi, in its publication on the conference titled
„New Environmental Norms: The Way Forward‟ held
on 7 September, 2016 cited the cost of FGD as Rs.
50 to 60 lakh/MW.
Total Cost including Taxes and IDC
Sr.
No.
Name of
Generating Station
Installed
Capacity Estimated Cost Reference
1
Vindhyachal Super
Thermal Power
Station Stage V
500 MW Rs. 201.30
Crore
Rs. 0.40
Crore/MW
CERC Order dated
31.08.2016 in Petition
No. 234/GT/2015
2 Rosa Power Supply
Company Ltd. 1200 MW
Rs. 1550.50
Crore
Rs. 1.29
Crore/MW
UPERC Order dated
25.05.2017 in Petition
No. 1132 of 2016
3 Maithon Power Ltd. 1050 MW Rs. 777.14
Crore
Rs. 0.74
Crore/MW
CERC Order dated
11.11.2019 in Petition
No. 152/MP/2019
4
Bongaigaon
Thermal Power
Station Unit 1
250 MW Rs. 108
Crore
Rs. 0.43
Crore/MW
CERC Order dated
22.05.2017 in Petition
No. 45/GT/2016
`5 Udupi Thermal
Power Station 1200 MW
Rs.899
Crore
Rs. 0.75
Crore/MW
CERC Order dated
20.11.2019 in Petition
No. 346/MP/2018
6
Adani Power
Maharashtra Ltd-
Tiroda TPS
3300 MW Rs. 2159
Crore
Rs. 0.65
Crore/MW
MERC Order dated
06.02.2019 in Case
No. 300 of 2018
7. Sasan Power
Limited 3960 MW
Rs. 2434
Crore
Rs. 0.615
Crore/ MW
CERC Order dated
23.04.2020 in Petition
No. 446/MP/2019
Total Cost in range of Rs 40-75 lakh/MW may be considered for evaluating DPRs by SERCs
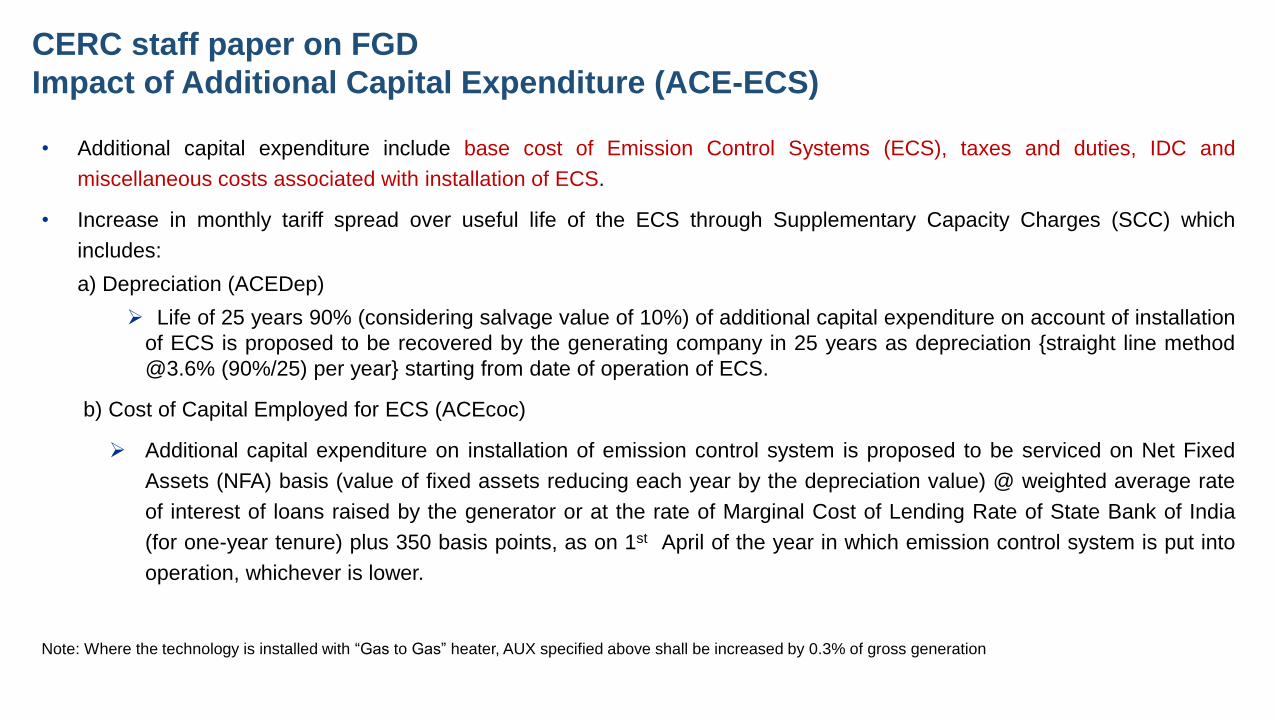
CERC staff paper on FGD
Impact of Additional Capital Expenditure (ACE-ECS)
• Additional capital expenditure include base cost of Emission Control Systems (ECS), taxes and duties, IDC and
miscellaneous costs associated with installation of ECS.
• Increase in monthly tariff spread over useful life of the ECS through Supplementary Capacity Charges (SCC) which
includes:
a) Depreciation (ACEDep)
Life of 25 years 90% (considering salvage value of 10%) of additional capital expenditure on account of installation
of ECS is proposed to be recovered by the generating company in 25 years as depreciation {straight line method
@3.6% (90%/25) per year} starting from date of operation of ECS.
b) Cost of Capital Employed for ECS (ACEcoc)
Additional capital expenditure on installation of emission control system is proposed to be serviced on Net Fixed
Assets (NFA) basis (value of fixed assets reducing each year by the depreciation value) @ weighted average rate
of interest of loans raised by the generator or at the rate of Marginal Cost of Lending Rate of State Bank of India
(for one-year tenure) plus 350 basis points, as on 1st April of the year in which emission control system is put into
operation, whichever is lower.
Note: Where the technology is installed with “Gas to Gas” heater, AUX specified above shall be increased by 0.3% of gross generation
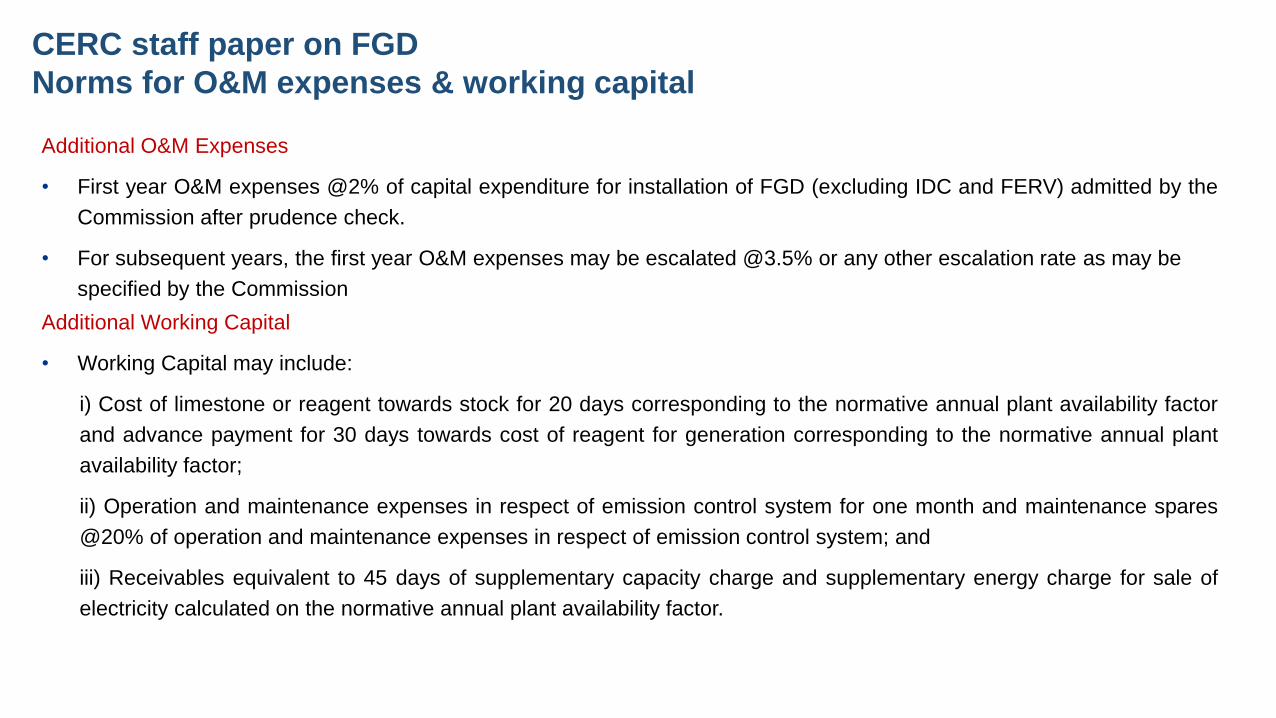
CERC staff paper on FGD
Norms for O&M expenses & working capital
Additional O&M Expenses
• First year O&M expenses @2% of capital expenditure for installation of FGD (excluding IDC and FERV) admitted by the
Commission after prudence check.
• For subsequent years, the first year O&M expenses may be escalated @3.5% or any other escalation rate as may be
specified by the Commission
Additional Working Capital
• Working Capital may include:
i) Cost of limestone or reagent towards stock for 20 days corresponding to the normative annual plant availability factor
and advance payment for 30 days towards cost of reagent for generation corresponding to the normative annual plant
availability factor;
ii) Operation and maintenance expenses in respect of emission control system for one month and maintenance spares
@20% of operation and maintenance expenses in respect of emission control system; and
iii) Receivables equivalent to 45 days of supplementary capacity charge and supplementary energy charge for sale of
electricity calculated on the normative annual plant availability factor.

CERC staff paper on FGD
Auxiliary consumption
Auxiliary consumption
Note: Where the technology is installed with “Gas to Gas” heater, AUX specified above shall be increased by 0.3% of gross generation
Name of Technology AUX (as % of Gross Generation)
a) Wet Limestone based FGD system (without Gas to Gas
heater ) 1.0%
b) Lime Spray Dryer or Semi dry FGD System 1.0%
c) Dry Sorbent Injection System (using Sodium bicarbonate) NIL
d) For CFBC Power plant (furnace injection) NIL
e) Sea water based FGD system (without Gas to Gas heater ) 0.7%

Estimated impact on tariff
• Impact on tariff on account of Wet Limestone based
FGD has been computed for a sample 3*500 MW of
Thermal Power Project
• For impact of tariff, capital cost of Rs. 800.23 Crore (Rs
0.53 Lakh/MW) has been considered based on CEA
specified base cost of Rs. 40.5 Lakh/MW for 500 MW
Unit size and additional cost of Taxes-Duties and IDC
• Operation of plant has been considered for 25 years
• The total per unit Levelized Tariff Impact for 25 years
works out to be around Rs. 0.247/kWh
S. No. Tariff Component Levelized Tariff for
25 years (Rs./kWh)
1
Differential energy charge
(for additional Aux. cons.
due to FGD)
0.034
2 Limestone cost 0.098
A Variable cost 0.132
3 O&M cost 0.015
4 Interest on debt 0.034
5 Depreciation 0.035
6 Return on equity 0.027
7 IoWC 0.004
B Fixed cost 0.115
C Total Impact on Tariff
(A+B) 0.247
Impact on Tariff (Rs./kWh)
Tentative levelized Tariff Impact of around 20-30 paise/kWh may be considered by SERCs for evaluating DPRs

Phasing of FGD as per CEA concept paper
• CEA, in its Paper on “Plant Location Specific Emission Standards”
has observed that there should be graded action plan for adopting
new emission norms for TPS rather than adopting a single
deadline for large base of power plants across the country
• CEA recommended that Phasing of FGD Installation should be
done based on Ambient Air Quality (AAQ) and SO2 Levels in that
location
• CEA proposed to implement FGD for the thermal power plants
region-wise as given in the table:
a) In areas where the development is high, the atmospheric air
quality is poor and is prone to serious atmospheric pollution
problems, strict control of emissions shall be required in such
key areas for TPS as categorised under Region 1.
b) In next phase may be after one year commissioning of 1st
phase units, observing the effectiveness of installed
equipment, to be implemented in the power plant which are
located under Region 2
c) Presently no action is required for power plant those are
situated under Region 3,4 & 5
Phasing of FGD Installation based on Ambient
Air Quality SO2 Levels
Region Ambient Air SO2
Levels Remarks
1 Level - I
(>40μg/m3)
FGD shall be installed
immediately
2
Level-II
(>30μg/m3
&≤40μg/m3)
FGD shall be installed
in 2nd phase
3
Level-III
(>20μg/m3
&≤30μg/m3)
FGD is not required at
present
4
Level-IV
(>10μg/m3
&≤20μg/m3)
FGD is not required at
present
`5 Level-V
(>0μg/m3 &≤10μg/m3)
FGD is not required at
present
Phasing of FGD may be considered as per Ambient Air Quality in vicinity of Power Plant

Impact of trading
margin on ACoS
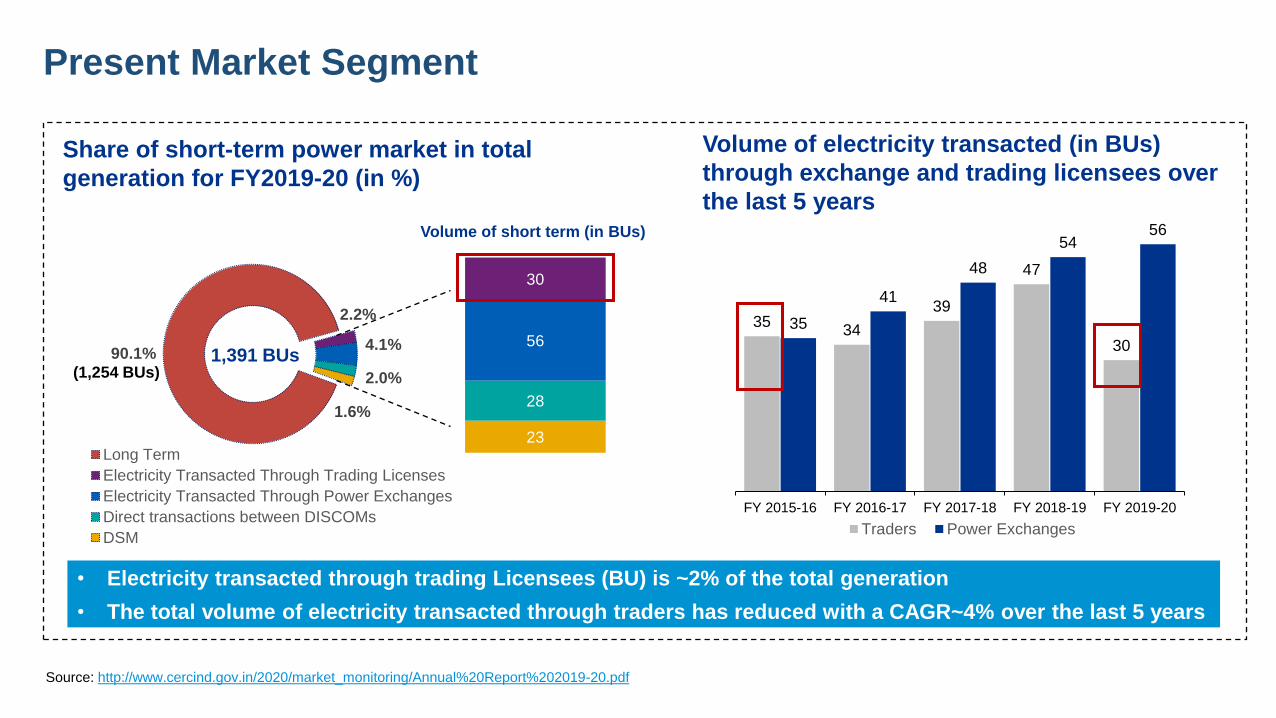
23
28
56
30
Present Market Segment
• Electricity transacted through trading Licensees (BU) is ~2% of the total generation
• The total volume of electricity transacted through traders has reduced with a CAGR~4% over the last 5 years
Source: http://www.cercind.gov.in/2020/market_monitoring/Annual%20Report%202019-20.pdf
Share of short-term power market in total
generation for FY2019-20 (in %)
Volume of electricity transacted (in BUs)
through exchange and trading licensees over
the last 5 years
90.1%
2.2%
4.1%
2.0%
1.6%
Long Term
Electricity Transacted Through Trading Licenses
Electricity Transacted Through Power Exchanges
Direct transactions between DISCOMs
DSM
1,391 BUs (1,254 BUs)
35 34
39
47
30
35
41
48
54 56
FY 2015-16 FY 2016-17 FY 2017-18 FY 2018-19 FY 2019-20
Traders Power Exchanges
Volume of short term (in BUs)
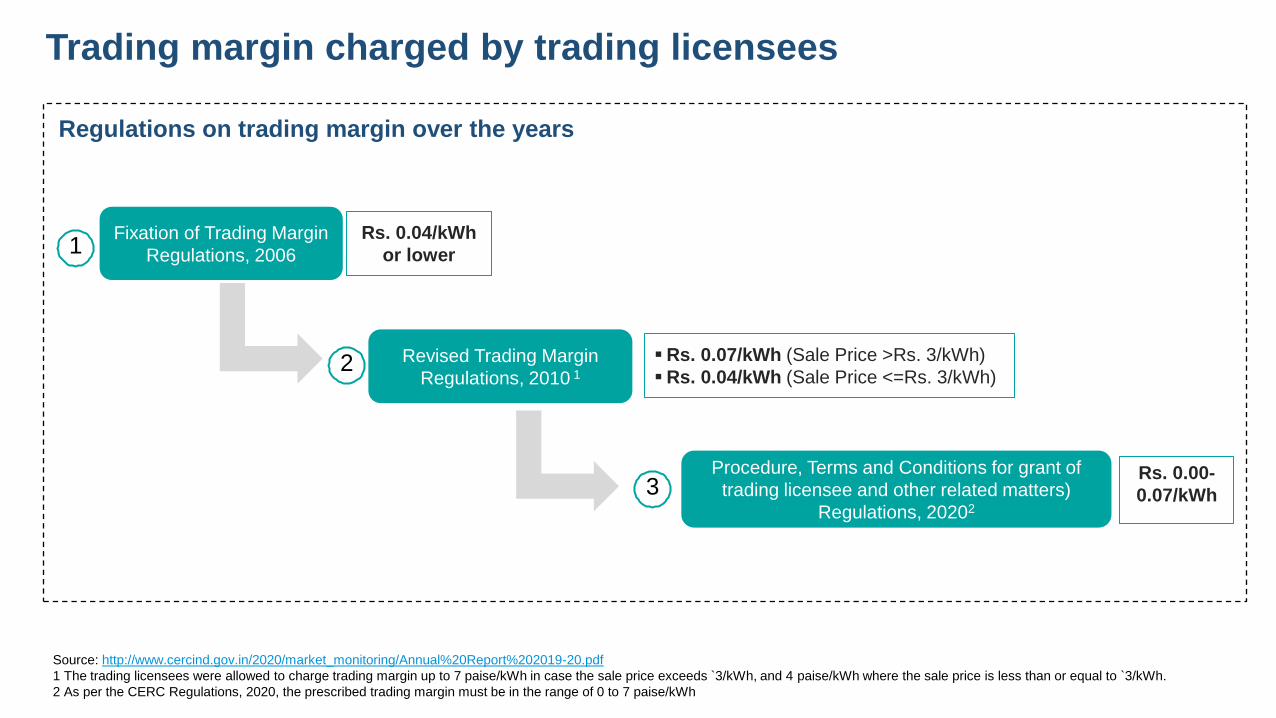
Trading margin charged by trading licensees
Source: http://www.cercind.gov.in/2020/market_monitoring/Annual%20Report%202019-20.pdf
1 The trading licensees were allowed to charge trading margin up to 7 paise/kWh in case the sale price exceeds `3/kWh, and 4 paise/kWh where the sale price is less than or equal to `3/kWh.
2 As per the CERC Regulations, 2020, the prescribed trading margin must be in the range of 0 to 7 paise/kWh
Fixation of Trading Margin
Regulations, 2006
Rs. 0.04/kWh
or lower
Revised Trading Margin
Regulations, 2010 1
Rs. 0.07/kWh (Sale Price >Rs. 3/kWh)
Rs. 0.04/kWh (Sale Price <=Rs. 3/kWh)
Procedure, Terms and Conditions for grant of
trading licensee and other related matters)
Regulations, 20202
Rs. 0.00-
0.07/kWh
1
2
3
Regulations on trading margin over the years

Trading margin charged by trading licensees
Average trading margin (in Rs./kWh) charged
by trading licensees starting 2009-10
Reduction in trading margin by Rs. 0.02/kWh would only
reduce the ACoS by Rs 0.001/kWh/ (0.01%)
Parameter Value
Total volume transacted through trading
licensees for FY20 (BUs) 30
Total contribution of trading margin for FY20
(Rs. Crore) 93
Impact of Rs. 0.01/kWh reduction in trading
margin (in Rs. Crore) 30
Impact of Rs. 0.02/kWh reduction in trading
margin (in Rs. Crore) 60
0.04
0.05 0.05
0.041
0.035
0.038
0.032 0.032 0.031
0.032 0.031
2009-10 2010-11 2011-12 2012-13 2013-14 2014-15 2015-16 2016-17 2017-18 2018-19 2019-20
Over the last 5 years, trading margin has
remained low (~3 paise/kWh) owing to
competition
Source: http://www.cercind.gov.in/2020/market_monitoring/Annual%20Report%202019-20.pdf
Average trading margin charged by trading licensees has
varied in the range of Rs. 0.05-0.03/kWh over last 10 years
Impact of reduction of trading margin
(in Rs. Crore)

Conclusion
Power purchase cost
o PPC accounts for ~67% to 78% of the total ACoS.
o Share of PPC in ACoS has reduced over the last 4 years, mainly due to increase in contribution of other cost components
(such as O&M, interest & finance, depreciation, etc.)
o Fixed charges contribute around 25-40% whereas energy charges contribute around 60-70% to the overall PPC
Coal prices
o Coal price accounts for around 25% of landed cost of
fuel.
o Coal prices (in last 4 yrs.) were about 28%1 higher as
compared to the price based on WPI and wt. avg. of
WPI and CPI.
Railway freight
o Rail freight accounts for ~40% of landed cost of fuel
o Railway freight (in last 4 yrs.) was about ~30%2
higher as compared to freight based on WPI and wt.
avg. of WPI and CPI.
Clean Energy Cess
o Clean energy cess has increased from Rs. 50/Tonne
in 2010 to Rs. 400/Tonne in 2016.
o Reduction of clean energy cess by Rs 50/MT may
reduce the ACoS by around 3 paise per unit
Change in GCV
o Every 100 kcal/kg loss in GCV results in ~3%
increase in energy charges
1 Actual coal prices compared to coal prices based on WPI and wt. avg. of WPI & CPI during Jan‟ 2018 2 Actual railway freight compared to freight based on WPI and wt. avg. of WPI & CPI during Nov‟ 2018

Conclusion
Depreciation
o Depreciation (for G, T & D utilities) accounted for
6% of the total ARR in FY 2020-21 for 12 states.
o Reduction of depreciation rate to 4.67% and
4.34% may reduce ACoS by Rs. 0.08kWh (1.2%)
and Rs. 0.10kWh (1.4%) respectively
ROE
o ROE (for G, T & D utilities) accounted for 5% of the
total ARR in FY 2020-21 for 12 states.
o Reduction of approved rate of ROE to 14% and 12%
may reduce ACoS by Rs. Rs. 0.02/kWh (0.4%) and
0.07/kWh (1.0%) respectively
Distribution loss
o Approved distribution losses accounted for ~8% -
21% of ACoS for 12 states for FY 2020-21.
o Reduction of approved Distribution losses to 12%
would reduce ACoS by Rs. 0.00-0.66/kWh (3%).
Transmission charges
o Inter-state transmission capacity has increased based
on projected demand.
o Inter-state transmission charges have increased @
CAGR of 17% in last 10 years
o Competitive bidding has resulted in ~ 45-50% reduction
in transmission charges
Other factors
o Retiring of inefficient old thermal power plants (>30 years old) may reduce energy charges by 4-23%,
o Merit Order Dispatch (MOD) Guidelines issued by MERC Maharashtra allows for “zero” scheduling of thermal power plants

Thank You
Contact Details
Udit Mathur
Energy Adviser
Foreign, Commonwealth & Development Office
Anish De
Programme Director - Power Sector Reforms Programme
KPMG India
https://psrindia.com/ https://twitter.com/psr_india www.facebook.com/PSR-India-122338261759998/
0.89
1.10
0.76
0.98
0.44
0.28 0.25 0.33
0.46 0.53
0.41
0.57
2016-17 2017-18 2018-19 2019-20
Uttarakhand: Transmission Charges* (Rs./kWh)
Inter-State TC (Rs./kWh) Intra-State TC (Rs./kWh) Total TC (Rs./kWh)
-9%
7%
CAGR
3%
Inter & Intra-State Transmission Charges (Rs. Crore & Rs./kWh) Change in Transmission Cost over the last 4 years
The share of inter-state transmission charges has increased in last
4 years whereas the share of intra-state transmission charges
remain constant.
385 506
388 510
271
253
209
266
2016-17 2017-18 2018-19 2019-20
Uttarakhand: Transmission Charges (Rs. Crore)
Inter-State TC Intra-State TC
-1%
10%
CAGR
Per unit inter-state TC has increased over the last 4 years whereas the
per unit intra-state TC has reduced.
Source: Tariff orders issued by respective state commissions for the last 4 years;
*Inter-state TC per unit is computed based on energy procured from ISGS and intra-state TC per unit is computed based on power procured from plants within the state

Inter & Intra-State Transmission Charges (Rs. Crore & Rs./kWh)
Source: Tariff orders issued by respective state commissions for the last 4 years;
*Inter-state TC per unit is computed based on energy procured from ISGS and intra-state TC per unit is computed based on power procured from plants within the state
Change in Transmission Cost over the last 4 years
The share of intra-state transmission charges has increased in last 4
years whereas the share of inter-state transmission charges remain
constant.
1,477 1,406 1,412 1,532
2,252 2,532 2,750 2,754
2016-17 2017-18 2018-19 2019-20
Madhya Pradesh: Transmission Charges (Rs. Crore)
Inter-State TC Intra-State TC
7%
1%
CAGR
Per unit inter-state TC has reduced over the last 4 years whereas the
per unit intra-state TC has increased
0.93 0.95
0.84 0.77
0.32 0.34 0.37 0.35 0.44 0.44 0.46 0.44
2016-17 2017-18 2018-19 2019-20
Madhya Pradesh: Transmission Charges* (Rs./kWh)
Inter-State TC (Rs./kWh) Intra-State TC (Rs./kWh) Total TC (Rs./kWh)
CAGR
3%
-6%
0%

Inter & Intra-State Transmission Charges (Rs. Crore & Rs./kWh) Change in Transmission Cost over the last 4 years
The share of Inter-State transmission charges has increased @ 24%
CAGR in last 4 years whereas the share of Intra-State transmission
charges has increased @ 4% CAGR only.
949 1,066 1,550 1,823
3,113 2,778
3,004
3,525
2016-17 2017-18 2018-19 2019-20
Karnataka: Transmission Charges (Rs. Crore)
Inter-State TC Intra-State TC
4%
24%
CAGR
Per unit inter-state TC has increased significantly over the last 4
years whereas the per unit intra-state TC has remained the same
0.46 0.53
0.75
0.91
0.70 0.61 0.63
0.69 0.62 0.59
0.67 0.75
2016-17 2017-18 2018-19 2019-20
Karnataka: Transmission Charges* (Rs./kWh)
Inter-State TC (Rs./kWh) Intra-State TC (Rs./kWh) Total TC (Rs./kWh)
CAGR
0%
7%
26%
0%
Source: Tariff orders issued by respective state commissions for the last 4 years;
*Inter-state TC per unit is computed based on energy procured from ISGS and intra-state TC per unit is computed based on power procured from plants within the state
0.31 0.30 0.30 0.28
1.95
1.37
1.08
1.36
0.62 0.58 0.54 0.55
2016-17 2017-18 2018-19 2019-20
Kerala: Transmission Charges* (Rs./kWh)
Inter-State TC (Rs./kWh) Intra-State TC (Rs./kWh) Total TC (Rs./kWh)
CAGR
0%
-11%
-4%
-4%
Inter & Intra-State Transmission Charges (Rs. Crore & Rs./kWh) Change in Transmission Cost over the last 4 years
The share of intra-state transmission charges has decreased in last 4
years whereas the share of inter-state transmission charges has
increased.
Per unit inter-state TC has decreased over the last 4 years whereas the
per unit intra-state TC has reduced at a higher rate
608 564 543 558
881 905 875 984
2016-17 2017-18 2018-19 2019-20
Kerala : Transmission Charges (Rs. Crore)
Inter-State TC Intra-State TC
-3%
4%
CAGR
Source: Tariff orders issued by respective state commissions for the last 4 years;
*Inter-state TC per unit is computed based on energy procured from ISGS and intra-state TC per unit is computed based on power procured from plants within the state
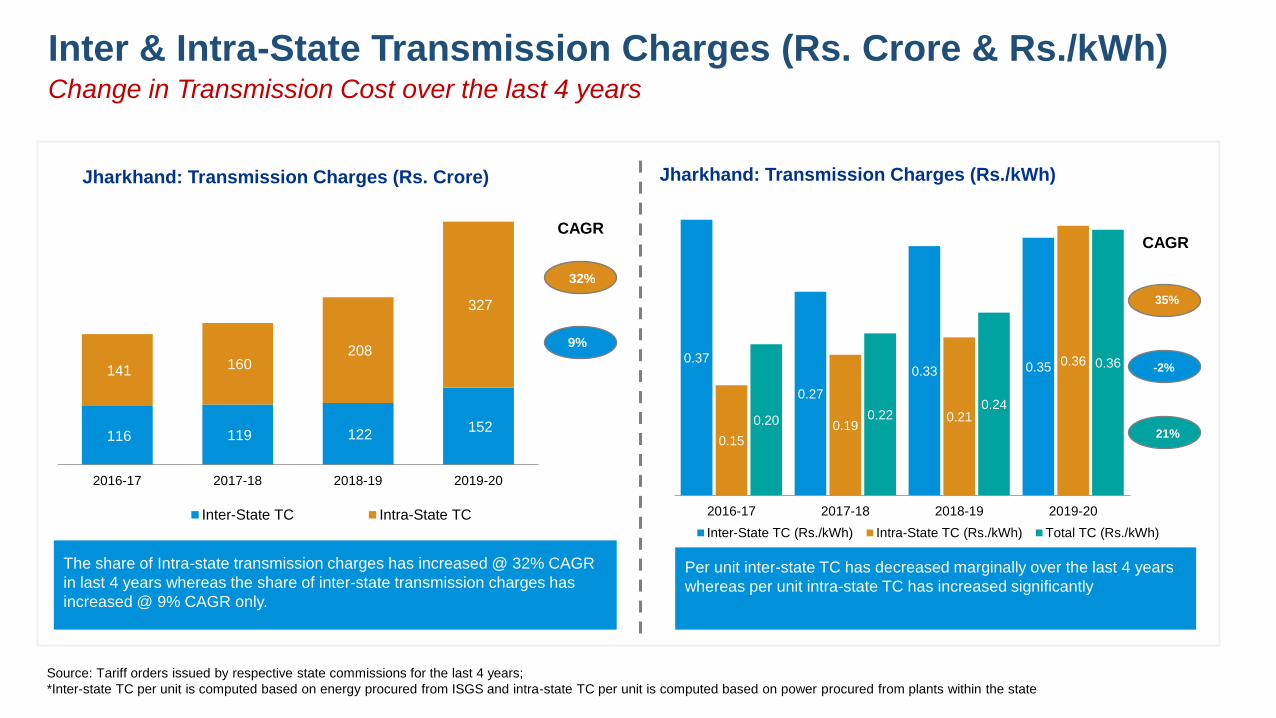
0.37
0.27
0.33 0.35
0.15 0.19
0.21
0.36
0.20 0.22 0.24
0.36
2016-17 2017-18 2018-19 2019-20
Jharkhand: Transmission Charges (Rs./kWh)
Inter-State TC (Rs./kWh) Intra-State TC (Rs./kWh) Total TC (Rs./kWh)
CAGR
0%
35%
21%
-2%
Inter & Intra-State Transmission Charges (Rs. Crore & Rs./kWh) Change in Transmission Cost over the last 4 years
The share of Intra-state transmission charges has increased @ 32% CAGR
in last 4 years whereas the share of inter-state transmission charges has
increased @ 9% CAGR only.
Per unit inter-state TC has decreased marginally over the last 4 years
whereas per unit intra-state TC has increased significantly
116 119 122 152
141 160 208
327
2016-17 2017-18 2018-19 2019-20
Jharkhand: Transmission Charges (Rs. Crore)
Inter-State TC Intra-State TC
32%
9%
CAGR
Source: Tariff orders issued by respective state commissions for the last 4 years;
*Inter-state TC per unit is computed based on energy procured from ISGS and intra-state TC per unit is computed based on power procured from plants within the state

Inter & Intra-State Transmission Charges (Rs. Crore & Rs./kWh) Change in Transmission Cost over the last 4 years
The share of intra-state transmission charges has increased in last 4
years whereas the share of inter-state transmission charges remain
constant.
530 535 526 537
295 341 381 365
2016-17 2017-18 2018-19 2019-20
Assam: Transmission Charges (Rs. Crore)
Inter-State TC Intra-State TC
7%
0%
CAGR
Per unit intra-state TC per unit and per unit inter-state TC has
decreased over the last 4 years
0.78 0.73 0.67 0.70
1.73 1.54
1.94
1.53
0.97 0.92 0.92 0.89
2016-17 2017-18 2018-19 2019-20
Assam: Transmission Charges (Rs./kWh)
Inter-State TC (Rs./kWh) Intra-State TC (Rs./kWh) Total TC (Rs./kWh)
CAGR
0%
-4%
-3%
-4%
Source: Tariff orders issued by respective state commissions for the last 4 years;
*Inter-state TC per unit is computed based on energy procured from ISGS and intra-state TC per unit is computed based on power procured from plants within the state
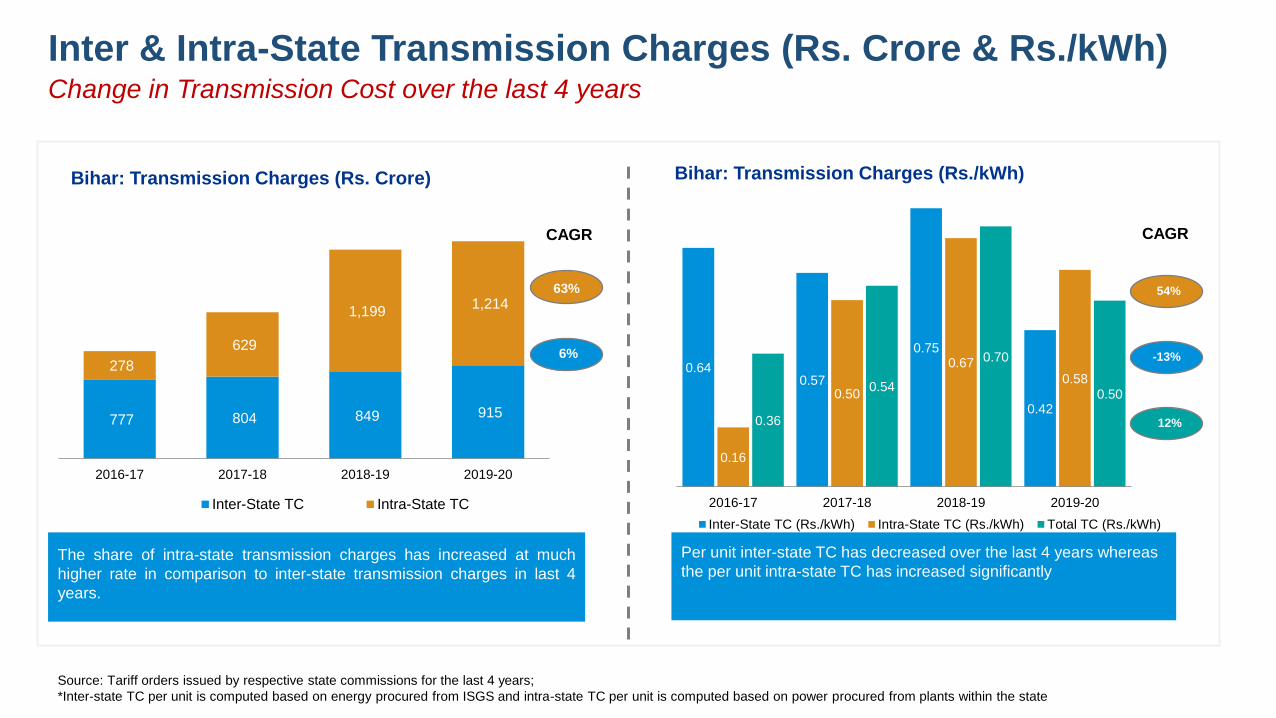
Inter & Intra-State Transmission Charges (Rs. Crore & Rs./kWh) Change in Transmission Cost over the last 4 years
The share of intra-state transmission charges has increased at much
higher rate in comparison to inter-state transmission charges in last 4
years.
777 804 849 915
278
629
1,199 1,214
2016-17 2017-18 2018-19 2019-20
Bihar: Transmission Charges (Rs. Crore)
Inter-State TC Intra-State TC
63%
6%
CAGR
Per unit inter-state TC has decreased over the last 4 years whereas
the per unit intra-state TC has increased significantly
0.64 0.57
0.75
0.42
0.16
0.50
0.67
0.58
0.36
0.54
0.70
0.50
2016-17 2017-18 2018-19 2019-20
Bihar: Transmission Charges (Rs./kWh)
Inter-State TC (Rs./kWh) Intra-State TC (Rs./kWh) Total TC (Rs./kWh)
CAGR
0%
54%
12%
-13%
Source: Tariff orders issued by respective state commissions for the last 4 years;
*Inter-state TC per unit is computed based on energy procured from ISGS and intra-state TC per unit is computed based on power procured from plants within the state
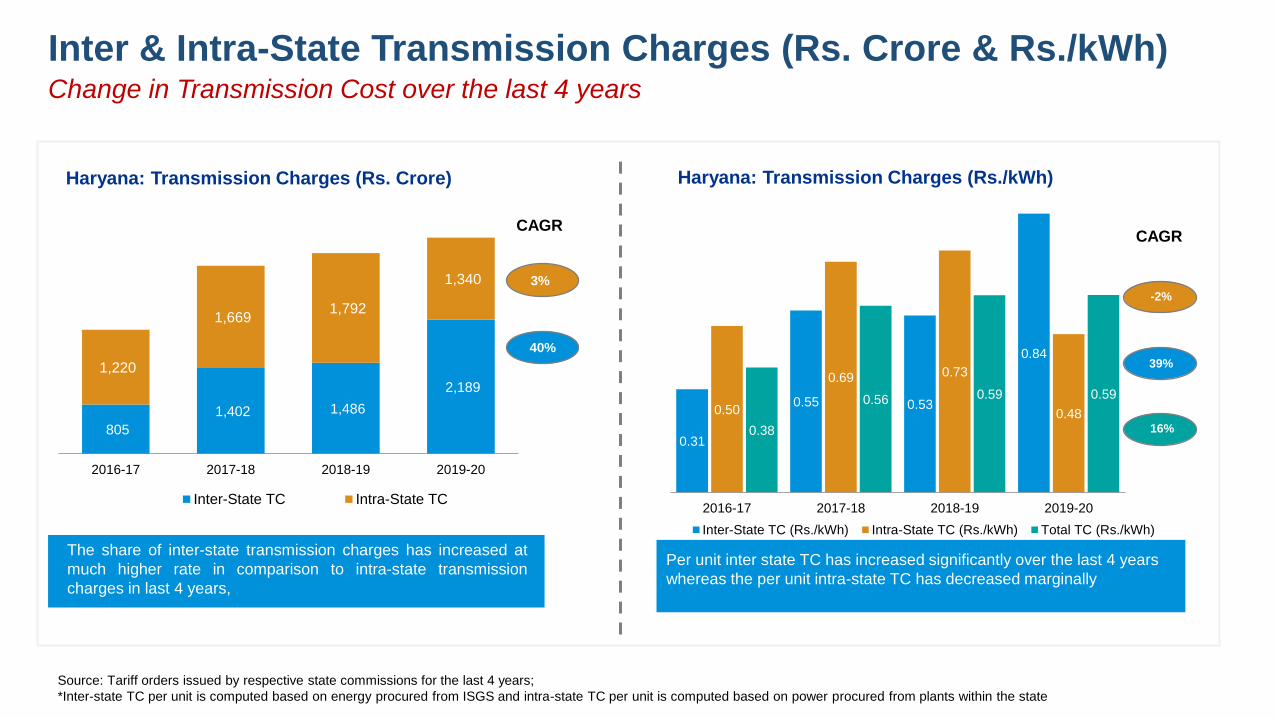
0.31
0.55 0.53
0.84
0.50
0.69 0.73
0.48
0.38
0.56 0.59 0.59
2016-17 2017-18 2018-19 2019-20
Haryana: Transmission Charges (Rs./kWh)
Inter-State TC (Rs./kWh) Intra-State TC (Rs./kWh) Total TC (Rs./kWh)
CAGR
0%
-2%
16%
39%
Inter & Intra-State Transmission Charges (Rs. Crore & Rs./kWh) Change in Transmission Cost over the last 4 years
The share of inter-state transmission charges has increased at
much higher rate in comparison to intra-state transmission
charges in last 4 years,
805
1,402 1,486
2,189
1,220
1,669 1,792
1,340
2016-17 2017-18 2018-19 2019-20
Haryana: Transmission Charges (Rs. Crore)
Inter-State TC Intra-State TC
3%
40%
CAGR
Per unit inter state TC has increased significantly over the last 4 years
whereas the per unit intra-state TC has decreased marginally
Source: Tariff orders issued by respective state commissions for the last 4 years;
*Inter-state TC per unit is computed based on energy procured from ISGS and intra-state TC per unit is computed based on power procured from plants within the state
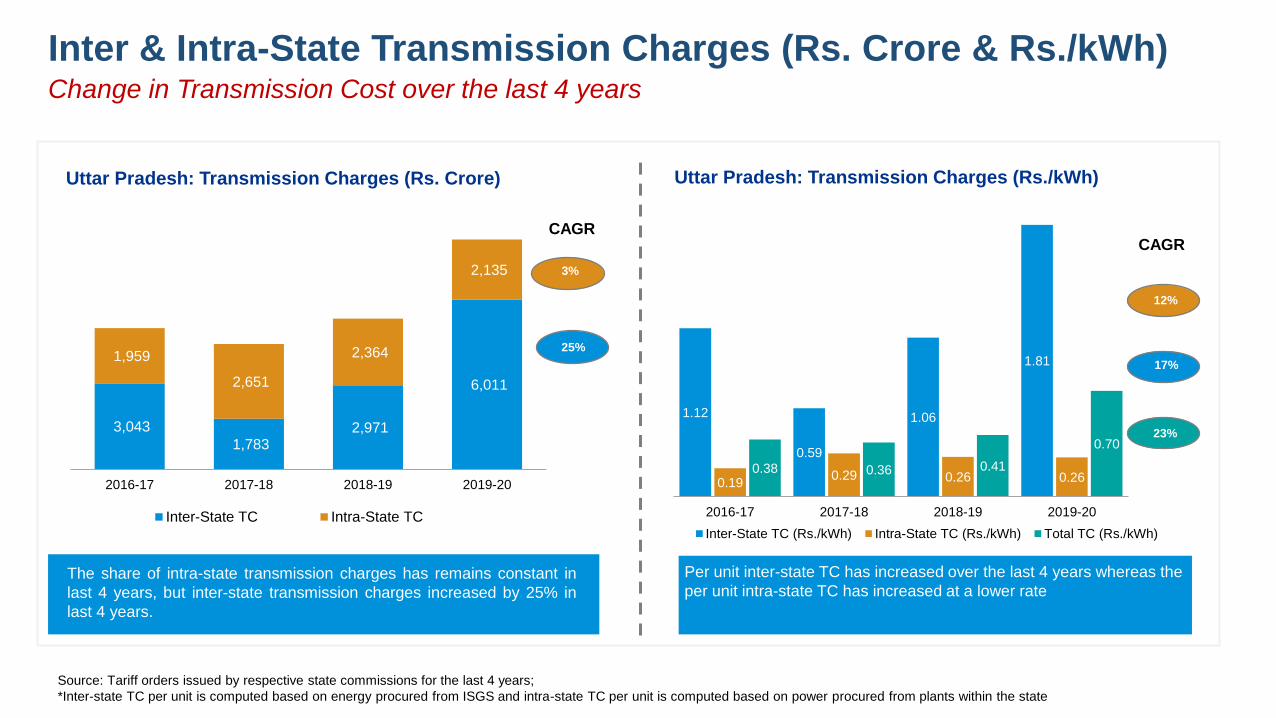
Inter & Intra-State Transmission Charges (Rs. Crore & Rs./kWh) Change in Transmission Cost over the last 4 years
The share of intra-state transmission charges has remains constant in
last 4 years, but inter-state transmission charges increased by 25% in
last 4 years.
3,043
1,783 2,971
6,011
1,959
2,651
2,364
2,135
2016-17 2017-18 2018-19 2019-20
Uttar Pradesh: Transmission Charges (Rs. Crore)
Inter-State TC Intra-State TC
3%
25%
CAGR
Per unit inter-state TC has increased over the last 4 years whereas the
per unit intra-state TC has increased at a lower rate
1.12
0.59
1.06
1.81
0.19 0.29 0.26 0.26
0.38 0.36 0.41
0.70
2016-17 2017-18 2018-19 2019-20
Uttar Pradesh: Transmission Charges (Rs./kWh)
Inter-State TC (Rs./kWh) Intra-State TC (Rs./kWh) Total TC (Rs./kWh)
CAGR
0%
12%
23%
17%
Source: Tariff orders issued by respective state commissions for the last 4 years;
*Inter-state TC per unit is computed based on energy procured from ISGS and intra-state TC per unit is computed based on power procured from plants within the state

Inter & Intra-State Transmission Charges (Rs. Crore & Rs./kWh) Change in Transmission Cost over the last 4 years
The share of inter-state transmission charges has increased at much
higher rate in comparison to intra-state transmission charges in last 4
years,
Per unit inter state TC has increased significantly over the last 4
years whereas the per unit intra-state TC has increased at a lower
rate
363 400
966
1,470 986
1,287
1,197
1,609
2016-17 2017-18 2018-19 2019-20
Andhra Pradesh: Transmission Charges (Rs. Crore)
Inter-State TC Intra-State TC
18%
59%
CAGR
0.26 0.29
0.47 0.52
0.23
0.30 0.30
0.39
0.24 0.30
0.36
0.44
2016-17 2017-18 2018-19 2019-20
Andhra Pradesh: Transmission Charges (Rs./kWh)
Inter-State TC (Rs./kWh) Intra-State TC (Rs./kWh) Total TC (Rs./kWh)
CAGR
0%
19%
23%
26%
Source: Tariff orders issued by respective state commissions for the last 4 years;
*Inter-state TC per unit is computed based on energy procured from ISGS and intra-state TC per unit is computed based on power procured from plants within the state

Inter & Intra-State Transmission Charges (Rs. Crore & Rs./kWh) Change in Transmission Cost over the last 4 years
The share of intra & inter-state transmission charges has increased @
~10% CAGR in last 4 years.
1,515 1,591 1,670 2,077
3,058 3,407
3,749
4,115
2016-17 2017-18 2018-19 2019-20
Gujarat: Transmission Charges (Rs. Crore)
Inter-State TC Intra-State TC
10%
11%
CAGR
Per unit inter state TC has remained constant over the last 4
years whereas the per unit intra-state TC has increased
0.75 0.72 0.67
0.75
0.43 0.46 0.48 0.50 0.48 0.50 0.52 0.55
2016-17 2017-18 2018-19 2019-20
Gujarat: Transmission Charges (Rs./kWh)
Inter-State TC (Rs./kWh) Intra-State TC (Rs./kWh) Total TC (Rs./kWh)
CAGR
0%
6%
5%
0%
Source: Tariff orders issued by respective state commissions for the last 4 years;
*Inter-state TC per unit is computed based on energy procured from ISGS and intra-state TC per unit is computed based on power procured from plants within the state

Approved Power Purchase Cost for 12 States (Excluding Transmission
Charges) for FY 2016-17 & FY 2017-18
Back
S No. States/UTs
2016-17
Sales (MU) PPC (Rs. Cr) PPC
(Rs/kWh)
1 Uttarakhand 11,188 4,047 3.62
2 Assam 6,684 2,909 4.35
3 Kerala 20,626 7,818 3.79
4 Bihar 19,957 10,751 5.39
5 Madhya Pradesh 48,552 18,143 3.74
6 Odisha 19,302 6,703 3.47
7 Karnataka 52,769 22,649 4.29
8 Andhra Pradesh 49,991 21,151 4.23
9 Haryana 35,981 19,436 5.40
10 Jharkhand 8,651 4,489 5.19
11 Uttar Pradesh 94,599 50,698 5.36
12 Gujarat 69,658 29,266 4.20
Total 437,958 198,060 4.52
S No. States/UTs
2017-18
Sales (MU) PPC (Rs. Cr) PPC
(Rs/kWh)
1 Uttarakhand 11,849 4,376 3.69
2 Assam 7,524 3,184 4.23
3 Kerala 21,840 7,453 3.41
4 Bihar 20,358 9,591 4.71
5 Madhya Pradesh 49,725 19,910 4.00
6 Odisha 19,775 6,969 3.52
7 Karnataka 54,699 22,776 4.16
8 Andhra Pradesh 50,077 21,491 4.29
9 Haryana 36,573 19,878 5.44
10 Jharkhand 9,223 4,859 5.27
11 Uttar Pradesh 92,094 48,017 5.21
12 Gujarat 85,962 31,215 3.63
Total 459,699 199,719 4.34

Approved Power Purchase Cost for 12 States (Excluding Transmission Charges)
for FY 2018-19 & FY 2019-20
S No. States/UTs
2018-19
Sales (MU) PPC (Rs. Cr) PPC
(Rs/kWh)
1 Uttarakhand 11,888 4,930 4.15
2 Assam 7,784 3,235 4.16
3 Kerala 21,647 7,848 3.63
4 Bihar 22,527 12,370 5.49
5 Madhya Pradesh 52,652 20,287 3.85
6 Odisha 20,448 7,190 3.52
7 Karnataka 57,180 24,739 4.33
8 Andhra Pradesh 54,932 24,565 4.47
9 Haryana 36,549 20,654 5.65
10 Jharkhand 10,197 4,644 4.55
11 Uttar Pradesh 104,380 50,604 4.85
12 Gujarat 84,580 33,043 3.91
Total 484,764 214,109 4.42
S No. States/UTs
2019-20
Sales (MU) PPC (Rs. Cr) PPC
(Rs/kWh)
1 Uttarakhand 12,938 5,176 4.00
2 Assam 7,930 3,821 4.82
3 Kerala 22,970 8,614 3.75
4 Bihar 27,512 12,875 4.68
5 Madhya Pradesh 55,638 21,718 3.90
6 Odisha 21,893 7,530 3.44
7 Karnataka 59,471 28,747 4.83
8 Andhra Pradesh 59,162 26,430 4.47
9 Haryana 41,786 21,207 5.08
10 Jharkhand 11,011 5,525 5.02
11 Uttar Pradesh 94,518 47,493 5.02
12 Gujarat 94,422 36,472 3.86
Total 509,251 225,608 4.43
Back

Estimation of national average power purchase cost data-CERC
State Data Sources for APPC estimation for FY2019-20 by CERC
Source of data for
analysis of key factors
impacting tariff
J&K No details available
PPC and transmission
charges from retail tariff
order for FY 2019-20.
Arunachal
Pradesh Tariff Order for FY 2018-19
Bihar PPC for FY2019-20 from APR order for FY 2019-20
Jharkhand*
Power Purchase and Cost for FY2019-20 from APR Order for FY 2019-20 have been considered for
JBVNL , TSL, TSUISL and DVC. For SAIL Bokaro, PPC for FY2019-20 has been considered from
MYT Order for FY 2016-17 – FY 2020-21.
Meghalaya PPC for FY2019-20 from MYT Order for Control Period FY 2018-19 to FY 2020-21
Nagaland PPC for FY2019-20 from Order on review for the FY 2019-20 (20th March 2020)
Tamil Nadu PPC for FY2018-19 from Order on Determination of Tariff for Generation and Distribution (11th
August 2017)
Telangana PPC for FY2018-19 from Tariff Order for FY 2018-19 (27th March 2018)
Tripura PPC for FY2019-20 from Order on ARR for FY 2016-17 – FY 2020-21 (1st Sep 2020)
West Bengal PPC from Tariff Orders of FY 2017-18
*For the state of Jharkhand, only JBVNL has been considered for the PPC computation.
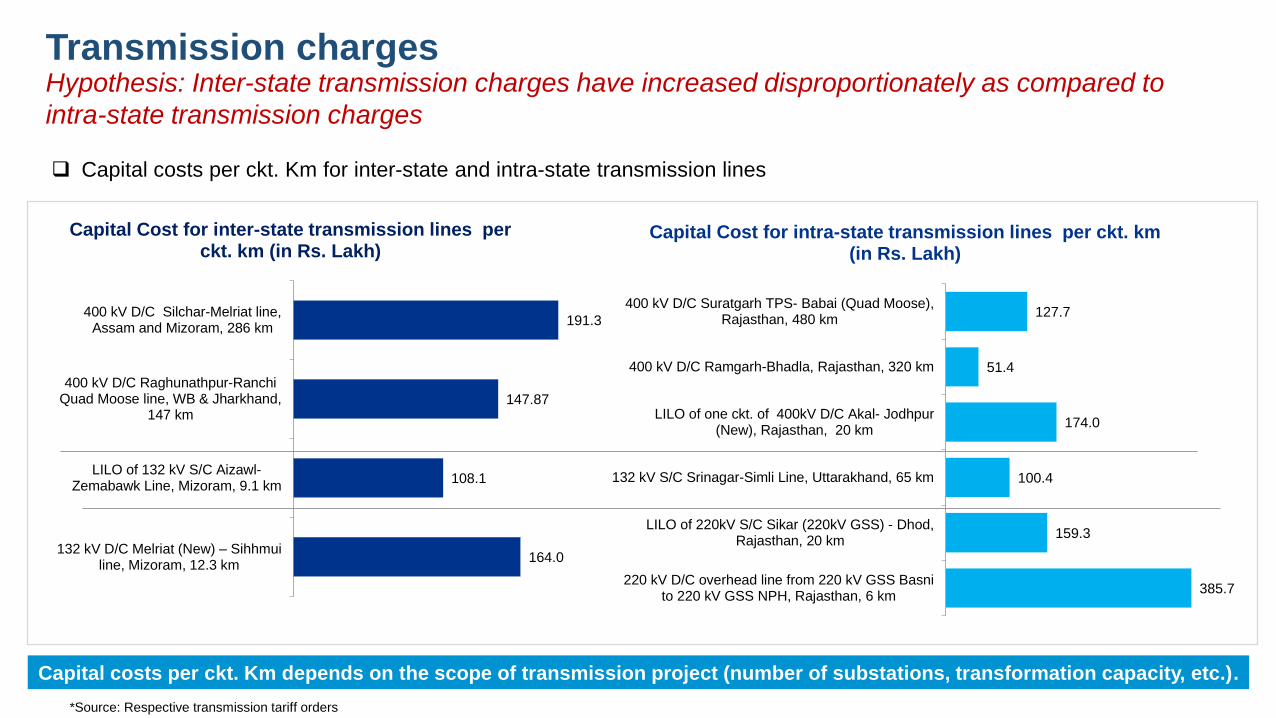
127.7
51.4
174.0
100.4
159.3
385.7
400 kV D/C Suratgarh TPS- Babai (Quad Moose),Rajasthan, 480 km
400 kV D/C Ramgarh-Bhadla, Rajasthan, 320 km
LILO of one ckt. of 400kV D/C Akal- Jodhpur(New), Rajasthan, 20 km
132 kV S/C Srinagar-Simli Line, Uttarakhand, 65 km
LILO of 220kV S/C Sikar (220kV GSS) - Dhod,Rajasthan, 20 km
220 kV D/C overhead line from 220 kV GSS Basnito 220 kV GSS NPH, Rajasthan, 6 km
Capital Cost for intra-state transmission lines per ckt. km (in Rs. Lakh)
191.3
147.87
108.1
164.0
400 kV D/C Silchar-Melriat line,Assam and Mizoram, 286 km
400 kV D/C Raghunathpur-RanchiQuad Moose line, WB & Jharkhand,
147 km
LILO of 132 kV S/C Aizawl-Zemabawk Line, Mizoram, 9.1 km
132 kV D/C Melriat (New) – Sihhmui line, Mizoram, 12.3 km
Capital Cost for inter-state transmission lines per ckt. km (in Rs. Lakh)
Transmission charges Hypothesis: Inter-state transmission charges have increased disproportionately as compared to
intra-state transmission charges
Capital costs per ckt. Km for inter-state and intra-state transmission lines
Capital costs per ckt. Km depends on the scope of transmission project (number of substations, transformation capacity, etc.).
*Source: Respective transmission tariff orders

98
Sector wise generation and inter state transmission charges
*Source: CEA monthly generation report, CERC short term market monitoring reports
Type 2011-12 2012-13 2013-14 2014-15 2015-16 2016-17 2017-18 2018-19 2019-20
Central (A) 364005 375970 384905 395110 409343 433744 449512 461125 460268
State 367953 347154 350403 366803 344995 350938 377726 401132 387966
Private 139647 184138 226245 281752 348240 369842 374290 382672 396756
Imported 5285 4795 5598 5008 5244 5617 4778 4407 5794
Grand Total 876888 912057 967150 1048673 1107822 1160141 1206306 1249337 1250784
Year FY 12 FY 13 FY 14 FY 15 FY 16 FY 17 FY 18 FY 19 FY 20
Annual Transmission charges (Rs
Cr.) (B) 8743 12797 15118 17680 22476 27838 31405 35599 39285
Per Unit transmission charges
(A/B*10) 0.24 0.34 0.39 0.45 0.55 0.64 0.70 0.77 0.85
Back
S. No. State 2017-18 2018-19 2019-20 CAGR
ACoS ABR Gap ACoS ABR Gap ACoS ABR Gap ACoS ABR
1 Andhra
Pradesh 5.54 5.54 0.00 5.88 5.88 0.00 6.06 6.06 0.00 4% 4%
2 Assam 7.42 7.35 0.07 7.35 6.68 0.67 7.05 7.05 0.00 6% 5%
3 Bihar 6.70 7.12 (0.42) 7.21 7.16 0.05 6.59 7.14 (0.55) 6% 9%
4 Gujarat 5.19 5.63 (0.44) 5.89 5.70 0.19 5.98 5.68 0.30 3% 1%
5 Haryana 5.43 5.50 (0.06) 6.10 6.13 (0.03) 5.59 5.72 (0.13) 4% 2%
6 Jharkhand 6.63 6.48 0.16 7.24 7.89 (0.65) 6.51 5.69 0.81 2% 3%
7 Karnataka 6.41 6.41 0.00 6.75 6.75 0.00 7.20 7.20 0.00 7% 7%
8 Kerala 5.05 5.53 (0.48) 6.11 6.09 0.02 6.51 6.55 (0.04) 6% 7%
9 Madhya
Pradesh 6.25 6.25 0.00 6.03 6.03 0.00 6.59 6.59 0.00 4% 4%
10 Odisha 4.69 4.70 (0.01) 4.68 4.69 (0.01) 4.77 4.77 0.00 1% 1%
11 Uttar Pradesh 6.47 5.64 0.83 6.73 5.75 0.98 7.35 6.71 0.64 4% 7%
12 Uttarakhand 4.92 4.92 0.00 5.05 5.06 (0.01) 5.28 5.32 (0.04) 4% 4%
Key Observations
While in some states like Uttar Pradesh, Gujarat and Jharkhand approved ACoS-ABR gap has been greater than 0 for the last few years,
in other states (like Haryana, Odisha, Bihar, and Kerala), the gap has been lower than 0
For states such as Karnataka, Andhra Pradesh and Uttarakhand, no ACoS-ABR gap has been approved over the years
States such as Assam, Karnataka, Bihar and Kerala have witnessed high (>6%) annual growth in ACoS over the last 3 years
ACoS ABR gap greater than 0 ACoS ABR gap lower than 0
State-wise ABR and ACoS values across the years
Back
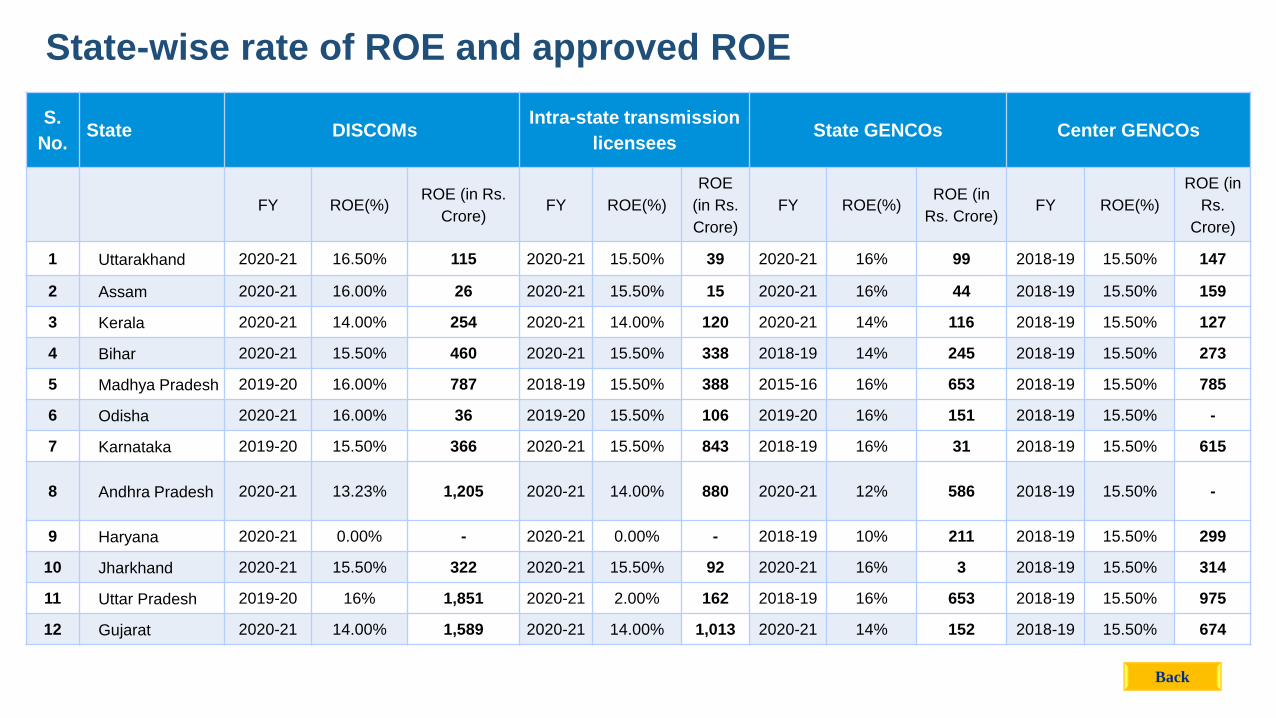
S.
No. State DISCOMs
Intra-state transmission
licensees State GENCOs Center GENCOs
FY ROE(%) ROE (in Rs.
Crore) FY ROE(%)
ROE
(in Rs.
Crore)
FY ROE(%) ROE (in
Rs. Crore) FY ROE(%)
ROE (in
Rs.
Crore)
1 Uttarakhand 2020-21 16.50% 115 2020-21 15.50% 39 2020-21 16% 99 2018-19 15.50% 147
2 Assam 2020-21 16.00% 26 2020-21 15.50% 15 2020-21 16% 44 2018-19 15.50% 159
3 Kerala 2020-21 14.00% 254 2020-21 14.00% 120 2020-21 14% 116 2018-19 15.50% 127
4 Bihar 2020-21 15.50% 460 2020-21 15.50% 338 2018-19 14% 245 2018-19 15.50% 273
5 Madhya Pradesh 2019-20 16.00% 787 2018-19 15.50% 388 2015-16 16% 653 2018-19 15.50% 785
6 Odisha 2020-21 16.00% 36 2019-20 15.50% 106 2019-20 16% 151 2018-19 15.50% -
7 Karnataka 2019-20 15.50% 366 2020-21 15.50% 843 2018-19 16% 31 2018-19 15.50% 615
8 Andhra Pradesh 2020-21 13.23% 1,205 2020-21 14.00% 880 2020-21 12% 586 2018-19 15.50% -
9 Haryana 2020-21 0.00% - 2020-21 0.00% - 2018-19 10% 211 2018-19 15.50% 299
10 Jharkhand 2020-21 15.50% 322 2020-21 15.50% 92 2020-21 16% 3 2018-19 15.50% 314
11 Uttar Pradesh 2019-20 16% 1,851 2020-21 2.00% 162 2018-19 16% 653 2018-19 15.50% 975
12 Gujarat 2020-21 14.00% 1,589 2020-21 14.00% 1,013 2020-21 14% 152 2018-19 15.50% 674
Back
State-wise rate of ROE and approved ROE
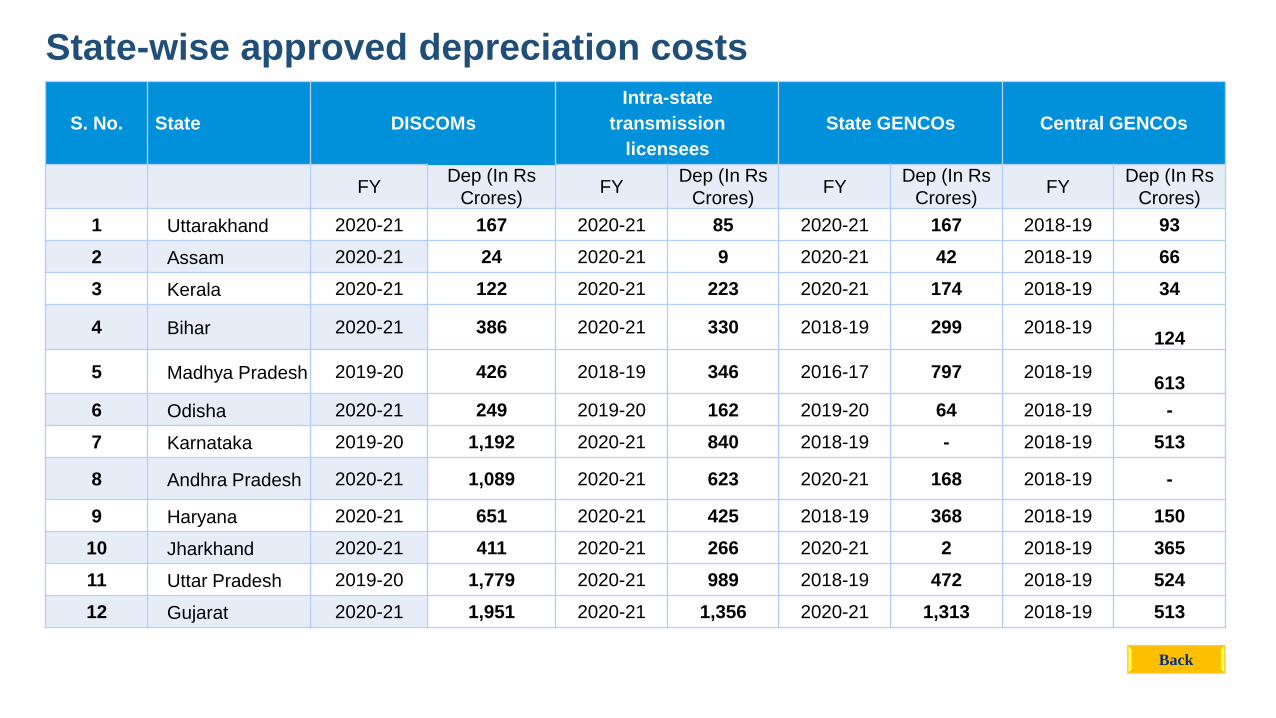
S. No. State DISCOMs
Intra-state
transmission
licensees
State GENCOs Central GENCOs
FY Dep (In Rs
Crores) FY
Dep (In Rs
Crores) FY
Dep (In Rs
Crores) FY
Dep (In Rs
Crores)
1 Uttarakhand 2020-21 167 2020-21 85 2020-21 167 2018-19 93
2 Assam 2020-21 24 2020-21 9 2020-21 42 2018-19 66
3 Kerala 2020-21 122 2020-21 223 2020-21 174 2018-19 34
4 Bihar 2020-21 386 2020-21 330 2018-19 299 2018-19
124
5 Madhya Pradesh 2019-20 426 2018-19 346 2016-17 797 2018-19
613
6 Odisha 2020-21 249 2019-20 162 2019-20 64 2018-19 -
7 Karnataka 2019-20 1,192 2020-21 840 2018-19 - 2018-19 513
8 Andhra Pradesh 2020-21 1,089 2020-21 623 2020-21 168 2018-19 -
9 Haryana 2020-21 651 2020-21 425 2018-19 368 2018-19 150
10 Jharkhand 2020-21 411 2020-21 266 2020-21 2 2018-19 365
11 Uttar Pradesh 2019-20 1,779 2020-21 989 2018-19 472 2018-19 524
12 Gujarat 2020-21 1,951 2020-21 1,356 2020-21 1,313 2018-19 513
Back
State-wise approved depreciation costs
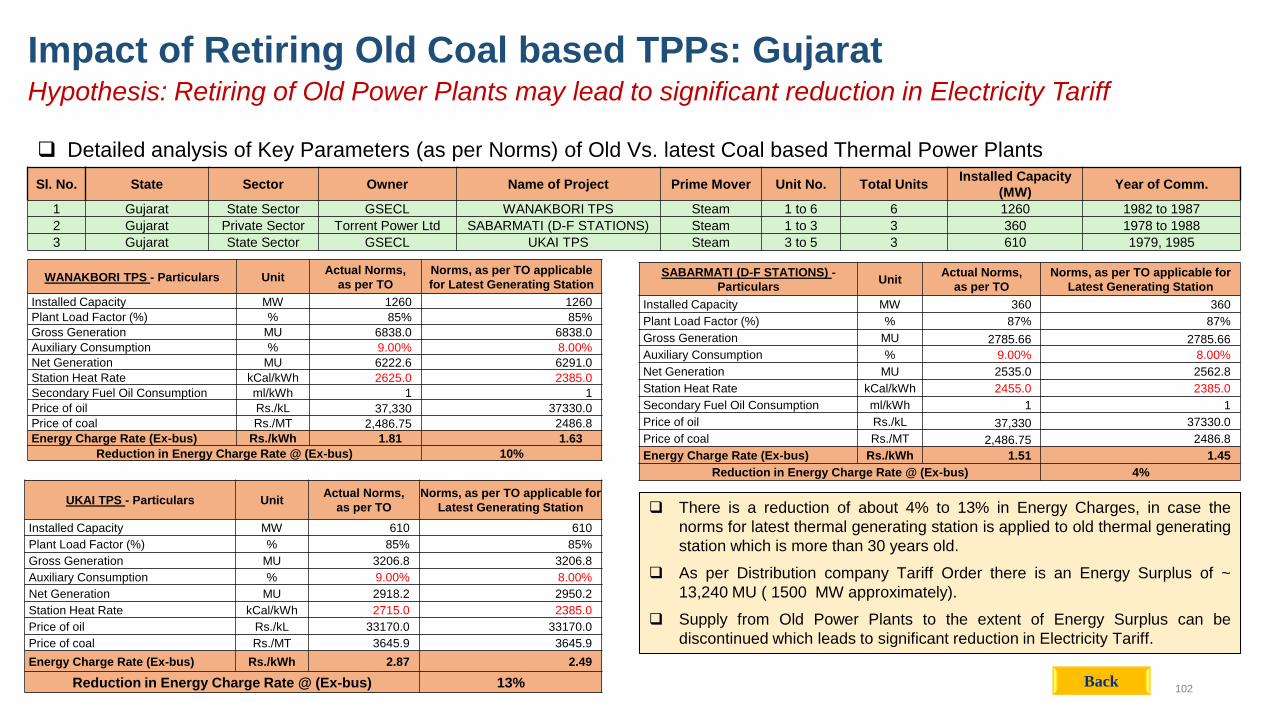
102
Impact of Retiring Old Coal based TPPs: Gujarat Hypothesis: Retiring of Old Power Plants may lead to significant reduction in Electricity Tariff
Detailed analysis of Key Parameters (as per Norms) of Old Vs. latest Coal based Thermal Power Plants
Sl. No. State Sector Owner Name of Project Prime Mover Unit No. Total Units Installed Capacity
(MW) Year of Comm.
1 Gujarat State Sector GSECL WANAKBORI TPS Steam 1 to 6 6 1260 1982 to 1987
2 Gujarat Private Sector Torrent Power Ltd SABARMATI (D-F STATIONS) Steam 1 to 3 3 360 1978 to 1988
3 Gujarat State Sector GSECL UKAI TPS Steam 3 to 5 3 610 1979, 1985
WANAKBORI TPS - Particulars Unit Actual Norms,
as per TO
Norms, as per TO applicable
for Latest Generating Station
Installed Capacity MW 1260 1260
Plant Load Factor (%) % 85% 85%
Gross Generation MU 6838.0 6838.0
Auxiliary Consumption % 9.00% 8.00%
Net Generation MU 6222.6 6291.0
Station Heat Rate kCal/kWh 2625.0 2385.0
Secondary Fuel Oil Consumption ml/kWh 1 1
Price of oil Rs./kL 37,330 37330.0
Price of coal Rs./MT 2,486.75 2486.8
Energy Charge Rate (Ex-bus) Rs./kWh 1.81 1.63
Reduction in Energy Charge Rate @ (Ex-bus) 10%
SABARMATI (D-F STATIONS) -
Particulars Unit
Actual Norms,
as per TO
Norms, as per TO applicable for
Latest Generating Station
Installed Capacity MW 360 360
Plant Load Factor (%) % 87% 87%
Gross Generation MU 2785.66 2785.66
Auxiliary Consumption % 9.00% 8.00%
Net Generation MU 2535.0 2562.8
Station Heat Rate kCal/kWh 2455.0 2385.0
Secondary Fuel Oil Consumption ml/kWh 1 1
Price of oil Rs./kL 37,330 37330.0
Price of coal Rs./MT 2,486.75 2486.8
Energy Charge Rate (Ex-bus) Rs./kWh 1.51 1.45
Reduction in Energy Charge Rate @ (Ex-bus) 4%
UKAI TPS - Particulars Unit Actual Norms,
as per TO
Norms, as per TO applicable for
Latest Generating Station
Installed Capacity MW 610 610
Plant Load Factor (%) % 85% 85%
Gross Generation MU 3206.8 3206.8
Auxiliary Consumption % 9.00% 8.00%
Net Generation MU 2918.2 2950.2
Station Heat Rate kCal/kWh 2715.0 2385.0
Price of oil Rs./kL 33170.0 33170.0
Price of coal Rs./MT 3645.9 3645.9
Energy Charge Rate (Ex-bus) Rs./kWh 2.87 2.49
Reduction in Energy Charge Rate @ (Ex-bus) 13%
There is a reduction of about 4% to 13% in Energy Charges, in case the
norms for latest thermal generating station is applied to old thermal generating
station which is more than 30 years old.
As per Distribution company Tariff Order there is an Energy Surplus of ~
13,240 MU ( 1500 MW approximately).
Supply from Old Power Plants to the extent of Energy Surplus can be
discontinued which leads to significant reduction in Electricity Tariff.
Back

103
Impact of Retiring Old Coal based TPPs: Madhya Pradesh Hypothesis: Retiring of Old Power Plants may lead to significant reduction in Electricity Tariff
Detailed analysis of Key Parameters (as per Norms) of Old Vs. latest Coal based Thermal Power Plants
Sl. No. State Sector Owner Name of Project Prime Mover Unit No. Total Units Installed Capacity
(MW) Year of Comm.
1 Madhya Pradesh State Sector MPPGCL SATPURA TPS Steam 6 to 9 4 800 1979 to 1984
2 Madhya Pradesh Central Sector NTPC VINDHYACHAL STPS* Steam 1 to 5 5 1050 1987 to 1990
SATPURA TPS - Particulars Unit Actual Norms,
as per TO
Norms, as per TO applicable
for Latest Generating Station
Installed Capacity MW 830 830
Plant Load Factor (%) % 85% 85%
Gross Generation MU 6180.18 6180.18
Auxiliary Consumption % 10.00% 6.25%
Net Generation MU 5,562.16 5,793.92
Station Heat Rate kCal/kWh 2700 2375
Secondary Fuel Oil Consumption ml/kWh 1.75 0.5
Price of oil Rs./kL 43934.0 43934.0
Price of coal Rs./MT 3217.3 3217.3
Energy Charge Rate (Ex-bus) Rs./kWh 2.83 2.38
Reduction in Energy Charge Rate @ (Ex-bus) 16%
Energy Availability & Requirement
State FY
Energy
Availability
(MU)
Energy
Requirement
(MU)
Energy
Surplus
(MU)
Approx.
Surplus
in MW
Old Coal
based TPPs
(>30 Years
Old), MW
Madhya
Pradesh 2019-20 97,989 69,353 28,636 3,268.95 1850
* The approved norms for Vindhyachal STPS is comparable to New Station.
There is a reduction of about 16% in Energy Charges for
Satpura thermal station, in case the norms for latest thermal
generating station is applied to old thermal generating station
which is more than 30 years old.
As per Distribution company Tariff Order there is an Energy
Surplus of ~ 28,000 MU or ~ 3,200 MW approximately.
From the numbers provided in above table, it is observed that
the supply from Old Power Plants can be discontinued as
Surplus Power is more than the MW capacity of Old Coal
based TPPs, which leads to significant reduction in Electricity
Tariff.
Back
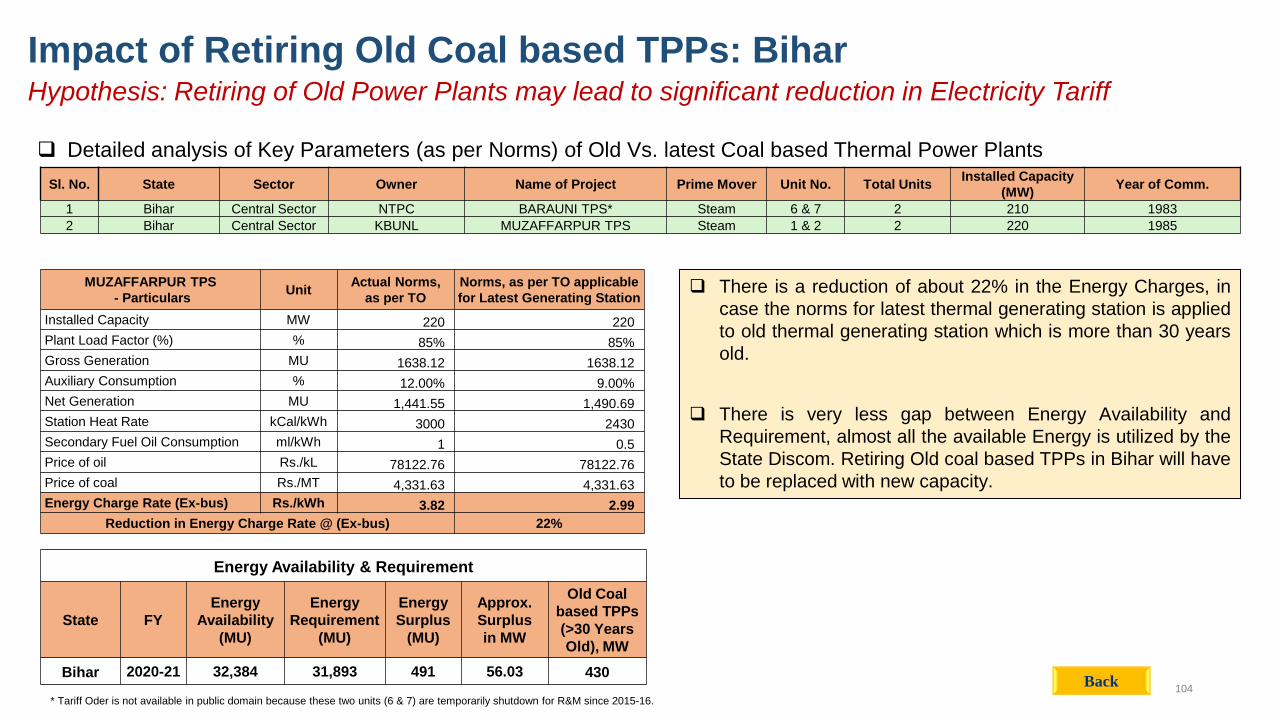
104
Impact of Retiring Old Coal based TPPs: Bihar Hypothesis: Retiring of Old Power Plants may lead to significant reduction in Electricity Tariff
Detailed analysis of Key Parameters (as per Norms) of Old Vs. latest Coal based Thermal Power Plants
Sl. No. State Sector Owner Name of Project Prime Mover Unit No. Total Units Installed Capacity
(MW) Year of Comm.
1 Bihar Central Sector NTPC BARAUNI TPS* Steam 6 & 7 2 210 1983
2 Bihar Central Sector KBUNL MUZAFFARPUR TPS Steam 1 & 2 2 220 1985
MUZAFFARPUR TPS
- Particulars Unit
Actual Norms,
as per TO
Norms, as per TO applicable
for Latest Generating Station
Installed Capacity MW 220 220
Plant Load Factor (%) % 85% 85%
Gross Generation MU 1638.12 1638.12
Auxiliary Consumption % 12.00% 9.00%
Net Generation MU 1,441.55 1,490.69
Station Heat Rate kCal/kWh 3000 2430
Secondary Fuel Oil Consumption ml/kWh 1 0.5
Price of oil Rs./kL 78122.76 78122.76
Price of coal Rs./MT 4,331.63 4,331.63
Energy Charge Rate (Ex-bus) Rs./kWh 3.82 2.99
Reduction in Energy Charge Rate @ (Ex-bus) 22%
* Tariff Oder is not available in public domain because these two units (6 & 7) are temporarily shutdown for R&M since 2015-16.
Energy Availability & Requirement
State FY
Energy
Availability
(MU)
Energy
Requirement
(MU)
Energy
Surplus
(MU)
Approx.
Surplus
in MW
Old Coal
based TPPs
(>30 Years
Old), MW
Bihar 2020-21 32,384 31,893 491 56.03 430
There is a reduction of about 22% in the Energy Charges, in
case the norms for latest thermal generating station is applied
to old thermal generating station which is more than 30 years
old.
There is very less gap between Energy Availability and
Requirement, almost all the available Energy is utilized by the
State Discom. Retiring Old coal based TPPs in Bihar will have
to be replaced with new capacity.
Back

105
Impact of Retiring Old Coal based TPPs: Odisha Hypothesis: Retiring of Old Power Plants may lead to significant reduction in Electricity Tariff
Detailed analysis of Key Parameters (as per Norms) of Old Vs. latest Coal based Thermal Power Plants
Sl. No. State Sector Owner Name of Project Prime Mover Unit No. Total Units Installed Capacity
(MW) Year of Comm.
1 Odisha Central Sector NTPC TALCHER (OLD) TPS Steam 1 to 6 6 460 1967 to 1983
TALCHER (OLD) TPS
- Particulars Unit
Actual Norms,
as per TO
Norms, as per TO
applicable for Latest
Generating Station
Installed Capacity MW 460 460
Plant Load Factor (%) % 85% 85%
Gross Generation MU 3425.16 3425.16
Auxiliary Consumption % 10.50% 8.50%
Net Generation MU 3,065.52 3,134.02
Station Heat Rate kCal/kWh 2850 2430
Secondary Fuel Oil
Consumption ml/kWh 0.5 0.5
Price of oil Rs./kL 52224.37 52224.37
Price of coal Rs./MT 1,166.20 1,166.20
Energy Charge Rate (Ex-
bus) Rs./kWh
0.99 0.83
Reduction in Energy Charge Rate @ (Ex-bus) 17%
There is a reduction of about 17% in the Energy Charges, in
case the norms for latest thermal generating station is
applied to old thermal generating station which is more than
30 years old.
There is very less gap between Energy Availability and
Requirement, almost all the available Energy is utilized by the
State Discom. Retiring Old coal based TPPs will have to be
replaced with new capacity.
Back
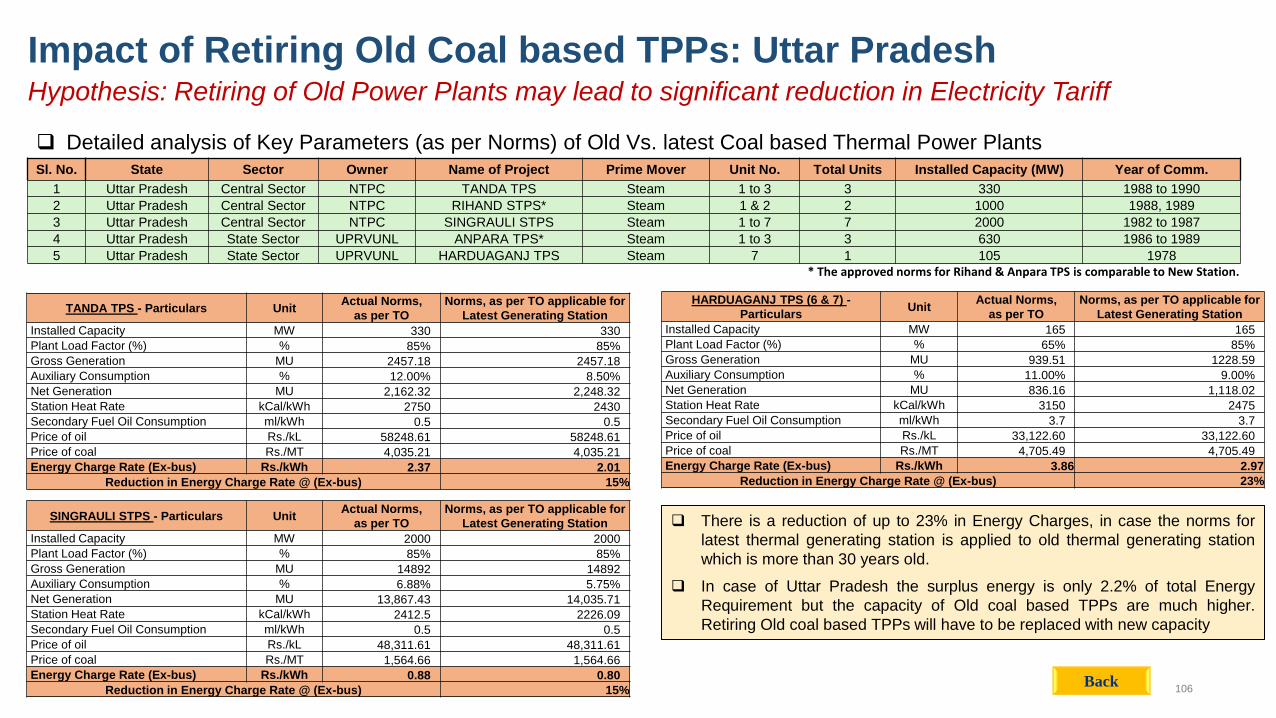
106
Impact of Retiring Old Coal based TPPs: Uttar Pradesh Hypothesis: Retiring of Old Power Plants may lead to significant reduction in Electricity Tariff
Detailed analysis of Key Parameters (as per Norms) of Old Vs. latest Coal based Thermal Power Plants Sl. No. State Sector Owner Name of Project Prime Mover Unit No. Total Units Installed Capacity (MW) Year of Comm.
1 Uttar Pradesh Central Sector NTPC TANDA TPS Steam 1 to 3 3 330 1988 to 1990
2 Uttar Pradesh Central Sector NTPC RIHAND STPS* Steam 1 & 2 2 1000 1988, 1989
3 Uttar Pradesh Central Sector NTPC SINGRAULI STPS Steam 1 to 7 7 2000 1982 to 1987
4 Uttar Pradesh State Sector UPRVUNL ANPARA TPS* Steam 1 to 3 3 630 1986 to 1989
5 Uttar Pradesh State Sector UPRVUNL HARDUAGANJ TPS Steam 7 1 105 1978
TANDA TPS - Particulars Unit Actual Norms,
as per TO
Norms, as per TO applicable for
Latest Generating Station
Installed Capacity MW 330 330
Plant Load Factor (%) % 85% 85%
Gross Generation MU 2457.18 2457.18
Auxiliary Consumption % 12.00% 8.50%
Net Generation MU 2,162.32 2,248.32
Station Heat Rate kCal/kWh 2750 2430
Secondary Fuel Oil Consumption ml/kWh 0.5 0.5
Price of oil Rs./kL 58248.61 58248.61
Price of coal Rs./MT 4,035.21 4,035.21
Energy Charge Rate (Ex-bus) Rs./kWh 2.37 2.01
Reduction in Energy Charge Rate @ (Ex-bus) 15%
SINGRAULI STPS - Particulars Unit Actual Norms,
as per TO
Norms, as per TO applicable for
Latest Generating Station
Installed Capacity MW 2000 2000
Plant Load Factor (%) % 85% 85%
Gross Generation MU 14892 14892
Auxiliary Consumption % 6.88% 5.75%
Net Generation MU 13,867.43 14,035.71
Station Heat Rate kCal/kWh 2412.5 2226.09
Secondary Fuel Oil Consumption ml/kWh 0.5 0.5
Price of oil Rs./kL 48,311.61 48,311.61
Price of coal Rs./MT 1,564.66 1,564.66
Energy Charge Rate (Ex-bus) Rs./kWh 0.88 0.80
Reduction in Energy Charge Rate @ (Ex-bus) 15%
* The approved norms for Rihand & Anpara TPS is comparable to New Station.
HARDUAGANJ TPS (6 & 7) -
Particulars Unit
Actual Norms,
as per TO
Norms, as per TO applicable for
Latest Generating Station
Installed Capacity MW 165 165
Plant Load Factor (%) % 65% 85%
Gross Generation MU 939.51 1228.59
Auxiliary Consumption % 11.00% 9.00%
Net Generation MU 836.16 1,118.02
Station Heat Rate kCal/kWh 3150 2475
Secondary Fuel Oil Consumption ml/kWh 3.7 3.7
Price of oil Rs./kL 33,122.60 33,122.60
Price of coal Rs./MT 4,705.49 4,705.49
Energy Charge Rate (Ex-bus) Rs./kWh 3.86 2.97
Reduction in Energy Charge Rate @ (Ex-bus) 23%
There is a reduction of up to 23% in Energy Charges, in case the norms for
latest thermal generating station is applied to old thermal generating station
which is more than 30 years old.
In case of Uttar Pradesh the surplus energy is only 2.2% of total Energy
Requirement but the capacity of Old coal based TPPs are much higher.
Retiring Old coal based TPPs will have to be replaced with new capacity
Back

107
IDENTIFIED ISSUES GUIDELINES
1. Guidelines for Zero
Schedule instructions to
the Generating Units
• In case of anticipated generation availability in surplus, the Distribution Licensee (DL) needs to optimize
their cost of power procurement considering the contracted sources for the period of anticipated surplus,
• DL may consider giving Zero Schedule to some of its contracted sources. This should be a conscious
decision of the DL in consultation with Maharashtra State Load Despatch Centre (MSLDC) taking into
account the demand supply position and transmission constraints.
• If grid constraints prevent the Zero Scheduling of the unit with highest Variable Charge (VC) in the MOD
stack, the unit with the next highest VC needs to be considered.
• The DL must give the Generating Company 24 hours prior notice of the Zero Scheduling.
• In case a particular unit is, in fact, required to be scheduled during the pre-declared Zero Scheduling
period, the DL must intimate the Generating station at least 72 hours in advance for the Unit(s) to come on
bar in cold start.
• Zero Scheduling to be carried out by DL considering the roles and obligations under the corresponding
PPAs
• Additional cost implication in Variable Charges that arises on account of Zero Scheduling will not be
allowed as pass through
Merit Order Dispatch (MOD): Issues & Guidelines (1/3)
Back

108
IDENTIFIED ISSUES GUIDELINES
2. Guidelines for Reserve
Shut Down (RSD) of
Generating Units by
MSDLC
• A Reserve Margin equivalent to the contracted capacity of the largest unit of the Power Station, contracted
by the Distribution Licensee needs to maintained.
• The Reserve Shut Down (RSD) should be implemented for the capacity available in excess of the largest
Unit contracted by the DL.
• The RSD should be applied to Units with higher Variable Charges in the MOD stack, subject to grid
conditions permitting the same.
3. Periodicity and date of
preparation of MOD
stack
• Variable Charge of immediately preceding month and in case the Variable Charge (VC) of immediately
month is no available, the average of the latest available VC for the preceding 3 months needs considered
for preparation of the MOD stack.
• SLDC to prepare the MOD stack by 15th of every month which will be effective from 16th of the month till
15th of subsequent month
• The MOD Stack may be subsequently revised by MSLDC-OD on account of new source, revision in
Variable Charges due to issuance of Tariff Order by CERC or SERC and impact of change in Law as per
PPA
4. Basis of preparation of
MOD stack, including the
variable charge to be
considered
• DL need to submit data for variable charges of generating stations/units to MSLDC.
• For Generating Stations (GS) whose tariff is being determined by the Commission under sec 62, the VC
for MOD purposes shall be the Energy Charge plus the actual FSA.
• For Central GS , the VC for MOD purposes shall be the landed cost at the State Periphery.
• For PPAs entered under sec 63, the VC for MOD purposes shall be the Energy Charge plus impact of
change in law.
• For Intra State OA transactions above 50 MW, 60% of total tariff shall be considered as VC for MOD
purpose.
Merit Order Dispatch (MOD): Issues & Guidelines (1/3)
Back

109
IDENTIFIED ISSUES GUIDELINES
5. Guidelines for operating
the Generating Units
• As a basic principle, MSLDC is required to finalize the despatch schedule based on least-cost principles.
• DL should try to procure the highest possible capacity from the units permitted by the system, rather than
scheduling the Units at Technical Minimum.
6. Guidelines for capacity
declaration by
Generating units
• Apart from the day ahead generation schedule, the Generating Company shall also provide the additional
information regarding the fuel and water availability in the provided format.
• In accordance with the MERC MYT Regulations 2015 provision which specifies the demonstration of
Declared capacity by GS, MSLDC shall ask the GS to demonstrate the max DC of Generating unit for the
particular time block.
7. Identification of Must
Run Stations, and
guidelines for operating
Hydro Stations
• With significant generation capacity addition in the State, MSLDC needs to ensure that the intended
purpose of Hydro Generating Stations in not defeated and indiscriminate use of Hydro power is avoided.
8. Technical Minimum of
Generating Units
• Technical Minimum for operation in respect of a coal fired/gas fired/multi fuel based thermal generating unit
connected to the STU shall be 55% of its installed capacity.
Merit Order Dispatch (MOD): Issues & Guidelines (3/3)
Back

CERC Staff Paper on FGD
Norms for Consumption of Reagent (1/2)
The normative consumption of specific reagent for various technologies for reduction of emission of sulphur dioxide shall be as
below:
(a) For Wet Limestone based Flue Gas De-sulphurisation (FGD) system
The specific limestone consumption (g/kWh) shall be worked out by following formula:
[0.85 x K x SHR (kCal/kWh) x S (%)] x [GCV (kCal/kg) x LP (%) ]
Where,
S = Sulphur content in percentage,
LP = Limestone Purity in percentage,
Provided that value of K shall be equivalent to (35.2 x Design SO2 Removal Efficiency/96%) for units to comply with SO2
emission norm of 100/200 mg/Nm3 or (26.8 x Design SO2 Removal Efficiency/73%) for units to comply with SO2 emission
norm of 600 mg/Nm3;
Provided further that the limestone purity shall not be less than 85%.

CERC Staff Paper on FGD
Norms for Consumption of Reagent (2/2)
(b) For Lime Spray Dryer or Semi-dry Flue Gas Desulphurisation (FGD) system
The specific lime consumption shall be worked out based on minimum purity of lime (LP) as at 90% or more by applying
formula [ 6 x 0.90 / PL (%) ] gm/kWh
(c) For Dry Sorbent Injection System (using sodium bicarbonate)
The specific consumption of sodium bicarbonate shall be 12 g per kWh at 100% purity
(d) For CFBC Technology (furnace injection) based generating station
The specific limestone consumption for CFBC based generating station (furnace injection) shall be computed with the following
formula:
[62.9 x S(%) x SHR (kCal/kWh) /GCV (kCal/kg) ] x [ 0.85/ LP], Where
S = Sulphur content in percentage,
LP = Limestone Purity in percentage
(e) For Sea Water based Flue Gas Desulphurisation (FGD) system
The reagent used is sea water, therefore there is no requirement for any normative formulae for consumption of reagent.

Return on Equity and,LTDF and Power Procurement Planning
Anoop SinghProfessor, Dept. of Industrial and Management Engineering (IME), IIT Kanpur
Founder & Coordinator, Centre for Energy Regulation (CER) & Energy Analytics Lab (EAL)
CER’s Inputs for Forum of Regulators (FOR)December 7, 2020
https://cer.iitk.ac.in/ https://eal.iitk.ac.in/
Copyright © IIT Kanpur
Return on Equity
2
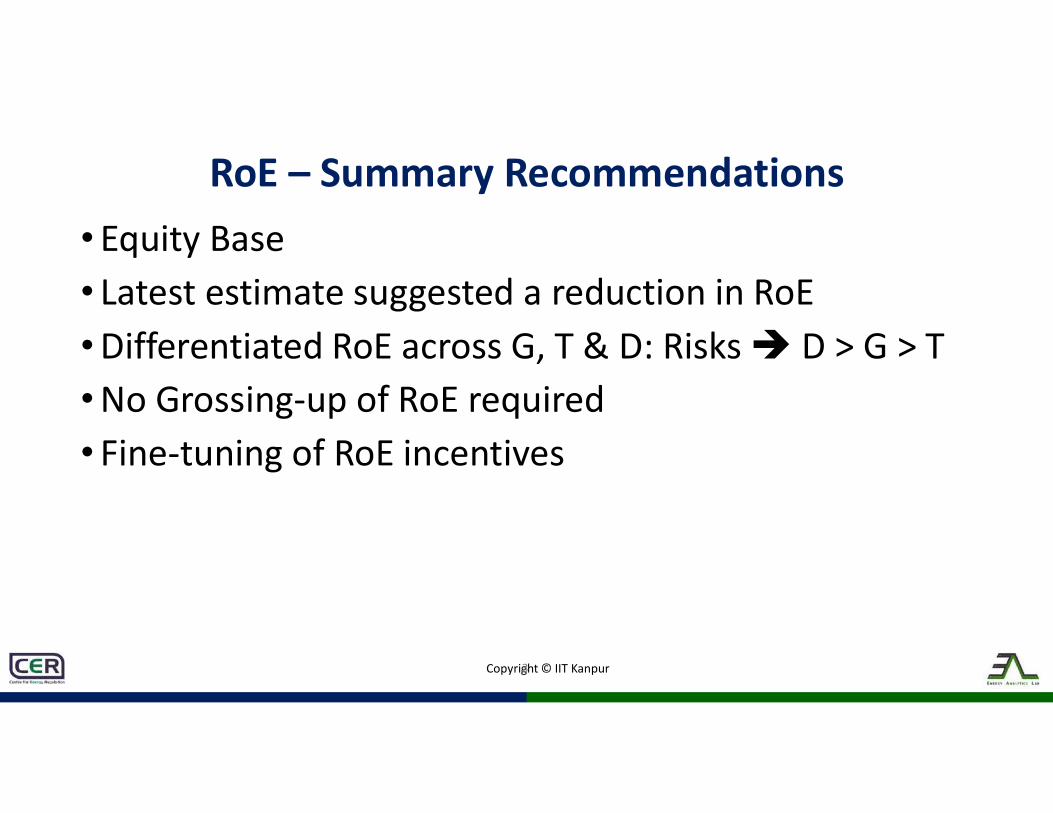
Copyright © IIT Kanpur
RoE – Summary Recommendations• Equity Base• Latest estimate suggested a reduction in RoE• Differentiated RoE across G, T & D: Risks D > G > T• No Grossing-up of RoE required• Fine-tuning of RoE incentives
3
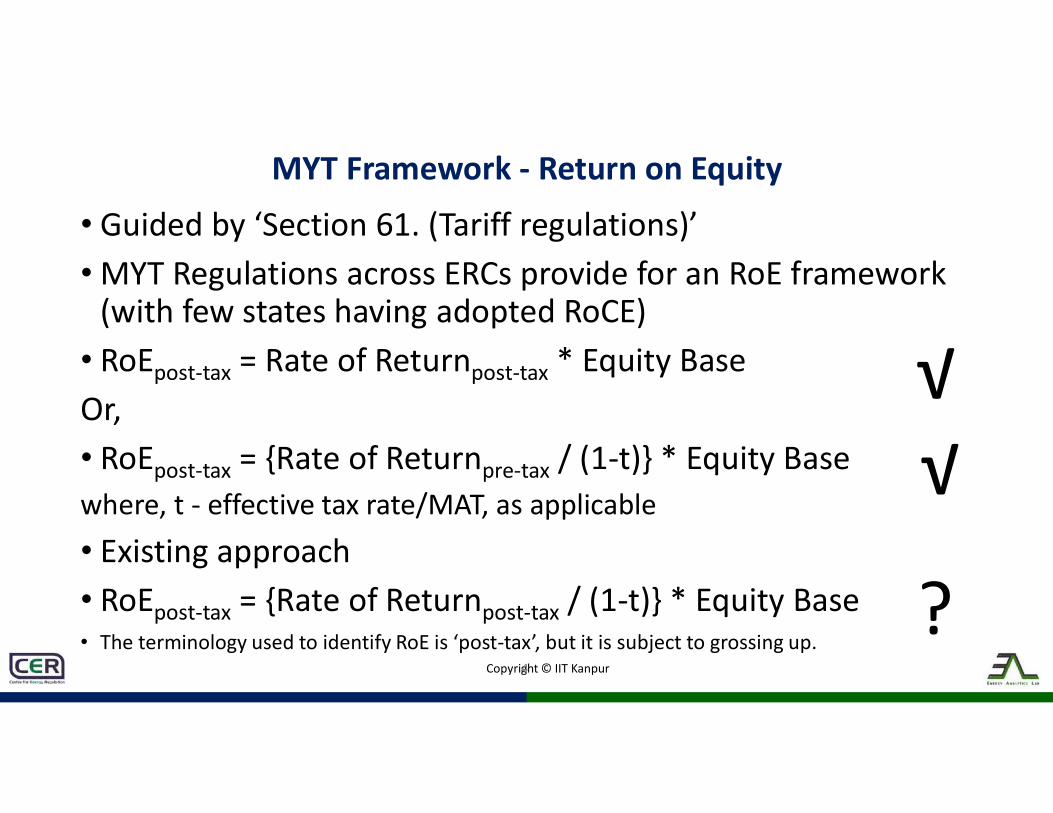
Copyright © IIT Kanpur
MYT Framework - Return on Equity
• Guided by ‘Section 61. (Tariff regulations)’• MYT Regulations across ERCs provide for an RoE framework
(with few states having adopted RoCE)• RoEpost-tax = Rate of Returnpost-tax * Equity BaseOr,• RoEpost-tax = {Rate of Returnpre-tax / (1-t)} * Equity Basewhere, t - effective tax rate/MAT, as applicable
• Existing approach• RoEpost-tax = {Rate of Returnpost-tax / (1-t)} * Equity Base• The terminology used to identify RoE is ‘post-tax’, but it is subject to grossing up.
4
√√
?
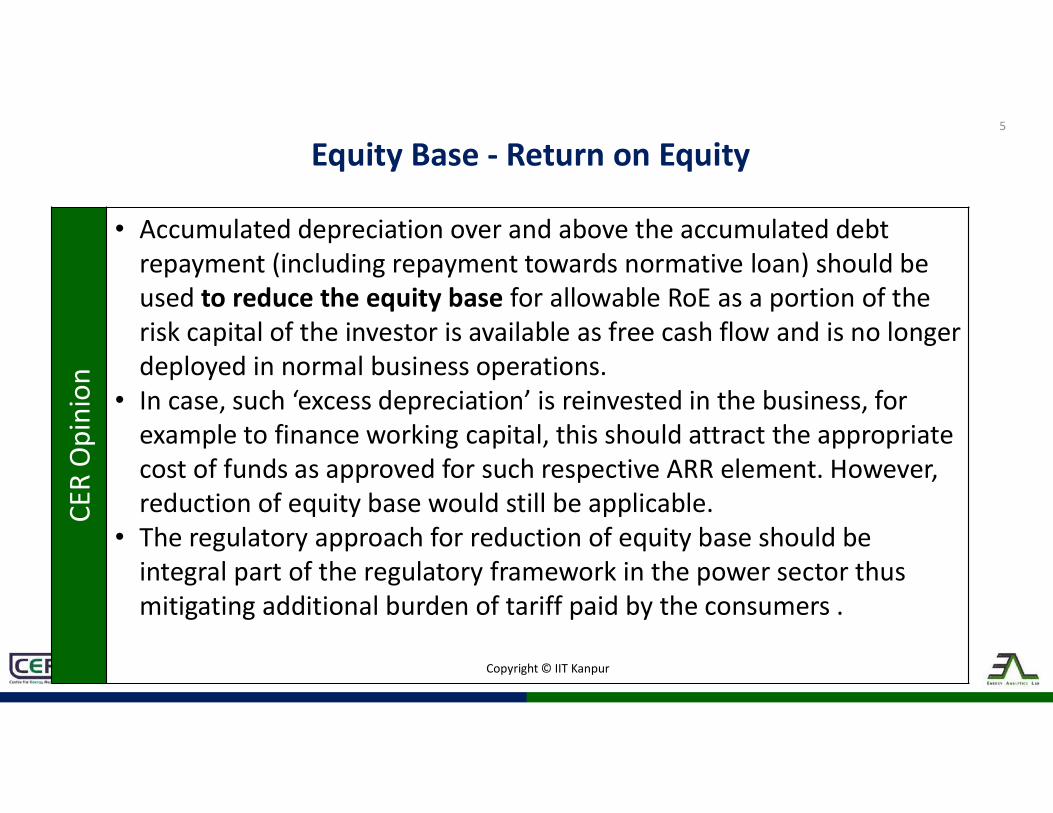
Copyright © IIT Kanpur
5
CER
Opi
nion
• Accumulated depreciation over and above the accumulated debt repayment (including repayment towards normative loan) should be used to reduce the equity base for allowable RoE as a portion of the risk capital of the investor is available as free cash flow and is no longer deployed in normal business operations.
• In case, such ‘excess depreciation’ is reinvested in the business, for example to finance working capital, this should attract the appropriate cost of funds as approved for such respective ARR element. However, reduction of equity base would still be applicable.
• The regulatory approach for reduction of equity base should be integral part of the regulatory framework in the power sector thus mitigating additional burden of tariff paid by the consumers .
Equity Base - Return on Equity
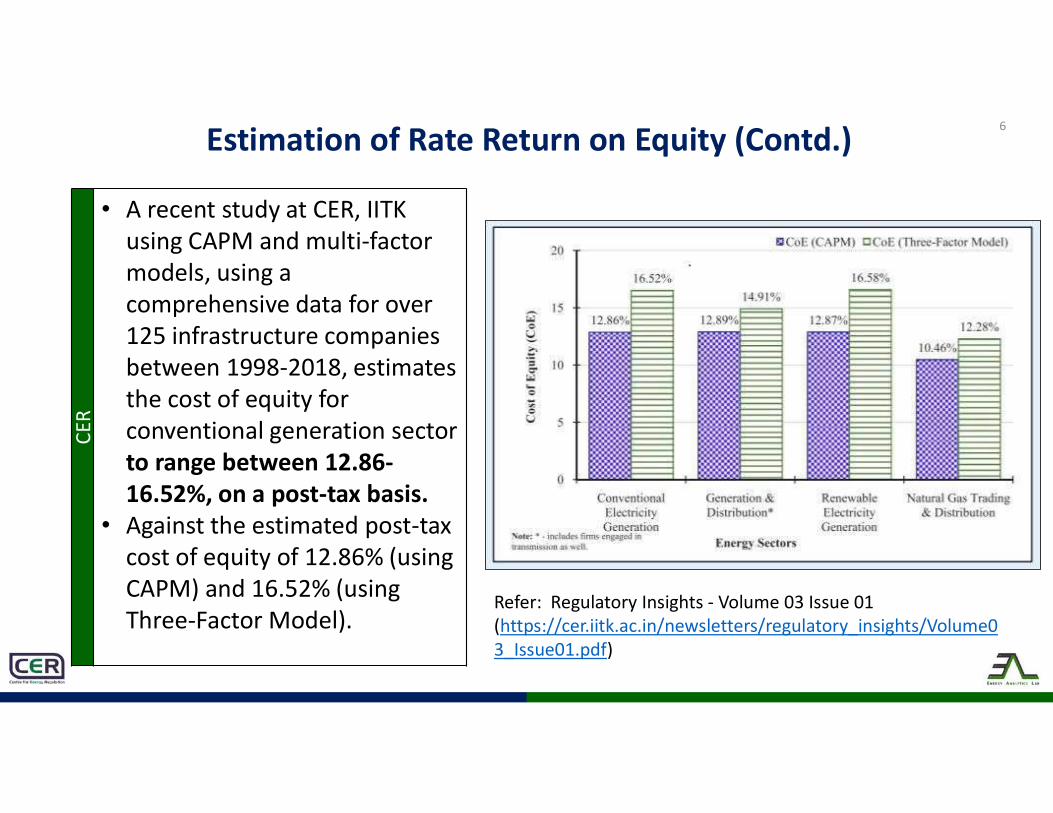
Copyright © IIT Kanpur
6Estimation of Rate Return on Equity (Contd.)
CER
• A recent study at CER, IITK using CAPM and multi-factor models, using a comprehensive data for over 125 infrastructure companies between 1998-2018, estimates the cost of equity for conventional generation sector to range between 12.86-16.52%, on a post-tax basis.
• Against the estimated post-tax cost of equity of 12.86% (using CAPM) and 16.52% (using Three-Factor Model).
Refer: Regulatory Insights - Volume 03 Issue 01 (https://cer.iitk.ac.in/newsletters/regulatory_insights/Volume03_Issue01.pdf)
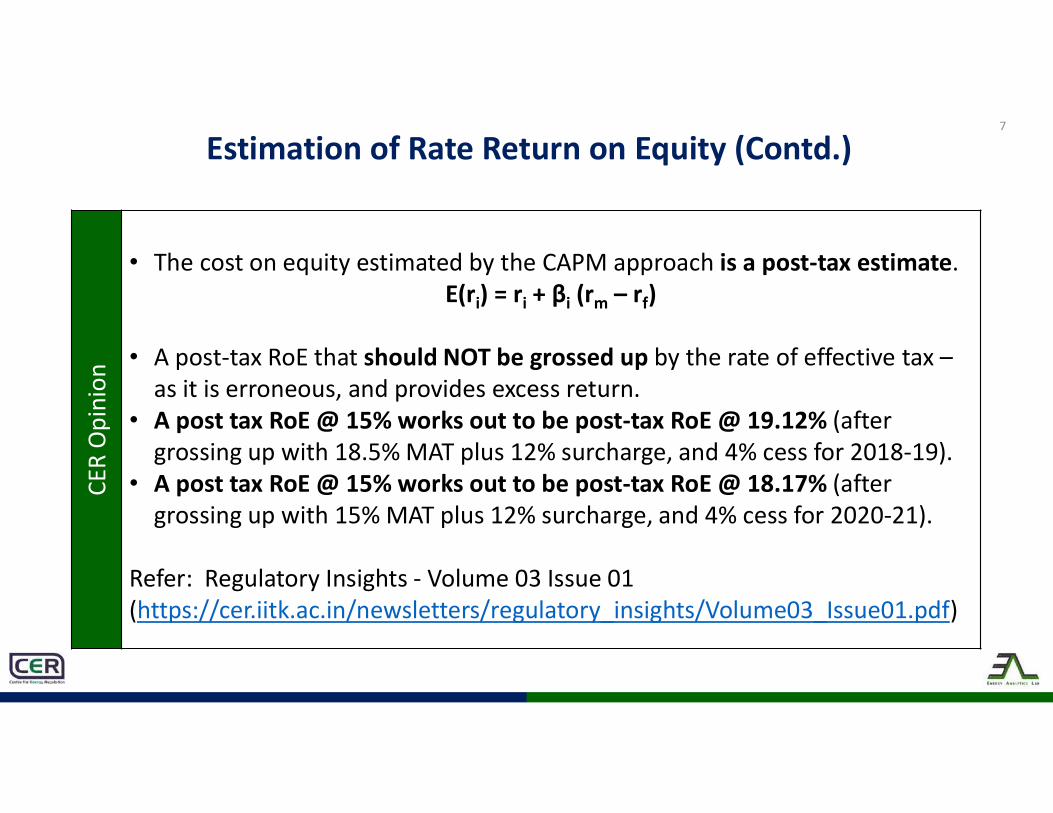
Copyright © IIT Kanpur
7
Estimation of Rate Return on Equity (Contd.)
CER
Opi
nion
• The cost on equity estimated by the CAPM approach is a post-tax estimate.E(ri) = ri + βi (rm – rf)
• A post-tax RoE that should NOT be grossed up by the rate of effective tax –as it is erroneous, and provides excess return.
• A post tax RoE @ 15% works out to be post-tax RoE @ 19.12% (after grossing up with 18.5% MAT plus 12% surcharge, and 4% cess for 2018-19).
• A post tax RoE @ 15% works out to be post-tax RoE @ 18.17% (after grossing up with 15% MAT plus 12% surcharge, and 4% cess for 2020-21).
Refer: Regulatory Insights - Volume 03 Issue 01 (https://cer.iitk.ac.in/newsletters/regulatory_insights/Volume03_Issue01.pdf)

Copyright © IIT Kanpur
Recommendations for RoE Framework
• Reduction in RoE• To be estimated (rather than calculated) on the basis appropriate
capital asset pricing model• To take into account the relative risk across business segments i.e.
Generation, transmission and distribution
• No grossing-up of RoE by effective income tax is required as the estimated RoE is already on a post-tax basis.
• Reduction in ‘equity base’ (to account for accumulated depreciation exceeding debt repayment)
• Implementable provisions, based on benefits to the system, for additional return for ramping capability of power plants.
8
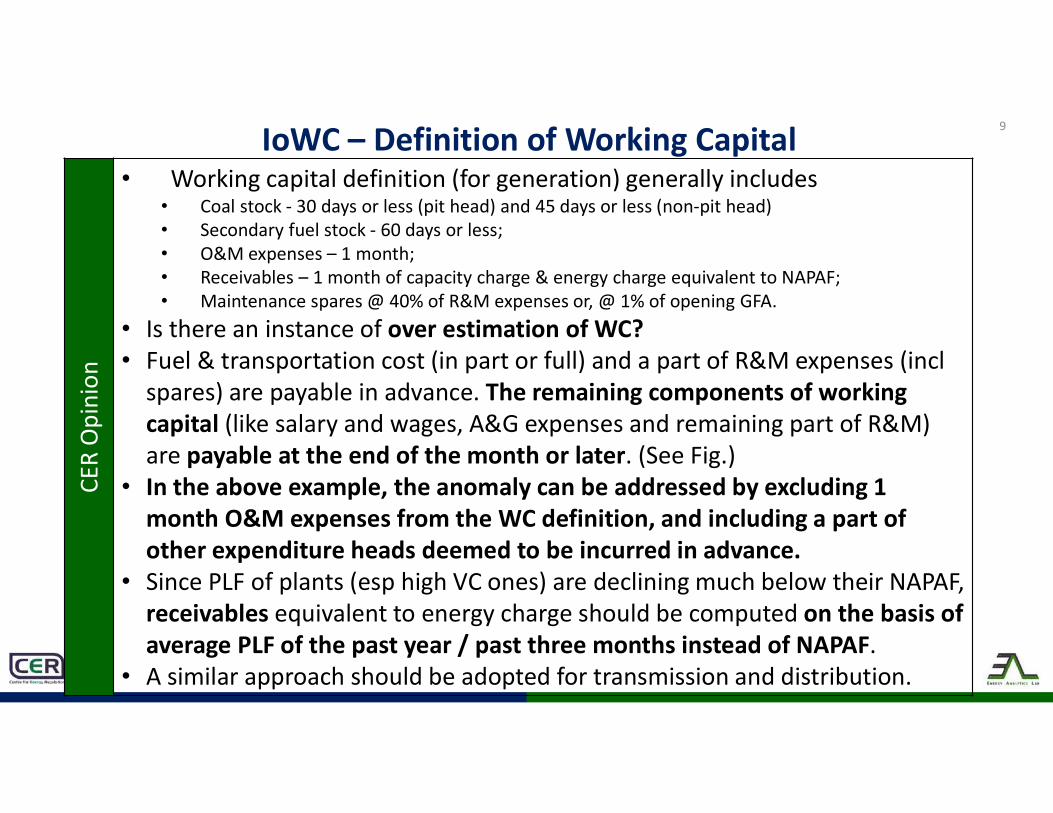
Copyright © IIT Kanpur
9IoWC – Definition of Working Capital
CER
Opi
nion
• Working capital definition (for generation) generally includes• Coal stock - 30 days or less (pit head) and 45 days or less (non-pit head) • Secondary fuel stock - 60 days or less;• O&M expenses – 1 month;• Receivables – 1 month of capacity charge & energy charge equivalent to NAPAF;• Maintenance spares @ 40% of R&M expenses or, @ 1% of opening GFA.
• Is there an instance of over estimation of WC?• Fuel & transportation cost (in part or full) and a part of R&M expenses (incl
spares) are payable in advance. The remaining components of working capital (like salary and wages, A&G expenses and remaining part of R&M) are payable at the end of the month or later. (See Fig.)
• In the above example, the anomaly can be addressed by excluding 1 month O&M expenses from the WC definition, and including a part of other expenditure heads deemed to be incurred in advance.
• Since PLF of plants (esp high VC ones) are declining much below their NAPAF, receivables equivalent to energy charge should be computed on the basis of average PLF of the past year / past three months instead of NAPAF.
• A similar approach should be adopted for transmission and distribution.
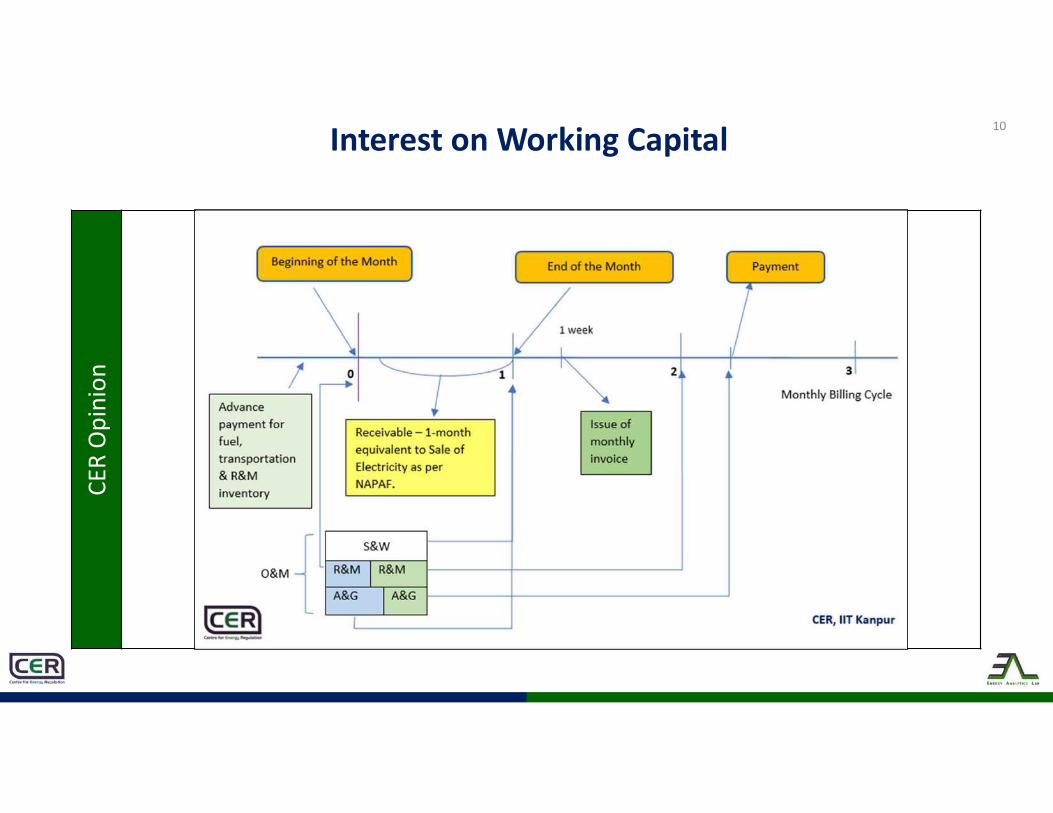
Copyright © IIT Kanpur
10Interest on Working CapitalCE
R O
pini
on
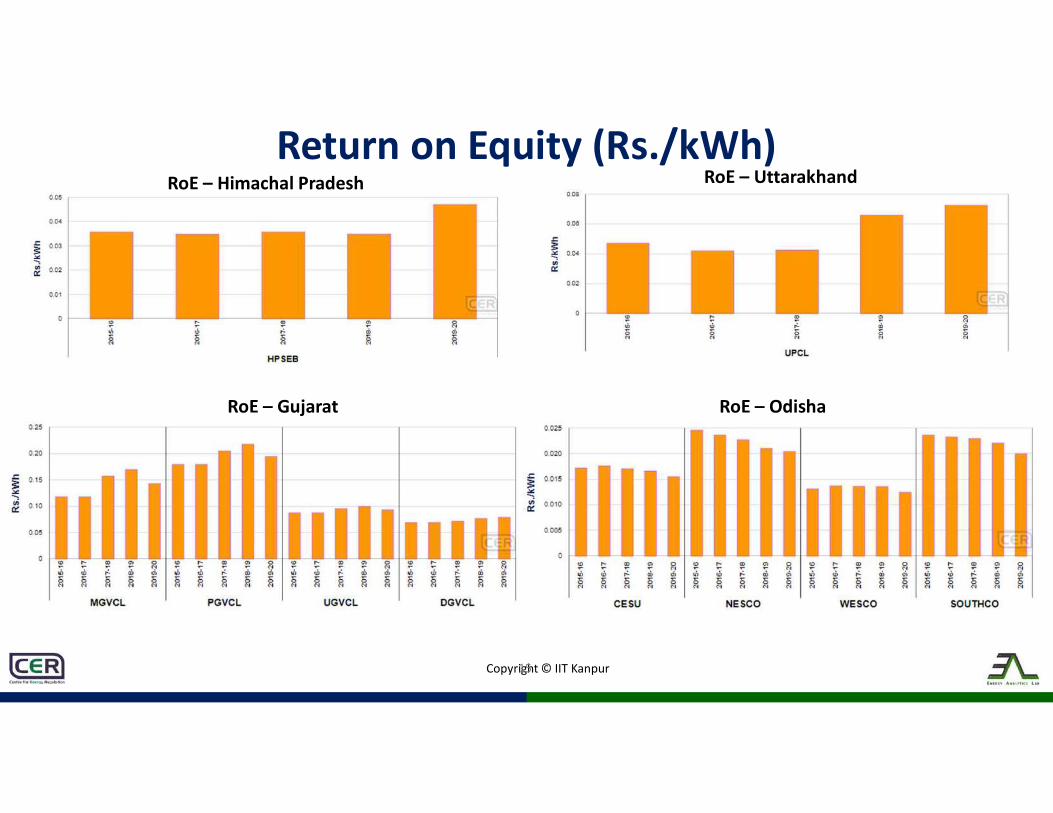
Copyright © IIT Kanpur
Return on Equity (Rs./kWh)
15
RoE – Himachal Pradesh
RoE – Gujarat
RoE – Uttarakhand
RoE – Odisha
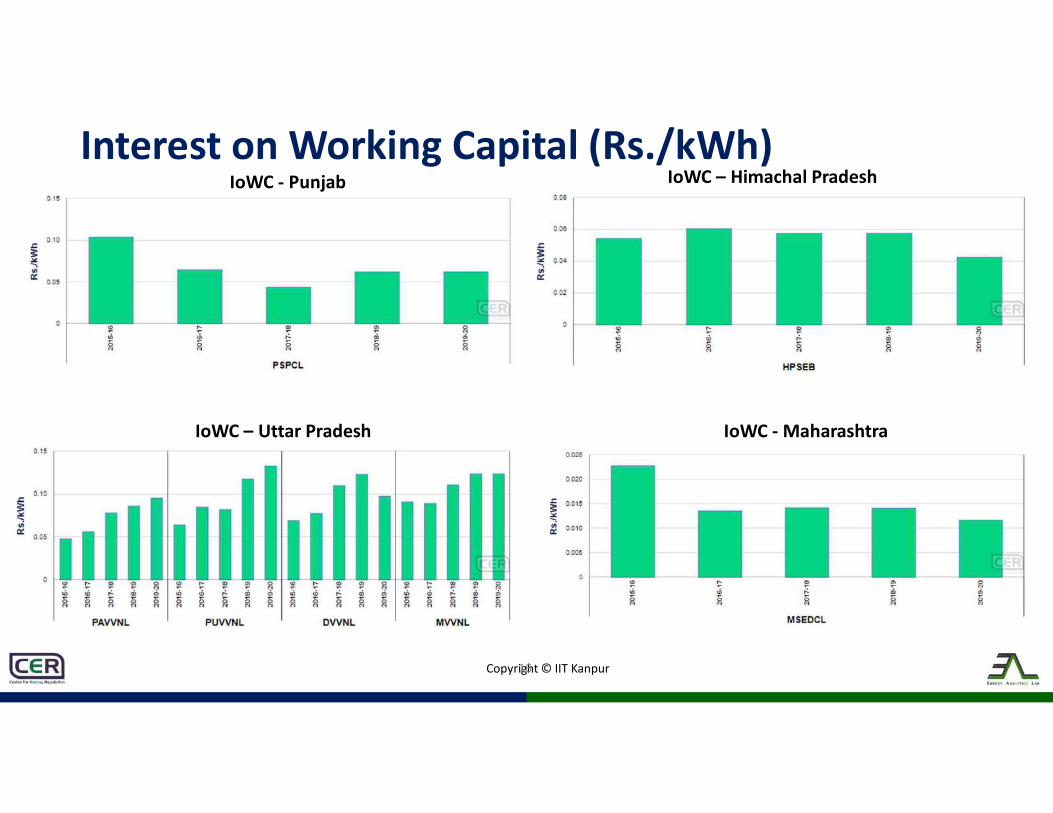
Copyright © IIT Kanpur
Interest on Working Capital (Rs./kWh)
16
IoWC - Punjab
IoWC – Uttar Pradesh
IoWC – Himachal Pradesh
IoWC - Maharashtra

Copyright © IIT Kanpur
Components of ARR – Growth Across Time
17
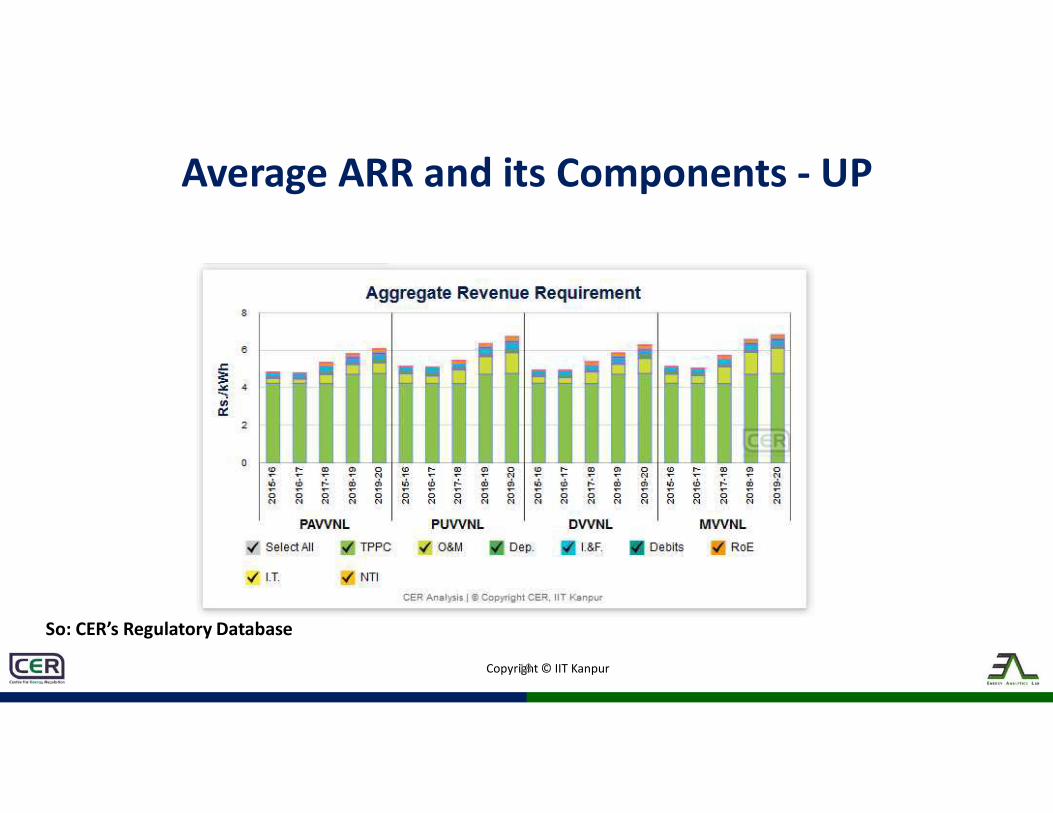
Copyright © IIT Kanpur
Average ARR and its Components - UP
18
So: CER’s Regulatory Database

Copyright © IIT Kanpur
Per unit O& M cost and its Components - UP
19
So: CER’s Regulatory Database
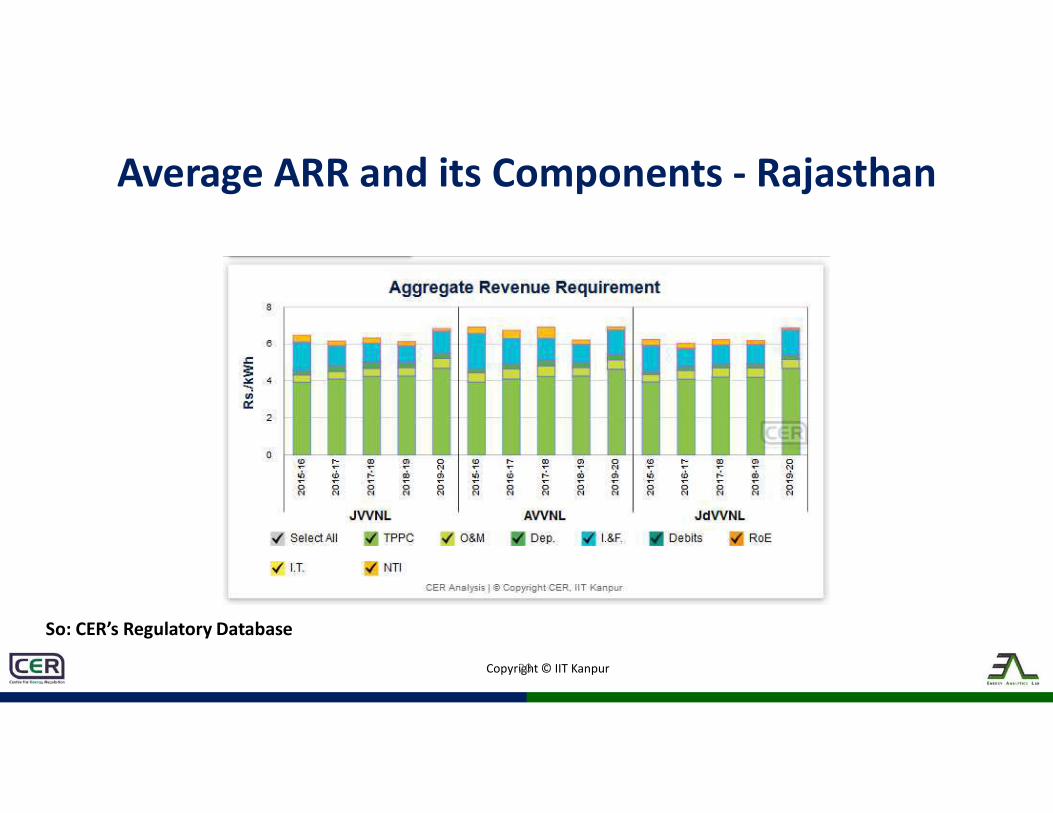
Copyright © IIT Kanpur
Average ARR and its Components - Rajasthan
20
So: CER’s Regulatory Database

Copyright © IIT Kanpur
Per unit O& M cost and its Components -Rajasthan
22
So: CER’s Regulatory Database

Copyright © IIT Kanpur
Average ARR and its Components - Haryana
23
So: CER’s Regulatory Database

Copyright © IIT Kanpur
Per unit O& M cost and its Components -Haryana
25
So: CER’s Regulatory Database
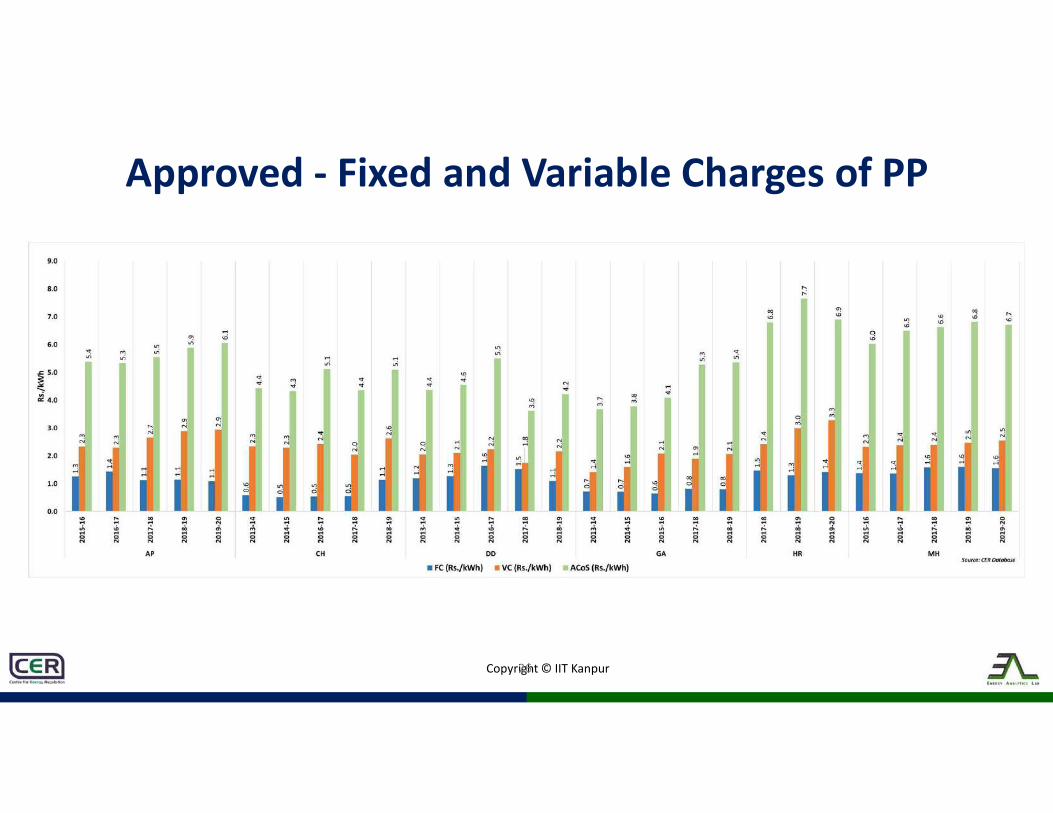
Copyright © IIT Kanpur
Approved - Fixed and Variable Charges of PP
26

Copyright © IIT Kanpur
Approved - Fixed and Variable Charges of PP
27
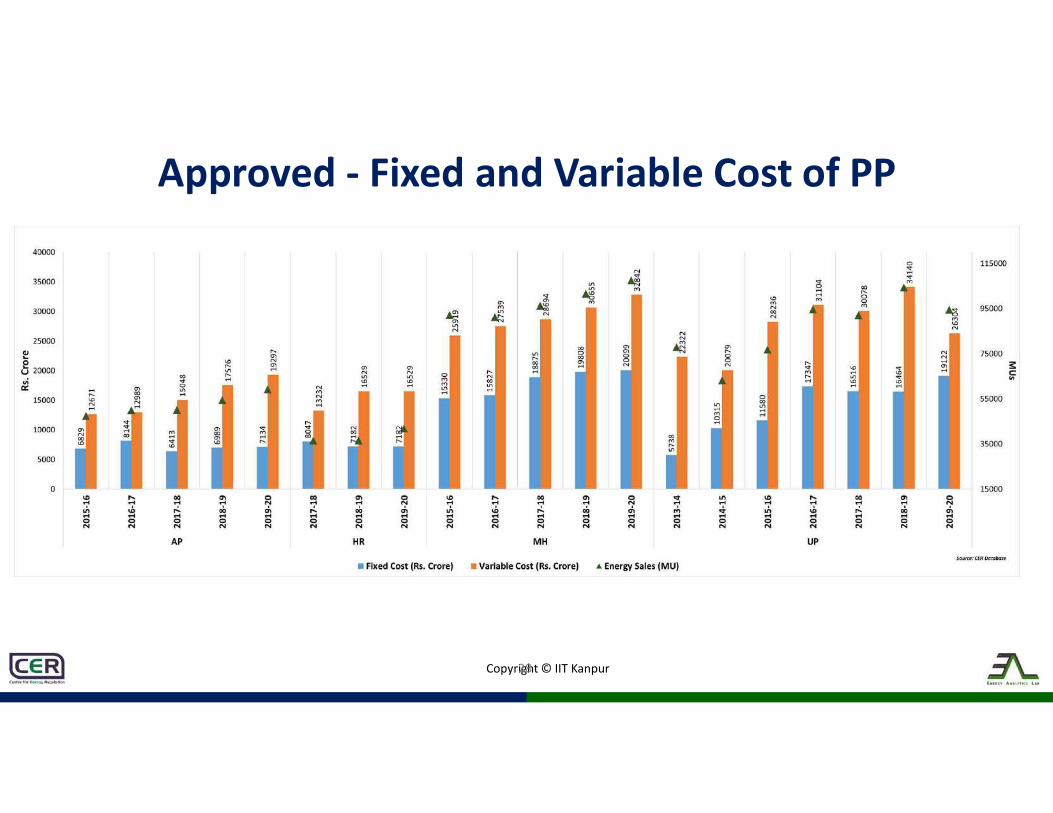
Copyright © IIT Kanpur
Approved - Fixed and Variable Cost of PP
28
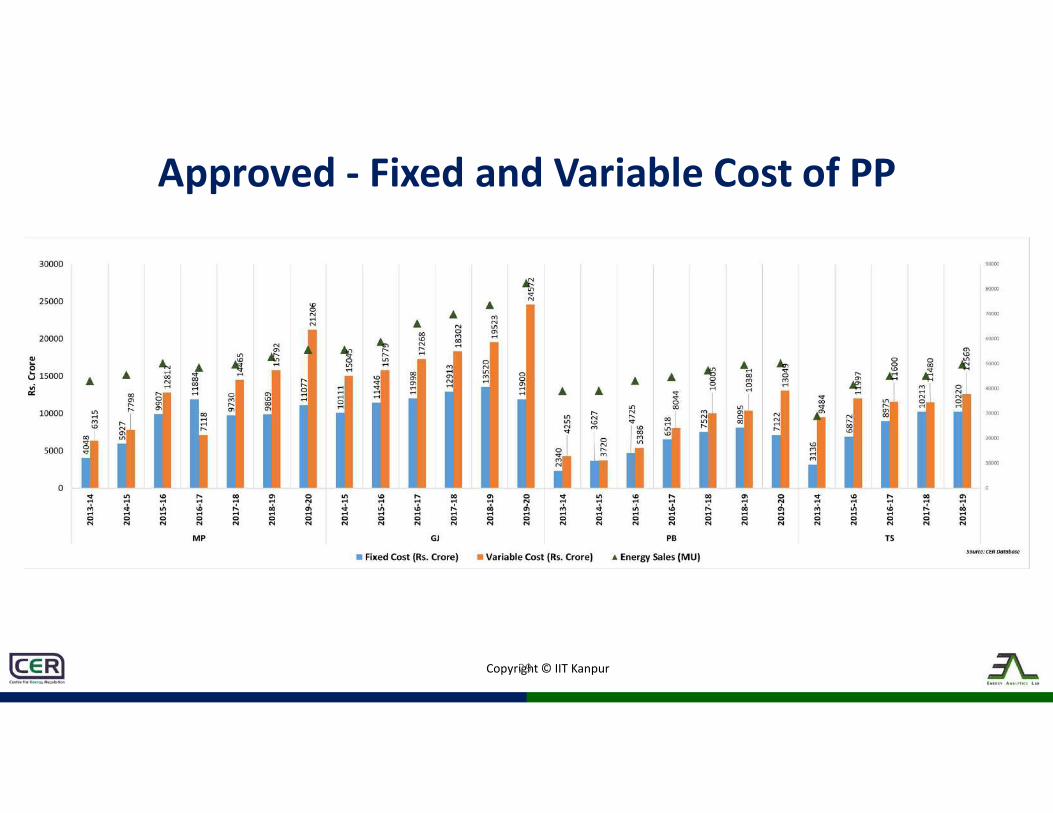
Copyright © IIT Kanpur
Approved - Fixed and Variable Cost of PP
29
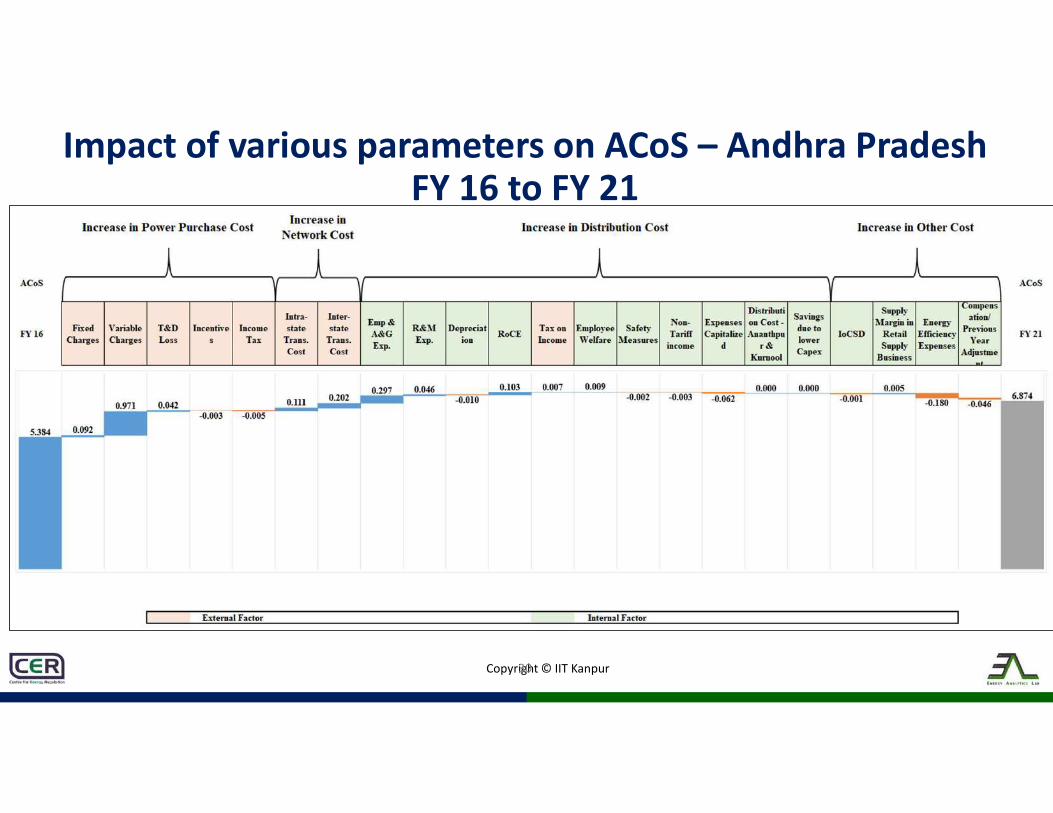
Copyright © IIT Kanpur
Impact of various parameters on ACoS – Andhra PradeshFY 16 to FY 21
30
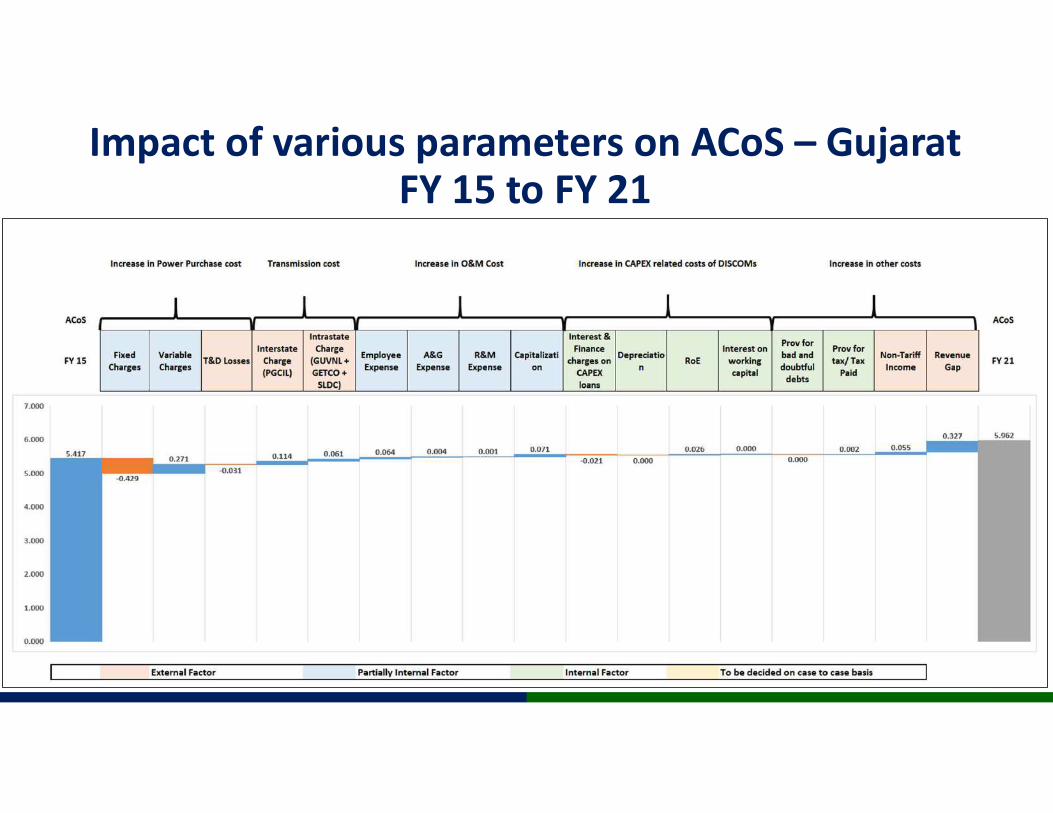
Copyright © IIT Kanpur
Impact of various parameters on ACoS – GujaratFY 15 to FY 21
31

Copyright © IIT Kanpur
Cost of Power Procurement:LT Demand Forecasting and Power Procurement Planning
32
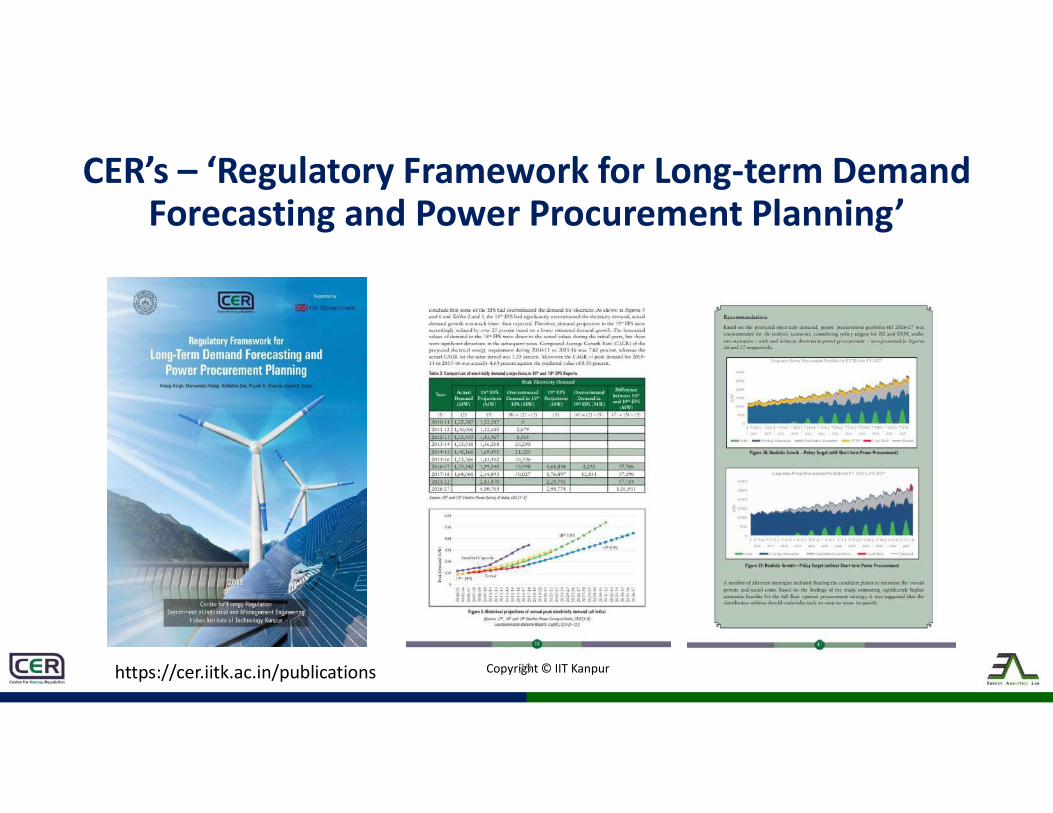
Copyright © IIT Kanpur
CER’s – ‘Regulatory Framework for Long-term Demand Forecasting and Power Procurement Planning’
35https://cer.iitk.ac.in/publications

Copyright © IIT Kanpur
Historical projections of annual peak electricity demand (All India)
37
So: Singh et al. (2019), Regulatory Framework for Long-Term Demand Forecasting and Power Procurement Planning, Centre for Energy Regulation, IIT Kanpur (Book ISBN: 978-93-5321-969-7); https://cer.iitk.ac.in/publications

Copyright © IIT Kanpur
Actual peak demand vs. projections (Maharashtra)
38

Copyright © IIT Kanpur
Actual peak demand vs. projections (NCT Delhi)
39
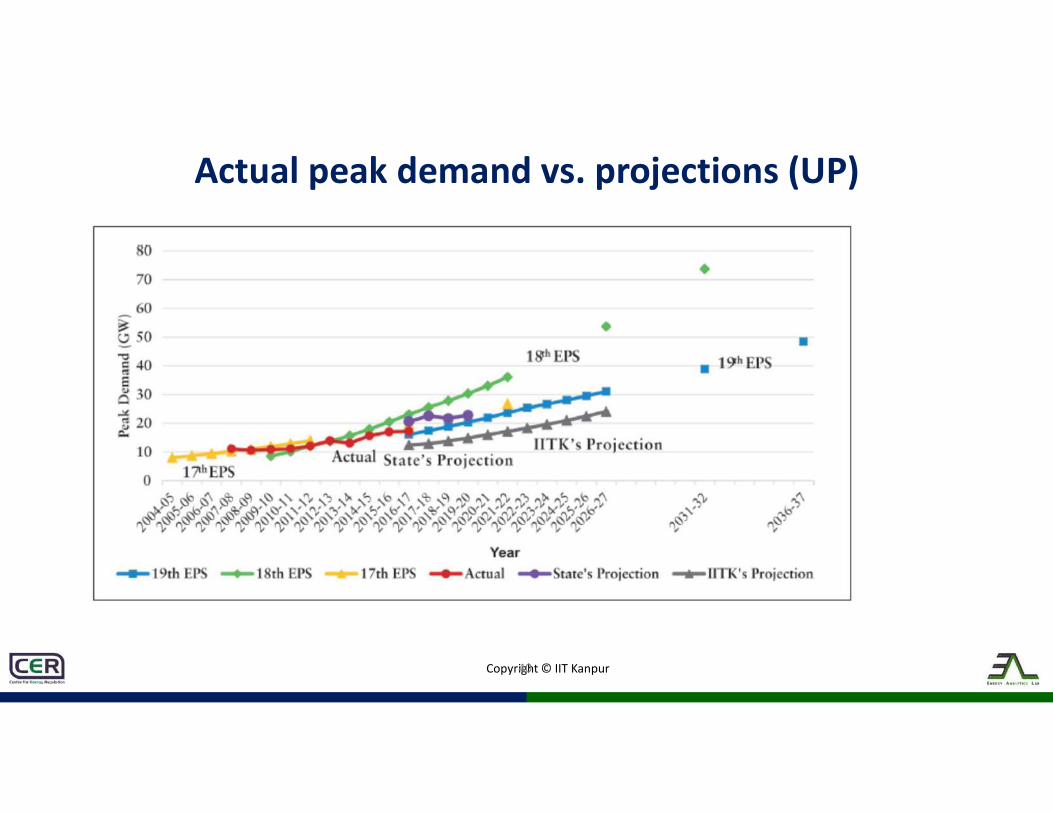
Copyright © IIT Kanpur
Actual peak demand vs. projections (UP)
40

Copyright © IIT Kanpur
Actual energy demand vs. projections (UP)
41
Copyright © IIT Kanpur
Cost of Power Procurement – Key Recommendations
• Power Procurement to be considered ‘controllable/ partially controllable’ over medium- to long-term.
• Separate Regulatory Process for ‘Demand Forecasting and Power Procurement Planning’
• MT & LT Demand Forecasting and Power Procurement Planning every 3-5 year with annual revision
• Explore flexibility in historical PPAs• Strict Adherence to MoD, with public disclosure for
deviations with reasons thereof.42
Copyright © IIT Kanpur
Regulatory Approach to Generation Tariff
• Trajectory of norms for SHR reduction• Aux Consumption – Non-revision of norms• Investment approval to meet the above targets, based
on a cost-benefit analysis.• Normative cost recovery should be linked to
incentives for achieving efficiency targets.
43

Copyright © IIT Kanpur
Norms for operation for Thermal Generating Stations
1800
2000
2200
2400
2600
2800
3000
3200
2016-17 2017-18 2018-19 2019-20 2020-21 2021-22 2022-23 2023-24 2024-25 2025-26
SHR (kCal/kWh)
GERC UkaiTPS (Unit 1- 5) GERC GandhinagarTPS (Unit 1- 4) GERC GandhinagarTPS (Unit 5) GERC GandhinagarTPS (Unit 3- 4) GERC WanakboriTPS (Unit 1-6)
GERC WanakboriTPS (Unit 7) GERC SikkaTPS GERC Kutch Lignite (Unit 1-3) GERC Kutch Lignite (Unit 4) GERC DhuvaranCCPP - 2
GERC Ukai-6 GERC DhuvaranCCPP-3 GERC DhuvaranCCPP-1 GERC Sikka 3 & 4 GERC Utran Extension
GERC Sabarmati ‘C’ GERC Sabarmati 'D' GERC Sabarmati 'E' & 'F' CSERC 200/210/250 MW CSERC 300/500 MW
CSERC DSPM CSERC HTPS
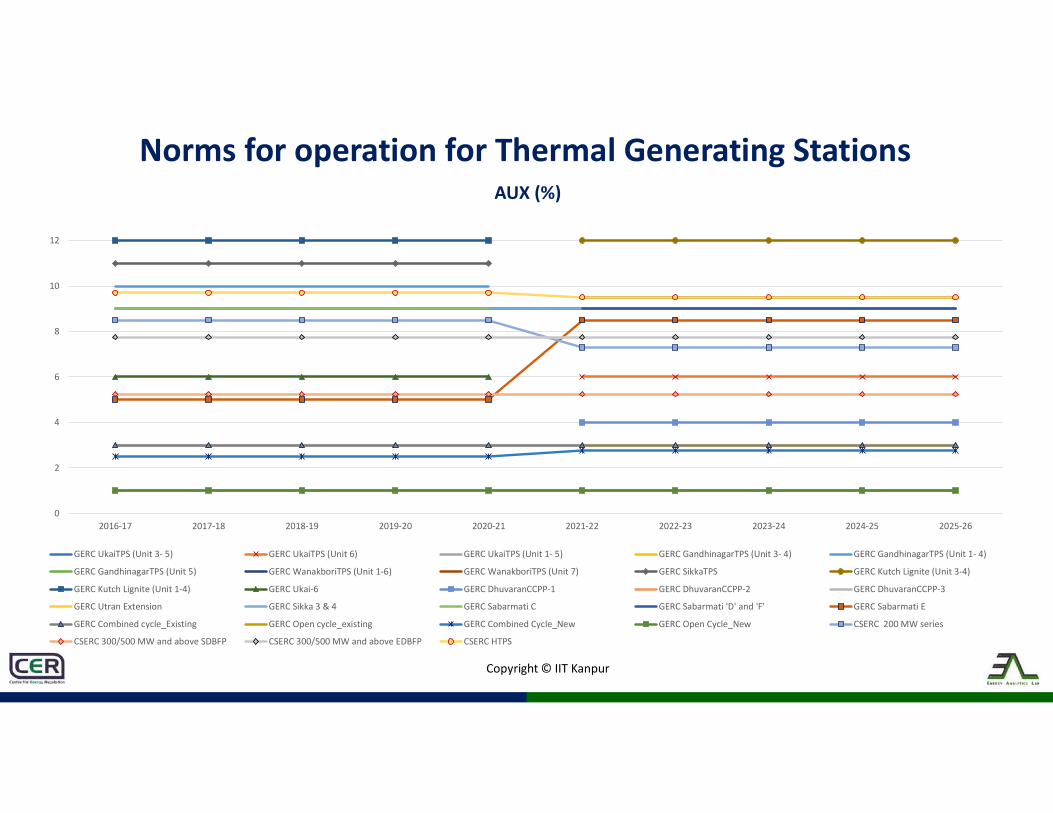
Copyright © IIT Kanpur
Norms for operation for Thermal Generating Stations
0
2
4
6
8
10
12
2016-17 2017-18 2018-19 2019-20 2020-21 2021-22 2022-23 2023-24 2024-25 2025-26
AUX (%)
GERC UkaiTPS (Unit 3- 5) GERC UkaiTPS (Unit 6) GERC UkaiTPS (Unit 1- 5) GERC GandhinagarTPS (Unit 3- 4) GERC GandhinagarTPS (Unit 1- 4)
GERC GandhinagarTPS (Unit 5) GERC WanakboriTPS (Unit 1-6) GERC WanakboriTPS (Unit 7) GERC SikkaTPS GERC Kutch Lignite (Unit 3-4)
GERC Kutch Lignite (Unit 1-4) GERC Ukai-6 GERC DhuvaranCCPP-1 GERC DhuvaranCCPP-2 GERC DhuvaranCCPP-3
GERC Utran Extension GERC Sikka 3 & 4 GERC Sabarmati C GERC Sabarmati 'D' and 'F' GERC Sabarmati E
GERC Combined cycle_Existing GERC Open cycle_existing GERC Combined Cycle_New GERC Open Cycle_New CSERC 200 MW series
CSERC 300/500 MW and above SDBFP CSERC 300/500 MW and above EDBFP CSERC HTPS
Copyright © IIT Kanpur
Fuel Supply Options - Key Suggestions
• Post coal sector liberalisation - Generating companies to explore alternate coal supply based on demonstrated cost reduction and improvement in GCV received.
• Channelise Clean Energy Cess to power sector - for RE/clean energy development and, to fund investment for improving efficiency and flexibility of thermal generating assets.
46
Copyright © IIT Kanpur
THANK YOU
cer.iitk.ac.in eal.iitk.ac.in
Copyright © IIT Kanpur
Centre for Energy Regulation (CER)
cer.iitk.ac.in
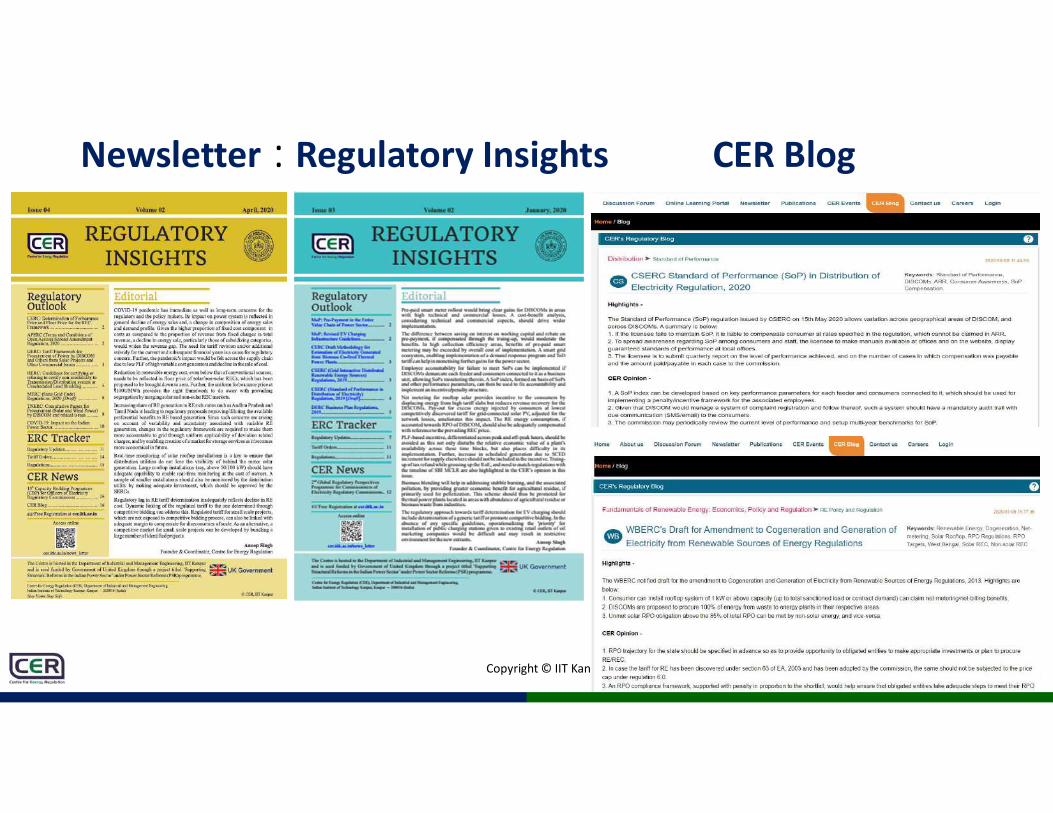
Copyright © IIT Kanpur
Newsletter : Regulatory Insights CER Blog
Copyright © IIT Kanpur
CER’s Regulatory Database Dashboard & Online Learning Platform (under development)
08-12-2020
Copyright © IIT Kanpur
Monograph – ‘Regulatory Framework for Long-term Demand Forecasting and Power Procurement Planning’
51

Copyright © IIT Kanpur
Energy Analytics Lab (EAL)
eal.iitk.ac.in/
Copyright © IIT Kanpur
All India Demand-met & Generation - Snapshot
53

Copyright © IIT Kanpur
Power Map Dashboard (NEW)
54
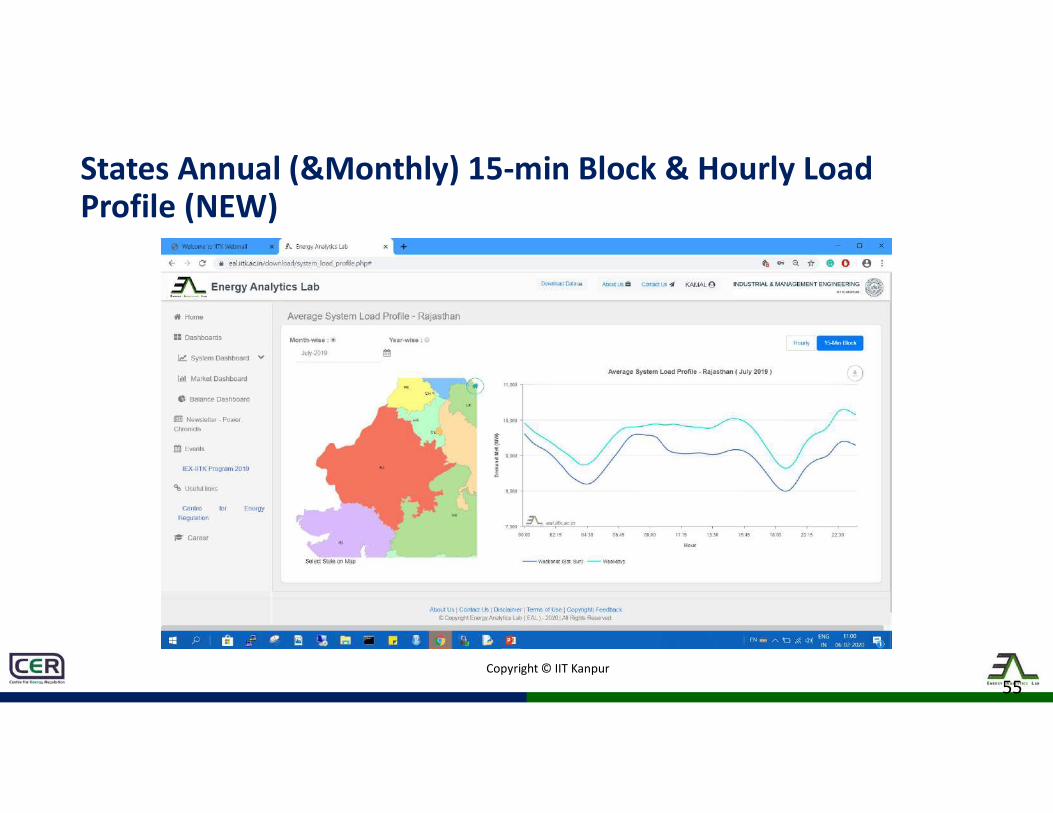
Copyright © IIT Kanpur
States Annual (&Monthly) 15-min Block & Hourly Load Profile (NEW)
55

Copyright © IIT Kanpur
All India Annual & Monthly 15-min & Hourly RE Generation Profile (NEW)
56
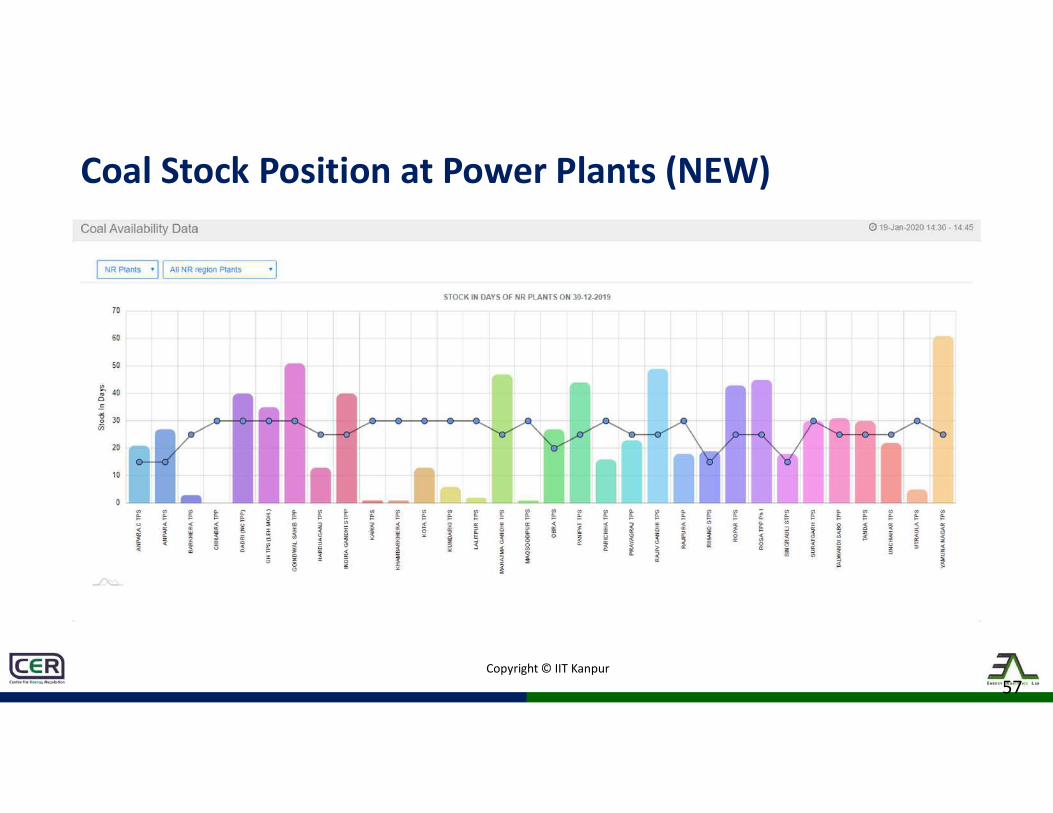
Copyright © IIT Kanpur
Coal Stock Position at Power Plants (NEW)
57
Copyright © IIT Kanpur
Power Market Dashboard
Copyright © IIT Kanpur
EAL Newsletter – Power Chronicle
59

Copyright © IIT Kanpur
Register to access resources
EAL’s Android AppCER’s Android App
cer.iitk.ac.in
eal.iitk.ac.in

Under-utilization of
generating stations and
procurement from
renewable sources

2
Under-utilization of generating stations Hypothesis: Optimal utilization of TPPs may lead to reduction in electricity tariffs
Shortage of coal 1
Generating plants running on technical
minimum due to higher energy availability. 2
Not following Merit Order Dispatch
properly 3
Targets set by Ministry of Power for RE
procurement 4
Reason for under-utilization of generating station
Issue of coal shortage and technical minimum can be handled by retiring old coal based TPP as discussed in
previous section. States like Madhya Pradesh, Gujarat, Andhra Pradesh etc. are surplus states.
Recently, MERC has issued guidelines for operation of Merit Order Dispatch under availability-based tariff
order. Other states can examine the same in their state as per their Energy Gap scenario. Detailed regarding
the guidelines issued by MERC are provided in subsequent slides. Proper implementation of MOD can improve
the utilization of Generating Station.
Procurement of Renewable Energy is one of the reason for under-utilization of Generating Stations.
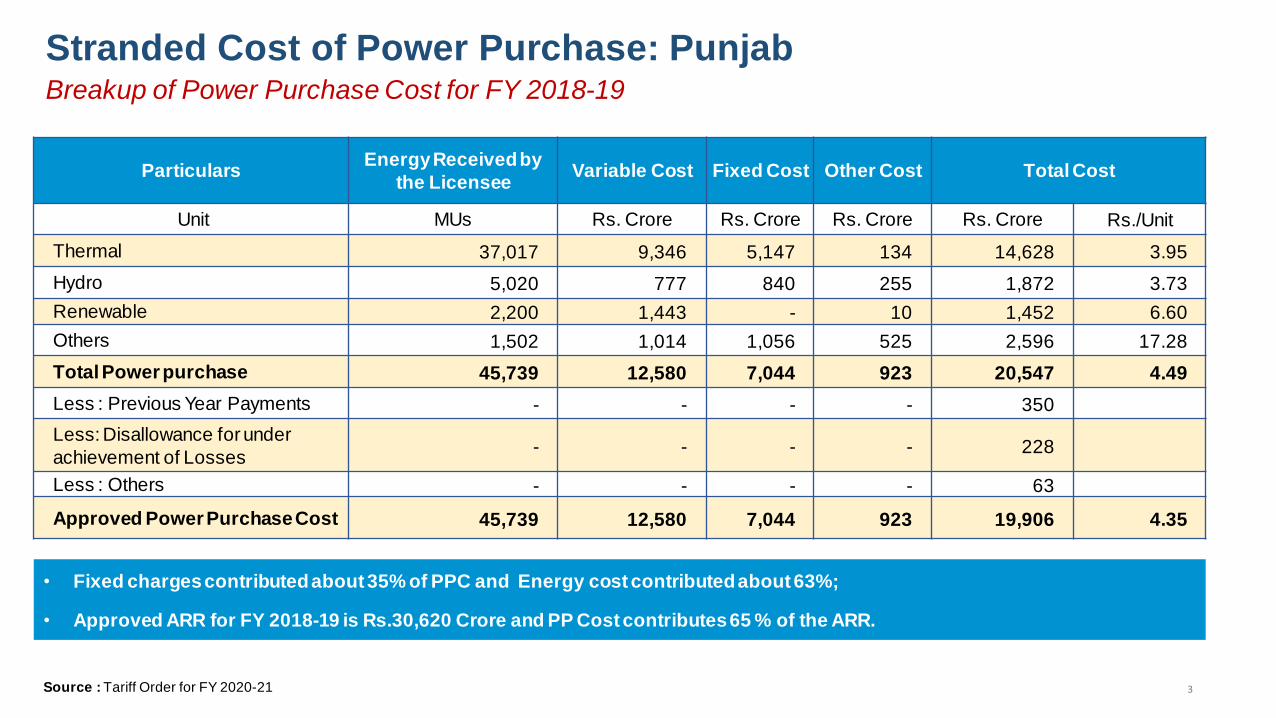
3
Stranded Cost of Power Purchase: Punjab
• Fixed charges contributed about 35% of PPC and Energy cost contributed about 63%;
• Approved ARR for FY 2018-19 is Rs.30,620 Crore and PP Cost contributes 65 % of the ARR.
Source : Tariff Order for FY 2020-21
Particulars Energy Received by
the Licensee Variable Cost Fixed Cost Other Cost Total Cost
Unit MUs Rs. Crore Rs. Crore Rs. Crore Rs. Crore Rs./Unit
Thermal 37,017 9,346 5,147 134 14,628 3.95
Hydro 5,020 777 840 255 1,872 3.73
Renewable 2,200 1,443 - 10 1,452 6.60
Others 1,502 1,014 1,056 525 2,596 17.28
Total Power purchase 45,739 12,580 7,044 923 20,547 4.49
Less : Previous Year Payments - - - - 350
Less: Disallowance for under
achievement of Losses - - - - 228
Less : Others - - - - 63
Approved Power Purchase Cost 45,739 12,580 7,044 923 19,906 4.35
Breakup of Power Purchase Cost for FY 2018-19

4
Particulars Units Value
Energy Requirement MU 57,277
Energy Surrendered MU 8,571
Fixed Cost Paid Rs. Crore 977
Per Unit Fixed Cost Rs./Unit 1.14
Details of surrendered power
Generating Stations Energy
(MU)
Fixed Cost (Rs
Crore) Rs./Unit
NTPC Stations 2,481 176 0.71
IPP's 5,086 687 1.35
Pragati Gas Plant 586 64 1.09
DVC 210 35 1.67
UMPP's 207 15 0.73
Total 8,571 977 1.14
Stranded Cost of Power Purchase: Punjab Details of Surrendered Power for FY 2018-19
Source: True-up petition for FY 2018-19
• The state has surrendered 8,571 MUs of power (15% of the total energy requirement in 2018-19)

5
Generating Station Actual PLF
Net
Generation
Actual per Unit
Fixed Cost
Normative
per Unit Fixed Cost
Variable Cost
Total Cost
(Actual PLF)
Total Cost
(Normative PLF)
% MU Rs./Unit Rs./Unit Rs./Unit Rs./Unit Rs./Unit
GGSSTP,Ropar 23.4% 1,573 3.26 0.90 3.33 6.59 4.23
GHTP Lehra 30.5% 2,245 2.08 0.75 3.33 5.41 4.08
Stranded Cost of Power Purchase: Punjab
Proportion of Surplus Fixed Cost to ARR
Approved Sales for FY 2018-19 MU 49,613
Approved ARR Rs. Crore 30,620
Approved ACoS Rs./Unit 6.17
Fixed Cost Paid for Surrendered Power Rs. Crore 977
Ratio of Fixed Cost Paid to ARR 3.2%
Surplus Energy Surrendered
• Apart from the surrendered surplus energy ,Thermal Power Plants are operating at a lower PLF.
• Contribution of fixed cost paid for surplus power is around 3.2% to the ARR approved by the State Commission.
• Impact of Surplus Power on ACOS is around 20 paise/unit (3.2%)
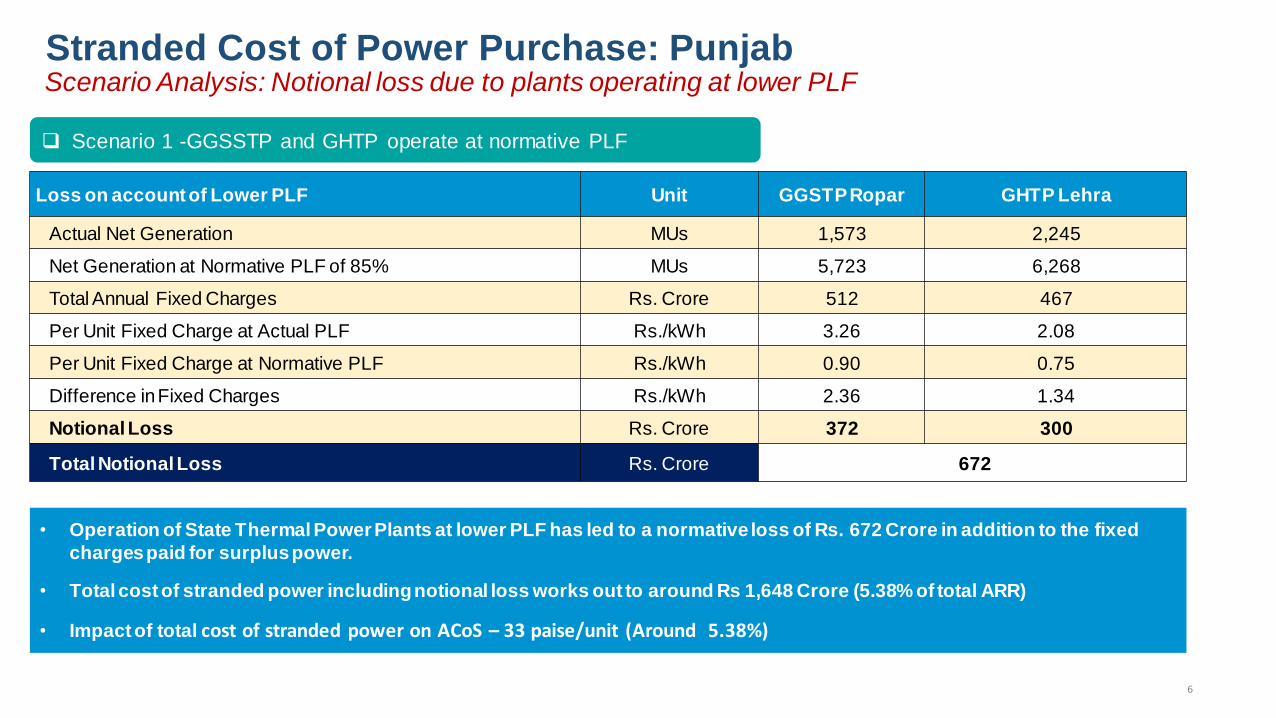
6
Scenario 1 -GGSSTP and GHTP operate at normative PLF
Loss on account of Lower PLF Unit GGSTP Ropar GHTP Lehra
Actual Net Generation MUs 1,573 2,245
Net Generation at Normative PLF of 85% MUs 5,723 6,268
Total Annual Fixed Charges Rs. Crore 512 467
Per Unit Fixed Charge at Actual PLF Rs./kWh 3.26 2.08
Per Unit Fixed Charge at Normative PLF Rs./kWh 0.90 0.75
Difference in Fixed Charges Rs./kWh 2.36 1.34
Notional Loss Rs. Crore 372 300
Total Notional Loss Rs. Crore 672
Stranded Cost of Power Purchase: Punjab Scenario Analysis: Notional loss due to plants operating at lower PLF
• Operation of State Thermal Power Plants at lower PLF has led to a normative loss of Rs. 672 Crore in addition to the fixed
charges paid for surplus power.
• Total cost of stranded power including notional loss works out to around Rs 1,648 Crore (5.38% of total ARR)
• Impact of total cost of stranded power on ACoS – 33 paise/unit (Around 5.38%)
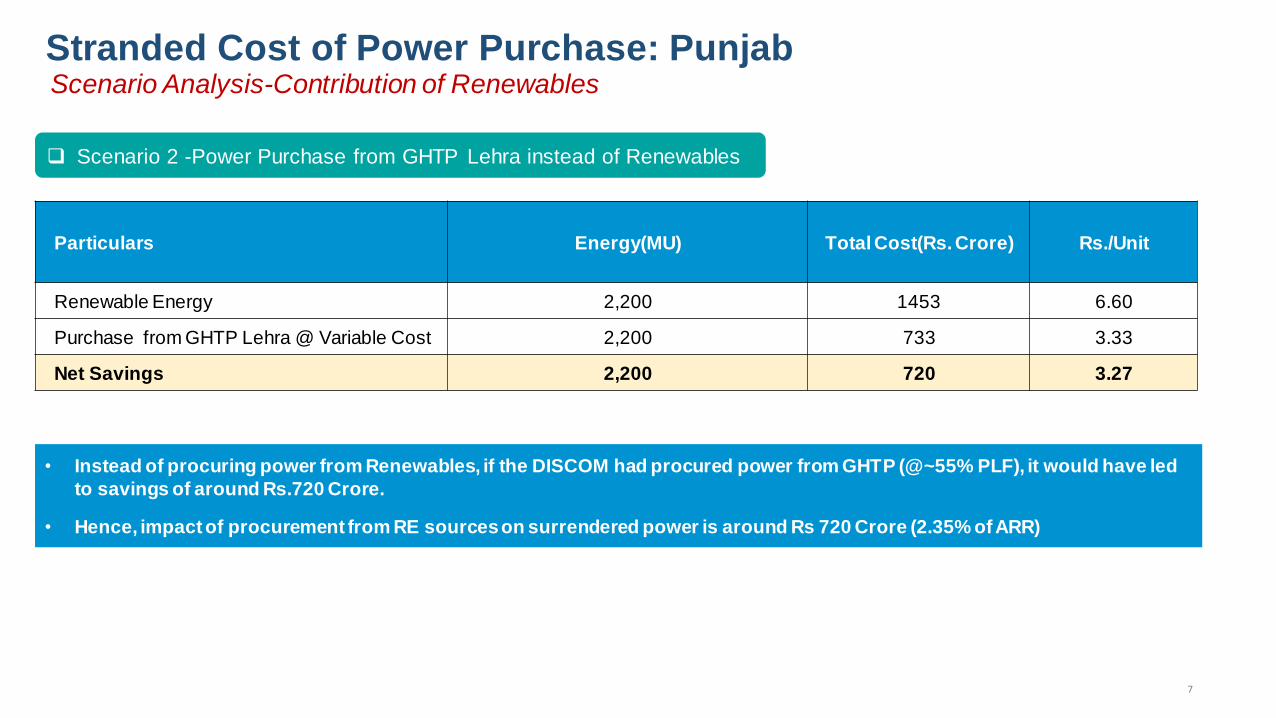
7
Stranded Cost of Power Purchase: Punjab Scenario Analysis-Contribution of Renewables
Particulars Energy(MU) Total Cost(Rs. Crore) Rs./Unit
Renewable Energy 2,200 1453 6.60
Purchase from GHTP Lehra @ Variable Cost 2,200 733 3.33
Net Savings 2,200 720 3.27
Scenario 2 -Power Purchase from GHTP Lehra instead of Renewables
• Instead of procuring power from Renewables, if the DISCOM had procured power from GHTP (@~55% PLF), it would have led
to savings of around Rs.720 Crore.
• Hence, impact of procurement from RE sources on surrendered power is around Rs 720 Crore (2.35% of ARR)
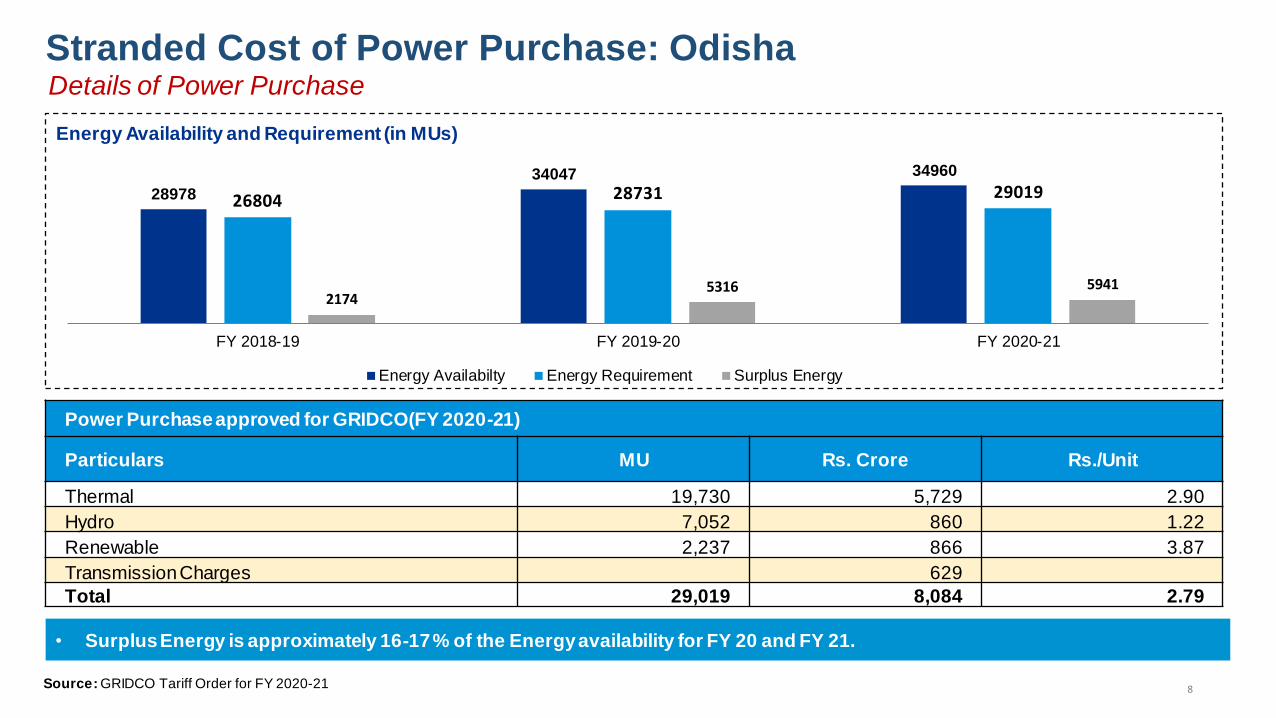
8 Source: GRIDCO Tariff Order for FY 2020-21
28978
34047 34960
26804 28731 29019
2174 5316 5941
FY 2018-19 FY 2019-20 FY 2020-21
Energy Availability and Requirement (in MUs)
Energy Availabilty Energy Requirement Surplus Energy
Power Purchase approved for GRIDCO(FY 2020-21)
Particulars MU Rs. Crore Rs./Unit
Thermal 19,730 5,729 2.90
Hydro 7,052 860 1.22
Renewable 2,237 866 3.87
Transmission Charges 629
Total 29,019 8,084 2.79
Stranded Cost of Power Purchase: Odisha Details of Power Purchase
• Surplus Energy is approximately 16-17 % of the Energy availability for FY 20 and FY 21.
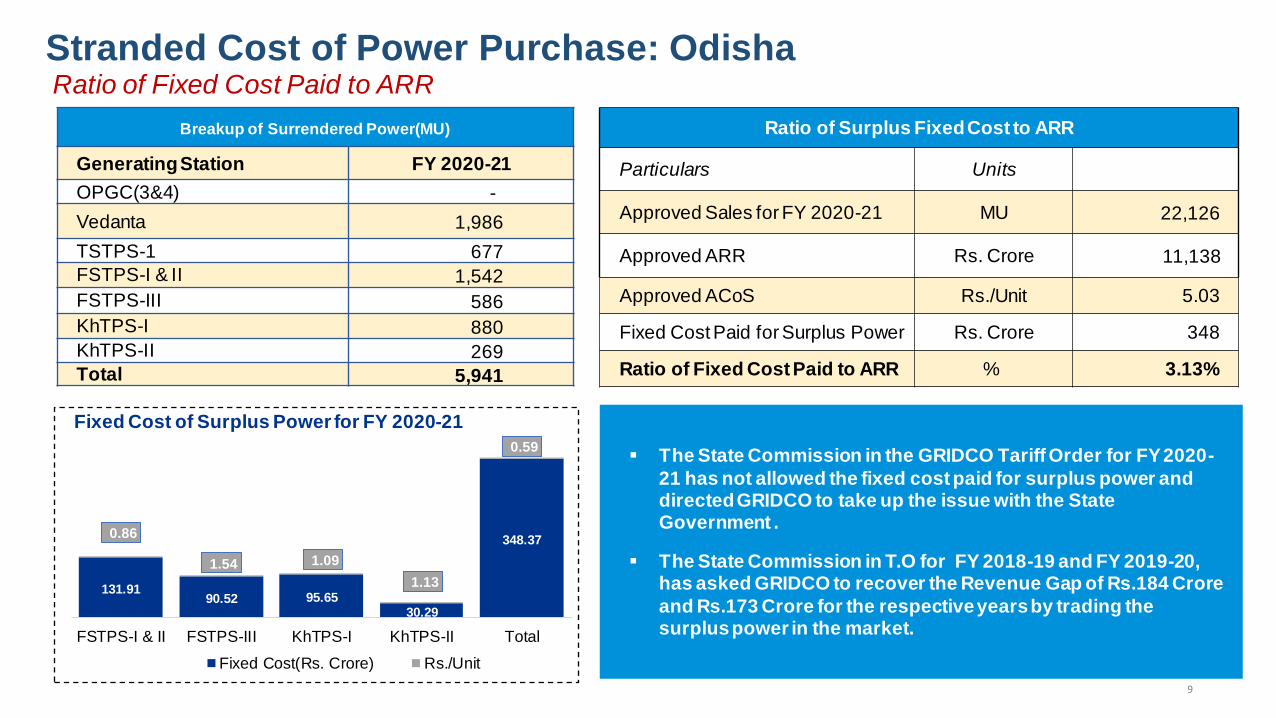
9
Breakup of Surrendered Power(MU)
Generating Station FY 2020-21
OPGC(3&4) -
Vedanta 1,986
TSTPS-1 677
FSTPS-I & II 1,542
FSTPS-III 586
KhTPS-I 880
KhTPS-II 269
Total 5,941
131.91 90.52 95.65
30.29
348.37 0.86
1.54 1.09
1.13
0.59
FSTPS-I & II FSTPS-III KhTPS-I KhTPS-II Total
Fixed Cost of Surplus Power for FY 2020-21
Fixed Cost(Rs. Crore) Rs./Unit
Ratio of Surplus Fixed Cost to ARR
Particulars Units
Approved Sales for FY 2020-21 MU 22,126
Approved ARR Rs. Crore 11,138
Approved ACoS Rs./Unit 5.03
Fixed Cost Paid for Surplus Power Rs. Crore 348
Ratio of Fixed Cost Paid to ARR % 3.13%
The State Commission in the GRIDCO Tariff Order for FY 2020-
21 has not allowed the fixed cost paid for surplus power and directed GRIDCO to take up the issue with the State Government .
The State Commission in T.O for FY 2018-19 and FY 2019-20, has asked GRIDCO to recover the Revenue Gap of Rs.184 Crore
and Rs.173 Crore for the respective years by trading the surplus power in the market.
Stranded Cost of Power Purchase: Odisha Ratio of Fixed Cost Paid to ARR

10
Stranded Cost of Power Purchase : Madhya Pradesh
• Approved ARR for FY 2019-20 is Rs.32,797 Crore and PP Cost contributes 66 % of the ARR (excluding Transmission Charges).
Source : Tariff Order for FY 2019-20 * Per unit total cost has been estimated using input energy for the DISCOM
Particulars Energy Received by the
Licensee Variable Cost Fixed Cost Total Cost*
Unit MUs Rs. Crore Rs. Crore Rs. Crore Rs./Unit
Thermal 79,744 16,375 9,733 26,108 3.27
Hydro 5,798 - 1,343 1,343 2.32
Renewable 7,644 4,211 - 4,211 5.51
Others 2,282 673 - 673 2.95
Total Power purchase 95,468 21,259 11,076 32,335 3.39
Revenue for Surplus Power 9,888
MPPMCL Cost (730)
Net Power Purchase Cost allowed 95,468 21,259 11,076 21,717 2.27
Breakup of Power Purchase Cost for FY 2019-20
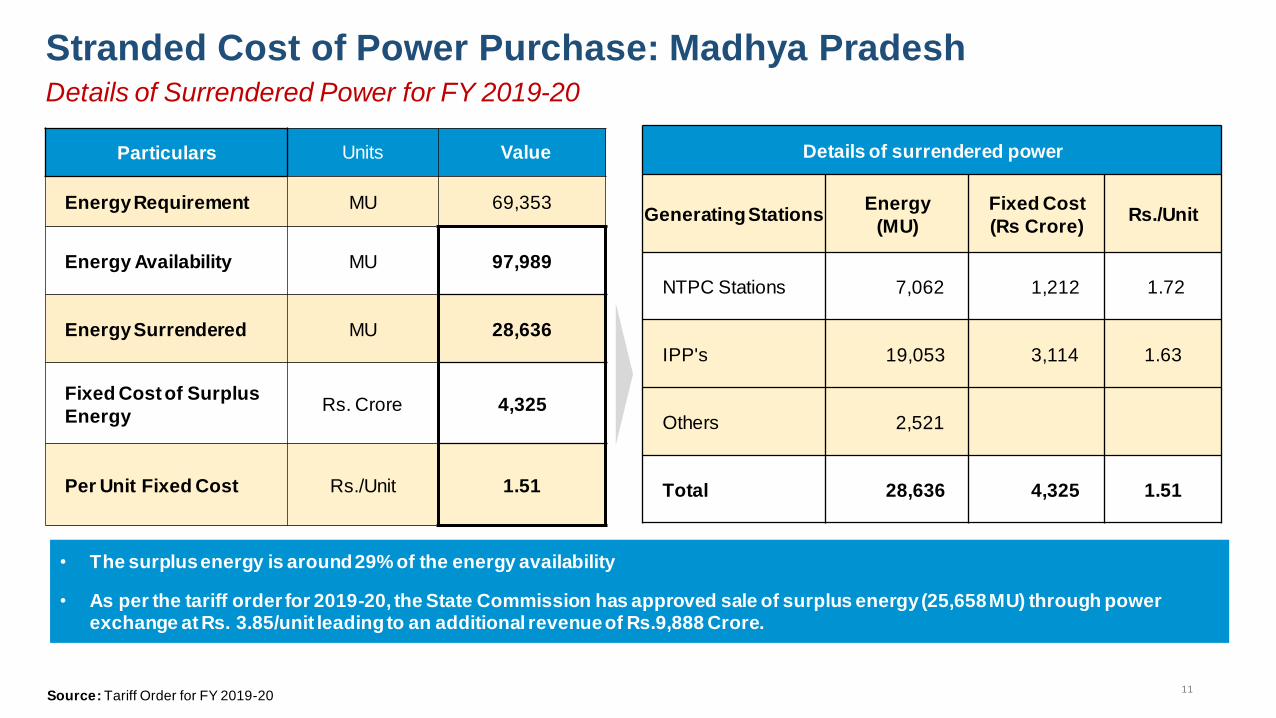
11
Particulars Units Value
Energy Requirement MU 69,353
Energy Availability MU 97,989
Energy Surrendered MU 28,636
Fixed Cost of Surplus
Energy Rs. Crore 4,325
Per Unit Fixed Cost Rs./Unit 1.51
Details of surrendered power
Generating Stations Energy
(MU)
Fixed Cost
(Rs Crore) Rs./Unit
NTPC Stations 7,062 1,212 1.72
IPP's 19,053 3,114 1.63
Others 2,521
Total 28,636 4,325 1.51
Stranded Cost of Power Purchase: Madhya Pradesh Details of Surrendered Power for FY 2019-20
Source: Tariff Order for FY 2019-20
• The surplus energy is around 29% of the energy availability
• As per the tariff order for 2019-20, the State Commission has approved sale of surplus energy (25,658 MU) through power exchange at Rs. 3.85/unit leading to an additional revenue of Rs.9,888 Crore.

12
Stranded Cost of Power Purchase: Madhya Pradesh Ratio of Surplus Fixed Cost to ARR
• Impact of surplus power on ACoS is around 78 paise/unit (13.19%)
• Instead of procuring power from Renewables, if the DISCOM had procured power from thermal stations , it would have led to savings of around Rs. 2,641 Crore (8% of ARR)
Ratio of Surplus Fixed Cost to ARR
Particulars Units
Approved Sales for FY 2019-20 MU 55,638
Approved ARR Rs. Crore 32,796
Approved ACoS Rs./Unit 5.89
Fixed Cost for Surplus Power Rs. Crore 4,325
Ratio of Fixed Cost Paid to ARR % 13.19%
Scenario - Power Purchase from Thermal instead of Renewables
Particulars Energy(MU) Total Cost(Rs. Crore) Rs./Unit
Renewable Energy 7,464 4211 5.64
Purchase from Thermal Stations @ Variable
Cost 7,464 1570 2.10
Net Savings 7,464 2,641 3.54

13
Stranded Cost of Power Purchase : JBVNL, Jharkhand
• Approved ARR for FY 2020-21 is Rs.6,326 Crore and PP Cost contributes 72 % of the ARR (excluding Transmission Charges).
Source : Tariff Order for FY 2020-21 *The Commission has estimated energy availability for FY 2020-21 on the basis of actual generation from tied-up power from Central, State-owned and other Generating Stations
Particulars Energy Received by the
Licensee Variable Cost Fixed Cost Total Cost
Unit MUs Rs. Crore Rs. Crore Rs. Crore Rs./Unit
Thermal 9,206 1,902 1,898 3,800 4.13
Hydro 910 154 53 208 2.28
Renewable 1,632 535 - 535 3.28
Total Power purchase 11,749 2,591 1,951 4,543 3.87
Breakup of Power Purchase Cost for FY 2020-21
Particulars Units Value
Energy Availability* MU 11,372
Energy Requirement MU 11,372
Fixed Cost of Surplus Energy Rs. Crore 563

14
Stranded Cost of Power Purchase : JBVNL, Jharkhand Ratio of Surplus Fixed Cost to ARR
• Impact of Surplus Power on ACoS is around 57 paise/unit (8.90%)
• Instead of procuring power from Renewables, if the DISCOM had procured power from thermal stations , it would have led to savings of around Rs. 198 Crore (3.1% of ARR)
Ratio of Surplus Fixed Cost to ARR
Particulars Units
Approved Sales for FY 2020-21 MU 9,894
Approved ARR Rs. Crore 6,326
Approved ACoS Rs./Unit 6.39
Fixed Cost for Surplus Power Rs. Crore 563
Ratio of Fixed Cost Paid to ARR % 8.90%
Scenario -Power Purchase from Thermal Stations instead of Renewables
Particulars Energy(MU) Total Cost(Rs. Crore) Rs./Unit
Renewable Energy 1,632 535 3.28
Purchase from Thermal Stations @ Variable Cost 1,632 337 2.07
Net Savings 1,632 198 1.21
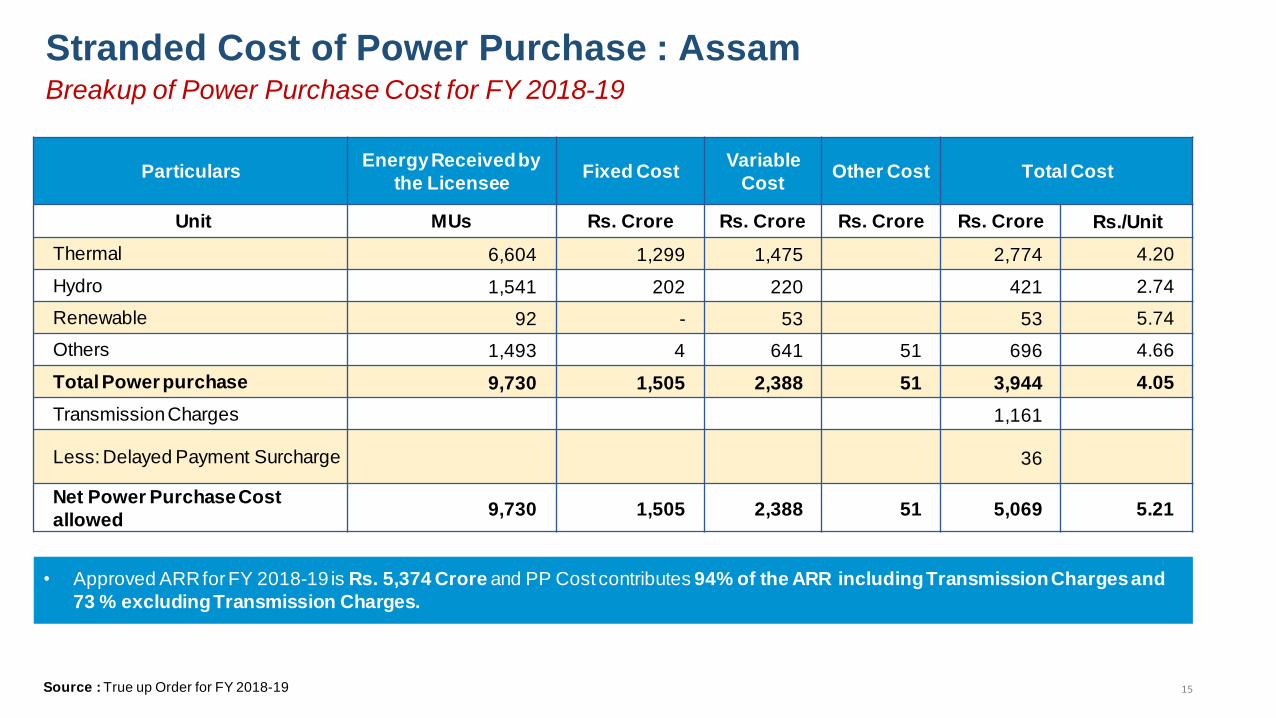
15
Stranded Cost of Power Purchase : Assam
• Approved ARR for FY 2018-19 is Rs. 5,374 Crore and PP Cost contributes 94% of the ARR including Transmission Charges and
73 % excluding Transmission Charges.
Source : True up Order for FY 2018-19
Particulars Energy Received by
the Licensee Fixed Cost
Variable
Cost Other Cost Total Cost
Unit MUs Rs. Crore Rs. Crore Rs. Crore Rs. Crore Rs./Unit
Thermal 6,604 1,299 1,475 2,774 4.20
Hydro 1,541 202 220 421 2.74
Renewable 92 - 53 53 5.74
Others 1,493 4 641 51 696 4.66
Total Power purchase 9,730 1,505 2,388 51 3,944 4.05
Transmission Charges 1,161
Less: Delayed Payment Surcharge 36
Net Power Purchase Cost
allowed 9,730 1,505 2,388 51 5,069 5.21
Breakup of Power Purchase Cost for FY 2018-19
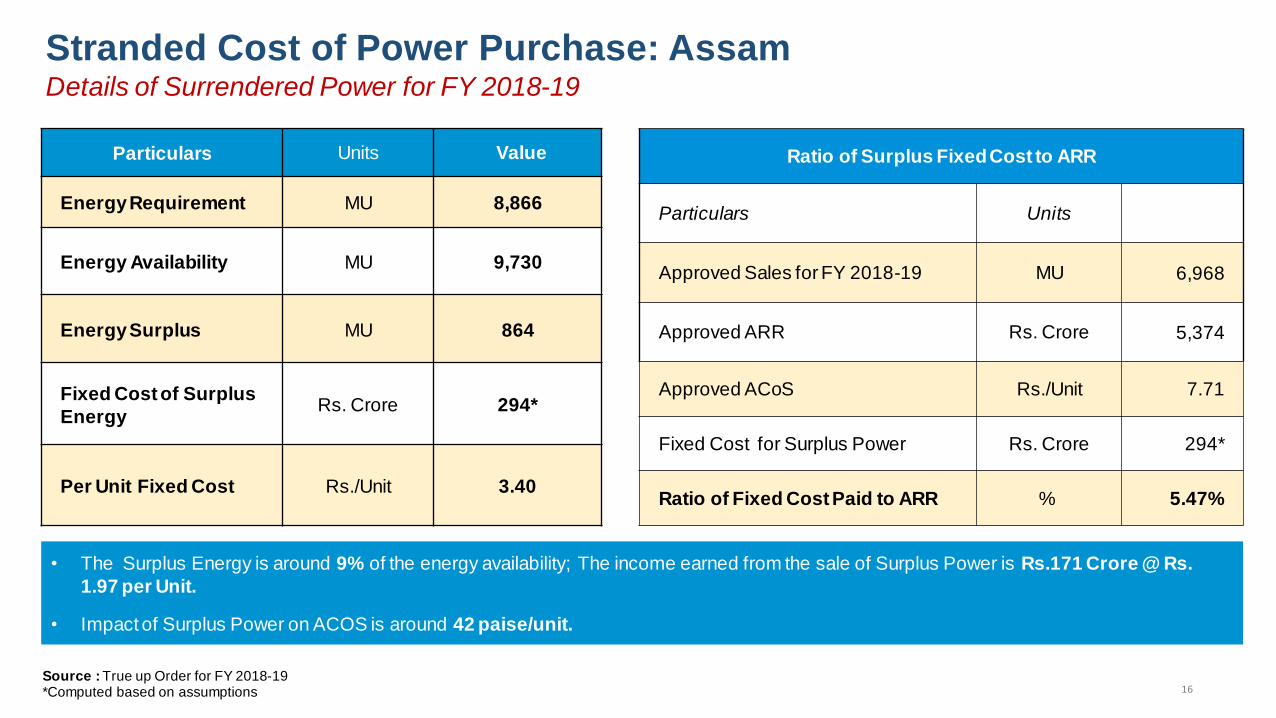
16
Particulars Units Value
Energy Requirement MU 8,866
Energy Availability MU 9,730
Energy Surplus MU 864
Fixed Cost of Surplus
Energy Rs. Crore 294*
Per Unit Fixed Cost Rs./Unit 3.40
Stranded Cost of Power Purchase: Assam Details of Surrendered Power for FY 2018-19
• The Surplus Energy is around 9% of the energy availability; The income earned from the sale of Surplus Power is Rs.171 Crore @ Rs.
1.97 per Unit.
• Impact of Surplus Power on ACOS is around 42 paise/unit.
Ratio of Surplus Fixed Cost to ARR
Particulars Units
Approved Sales for FY 2018-19 MU 6,968
Approved ARR Rs. Crore 5,374
Approved ACoS Rs./Unit 7.71
Fixed Cost for Surplus Power Rs. Crore 294*
Ratio of Fixed Cost Paid to ARR % 5.47%
Source : True up Order for FY 2018-19 *Computed based on assumptions

17
Stranded Cost of Power Purchase: Assam Scenario Analysis-Contribution of Renewables
• Instead of procuring power from Renewables, if the DISCOM had procured power from thermal stations , it would
have led to savings of around Rs. 32 Crore (0.6% of the ARR)
Scenario -Power Purchase from Thermal instead of Renewables
Particulars Energy(MU) Total Cost(Rs. Crore) Rs./Unit
Renewable Energy 92 53 5.74
Purchase from Thermal Stations @ Variable
Cost 92 21 2.23
Net Savings 92 32 3.51

18
Stranded Cost of Power Purchase : Uttarakhand
• Approved ARR for FY 2020-21 is Rs.6,957 Crore and PP Cost contributes 75% of the ARR.
Source : Tariff Order for FY 2020-21
Particulars Energy Received by the
Licensee Variable Cost Fixed Cost Total Cost
Unit MUs Rs. Crore Rs. Crore Rs. Crore Rs./Unit
Thermal 6,225 1,991 734 3,800 4.13
Hydro 6,312 953 577 208 2.28
Renewable 1,477 672 - 535 3.28
Others 282 101 - Total Power purchase 14,295 3,717 1,311 5,028 3.52
Short Term (Tied Up) & Deficit Purchase 487 195 Banking including OA Charges 49 30 Net Power Purchase Cost allowed 14,832 3,942 1,311 5,252 3.54
Breakup of Power Purchase Cost for FY 2020-21
Particulars Units Value
Energy Requirement MU 14,832
Energy Availability MU 14,295
Energy Deficit MU 536

19
Stranded Cost of Power Purchase: Uttarakhand Scenario Analysis-Contribution of Renewables
• Instead of procuring power from Renewables, if the DISCOM had procured power from Thermal Stations , it would have led to savings
of around Rs. 200 Crore (2.8% of ARR)
Scenario - Power Purchase from Thermal instead of Renewables
Particulars Energy(MU) Total Cost(Rs. Crore) Rs./Unit
Renewable Energy 1,477 672 4.55
Purchase from Thermal Stations @ Variable
Cost 1,477 472 3.20
Net Savings 1,477 200 1.35

20
Stranded Cost of Power Purchase: Bihar
• Approved ARR for FY 2020-21 is Rs. 18,528 Crore and PP Cost contributes 73% of the ARR excluding Transmission Charges
Source : Tariff Order for FY 2020-21
Particulars Energy Received by
the Licensee Fixed Cost
Variable
Cost Other Cost Total Cost
Unit MUs Rs. Crore Rs. Crore Rs. Crore Rs. Crore Rs./Unit
Thermal 25,425 5,489 5,552 135 11,175 4.40
Hydro 3,117 150 833 983 3.15
Renewable 3,026 - 1,084 1,084 3.58
Others 816 - 342 342 4.19
Total Power purchase 32,384 5,639 7,811 135 13,584 4.19
Breakup of Power Purchase Cost for FY 2020-21

21
Particulars Units Value
Energy Requirement MU 32,384
Energy Availability MU 46,686
Energy Surplus MU 14,301
Fixed Cost of Surplus
Energy Rs. Crore 1,294*
Per Unit Fixed Cost Rs./Unit 0.91
Stranded Cost of Power Purchase: Bihar Details of Surrendered Power for FY 2020-21
• The surplus energy is around 31% of the energy availability,
• Impact of surplus power on ACOS is around 6.99% (48 paise/unit)
Ratio of Surplus Fixed Cost to ARR
Particulars Units
Approved Sales MU 26,499
Approved ARR Rs. Crore 18,528
Approved ACoS Rs./Unit 6.99
Fixed Cost for Surplus Power Rs. Crore 1,294*
Ratio of Fixed Cost Paid to ARR % 6.99%
*Computed on the basis of Station wise Surplus Energy Source : Tariff Order for FY 2020-21
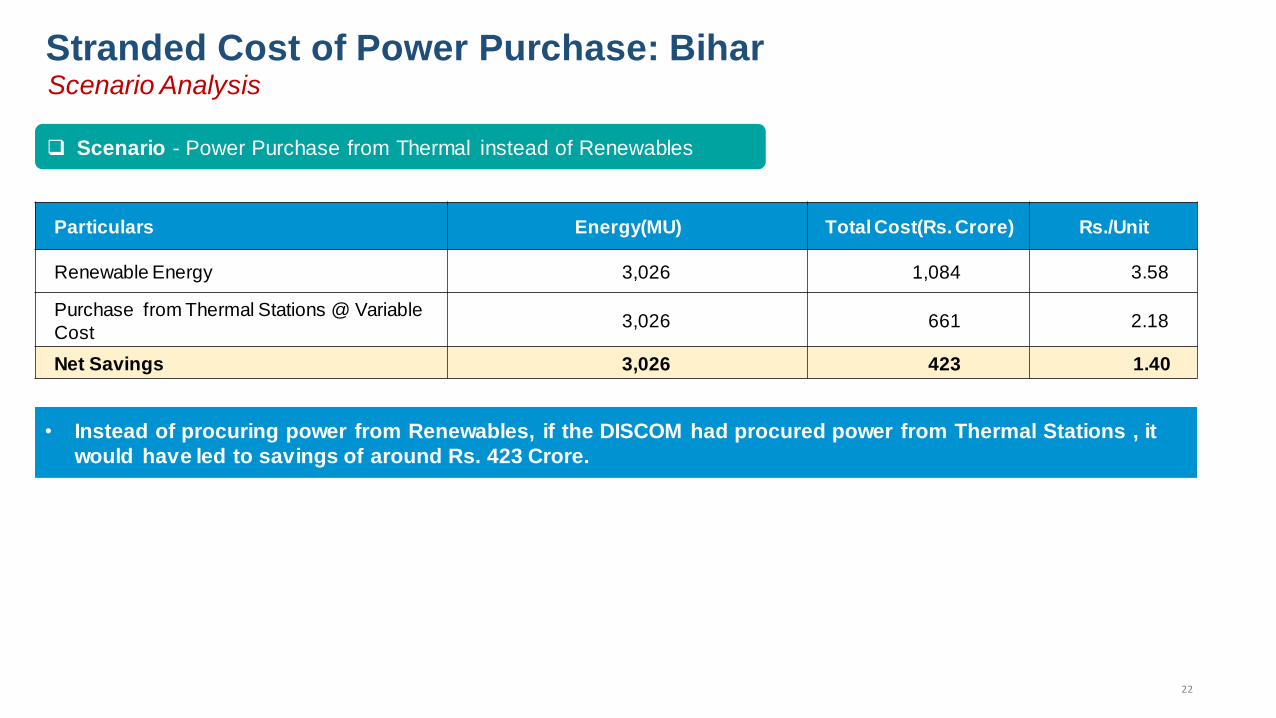
22
Stranded Cost of Power Purchase: Bihar Scenario Analysis
• Instead of procuring power from Renewables, if the DISCOM had procured power from Thermal Stations , it
would have led to savings of around Rs. 423 Crore.
Scenario - Power Purchase from Thermal instead of Renewables
Particulars Energy(MU) Total Cost(Rs. Crore) Rs./Unit
Renewable Energy 3,026 1,084 3.58
Purchase from Thermal Stations @ Variable
Cost 3,026 661 2.18
Net Savings 3,026 423 1.40
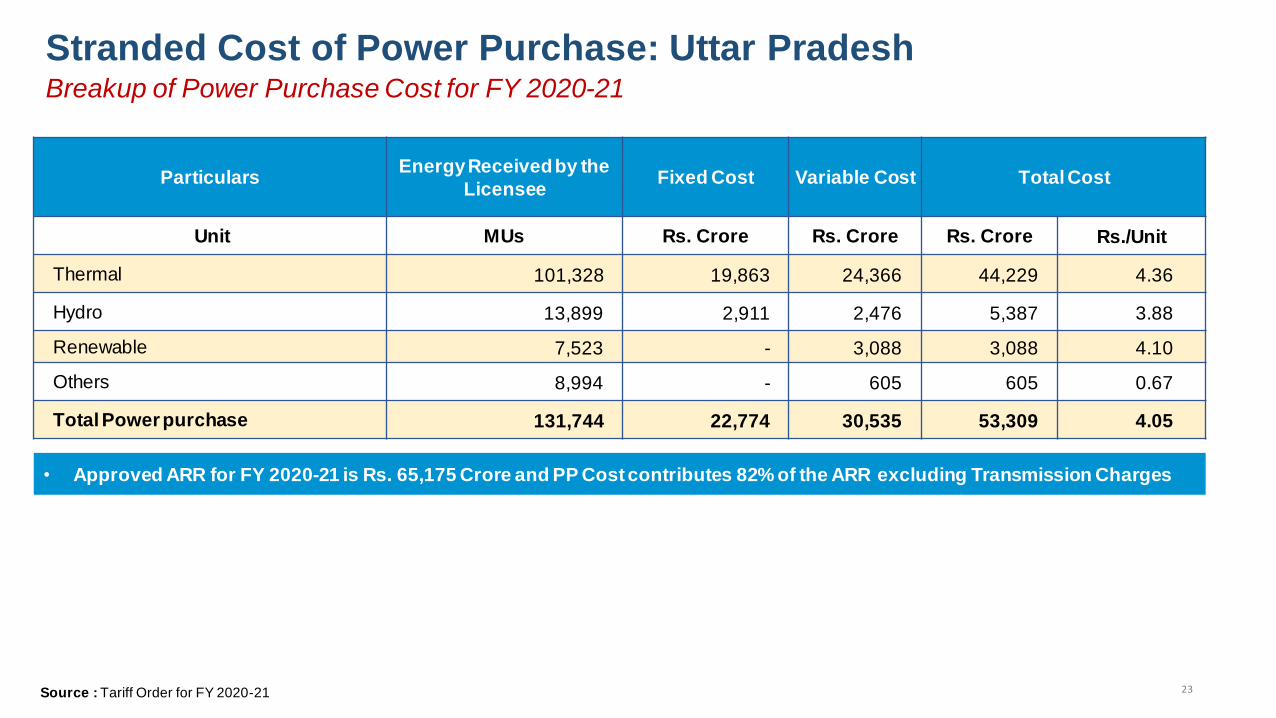
23
Stranded Cost of Power Purchase: Uttar Pradesh
• Approved ARR for FY 2020-21 is Rs. 65,175 Crore and PP Cost contributes 82% of the ARR excluding Transmission Charges
Source : Tariff Order for FY 2020-21
Particulars Energy Received by the
Licensee Fixed Cost Variable Cost Total Cost
Unit MUs Rs. Crore Rs. Crore Rs. Crore Rs./Unit
Thermal 101,328 19,863 24,366 44,229 4.36
Hydro 13,899 2,911 2,476 5,387 3.88
Renewable 7,523 - 3,088 3,088 4.10
Others 8,994 - 605 605 0.67
Total Power purchase 131,744 22,774 30,535 53,309 4.05
Breakup of Power Purchase Cost for FY 2020-21
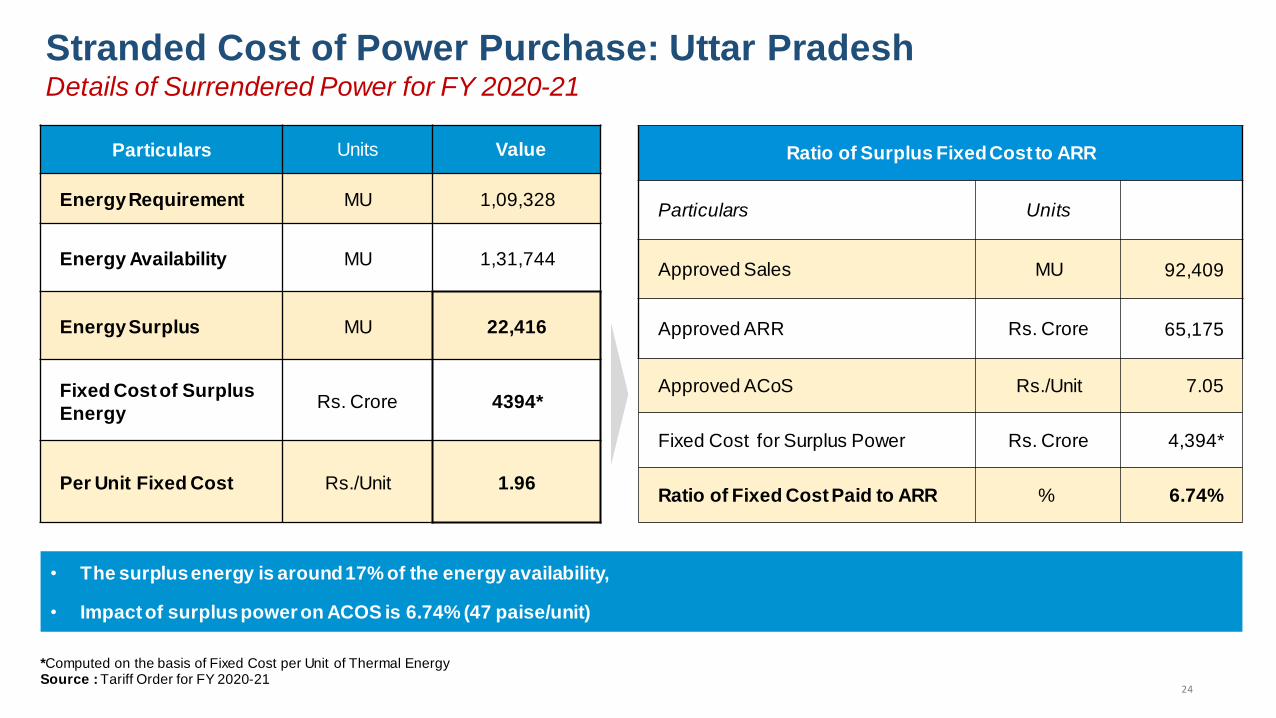
24
Particulars Units Value
Energy Requirement MU 1,09,328
Energy Availability MU 1,31,744
Energy Surplus MU 22,416
Fixed Cost of Surplus
Energy Rs. Crore 4394*
Per Unit Fixed Cost Rs./Unit 1.96
Stranded Cost of Power Purchase: Uttar Pradesh Details of Surrendered Power for FY 2020-21
• The surplus energy is around 17% of the energy availability,
• Impact of surplus power on ACOS is 6.74% (47 paise/unit)
Ratio of Surplus Fixed Cost to ARR
Particulars Units
Approved Sales MU 92,409
Approved ARR Rs. Crore 65,175
Approved ACoS Rs./Unit 7.05
Fixed Cost for Surplus Power Rs. Crore 4,394*
Ratio of Fixed Cost Paid to ARR % 6.74%
*Computed on the basis of Fixed Cost per Unit of Thermal Energy Source : Tariff Order for FY 2020-21
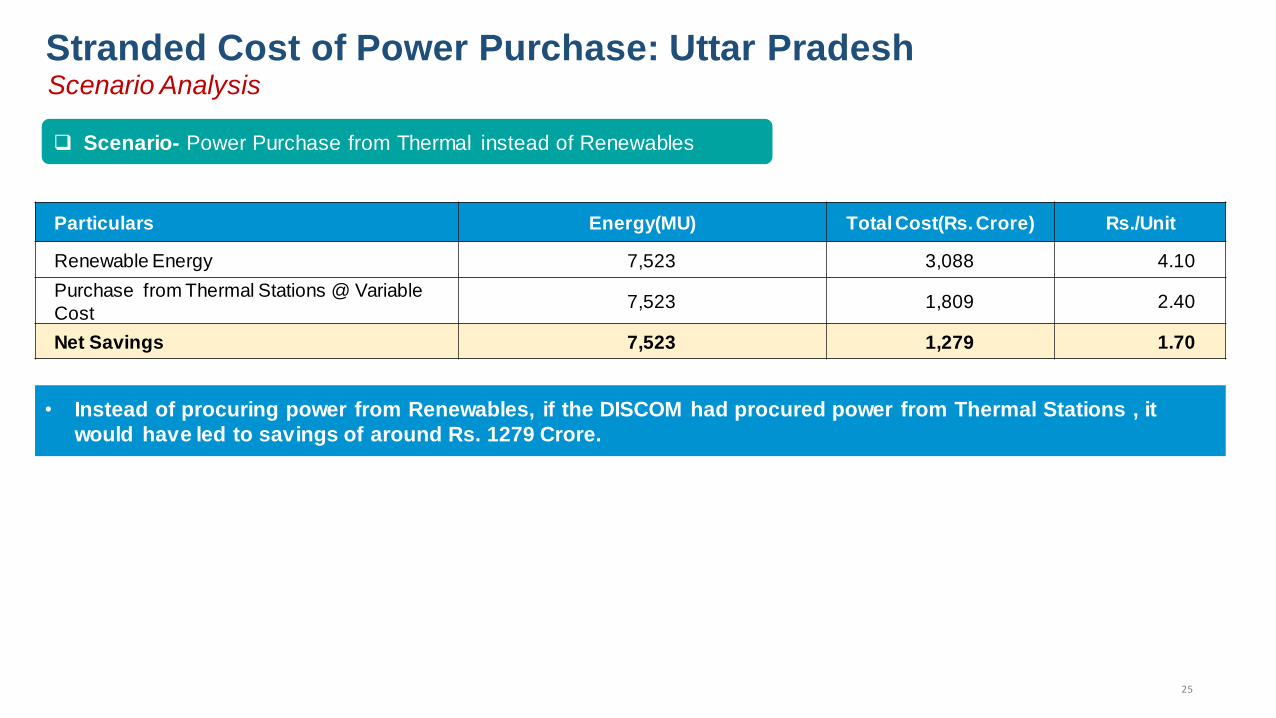
25
Stranded Cost of Power Purchase: Uttar Pradesh Scenario Analysis
• Instead of procuring power from Renewables, if the DISCOM had procured power from Thermal Stations , it
would have led to savings of around Rs. 1279 Crore.
Scenario- Power Purchase from Thermal instead of Renewables
Particulars Energy(MU) Total Cost(Rs. Crore) Rs./Unit
Renewable Energy 7,523 3,088 4.10
Purchase from Thermal Stations @ Variable
Cost 7,523 1,809 2.40
Net Savings 7,523 1,279 1.70
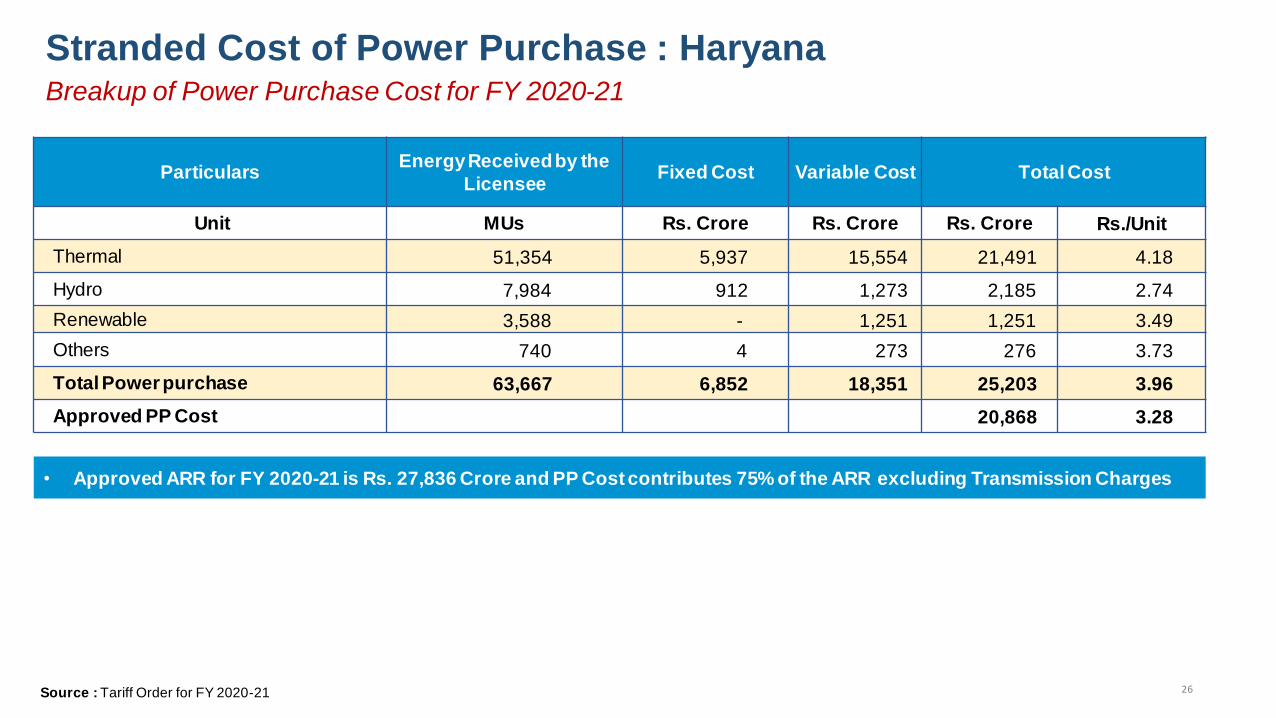
26
Stranded Cost of Power Purchase : Haryana
• Approved ARR for FY 2020-21 is Rs. 27,836 Crore and PP Cost contributes 75% of the ARR excluding Transmission Charges
Source : Tariff Order for FY 2020-21
Particulars Energy Received by the
Licensee Fixed Cost Variable Cost Total Cost
Unit MUs Rs. Crore Rs. Crore Rs. Crore Rs./Unit
Thermal 51,354 5,937 15,554 21,491 4.18
Hydro 7,984 912 1,273 2,185 2.74
Renewable 3,588 - 1,251 1,251 3.49
Others 740 4 273 276 3.73
Total Power purchase 63,667 6,852 18,351 25,203 3.96
Approved PP Cost 20,868 3.28
Breakup of Power Purchase Cost for FY 2020-21
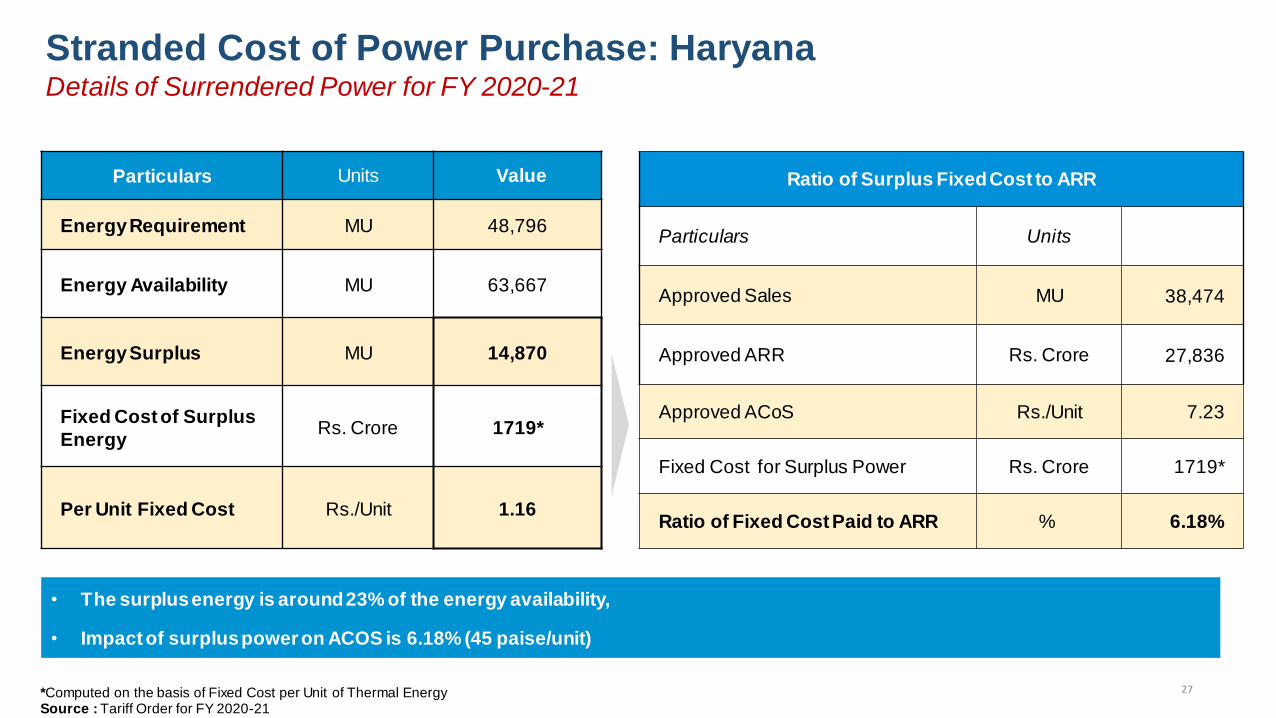
27
Particulars Units Value
Energy Requirement MU 48,796
Energy Availability MU 63,667
Energy Surplus MU 14,870
Fixed Cost of Surplus
Energy Rs. Crore 1719*
Per Unit Fixed Cost Rs./Unit 1.16
Stranded Cost of Power Purchase: Haryana Details of Surrendered Power for FY 2020-21
• The surplus energy is around 23% of the energy availability,
• Impact of surplus power on ACOS is 6.18% (45 paise/unit)
Ratio of Surplus Fixed Cost to ARR
Particulars Units
Approved Sales MU 38,474
Approved ARR Rs. Crore 27,836
Approved ACoS Rs./Unit 7.23
Fixed Cost for Surplus Power Rs. Crore 1719*
Ratio of Fixed Cost Paid to ARR % 6.18%
*Computed on the basis of Fixed Cost per Unit of Thermal Energy Source : Tariff Order for FY 2020-21
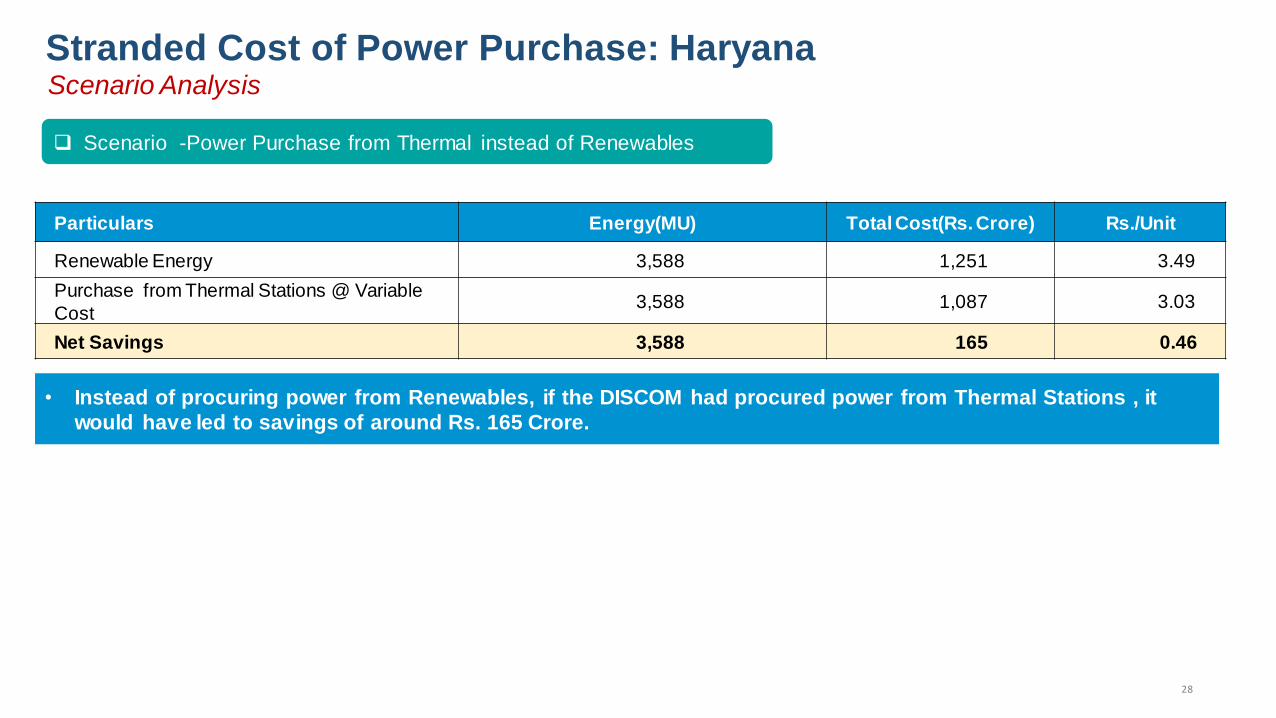
28
Stranded Cost of Power Purchase: Haryana Scenario Analysis
• Instead of procuring power from Renewables, if the DISCOM had procured power from Thermal Stations , it
would have led to savings of around Rs. 165 Crore.
Scenario -Power Purchase from Thermal instead of Renewables
Particulars Energy(MU) Total Cost(Rs. Crore) Rs./Unit
Renewable Energy 3,588 1,251 3.49
Purchase from Thermal Stations @ Variable
Cost 3,588 1,087 3.03
Net Savings 3,588 165 0.46
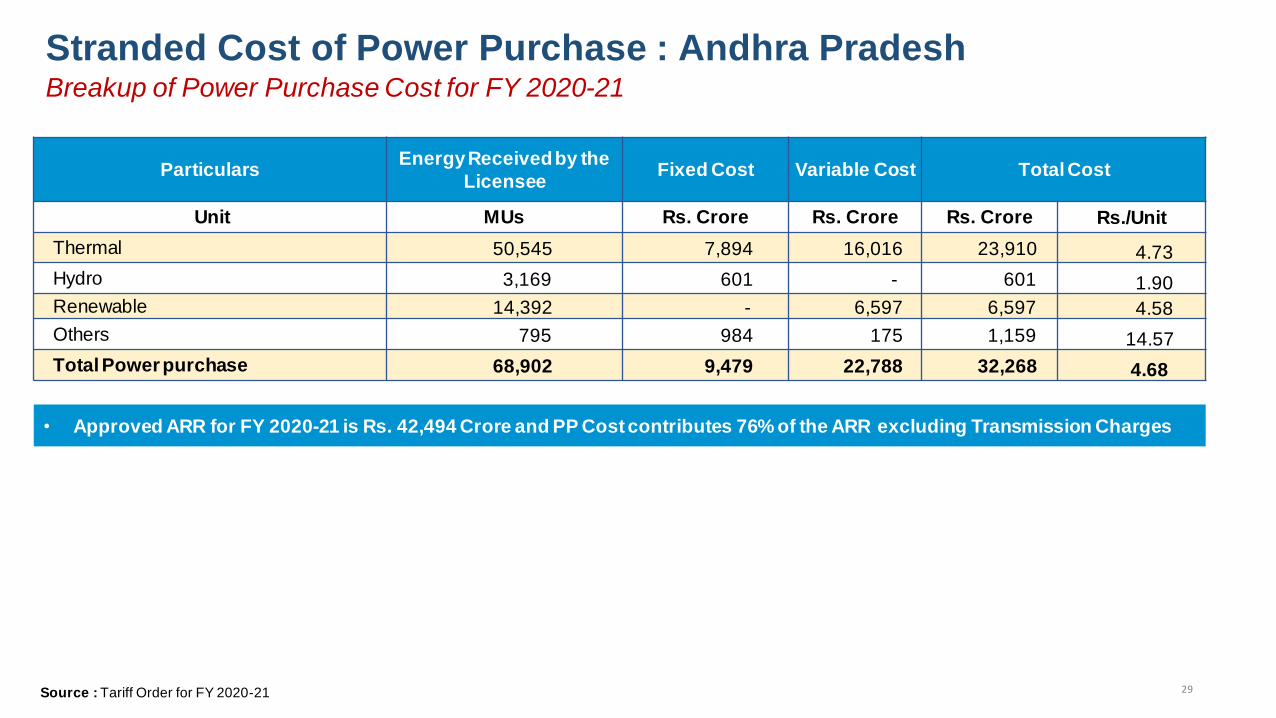
29
Stranded Cost of Power Purchase : Andhra Pradesh
• Approved ARR for FY 2020-21 is Rs. 42,494 Crore and PP Cost contributes 76% of the ARR excluding Transmission Charges
Source : Tariff Order for FY 2020-21
Particulars Energy Received by the
Licensee Fixed Cost Variable Cost Total Cost
Unit MUs Rs. Crore Rs. Crore Rs. Crore Rs./Unit
Thermal 50,545 7,894 16,016 23,910 4.73
Hydro 3,169 601 - 601 1.90
Renewable 14,392 - 6,597 6,597 4.58
Others 795 984 175 1,159 14.57
Total Power purchase 68,902 9,479 22,788 32,268 4.68
Breakup of Power Purchase Cost for FY 2020-21
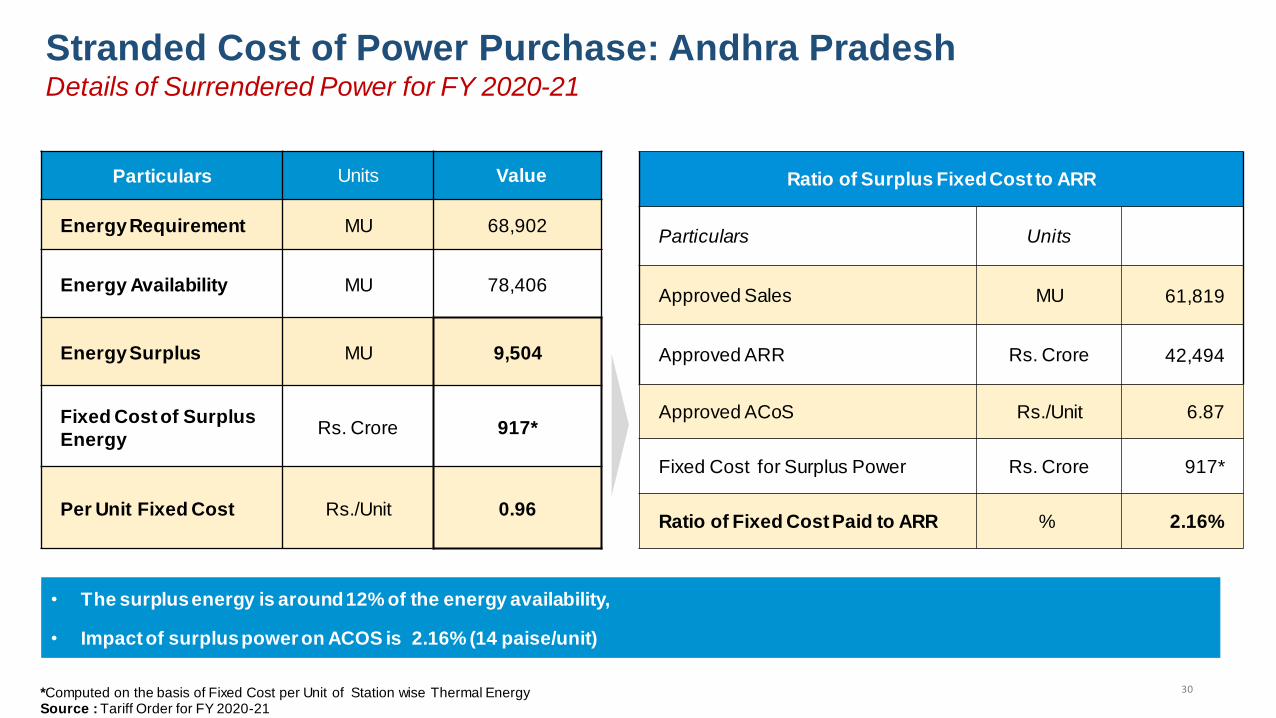
30
Particulars Units Value
Energy Requirement MU 68,902
Energy Availability MU 78,406
Energy Surplus MU 9,504
Fixed Cost of Surplus
Energy Rs. Crore 917*
Per Unit Fixed Cost Rs./Unit 0.96
Stranded Cost of Power Purchase: Andhra Pradesh Details of Surrendered Power for FY 2020-21
• The surplus energy is around 12% of the energy availability,
• Impact of surplus power on ACOS is 2.16% (14 paise/unit)
Ratio of Surplus Fixed Cost to ARR
Particulars Units
Approved Sales MU 61,819
Approved ARR Rs. Crore 42,494
Approved ACoS Rs./Unit 6.87
Fixed Cost for Surplus Power Rs. Crore 917*
Ratio of Fixed Cost Paid to ARR % 2.16%
*Computed on the basis of Fixed Cost per Unit of Station wise Thermal Energy Source : Tariff Order for FY 2020-21
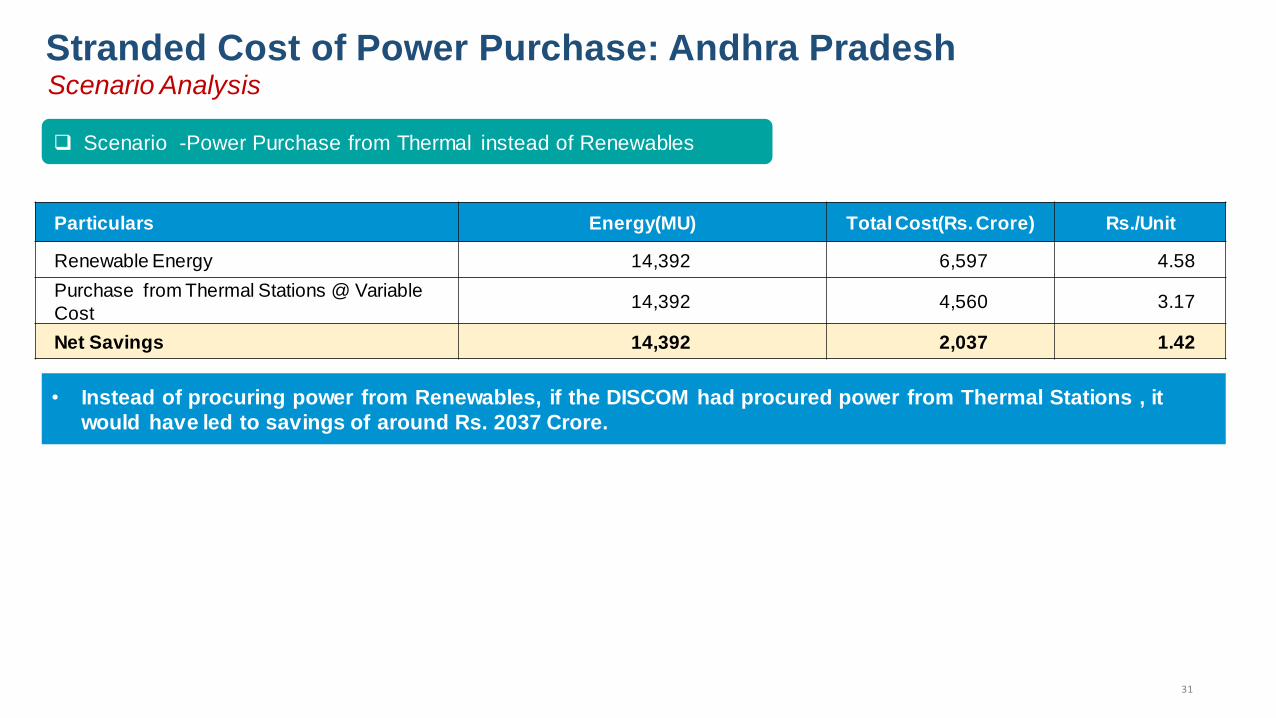
31
Stranded Cost of Power Purchase: Andhra Pradesh Scenario Analysis
• Instead of procuring power from Renewables, if the DISCOM had procured power from Thermal Stations , it
would have led to savings of around Rs. 2037 Crore.
Scenario -Power Purchase from Thermal instead of Renewables
Particulars Energy(MU) Total Cost(Rs. Crore) Rs./Unit
Renewable Energy 14,392 6,597 4.58
Purchase from Thermal Stations @ Variable
Cost 14,392 4,560 3.17
Net Savings 14,392 2,037 1.42
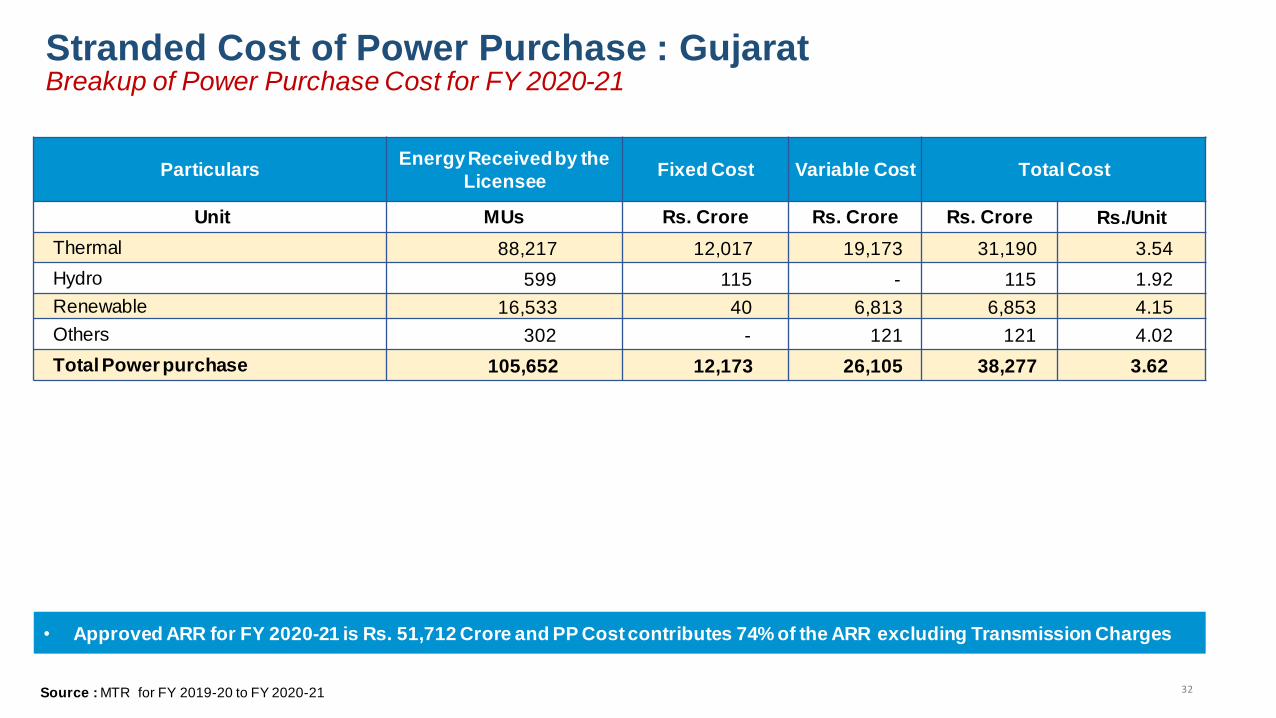
32
Stranded Cost of Power Purchase : Gujarat
• Approved ARR for FY 2020-21 is Rs. 51,712 Crore and PP Cost contributes 74% of the ARR excluding Transmission Charges
Source : MTR for FY 2019-20 to FY 2020-21
Particulars Energy Received by the
Licensee Fixed Cost Variable Cost Total Cost
Unit MUs Rs. Crore Rs. Crore Rs. Crore Rs./Unit
Thermal 88,217 12,017 19,173 31,190 3.54
Hydro 599 115 - 115 1.92
Renewable 16,533 40 6,813 6,853 4.15
Others 302 - 121 121 4.02
Total Power purchase 105,652 12,173 26,105 38,277 3.62
Breakup of Power Purchase Cost for FY 2020-21

33
Particulars Units Value
Energy Requirement MU 1,05,652
Energy Availability MU 1,16,872
Energy Surplus MU 1,12,20
Fixed Cost of Surplus
Energy Rs. Crore 1,528*
Per Unit Fixed Cost Rs./Unit 1.36
Stranded Cost of Power Purchase: Gujarat Details of Surrendered Power for FY 2020-21
• The surplus energy is around 10% of the energy availability,
• Impact of surplus power on ACOS is 2.96% (17 paise/unit)
Ratio of Surplus Fixed Cost to ARR
Particulars Units
Approved Sales MU 87,824
Approved ARR Rs. Crore 51,712
Approved ACoS Rs./Unit 5.89
Fixed Cost for Surplus Power Rs. Crore 1,528*
Ratio of Fixed Cost Paid to ARR % 2.96%
*Computed on the basis of Fixed Cost per Unit of Thermal Energy Source : MTR for FY 2019-20 to FY 2020-21

34
Stranded Cost of Power Purchase: Gujarat Scenario Analysis
• Instead of procuring power from Renewables, if the DISCOM had procured power from Thermal Stations , it
would have led to savings of around Rs. 3260 Crore.
Scenario - Power Purchase from Thermal instead of Renewables
Particulars Energy(MU) Total Cost(Rs. Crore) Rs./Unit
Renewable Energy 16,533 6,853 4.15
Purchase from Thermal Stations @ Variable
Cost 16,533 3,593 2.17
Net Savings 16,533 3,260 1.97
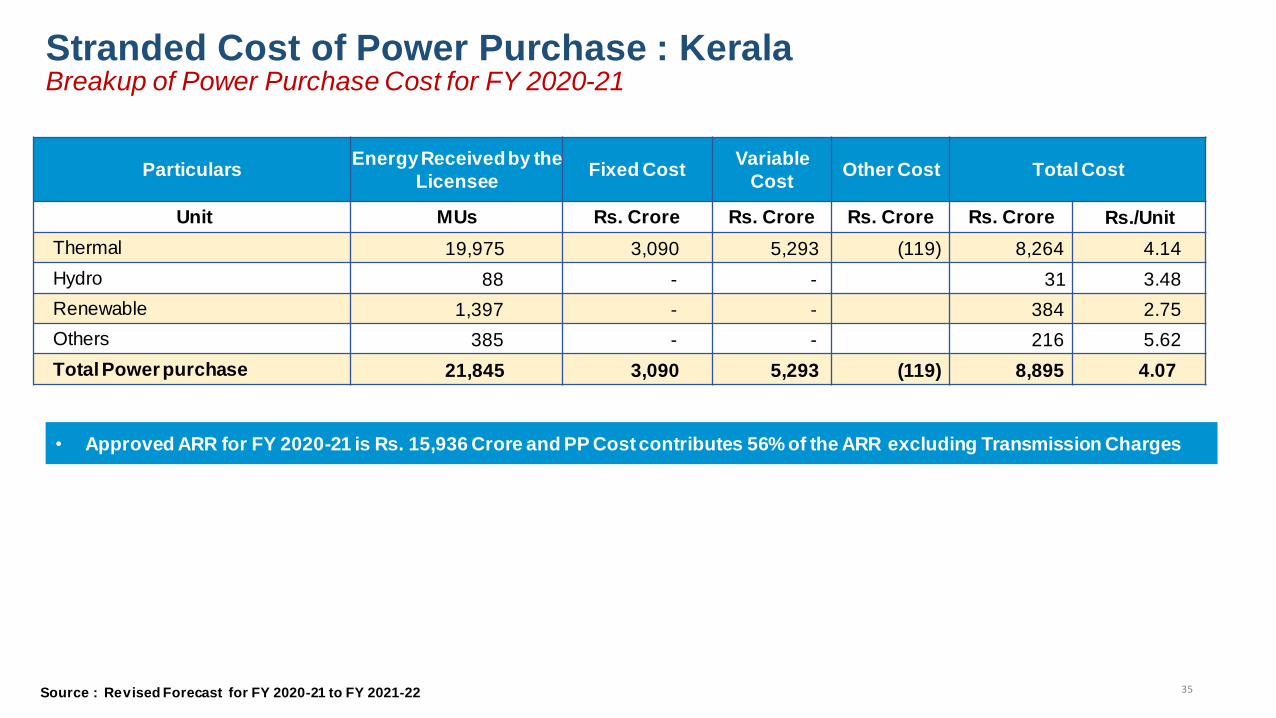
35
Stranded Cost of Power Purchase : Kerala
• Approved ARR for FY 2020-21 is Rs. 15,936 Crore and PP Cost contributes 56% of the ARR excluding Transmission Charges
Source : Revised Forecast for FY 2020-21 to FY 2021-22
Particulars Energy Received by the
Licensee Fixed Cost
Variable
Cost Other Cost Total Cost
Unit MUs Rs. Crore Rs. Crore Rs. Crore Rs. Crore Rs./Unit
Thermal 19,975 3,090 5,293 (119) 8,264 4.14
Hydro 88 - - 31 3.48
Renewable 1,397 - - 384 2.75
Others 385 - - 216 5.62
Total Power purchase 21,845 3,090 5,293 (119) 8,895 4.07
Breakup of Power Purchase Cost for FY 2020-21
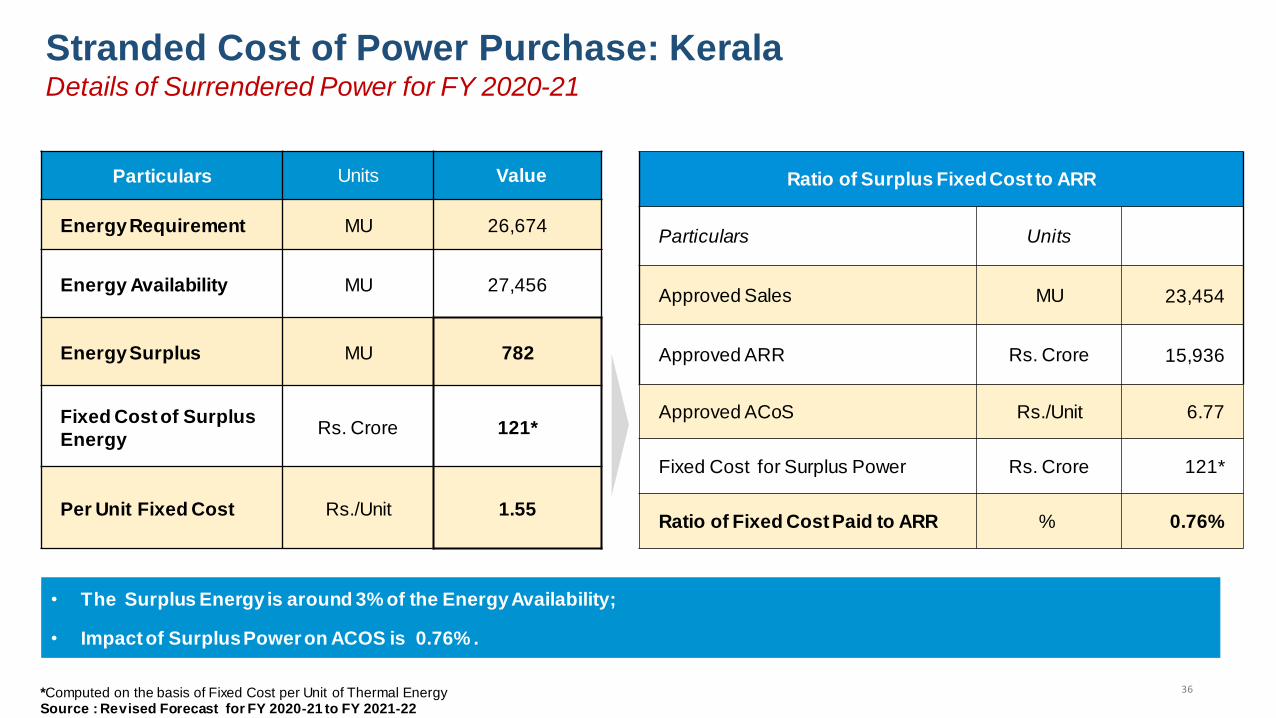
36
Particulars Units Value
Energy Requirement MU 26,674
Energy Availability MU 27,456
Energy Surplus MU 782
Fixed Cost of Surplus
Energy Rs. Crore 121*
Per Unit Fixed Cost Rs./Unit 1.55
Stranded Cost of Power Purchase: Kerala Details of Surrendered Power for FY 2020-21
• The Surplus Energy is around 3% of the Energy Availability;
• Impact of Surplus Power on ACOS is 0.76% .
Ratio of Surplus Fixed Cost to ARR
Particulars Units
Approved Sales MU 23,454
Approved ARR Rs. Crore 15,936
Approved ACoS Rs./Unit 6.77
Fixed Cost for Surplus Power Rs. Crore 121*
Ratio of Fixed Cost Paid to ARR % 0.76%
*Computed on the basis of Fixed Cost per Unit of Thermal Energy Source : Revised Forecast for FY 2020-21 to FY 2021-22

37
Stranded Cost of Power Purchase: Kerala Scenario Analysis
• Instead of procuring power from Renewables, if the DISCOM had procured power from Thermal Stations , it
would have led to savings of around Rs. 14 Crore.
Scenario -Power Purchase from Thermal instead of Renewables
Particulars Energy(MU) Total Cost(Rs. Crore) Rs./Unit
Renewable Energy 1,397 384 2.75
Purchase from Thermal Stations @ Variable
Cost 1,397 370 2.65
Net Savings 1,397 14 0.10

Summary: Under-utilization of generating stations Hypothesis: Optimal utilization of TPPs may lead to reduction in electricity tariffs
Under-utilization of generating stations could be attributed to shortage of coal, non-compliance with
Merit Order Dispatch, procurement from RE sources, and generating plants running on technical
minimum due to higher energy availability.
In Punjab, operation of State Thermal Power Plants at lower PLF has led to a normative loss of Rs.
672 Crore in addition to the fixed charges paid for surplus power.
Fixed cost paid for surplus power varied in the range of 1-13% of the total ARR for the 12 states
Instead of procuring power from Renewables, if DISCOMs had procured power from TPPs, it would
have led to savings of around Rs. 11,000 Crore for 12 states. (3% of the total ARR)
38

Total Impact of Clean
Energy Cess over last
10 Years

2
Clean Energy Cess
The amount collected has increased after 2016-17 with increase in Coal Consumption and increase in
Cess(Rs./MT).
Year Coal Consumption Total Impact of Clean Energy Cess
Million MT Rs. Crore
2010-11 396 990
2011-12 438 2,188
2012-13 485 2,427
2013-14 493 2,466
2014-15 498 3,733
2015-16 518 9,492
2016-17 535 19,618
2017-18* 608 24,320
2018-19* 629 25,144
2019-20* 622 24,883
Notification June 2010 July 2014 Feb. 2015 March 2016
Clean Energy Cess(Rs./Tonne) 50 100 200 400
Impact of Clean Energy Cess considering Coal Consumption by Energy Sector
Source : MOSPI (Energy Statistics 2019)
*Computed based on Monthly CEA Fuel Reports
Under-utilization of
generating stations and
procurement from
renewable sources

4
Under-utilization of generating stations Hypothesis: Optimal utilization of TPPs may lead to reduction in electricity tariffs
Shortage of coal 1
Generating plants running on technical
minimum due to higher energy availability. 2
Not following Merit Order Dispatch
properly 3
Targets set by Ministry of Power for RE
procurement 4
Reason for under-utilization of generating station
Issue of coal shortage and technical minimum can be handled by retiring old coal based TPP as discussed in
previous section. States like Madhya Pradesh, Gujarat, Andhra Pradesh etc. are surplus states.
Recently, MERC has issued guidelines for operation of Merit Order Dispatch under availability-based tariff
order. Other states can examine the same in their state as per their Energy Gap scenario. Detailed regarding
the guidelines issued by MERC are provided in subsequent slides. Proper implementation of MOD can improve
the utilization of Generating Station.
Procurement of Renewable Energy is one of the reason for under-utilization of Generating Stations.

5
Stranded Cost of Power Purchase: Punjab
• Fixed charges contributed about 35% of PPC and Energy cost contributed about 63%;
• Approved ARR for FY 2018-19 is Rs.30,620 Crore and PP Cost contributes 65 % of the ARR.
Source : Tariff Order for FY 2020-21
Particulars Energy Received by
the Licensee Variable Cost Fixed Cost Other Cost Total Cost
Unit MUs Rs. Crore Rs. Crore Rs. Crore Rs. Crore Rs./Unit
Thermal 37,017 9,346 5,147 134 14,628 3.95
Hydro 5,020 777 840 255 1,872 3.73
Renewable 2,200 1,443 - 10 1,452 6.60
Others 1,502 1,014 1,056 525 2,596 17.28
Total Power purchase 45,739 12,580 7,044 923 20,547 4.49
Less : Previous Year Payments - - - - 350
Less: Disallowance for under
achievement of Losses - - - - 228
Less : Others - - - - 63
Approved Power Purchase Cost 45,739 12,580 7,044 923 19,906 4.35
Breakup of Power Purchase Cost for FY 2018-19
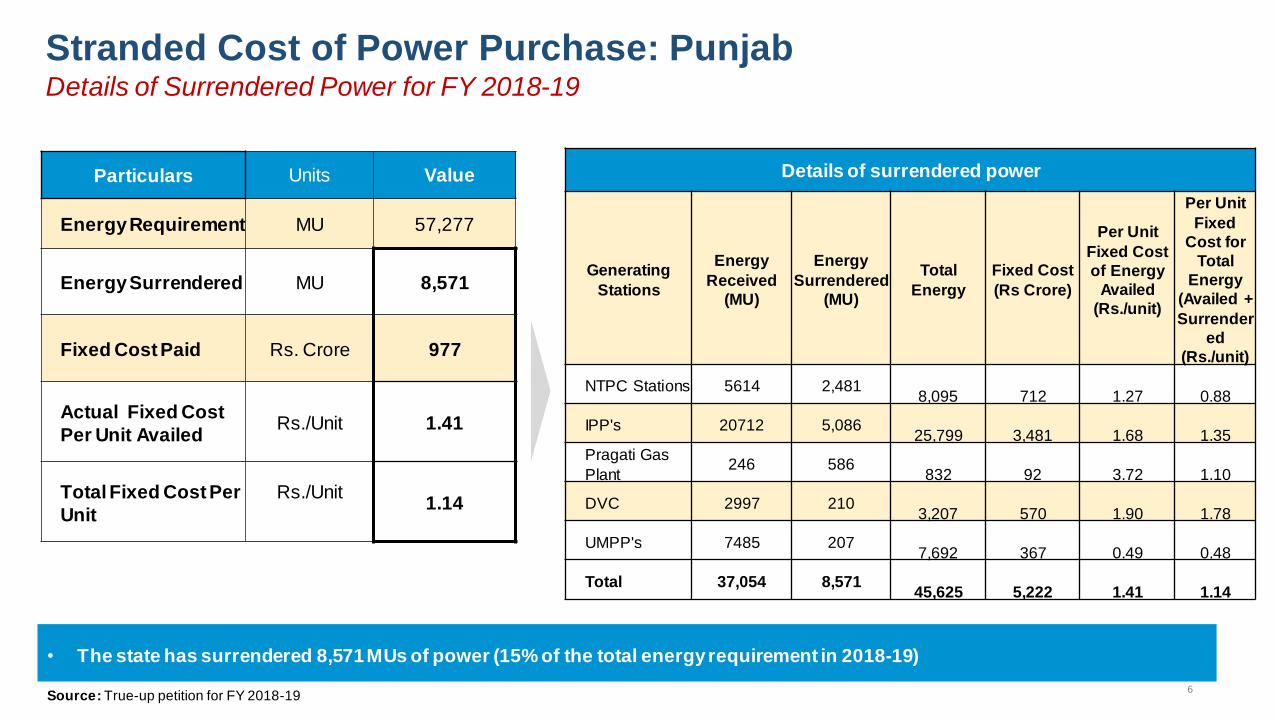
6
Particulars Units Value
Energy Requirement MU 57,277
Energy Surrendered MU 8,571
Fixed Cost Paid Rs. Crore 977
Actual Fixed Cost
Per Unit Availed Rs./Unit 1.41
Total Fixed Cost Per
Unit
Rs./Unit
1.14
Details of surrendered power
Generating
Stations
Energy
Received
(MU)
Energy
Surrendered
(MU)
Total
Energy
Fixed Cost
(Rs Crore)
Per Unit
Fixed Cost
of Energy
Availed
(Rs./unit)
Per Unit
Fixed
Cost for
Total
Energy
(Availed +
Surrender
ed
(Rs./unit)
NTPC Stations 5614 2,481
8,095
712
1.27
0.88
IPP's 20712 5,086
25,799
3,481
1.68
1.35
Pragati Gas
Plant 246 586
832
92
3.72
1.10
DVC 2997 210
3,207
570
1.90
1.78
UMPP's 7485 207
7,692
367
0.49
0.48
Total 37,054 8,571
45,625
5,222
1.41
1.14
Stranded Cost of Power Purchase: Punjab Details of Surrendered Power for FY 2018-19
Source: True-up petition for FY 2018-19
• The state has surrendered 8,571 MUs of power (15% of the total energy requirement in 2018-19)

7
Generating Station Actual PLF
Net
Generation
Actual per Unit
Fixed Cost
Normative
per Unit Fixed Cost
Variable Cost
Total Cost
(Actual PLF)
Total Cost
(Normative PLF)
% MU Rs./Unit Rs./Unit Rs./Unit Rs./Unit Rs./Unit
GGSSTP,Ropar 23.4% 1,573 3.26 0.90 3.33 6.59 4.23
GHTP Lehra 30.5% 2,245 2.08 0.75 3.33 5.41 4.08
Stranded Cost of Power Purchase: Punjab
Proportion of Surplus Fixed Cost to ARR
Approved Sales for FY 2018-19 MU 49,613
Approved ARR Rs. Crore 30,620
Approved ACoS Rs./Unit 6.17
Fixed Cost Paid for Surrendered Power Rs. Crore 977
Ratio of Fixed Cost Paid to ARR 3.2%
Surplus Energy Surrendered
• Apart from the surrendered surplus energy ,Thermal Power Plants are operating at a lower PLF.
• Contribution of fixed cost paid for surplus power is around 3.2% to the ARR approved by the State Commission.
• Impact of Surplus Power on ACOS is around 20 paise/unit (3.2%)

8
Scenario 1 -GGSSTP and GHTP operate at normative PLF
Loss on account of Lower PLF Unit GGSTP Ropar GHTP Lehra
Actual Net Generation MUs 1,573 2,245
Net Generation at Normative PLF of 85% MUs 5,723 6,268
Total Annual Fixed Charges Rs. Crore 512 467
Per Unit Fixed Charge at Actual PLF Rs./kWh 3.26 2.08
Per Unit Fixed Charge at Normative PLF Rs./kWh 0.90 0.75
Difference in Fixed Charges Rs./kWh 2.36 1.34
Notional Loss Rs. Crore 372 300
Total Notional Loss Rs. Crore 672
Stranded Cost of Power Purchase: Punjab Scenario Analysis: Notional loss due to plants operating at lower PLF
• Operation of State Thermal Power Plants at lower PLF has led to a normative loss of Rs. 672 Crore in addition to the fixed
charges paid for surplus power.
• Total cost of stranded power including notional loss works out to around Rs 1,648 Crore (5.38% of total ARR)
• Impact of total cost of stranded power on ACoS – 33 paise/unit (Around 5.38%)

9
Stranded Cost of Power Purchase: Punjab Scenario Analysis-Contribution of Renewables
Particulars Energy(MU) Total Cost(Rs. Crore) Rs./Unit
Renewable Energy 2,200 1453 6.60
Purchase from GHTP Lehra @ Variable Cost 2,200 733 3.33
Net Savings 2,200 720 3.27
Scenario 2 -Power Purchase from GHTP Lehra instead of Renewables
• Instead of procuring power from Renewables, if the DISCOM had procured power from GHTP (@~55% PLF), it would have led
to savings of around Rs.720 Crore.
• Hence, impact of procurement from RE sources on surrendered power is around Rs 720 Crore (2.35% of ARR)

10 Source: GRIDCO Tariff Order for FY 2020-21
28978
34047 34960
26804 28731 29019
2174 5316 5941
FY 2018-19 FY 2019-20 FY 2020-21
Energy Availability and Requirement (in MUs)
Energy Availabilty Energy Requirement Surplus Energy
Power Purchase approved for GRIDCO(FY 2020-21)
Particulars MU Rs. Crore Rs./Unit
Thermal 19,730 5,729 2.90
Hydro 7,052 860 1.22
Renewable 2,237 866 3.87
Transmission Charges 629
Total 29,019 8,084 2.79
Stranded Cost of Power Purchase: Odisha Details of Power Purchase
• Surplus Energy is approximately 16-17 % of the Energy availability for FY 20 and FY 21.
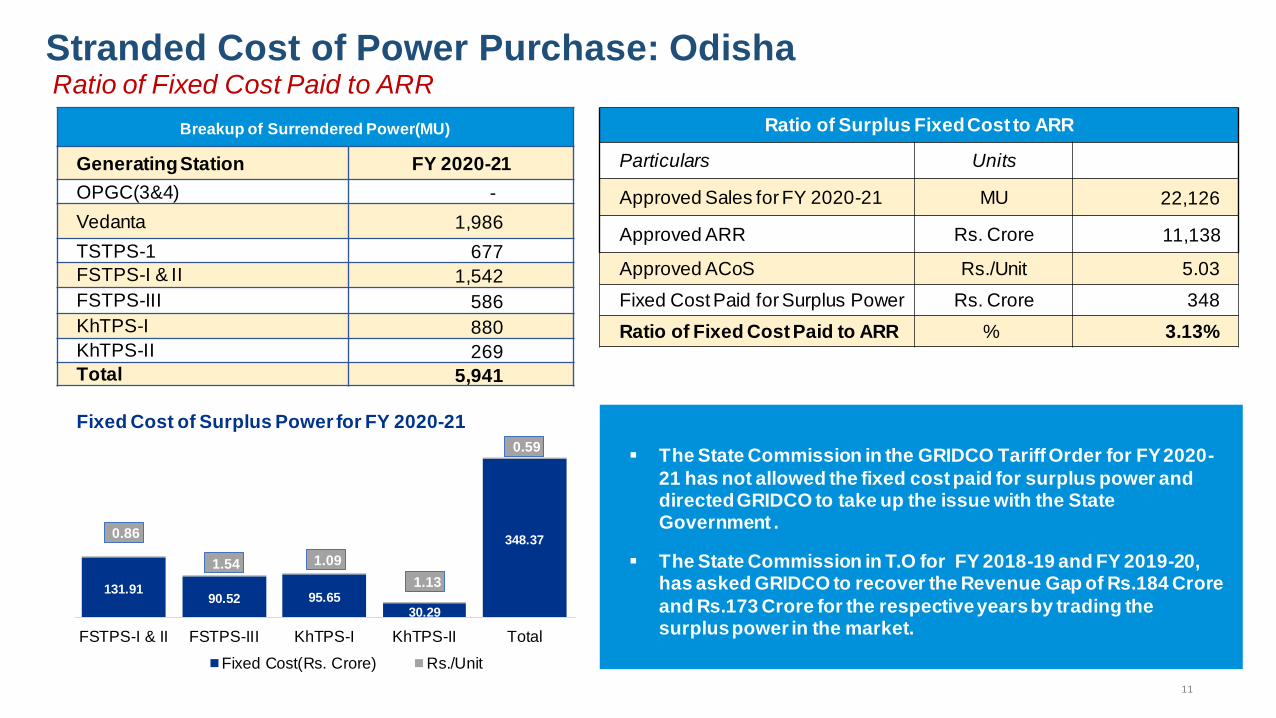
11
Breakup of Surrendered Power(MU)
Generating Station FY 2020-21
OPGC(3&4) -
Vedanta 1,986
TSTPS-1 677
FSTPS-I & II 1,542
FSTPS-III 586
KhTPS-I 880
KhTPS-II 269
Total 5,941
131.91 90.52 95.65
30.29
348.37 0.86
1.54 1.09
1.13
0.59
FSTPS-I & II FSTPS-III KhTPS-I KhTPS-II Total
Fixed Cost of Surplus Power for FY 2020-21
Fixed Cost(Rs. Crore) Rs./Unit
Ratio of Surplus Fixed Cost to ARR
Particulars Units
Approved Sales for FY 2020-21 MU 22,126
Approved ARR Rs. Crore 11,138
Approved ACoS Rs./Unit 5.03
Fixed Cost Paid for Surplus Power Rs. Crore 348
Ratio of Fixed Cost Paid to ARR % 3.13%
The State Commission in the GRIDCO Tariff Order for FY 2020-
21 has not allowed the fixed cost paid for surplus power and directed GRIDCO to take up the issue with the State Government .
The State Commission in T.O for FY 2018-19 and FY 2019-20, has asked GRIDCO to recover the Revenue Gap of Rs.184 Crore
and Rs.173 Crore for the respective years by trading the surplus power in the market.
Stranded Cost of Power Purchase: Odisha Ratio of Fixed Cost Paid to ARR
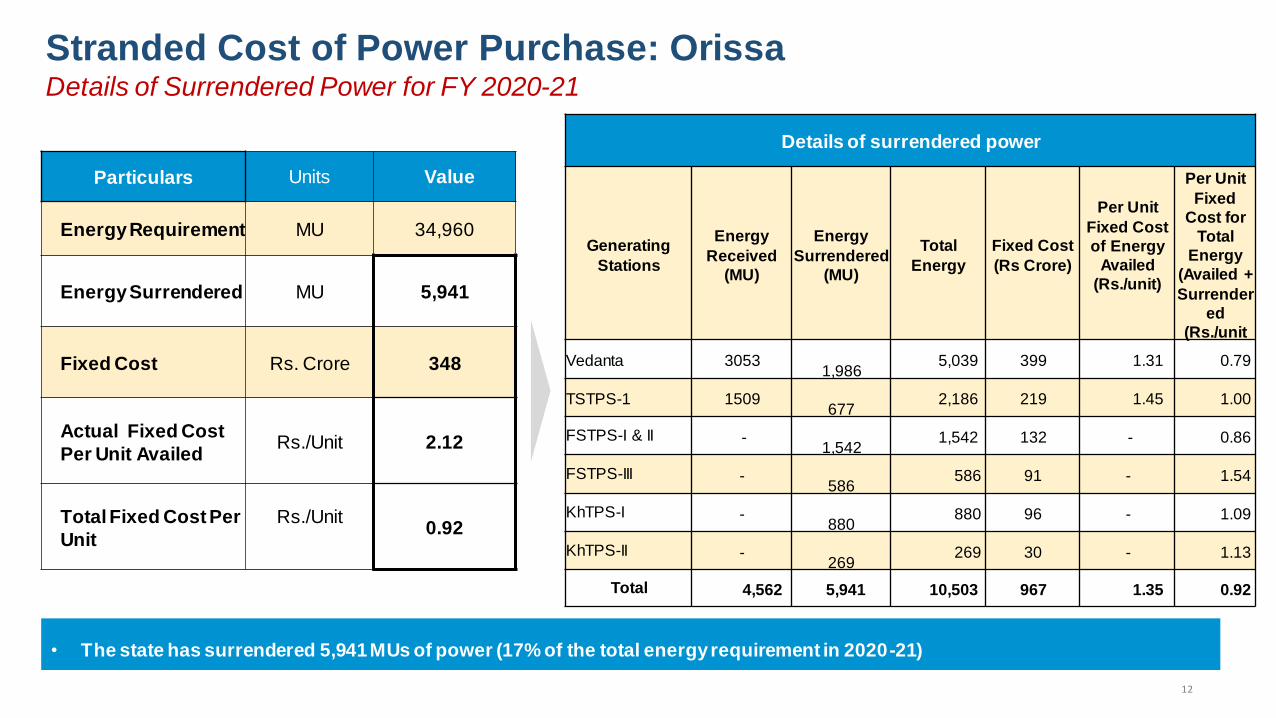
12
Particulars Units Value
Energy Requirement MU 34,960
Energy Surrendered MU 5,941
Fixed Cost Rs. Crore 348
Actual Fixed Cost
Per Unit Availed Rs./Unit 2.12
Total Fixed Cost Per
Unit
Rs./Unit
0.92
Details of surrendered power
Generating
Stations
Energy
Received
(MU)
Energy
Surrendered
(MU)
Total
Energy
Fixed Cost
(Rs Crore)
Per Unit
Fixed Cost
of Energy
Availed
(Rs./unit)
Per Unit
Fixed
Cost for
Total
Energy
(Availed +
Surrender
ed
(Rs./unit
Vedanta 3053
1,986 5,039 399 1.31 0.79
TSTPS-1 1509
677 2,186 219 1.45 1.00
FSTPS-I & II -
1,542 1,542 132 - 0.86
FSTPS-III -
586 586 91 - 1.54
KhTPS-I -
880 880 96 - 1.09
KhTPS-II -
269 269 30 - 1.13
Total 4,562 5,941 10,503 967 1.35 0.92
Stranded Cost of Power Purchase: Orissa Details of Surrendered Power for FY 2020-21
• The state has surrendered 5,941 MUs of power (17% of the total energy requirement in 2020-21)
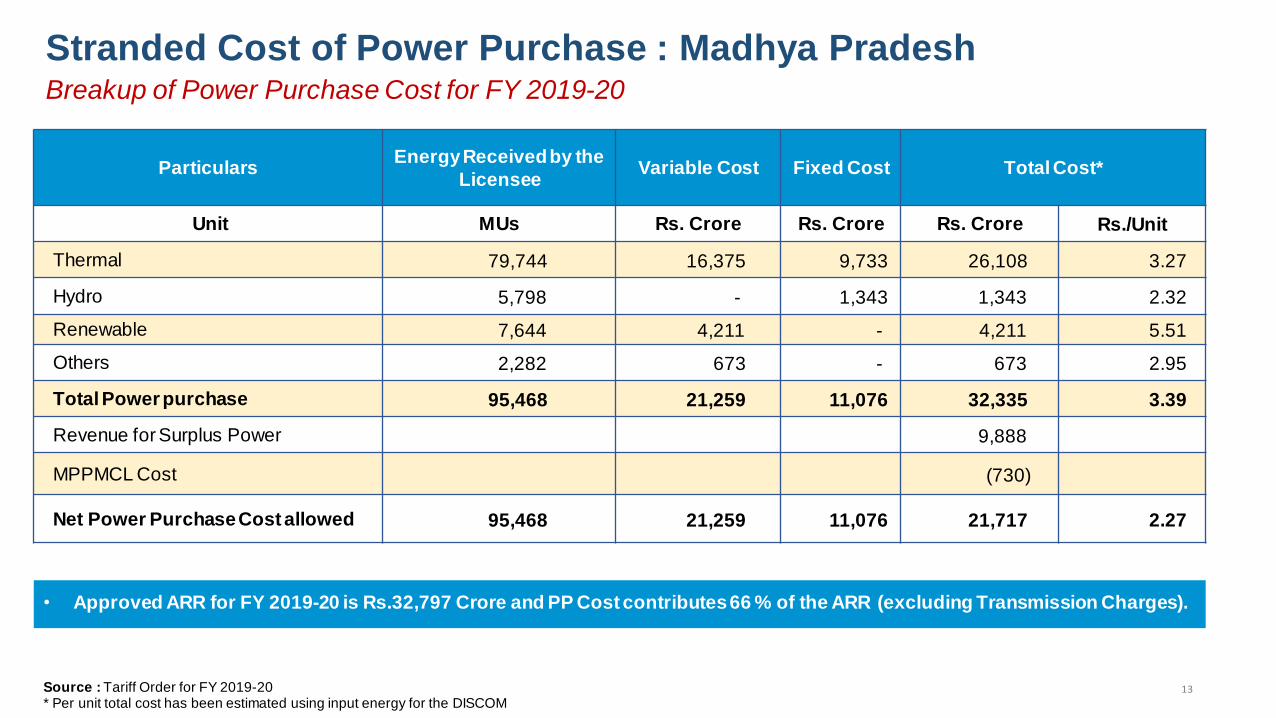
13
Stranded Cost of Power Purchase : Madhya Pradesh
• Approved ARR for FY 2019-20 is Rs.32,797 Crore and PP Cost contributes 66 % of the ARR (excluding Transmission Charges).
Source : Tariff Order for FY 2019-20 * Per unit total cost has been estimated using input energy for the DISCOM
Particulars Energy Received by the
Licensee Variable Cost Fixed Cost Total Cost*
Unit MUs Rs. Crore Rs. Crore Rs. Crore Rs./Unit
Thermal 79,744 16,375 9,733 26,108 3.27
Hydro 5,798 - 1,343 1,343 2.32
Renewable 7,644 4,211 - 4,211 5.51
Others 2,282 673 - 673 2.95
Total Power purchase 95,468 21,259 11,076 32,335 3.39
Revenue for Surplus Power 9,888
MPPMCL Cost (730)
Net Power Purchase Cost allowed 95,468 21,259 11,076 21,717 2.27
Breakup of Power Purchase Cost for FY 2019-20

14
Particulars Units Value
Energy Requirement MU 69,353
Energy Availability MU 97,989
Energy Surrendered MU 28,636
Fixed Cost of Surplus
Energy Rs. Crore 4,325
Actual Fixed Cost Per
Unit Availed Rs./Unit 1.11
Total Fixed Cost Per
Unit
Rs./Unit
0.73
Stranded Cost of Power Purchase: Madhya Pradesh Details of Surrendered Power for FY 2019-20
Source: Tariff Order for FY 2019-20
• The surplus energy is around 29% of the energy availability
• As per the tariff order for 2019-20, the State Commission has approved sale of surplus energy (25,658 MU) through power exchange at Rs. 3.85/unit leading to an additional revenue of Rs.9,888 Crore.
Details of surrendered power
Generating
Stations
Energy
Received
(MU)
Energy
Surrendered
(MU)
Total
Energy
Fixed
Cost (Rs
Crore)
Per Unit
Fixed Cost
of Energy
Availed
(Rs./unit)
Per Unit
Fixed Cost
for Total
Energy
(Availed +
Surrender
ed
(Rs./unit
NTPC
Stations 26947 7062 34010
3,141
1.17 0.92
IPP's 22815 19053 41868
2,396
1.05 0.57
Others 2521
Total 49762 28636 75877 5537 1.11 0.73
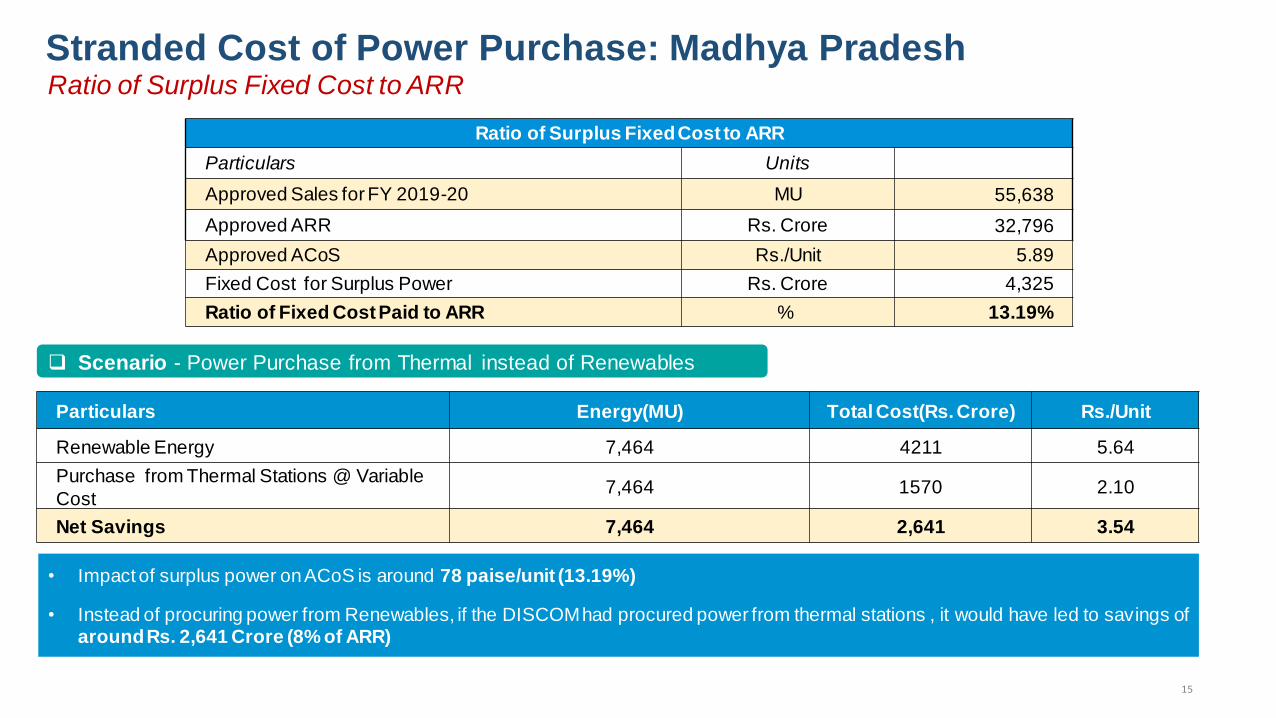
15
Stranded Cost of Power Purchase: Madhya Pradesh Ratio of Surplus Fixed Cost to ARR
• Impact of surplus power on ACoS is around 78 paise/unit (13.19%)
• Instead of procuring power from Renewables, if the DISCOM had procured power from thermal stations , it would have led to savings of around Rs. 2,641 Crore (8% of ARR)
Ratio of Surplus Fixed Cost to ARR
Particulars Units
Approved Sales for FY 2019-20 MU 55,638
Approved ARR Rs. Crore 32,796
Approved ACoS Rs./Unit 5.89
Fixed Cost for Surplus Power Rs. Crore 4,325
Ratio of Fixed Cost Paid to ARR % 13.19%
Scenario - Power Purchase from Thermal instead of Renewables
Particulars Energy(MU) Total Cost(Rs. Crore) Rs./Unit
Renewable Energy 7,464 4211 5.64
Purchase from Thermal Stations @ Variable
Cost 7,464 1570 2.10
Net Savings 7,464 2,641 3.54
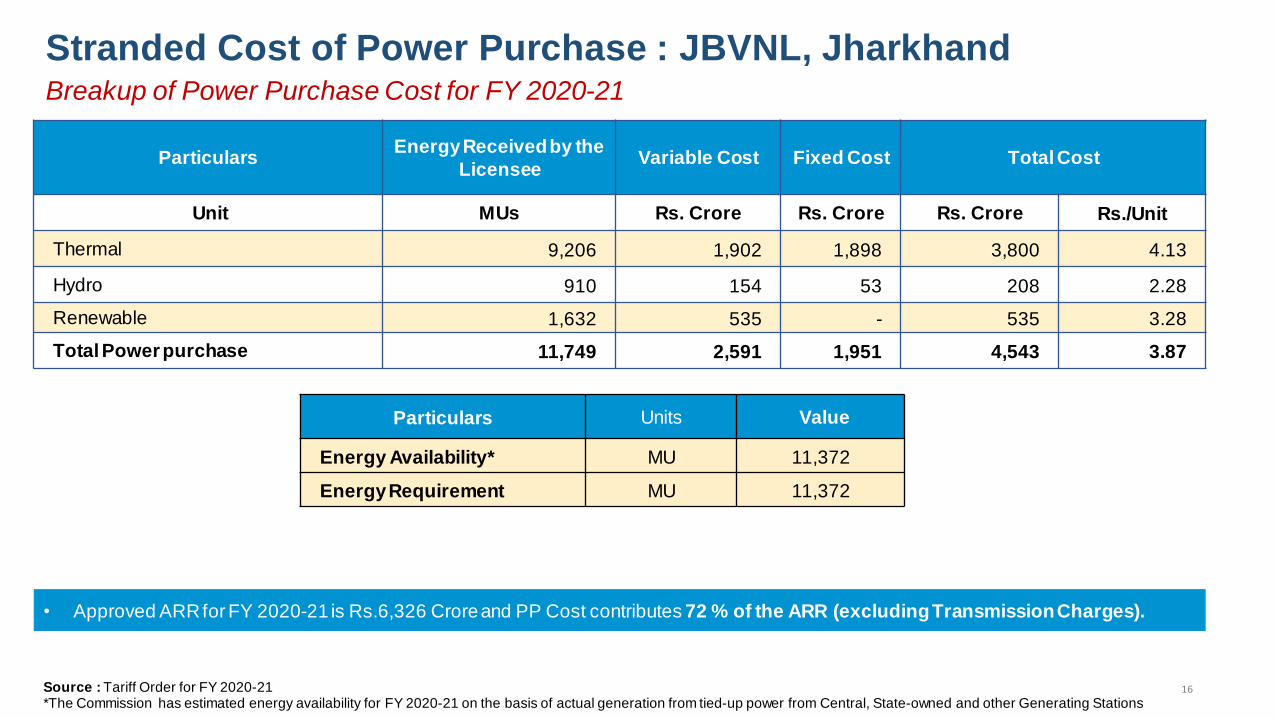
16
Stranded Cost of Power Purchase : JBVNL, Jharkhand
• Approved ARR for FY 2020-21 is Rs.6,326 Crore and PP Cost contributes 72 % of the ARR (excluding Transmission Charges).
Source : Tariff Order for FY 2020-21 *The Commission has estimated energy availability for FY 2020-21 on the basis of actual generation from tied-up power from Central, State-owned and other Generating Stations
Particulars Energy Received by the
Licensee Variable Cost Fixed Cost Total Cost
Unit MUs Rs. Crore Rs. Crore Rs. Crore Rs./Unit
Thermal 9,206 1,902 1,898 3,800 4.13
Hydro 910 154 53 208 2.28
Renewable 1,632 535 - 535 3.28
Total Power purchase 11,749 2,591 1,951 4,543 3.87
Breakup of Power Purchase Cost for FY 2020-21
Particulars Units Value
Energy Availability* MU 11,372
Energy Requirement MU 11,372

17
Stranded Cost of Power Purchase : JBVNL, Jharkhand Ratio of Surplus Fixed Cost to ARR
• Impact of Surplus Power on ACoS is around 57 paise/unit (8.90%)
• Instead of procuring power from Renewables, if the DISCOM had procured power from thermal stations , it would have led to savings of around Rs. 198 Crore (3.1% of ARR)
Ratio of Surplus Fixed Cost to ARR
Particulars Units
Approved Sales for FY 2020-21 MU 9,894
Approved ARR Rs. Crore 6,326
Approved ACoS Rs./Unit 6.39
Fixed Cost for Surplus Power Rs. Crore 563
Ratio of Fixed Cost Paid to ARR % 8.90%
Scenario -Power Purchase from Thermal Stations instead of Renewables
Particulars Energy(MU) Total Cost(Rs. Crore) Rs./Unit
Renewable Energy 1,632 535 3.28
Purchase from Thermal Stations @ Variable Cost 1,632 337 2.07
Net Savings 1,632 198 1.21

18
Stranded Cost of Power Purchase : Assam
• Approved ARR for FY 2018-19 is Rs. 5,374 Crore and PP Cost contributes 94% of the ARR including Transmission Charges and
73 % excluding Transmission Charges.
Source : True up Order for FY 2018-19
Particulars Energy Received by
the Licensee Fixed Cost
Variable
Cost Other Cost Total Cost
Unit MUs Rs. Crore Rs. Crore Rs. Crore Rs. Crore Rs./Unit
Thermal 6,604 1,299 1,475 2,774 4.20
Hydro 1,541 202 220 421 2.74
Renewable 92 - 53 53 5.74
Others 1,493 4 641 51 696 4.66
Total Power purchase 9,730 1,505 2,388 51 3,944 4.05
Transmission Charges 1,161
Less: Delayed Payment Surcharge 36
Net Power Purchase Cost
allowed 9,730 1,505 2,388 51 5,069 5.21
Breakup of Power Purchase Cost for FY 2018-19

19
Particulars Units Value
Energy Requirement MU 8,866
Energy Availability MU 9,730
Energy Surplus MU 864
Fixed Cost of Surplus
Energy Rs. Crore 294*
Actual Per Unit Fixed
Cost Rs./Unit 3.40
Total Fixed Cost Per Unit Rs./Unit
2.19
Stranded Cost of Power Purchase: Assam Details of Surrendered Power for FY 2018-19
• The Surplus Energy is around 9% of the energy availability; The income earned from the sale of Surplus Power is Rs.171 Crore @ Rs.
1.97 per Unit.
• Impact of Surplus Power on ACOS is around 42 paise/unit.
Ratio of Surplus Fixed Cost to ARR
Particulars Units
Approved Sales for FY 2018-19 MU 6,968
Approved ARR Rs. Crore 5,374
Approved ACoS Rs./Unit 7.71
Fixed Cost for Surplus Power Rs. Crore 294*
Ratio of Fixed Cost Paid to ARR % 5.47%
Source : True up Order for FY 2018-19 *Computed based on assumptions
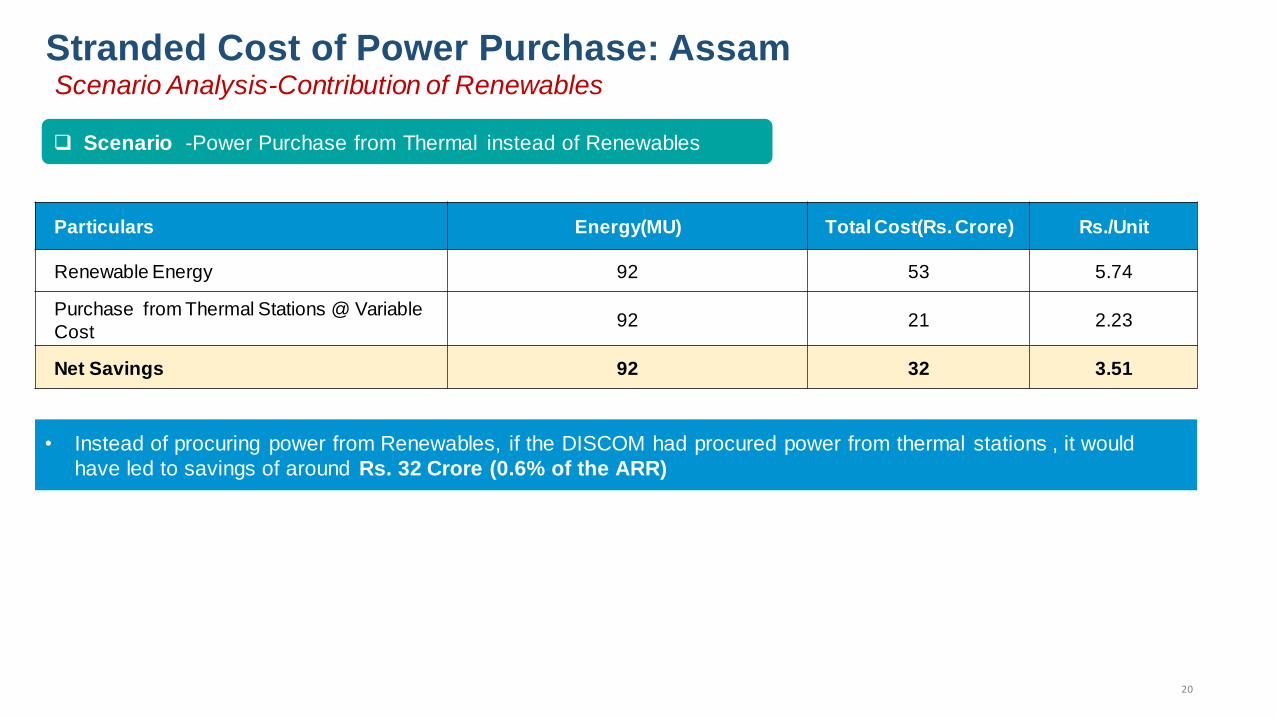
20
Stranded Cost of Power Purchase: Assam Scenario Analysis-Contribution of Renewables
• Instead of procuring power from Renewables, if the DISCOM had procured power from thermal stations , it would
have led to savings of around Rs. 32 Crore (0.6% of the ARR)
Scenario -Power Purchase from Thermal instead of Renewables
Particulars Energy(MU) Total Cost(Rs. Crore) Rs./Unit
Renewable Energy 92 53 5.74
Purchase from Thermal Stations @ Variable
Cost 92 21 2.23
Net Savings 92 32 3.51
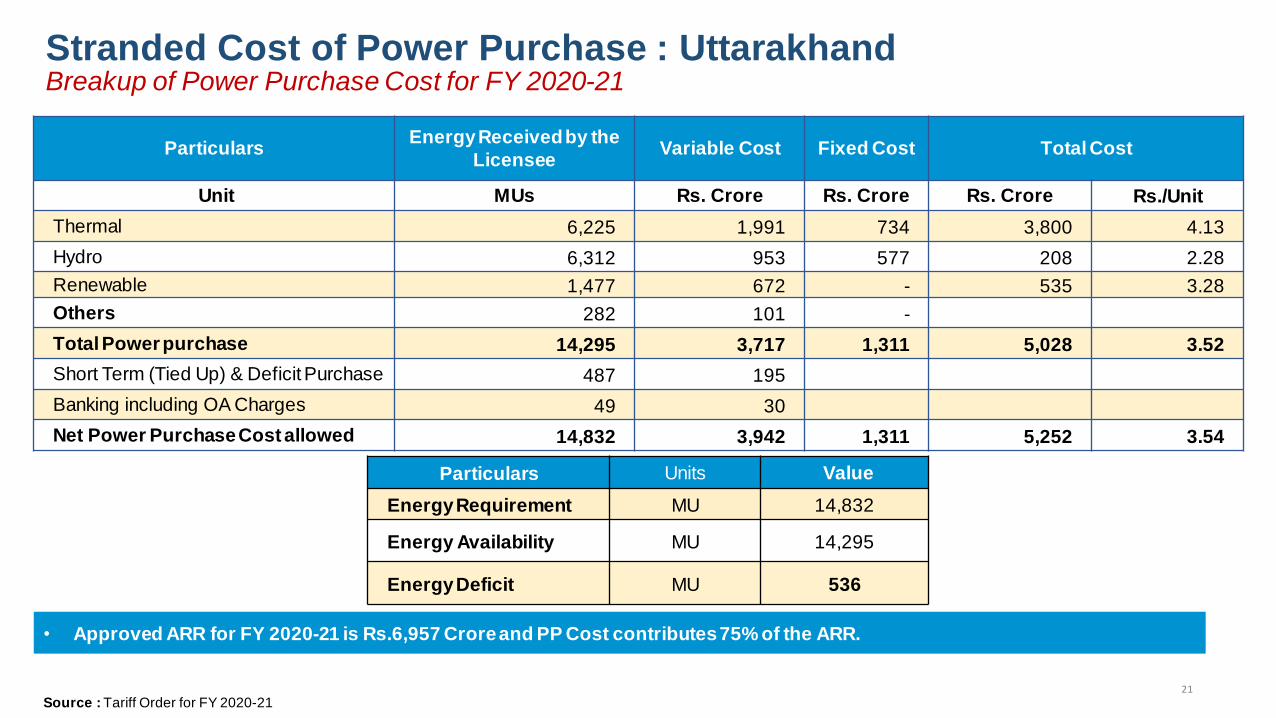
21
Stranded Cost of Power Purchase : Uttarakhand
• Approved ARR for FY 2020-21 is Rs.6,957 Crore and PP Cost contributes 75% of the ARR.
Source : Tariff Order for FY 2020-21
Particulars Energy Received by the
Licensee Variable Cost Fixed Cost Total Cost
Unit MUs Rs. Crore Rs. Crore Rs. Crore Rs./Unit
Thermal 6,225 1,991 734 3,800 4.13
Hydro 6,312 953 577 208 2.28
Renewable 1,477 672 - 535 3.28
Others 282 101 - Total Power purchase 14,295 3,717 1,311 5,028 3.52
Short Term (Tied Up) & Deficit Purchase 487 195 Banking including OA Charges 49 30 Net Power Purchase Cost allowed 14,832 3,942 1,311 5,252 3.54
Breakup of Power Purchase Cost for FY 2020-21
Particulars Units Value
Energy Requirement MU 14,832
Energy Availability MU 14,295
Energy Deficit MU 536
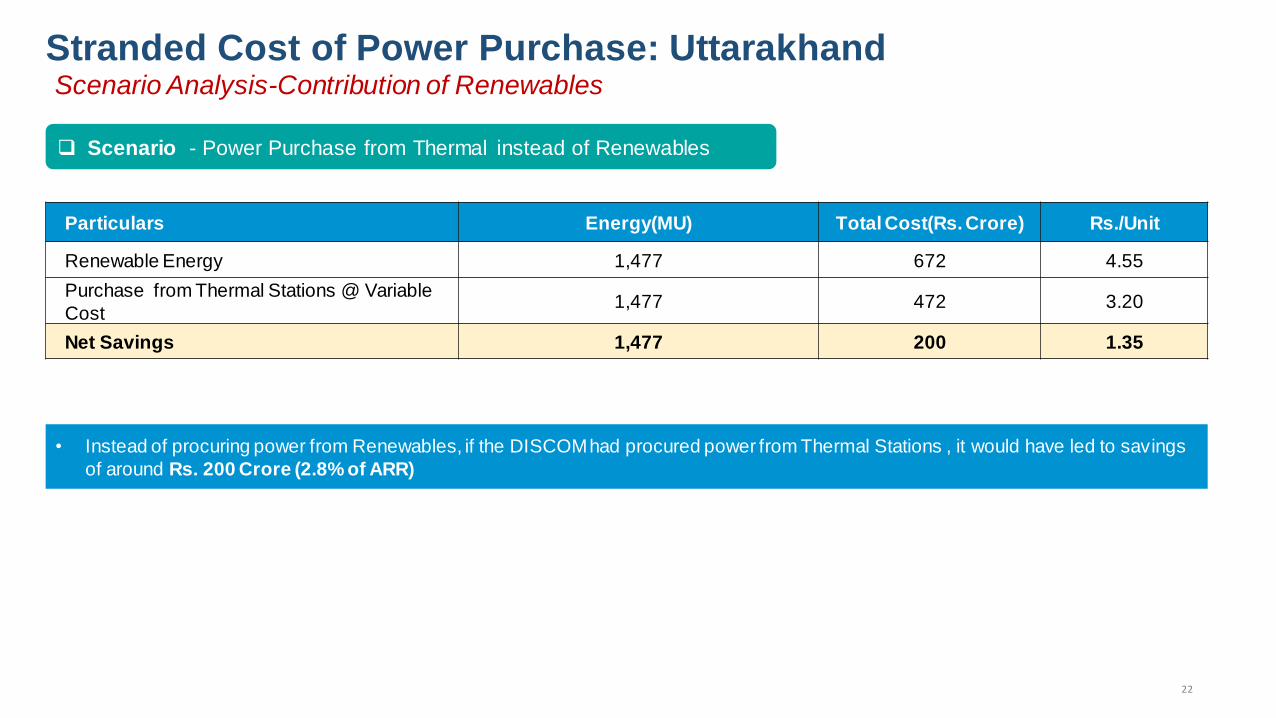
22
Stranded Cost of Power Purchase: Uttarakhand Scenario Analysis-Contribution of Renewables
• Instead of procuring power from Renewables, if the DISCOM had procured power from Thermal Stations , it would have led to savings
of around Rs. 200 Crore (2.8% of ARR)
Scenario - Power Purchase from Thermal instead of Renewables
Particulars Energy(MU) Total Cost(Rs. Crore) Rs./Unit
Renewable Energy 1,477 672 4.55
Purchase from Thermal Stations @ Variable
Cost 1,477 472 3.20
Net Savings 1,477 200 1.35

23
Stranded Cost of Power Purchase: Bihar
• Approved ARR for FY 2020-21 is Rs. 18,528 Crore and PP Cost contributes 73% of the ARR excluding Transmission Charges
Source : Tariff Order for FY 2020-21
Particulars Energy Received by
the Licensee Fixed Cost
Variable
Cost Other Cost Total Cost
Unit MUs Rs. Crore Rs. Crore Rs. Crore Rs. Crore Rs./Unit
Thermal 25,425 5,489 5,552 135 11,175 4.40
Hydro 3,117 150 833 983 3.15
Renewable 3,026 - 1,084 1,084 3.58
Others 816 - 342 342 4.19
Total Power purchase 32,384 5,639 7,811 135 13,584 4.19
Breakup of Power Purchase Cost for FY 2020-21
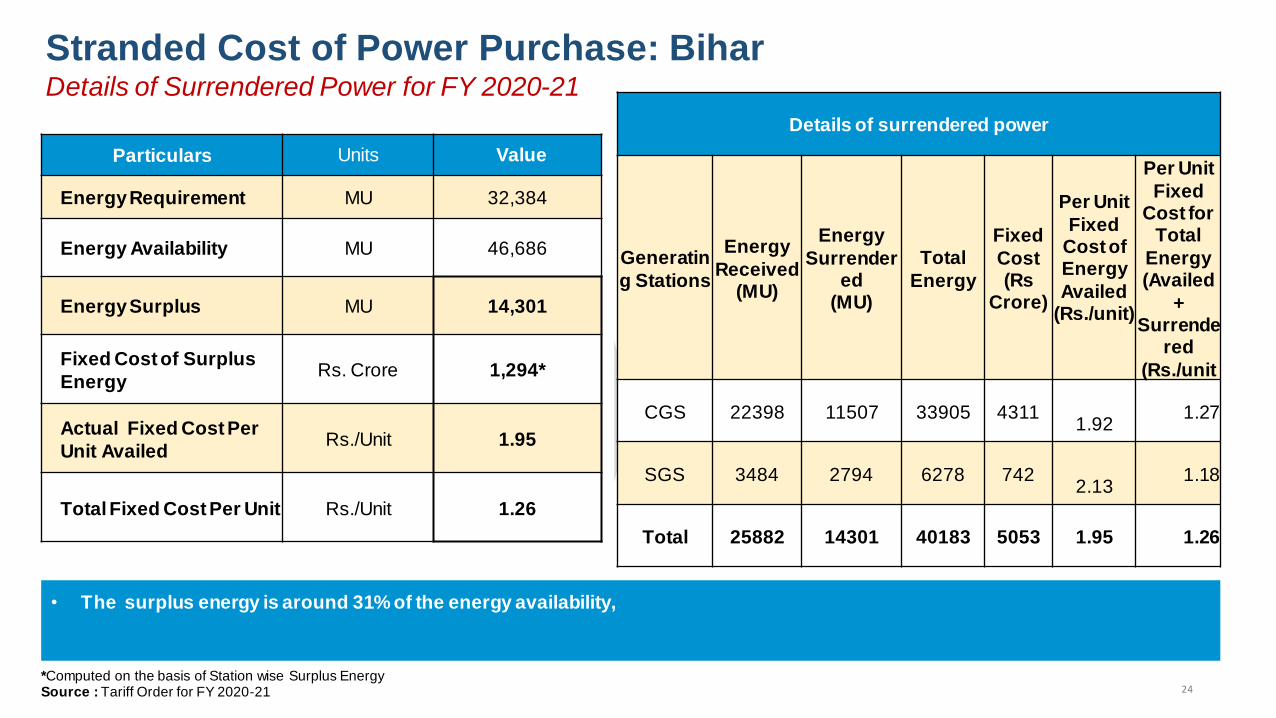
24
Particulars Units Value
Energy Requirement MU 32,384
Energy Availability MU 46,686
Energy Surplus MU 14,301
Fixed Cost of Surplus
Energy Rs. Crore 1,294*
Actual Fixed Cost Per
Unit Availed Rs./Unit 1.95
Total Fixed Cost Per Unit Rs./Unit 1.26
Stranded Cost of Power Purchase: Bihar Details of Surrendered Power for FY 2020-21
• The surplus energy is around 31% of the energy availability,
*Computed on the basis of Station wise Surplus Energy Source : Tariff Order for FY 2020-21
Details of surrendered power
Generatin
g Stations
Energy
Received (MU)
Energy
Surrendered
(MU)
Total
Energy
Fixed
Cost (Rs
Crore)
Per Unit
Fixed Cost of Energy
Availed (Rs./unit)
Per Unit
Fixed Cost for
Total
Energy (Availed
+ Surrende
red
(Rs./unit
CGS 22398 11507 33905 4311
1.92 1.27
SGS 3484 2794 6278 742
2.13 1.18
Total 25882 14301 40183 5053 1.95 1.26
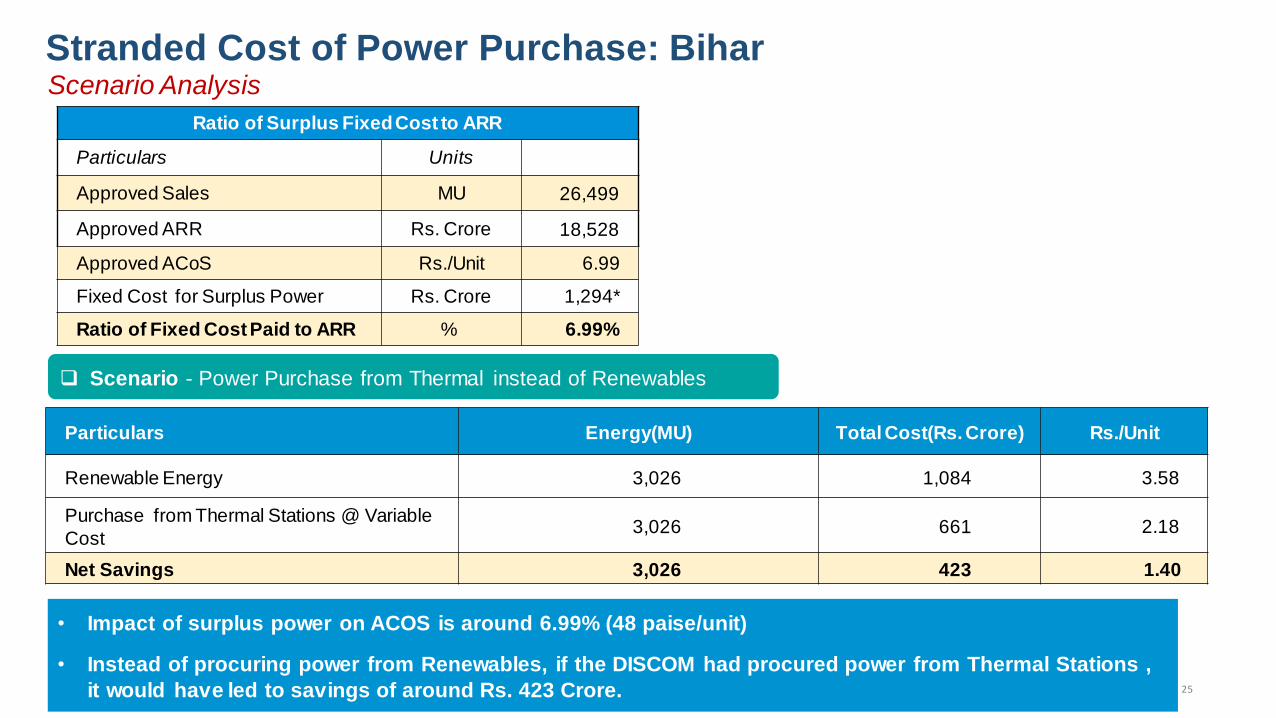
25
Stranded Cost of Power Purchase: Bihar Scenario Analysis
• Impact of surplus power on ACOS is around 6.99% (48 paise/unit)
• Instead of procuring power from Renewables, if the DISCOM had procured power from Thermal Stations ,
it would have led to savings of around Rs. 423 Crore.
Scenario - Power Purchase from Thermal instead of Renewables
Particulars Energy(MU) Total Cost(Rs. Crore) Rs./Unit
Renewable Energy 3,026 1,084 3.58
Purchase from Thermal Stations @ Variable
Cost 3,026 661 2.18
Net Savings 3,026 423 1.40
Ratio of Surplus Fixed Cost to ARR
Particulars Units
Approved Sales MU 26,499
Approved ARR Rs. Crore 18,528
Approved ACoS Rs./Unit 6.99
Fixed Cost for Surplus Power Rs. Crore 1,294*
Ratio of Fixed Cost Paid to ARR % 6.99%

26
Stranded Cost of Power Purchase: Uttar Pradesh
• Approved ARR for FY 2020-21 is Rs. 65,175 Crore and PP Cost contributes 82% of the ARR excluding Transmission Charges
Source : Tariff Order for FY 2020-21
Particulars Energy Received by the
Licensee Fixed Cost Variable Cost Total Cost
Unit MUs Rs. Crore Rs. Crore Rs. Crore Rs./Unit
Thermal 101,328 19,863 24,366 44,229 4.36
Hydro 13,899 2,911 2,476 5,387 3.88
Renewable 7,523 - 3,088 3,088 4.10
Others 8,994 - 605 605 0.67
Total Power purchase 131,744 22,774 30,535 53,309 4.05
Breakup of Power Purchase Cost for FY 2020-21

27
Particulars Units Value
Energy Requirement MU 1,09,328
Energy Availability MU 1,31,744
Energy Surplus MU 22,416
Fixed Cost of Surplus
Energy Rs. Crore 4394*
Actual Per Unit Fixed
Cost Rs./Unit 1.96
Total Fixed Cost Per Unit Rs./Unit
1.61
Stranded Cost of Power Purchase: Uttar Pradesh Details of Surrendered Power for FY 2020-21
• The surplus energy is around 17% of the energy availability,
• Impact of surplus power on ACOS is 6.74% (47 paise/unit)
Ratio of Surplus Fixed Cost to ARR
Particulars Units
Approved Sales MU 92,409
Approved ARR Rs. Crore 65,175
Approved ACoS Rs./Unit 7.05
Fixed Cost for Surplus Power Rs. Crore 4,394*
Ratio of Fixed Cost Paid to ARR % 6.74%
*Computed on the basis of Fixed Cost per Unit of Thermal Energy Source : Tariff Order for FY 2020-21

28
Stranded Cost of Power Purchase: Uttar Pradesh Scenario Analysis
• Instead of procuring power from Renewables, if the DISCOM had procured power from Thermal Stations , it
would have led to savings of around Rs. 1279 Crore.
Scenario- Power Purchase from Thermal instead of Renewables
Particulars Energy(MU) Total Cost(Rs. Crore) Rs./Unit
Renewable Energy 7,523 3,088 4.10
Purchase from Thermal Stations @ Variable
Cost 7,523 1,809 2.40
Net Savings 7,523 1,279 1.70

29
Stranded Cost of Power Purchase : Haryana
• Approved ARR for FY 2020-21 is Rs. 27,836 Crore and PP Cost contributes 75% of the ARR excluding Transmission Charges
Source : Tariff Order for FY 2020-21
Particulars Energy Received by the
Licensee Fixed Cost Variable Cost Total Cost
Unit MUs Rs. Crore Rs. Crore Rs. Crore Rs./Unit
Thermal 51,354 5,937 15,554 21,491 4.18
Hydro 7,984 912 1,273 2,185 2.74
Renewable 3,588 - 1,251 1,251 3.49
Others 740 4 273 276 3.73
Total Power purchase 63,667 6,852 18,351 25,203 3.96
Approved PP Cost 20,868 3.28
Breakup of Power Purchase Cost for FY 2020-21
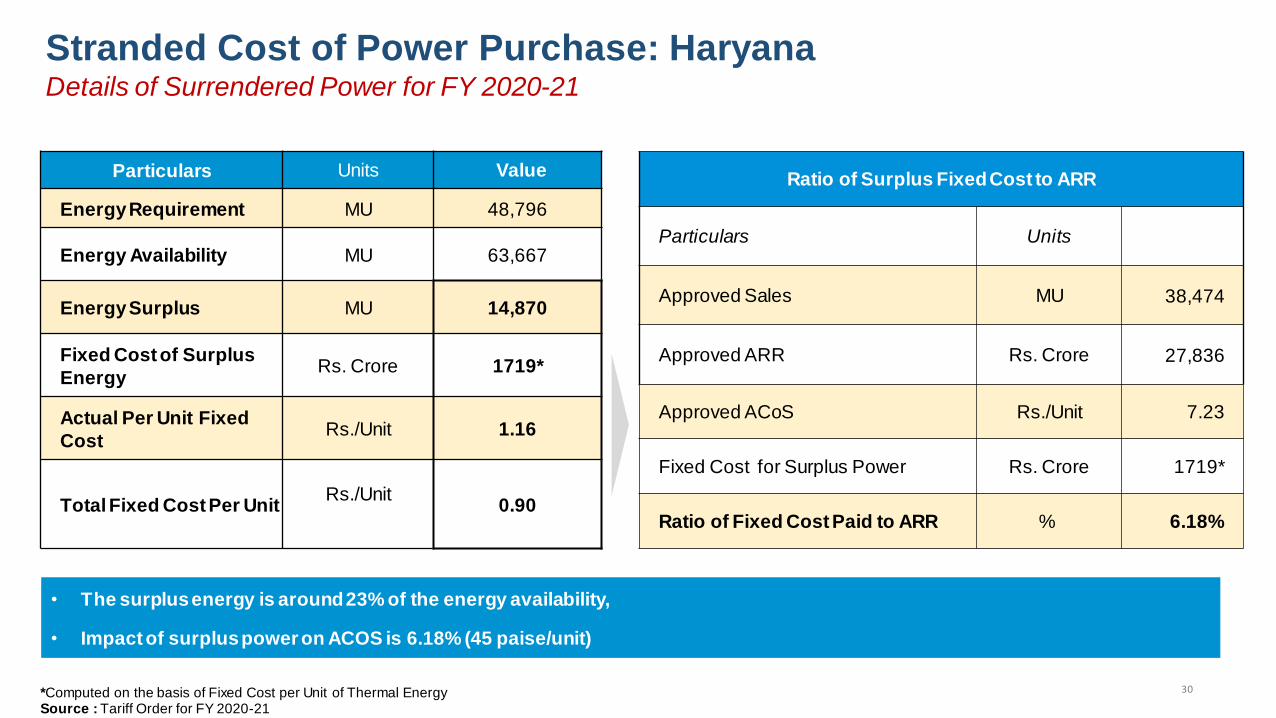
30
Particulars Units Value
Energy Requirement MU 48,796
Energy Availability MU 63,667
Energy Surplus MU 14,870
Fixed Cost of Surplus
Energy Rs. Crore 1719*
Actual Per Unit Fixed
Cost Rs./Unit 1.16
Total Fixed Cost Per Unit Rs./Unit
0.90
Stranded Cost of Power Purchase: Haryana Details of Surrendered Power for FY 2020-21
• The surplus energy is around 23% of the energy availability,
• Impact of surplus power on ACOS is 6.18% (45 paise/unit)
Ratio of Surplus Fixed Cost to ARR
Particulars Units
Approved Sales MU 38,474
Approved ARR Rs. Crore 27,836
Approved ACoS Rs./Unit 7.23
Fixed Cost for Surplus Power Rs. Crore 1719*
Ratio of Fixed Cost Paid to ARR % 6.18%
*Computed on the basis of Fixed Cost per Unit of Thermal Energy Source : Tariff Order for FY 2020-21

31
Stranded Cost of Power Purchase: Haryana Scenario Analysis
• Instead of procuring power from Renewables, if the DISCOM had procured power from Thermal Stations , it
would have led to savings of around Rs. 165 Crore.
Scenario -Power Purchase from Thermal instead of Renewables
Particulars Energy(MU) Total Cost(Rs. Crore) Rs./Unit
Renewable Energy 3,588 1,251 3.49
Purchase from Thermal Stations @ Variable
Cost 3,588 1,087 3.03
Net Savings 3,588 165 0.46

32
Stranded Cost of Power Purchase : Andhra Pradesh
• Approved ARR for FY 2020-21 is Rs. 42,494 Crore and PP Cost contributes 76% of the ARR excluding Transmission Charges
Source : Tariff Order for FY 2020-21
Particulars Energy Received by the
Licensee Fixed Cost Variable Cost Total Cost
Unit MUs Rs. Crore Rs. Crore Rs. Crore Rs./Unit
Thermal 50,545 7,894 16,016 23,910 4.73
Hydro 3,169 601 - 601 1.90
Renewable 14,392 - 6,597 6,597 4.58
Others 795 984 175 1,159 14.57
Total Power purchase 68,902 9,479 22,788 32,268 4.68
Breakup of Power Purchase Cost for FY 2020-21
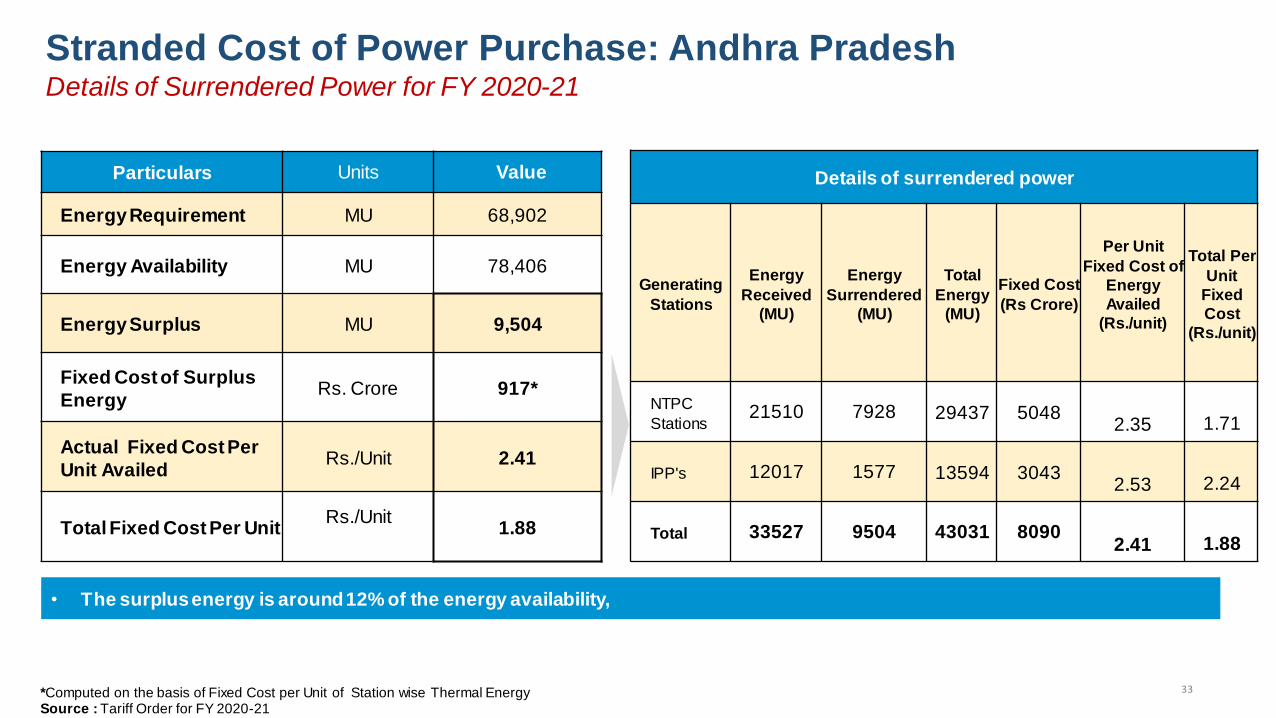
33
Particulars Units Value
Energy Requirement MU 68,902
Energy Availability MU 78,406
Energy Surplus MU 9,504
Fixed Cost of Surplus
Energy Rs. Crore 917*
Actual Fixed Cost Per
Unit Availed Rs./Unit 2.41
Total Fixed Cost Per Unit Rs./Unit
1.88
Stranded Cost of Power Purchase: Andhra Pradesh Details of Surrendered Power for FY 2020-21
• The surplus energy is around 12% of the energy availability,
*Computed on the basis of Fixed Cost per Unit of Station wise Thermal Energy Source : Tariff Order for FY 2020-21
Details of surrendered power
Generating
Stations
Energy
Received
(MU)
Energy
Surrendered
(MU)
Total
Energy
(MU)
Fixed Cost
(Rs Crore)
Per Unit
Fixed Cost of
Energy
Availed
(Rs./unit)
Total Per
Unit
Fixed
Cost
(Rs./unit)
NTPC
Stations 21510 7928 29437 5048
2.35
1.71
IPP's 12017 1577 13594 3043
2.53
2.24
Total 33527 9504 43031 8090
2.41
1.88

34
Stranded Cost of Power Purchase: Andhra Pradesh Scenario Analysis
• Impact of surplus power on ACOS is 2.16% (14 paise/unit)
• Instead of procuring power from Renewables, if the DISCOM had procured power from Thermal Stations , it would have led to savings of around Rs. 2037 Crore.
Scenario -Power Purchase from Thermal instead of Renewables
Particulars Energy(MU) Total Cost(Rs. Crore) Rs./Unit
Renewable Energy 14,392 6,597 4.58
Purchase from Thermal Stations @ Variable
Cost 14,392 4,560 3.17
Net Savings 14,392 2,037 1.42
Ratio of Surplus Fixed Cost to ARR
Particulars Units
Approved Sales MU 61,819
Approved ARR Rs. Crore 42,494
Approved ACoS Rs./Unit 6.87
Fixed Cost for Surplus Power Rs. Crore 917*
Ratio of Fixed Cost Paid to ARR % 2.16%

35
Stranded Cost of Power Purchase : Gujarat
• Approved ARR for FY 2020-21 is Rs. 51,712 Crore and PP Cost contributes 74% of the ARR excluding Transmission Charges
Source : MTR for FY 2019-20 to FY 2020-21
Particulars Energy Received by the
Licensee Fixed Cost Variable Cost Total Cost
Unit MUs Rs. Crore Rs. Crore Rs. Crore Rs./Unit
Thermal 88,217 12,017 19,173 31,190 3.54
Hydro 599 115 - 115 1.92
Renewable 16,533 40 6,813 6,853 4.15
Others 302 - 121 121 4.02
Total Power purchase 105,652 12,173 26,105 38,277 3.62
Breakup of Power Purchase Cost for FY 2020-21
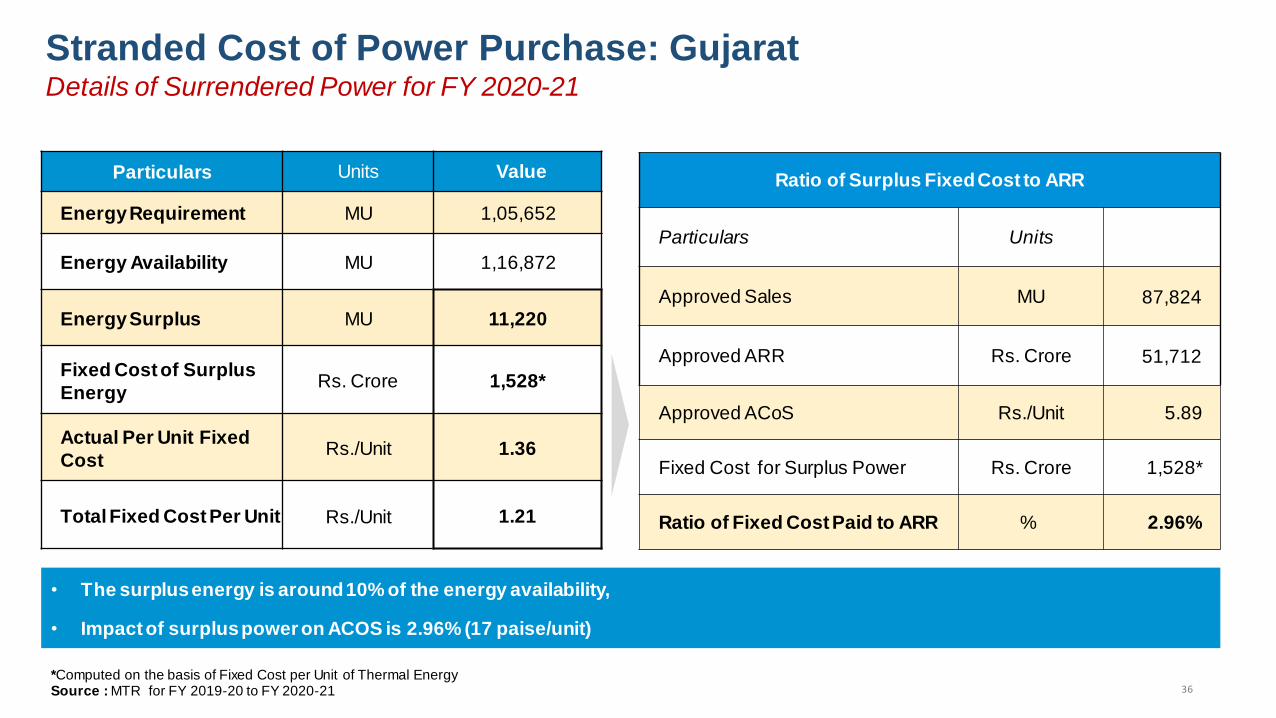
36
Particulars Units Value
Energy Requirement MU 1,05,652
Energy Availability MU 1,16,872
Energy Surplus MU 11,220
Fixed Cost of Surplus
Energy Rs. Crore 1,528*
Actual Per Unit Fixed
Cost Rs./Unit 1.36
Total Fixed Cost Per Unit
Rs./Unit
1.21
Stranded Cost of Power Purchase: Gujarat Details of Surrendered Power for FY 2020-21
• The surplus energy is around 10% of the energy availability,
• Impact of surplus power on ACOS is 2.96% (17 paise/unit)
Ratio of Surplus Fixed Cost to ARR
Particulars Units
Approved Sales MU 87,824
Approved ARR Rs. Crore 51,712
Approved ACoS Rs./Unit 5.89
Fixed Cost for Surplus Power Rs. Crore 1,528*
Ratio of Fixed Cost Paid to ARR % 2.96%
*Computed on the basis of Fixed Cost per Unit of Thermal Energy Source : MTR for FY 2019-20 to FY 2020-21
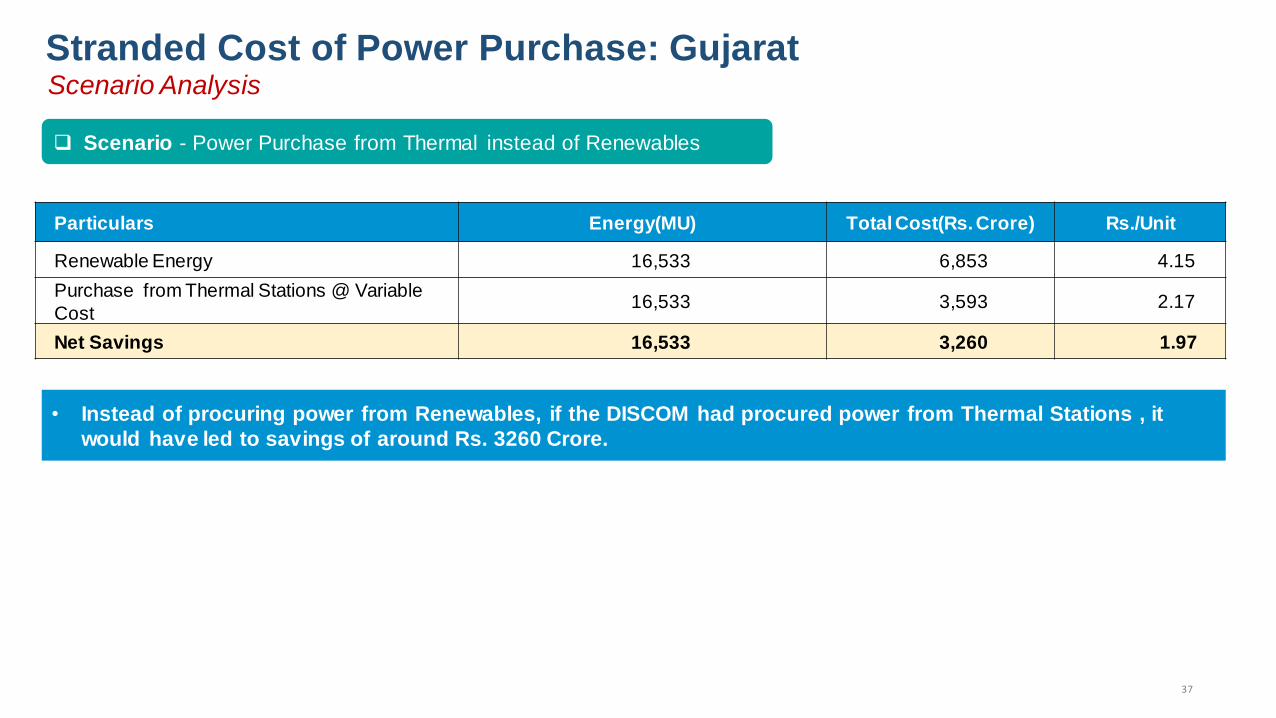
37
Stranded Cost of Power Purchase: Gujarat Scenario Analysis
• Instead of procuring power from Renewables, if the DISCOM had procured power from Thermal Stations , it
would have led to savings of around Rs. 3260 Crore.
Scenario - Power Purchase from Thermal instead of Renewables
Particulars Energy(MU) Total Cost(Rs. Crore) Rs./Unit
Renewable Energy 16,533 6,853 4.15
Purchase from Thermal Stations @ Variable
Cost 16,533 3,593 2.17
Net Savings 16,533 3,260 1.97

38
Stranded Cost of Power Purchase : Kerala
• Approved ARR for FY 2020-21 is Rs. 15,936 Crore and PP Cost contributes 56% of the ARR excluding Transmission Charges
Source : Revised Forecast for FY 2020-21 to FY 2021-22
Particulars Energy Received by the
Licensee Fixed Cost
Variable
Cost Other Cost Total Cost
Unit MUs Rs. Crore Rs. Crore Rs. Crore Rs. Crore Rs./Unit
Thermal 19,975 3,090 5,293 (119) 8,264 4.14
Hydro 88 - - 31 3.48
Renewable 1,397 - - 384 2.75
Others 385 - - 216 5.62
Total Power purchase 21,845 3,090 5,293 (119) 8,895 4.07
Breakup of Power Purchase Cost for FY 2020-21

39
Particulars Units Value
Energy Requirement MU 26,674
Energy Availability MU 27,456
Energy Surplus MU 782
Fixed Cost of Surplus
Energy Rs. Crore 121*
Actual Per Unit Fixed
Cost Rs./Unit 1.55
Total Fixed Cost Per Unit
Rs./Unit
1.49
Stranded Cost of Power Purchase: Kerala Details of Surrendered Power for FY 2020-21
• The Surplus Energy is around 3% of the Energy Availability;
• Impact of Surplus Power on ACOS is 0.76% .
Ratio of Surplus Fixed Cost to ARR
Particulars Units
Approved Sales MU 23,454
Approved ARR Rs. Crore 15,936
Approved ACoS Rs./Unit 6.77
Fixed Cost for Surplus Power Rs. Crore 121*
Ratio of Fixed Cost Paid to ARR % 0.76%
*Computed on the basis of Fixed Cost per Unit of Thermal Energy Source : Revised Forecast for FY 2020-21 to FY 2021-22

40
Stranded Cost of Power Purchase: Kerala Scenario Analysis
• Instead of procuring power from Renewables, if the DISCOM had procured power from Thermal Stations , it
would have led to savings of around Rs. 14 Crore.
Scenario -Power Purchase from Thermal instead of Renewables
Particulars Energy(MU) Total Cost(Rs. Crore) Rs./Unit
Renewable Energy 1,397 384 2.75
Purchase from Thermal Stations @ Variable
Cost 1,397 370 2.65
Net Savings 1,397 14 0.10
41
Ratio of Surplus Fixed Cost to ARR
State Year Fixed Cost Paid for Surplus
Power ( in Rs. Crore)
Ratio of Fixed Cost Paid
to ARR (in %)
Madhya Pradesh FY 2019-20 4,325 13.2%
Jharkhand FY 2020-21 563 8.9%
Bihar FY 2020-21 1,294 7.0%
Uttar Pradesh FY 2020-21 4,394 6.7%
Haryana FY 2020-21 1,719 6.2%
Assam FY 2018-19 294 5.5%
Punjab FY 2018-19 977 3.2%
Odisha FY 2020-21 348 3.1%
Gujarat FY 2020-21 1,528 3.0%
Andhra Pradesh FY 2020-21 917 2.2%
Kerala FY 2020-21 121 0.8%
Total 16480
Fixed cost paid for surplus power varied in the range of 1-13% of the total ARR for the 12 states
Stranded Cost of Power Purchase: Summary Ratio of Fixed Cost Paid to ARR
Summary: Under-utilization of generating stations Hypothesis: Optimal utilization of TPPs may lead to reduction in electricity tariffs
Under-utilization of generating stations could be attributed to shortage of coal, non-compliance with
Merit Order Dispatch, procurement from RE sources, and generating plants running on technical
minimum due to higher energy availability.
In Punjab, operation of State Thermal Power Plants at lower PLF has led to a normative loss of Rs.
672 Crore in addition to the fixed charges paid for surplus power.
Fixed cost paid for surplus power varied in the range of 1-13% of the total ARR for the 12 states
42

Key Factors Impacting
Study on Analysis of
Electricity Tariffs
April 2021

Background and objective 01
02
03
Structure of the discussion
Analysis of select parameters
Contents
04 Conclusion
2

Retail supply tariffs are designed to recover the cost incurred across the entire value chain i.e.,
generation, transmission, distribution and retail supply.
It depends on multiple factors such as like cost of generation- fixed costs including O&M expenses, fuel
expense, taxes and duties, etc., cost of transmission- capital and operating costs, Return on Equity
(ROE), network maintenance expenses, etc. and cost of distribution- network development, O&M,
distribution losses, metering, billing & collection expenses, etc.
In order to identify measures to reduce retail supply tariffs, it is proposed to conduct a study on “Analysis
of key factors impacting electricity tariffs”.
Background and objective
The proposed study will:
a) Identify the impact of key external and internal factors on electricity tariff including the likely impact of
recent developments in the sector, and
b) Suggest policy and regulatory measures to reduce electricity tariffs
3
4
Structure of discussion
Transmission
charges
Power purchase
cost
2 3
5
Actual energy
demand vis-à-vis planned
Inter-state annual
transmission charges at the
national level over the last 10 years
Tariff discovered
through competitive bidding
Distribution
Losses
O&M Expenses
Interest and
finance charges
Retiring of old TPPs
Under-utilization of generating stations
MERC MOD Guidelines
Stranded Capacity
Compliance of new
environmental norms
Cost optimization through greater use of market
Share of PPC in
approved ACoS
Break up of PPC
Cost and quality
of coal, grade slippages, railway
freight and taxes
Clean Energy Cess
GCV loss
Components of Average Cost of Supply (ACoS)
Internal
factors Other factors
6
1
Fixed cost
elements
4
Return on Equity
Depreciation costs

Power
purchase cost

Share of PPC in approved
ACoS
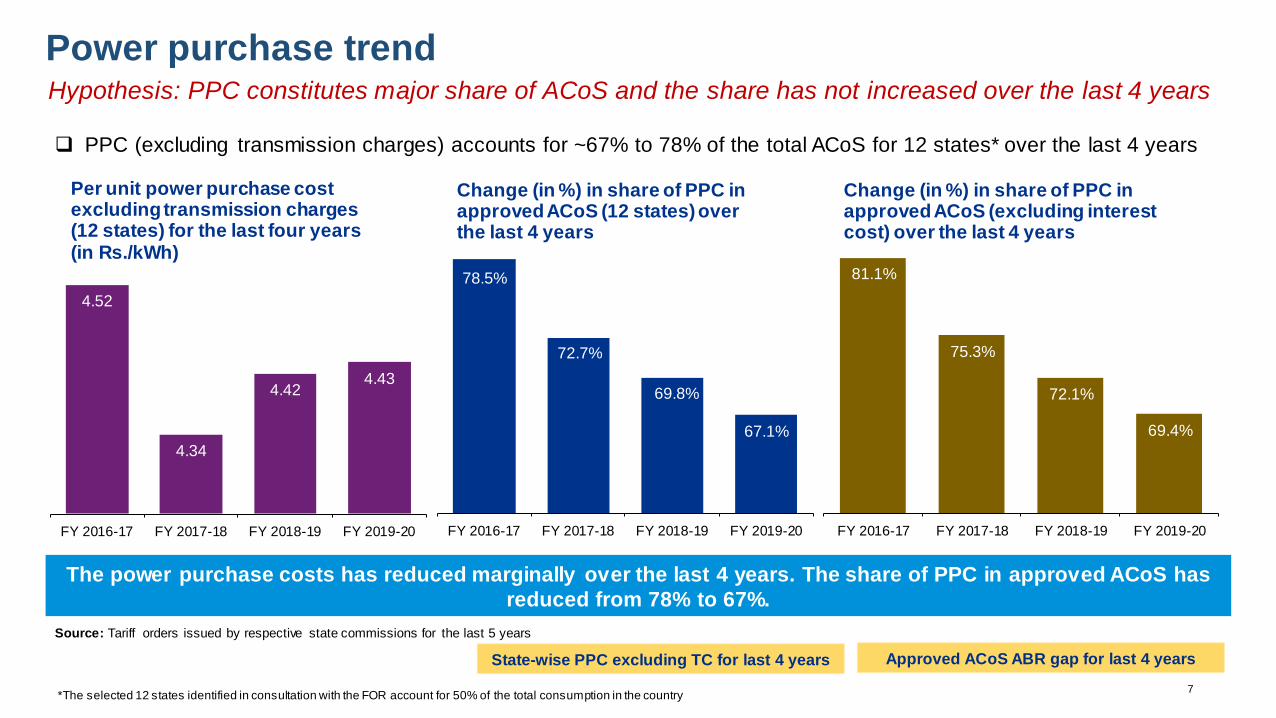
7
Power purchase trend
PPC (excluding transmission charges) accounts for ~67% to 78% of the total ACoS for 12 states* over the last 4 years
Source: Tariff orders issued by respective state commissions for the last 5 years
The power purchase costs has reduced marginally over the last 4 years. The share of PPC in approved ACoS has
reduced from 78% to 67%.
*The selected 12 states identified in consultation with the FOR account for 50% of the total consumption in the country
Hypothesis: PPC constitutes major share of ACoS and the share has not increased over the last 4 years
State-wise PPC excluding TC for last 4 years Approved ACoS ABR gap for last 4 years
81.1%
75.3%
72.1%
69.4%
FY 2016-17 FY 2017-18 FY 2018-19 FY 2019-20
Change (in %) in share of PPC in approved ACoS (excluding interest cost) over the last 4 years
4.52
4.34
4.42 4.43
FY 2016-17 FY 2017-18 FY 2018-19 FY 2019-20
Per unit power purchase cost excluding transmission charges (12 states) for the last four years (in Rs./kWh)
78.5%
72.7%
69.8%
67.1%
FY 2016-17 FY 2017-18 FY 2018-19 FY 2019-20
Change (in %) in share of PPC in approved ACoS (12 states) over the last 4 years

12.6% 12.9% 15.6% 14.5%
64.0% 64.1% 63.9%
59.2%
13.2% 12.7% 13.1%
11.7% 2.6%
2.2% 2.6% 2.1% 3.2%
2.4% 2.4% 2.3%
1.4% 1.2% 1.4%
1.2%
3.0% 4.5% 1.0% 9.0%
FY 2016-17 FY 2017-18 FY 2018-19 FY 2019-20
Madhya Pradesh
10.9% 9.0% 8.2% 8.4%
77.0% 77.8% 80.3% 79.0%
12.5% 13.5% 9.7% 11.8% 0.9% 0.9% 1.3% 1.4%
2.6% 3.2% 2.3% 2.2%
2.4% 2.4% 2.3%
2.2%
-6.4% -6.8% -4.1% -5.0%
FY 2016-17 FY 2017-18 FY 2018-19 FY 2019-20
Uttarakhand
Share of cost components (in %) of ARR
Source: Tariff orders issued by respective state commissions for the last 4 years;
Change in share of cost components over the last 4 years
The share of PPC has reduced marginally over
the last 4 years whereas the share of O&M
expenses has increased over the same duration
The share of transmission charges and O&M
expenses has reduced whereas the share of
PPC has increased
The share of PPC and transmission charges has
reduced in last 4 years whereas the share of
O&M expenses and other elements has
increased
O&M Expenses PPC Transmission Charges Return on Equity Net Interest & Finance Charges Depreciation Other elements
10.1% 10.5% 10.6% 11.4%
69.0% 65.2% 64.1% 67.2%
12.4% 11.0% 11.8%
12.5%
0.5% 0.6% 1.0%
0.9% 5.1% 5.2% 5.2%
5.3% 2.0% 2.4% 2.5%
2.8% 0.9% 5.0% 4.8%
0.0%
FY 2016-17 FY 2017-18 FY 2018-19 FY 2019-20
Karnataka
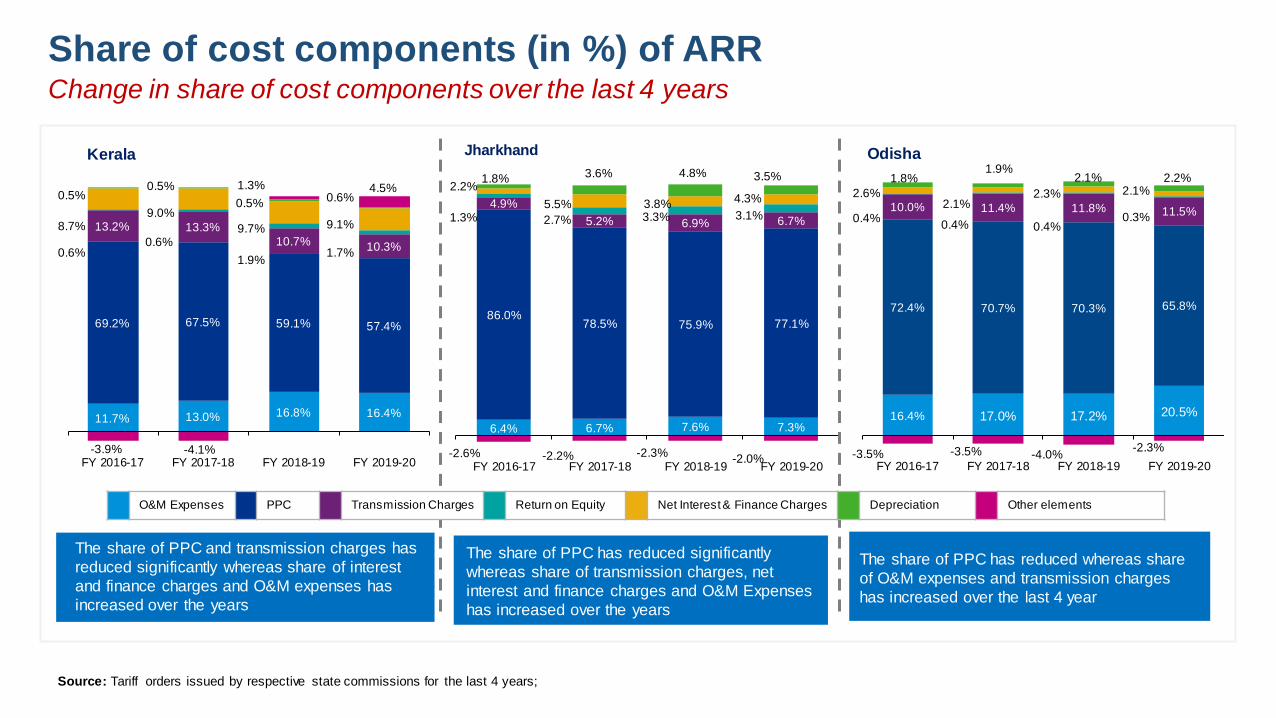
Share of cost components (in %) of ARR
Source: Tariff orders issued by respective state commissions for the last 4 years;
Change in share of cost components over the last 4 years
The share of PPC has reduced whereas share
of O&M expenses and transmission charges
has increased over the last 4 year
The share of PPC has reduced significantly
whereas share of transmission charges, net
interest and finance charges and O&M Expenses
has increased over the years
The share of PPC and transmission charges has
reduced significantly whereas share of interest
and finance charges and O&M expenses has
increased over the years
11.7% 13.0% 16.8% 16.4%
69.2% 67.5% 59.1% 57.4%
13.2% 13.3%
10.7% 10.3% 0.6%
0.6%
1.9% 1.7%
8.7% 9.0%
9.7% 9.1%
0.5% 0.5%
0.5% 0.6%
-3.9% -4.1%
1.3% 4.5%
FY 2016-17 FY 2017-18 FY 2018-19 FY 2019-20
Kerala
6.4% 6.7% 7.6% 7.3%
86.0% 78.5% 75.9% 77.1%
4.9%
5.2% 6.9% 6.7% 1.3% 2.7% 3.3% 3.1%
2.2%
5.5% 3.8% 4.3%
1.8% 3.6% 4.8% 3.5%
-2.6% -2.2% -2.3% -2.0%
FY 2016-17 FY 2017-18 FY 2018-19 FY 2019-20
Jharkhand
16.4% 17.0% 17.2% 20.5%
72.4% 70.7% 70.3% 65.8%
10.0% 11.4% 11.8% 11.5% 0.4%
0.4% 0.4% 0.3%
2.6% 2.1%
2.3% 2.1% 1.8%
1.9% 2.1% 2.2%
-3.5% -3.5% -4.0% -2.3%
FY 2016-17 FY 2017-18 FY 2018-19 FY 2019-20
Odisha
O&M Expenses PPC Transmission Charges Return on Equity Net Interest & Finance Charges Depreciation Other elements

5.7% 6.8% 6.1% 8.3%
89.2%
70.3% 76.8% 71.2%
8.8%
12.0% 12.7%
11.8%
0.4%
4.3% 2.6% 4.4%
1.7%
6.4% 2.5% 5.4%
3.5% 1.6% 2.3%
-5.8% -3.3% -2.3% -3.5%
FY 2016-17 FY 2017-18 FY 2018-19 FY 2019-20
Bihar
Share of cost components (in %) of ARR
Source: Tariff orders issued by respective state commissions for the last 4 years;
Change in share of cost components over the last 4 years
The share of PPC has reduced whereas the
share of transmission charges has increased
The share of transmission charges, net interest
and finance charges and O&M expenses has
increased whereas the share of PPC has
reduced significantly in the state
The share of transmission charges has
increased whereas the share of PPC and O&M
expenses have reduced
19.3% 15.6% 18.4% 18.8%
72.5%
57.0% 56.5% 68.3%
13.4%
21.4% 20.3%
16.1%
0.6%
0.5% 0.5%
0.5% 1.6% 1.2%
1.0%
0.4%
0.3%
0.4% 0.5%
0.3%
-7.7%
4.0% 2.8%
-4.4%
FY 2016-17 FY 2017-18 FY 2018-19 FY 2019-20
Assam
10.3% 10.4% 9.8% 10.5%
86.5% 79.9%
73.9% 73.6%
9.0% 12.3%
11.7% 12.3% 0.0%
1.5%
0.0%
0.0%
0.6% 1.9%
2.7% 2.4%
2.4% 2.4%
2.1% 2.2%
-8.9% -8.5%
-0.2%
-1.0%
FY 2016-17 FY 2017-18 FY 2018-19 FY 2019-20
Haryana
O&M Expenses PPC Transmission Charges Return on Equity Net Interest & Finance Charges Depreciation Other elements

Share of cost components (in %) of ARR
Source: Tariff orders issued by respective state commissions for the last 4 years;
Change in share of cost components over the last 4 years
The share of PPC has reduced over the years
whereas the share of transmission charges and
O&M expenses has increased
The share of PPC has reduced whereas the
share of transmission charges and other
expenses has increased over the years
The share of PPC has reduced over the years
whereas the share of transmission charges and
O&M expenses has increased over the last 4 years
5.0% 4.9% 4.9% 7.0%
75.3% 74.7% 74.3% 73.3%
11.8% 12.0% 12.2% 12.4% 2.8%
2.9% 3.0%
2.9% 2.2% 2.2% 2.2%
2.0%
4.2% 4.5% 4.7%
3.6%
-1.3% -1.2% -1.4% -1.1%
FY 2016-17 FY 2017-18 FY 2018-19 FY 2019-20
Gujarat
*For the state of Andhra Pradesh, net ARR is estimated as sum of PPC, transmission charges and other elements of ARR
4.7% 9.8% 11.3% 12.4%
80.3% 74.8% 72.0%
65.4%
8.3% 7.2% 7.6% 11.5%
0.1% 2.5% 2.3% 2.6%
4.6% 4.0% 5.7% 5.9%
2.3% 1.9% 1.3% 2.5%
FY 2016-17 FY 2017-18 FY 2018-19 FY 2019-20
Uttar Pradesh
O&M Expenses PPC Transmission Charges Return on Equity Net Interest & Finance Charges Depreciation Other elements
79.4% 77.4% 76.8% 73.9%
5.2% 6.3% 6.9% 8.8%
15.4% 16.3% 16.3% 17.3%
FY 2016-17 FY 2017-18 FY 2018-19 FY 2019-20
Andhra Pradesh*

Summary: Power purchase trend Hypothesis: PPC constitutes major share of ACoS and the share has not increased over the last 4 years
PPC accounted for ~67% to 78% of the ACoS over the last 4 years for 12 states. However, per
unit PPC has reduced during the same period.
o Share of PPC in approved ACoS has reduced across states (except for the states of
Uttarakhand)
• In Uttarakhand, the share of PPC has increased mainly on account of new PPAs with gas-
based power plants
Major reason for reduction in share of PPC is the increase in contribution of other cost
components (such as O&M costs, depreciation, ROE, etc.) to the approved ACoS

Power purchase break-up,
cost and quality of coal,
grade slippages, increasing
taxes, railway freight
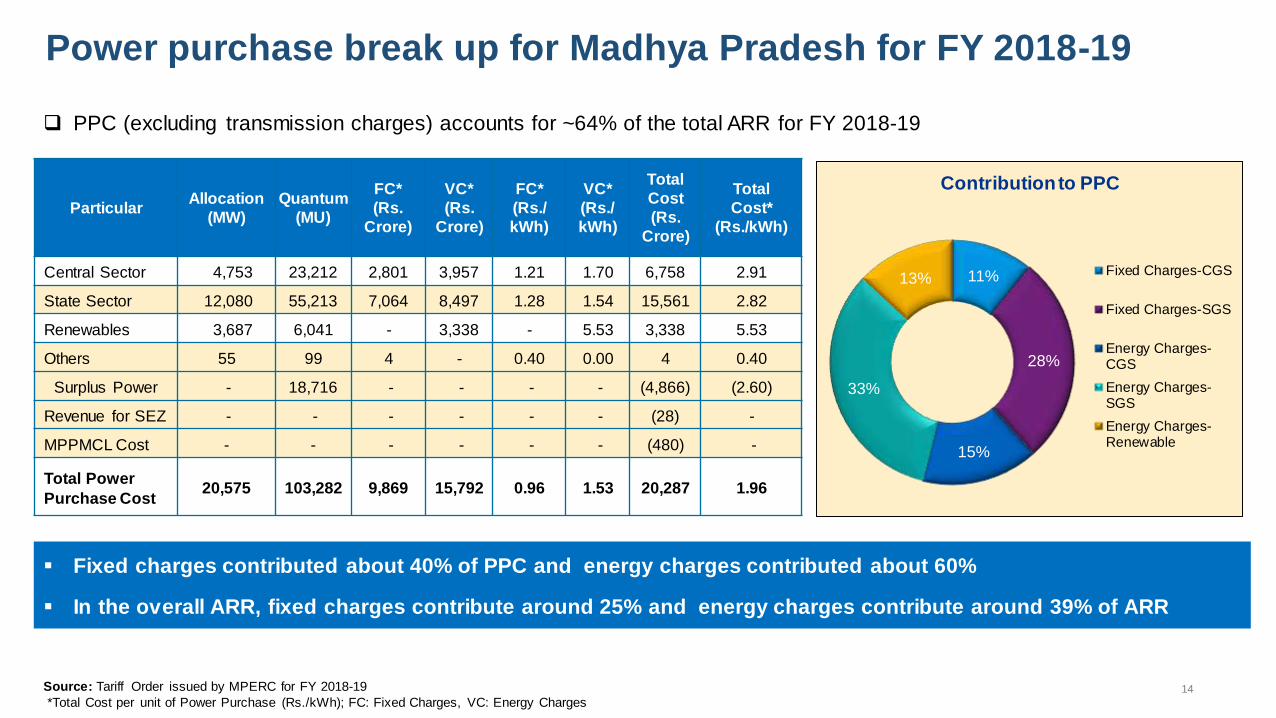
14
Power purchase break up for Madhya Pradesh for FY 2018-19
PPC (excluding transmission charges) accounts for ~64% of the total ARR for FY 2018-19
Fixed charges contributed about 40% of PPC and energy charges contributed about 60%
In the overall ARR, fixed charges contribute around 25% and energy charges contribute around 39% of ARR
Source: Tariff Order issued by MPERC for FY 2018-19
*Total Cost per unit of Power Purchase (Rs./kWh); FC: Fixed Charges, VC: Energy Charges
Particular Allocation
(MW)
Quantum
(MU)
FC*
(Rs.
Crore)
VC*
(Rs.
Crore)
FC*
(Rs./
kWh)
VC*
(Rs./
kWh)
Total
Cost
(Rs.
Crore)
Total
Cost*
(Rs./kWh)
Central Sector 4,753 23,212 2,801 3,957 1.21 1.70 6,758 2.91
State Sector 12,080 55,213 7,064 8,497 1.28 1.54 15,561 2.82
Renewables 3,687 6,041 - 3,338 - 5.53 3,338 5.53
Others 55 99 4 - 0.40 0.00 4 0.40
Surplus Power - 18,716 - - - - (4,866) (2.60)
Revenue for SEZ - - - - - - (28) -
MPPMCL Cost - - - - - - (480) -
Total Power
Purchase Cost 20,575 103,282 9,869 15,792 0.96 1.53 20,287 1.96
11%
28%
15%
33%
13%
Contribution to PPC
Fixed Charges-CGS
Fixed Charges-SGS
Energy Charges-CGS
Energy Charges-SGS
Energy Charges-Renewable

15
Power purchase break up for Uttarakhand for FY 2018-19
PPC (excluding transmission charges) accounts for ~80% of the total ARR for FY 2018-19
Fixed charges contributed around 25% of PPC and energy charges contributed about 70% to PPC
Variable charges for Uttarakhand is high mainly due to purchase from gas-based stations
Source: Tariff Order issued by UERC for FY 2018-19
Particular Allocation
(MW)
PP at State
periphery
(MU)
FC* (Rs.
Crore)
VC*
(Rs.
Crore)
VC*
(Rs./
kWh)
Total
Cost
(Rs.
Crore)
Total Cost*
(Rs./kWh)
Central Sector 1,018 4,926 569 1,033 2.10 1,602 3.25
State Sector 1,682 7,511 642 1,606 2.14 2,248 2.99
Renewables 209 1,989 - 701 3.53 701 3.53
Water Tax - - - 233 - 233 -
Total Power
Purchase Cost 2,909 14,426 1,212 3,573 2.48 4,785 3.32
*Total Cost per unit of Power Purchase (Rs./kWh)
FC: Fixed Charges, VC: Energy Charges
12%
13%
22% [VALUE]
15%
5%
Contribution to PPC
Fixed Charges-CGS
Fixed Charges-SGS
Energy Charges-CGS
Energy Charges-SGS
Energy Charges-Renewable
Water Tax

16
Coal price hike Hypothesis: Cost of coal for TPPs has increased disproportionately as compared to other
cost components
Coal Grade GCV (Kcal/Kg) Coal Price (Rs/Tonne)
June 2013- May 2016 June 2016- Dec 2017 Jan 2018- present
G1 Above 7000
Price shall be increased by Rs. 150/- per tonne over and above the
price applicable for GCV band exceeding 6700 but not exceeding 7000 Kcal/Kg, for increase in GCV by every 100 Kcal/Kg
Price shall be increased by Rs. 100/- per tonne over and above the
price applicable for GCV band exceeding 6700 but not exceeding 7000 Kcal/Kg, for increase in GCV by every 100 Kcal/Kg
G2 6701-7000 4,870 3,450 3,288
G3 6401-6700 3,890 3,210 3,144
G4 6101-6400 3,490 3,000 3,000
G5 5801-6100 2,800 2,750 2,737
G6 5501-5800 1,600 1,900 2,317
G7 5201-5500 1,400 1,600 1,926
G8 4901-5200 1,250 1,420 1,465
G9 4601-4900 970 1,100 1,140
G10 4301-4600 860 980 1,024
G11 4001-4300 700 810 955
G12 3701-4000 660 760 886
G13 3401-3700 610 720 817
G14 3101-3400 550 650 748
G15 2801-3100 510 600 590
G16 2501-2800 450 530 504
G17 2201-2500 400 470 447
• Price per tonne for most grades of coal has increased since January 2018, directly impacting power purchase cost of
power distribution companies
Coal price for CIL subsidiaries and NEC except WCL; Source: http://www.coal.nic.in,
Coal grade used for electricity generation • Increase in G11 – G14 Grade in Jan 2018 with respect to June 2016 is in range of 13-18%

Railway transportation charges
Base freight charges of coal and coke have increased by 21% in Jan 2018 and 9% in Nov 2018 impacting
the power purchase cost
Distance slab (in kms) 2016 July-sept 2017 Oct 2017-Jan 2018 Jan 2018* November 2018#
1-100 165 179 165 199 216
500-600 844 949 935 1129 1228
1000-1020 1371 1476 1462 1765 1920
1500-1510 1970 2076 2061 2489 2707
2000-2010 2249 2354 2340 2825 3073
2500-2510 2524 2630 2615 3158 3434
3000-3010 2799 2905 2890 3490 3795
Figures in Rs./tonne Freight rate- Trainload for Coal and coke
*Adjustment in base freight rates effective from 9 th January 2018 Source: http://www.indianrailways.gov.in #http://www.indianrailways.gov.in/railwayboard/uploads/directorate/traffic_comm/downloads/Freight_Rate_2018/RC_19_2018.PDF
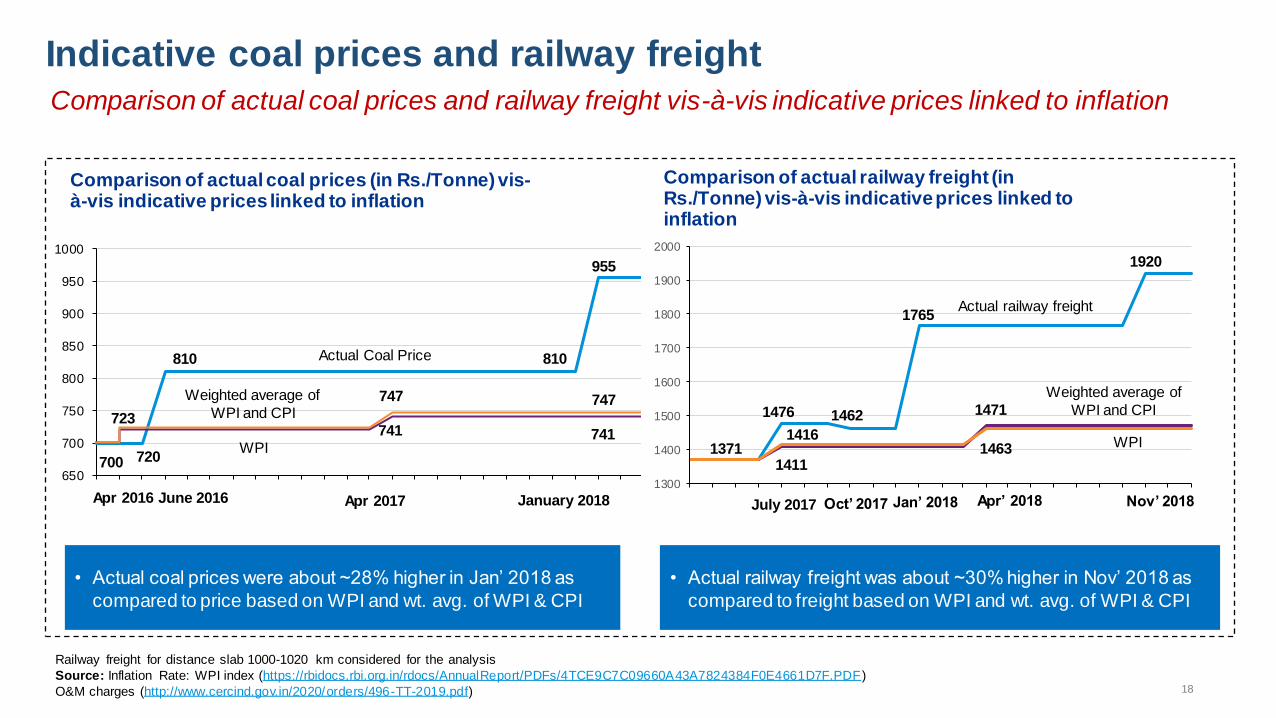
18
Indicative coal prices and railway freight
650
700
750
800
850
900
950
1000
Mar-
16
Ap
r-1
6
May-1
6
Ju
n-1
6
Ju
l-16
Au
g-1
6
Se
p-1
6
Oct-
16
No
v-1
6
De
c-1
6
Ja
n-1
7
Feb
-17
Mar-
17
Ap
r-1
7
May-1
7
Ju
n-1
7
Ju
l-17
Au
g-1
7
Se
p-1
7
Oct-
17
No
v-1
7
De
c-1
7
Ja
n-1
8
Feb
-18
Mar-
18
Comparison of actual coal prices (in Rs./Tonne) vis-à-vis indicative prices linked to inflation
810
700
955
720
723 741
747
Actual Coal Price
Weighted average of
WPI and CPI
WPI
June 2016 January 2018
Comparison of actual coal prices and railway freight vis-à-vis indicative prices linked to inflation
Railway freight for distance slab 1000-1020 km considered for the analysis
Source: Inflation Rate: WPI index (https://rbidocs.rbi.org.in/rdocs/AnnualReport/PDFs/4TCE9C7C09660A43A7824384F0E4661D7F.PDF)
O&M charges (http://www.cercind.gov.in/2020/orders/496-TT-2019.pdf)
• Actual coal prices were about ~28% higher in Jan‟ 2018 as
compared to price based on WPI and wt. avg. of WPI & CPI
1300
1400
1500
1600
1700
1800
1900
2000
Ma
r-17
Ap
r-17
Ma
y-1
7
Ju
n-1
7
Ju
l-1
7
Au
g-1
7
Se
p-1
7
Oct-
17
Nov-1
7
Dec-1
7
Ja
n-1
8
Fe
b-1
8
Ma
r-18
Ap
r-18
Ma
y-1
8
Ju
n-1
8
Ju
l-1
8
Au
g-1
8
Se
p-1
8
Oct-
18
Nov-1
8
Dec-1
8
Ja
n-1
9
Comparison of actual railway freight (in Rs./Tonne) vis-à-vis indicative prices linked to inflation
• Actual railway freight was about ~30% higher in Nov‟ 2018 as
compared to freight based on WPI and wt. avg. of WPI & CPI
July 2017 Jan’ 2018 Nov’ 2018
1920
1765
1371
1476 1462
Oct’ 2017
1411
1416 1463
1471
Apr’ 2018
Actual railway freight
Apr 2016 Apr 2017
741
747
810
Weighted average of
WPI and CPI
WPI

Clean energy cess
Source: http://www.coal.nic.in, www.arthapedia.in
https://coal.nic.in/sites/upload_files/coal/files/curentnotices/cbec140710_0_0.pdf https://timesofindia.indiatimes.com/budget -2016/industry/Union-Budget-2016-Govt-doubles-Clean-
Energy-Cess-on-coal-to-Rs-400-per-tonne/articleshow/51191619.cmsSource: http://www.indianrailways.gov.in
Description Unit
GoI, Ministry of
Finance Notification
dated 22 June
2010
GoI, Ministry of
Finance Notification
dated July 2014
GoI, Ministry of
Finance Notification
dated 28 Feb
2015
GoI, Ministry of
Finance Notification dated
March 2016
Clean energy cess Rs./Tonne 50 100 200 400
19
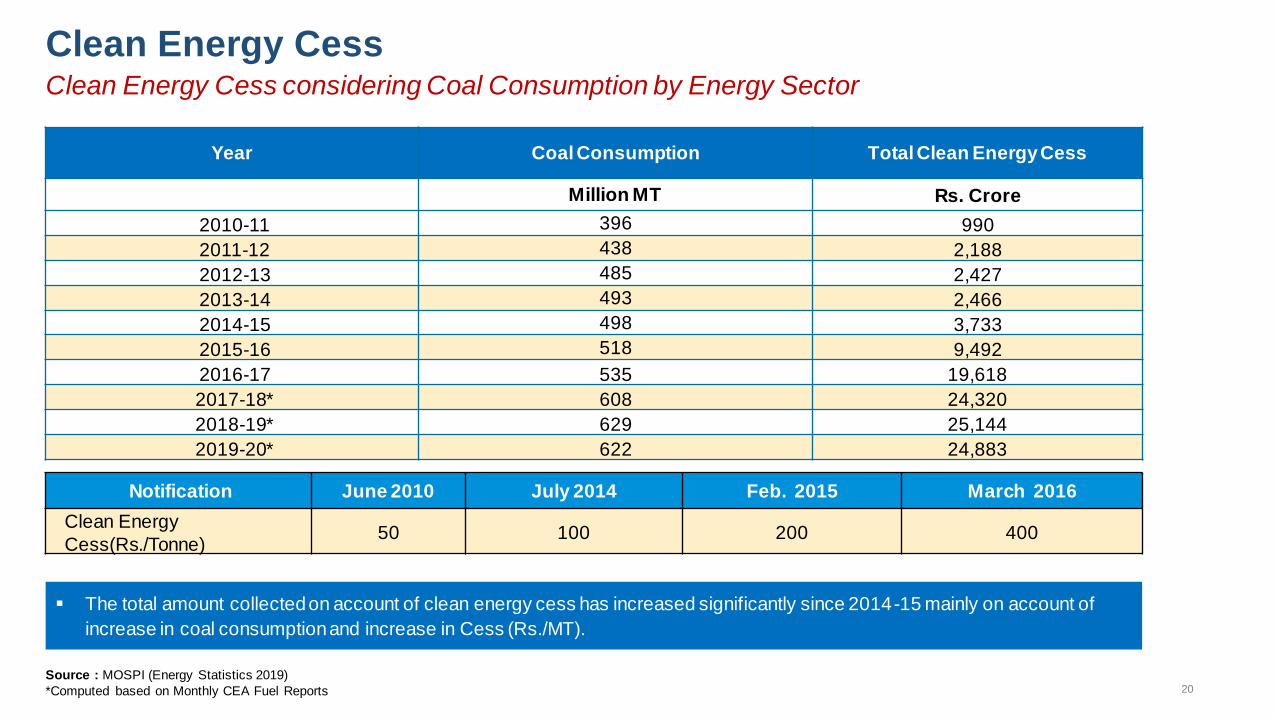
20
Clean Energy Cess
The total amount collected on account of clean energy cess has increased significantly since 2014-15 mainly on account of
increase in coal consumption and increase in Cess (Rs./MT).
Year Coal Consumption Total Clean Energy Cess
Million MT Rs. Crore
2010-11 396 990
2011-12 438 2,188
2012-13 485 2,427
2013-14 493 2,466
2014-15 498 3,733
2015-16 518 9,492
2016-17 535 19,618
2017-18* 608 24,320
2018-19* 629 25,144
2019-20* 622 24,883
Notification June 2010 July 2014 Feb. 2015 March 2016
Clean Energy
Cess(Rs./Tonne) 50 100 200 400
Clean Energy Cess considering Coal Consumption by Energy Sector
Source : MOSPI (Energy Statistics 2019)
*Computed based on Monthly CEA Fuel Reports

21
Contribution of fuel cost, railway freight and cess to cost of generation for
a sample station in Madhya Pradesh
For non pit-head stations,
• Transportation Cost accounts for around 50% of total landed cost of coal
• Clean energy cess contributes to around 10% of total landed cost of coal which will be around 12-20% for landed
cost of coal for pit head stations
25%
41%
11%
12%
[VALUE]
Coal Landed Price Break up for Non Pit Head Stations (G 11 Coal)
Coal Price
Rail Transportation
Road Transportation
Others
Clean Energy Cess

22
Reduction in clean energy cess
Parameter Value
Total Coal and Lignite Consumption for Power Generation in FY 2017-18 (as per
MOSPI Report) 614.53 Million Tonnes
Total Annual Thermal Generation in FY 2017-18 (CEA Report) 1,037 Billion Units
Annual savings due to reduction in Clean Energy Cess by Rs 100/MT Rs 6,145 Crore
Impact of Rs 100/MT reduction in Clean Energy Cess on per unit energy charge Around 6 paise per unit
(approximately 3%)
Impact of Rs 50/MT reduction in Clean Energy Cess on per unit energy charge Around 3 paise per unit
(approximately 1.5%)
*The above analysis is only indicative. A detailed analysis on this aspect will be conducted during the study.
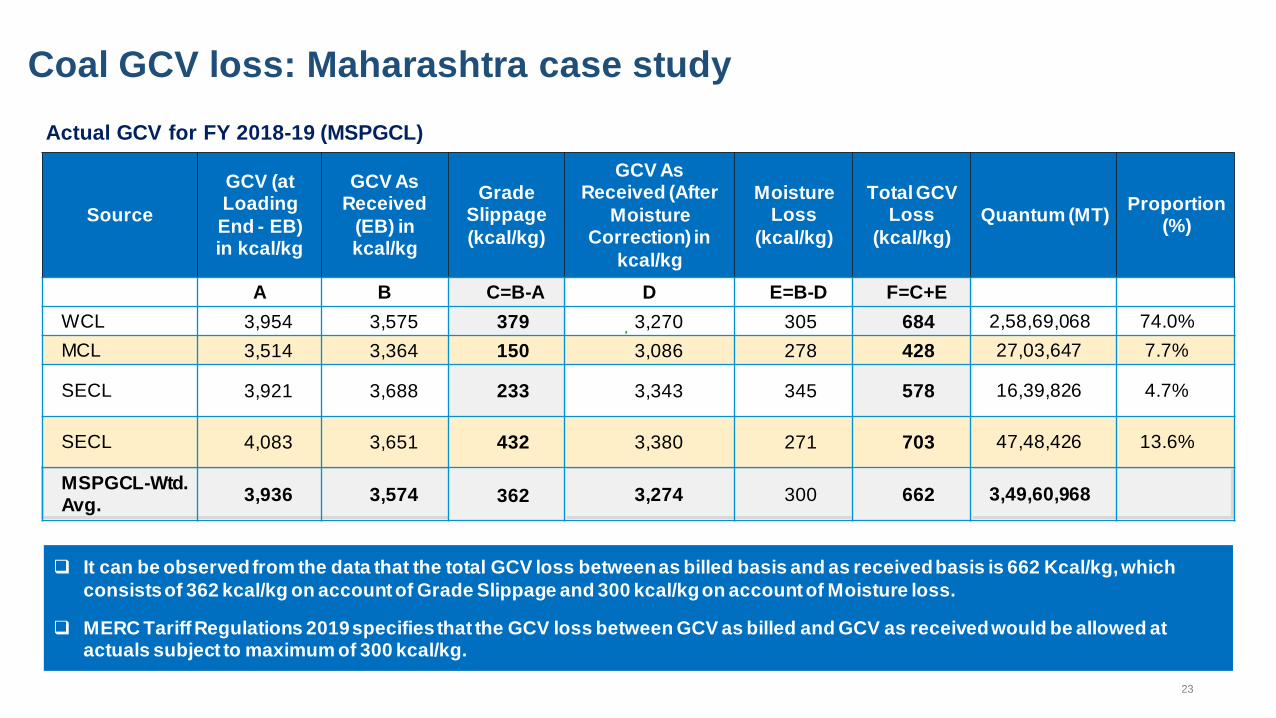
23
Coal GCV loss: Maharashtra case study
Actual GCV for FY 2018-19 (MSPGCL)
It can be observed from the data that the total GCV loss between as billed basis and as received basis is 662 Kcal/kg, which
consists of 362 kcal/kg on account of Grade Slippage and 300 kcal/kg on account of Moisture loss.
MERC Tariff Regulations 2019 specifies that the GCV loss between GCV as billed and GCV as received would be allowed at actuals subject to maximum of 300 kcal/kg.
Source
GCV (at Loading
End - EB) in kcal/kg
GCV As Received
(EB) in kcal/kg
Grade Slippage
(kcal/kg)
GCV As Received (After
Moisture Correction) in
kcal/kg
Moisture Loss
(kcal/kg)
Total GCV Loss
(kcal/kg)
Quantum (MT) Proportion
(%)
A B C=B-A D E=B-D F=C+E
WCL 3,954 3,575 379 3,270 305 684 2,58,69,068 74.0%
MCL 3,514 3,364 150 3,086 278 428 27,03,647 7.7%
SECL 3,921 3,688 233 3,343 345 578 16,39,826 4.7%
SECL 4,083 3,651 432 3,380 271 703 47,48,426 13.6%
MSPGCL-Wtd. Avg.
3,936 3,574 362 3,274 300 662 3,49,60,968

24
Coal GCV loss: Maharashtra case study
Actual GCV for FY 2019-20 (April to Oct 2019.)
GCV loss between As Billed and As Received is 808 kcal/kg for MSPGCL as a whole, comprising 495 kcal/kg towards Grade
Slippage and 313 kcal/kg towards moisture correction.
The GCV loss for FY 2019-20 (April to October) is higher than FY 2018-19,because losses are higher during the monsoon season.
Source
GCV (at Loading End
-EB) in kcal/kg
GCV As Received (EB)
in kcal/kg
Grade Slippage
(kcal/kg)
GCV As Received (After Moisture
Correction) in kcal/kg
Moisture Loss
(kcal/kg)
Total GCV Loss
(kcal/kg)
Quantum (MT)
Proportion (%)
A B C=B-A D E=B-D F=C+E
WCL 4,115 3,491 624 3,168 323 947 12,993,932 72.0%
MCL 3,537 3,565 (28) 3,225 340 312 1,390,724 7.7%
SECL 3,814 3,752 62 3,404 348 410 732,058 4.1%
SCCL 3,430 3,149 281 2,900 249 530 2,938,306 16.3%
MSPGCL-Wtd. Avg.
3,947 3,452 495 3,138 313 808 18,055,020

25
Particulars GCV Relaxation as per
Regulations Additional GCV relaxation Total Relaxation in GCV
kcal/kg kcal/kg kcal/kg
FY 2020-21 300 225 525
FY 2021-22 300 200 500
FY 2022-23 300 175 475
FY 2023-24 300 150 450
FY 2024-25 300 125 425
Observations of MERC on GCV of Coal
Coal GCV loss: Maharashtra case study
GCV loss between as billed and as received
for FY 2018-19
662
kcal/kg1 GCV loss between as billed and as received
for FY 2019-20
792
kcal/kg2
1 362 kcal/kg - Grade Slippage and 300 kcal/kg-Moisture correction 2 492 kcal/kg –Grade slippage and 300 kcal/kg-Moisture correction
The Commission observed that if entire GCV loss is allowed, then there will be no incentive for MSPGCL to control the GCV loss.
Hence in addition to the relaxation of 300 kcal/kg, the Commission decided to provide extra relaxation on account of GCV for
the subsequent years, provided in the table below:

26
Impact of GCV loss on energy charge
Sample Impact of GCV Loss on Energy Charges
Sample Impact of GCV Unit GCV-3408 GCV-3308 GCV-3208
Installed Capacity MW 210 210 210
Plant Load Factor (%) % 85.00% 85.00% 85.00%
Gross Generation MU 1563.7 1563.7 1563.7
Auxiliary Consumption % 11.0% 11.0% 11.0%
Net Generation MU 1392.3 1392.3 1392.3
Station Heat Rate kCal/kWh 2450 2450 2450
Secondary Fuel Oil
Consumptionml/kWh
2 2
2
GCV of Oil kCal/litre 10589 10589 10589
GCV of Coal kCal/kg 3,408.0 3,308.0 3,208.0
Price of coal Rs./MT 3410 3410 3410
Energy Charge Rate (Ex-bus) Rs./kWh 2.79 2.88 2.97
3% 3%Reduction in Energy Charges (Rs./kWh)
Every 100 kcal/kg GCV loss impacts the Energy Charges by 3%
(in %)
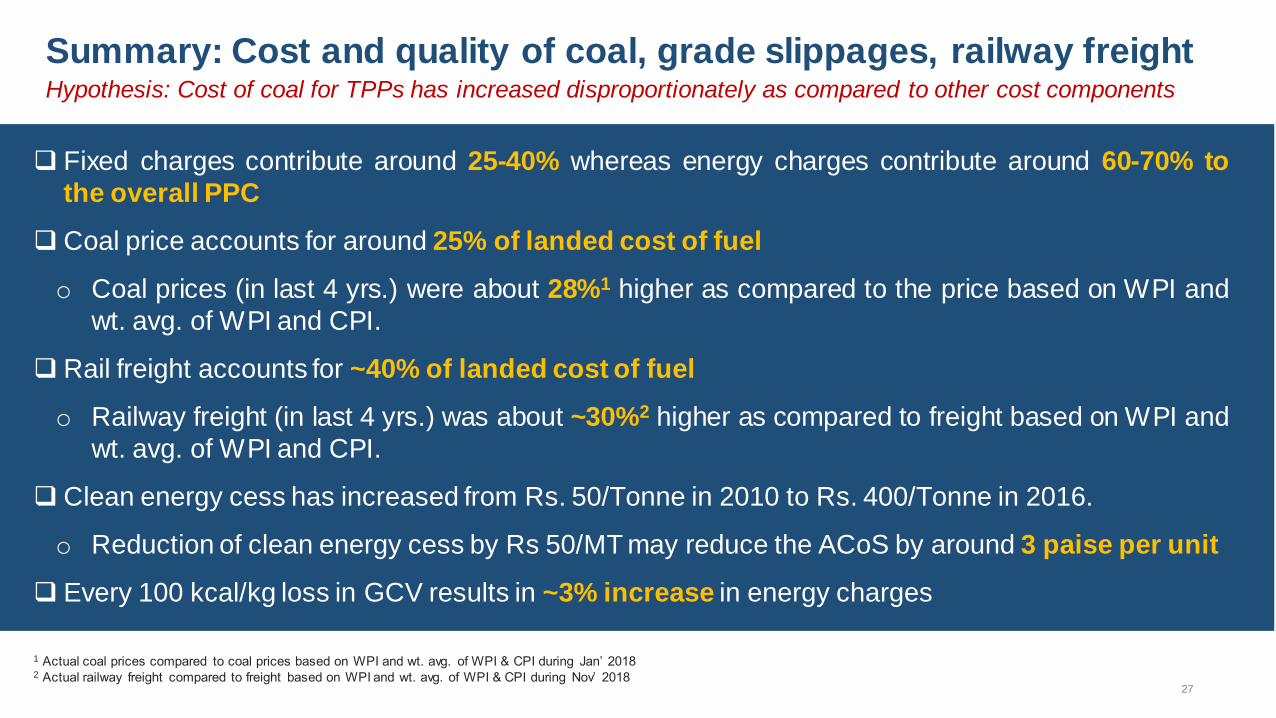
Summary: Cost and quality of coal, grade slippages, railway freight Hypothesis: Cost of coal for TPPs has increased disproportionately as compared to other cost components
Fixed charges contribute around 25-40% whereas energy charges contribute around 60-70% to
the overall PPC
Coal price accounts for around 25% of landed cost of fuel
o Coal prices (in last 4 yrs.) were about 28%1 higher as compared to the price based on WPI and
wt. avg. of WPI and CPI.
Rail freight accounts for ~40% of landed cost of fuel
o Railway freight (in last 4 yrs.) was about ~30%2 higher as compared to freight based on WPI and
wt. avg. of WPI and CPI.
Clean energy cess has increased from Rs. 50/Tonne in 2010 to Rs. 400/Tonne in 2016.
o Reduction of clean energy cess by Rs 50/MT may reduce the ACoS by around 3 paise per unit
Every 100 kcal/kg loss in GCV results in ~3% increase in energy charges
1 Actual coal prices compared to coal prices based on WPI and wt. avg. of WPI & CPI during Jan‟ 2018 2 Actual railway freight compared to freight based on WPI and wt. avg. of WPI & CPI during Nov‟ 2018
27

Transmission
charges
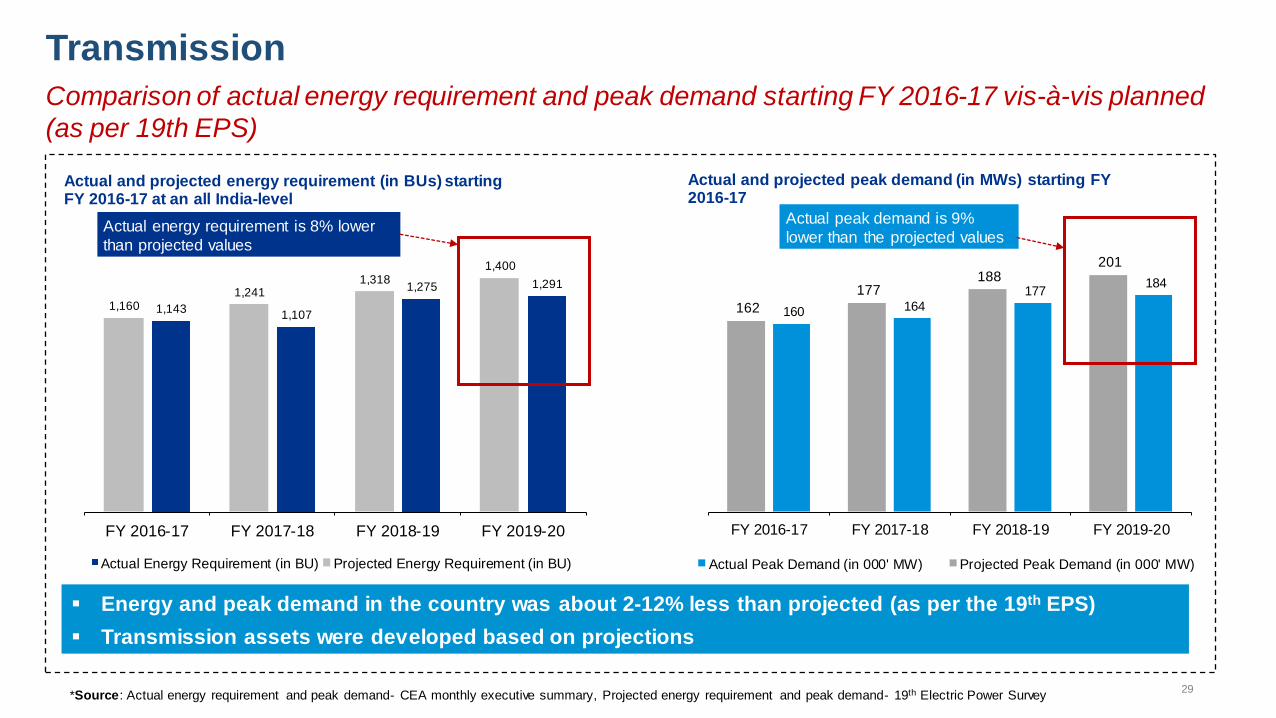
29
184 177
164 160
201 188
177
162
FY 2019-20FY 2018-19FY 2017-18FY 2016-17
Actual and projected peak demand (in MWs) starting FY 2016-17
Actual Peak Demand (in 000' MW) Projected Peak Demand (in 000' MW)
Transmission
1,291 1,275
1,107 1,143
1,400 1,318
1,241 1,160
FY 2019-20FY 2018-19FY 2017-18FY 2016-17
Actual and projected energy requirement (in BUs) starting FY 2016-17 at an all India-level
Actual Energy Requirement (in BU) Projected Energy Requirement (in BU)
*Source: Actual energy requirement and peak demand- CEA monthly executive summary, Projected energy requirement and peak demand- 19th Electric Power Survey
Energy and peak demand in the country was about 2-12% less than projected (as per the 19th EPS)
Transmission assets were developed based on projections
Actual energy requirement is 8% lower
than projected values
Actual peak demand is 9%
lower than the projected values
Comparison of actual energy requirement and peak demand starting FY 2016-17 vis-à-vis planned
(as per 19th EPS)

30
Transmission capacity
*Source: CEA monthly executive summary
Historical trend of transmission capacity
368 391 414 425
741
827 900
968
2016-17 2017-18 2018-19 2019-20
Cumulative transmission assets (inter-state and intra-state)
Transmission Lines ('000 CKM) Transformation Capacity ('000 MVA)
11,669
9,210
8,590
4,489
9,751
9,279
8,290
5,747
2016-17
2017-18
2018-19
2019-20
Inter-state transmission capacity addition vis-à-vis planned
Capacity addition planned at center level Capacity addition at center level
Transmission capacity has increased as planned with 5% CAGR Growth (CKM) in lines and 9% CAGR Growth in
transformation capacity

31
Transmission charges
*Source: CEA monthly executive summary
Voltage wise capacity addition vis-à-vis planned
Capacity addition of 400 kV transmission lines accounted for 43% of the cumulative addition over the last 4
years
23,384
26,300 28,013
26,938
22,647
22,437
23,621
11,664
2,597 2,618 4,927 3,819
5,006 6,995
4,927
3,819
6,285 6,750 6,019 3,044
10,768
10,657 11,424 13,813
9,672 9,146
6,798
3,775
5,013
6,030 6,735 5,487
6,690 6,541 10,804
4,845
Planned Actual Planned Actual Planned Actual Planned Actual
2016-17 2016-17 2017-18 2017-18 2018-19 2018-19 2019-20 2019-20
Voltage-wise addition to the transmission lines (in CKM) over the last 4 years
800 kV 500 kV 765 kV 400 kV 220 kV

32
Power procurement from central generating stations
*Source: Distribution tariff and true up order issued by respective commissions
Actual power purchased from CGS vis-à-vis approved
• Uttarakhand, Andhra Pradesh, Bihar and Jharkhand procured about ~84%-93% of the booked capacity from
central sector plants for FY 2018-19
14,750
9,694
4,404 4,600
12,939
8,710
4,115 3,860
Andhra Pradesh Bihar Jharkhand Uttarakhand
Actual and approved power purchase quantum (in MUs) for FY 2018-19
Approved power procurement from CGS (in MUs)
Actual power procured from CGS (in MUs)
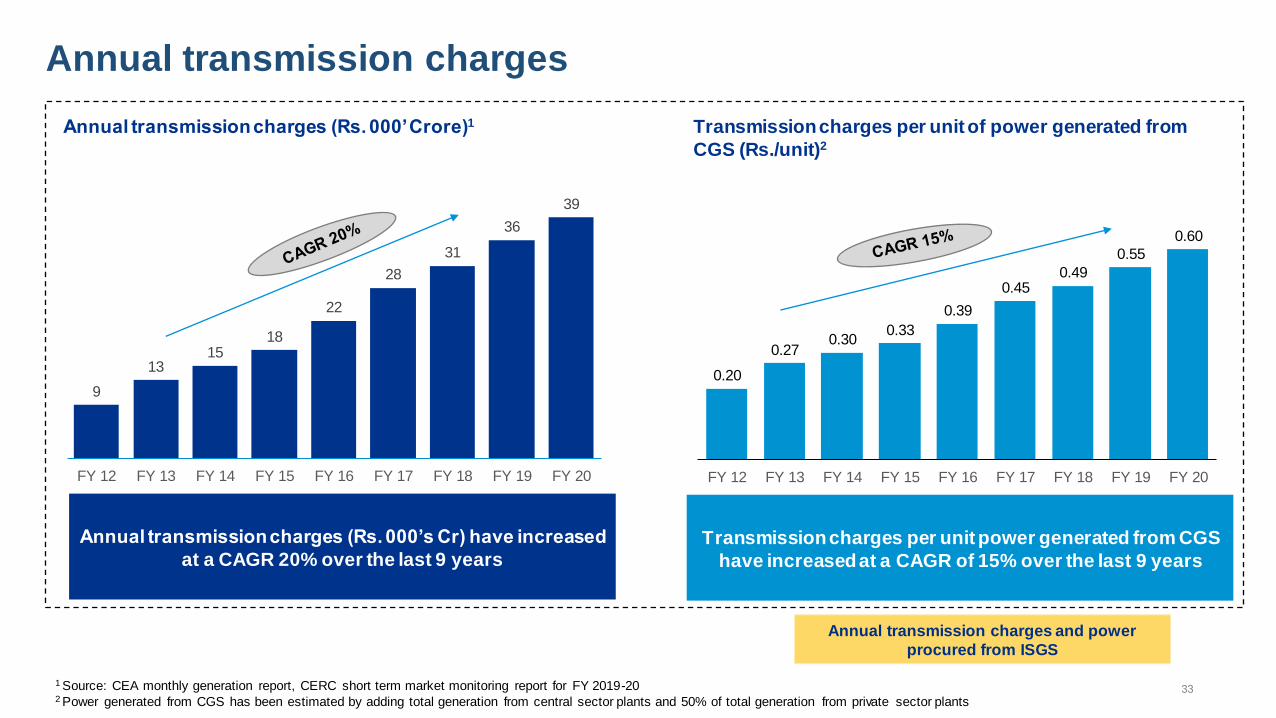
33
0.20
0.27 0.30
0.33
0.39
0.45 0.49
0.55
0.60
FY 12 FY 13 FY 14 FY 15 FY 16 FY 17 FY 18 FY 19 FY 20
Annual transmission charges
1 Source: CEA monthly generation report, CERC short term market monitoring report for FY 2019-20 2 Power generated from CGS has been estimated by adding total generation from central sector plants and 50% of total generation from private sector plants
Annual transmission charges and power
procured from ISGS
Annual transmission charges (Rs. 000’ Crore)1 Transmission charges per unit of power generated from
CGS (Rs./unit)2
Annual transmission charges (Rs. 000’s Cr) have increased
at a CAGR 20% over the last 9 years Transmission charges per unit power generated from CGS
have increased at a CAGR of 15% over the last 9 years
9
13 15
18
22
28
31
36
39
FY 12 FY 13 FY 14 FY 15 FY 16 FY 17 FY 18 FY 19 FY 20
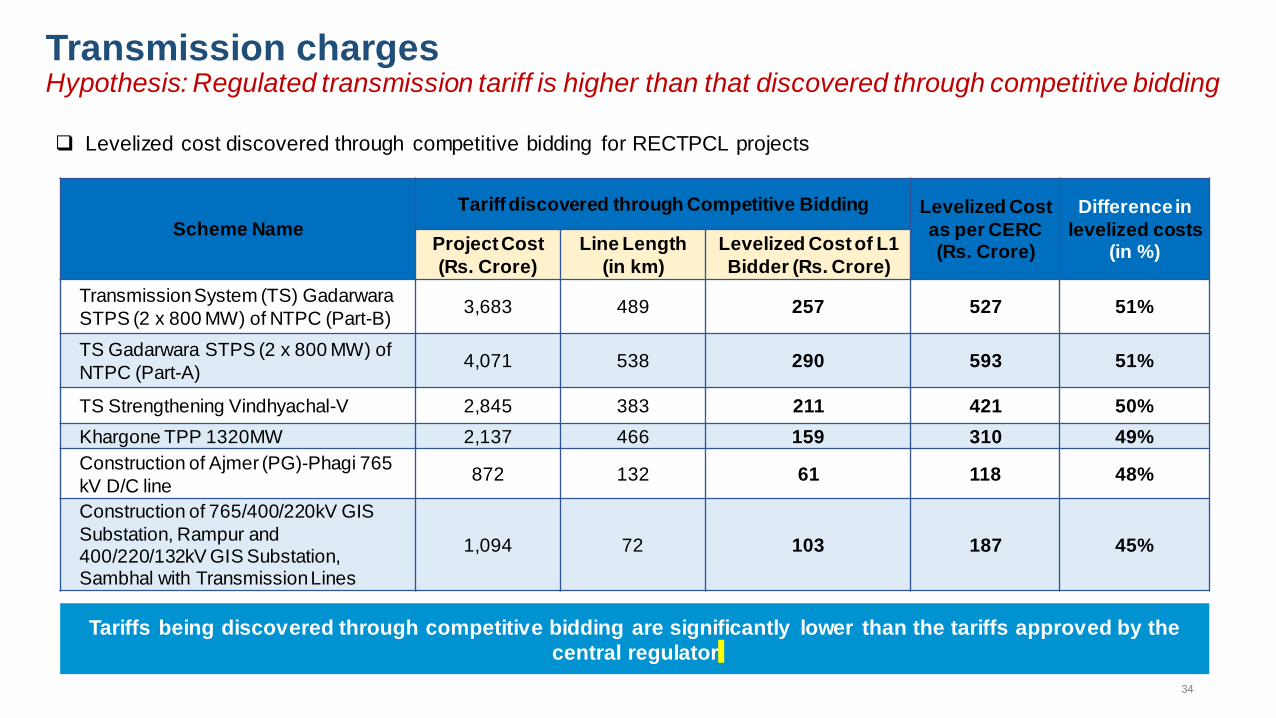
Transmission charges Hypothesis: Regulated transmission tariff is higher than that discovered through competitive bidding
Scheme Name
Tariff discovered through Competitive Bidding Levelized Cost
as per CERC (Rs. Crore)
Difference in
levelized costs (in %) Project Cost
(Rs. Crore)
Line Length
(in km)
Levelized Cost of L1
Bidder (Rs. Crore)
Transmission System (TS) Gadarwara
STPS (2 x 800 MW) of NTPC (Part-B) 3,683 489 257 527 51%
TS Gadarwara STPS (2 x 800 MW) of
NTPC (Part-A) 4,071 538 290 593 51%
TS Strengthening Vindhyachal-V 2,845 383 211 421 50%
Khargone TPP 1320MW 2,137 466 159 310 49%
Construction of Ajmer (PG)-Phagi 765
kV D/C line 872 132 61 118 48%
Construction of 765/400/220kV GIS
Substation, Rampur and 400/220/132kV GIS Substation, Sambhal with Transmission Lines
1,094 72 103 187 45%
Levelized cost discovered through competitive bidding for RECTPCL projects
Tariffs being discovered through competitive bidding are significantly lower than the tariffs approved by the
central regulator
34
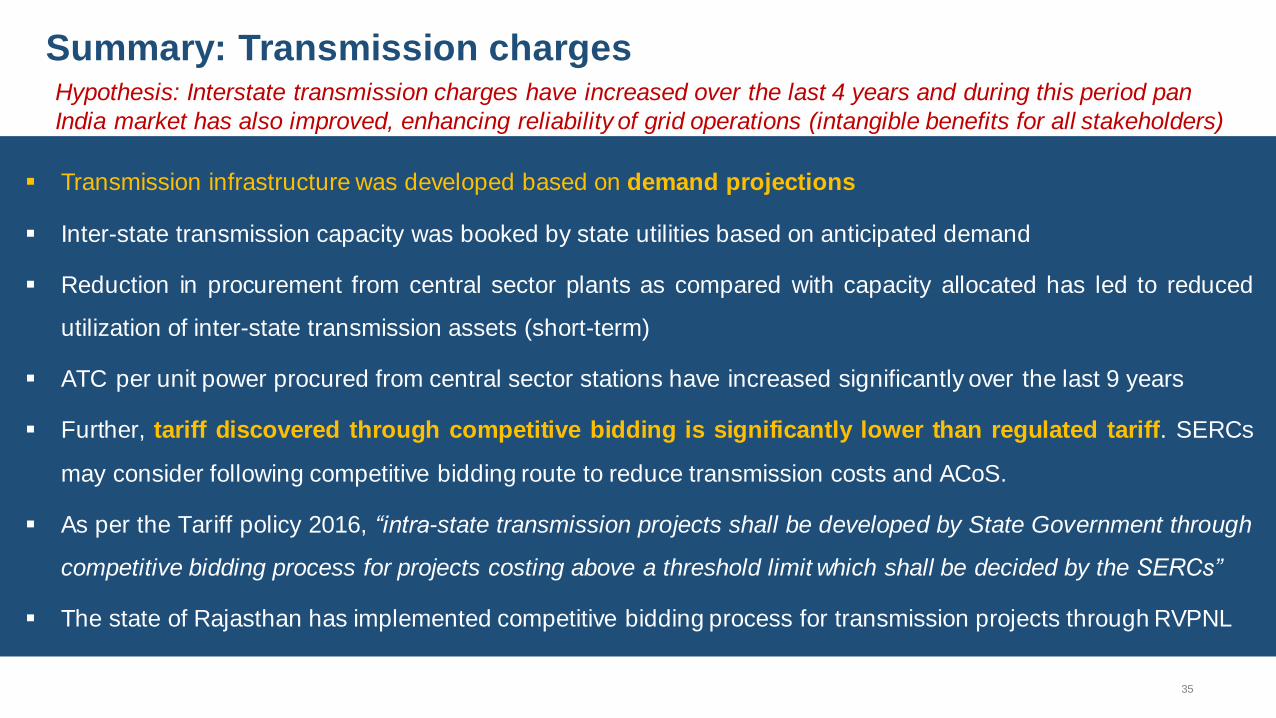
Summary: Transmission charges
Transmission infrastructure was developed based on demand projections
Inter-state transmission capacity was booked by state utilities based on anticipated demand
Reduction in procurement from central sector plants as compared with capacity allocated has led to reduced
utilization of inter-state transmission assets (short-term)
ATC per unit power procured from central sector stations have increased significantly over the last 9 years
Further, tariff discovered through competitive bidding is significantly lower than regulated tariff. SERCs
may consider following competitive bidding route to reduce transmission costs and ACoS.
As per the Tariff policy 2016, “intra-state transmission projects shall be developed by State Government through
competitive bidding process for projects costing above a threshold limit which shall be decided by the SERCs”
The state of Rajasthan has implemented competitive bidding process for transmission projects through RVPNL
Hypothesis: Interstate transmission charges have increased over the last 4 years and during this period pan
India market has also improved, enhancing reliability of grid operations (intangible benefits for all stakeholders)
35

Fixed Cost
Elements

Return on Equity

ROE for generation, transmission and distribution companies Hypothesis: Change in norms for estimation of ROE, may lead to significant reduction in electricity tariffs
*Reduction in RoE by 1% given the station is declared under COD without commissioning of any of the RGMO or FGMO, data telemetry, communication system up to
load dispatch center or protection system based on the report submitted by the respective RLDC.
Rate of RoE approved through various control periods by CERC
2001-2004
2004-2009
2009-2014
2014-2019
2019-2024
ROE fixed @ 16%
• Premium of 5% over risk free rate
ROE revised to 14%
• ROE revised to 15.5% mainly on account of
• Increase in PLR of SBI and other PSU banks, and
• Increase in 10-year G-Sec yield
ROE retained @ 15.5%
ROE retained @ 15.5%*
• ROE for storage type hydro stations fixed
@16.50% • Reduction in risk free rates and
premium
38

ROE for generation, transmission and distribution companies
S. No. States State GENCO TRANSCOs DISCOMs
1 Odisha 16.0% 15.5% 16.0%
2 Maharashtra 15.5% 15.5% 15.5%
3 Uttar Pradesh 15.5% 14.5% 16.0%
4 MP 15.5% 15.5% 16.0%
5 Chhattisgarh 15.5% 15.5% 16.0%
6 Assam 15.5% 15.5% 16.0%
7 Himachal
Pradesh 15.5% 15.5% 16.0%
8 West Bengal 15.5% 15.5% 15.5%
9 Uttarakhand 15.5% 15.5% 15.5%
10 Tripura 15.5% - 16.5%* 15.5% 15.5%
11 Punjab 15.5% - 16.5%* 15.5% 15.5%
12 Nagaland 15.5% 15.5% 15.5%
13 Manipur 15.5% 15.5% 15.5%
14 Mizoram 15.5% 15.5% 15.5%
Rate of Return on equity in different states as per tariff regulations across the value chain
S. No. States State GENCO TRANSCO DISCOM
15 Karnataka 15.5% 15.5% 15.5%
16 Jharkhand 14.0% 14.0% 14.5% 17 Jammu & Kashmir 15.5% 15.5% 15.5%
18 Bihar 15.5% 15.5% 15.5% 19 Andhra Pradesh 15.5% 14.0% 14.0% 20 Telangana 15.5% 14.0% 14.0% 21 Arunachal Pradesh 15.0% 14.0% 16.0% 22 Rajasthan 15.0% 14.0% 16.0% 23 Tamil Nadu 14.0% 14.0% 14.0% 24 Gujarat 14.0% 14.0% 14.0%
25 Haryana 14.0% 14.0% 14.0% 26 Kerala 14.0% 14.0% 14.0%
27 Delhi 14.0% 14.0% 16.0% 28 Sikkim 14.0% 14.0% 14.0% 29 Meghalaya 14.0% 14.0% 14.0%
*For the state of Punjab and Tripura, it is mentioned in the tariff regulations that return on equity shall be computed at the rate of 15.50% and 16.50% for thermal power stations and storage type
hydro generating stations, respectively.
Rate of ROE >15.50% Rate of ROE equal to
15.50% Rate of ROE <15.50
Several states have post-tax rate of return on equity lower than 15.50% as per tariff regulations
*Source: Respective generation, transmission and distribution tariff regulations 39
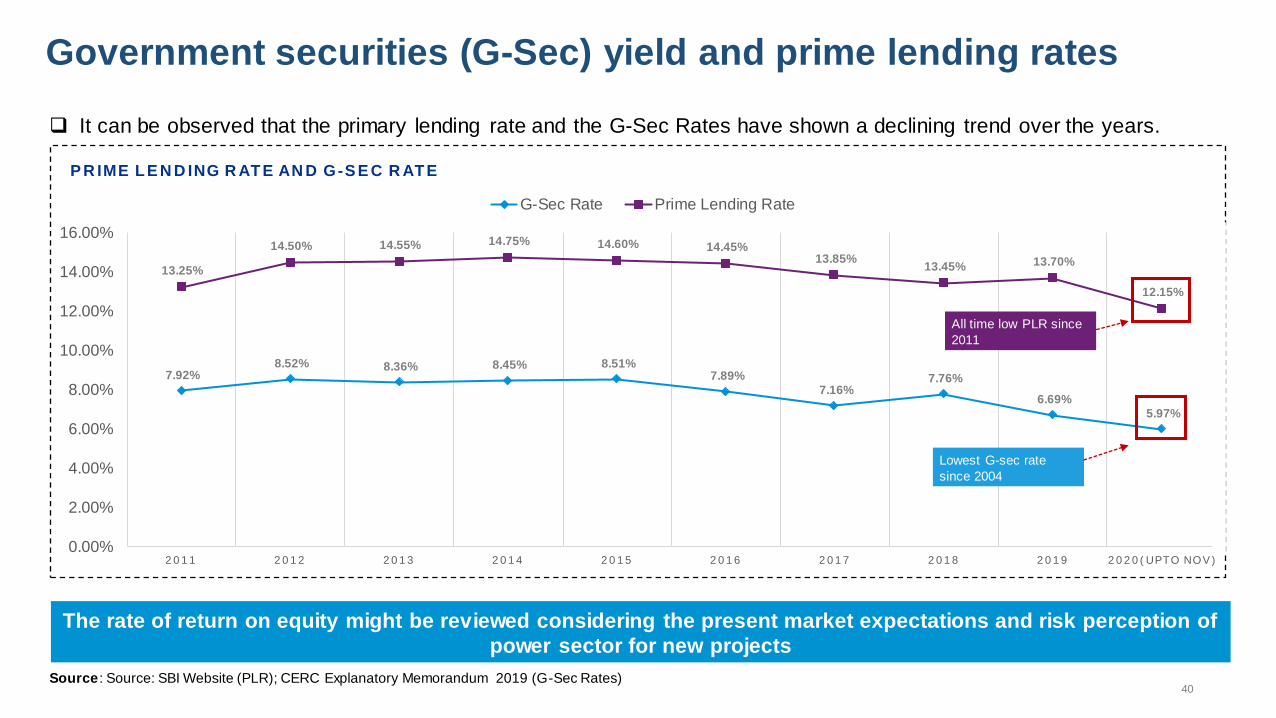
Government securities (G-Sec) yield and prime lending rates
It can be observed that the primary lending rate and the G-Sec Rates have shown a declining trend over the years.
Source : Source: SBI Website (PLR); CERC Explanatory Memorandum 2019 (G-Sec Rates)
7.92% 8.52% 8.36% 8.45% 8.51%
7.89%
7.16% 7.76%
6.69%
5.97%
13.25%
14.50% 14.55% 14.75% 14.60% 14.45% 13.85%
13.45% 13.70%
12.15%
0.00%
2.00%
4.00%
6.00%
8.00%
10.00%
12.00%
14.00%
16.00%
2 0 1 1 2 0 1 2 2 0 1 3 2 0 1 4 2 0 1 5 2 0 1 6 2 0 1 7 2 0 1 8 2 0 1 9 2 0 2 0 ( UPTO NOV )
P R IME LE N D ING R ATE AN D G-S E C R ATE
G-Sec Rate Prime Lending Rate
All time low PLR since
2011
Lowest G-sec rate
since 2004
The rate of return on equity might be reviewed considering the present market expectations and risk perception of
power sector for new projects
40

2,943
4,368
3,998
7,010
18,319
Total Segment A Segment B Segment C Segment E
Approved ROE for 12 states in FY 2020-21
ROE in FY 2020-
21 for 12 states Distribution companies
Intra-state transmission
licensees
State GENCOs
Generation Distribution Transmission
Central GENCOs
(All Figures in Rs. Cr. except wherever mentioned)
ROE:
5% of total ARR/
Rs. 0.35/kWh
~Rs. 0.06/kWh
~Rs. 0.13/kWh
~Rs. 0.08/kWh
~Rs. 0.08/kWh
• RoE is computed for sample thermal power plants, data for some thermal power plants and Power Purchase breakup for states like AP
& Odisha are not available in public domain; The above analysis does not include approved ROE for inter-state transmission licensee
Contribution of ROE to the overall ARR
~Rs. 3,41,197
Crore
Total ARR for
FY 2020-21
Rs. 6.56/kWh
ACoS for
FY2020-21
Rs. 7,331 Crore Rs. 3,998 Crore Rs. 7,010 Crore
State-wise approved ROE for GENCO,
TRANSCOs and DISCOMs for FY 2019-20 *Source: Generation, transmission and distribution tariff orders issued for 12 states by respective commissions
41
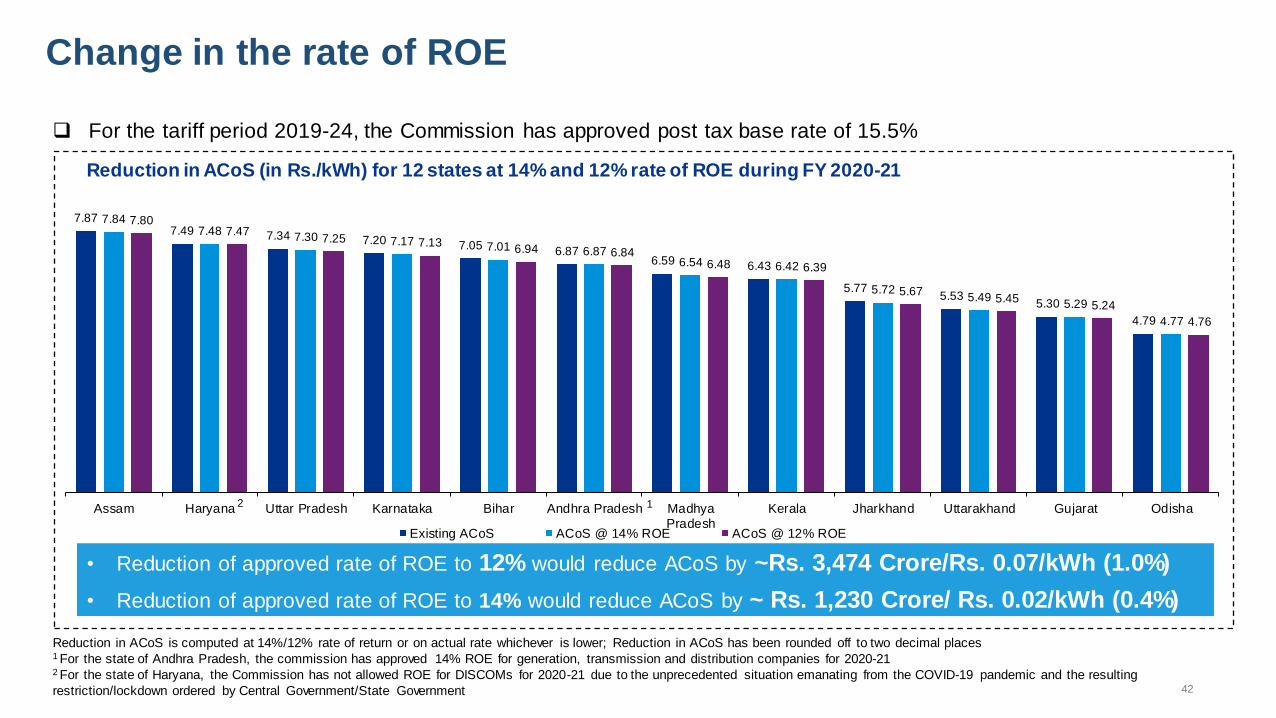
Change in the rate of ROE
7.87 7.49 7.34 7.20 7.05
6.87 6.59 6.43
5.77 5.53
5.30
4.79
7.84 7.48
7.30 7.17 7.01 6.87 6.54 6.42
5.72 5.49
5.29
4.77
7.80 7.47
7.25 7.13 6.94 6.84
6.48 6.39
5.67 5.45
5.24
4.76
Assam Haryana Uttar Pradesh Karnataka Bihar Andhra Pradesh MadhyaPradesh
Kerala Jharkhand Uttarakhand Gujarat Odisha
Existing ACoS ACoS @ 14% ROE ACoS @ 12% ROE
Reduction in ACoS is computed at 14%/12% rate of return or on actual rate whichever is lower; Reduction in ACoS has been rounded off to two decimal places 1 For the state of Andhra Pradesh, the commission has approved 14% ROE for generation, transmission and distribution companies for 2020-21 2 For the state of Haryana, the Commission has not allowed ROE for DISCOMs for 2020-21 due to the unprecedented situation emanating from the COVID-19 pandemic and the resulting
restriction/lockdown ordered by Central Government/State Government
• Reduction of approved rate of ROE to 12% would reduce ACoS by ~Rs. 3,474 Crore/Rs. 0.07/kWh (1.0%)
• Reduction of approved rate of ROE to 14% would reduce ACoS by ~ Rs. 1,230 Crore/ Rs. 0.02/kWh (0.4%)
For the tariff period 2019-24, the Commission has approved post tax base rate of 15.5%
Reduction in ACoS (in Rs./kWh) for 12 states at 14% and 12% rate of ROE during FY 2020-21
1 2
42

Tariff discovered through competitive bidding
Source: 1 https://mercomindia.com/new-solar-tariff-record/ 2 https://rerc.rajasthan.gov.in/rerc-user-files/tariff-orders 3 https://mercomindia.com/gujarat-tariff-2-65-solar-park/ 4 https://www.gercin.org/wp-content/uploads/2020/05/GERC-Solar-Tariff-Order-No.03-2020_08052020.pdf 5 https://mercomindia.com/solar-projects-andhra-pradesh-delays/ 6 http://aperc.gov.in/admin/upload/PettiionOP67of2019.pdf 7 https://mercomindia.com/ntpc-750mw-solar-auction-results/
S. No. Company Year Lowest quoted
tariff(Rs/kWh) State
Tariff approved by
state electricity regulatory
commission(Rs/kW
h)
1 SECI, 1070 MW Solar Auction 2020-21 2.001 Rajasthan 2.52 (for FY 2020)
2 GUVNL, Raghanesda Park 100 MW,
Gujarat 2019-20 2.653 Gujarat 5.344 (for FY 2018)
3 SECI, Kadapa Solar Park (AP) 2018-19 2.705 Andhra Pradesh 3.56 (for FY 2019)
4 NTPC, Ananthapuram Solar Park 750
MW(AP) 2018-19 2.727 Andhra Pradesh 3.56 (for FY 2019)
Tariffs being discovered through competitive bidding are significantly lower than the tariffs approved by the central
regulator
43
Depreciation cost
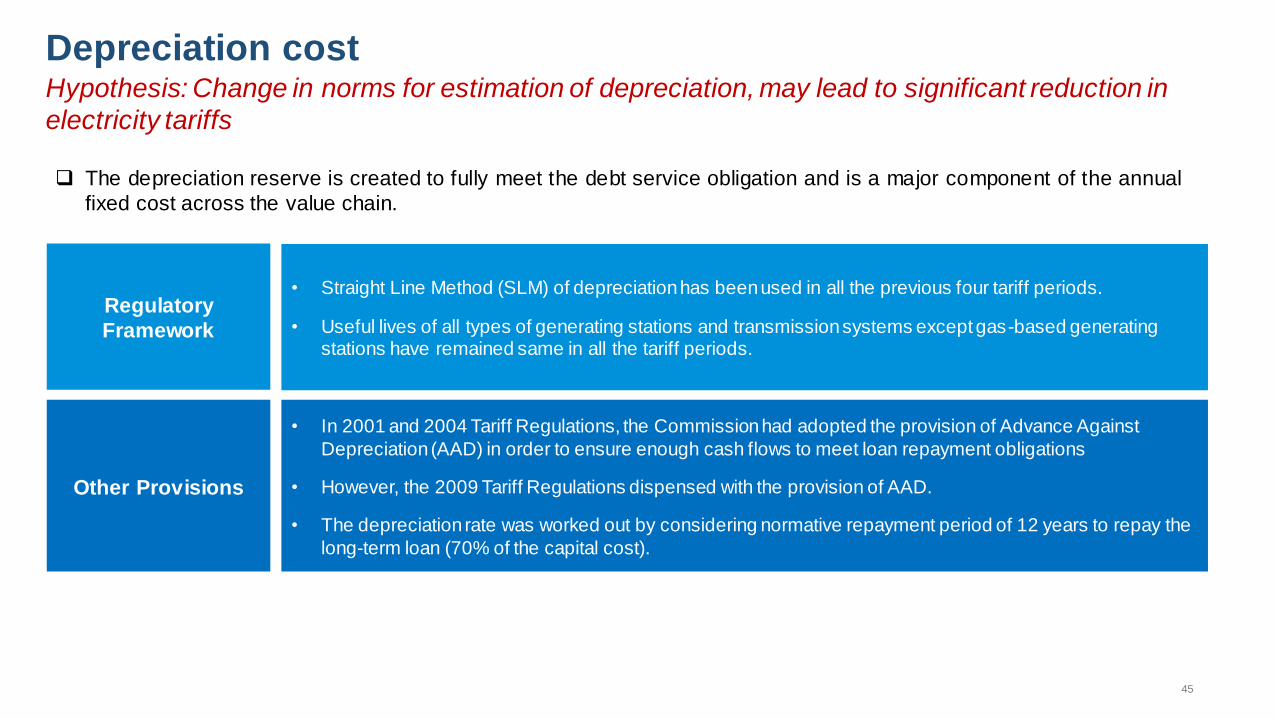
Depreciation cost Hypothesis: Change in norms for estimation of depreciation, may lead to significant reduction in
electricity tariffs
The depreciation reserve is created to fully meet the debt service obligation and is a major component of the annual
fixed cost across the value chain.
Regulatory
Framework
• Straight Line Method (SLM) of depreciation has been used in all the previous four tariff periods.
• Useful lives of all types of generating stations and transmission systems except gas-based generating stations have remained same in all the tariff periods.
Other Provisions
• In 2001 and 2004 Tariff Regulations, the Commission had adopted the provision of Advance Against
Depreciation (AAD) in order to ensure enough cash flows to meet loan repayment obligations
• However, the 2009 Tariff Regulations dispensed with the provision of AAD.
• The depreciation rate was worked out by considering normative repayment period of 12 years to repay the
long-term loan (70% of the capital cost).
45
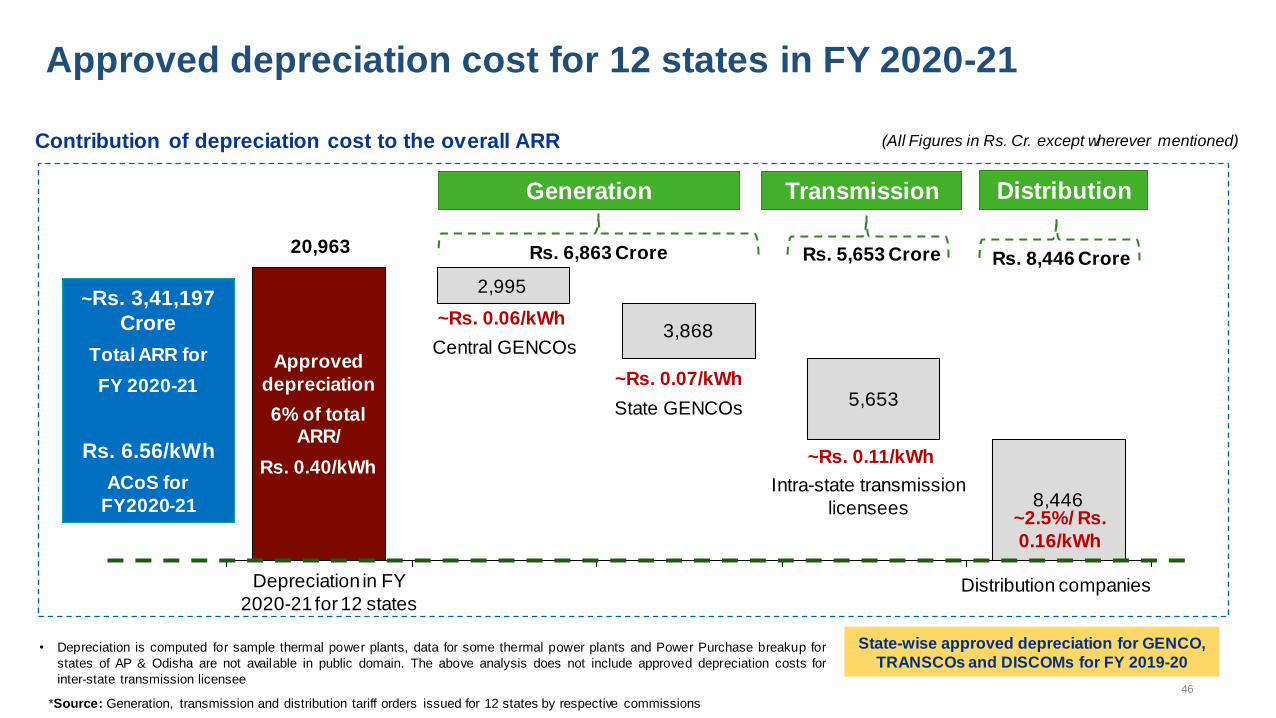
Approved depreciation cost for 12 states in FY 2020-21
2,505
3,868
5,653
8,446
20,473
Total Segment A Segment B Segment C Segment E
~Rs. 3,41,197
Crore
Total ARR for
FY 2020-21
Rs. 6.56/kWh
ACoS for
FY2020-21
Contribution of depreciation cost to the overall ARR
Depreciation in FY
2020-21 for 12 states Distribution companies
Intra-state transmission
licensees
State GENCOs
Generation Distribution Transmission
Central GENCOs
~Rs. 0.06/kWh
~2.5%/ Rs.
0.16/kWh
~Rs. 0.07/kWh
~Rs. 0.11/kWh
Approved
depreciation
6% of total ARR/
Rs. 0.40/kWh
(All Figures in Rs. Cr. except wherever mentioned)
• Depreciation is computed for sample thermal power plants, data for some thermal power plants and Power Purchase breakup for
states of AP & Odisha are not available in public domain. The above analysis does not include approved depreciation costs for
inter-state transmission licensee
2,995
Rs. 6,863 Crore Rs. 5,653 Crore Rs. 8,446 Crore 20,963
State-wise approved depreciation for GENCO,
TRANSCOs and DISCOMs for FY 2019-20
*Source: Generation, transmission and distribution tariff orders issued for 12 states by respective commissions
46

Change in the rate of depreciation
As per the prevailing norms, depreciation rate is estimated by considering loan repayment
period of 12 years to repay the loan (70% of the capital cost)
Reduction of depreciation rate to 4.67% (considering loan repayment period of 15 years to
repay 70% of the capital cost) would reduce ACoS by ~Rs. 3,500-4,000 Crore/ Rs.
0.08kWh (1.2%)
Reduction of depreciation rate to 4.34% (considering loan repayment period of 15 years to
repay 65% of the capital cost) would reduce ACoS by ~Rs. 4,500-4,800 Crore/ Rs.
0.10kWh (1.4%)
47

Depreciation norms: Petroleum sector
Petroleum and
Natural Gas
Regulatory Board
(PGNRB)
Determines the transportation tariff for (a) Petroleum and Petroleum Products pipelines and (b) Natural Gas
pipelines (awarded on nomination basis)
Tariff determination for transportation of Petroleum and Petroleum Products Natural Gas
Regulation Determination of Petroleum and Petroleum Products
Pipeline Transportation Tariff) Regulations, 2010
Determination of Natural Gas
Pipeline Tariff Regulations, 2008
Procedure for Tariff determination
Benchmarking against rail tariff at a level of 75%
(100% for LPG) on a train load basis for equivalent rail distance along the petroleum and petroleum product pipeline route.
Cost plus basis
Treatment of Depreciation Not Applicable
Rate of Depreciation:
Depreciation on fixed assets on straight line basis based on rates as per Schedule VI to the
Companies Act, 1956)
Regulation Determination of Petroleum and Petroleum Products
Pipeline Transportation Tariff) Regulations, 2010
Determination of Natural Gas
Pipeline Tariff Regulations, 2008
48
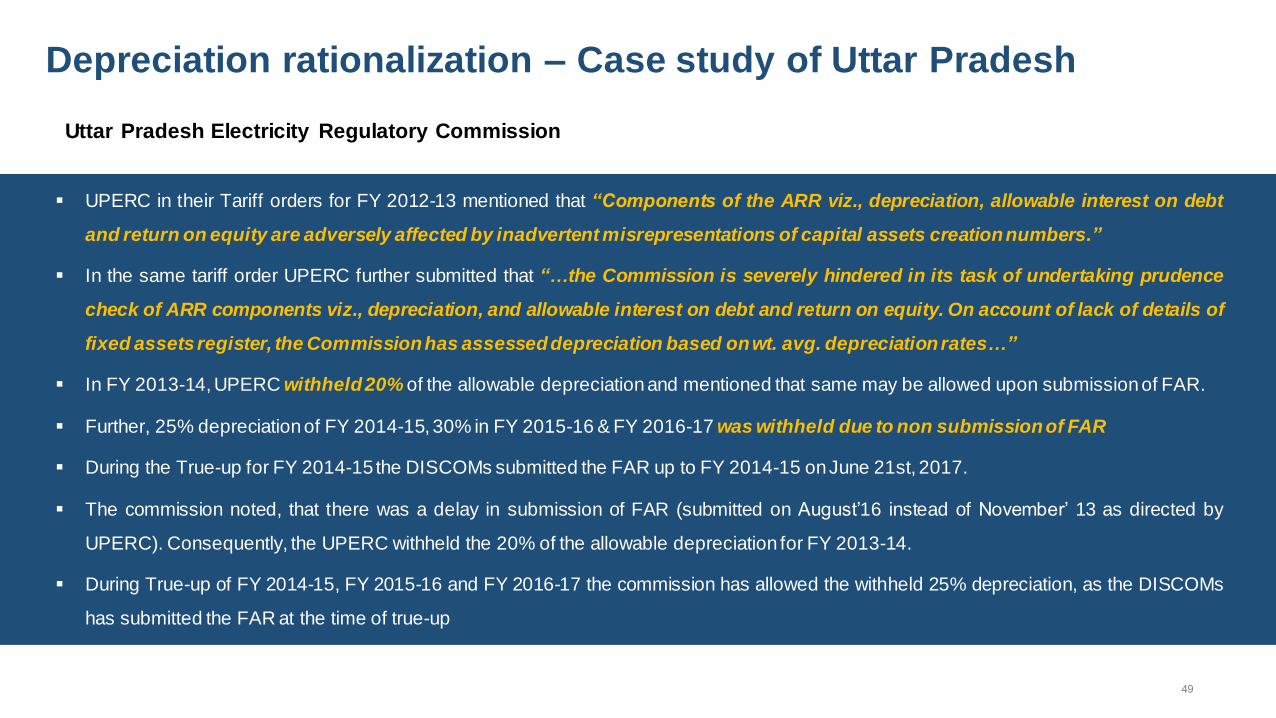
Depreciation rationalization – Case study of Uttar Pradesh
Uttar Pradesh Electricity Regulatory Commission
1
2
• Subsequently next year, UPERC while reprimanding Distribution Companies and Transmission company over the
issue of non-maintenance of fixed asset registers had withheld 20% of the allowable depreciation for FY 2013-14 (Order dated May 31, 2013) citing the APTEL orders in Appeal No. 121 of 2010 & I.A. No.83 of 2011 and ordered that the same would be released for recovery through tariff, upon submission of fixed asset registers. Further, 25%
depreciation of FY 2014-15, 30% in FY 2015-16 & FY 2016-17 was withheld of the percentage of net allowable depreciation.
UPERC in their Tariff orders for FY 2012-13 mentioned that “Components of the ARR viz., depreciation, allowable interest on debt
and return on equity are adversely affected by inadvertent misrepresentations of capital assets creation numbers.”
In the same tariff order UPERC further submitted that “…the Commission is severely hindered in its task of undertaking prudence
check of ARR components viz., depreciation, and allowable interest on debt and return on equity. On account of lack of details of
fixed assets register, the Commission has assessed depreciation based on wt. avg. depreciation rates…”
In FY 2013-14, UPERC withheld 20% of the allowable depreciation and mentioned that same may be allowed upon submission of FAR.
Further, 25% depreciation of FY 2014-15, 30% in FY 2015-16 & FY 2016-17 was withheld due to non submission of FAR
During the True-up for FY 2014-15 the DISCOMs submitted the FAR up to FY 2014-15 on June 21st, 2017.
The commission noted, that there was a delay in submission of FAR (submitted on August‟16 instead of November‟ 13 as directed by
UPERC). Consequently, the UPERC withheld the 20% of the allowable depreciation for FY 2013-14.
During True-up of FY 2014-15, FY 2015-16 and FY 2016-17 the commission has allowed the withheld 25% depreciation, as the DISCOMs
has submitted the FAR at the time of true-up
49
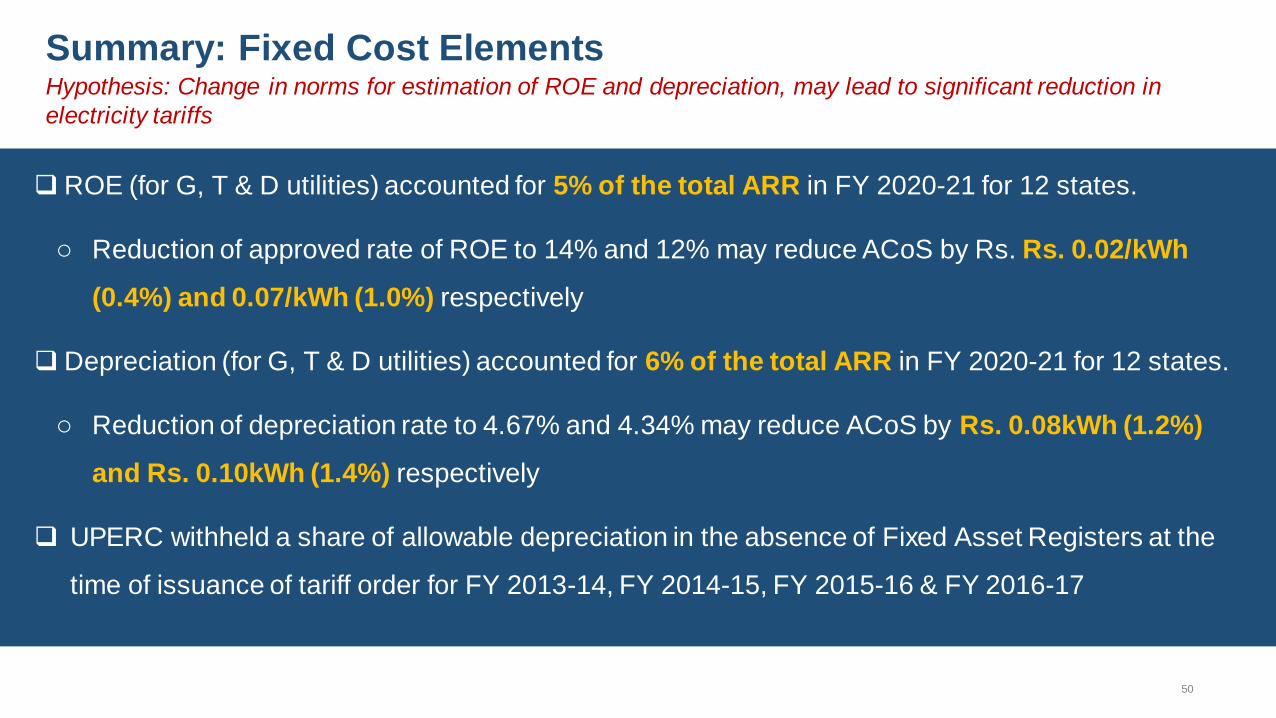
Summary: Fixed Cost Elements
ROE (for G, T & D utilities) accounted for 5% of the total ARR in FY 2020-21 for 12 states.
o Reduction of approved rate of ROE to 14% and 12% may reduce ACoS by Rs. Rs. 0.02/kWh
(0.4%) and 0.07/kWh (1.0%) respectively
Depreciation (for G, T & D utilities) accounted for 6% of the total ARR in FY 2020-21 for 12 states.
o Reduction of depreciation rate to 4.67% and 4.34% may reduce ACoS by Rs. 0.08kWh (1.2%)
and Rs. 0.10kWh (1.4%) respectively
UPERC withheld a share of allowable depreciation in the absence of Fixed Asset Registers at the
time of issuance of tariff order for FY 2013-14, FY 2014-15, FY 2015-16 & FY 2016-17
Hypothesis: Change in norms for estimation of ROE and depreciation, may lead to significant reduction in
electricity tariffs
50
Analysis of
internal factors

Approved distribution losses Hypothesis: Change in approved distribution losses may lead to significant reduction in electricity tariffs
Distribution loss*
• The approved distribution losses for 12 states for FY 2020-
21 varied in the range 12-18% (excluding Andhra Pradesh-~9% and Odisha- ~21%)
Approved distribution loss (%) for licensees of 12 states for FY
2020-21 and impact on ACoS
21.2
18.4
15.9 15.5 15.0 14.0 14.0
12.9 12.2 12.0 12.0
8.8
Reduction in ACoS (Rs/kWh) on account of change in rate of
distribution loss
7.9
7.2 7.2 7.0
6.6 6.6 6.5
5.5
4.8
7.6
6.8
7.1 6.9
6.4 6.3 6.4
5.4
4.1 4.0
4.5
5.0
5.5
6.0
6.5
7.0
7.5
8.0
8.5
ACoS at approved Distribution Loss
ACoS at recommended Distribution Loss
• Reduction of approved rate of Distribution losses to 12%
would reduce ACoS by Rs. 0-0.66 /kWh/ (3%)
*Distribution loss does not include inter-state and intra-state transmission losses
52
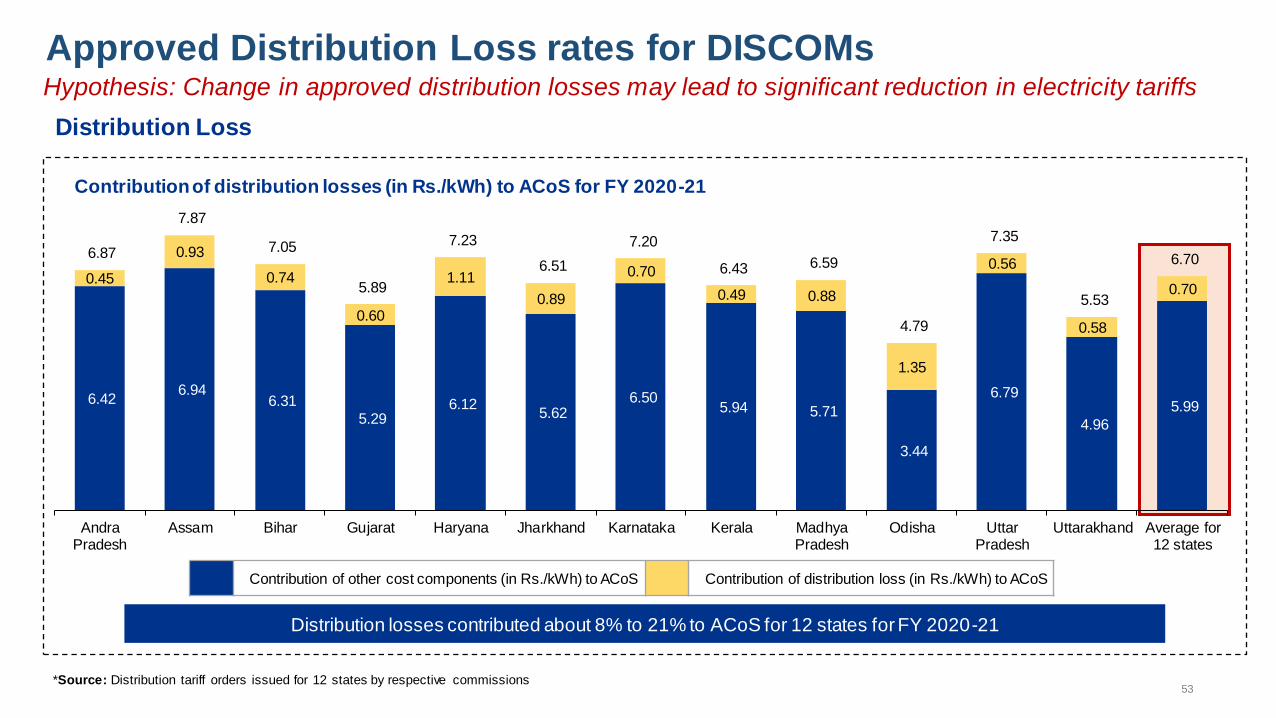
6.42 6.94
6.31
5.29 6.12
5.62 6.50
5.94 5.71
3.44
6.79
4.96
5.99
0.45
0.93
0.74
0.60
1.11
0.89
0.70
0.49 0.88
1.35
0.56
0.58
0.70
6.87
7.87
7.05
5.89
7.23
6.51
7.20
6.43 6.59
4.79
7.35
5.53
6.70
AndraPradesh
Assam Bihar Gujarat Haryana Jharkhand Karnataka Kerala MadhyaPradesh
Odisha UttarPradesh
Uttarakhand Average for12 states
Contribution of distribution losses (in Rs./kWh) to ACoS for FY 2020-21
Approved Distribution Loss rates for DISCOMs
Distribution Loss
Hypothesis: Change in approved distribution losses may lead to significant reduction in electricity tariffs
Distribution losses contributed about 8% to 21% to ACoS for 12 states for FY 2020-21
Contribution of other cost components (in Rs./kWh) to ACoS Contribution of distribution loss (in Rs./kWh) to ACoS
*Source: Distribution tariff orders issued for 12 states by respective commissions
53

1,036 940
804 767 762 718
595
483 411 374
301
O&M Expenses for DISCOMs
O&M Charges
Approved O&M Expense for licensees of 12 states for FY
2020-21*
Expenditure on O&M (Rs) per 1000 units of energy
handled by DISCOMs#
*Latest available TO is used for states wherein FY21 TO is not available
1.04 0.94
0.80 0.77 0.76 0.72 0.59
0.48 0.41 0.37
0.30
16.4% 17.3%
21.3%
14.5% 12.5% 11.4% 10.4%
8.4% 7.3% 8.0% 6.1%
-6.0%
-1.0%
4.0%
9.0%
14.0%
19.0%
-
0.20
0.40
0.60
0.80
1.00
1.20
1.40
Approved Net O&M charges (Rs/kWh) O&M Charges as % of Total ARR
• Norms for approval of O&M expenses are based on
historical cost performance of individual metrics such as total expense on lines per unit of line length created.
• Initiatives and field level best practices undertaken by better
performing states (Gujarat, Uttarakhand, etc.) might be disseminated across states for reduction in O&M costs
#Expenditure on O&M shows a wide range of variation from Rs. 301 (Gujarat) to Rs 1,036 (Assam) per 1000 units of energy handled. This is mainly on account of variation in factors such as
Number of Consumers, Network length and expanse, HT/LT ratio and age of infrastructure .
*Source: Distribution tariff orders issued for 12 states by respective commissions 54

323
263 239
216 198 193
142
117 112
-
50
100
150
200
250
300
350
Assam Gujarat Jharkhand MadhyaPradesh
UttarPradesh
Haryana Kerala Karnataka Bihar
O&M Expenses for state and central GENCOs
O&M Charges
Approved O&M Expense for generation licensees of 12
states for FY 2018-19*
Expenditure on O&M (Rs) per 1000 units of energy
handled by DISCOMs
Source: Generation tariff orders issued for 12 states by respective commissions
*Latest available TO is used for state and central GENCOs
• Approved O&M expenses varied in the range of 10-16%
of the total ARR of central and state GENCOs for the 12 states
• Initiatives and field level best practices undertaken by better
performing states (Karnataka, Bihar, etc.) might be disseminated across states for reduction in O&M costs
55

Interest & finance charges for DISCOMs
Interest charges
Approved I&F charges for licensees of 12 states for FY
2020-21*
Expenditure on I&F per 1000 units of energy handled by
DISCOMs
*Interest expense of KSEB includes expenses for Generation, Transmission and Distribution entities
0.50
0.33
0.25 0.24 0.24
0.16
0.12 0.09 0.08 0.07 0.07
0.04
9.2%
5.3%
4.2% 4.2% 4.3%
2.7% 2.3% 2.0%
1.6% 1.2%
1.8%
0.7%
-3.0%
-1.0%
1.0%
3.0%
5.0%
7.0%
9.0%
0.00
0.10
0.20
0.30
0.40
0.50
0.60I&F charges (Rs /KWh) I&F Charges as % of Total ARR
501.1
329.2
254.7 242.3 239.0
155.3
119.2 92.4 80.3 73.1 69.4
44.6
*
*Source: Distribution tariff orders issued for 12 states by respective commissions
56
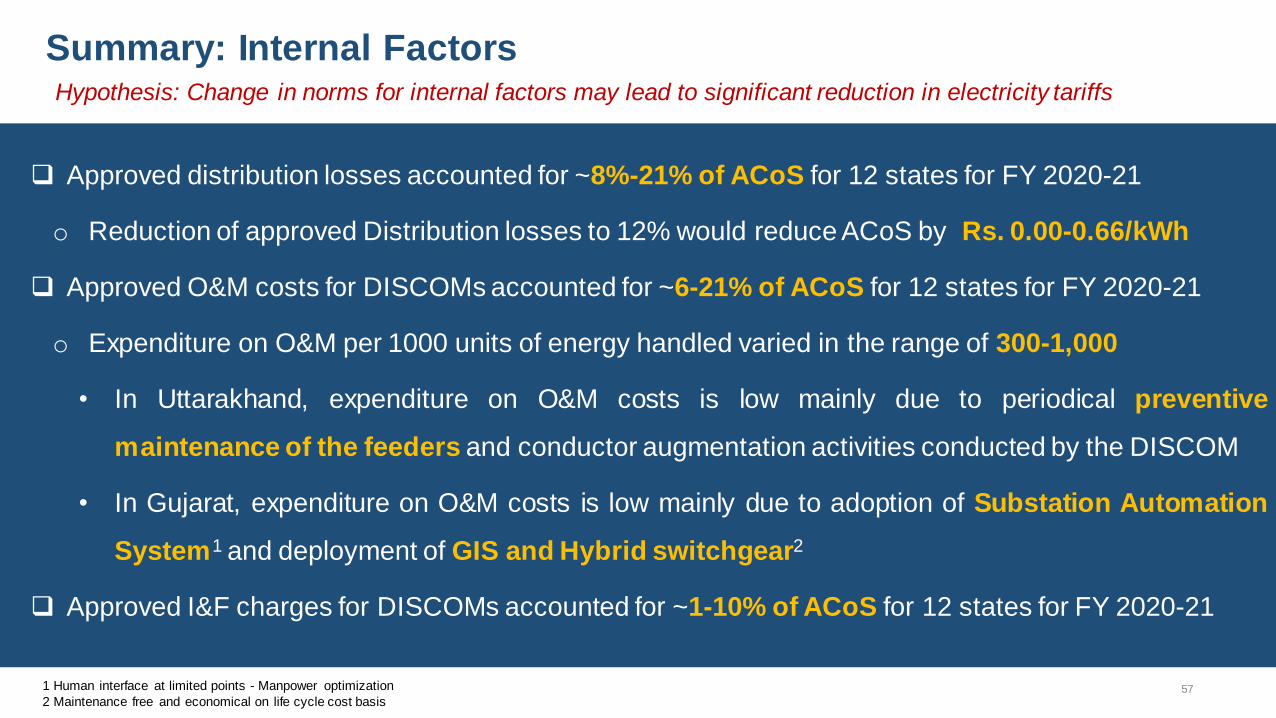
Summary: Internal Factors
Approved distribution losses accounted for ~8%-21% of ACoS for 12 states for FY 2020-21
o Reduction of approved Distribution losses to 12% would reduce ACoS by Rs. 0.00-0.66/kWh
Approved O&M costs for DISCOMs accounted for ~6-21% of ACoS for 12 states for FY 2020-21
o Expenditure on O&M per 1000 units of energy handled varied in the range of 300-1,000
• In Uttarakhand, expenditure on O&M costs is low mainly due to periodical preventive
maintenance of the feeders and conductor augmentation activities conducted by the DISCOM
• In Gujarat, expenditure on O&M costs is low mainly due to adoption of Substation Automation
System1 and deployment of GIS and Hybrid switchgear2
Approved I&F charges for DISCOMs accounted for ~1-10% of ACoS for 12 states for FY 2020-21
Hypothesis: Change in norms for internal factors may lead to significant reduction in electricity tariffs
1 Human interface at limited points - Manpower optimization
2 Maintenance free and economical on life cycle cost basis 57

Other factors

Retiring old coal based
TPPs
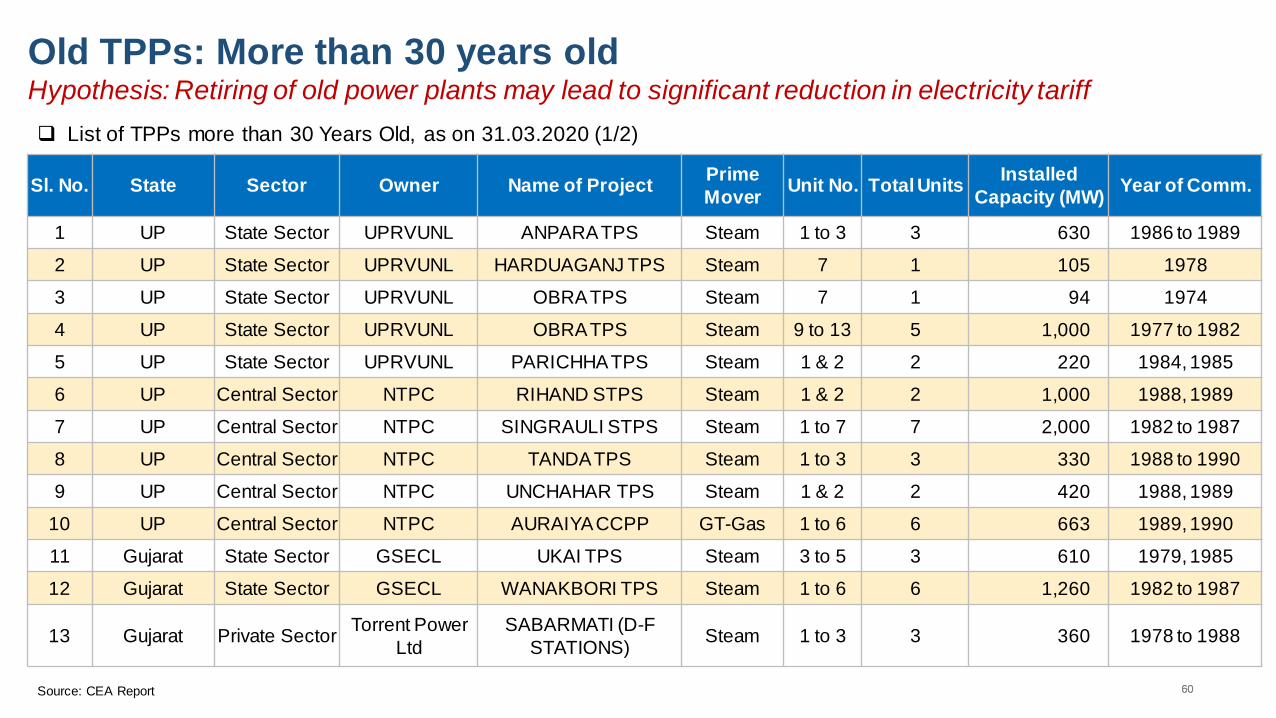
60
Old TPPs: More than 30 years old Hypothesis: Retiring of old power plants may lead to significant reduction in electricity tariff
List of TPPs more than 30 Years Old, as on 31.03.2020 (1/2)
Sl. No. State Sector Owner Name of Project Prime
Mover Unit No. Total Units
Installed
Capacity (MW) Year of Comm.
1 UP State Sector UPRVUNL ANPARA TPS Steam 1 to 3 3 630 1986 to 1989
2 UP State Sector UPRVUNL HARDUAGANJ TPS Steam 7 1 105 1978
3 UP State Sector UPRVUNL OBRA TPS Steam 7 1 94 1974
4 UP State Sector UPRVUNL OBRA TPS Steam 9 to 13 5 1,000 1977 to 1982
5 UP State Sector UPRVUNL PARICHHA TPS Steam 1 & 2 2 220 1984, 1985
6 UP Central Sector NTPC RIHAND STPS Steam 1 & 2 2 1,000 1988, 1989
7 UP Central Sector NTPC SINGRAULI STPS Steam 1 to 7 7 2,000 1982 to 1987
8 UP Central Sector NTPC TANDA TPS Steam 1 to 3 3 330 1988 to 1990
9 UP Central Sector NTPC UNCHAHAR TPS Steam 1 & 2 2 420 1988, 1989
10 UP Central Sector NTPC AURAIYA CCPP GT-Gas 1 to 6 6 663 1989, 1990
11 Gujarat State Sector GSECL UKAI TPS Steam 3 to 5 3 610 1979, 1985
12 Gujarat State Sector GSECL WANAKBORI TPS Steam 1 to 6 6 1,260 1982 to 1987
13 Gujarat Private Sector Torrent Power
Ltd
SABARMATI (D-F
STATIONS) Steam 1 to 3 3 360 1978 to 1988
Source: CEA Report 60
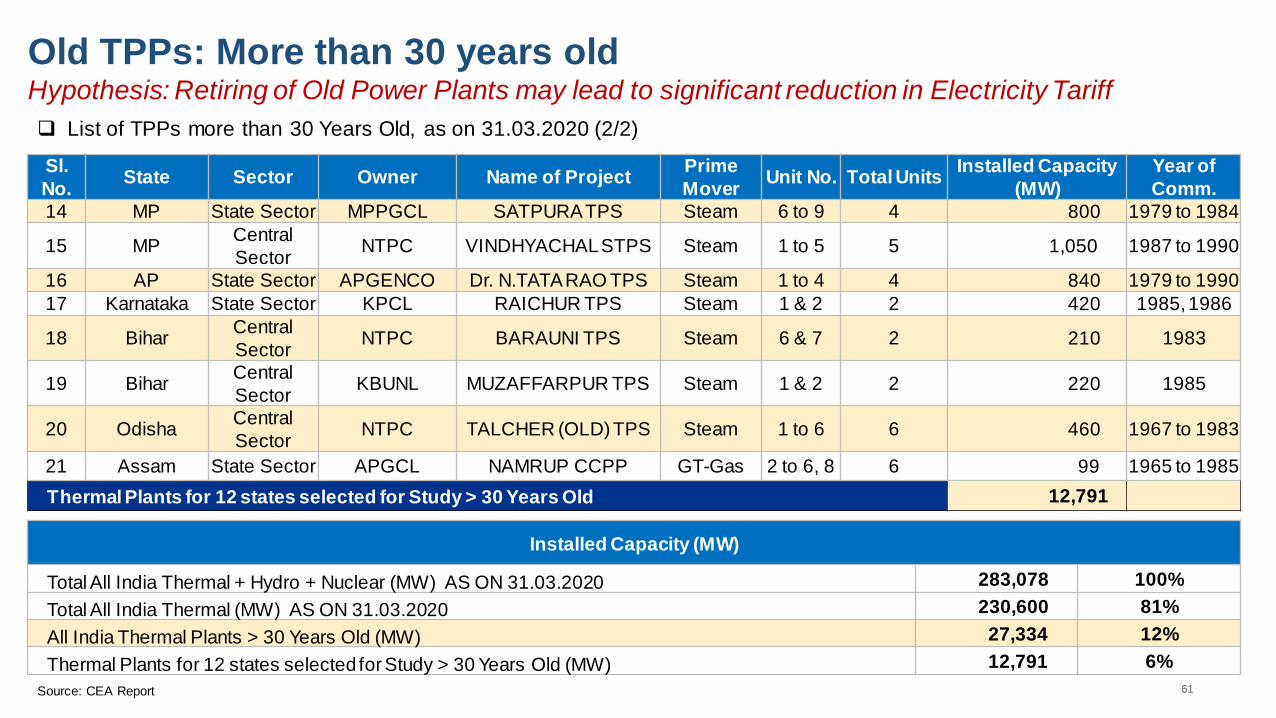
61
Old TPPs: More than 30 years old Hypothesis: Retiring of Old Power Plants may lead to significant reduction in Electricity Tariff
List of TPPs more than 30 Years Old, as on 31.03.2020 (2/2)
Sl.
No. State Sector Owner Name of Project
Prime
Mover Unit No. Total Units
Installed Capacity
(MW)
Year of
Comm.
14 MP State Sector MPPGCL SATPURA TPS Steam 6 to 9 4 800 1979 to 1984
15 MP Central
Sector NTPC VINDHYACHAL STPS Steam 1 to 5 5 1,050 1987 to 1990
16 AP State Sector APGENCO Dr. N.TATA RAO TPS Steam 1 to 4 4 840 1979 to 1990
17 Karnataka State Sector KPCL RAICHUR TPS Steam 1 & 2 2 420 1985, 1986
18 Bihar Central
Sector NTPC BARAUNI TPS Steam 6 & 7 2 210 1983
19 Bihar Central
Sector KBUNL MUZAFFARPUR TPS Steam 1 & 2 2 220 1985
20 Odisha Central
Sector NTPC TALCHER (OLD) TPS Steam 1 to 6 6 460 1967 to 1983
21 Assam State Sector APGCL NAMRUP CCPP GT-Gas 2 to 6, 8 6 99 1965 to 1985
Thermal Plants for 12 states selected for Study > 30 Years Old 12,791
Installed Capacity (MW)
Total All India Thermal + Hydro + Nuclear (MW) AS ON 31.03.2020 283,078 100%
Total All India Thermal (MW) AS ON 31.03.2020 230,600 81%
All India Thermal Plants > 30 Years Old (MW) 27,334 12%
Thermal Plants for 12 states selected for Study > 30 Years Old (MW) 12,791 6%
Source: CEA Report 61
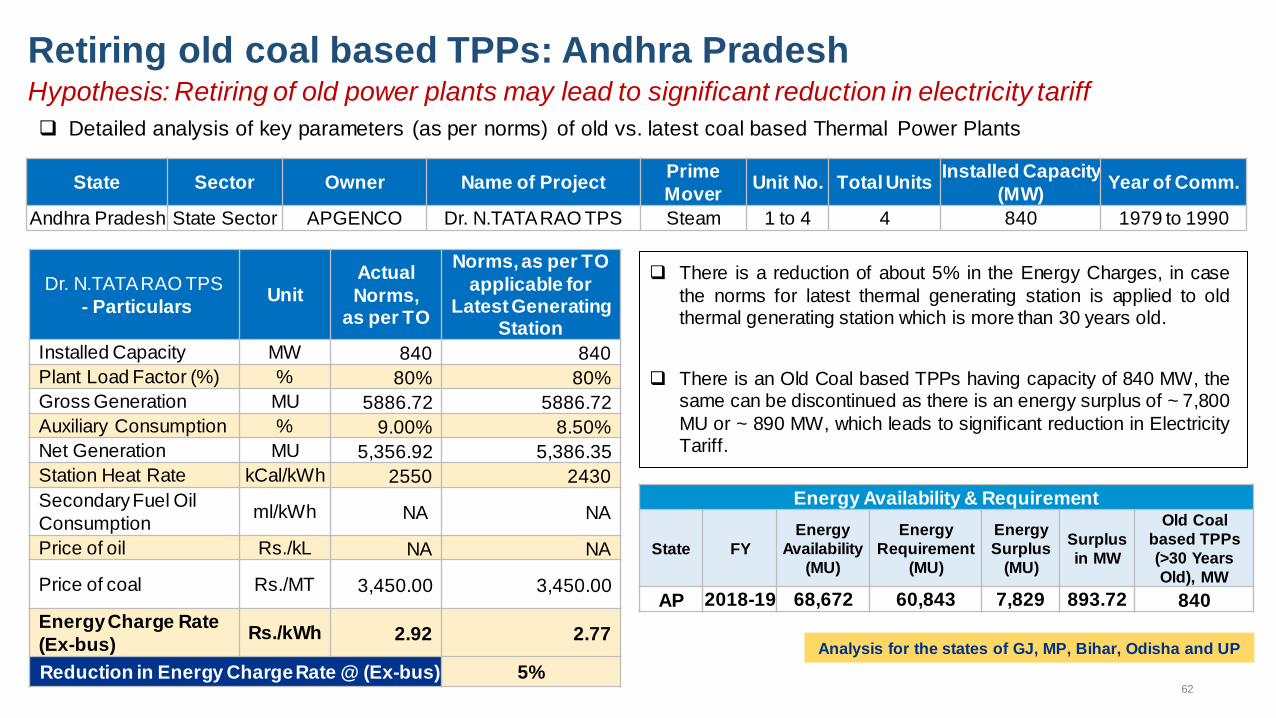
62
Retiring old coal based TPPs: Andhra Pradesh Hypothesis: Retiring of old power plants may lead to significant reduction in electricity tariff
Detailed analysis of key parameters (as per norms) of old vs. latest coal based Thermal Power Plants
State Sector Owner Name of Project Prime
Mover Unit No. Total Units
Installed Capacity
(MW) Year of Comm.
Andhra Pradesh State Sector APGENCO Dr. N.TATA RAO TPS Steam 1 to 4 4 840 1979 to 1990
Dr. N.TATA RAO TPS
- Particulars Unit
Actual
Norms, as per TO
Norms, as per TO
applicable for Latest Generating
Station
Installed Capacity MW 840 840
Plant Load Factor (%) % 80% 80%
Gross Generation MU 5886.72 5886.72
Auxiliary Consumption % 9.00% 8.50%
Net Generation MU 5,356.92 5,386.35
Station Heat Rate kCal/kWh 2550 2430
Secondary Fuel Oil
Consumption ml/kWh NA NA
Price of oil Rs./kL NA NA
Price of coal Rs./MT 3,450.00 3,450.00
Energy Charge Rate
(Ex-bus) Rs./kWh 2.92 2.77
Reduction in Energy Charge Rate @ (Ex-bus) 5%
Energy Availability & Requirement
State FY
Energy
Availability
(MU)
Energy
Requirement
(MU)
Energy
Surplus
(MU)
Surplus
in MW
Old Coal
based TPPs
(>30 Years
Old), MW
AP 2018-19 68,672 60,843 7,829 893.72 840
There is a reduction of about 5% in the Energy Charges, in case
the norms for latest thermal generating station is applied to old thermal generating station which is more than 30 years old.
There is an Old Coal based TPPs having capacity of 840 MW, the same can be discontinued as there is an energy surplus of ~ 7,800
MU or ~ 890 MW, which leads to significant reduction in Electricity Tariff.
Analysis for the states of GJ, MP, Bihar, Odisha and UP

Summary: Retiring old coal based TPPs Hypothesis: Retiring of old power plants may lead to significant reduction in electricity tariff
Thermal Plants > 30 Years Old account for 12% of the total installed capacity at the
national level
Energy charges may reduce by ~4-23% for 12 states in case the norms for latest thermal
generating station are applied to old thermal generating station (> 30 years old)
Old coal-based TPPs can be discontinued in the states of Gujarat, Madhya Pradesh and
Andhra Pradesh as there is an energy surplus to the tune of 1,000 - 3,000 MW during
FY 2018-19

Installed Capacity & Peak
Demand
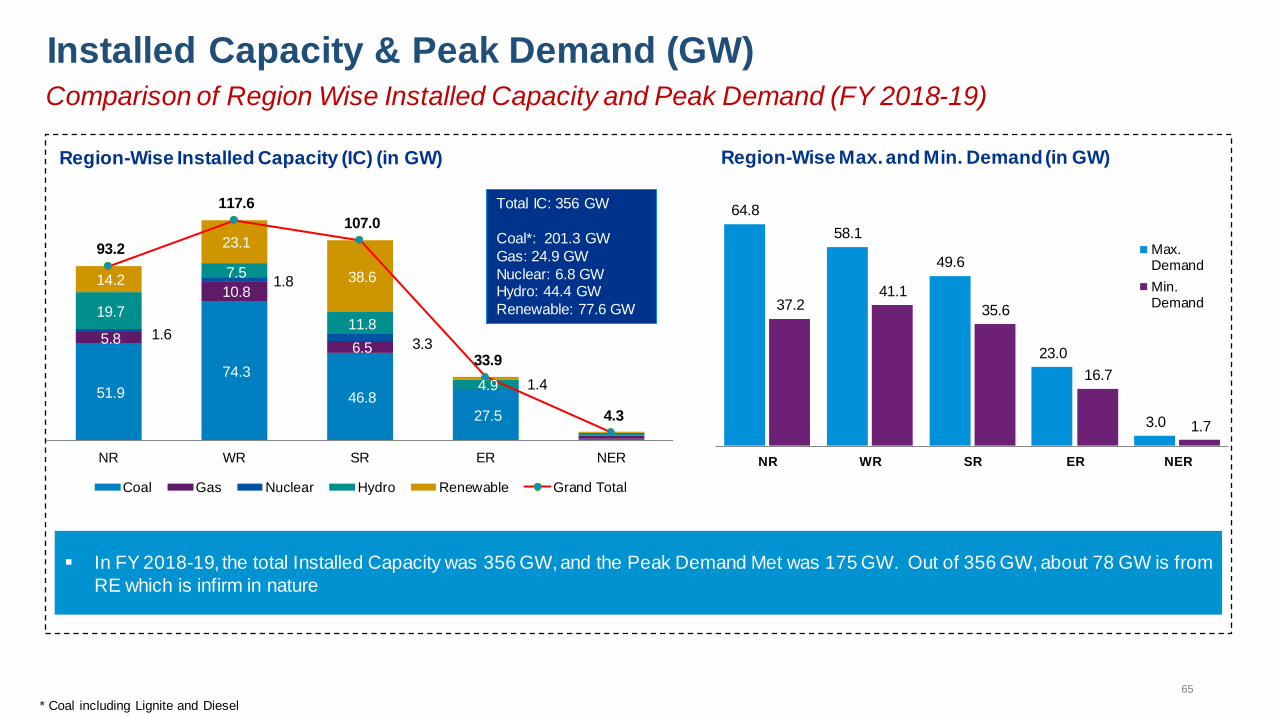
Installed Capacity & Peak Demand (GW) Comparison of Region Wise Installed Capacity and Peak Demand (FY 2018-19)
51.9
74.3
46.8
27.5
5.8
10.8
6.5 1.6
1.8
3.3
19.7
7.5
11.8
4.9
14.2
23.1
38.6
1.4
93.2
117.6
107.0
33.9
4.3
NR WR SR ER NER
Region-Wise Installed Capacity (IC) (in GW)
Coal Gas Nuclear Hydro Renewable Grand Total
64.8
58.1
49.6
23.0
3.0
37.2 41.1
35.6
16.7
1.7
NR WR SR ER NER
Region-Wise Max. and Min. Demand (in GW)
Max.Demand
Min.Demand
Total IC: 356 GW
Coal*: 201.3 GW
Gas: 24.9 GW
Nuclear: 6.8 GW Hydro: 44.4 GW
Renewable: 77.6 GW
* Coal including Lignite and Diesel
65
In FY 2018-19, the total Installed Capacity was 356 GW, and the Peak Demand Met was 175 GW. Out of 356 GW, about 78 GW is from
RE which is infirm in nature

Comparison of Region Wise Installed Capacity and Peak Demand (FY 2019-20)
55.0
74.5
48.1
27.3
5.8
10.8
6.5
1.6
1.8
3.3
20.1
7.6
11.8
4.6
16.9
25.9
42.4
1.5
99.4
120.6
112.1
33.5
4.5
NR WR SR ER NER
Region-Wise Installed Capacity (GW)
Coal Gas Nuclear Hydro Renewable Grand Total
Total IC: 370.1 GW
Coal*: 205.6 GW
Gas: 25 GW
Nuclear: 6.8 GW Hydro: 45.7 GW
Renewable: 87 GW
66.7
59.4
53.5
23.8
5.2
27.8 25.4
31.1
15.9
1.5
NR WR SR ER NER
Region-Wise Max. and Min. Demand (GW)
Max.Demand
Min.Demand
Installed Capacity & Peak Demand (MW)
* Coal including Lignite and Diesel
In FY 2019-20, the total Installed Capacity was 370 GW, and the Peak Demand Met was 182 GW. Out of 370 GW Installed Capacity
about 87 GW is from RE which is infirm in nature
66
Under-utilization of
generating stations

68
Under-utilization of generating stations Hypothesis: Optimal utilization of TPPs may lead to reduction in electricity tariffs
Shortage of coal 1
Generating plants running on technical
minimum due to higher energy availability. 2
Not following Merit Order Dispatch
properly 3
Targets set by Ministry of Power for RE
procurement 4
Reason for under-utilization of generating station
Issue of coal shortage and technical minimum can be handled by retiring old coal based TPP as discussed in
previous section. States like Madhya Pradesh, Gujarat, Andhra Pradesh etc. are surplus states.
Recently, MERC has issued guidelines for operation of Merit Order Dispatch under availability-based tariff
order. Other states can examine the same in their state as per their Energy Gap scenario. Detailed regarding
the guidelines issued by MERC are provided in subsequent slides. Proper implementation of MOD can improve
the utilization of Generating Station.
Procurement of Renewable Energy is one of the reason for under-utilization of Generating Stations.
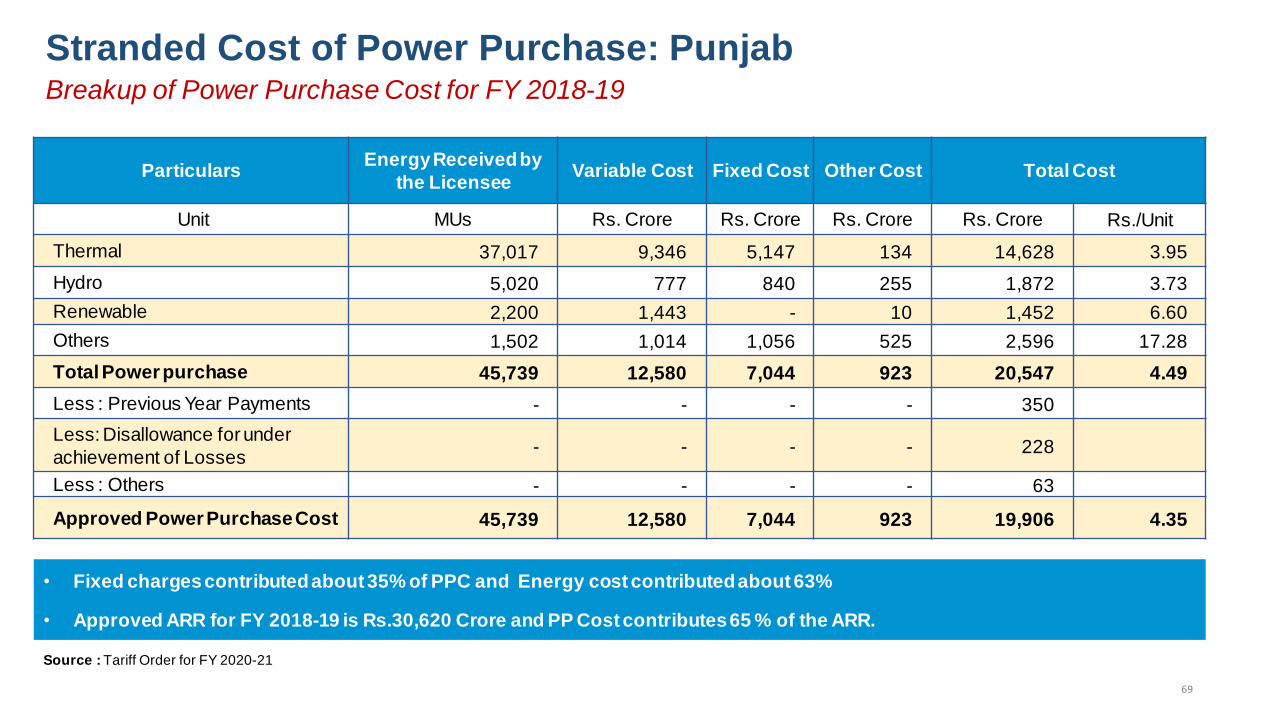
69
Stranded Cost of Power Purchase: Punjab
• Fixed charges contributed about 35% of PPC and Energy cost contributed about 63%
• Approved ARR for FY 2018-19 is Rs.30,620 Crore and PP Cost contributes 65 % of the ARR.
Source : Tariff Order for FY 2020-21
Particulars Energy Received by
the Licensee Variable Cost Fixed Cost Other Cost Total Cost
Unit MUs Rs. Crore Rs. Crore Rs. Crore Rs. Crore Rs./Unit
Thermal 37,017 9,346 5,147 134 14,628 3.95
Hydro 5,020 777 840 255 1,872 3.73
Renewable 2,200 1,443 - 10 1,452 6.60
Others 1,502 1,014 1,056 525 2,596 17.28
Total Power purchase 45,739 12,580 7,044 923 20,547 4.49
Less : Previous Year Payments - - - - 350
Less: Disallowance for under
achievement of Losses - - - - 228
Less : Others - - - - 63
Approved Power Purchase Cost 45,739 12,580 7,044 923 19,906 4.35
Breakup of Power Purchase Cost for FY 2018-19
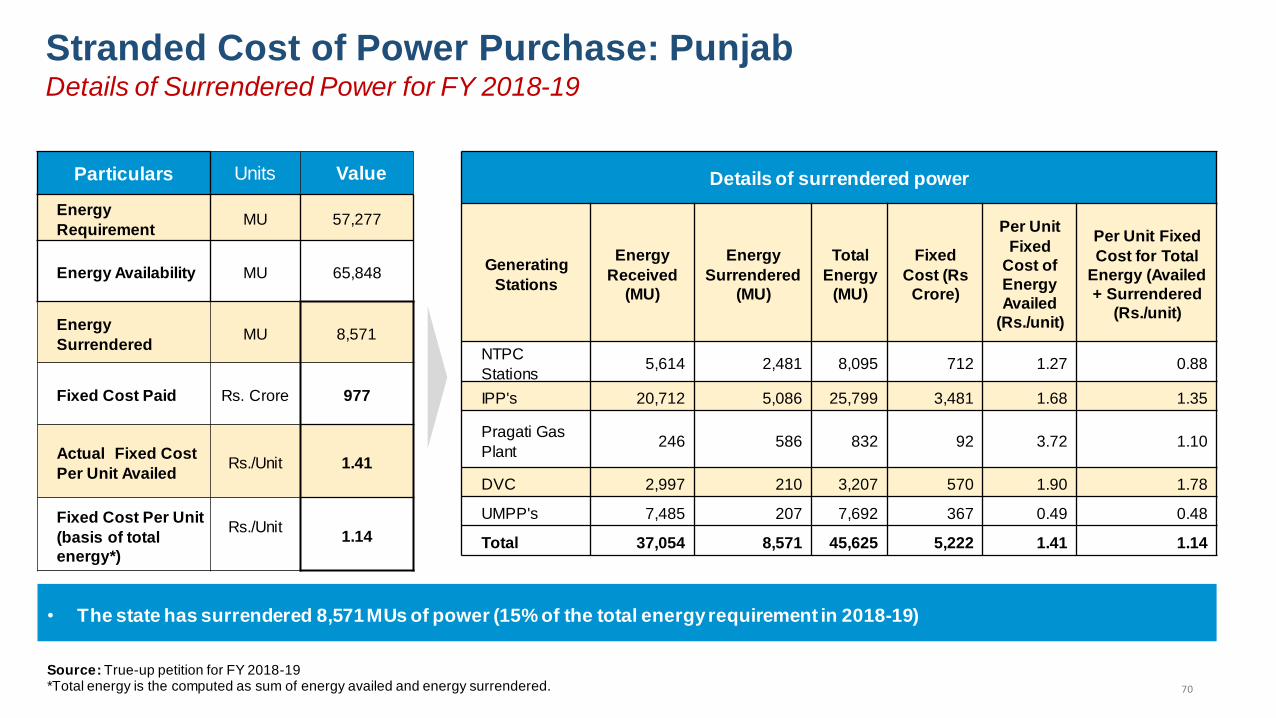
70
Particulars Units Value
Energy
Requirement MU 57,277
Energy Availability MU 65,848
Energy
Surrendered MU 8,571
Fixed Cost Paid Rs. Crore 977
Actual Fixed Cost
Per Unit Availed Rs./Unit 1.41
Fixed Cost Per Unit
(basis of total
energy*)
Rs./Unit
1.14
Details of surrendered power
Generating
Stations
Energy
Received
(MU)
Energy
Surrendered
(MU)
Total
Energy
(MU)
Fixed
Cost (Rs
Crore)
Per Unit
Fixed
Cost of
Energy
Availed
(Rs./unit)
Per Unit Fixed
Cost for Total
Energy (Availed
+ Surrendered
(Rs./unit)
NTPC
Stations 5,614 2,481 8,095 712 1.27 0.88
IPP's 20,712 5,086 25,799 3,481 1.68 1.35
Pragati Gas
Plant 246 586 832 92 3.72 1.10
DVC 2,997 210 3,207 570 1.90 1.78
UMPP's 7,485 207 7,692 367 0.49 0.48
Total 37,054 8,571 45,625 5,222 1.41 1.14
Stranded Cost of Power Purchase: Punjab Details of Surrendered Power for FY 2018-19
Source: True-up petition for FY 2018-19 *Total energy is the computed as sum of energy availed and energy surrendered.
• The state has surrendered 8,571 MUs of power (15% of the total energy requirement in 2018-19)

71 Source: GRIDCO Tariff Order for FY 2020-21
28978
34047 34960
26804 28731 29019
2174 5316 5941
FY 2018-19 FY 2019-20 FY 2020-21
Energy Availability and Requirement (in MUs)
Energy Availabilty Energy Requirement Surplus Energy
Power Purchase approved for GRIDCO(FY 2020-21)
Particulars MU Rs. Crore Rs./Unit
Thermal 19,730 5,729 2.90
Hydro 7,052 860 1.22
Renewable 2,237 866 3.87
Transmission Charges 629
Total 29,019 8,084 2.79
Stranded Cost of Power Purchase: Odisha Details of Power Purchase
• Surplus Energy is approximately 16-17 % of the Energy availability for FY 20 and FY 21.

72
Particulars Units Value
Energy
Requirement MU 29,019
Energy Availability MU 34,960
Energy
Surrendered MU 5,941
Fixed Cost Rs. Crore 348
Actual Fixed Cost
Per Unit Availed Rs./Unit 2.12
Fixed Cost Per Unit
(basis of total
energy)
Rs./Unit
0.92
Details of surrendered power
Generating
Stations
Energy
Received
(MU)
Energy
Surrendered
(MU)
Total
Energy
(MU)
Fixed Cost (Rs
Crore)
Per Unit
Fixed Cost
of Energy
Availed
(Rs./unit)
Per Unit Fixed
Cost for Total
Energy
(Availed +
Surrendered
(Rs./unit
Vedanta 3,053 1,986 5,039 399 1.31 0.79
TSTPS-1 1,509 677 2,186 219 1.45 1
FSTPS-I & II - 1,542 1,542 132 - 0.86
FSTPS-III - 586 586 91 - 1.54
KhTPS-I - 880 880 96 - 1.09
KhTPS-II - 269 269 30 - 1.13
Total 4,562 5,941 10,503 967 2.12 0.92
Stranded Cost of Power Purchase: Orissa Details of Surrendered Power for FY 2020-21
• The state has surrendered 5,941 MUs of power (17% of the total energy requirement in 2020-21)
Source: GRIDCO True-up petition for FY 2020-21
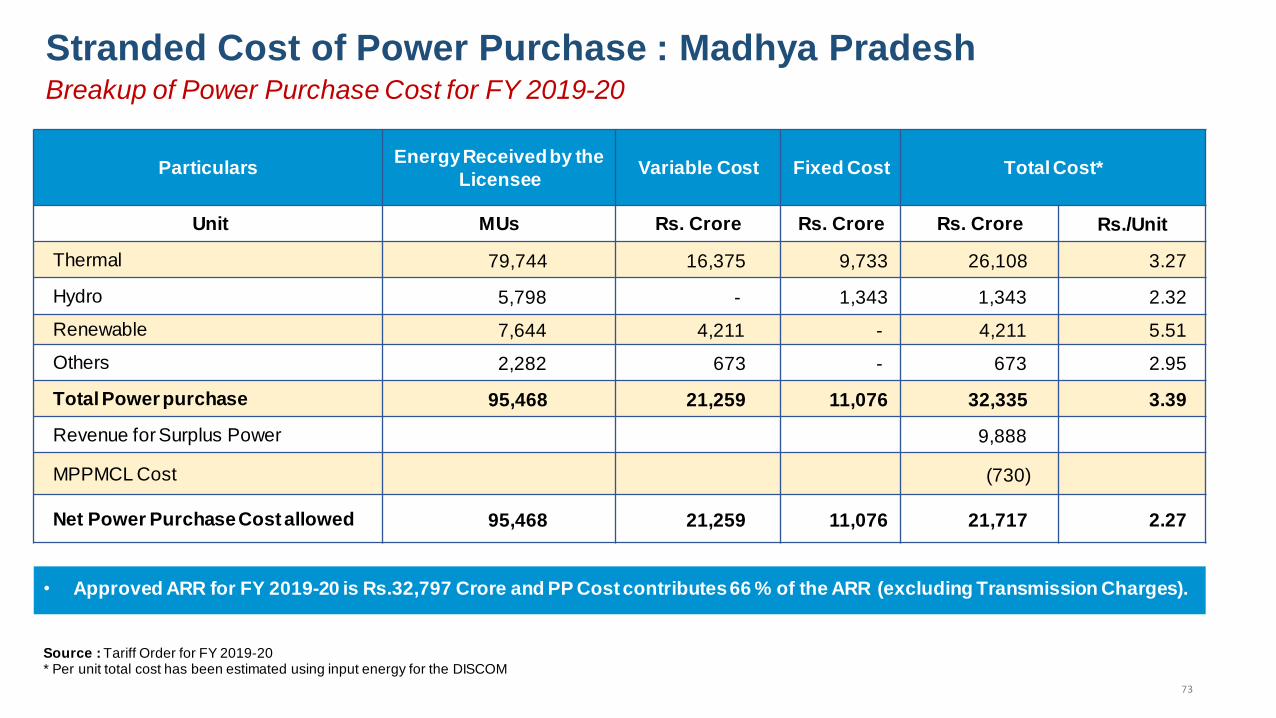
73
Stranded Cost of Power Purchase : Madhya Pradesh
• Approved ARR for FY 2019-20 is Rs.32,797 Crore and PP Cost contributes 66 % of the ARR (excluding Transmission Charges).
Source : Tariff Order for FY 2019-20 * Per unit total cost has been estimated using input energy for the DISCOM
Particulars Energy Received by the
Licensee Variable Cost Fixed Cost Total Cost*
Unit MUs Rs. Crore Rs. Crore Rs. Crore Rs./Unit
Thermal 79,744 16,375 9,733 26,108 3.27
Hydro 5,798 - 1,343 1,343 2.32
Renewable 7,644 4,211 - 4,211 5.51
Others 2,282 673 - 673 2.95
Total Power purchase 95,468 21,259 11,076 32,335 3.39
Revenue for Surplus Power 9,888
MPPMCL Cost (730)
Net Power Purchase Cost allowed 95,468 21,259 11,076 21,717 2.27
Breakup of Power Purchase Cost for FY 2019-20

74
Particulars Units Value
Energy Requirement MU 69,353
Energy Availability MU 97,989
Energy Surrendered MU 28,636
Fixed Cost of Surplus
Energy Rs. Crore 4,325
Actual Fixed Cost Per
Unit Availed Rs./Unit 1.11
Fixed Cost Per Unit
(basis of total energy)
Rs./Unit
0.73
Stranded Cost of Power Purchase: Madhya Pradesh Details of Surrendered Power for FY 2019-20
Source: Tariff Order for FY 2019-20
• The surplus energy is around 29% of the energy availability
• As per the tariff order for 2019-20, the State Commission has approved sale of surplus energy (25,658 MU) through power exchange at Rs. 3.85/unit leading to an additional revenue of Rs.9,888 Crore.
Details of surrendered power
Generating
Stations
Energy
Received
(MU)
Energy
Surrendered
(MU)
Total
Energy
(MU)
Fixed
Cost (Rs
Crore)
Per Unit
Fixed Cost
of Energy
Availed
(Rs./unit)
Per Unit Fixed
Cost for Total
Energy (Availed +
Surrendered
(Rs./unit)
NTPC
Stations 26,947 7,062 34,010 3,141 1.17 0.92
IPP's 22,815 19,053 41,868 2,396 1.05 0.57
Others 2,521
Total 49,762 28,636 75,877 5,537 1.11 0.73
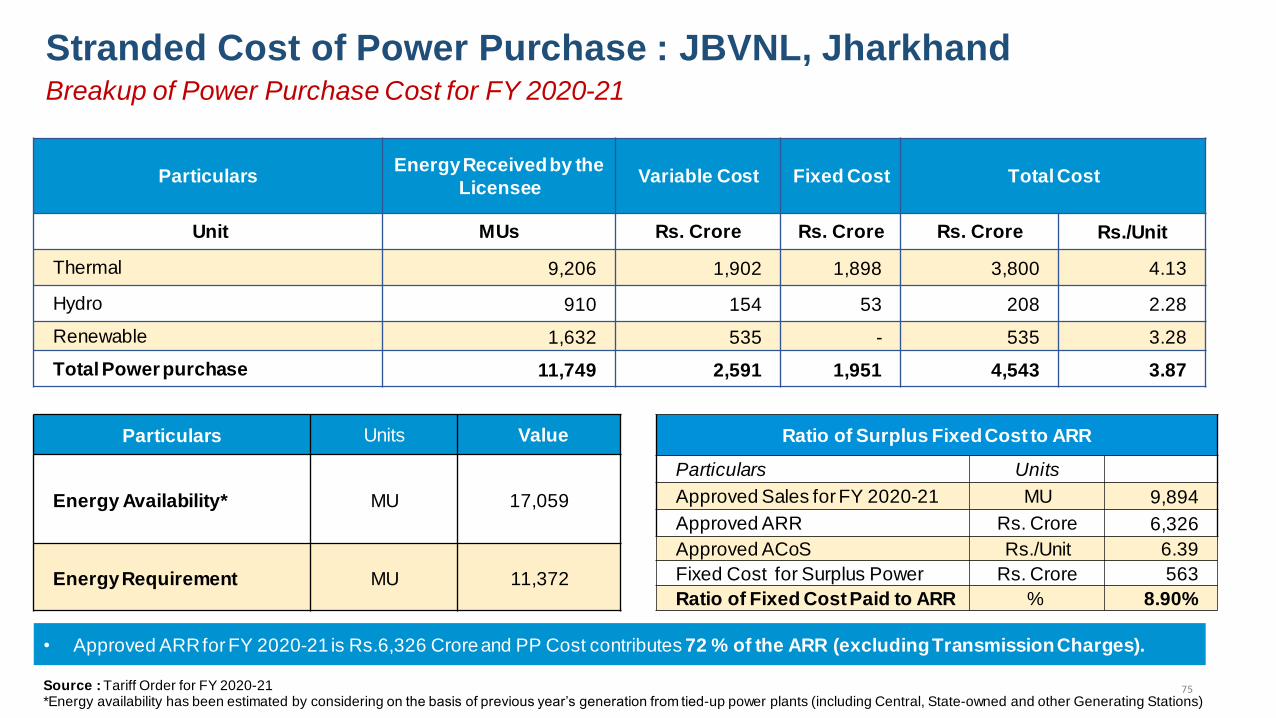
75
Stranded Cost of Power Purchase : JBVNL, Jharkhand
• Approved ARR for FY 2020-21 is Rs.6,326 Crore and PP Cost contributes 72 % of the ARR (excluding Transmission Charges).
Source : Tariff Order for FY 2020-21 *Energy availability has been estimated by considering on the basis of previous year‟s generation from tied-up power plants (including Central, State-owned and other Generating Stations)
Particulars Energy Received by the
Licensee Variable Cost Fixed Cost Total Cost
Unit MUs Rs. Crore Rs. Crore Rs. Crore Rs./Unit
Thermal 9,206 1,902 1,898 3,800 4.13
Hydro 910 154 53 208 2.28
Renewable 1,632 535 - 535 3.28
Total Power purchase 11,749 2,591 1,951 4,543 3.87
Breakup of Power Purchase Cost for FY 2020-21
Particulars Units Value
Energy Availability* MU 17,059
Energy Requirement MU 11,372
Ratio of Surplus Fixed Cost to ARR
Particulars Units
Approved Sales for FY 2020-21 MU 9,894
Approved ARR Rs. Crore 6,326
Approved ACoS Rs./Unit 6.39
Fixed Cost for Surplus Power Rs. Crore 563
Ratio of Fixed Cost Paid to ARR % 8.90%
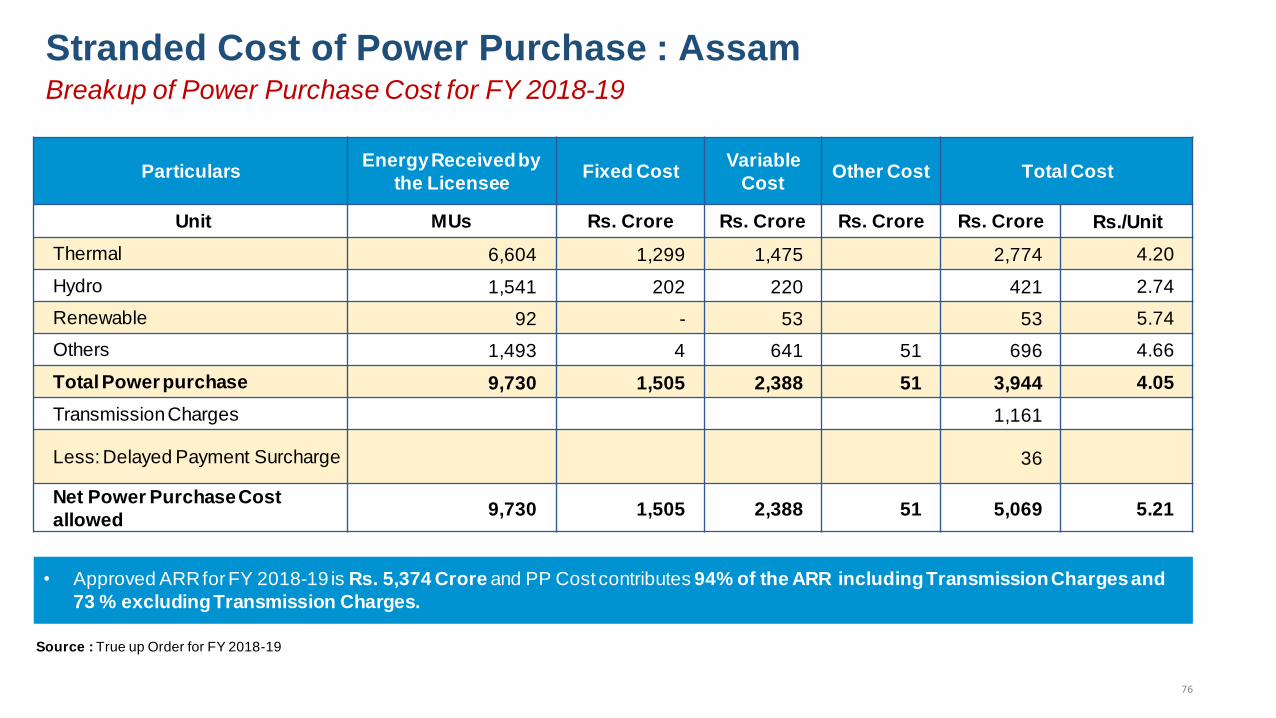
76
Stranded Cost of Power Purchase : Assam
• Approved ARR for FY 2018-19 is Rs. 5,374 Crore and PP Cost contributes 94% of the ARR including Transmission Charges and
73 % excluding Transmission Charges.
Source : True up Order for FY 2018-19
Particulars Energy Received by
the Licensee Fixed Cost
Variable
Cost Other Cost Total Cost
Unit MUs Rs. Crore Rs. Crore Rs. Crore Rs. Crore Rs./Unit
Thermal 6,604 1,299 1,475 2,774 4.20
Hydro 1,541 202 220 421 2.74
Renewable 92 - 53 53 5.74
Others 1,493 4 641 51 696 4.66
Total Power purchase 9,730 1,505 2,388 51 3,944 4.05
Transmission Charges 1,161
Less: Delayed Payment Surcharge 36
Net Power Purchase Cost
allowed 9,730 1,505 2,388 51 5,069 5.21
Breakup of Power Purchase Cost for FY 2018-19

77
Particulars Units Value
Energy Requirement MU 8,866
Energy Availability MU 9,730
Energy Surplus MU 864
Fixed Cost of Surplus
Energy Rs. Crore 294*
Actual Per Unit Fixed
Cost Rs./Unit 3.40
Fixed Cost Per Unit
(basis of total energy)
Rs./Unit
2.19
Stranded Cost of Power Purchase: Assam Details of Surrendered Power for FY 2018-19
• The Surplus Energy is around 9% of the energy availability; The income earned from the sale of Surplus Power is Rs.171 Crore @ Rs.
1.97 per Unit.
• Impact of Surplus Power on ACOS is around 42 paise/unit.
Ratio of Surplus Fixed Cost to ARR
Particulars Units
Approved Sales for FY 2018-19 MU 6,968
Approved ARR Rs. Crore 5,374
Approved ACoS Rs./Unit 7.71
Fixed Cost for Surplus Power Rs. Crore 294*
Ratio of Fixed Cost Paid to ARR % 5.47%
Source : True up Order for FY 2018-19 *Computed based on assumptions
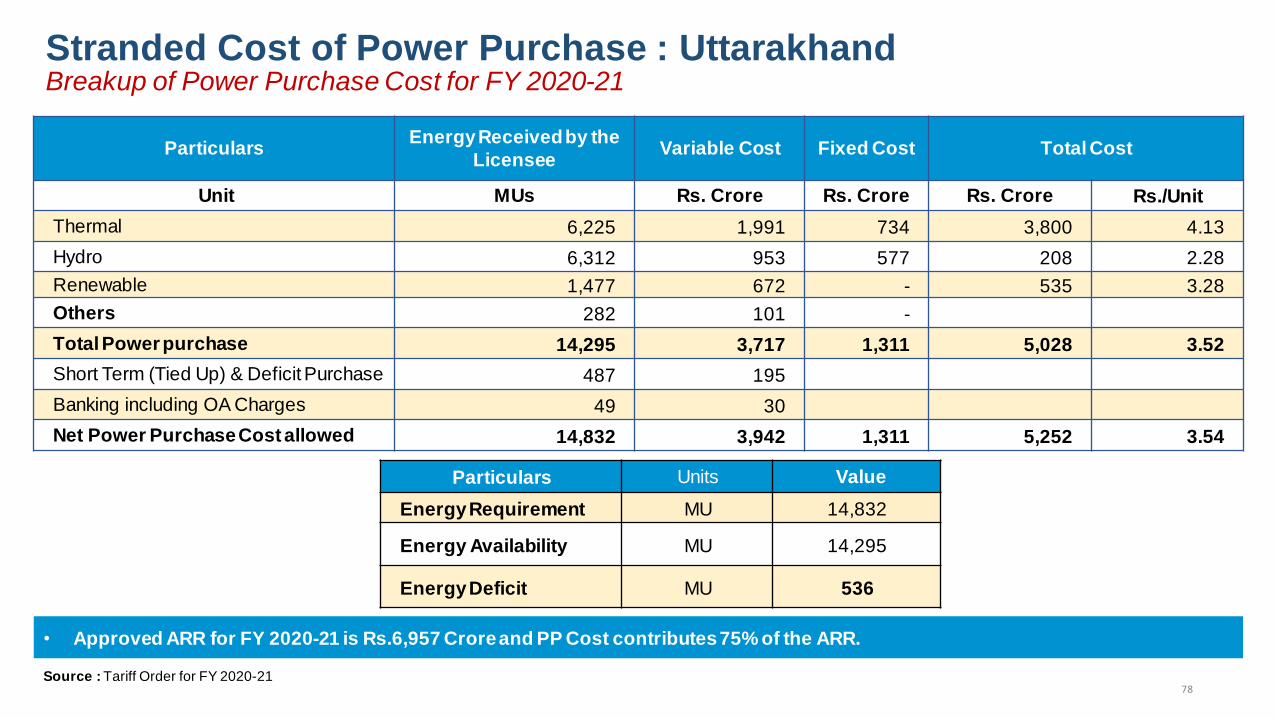
78
Stranded Cost of Power Purchase : Uttarakhand
• Approved ARR for FY 2020-21 is Rs.6,957 Crore and PP Cost contributes 75% of the ARR.
Source : Tariff Order for FY 2020-21
Particulars Energy Received by the
Licensee Variable Cost Fixed Cost Total Cost
Unit MUs Rs. Crore Rs. Crore Rs. Crore Rs./Unit
Thermal 6,225 1,991 734 3,800 4.13
Hydro 6,312 953 577 208 2.28
Renewable 1,477 672 - 535 3.28
Others 282 101 - Total Power purchase 14,295 3,717 1,311 5,028 3.52
Short Term (Tied Up) & Deficit Purchase 487 195 Banking including OA Charges 49 30 Net Power Purchase Cost allowed 14,832 3,942 1,311 5,252 3.54
Breakup of Power Purchase Cost for FY 2020-21
Particulars Units Value
Energy Requirement MU 14,832
Energy Availability MU 14,295
Energy Deficit MU 536

79
Stranded Cost of Power Purchase: Bihar
• Approved ARR for FY 2020-21 is Rs. 18,528 Crore and PP Cost contributes 73% of the ARR excluding Transmission Charges
Source : Tariff Order for FY 2020-21
Particulars Energy Received by
the Licensee Fixed Cost
Variable
Cost Other Cost Total Cost
Unit MUs Rs. Crore Rs. Crore Rs. Crore Rs. Crore Rs./Unit
Thermal 25,425 5,489 5,552 135 11,175 4.40
Hydro 3,117 150 833 983 3.15
Renewable 3,026 - 1,084 1,084 3.58
Others 816 - 342 342 4.19
Total Power purchase 32,384 5,639 7,811 135 13,584 4.19
Breakup of Power Purchase Cost for FY 2020-21
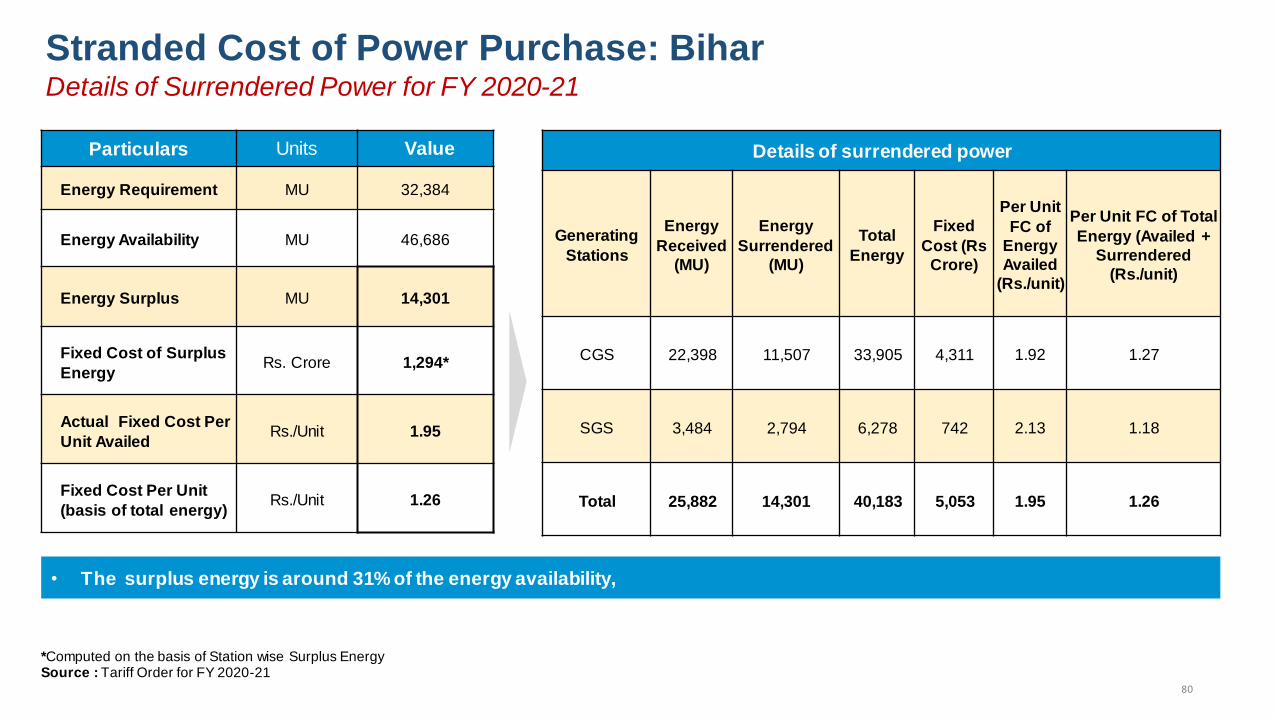
80
Particulars Units Value
Energy Requirement MU 32,384
Energy Availability MU 46,686
Energy Surplus MU 14,301
Fixed Cost of Surplus
Energy Rs. Crore 1,294*
Actual Fixed Cost Per
Unit Availed Rs./Unit 1.95
Fixed Cost Per Unit
(basis of total energy) Rs./Unit 1.26
Stranded Cost of Power Purchase: Bihar Details of Surrendered Power for FY 2020-21
• The surplus energy is around 31% of the energy availability,
*Computed on the basis of Station wise Surplus Energy Source : Tariff Order for FY 2020-21
Details of surrendered power
Generating
Stations
Energy
Received
(MU)
Energy
Surrendered
(MU)
Total
Energy
Fixed
Cost (Rs
Crore)
Per Unit
FC of
Energy
Availed
(Rs./unit)
Per Unit FC of Total
Energy (Availed +
Surrendered
(Rs./unit)
CGS 22,398 11,507 33,905 4,311 1.92 1.27
SGS 3,484 2,794 6,278 742 2.13 1.18
Total 25,882 14,301 40,183 5,053 1.95 1.26

81
Stranded Cost of Power Purchase: Uttar Pradesh
• Approved ARR for FY 2020-21 is Rs. 65,175 Crore and PP Cost contributes 82% of the ARR excluding Transmission Charges
Source : Tariff Order for FY 2020-21
Particulars Energy Received by the
Licensee Fixed Cost Variable Cost Total Cost
Unit MUs Rs. Crore Rs. Crore Rs. Crore Rs./Unit
Thermal 101,328 19,863 24,366 44,229 4.36
Hydro 13,899 2,911 2,476 5,387 3.88
Renewable 7,523 - 3,088 3,088 4.10
Others 8,994 - 605 605 0.67
Total Power purchase 131,744 22,774 30,535 53,309 4.05
Breakup of Power Purchase Cost for FY 2020-21

82
Particulars Units Value
Energy Requirement MU 1,09,328
Energy Availability MU 1,31,744
Energy Surplus MU 22,416
Fixed Cost of Surplus
Energy Rs. Crore 4,394*
Actual Per Unit Fixed
Cost Rs./Unit 1.96
Fixed Cost Per Unit (basis
of total energy) Rs./Unit 1.61
Stranded Cost of Power Purchase: Uttar Pradesh Details of Surrendered Power for FY 2020-21
• The surplus energy is around 17% of the energy availability,
• Impact of surplus power on ACOS is 6.74% (47 paise/unit)
Ratio of Surplus Fixed Cost to ARR
Particulars Units
Approved Sales MU 92,409
Approved ARR Rs. Crore 65,175
Approved ACoS Rs./Unit 7.05
Fixed Cost for Surplus Power Rs. Crore 4,394*
Ratio of Fixed Cost Paid to ARR % 6.74%
*Computed on the basis of Fixed Cost per Unit of Thermal Energy Source : Tariff Order for FY 2020-21
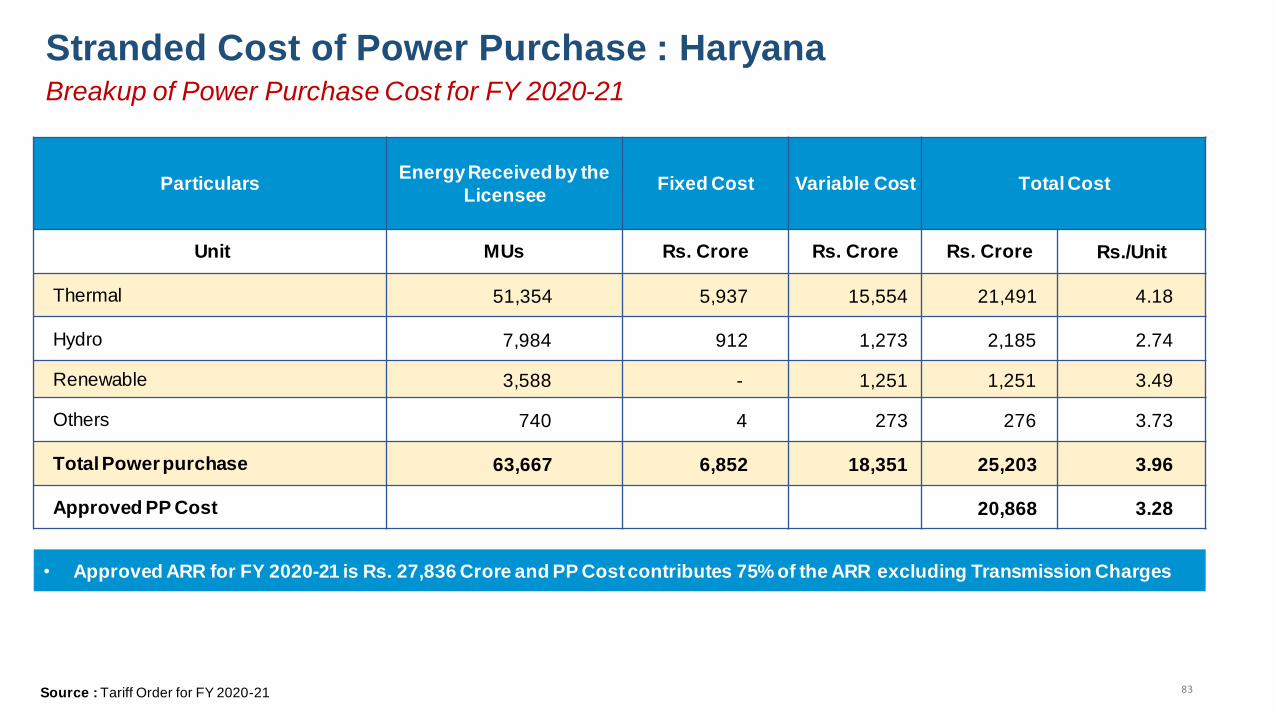
83
Stranded Cost of Power Purchase : Haryana
• Approved ARR for FY 2020-21 is Rs. 27,836 Crore and PP Cost contributes 75% of the ARR excluding Transmission Charges
Source : Tariff Order for FY 2020-21
Particulars Energy Received by the
Licensee Fixed Cost Variable Cost Total Cost
Unit MUs Rs. Crore Rs. Crore Rs. Crore Rs./Unit
Thermal 51,354 5,937 15,554 21,491 4.18
Hydro 7,984 912 1,273 2,185 2.74
Renewable 3,588 - 1,251 1,251 3.49
Others 740 4 273 276 3.73
Total Power purchase 63,667 6,852 18,351 25,203 3.96
Approved PP Cost 20,868 3.28
Breakup of Power Purchase Cost for FY 2020-21

84
Particulars Units Value
Energy Requirement MU 48,796
Energy Availability MU 63,667
Energy Surplus MU 14,870
Fixed Cost of Surplus
Energy Rs. Crore 1,719*
Actual Per Unit Fixed
Cost Rs./Unit 1.16
Fixed Cost Per Unit
(basis of total energy)
Rs./Unit
0.90
Stranded Cost of Power Purchase: Haryana Details of Surrendered Power for FY 2020-21
• The surplus energy is around 23% of the energy availability,
• Impact of surplus power on ACOS is 6.18% (45 paise/unit)
Ratio of Surplus Fixed Cost to ARR
Particulars Units
Approved Sales MU 38,474
Approved ARR Rs. Crore 27,836
Approved ACoS Rs./Unit 7.23
Fixed Cost for Surplus Power Rs. Crore 1719*
Ratio of Fixed Cost Paid to ARR % 6.18%
*Computed on the basis of Fixed Cost per Unit of Thermal Energy Source : Tariff Order for FY 2020-21
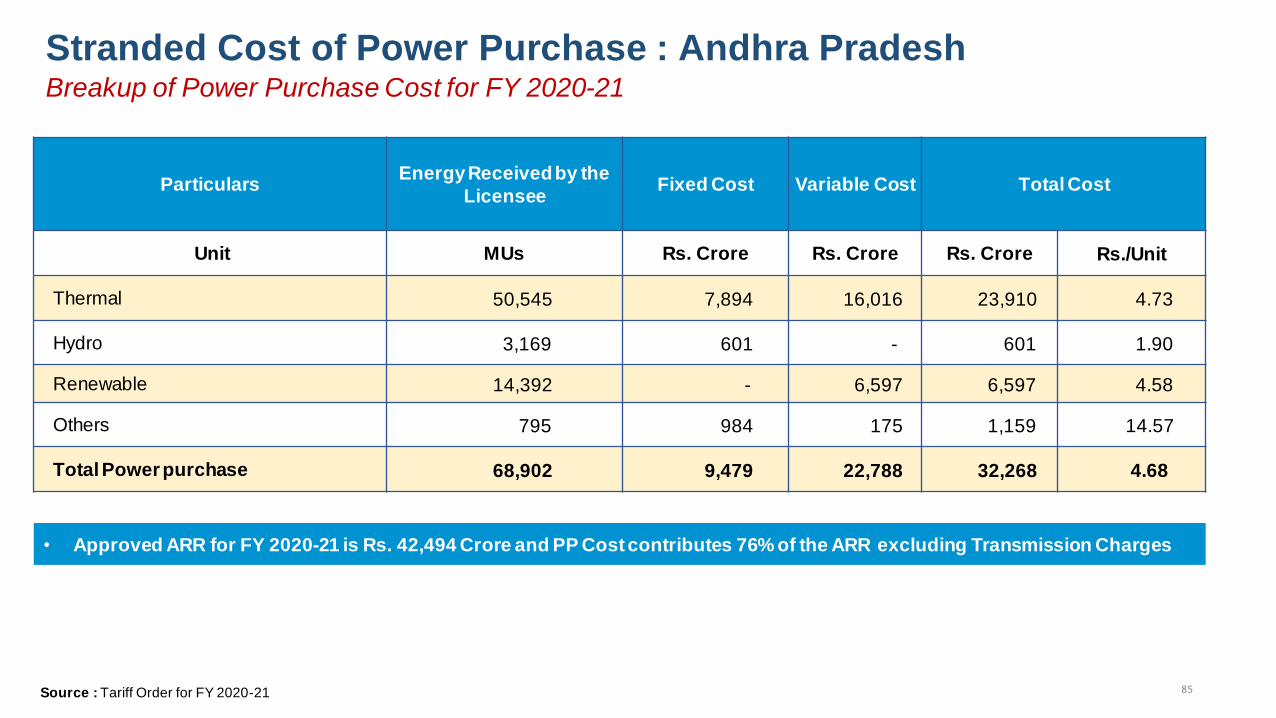
85
Stranded Cost of Power Purchase : Andhra Pradesh
• Approved ARR for FY 2020-21 is Rs. 42,494 Crore and PP Cost contributes 76% of the ARR excluding Transmission Charges
Source : Tariff Order for FY 2020-21
Particulars Energy Received by the
Licensee Fixed Cost Variable Cost Total Cost
Unit MUs Rs. Crore Rs. Crore Rs. Crore Rs./Unit
Thermal 50,545 7,894 16,016 23,910 4.73
Hydro 3,169 601 - 601 1.90
Renewable 14,392 - 6,597 6,597 4.58
Others 795 984 175 1,159 14.57
Total Power purchase 68,902 9,479 22,788 32,268 4.68
Breakup of Power Purchase Cost for FY 2020-21
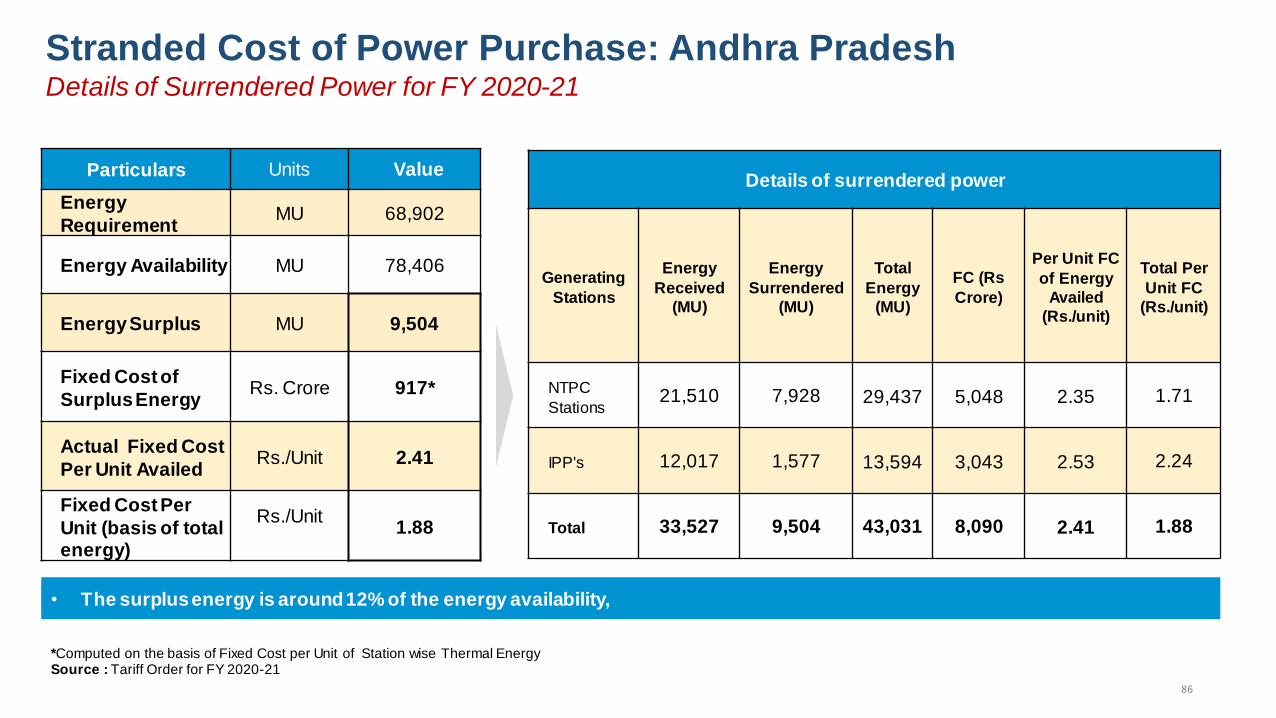
86
Particulars Units Value
Energy
Requirement MU 68,902
Energy Availability MU 78,406
Energy Surplus MU 9,504
Fixed Cost of
Surplus Energy Rs. Crore 917*
Actual Fixed Cost
Per Unit Availed Rs./Unit 2.41
Fixed Cost Per
Unit (basis of total energy)
Rs./Unit
1.88
Stranded Cost of Power Purchase: Andhra Pradesh Details of Surrendered Power for FY 2020-21
• The surplus energy is around 12% of the energy availability,
*Computed on the basis of Fixed Cost per Unit of Station wise Thermal Energy Source : Tariff Order for FY 2020-21
Details of surrendered power
Generating
Stations
Energy
Received
(MU)
Energy
Surrendered
(MU)
Total
Energy
(MU)
FC (Rs
Crore)
Per Unit FC
of Energy
Availed
(Rs./unit)
Total Per
Unit FC
(Rs./unit)
NTPC
Stations 21,510 7,928 29,437 5,048 2.35 1.71
IPP's 12,017 1,577 13,594 3,043 2.53 2.24
Total 33,527 9,504 43,031 8,090 2.41 1.88
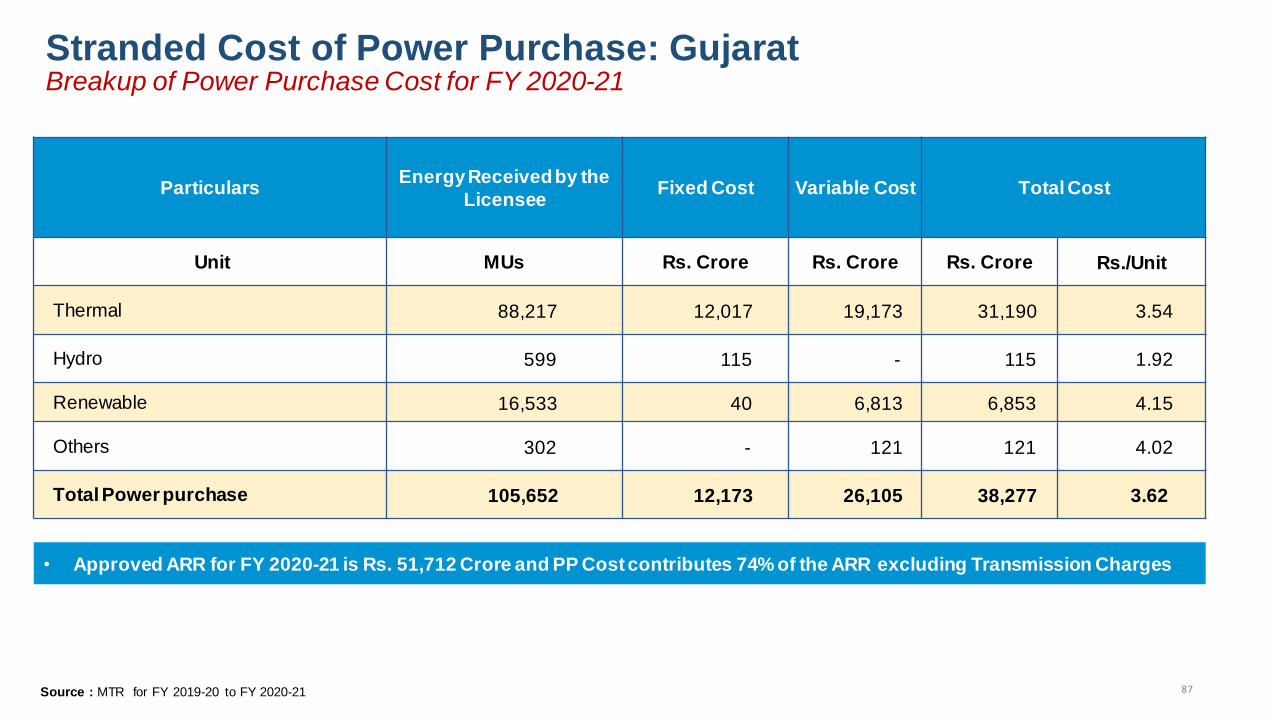
87
Stranded Cost of Power Purchase: Gujarat
• Approved ARR for FY 2020-21 is Rs. 51,712 Crore and PP Cost contributes 74% of the ARR excluding Transmission Charges
Source : MTR for FY 2019-20 to FY 2020-21
Particulars Energy Received by the
Licensee Fixed Cost Variable Cost Total Cost
Unit MUs Rs. Crore Rs. Crore Rs. Crore Rs./Unit
Thermal 88,217 12,017 19,173 31,190 3.54
Hydro 599 115 - 115 1.92
Renewable 16,533 40 6,813 6,853 4.15
Others 302 - 121 121 4.02
Total Power purchase 105,652 12,173 26,105 38,277 3.62
Breakup of Power Purchase Cost for FY 2020-21

88
Particulars Units Value
Energy Requirement MU 1,05,652
Energy Availability MU 1,16,872
Energy Surplus MU 11,220
Fixed Cost of Surplus
Energy Rs. Crore 1,528*
Actual Per Unit Fixed
Cost Rs./Unit 1.36
Fixed Cost Per Unit
(basis of total energy)
Rs./Unit
1.21
Stranded Cost of Power Purchase: Gujarat Details of Surrendered Power for FY 2020-21
• The surplus energy is around 10% of the energy availability,
• Impact of surplus power on ACOS is 2.96% (17 paise/unit)
Ratio of Surplus Fixed Cost to ARR
Particulars Units
Approved Sales MU 87,824
Approved ARR Rs. Crore 51,712
Approved ACoS Rs./Unit 5.89
Fixed Cost for Surplus Power Rs. Crore 1,528*
Ratio of Fixed Cost Paid to ARR % 2.96%
*Computed on the basis of Fixed Cost per Unit of Thermal Energy Source : MTR for FY 2019-20 to FY 2020-21
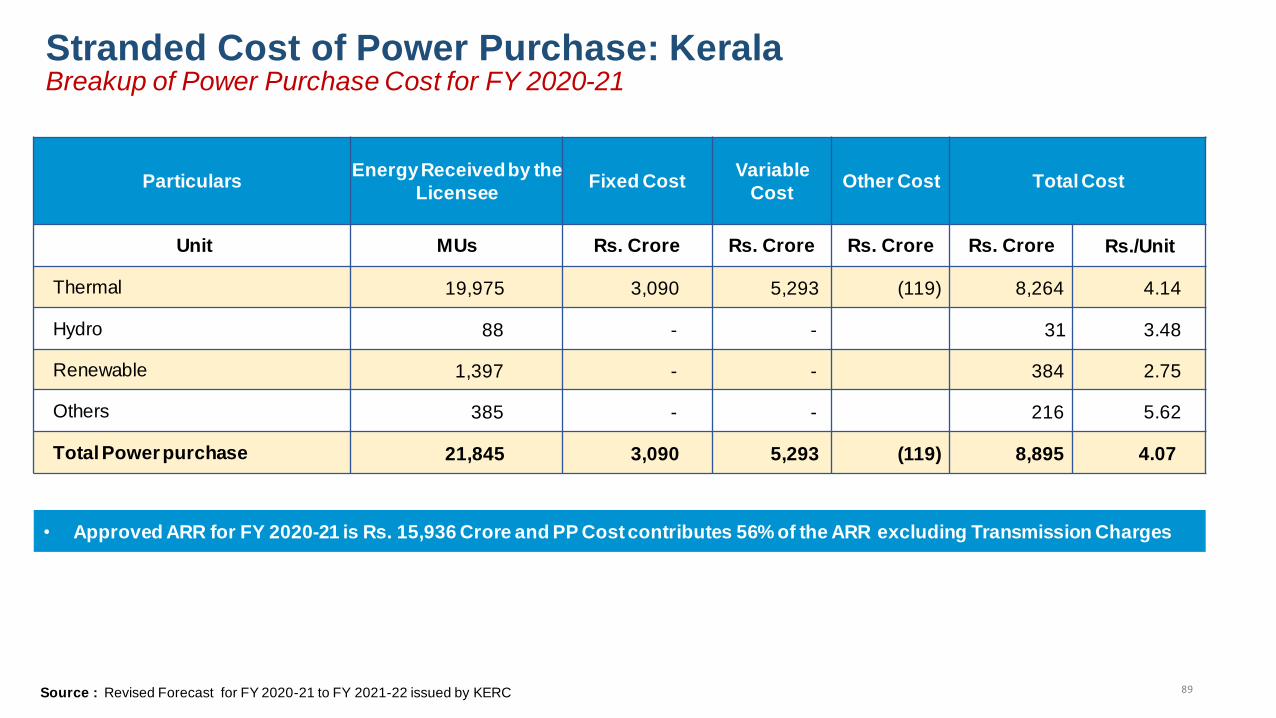
89
Stranded Cost of Power Purchase: Kerala
• Approved ARR for FY 2020-21 is Rs. 15,936 Crore and PP Cost contributes 56% of the ARR excluding Transmission Charges
Source : Revised Forecast for FY 2020-21 to FY 2021-22 issued by KERC
Particulars Energy Received by the
Licensee Fixed Cost
Variable
Cost Other Cost Total Cost
Unit MUs Rs. Crore Rs. Crore Rs. Crore Rs. Crore Rs./Unit
Thermal 19,975 3,090 5,293 (119) 8,264 4.14
Hydro 88 - - 31 3.48
Renewable 1,397 - - 384 2.75
Others 385 - - 216 5.62
Total Power purchase 21,845 3,090 5,293 (119) 8,895 4.07
Breakup of Power Purchase Cost for FY 2020-21
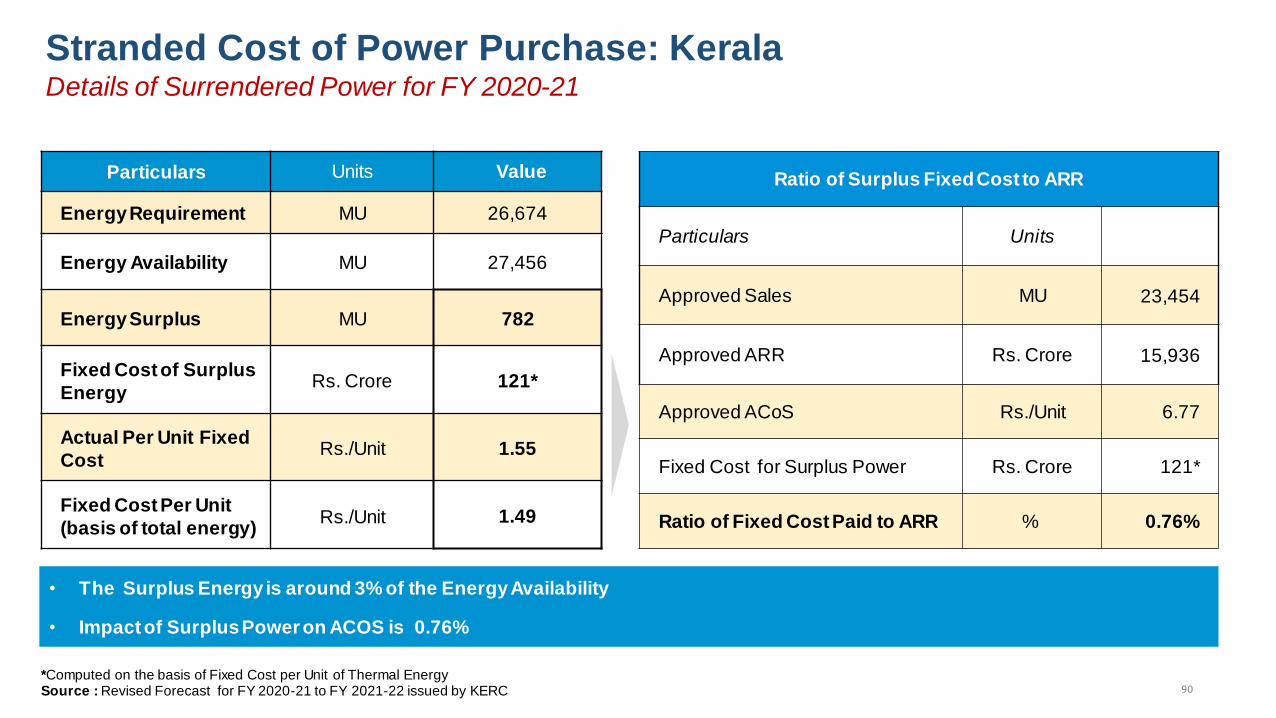
90
Particulars Units Value
Energy Requirement MU 26,674
Energy Availability MU 27,456
Energy Surplus MU 782
Fixed Cost of Surplus
Energy Rs. Crore 121*
Actual Per Unit Fixed
Cost Rs./Unit 1.55
Fixed Cost Per Unit
(basis of total energy)
Rs./Unit
1.49
Stranded Cost of Power Purchase: Kerala Details of Surrendered Power for FY 2020-21
• The Surplus Energy is around 3% of the Energy Availability
• Impact of Surplus Power on ACOS is 0.76%
Ratio of Surplus Fixed Cost to ARR
Particulars Units
Approved Sales MU 23,454
Approved ARR Rs. Crore 15,936
Approved ACoS Rs./Unit 6.77
Fixed Cost for Surplus Power Rs. Crore 121*
Ratio of Fixed Cost Paid to ARR % 0.76%
*Computed on the basis of Fixed Cost per Unit of Thermal Energy Source : Revised Forecast for FY 2020-21 to FY 2021-22 issued by KERC
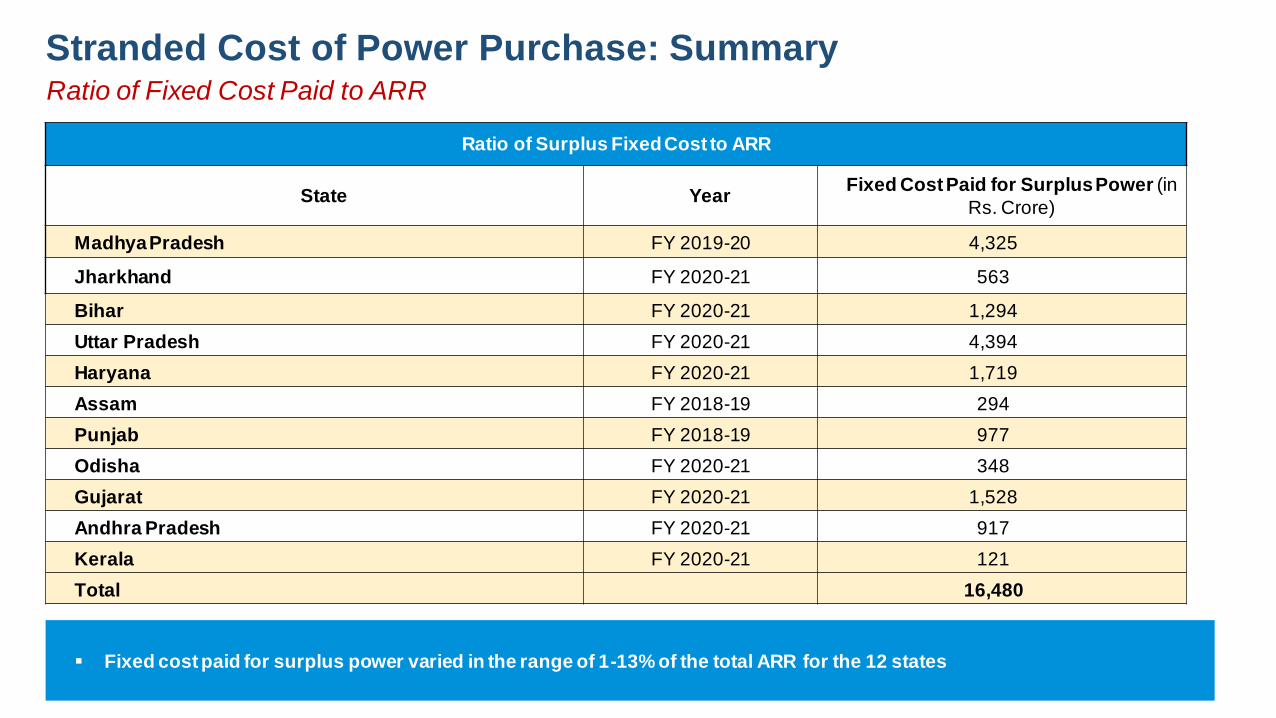
91
Ratio of Surplus Fixed Cost to ARR
State Year Fixed Cost Paid for Surplus Power (in
Rs. Crore)
Madhya Pradesh FY 2019-20 4,325
Jharkhand FY 2020-21 563
Bihar FY 2020-21 1,294
Uttar Pradesh FY 2020-21 4,394
Haryana FY 2020-21 1,719
Assam FY 2018-19 294
Punjab FY 2018-19 977
Odisha FY 2020-21 348
Gujarat FY 2020-21 1,528
Andhra Pradesh FY 2020-21 917
Kerala FY 2020-21 121
Total 16,480
Fixed cost paid for surplus power varied in the range of 1-13% of the total ARR for the 12 states
Stranded Cost of Power Purchase: Summary Ratio of Fixed Cost Paid to ARR

Summary: Under-utilization of generating stations Hypothesis: Optimal utilization of TPPs may lead to reduction in electricity tariffs
Under-utilization of generating stations could be attributed to various factors such as shortage of
coal, non-compliance with Merit Order Dispatch, generating plants running on technical minimum
due to higher energy availability, etc.
Fixed cost paid for surplus power for 12 states was about Rs 16,480 crores varying in the range of
1-13% of the total ARR for the 12 states
92

93
Maharashtra Electricity Regulatory Commission (MERC) issued guidelines for operation of Merit Order Despatch (MOD)
under availability-based tariff order. These guidelines came into effect from the month of April 2019.
The following key aspects have been identified and addressed in the guidelines:
Guidelines for Zero Schedule instructions to the Generating
Units.
Guidelines for Reserve Shut Down (RSD) instructions to
the Generating Units.
• Periodicity and date of preparation of MOD stack. • Guidelines for capacity declaration by Generating units
• Basis of preparation of MOD stack, including the variable
charge to be considered
• Identification of Must Run Stations, and guidelines for
operating Hydro Stations
• Guidelines for operating the Generating Units. • Technical Minimum of Generating Units.
Maharashtra: Merit Order Dispatch (MOD) guidelines
Other aspects:
Detailed Guidelines

Compliance of new
environmental norms

95
Benchmarking of capital cost for FGD-capital cost specified by CEA
• CEA has specified an indicative capex cost1 in Rs. lakh/MW for FGD installation for
various unit sizes and it is discovered through open competitive bidding for the projects
already awarded
• CEA has specified that the Base Cost may further vary as per the following conditions:
– No. of Units
– Range of SO2 removal
– Chimney Layout such as using existing chimney as wet stack, new wet stack with
single or multi flue cans, Chimney above absorber, and chimney material
– Choice of Corrosion protection lining in chimney, absorber and other sections of
FGD.
• Also, the cost may further come down in future due to increased number of
vendors/suppliers as the market matures.
FGD Base Cost specified by CEA
Capacity Group
(MW)
CAPEX
(Rs. Lakh/MW)
210 45
250
300 43.5
500 40.5
525
600 37
660
800 30
830
1This capex is “Base Cost” only with cost of new chimney and does not include Taxes -Duties and IDC

Benchmarking of capital cost for FGD- capital cost petitioned by
DISCOMs
• Cost estimates projected by the other generating
stations for installing FGD system are provided in
the Table
• CERC has considered the Capital Cost (CC) range
of Rs. 43- 75 lakh/MW for various CGS
• For Tiroda TPS, MERC has considered CC of Rs.
65 lakh/MW
• For Rosa plant, the petitioner has requested
approval of CC of Rs. 0.60 Crore/MW1
Cost specified by CSE
• CSE2 in its publication3 cited the cost of FGD as Rs.
50 to 60 lakh/MW.
Total Cost including Taxes and IDC
Sr.
No.
Name of
Generating Station
Installed
Capacity Estimated Cost Reference
1
Vindhyachal Super
Thermal Power
Station Stage V
500 MW Rs. 201.30
Crore
Rs. 0.40
Crore/MW
CERC Order dated
31.08.2016 in Petition
No. 234/GT/2015
2 Rosa Power Supply
Company Ltd. 1200 MW
Rs. 730.49
Crore
Rs. 0.60
Crore/MW
UPERC Order dated
16.01.2020 in Petition
No. 1465 of 2019
3 Maithon Power Ltd. 1050 MW Rs. 777.14
Crore
Rs. 0.74
Crore/MW
CERC Order dated
11.11.2019 in Petition
No. 152/MP/2019
4
Bongaigaon
Thermal Power
Station Unit 1
250 MW Rs. 108
Crore
Rs. 0.43
Crore/MW
CERC Order dated
22.05.2017 in Petition
No. 45/GT/2016
`5 Udupi Thermal
Power Station 1200 MW
Rs.899
Crore
Rs. 0.75
Crore/MW
CERC Order dated
20.11.2019 in Petition
No. 346/MP/2018
6
Adani Power
Maharashtra Ltd-
Tiroda TPS
3300 MW Rs. 2159
Crore
Rs. 0.65
Crore/MW
MERC Order dated
06.02.2019 in Case
No. 300 of 2018
7. Sasan Power
Limited 3960 MW
Rs. 2434
Crore
Rs. 0.615
Crore/ MW
CERC Order dated
23.04.2020 in Petition
No. 446/MP/2019
Total Cost in range of Rs 40-75 lakh/MW may be considered for evaluating DPRs by SERCs 1 The commission has not approved the capital cost because additional capital cost approval due to change in law can be considered only after compliance and prudence check as per UPERC Generation
Tariff Regulations 2019 2 Centre of Science and Environment 3. Released during the conference titled „New Environmental Norms: The Way Forward‟ held on 7 September 2016
96
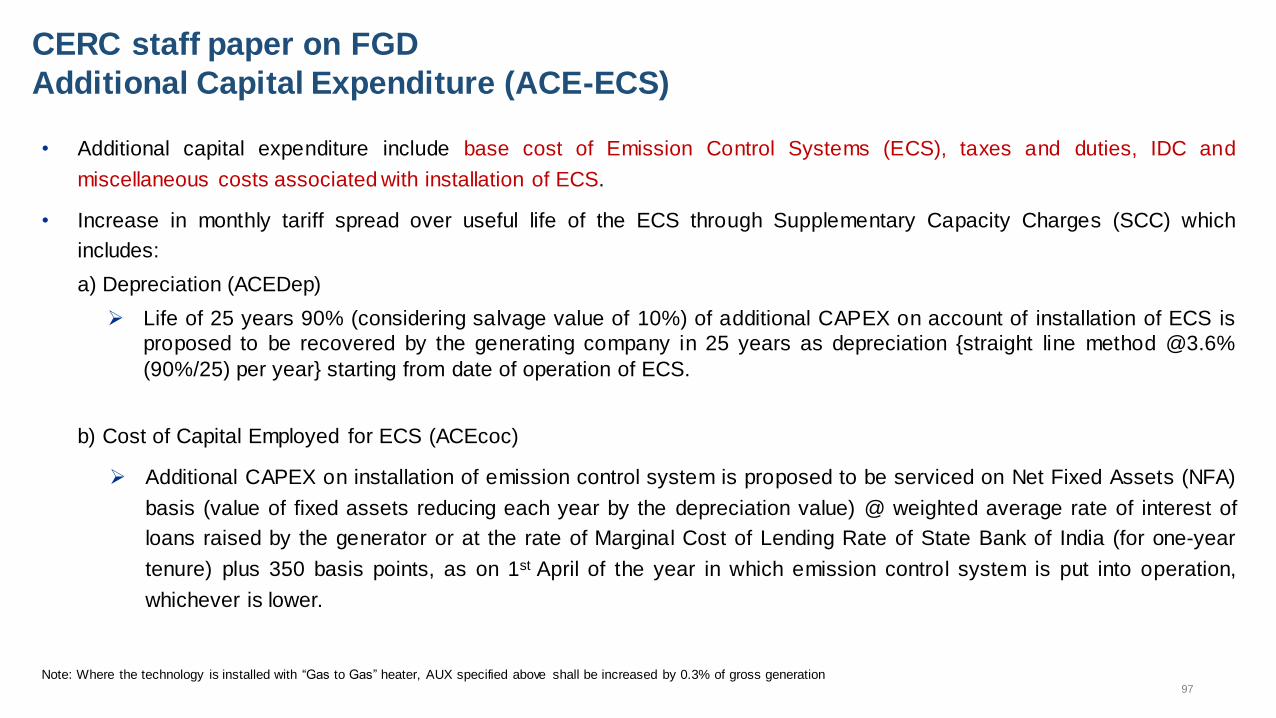
CERC staff paper on FGD
Additional Capital Expenditure (ACE-ECS)
• Additional capital expenditure include base cost of Emission Control Systems (ECS), taxes and duties, IDC and
miscellaneous costs associated with installation of ECS.
• Increase in monthly tariff spread over useful life of the ECS through Supplementary Capacity Charges (SCC) which
includes:
a) Depreciation (ACEDep)
Life of 25 years 90% (considering salvage value of 10%) of additional CAPEX on account of installation of ECS is
proposed to be recovered by the generating company in 25 years as depreciation {straight line method @3.6%
(90%/25) per year} starting from date of operation of ECS.
b) Cost of Capital Employed for ECS (ACEcoc)
Additional CAPEX on installation of emission control system is proposed to be serviced on Net Fixed Assets (NFA)
basis (value of fixed assets reducing each year by the depreciation value) @ weighted average rate of interest of
loans raised by the generator or at the rate of Marginal Cost of Lending Rate of State Bank of India (for one-year
tenure) plus 350 basis points, as on 1st April of the year in which emission control system is put into operation,
whichever is lower.
Note: Where the technology is installed with “Gas to Gas” heater, AUX specified above shall be increased by 0.3% of gross generation
97

CERC staff paper on FGD
Norms for O&M expenses & working capital
Additional O&M Expenses
• First year O&M expenses @2% of capital expenditure for installation of FGD (excluding IDC and FERV) admitted by the
Commission after prudence check.
• For subsequent years, the first year O&M expenses may be escalated @3.5% or any other escalation rate as may be
specified by the Commission
Additional Working Capital
• Working Capital may include:
i) Cost of limestone or reagent towards stock for 20 days corresponding to the normative annual plant availability factor
and advance payment for 30 days towards cost of reagent for generation corresponding to the normative annual plant
availability factor;
ii) Operation and maintenance expenses in respect of emission control system for one month and maintenance spares
@20% of operation and maintenance expenses in respect of emission control system; and
iii) Receivables equivalent to 45 days of supplementary capacity charge and supplementary energy charge for sale of
electricity calculated on the normative annual plant availability factor.
98
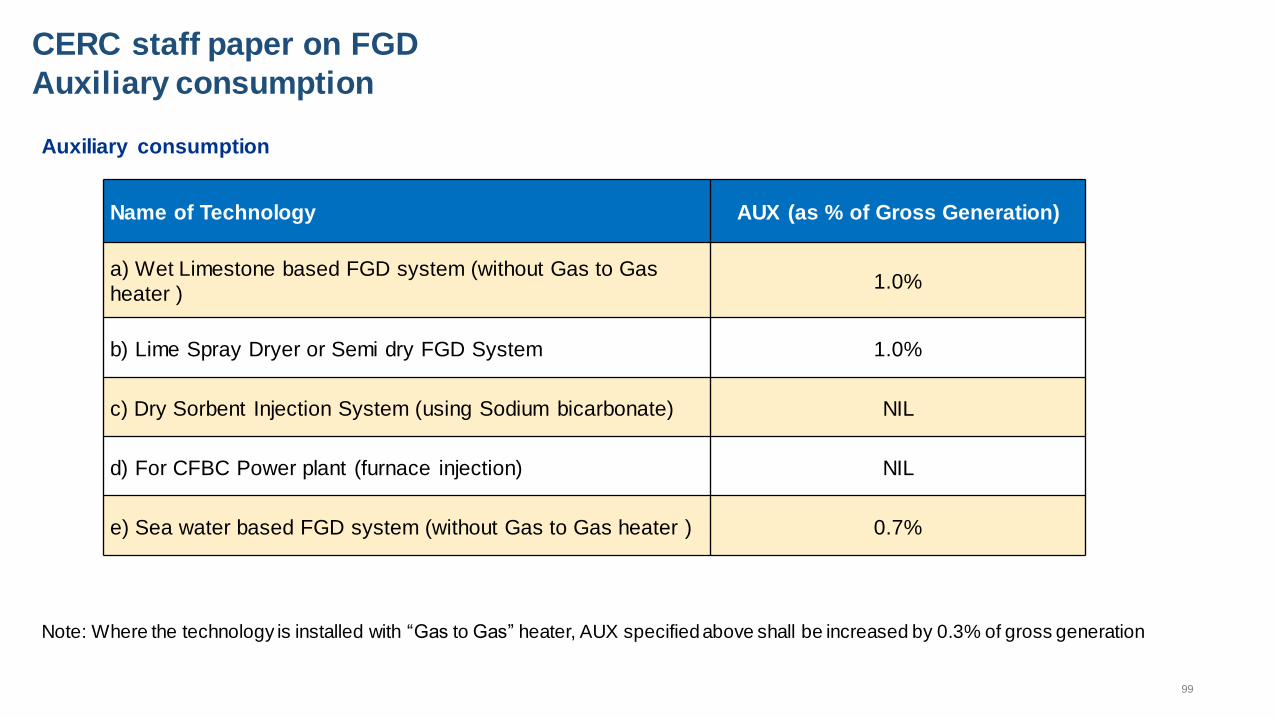
CERC staff paper on FGD
Auxiliary consumption
Auxiliary consumption
Note: Where the technology is installed with “Gas to Gas” heater, AUX specified above shall be increased by 0.3% of gross generation
Name of Technology AUX (as % of Gross Generation)
a) Wet Limestone based FGD system (without Gas to Gas
heater ) 1.0%
b) Lime Spray Dryer or Semi dry FGD System 1.0%
c) Dry Sorbent Injection System (using Sodium bicarbonate) NIL
d) For CFBC Power plant (furnace injection) NIL
e) Sea water based FGD system (without Gas to Gas heater ) 0.7%
99
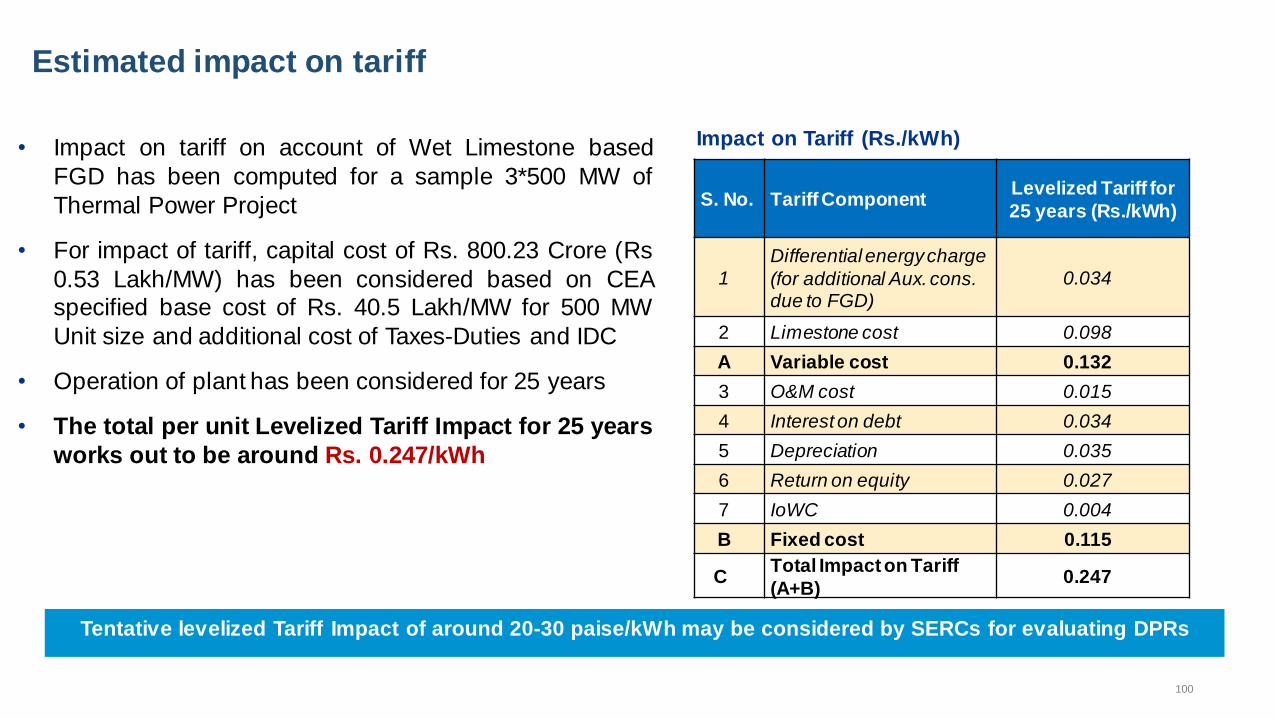
Estimated impact on tariff
• Impact on tariff on account of Wet Limestone based
FGD has been computed for a sample 3*500 MW of
Thermal Power Project
• For impact of tariff, capital cost of Rs. 800.23 Crore (Rs
0.53 Lakh/MW) has been considered based on CEA specified base cost of Rs. 40.5 Lakh/MW for 500 MW
Unit size and additional cost of Taxes-Duties and IDC
• Operation of plant has been considered for 25 years
• The total per unit Levelized Tariff Impact for 25 years
works out to be around Rs. 0.247/kWh
S. No. Tariff Component Levelized Tariff for
25 years (Rs./kWh)
1
Differential energy charge
(for additional Aux. cons. due to FGD)
0.034
2 Limestone cost 0.098
A Variable cost 0.132
3 O&M cost 0.015
4 Interest on debt 0.034
5 Depreciation 0.035
6 Return on equity 0.027
7 IoWC 0.004
B Fixed cost 0.115
C Total Impact on Tariff
(A+B) 0.247
Impact on Tariff (Rs./kWh)
Tentative levelized Tariff Impact of around 20-30 paise/kWh may be considered by SERCs for evaluating DPRs
100

Phasing of FGD as per CEA concept paper
• CEA, in its Paper on “Plant Location Specific Emission Standards”
has observed that there should be graded action plan for adopting
new emission norms for TPS rather than adopting a single
deadline for large base of power plants across the country
• CEA recommended that Phasing of FGD Installation should be
done based on Ambient Air Quality (AAQ) and SO2 Levels in that
location
• CEA proposed to implement FGD for the thermal power plants
region-wise as given in the table:
a) In areas where the development is high, the atmospheric air
quality is poor and is prone to serious atmospheric pollution
problems, strict control of emissions shall be required in such
key areas for TPS as categorised under Region 1.
b) In next phase may be after one year commissioning of 1st
phase units, observing the effectiveness of installed
equipment, to be implemented in the power plant which are
located under Region 2
c) Presently no action is required for power plant those are
situated under Region 3,4 & 5
Phasing of FGD Installation based on Ambient
Air Quality SO2 Levels
Region Ambient Air SO2
Levels Remarks
1 Level - I
(>40μg/m3)
FGD shall be installed
immediately
2
Level-II
(>30μg/m3 &≤40μg/m3)
FGD shall be installed
in 2nd phase
3
Level-III
(>20μg/m3 &≤30μg/m3)
FGD is not required at
present
4
Level-IV
(>10μg/m3 &≤20μg/m3)
FGD is not required at
present
`5 Level-V
(>0μg/m3 &≤10μg/m3)
FGD is not required at
present
Phasing of FGD may be considered as per Ambient Air Quality in vicinity of Power Plant
101
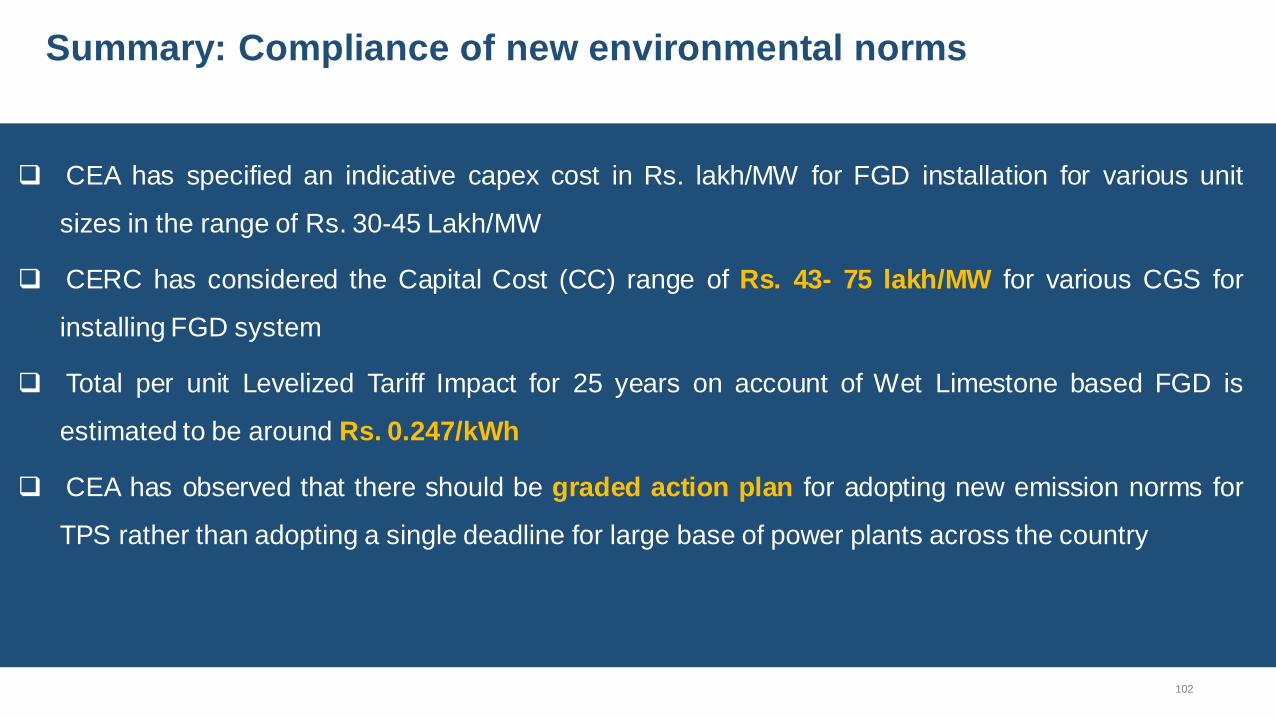
Summary: Compliance of new environmental norms
CEA has specified an indicative capex cost in Rs. lakh/MW for FGD installation for various unit
sizes in the range of Rs. 30-45 Lakh/MW
CERC has considered the Capital Cost (CC) range of Rs. 43- 75 lakh/MW for various CGS for
installing FGD system
Total per unit Levelized Tariff Impact for 25 years on account of Wet Limestone based FGD is
estimated to be around Rs. 0.247/kWh
CEA has observed that there should be graded action plan for adopting new emission norms for
TPS rather than adopting a single deadline for large base of power plants across the country
102

Cost optimization through
greater use of market
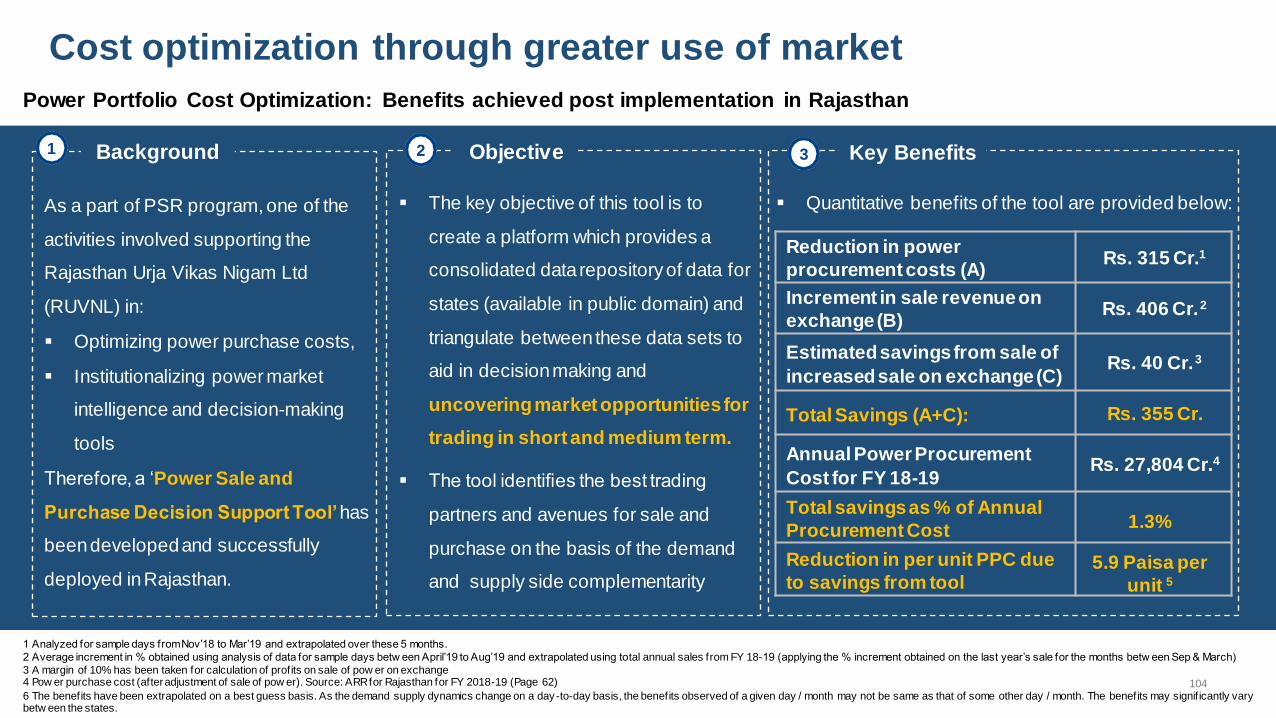
Cost optimization through greater use of market
Background
As a part of PSR program, one of the
activities involved supporting the
Rajasthan Urja Vikas Nigam Ltd
(RUVNL) in:
Optimizing power purchase costs,
Institutionalizing power market
intelligence and decision-making
tools
Therefore, a „Power Sale and
Purchase Decision Support Tool’ has
been developed and successfully
deployed in Rajasthan.
Objective Key Benefits
The key objective of this tool is to
create a platform which provides a
consolidated data repository of data for
states (available in public domain) and
triangulate between these data sets to
aid in decision making and
uncovering market opportunities for
trading in short and medium term.
The tool identifies the best trading
partners and avenues for sale and
purchase on the basis of the demand
and supply side complementarity
1 2 3
Reduction in power
procurement costs (A) Rs. 315 Cr.1
Increment in sale revenue on
exchange (B) Rs. 406 Cr. 2
Estimated savings from sale of
increased sale on exchange (C) Rs. 40 Cr. 3
Total Savings (A+C): Rs. 355 Cr.
Annual Power Procurement
Cost for FY 18-19 Rs. 27,804 Cr.4
Total savings as % of Annual
Procurement Cost 1.3%
Reduction in per unit PPC due
to savings from tool 5.9 Paisa per
unit 5
1 Analyzed for sample days from Nov‟18 to Mar‟19 and extrapolated over these 5 months. 2 Average increment in % obtained using analysis of data for sample days betw een April‟19 to Aug‟19 and extrapolated using total annual sales from FY 18-19 (applying the % increment obtained on the last year‟s sale for the months betw een Sep & March) 3 A margin of 10% has been taken for calculation of profits on sale of pow er on exchange 4 Pow er purchase cost (after adjustment of sale of pow er). Source: ARR for Rajasthan for FY 2018-19 (Page 62)
6 The benefits have been extrapolated on a best guess basis. As the demand supply dynamics change on a day-to-day basis, the benefits observed of a given day / month may not be same as that of some other day / month. The benefits may signif icantly vary betw een the states.
Quantitative benefits of the tool are provided below:
Power Portfolio Cost Optimization: Benefits achieved post implementation in Rajasthan
104
Conclusion
Power purchase cost
o PPC accounts for ~67% to 78% of the total ACoS.
o Share of PPC in ACoS has reduced over the last 4 years, mainly due to increase in contribution of other cost components (such as O&M, interest & finance, depreciation, etc.)
o Fixed charges contribute around 25-40% whereas energy charges contribute around 60-70% to the overall PPC
Coal prices
o Coal price accounts for around 25% of landed cost of
fuel.
o Coal prices (in last 4 yrs.) were about 28%1 higher as compared to the price based on WPI and wt. avg. of
WPI and CPI.
Railway freight
o Rail freight accounts for ~40% of landed cost of fuel
o Railway freight (in last 4 yrs.) was about ~30%2 higher as compared to freight based on WPI and wt. avg. of WPI and CPI.
Clean Energy Cess
o Clean energy cess has increased from Rs. 50/Tonne
in 2010 to Rs. 400/Tonne in 2016.
o Reduction of clean energy cess by Rs 50/MT may reduce the ACoS by around 3 paise per unit
Change in GCV
o Every 100 kcal/kg loss in GCV results in ~3%
increase in energy charges
1 Actual coal prices compared to coal prices based on WPI and wt. avg. of WPI & CPI during Jan‟ 2018 2 Actual railway freight compared to freight based on WPI and wt. avg. of WPI & CPI during Nov‟ 2018
105
Conclusion
Depreciation
o Depreciation (for G, T & D utilities) accounted for
6% of the total ARR in FY 2020-21 for 12 states.
o Reduction of depreciation rate to 4.67% and 4.34% may reduce ACoS by Rs. 0.08kWh (1.2%)
and Rs. 0.10kWh (1.4%) respectively
ROE
o ROE (for G, T & D utilities) accounted for 5% of the
total ARR in FY 2020-21 for 12 states.
o Reduction of approved rate of ROE to 14% and 12% may reduce ACoS by Rs. Rs. 0.02/kWh (0.4%) and
0.07/kWh (1.0%) respectively
Distribution loss
o Approved distribution losses accounted for ~8% -
21% of ACoS for 12 states for FY 2020-21.
o Reduction of approved Distribution losses to 12% would reduce ACoS by Rs. 0.00-0.66/kWh (3%).
Transmission charges
o Inter-state transmission capacity has increased based
on projected demand.
o Inter-state transmission charges have increased @ CAGR of 17% in last 10 years
o Competitive bidding has resulted in ~ 45-50% reduction in transmission charges
Other factors
o Retiring of inefficient old thermal power plants (>30 years old) may reduce energy charges by 4-23%,
o Fixed cost paid for surplus power for 12 states is about Rs 16 thousand crores varying in the range of 1-13% of the total ARR.
o The total per unit levelized tariff impact for 25 years due to FGD installation is estimated to be around Rs. 0.247/kWh
106

Thank You
Contact Details
Udit Mathur Energy Adviser
Foreign, Commonwealth & Development Office [email protected]
Anish De Programme Director - Power Sector Reforms Programme
KPMG India [email protected]
https://psrindia.com/ https://twitter.com/psr_india www.facebook.com/PSR-India-122338261759998/
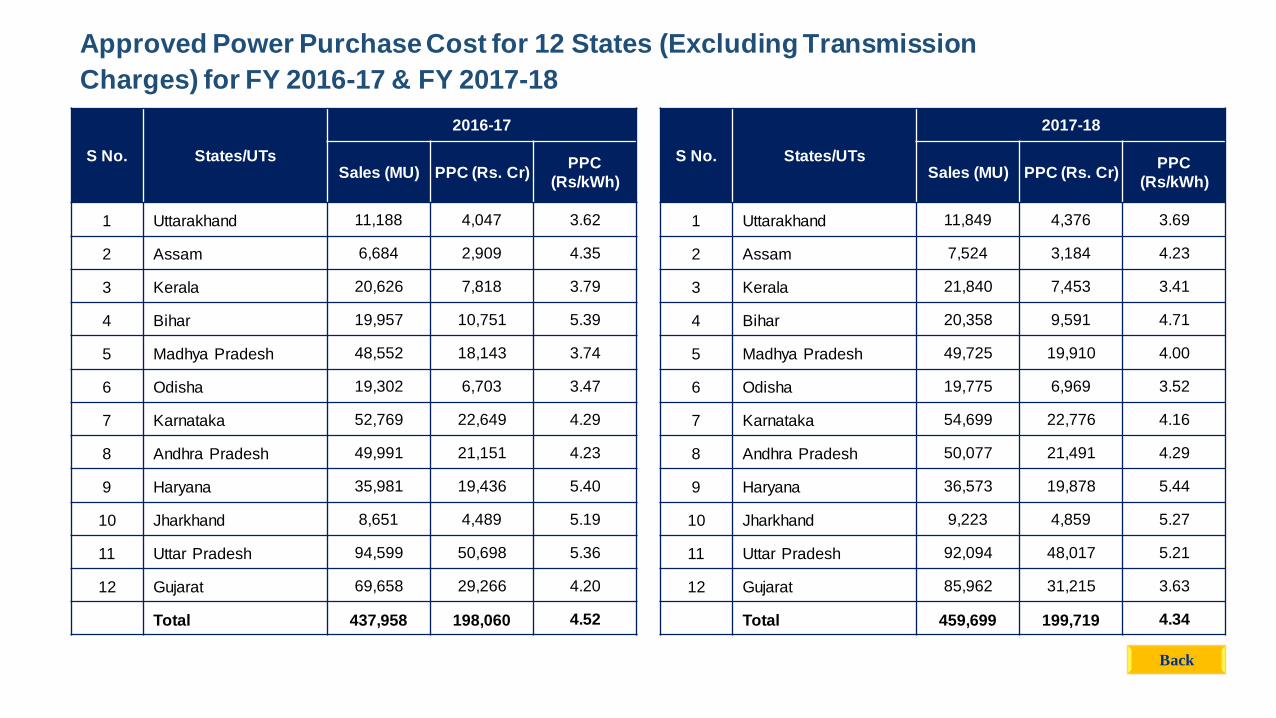
Approved Power Purchase Cost for 12 States (Excluding Transmission
Charges) for FY 2016-17 & FY 2017-18
Back
S No. States/UTs
2016-17
Sales (MU) PPC (Rs. Cr) PPC
(Rs/kWh)
1 Uttarakhand 11,188 4,047 3.62
2 Assam 6,684 2,909 4.35
3 Kerala 20,626 7,818 3.79
4 Bihar 19,957 10,751 5.39
5 Madhya Pradesh 48,552 18,143 3.74
6 Odisha 19,302 6,703 3.47
7 Karnataka 52,769 22,649 4.29
8 Andhra Pradesh 49,991 21,151 4.23
9 Haryana 35,981 19,436 5.40
10 Jharkhand 8,651 4,489 5.19
11 Uttar Pradesh 94,599 50,698 5.36
12 Gujarat 69,658 29,266 4.20
Total 437,958 198,060 4.52
S No. States/UTs
2017-18
Sales (MU) PPC (Rs. Cr) PPC
(Rs/kWh)
1 Uttarakhand 11,849 4,376 3.69
2 Assam 7,524 3,184 4.23
3 Kerala 21,840 7,453 3.41
4 Bihar 20,358 9,591 4.71
5 Madhya Pradesh 49,725 19,910 4.00
6 Odisha 19,775 6,969 3.52
7 Karnataka 54,699 22,776 4.16
8 Andhra Pradesh 50,077 21,491 4.29
9 Haryana 36,573 19,878 5.44
10 Jharkhand 9,223 4,859 5.27
11 Uttar Pradesh 92,094 48,017 5.21
12 Gujarat 85,962 31,215 3.63
Total 459,699 199,719 4.34
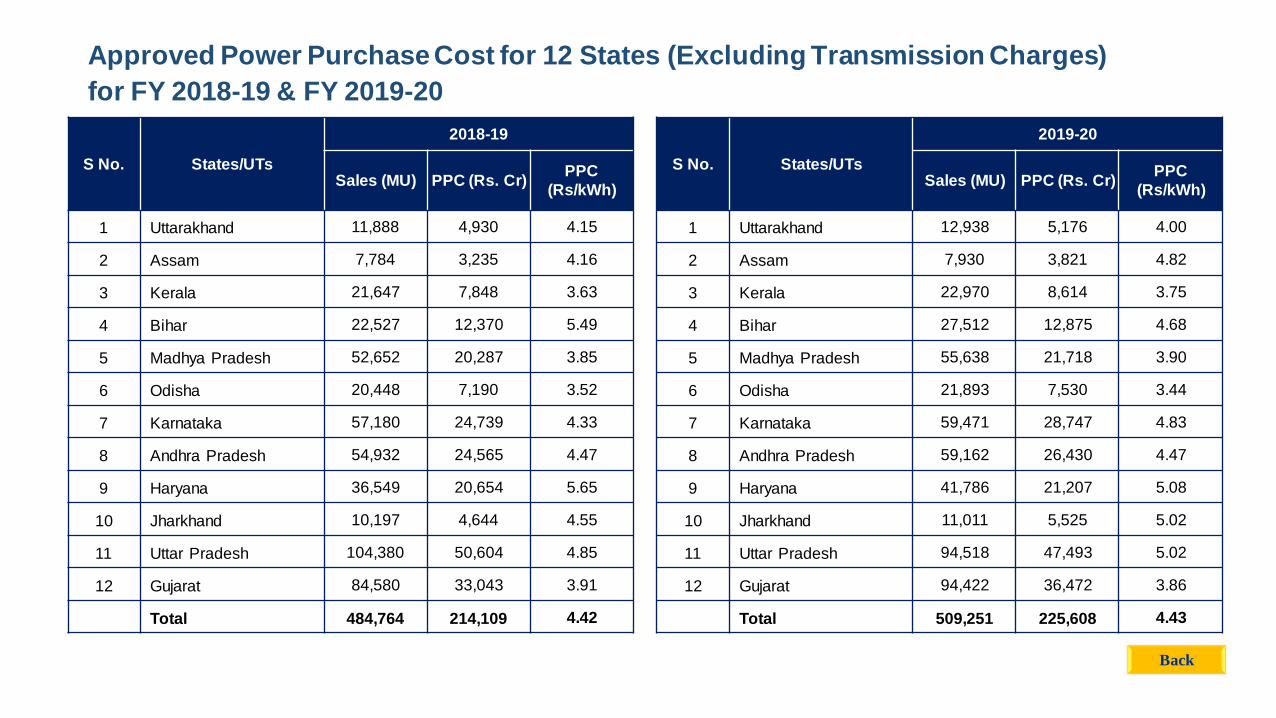
Approved Power Purchase Cost for 12 States (Excluding Transmission Charges)
for FY 2018-19 & FY 2019-20
S No. States/UTs
2018-19
Sales (MU) PPC (Rs. Cr) PPC
(Rs/kWh)
1 Uttarakhand 11,888 4,930 4.15
2 Assam 7,784 3,235 4.16
3 Kerala 21,647 7,848 3.63
4 Bihar 22,527 12,370 5.49
5 Madhya Pradesh 52,652 20,287 3.85
6 Odisha 20,448 7,190 3.52
7 Karnataka 57,180 24,739 4.33
8 Andhra Pradesh 54,932 24,565 4.47
9 Haryana 36,549 20,654 5.65
10 Jharkhand 10,197 4,644 4.55
11 Uttar Pradesh 104,380 50,604 4.85
12 Gujarat 84,580 33,043 3.91
Total 484,764 214,109 4.42
S No. States/UTs
2019-20
Sales (MU) PPC (Rs. Cr) PPC
(Rs/kWh)
1 Uttarakhand 12,938 5,176 4.00
2 Assam 7,930 3,821 4.82
3 Kerala 22,970 8,614 3.75
4 Bihar 27,512 12,875 4.68
5 Madhya Pradesh 55,638 21,718 3.90
6 Odisha 21,893 7,530 3.44
7 Karnataka 59,471 28,747 4.83
8 Andhra Pradesh 59,162 26,430 4.47
9 Haryana 41,786 21,207 5.08
10 Jharkhand 11,011 5,525 5.02
11 Uttar Pradesh 94,518 47,493 5.02
12 Gujarat 94,422 36,472 3.86
Total 509,251 225,608 4.43
Back

Estimation of national average power purchase cost data-CERC
State Data Sources for APPC estimation for FY2019-20 by CERC
Source of data for
analysis of key factors
impacting tariff
J&K No details available
PPC and transmission
charges from retail tariff
order for FY 2019-20.
Arunachal
Pradesh Tariff Order for FY 2018-19
Bihar PPC for FY2019-20 from APR order for FY 2019-20
Jharkhand*
Power Purchase and Cost for FY2019-20 from APR Order for FY 2019-20 have been considered for
JBVNL , TSL, TSUISL and DVC. For SAIL Bokaro, PPC for FY2019-20 has been considered from
MYT Order for FY 2016-17 – FY 2020-21.
Meghalaya PPC for FY2019-20 from MYT Order for Control Period FY 2018-19 to FY 2020-21
Nagaland PPC for FY2019-20 from Order on review for the FY 2019-20 (20th March 2020)
Tamil Nadu PPC for FY2018-19 from Order on Determination of Tariff for Generation and Distribution (11th
August 2017)
Telangana PPC for FY2018-19 from Tariff Order for FY 2018-19 (27th March 2018)
Tripura PPC for FY2019-20 from Order on ARR for FY 2016-17 – FY 2020-21 (1st Sep 2020)
West Bengal PPC from Tariff Orders of FY 2017-18
*For the state of Jharkhand, only JBVNL has been considered for the PPC computation.

127.7
51.4
174.0
100.4
159.3
385.7
400 kV D/C Suratgarh TPS- Babai (Quad Moose),Rajasthan, 480 km
400 kV D/C Ramgarh-Bhadla, Rajasthan, 320 km
LILO of one ckt. of 400kV D/C Akal- Jodhpur(New), Rajasthan, 20 km
132 kV S/C Srinagar-Simli Line, Uttarakhand, 65 km
LILO of 220kV S/C Sikar (220kV GSS) - Dhod,Rajasthan, 20 km
220 kV D/C overhead line from 220 kV GSS Basnito 220 kV GSS NPH, Rajasthan, 6 km
Capital Cost for intra-state transmission lines per ckt. km (in Rs. Lakh)
191.3
147.87
108.1
164.0
400 kV D/C Silchar-Melriat line,Assam and Mizoram, 286 km
400 kV D/C Raghunathpur-RanchiQuad Moose line, WB & Jharkhand,
147 km
LILO of 132 kV S/C Aizawl-Zemabawk Line, Mizoram, 9.1 km
132 kV D/C Melriat (New) – Sihhmui line, Mizoram, 12.3 km
Capital Cost for inter-state transmission lines per ckt. km (in Rs. Lakh)
Transmission charges Hypothesis: Inter-state transmission charges have increased disproportionately as compared to
intra-state transmission charges
Capital costs per ckt. Km for inter-state and intra-state transmission lines
Capital costs per ckt. Km depends on the scope of transmission project (number of substations, transformation capacity, etc.) .
*Source: Respective transmission tariff orders
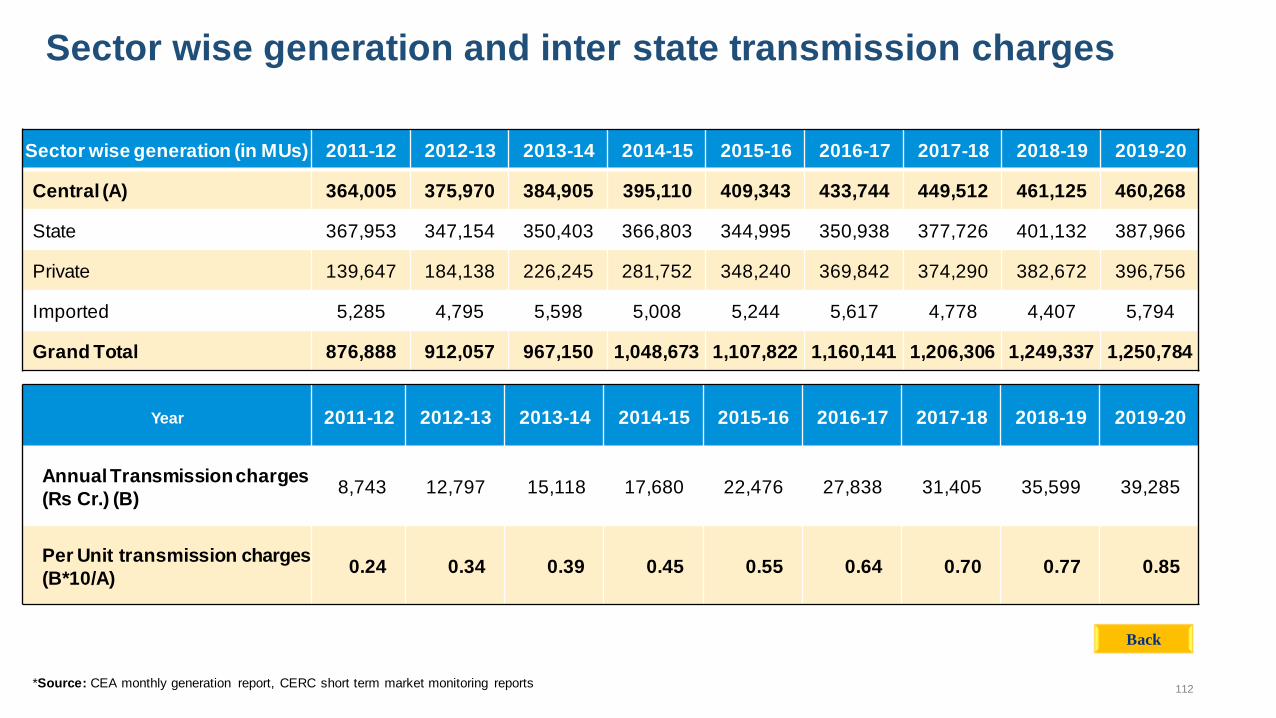
112
Sector wise generation and inter state transmission charges
*Source: CEA monthly generation report, CERC short term market monitoring reports
Sector wise generation (in MUs) 2011-12 2012-13 2013-14 2014-15 2015-16 2016-17 2017-18 2018-19 2019-20
Central (A) 364,005 375,970 384,905 395,110 409,343 433,744 449,512 461,125 460,268
State 367,953 347,154 350,403 366,803 344,995 350,938 377,726 401,132 387,966
Private 139,647 184,138 226,245 281,752 348,240 369,842 374,290 382,672 396,756
Imported 5,285 4,795 5,598 5,008 5,244 5,617 4,778 4,407 5,794
Grand Total 876,888 912,057 967,150 1,048,673 1,107,822 1,160,141 1,206,306 1,249,337 1,250,784
Year 2011-12 2012-13 2013-14 2014-15 2015-16 2016-17 2017-18 2018-19 2019-20
Annual Transmission charges
(Rs Cr.) (B) 8,743 12,797 15,118 17,680 22,476 27,838 31,405 35,599 39,285
Per Unit transmission charges
(B*10/A) 0.24 0.34 0.39 0.45 0.55 0.64 0.70 0.77 0.85
Back
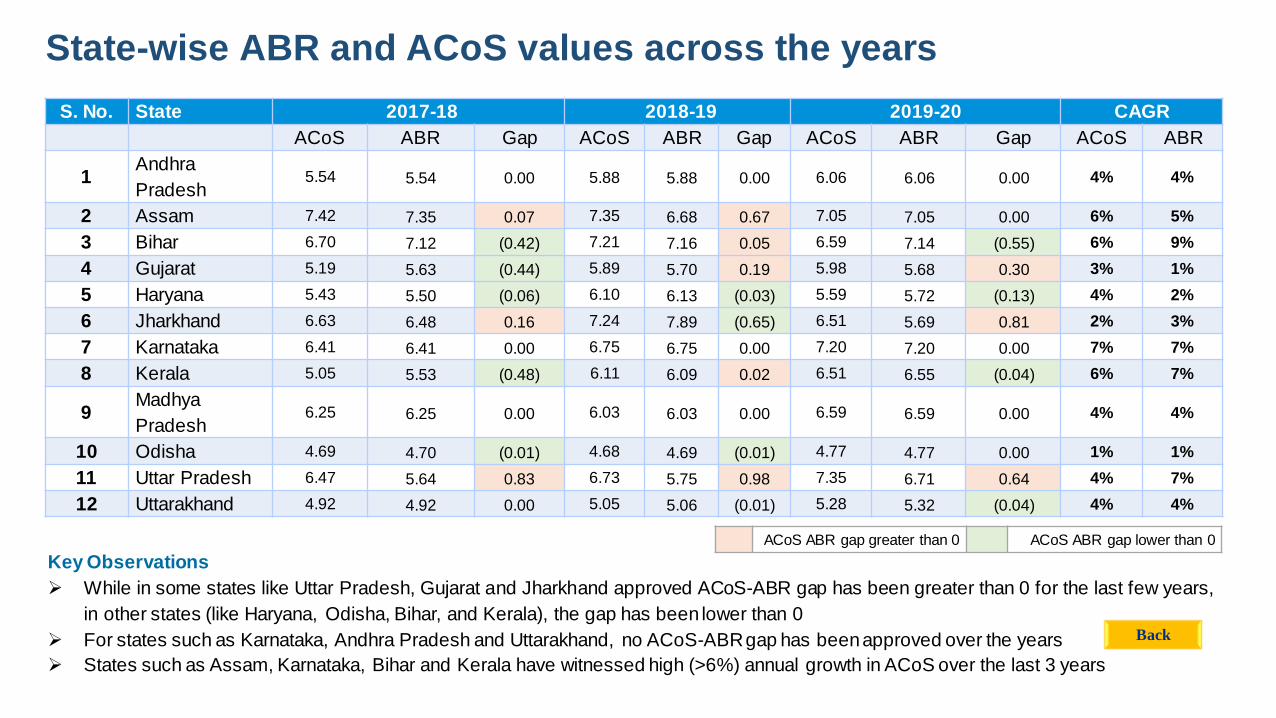
S. No. State 2017-18 2018-19 2019-20 CAGR
ACoS ABR Gap ACoS ABR Gap ACoS ABR Gap ACoS ABR
1 Andhra
Pradesh 5.54 5.54 0.00 5.88 5.88 0.00 6.06 6.06 0.00 4% 4%
2 Assam 7.42 7.35 0.07 7.35 6.68 0.67 7.05 7.05 0.00 6% 5%
3 Bihar 6.70 7.12 (0.42) 7.21 7.16 0.05 6.59 7.14 (0.55) 6% 9%
4 Gujarat 5.19 5.63 (0.44) 5.89 5.70 0.19 5.98 5.68 0.30 3% 1%
5 Haryana 5.43 5.50 (0.06) 6.10 6.13 (0.03) 5.59 5.72 (0.13) 4% 2%
6 Jharkhand 6.63 6.48 0.16 7.24 7.89 (0.65) 6.51 5.69 0.81 2% 3%
7 Karnataka 6.41 6.41 0.00 6.75 6.75 0.00 7.20 7.20 0.00 7% 7%
8 Kerala 5.05 5.53 (0.48) 6.11 6.09 0.02 6.51 6.55 (0.04) 6% 7%
9 Madhya
Pradesh 6.25 6.25 0.00 6.03 6.03 0.00 6.59 6.59 0.00 4% 4%
10 Odisha 4.69 4.70 (0.01) 4.68 4.69 (0.01) 4.77 4.77 0.00 1% 1%
11 Uttar Pradesh 6.47 5.64 0.83 6.73 5.75 0.98 7.35 6.71 0.64 4% 7%
12 Uttarakhand 4.92 4.92 0.00 5.05 5.06 (0.01) 5.28 5.32 (0.04) 4% 4%
Key Observations
While in some states like Uttar Pradesh, Gujarat and Jharkhand approved ACoS-ABR gap has been greater than 0 for the last few years,
in other states (like Haryana, Odisha, Bihar, and Kerala), the gap has been lower than 0
For states such as Karnataka, Andhra Pradesh and Uttarakhand, no ACoS-ABR gap has been approved over the years
States such as Assam, Karnataka, Bihar and Kerala have witnessed high (>6%) annual growth in ACoS over the last 3 years
ACoS ABR gap greater than 0 ACoS ABR gap lower than 0
State-wise ABR and ACoS values across the years
Back

S.
No. State DISCOMs
Intra-state transmission
licensees State GENCOs Center GENCOs
FY ROE(%) ROE (in Rs.
Crore) FY ROE(%)
ROE
(in Rs.
Crore)
FY ROE(%) ROE (in
Rs. Crore) FY ROE(%)
ROE (in
Rs.
Crore)
1 Uttarakhand 2020-21 16.50% 115 2020-21 15.50% 39 2020-21 16% 99 2018-19 15.50% 147
2 Assam 2020-21 16.00% 26 2020-21 15.50% 15 2020-21 16% 44 2018-19 15.50% 159
3 Kerala 2020-21 14.00% 254 2020-21 14.00% 120 2020-21 14% 116 2018-19 15.50% 127
4 Bihar 2020-21 15.50% 460 2020-21 15.50% 338 2018-19 14% 245 2018-19 15.50% 273
5 Madhya Pradesh 2019-20 16.00% 787 2018-19 15.50% 388 2015-16 16% 653 2018-19 15.50% 785
6 Odisha 2020-21 16.00% 36 2019-20 15.50% 106 2019-20 16% 151 2018-19 15.50% -
7 Karnataka 2019-20 15.50% 366 2020-21 15.50% 843 2018-19 16% 31 2018-19 15.50% 615
8 Andhra Pradesh 2020-21 13.23% 1,205 2020-21 14.00% 880 2020-21 12% 586 2018-19 15.50% -
9 Haryana 2020-21 0.00% - 2020-21 0.00% - 2018-19 10% 211 2018-19 15.50% 299
10 Jharkhand 2020-21 15.50% 322 2020-21 15.50% 92 2020-21 16% 3 2018-19 15.50% 314
11 Uttar Pradesh 2019-20 16% 1,851 2020-21 2.00% 162 2018-19 16% 653 2018-19 15.50% 975
12 Gujarat 2020-21 14.00% 1,589 2020-21 14.00% 1,013 2020-21 14% 152 2018-19 15.50% 674
Back
State-wise rate of ROE and approved ROE

S. No. State DISCOMs
Intra-state
transmission
licensees
State GENCOs Central GENCOs
FY Dep (In Rs
Crores) FY
Dep (In Rs
Crores) FY
Dep (In Rs
Crores) FY
Dep (In Rs
Crores)
1 Uttarakhand 2020-21 167 2020-21 85 2020-21 167 2018-19 93
2 Assam 2020-21 24 2020-21 9 2020-21 42 2018-19 66
3 Kerala 2020-21 122 2020-21 223 2020-21 174 2018-19 34
4 Bihar 2020-21 386 2020-21 330 2018-19 299 2018-19
124
5 Madhya Pradesh 2019-20 426 2018-19 346 2016-17 797 2018-19
613
6 Odisha 2020-21 249 2019-20 162 2019-20 64 2018-19 -
7 Karnataka 2019-20 1,192 2020-21 840 2018-19 - 2018-19 513
8 Andhra Pradesh 2020-21 1,089 2020-21 623 2020-21 168 2018-19 -
9 Haryana 2020-21 651 2020-21 425 2018-19 368 2018-19 150
10 Jharkhand 2020-21 411 2020-21 266 2020-21 2 2018-19 365
11 Uttar Pradesh 2019-20 1,779 2020-21 989 2018-19 472 2018-19 524
12 Gujarat 2020-21 1,951 2020-21 1,356 2020-21 1,313 2018-19 513
Back
State-wise approved depreciation costs
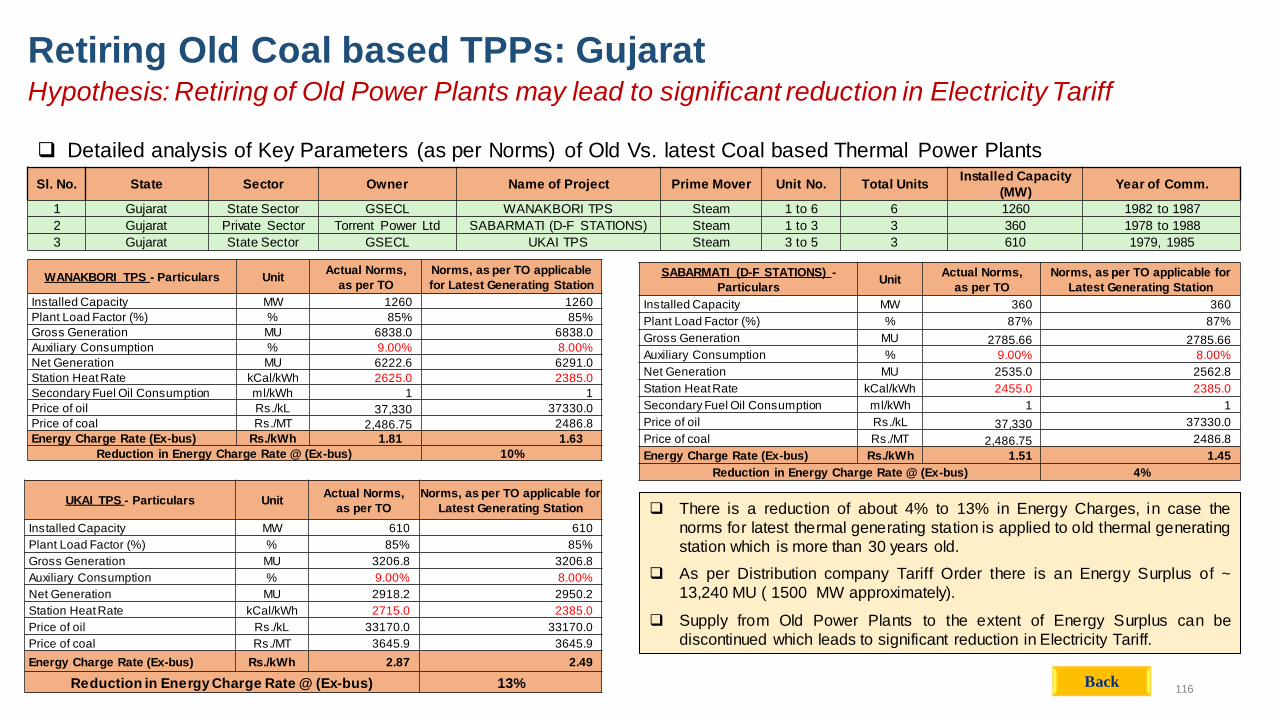
116
Retiring Old Coal based TPPs: Gujarat Hypothesis: Retiring of Old Power Plants may lead to significant reduction in Electricity Tariff
Detailed analysis of Key Parameters (as per Norms) of Old Vs. latest Coal based Thermal Power Plants
Sl. No. State Sector Owner Name of Project Prime Mover Unit No. Total Units Installed Capacity
(MW) Year of Comm.
1 Gujarat State Sector GSECL WANAKBORI TPS Steam 1 to 6 6 1260 1982 to 1987
2 Gujarat Private Sector Torrent Power Ltd SABARMATI (D-F STATIONS) Steam 1 to 3 3 360 1978 to 1988
3 Gujarat State Sector GSECL UKAI TPS Steam 3 to 5 3 610 1979, 1985
WANAKBORI TPS - Particulars Unit Actual Norms,
as per TO
Norms, as per TO applicable
for Latest Generating Station
Installed Capacity MW 1260 1260
Plant Load Factor (%) % 85% 85%
Gross Generation MU 6838.0 6838.0
Auxiliary Consumption % 9.00% 8.00%
Net Generation MU 6222.6 6291.0
Station Heat Rate kCal/kWh 2625.0 2385.0
Secondary Fuel Oil Consumption ml/kWh 1 1
Price of oil Rs./kL 37,330 37330.0
Price of coal Rs./MT 2,486.75 2486.8
Energy Charge Rate (Ex-bus) Rs./kWh 1.81 1.63
Reduction in Energy Charge Rate @ (Ex-bus) 10%
SABARMATI (D-F STATIONS) -
Particulars Unit
Actual Norms,
as per TO
Norms, as per TO applicable for
Latest Generating Station
Installed Capacity MW 360 360
Plant Load Factor (%) % 87% 87%
Gross Generation MU 2785.66 2785.66
Auxiliary Consumption % 9.00% 8.00%
Net Generation MU 2535.0 2562.8
Station Heat Rate kCal/kWh 2455.0 2385.0
Secondary Fuel Oil Consumption ml/kWh 1 1
Price of oil Rs./kL 37,330 37330.0
Price of coal Rs./MT 2,486.75 2486.8
Energy Charge Rate (Ex-bus) Rs./kWh 1.51 1.45
Reduction in Energy Charge Rate @ (Ex-bus) 4%
UKAI TPS - Particulars Unit Actual Norms,
as per TO
Norms, as per TO applicable for
Latest Generating Station
Installed Capacity MW 610 610
Plant Load Factor (%) % 85% 85%
Gross Generation MU 3206.8 3206.8
Auxiliary Consumption % 9.00% 8.00%
Net Generation MU 2918.2 2950.2
Station Heat Rate kCal/kWh 2715.0 2385.0
Price of oil Rs./kL 33170.0 33170.0
Price of coal Rs./MT 3645.9 3645.9
Energy Charge Rate (Ex-bus) Rs./kWh 2.87 2.49
Reduction in Energy Charge Rate @ (Ex-bus) 13%
There is a reduction of about 4% to 13% in Energy Charges, in case the
norms for latest thermal generating station is applied to old thermal generating
station which is more than 30 years old.
As per Distribution company Tariff Order there is an Energy Surplus of ~
13,240 MU ( 1500 MW approximately).
Supply from Old Power Plants to the extent of Energy Surplus can be
discontinued which leads to significant reduction in Electricity Tariff.
Back
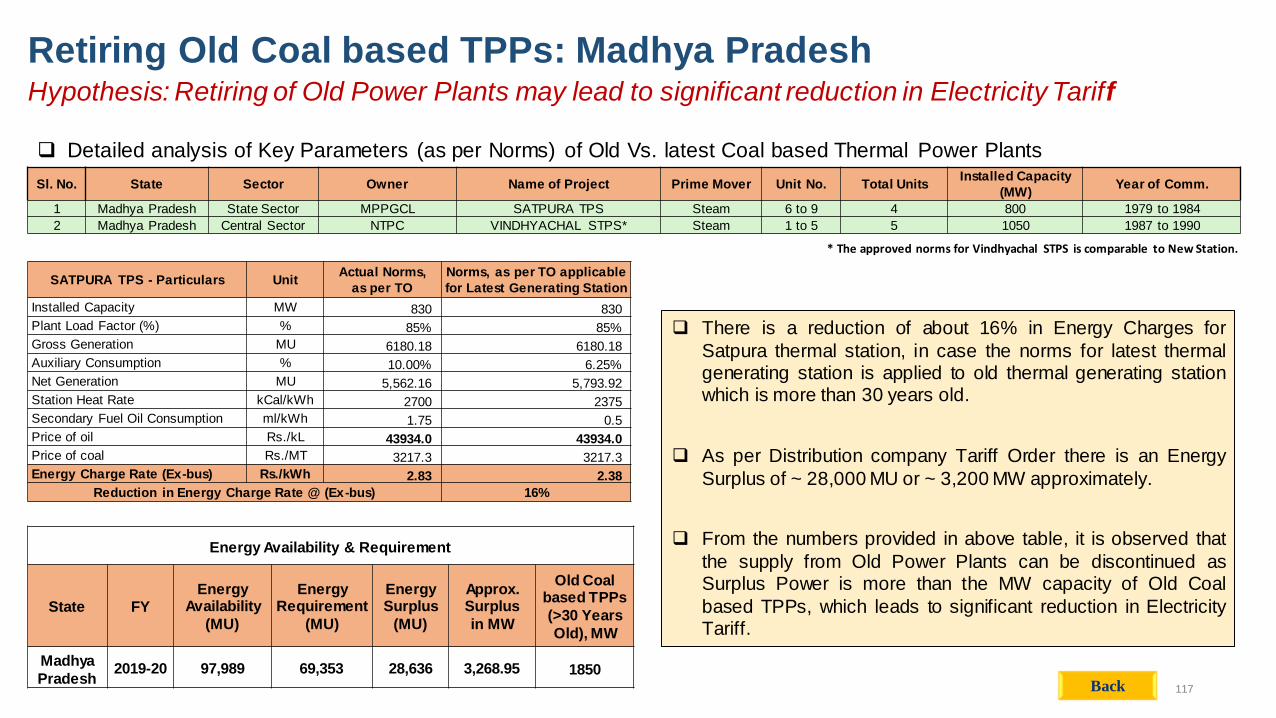
117
Retiring Old Coal based TPPs: Madhya Pradesh Hypothesis: Retiring of Old Power Plants may lead to significant reduction in Electricity Tariff
Detailed analysis of Key Parameters (as per Norms) of Old Vs. latest Coal based Thermal Power Plants
Sl. No. State Sector Owner Name of Project Prime Mover Unit No. Total Units Installed Capacity
(MW) Year of Comm.
1 Madhya Pradesh State Sector MPPGCL SATPURA TPS Steam 6 to 9 4 800 1979 to 1984
2 Madhya Pradesh Central Sector NTPC VINDHYACHAL STPS* Steam 1 to 5 5 1050 1987 to 1990
SATPURA TPS - Particulars Unit Actual Norms,
as per TO
Norms, as per TO applicable
for Latest Generating Station
Installed Capacity MW 830 830
Plant Load Factor (%) % 85% 85%
Gross Generation MU 6180.18 6180.18
Auxiliary Consumption % 10.00% 6.25%
Net Generation MU 5,562.16 5,793.92
Station Heat Rate kCal/kWh 2700 2375
Secondary Fuel Oil Consumption ml/kWh 1.75 0.5
Price of oil Rs./kL 43934.0 43934.0
Price of coal Rs./MT 3217.3 3217.3
Energy Charge Rate (Ex-bus) Rs./kWh 2.83 2.38
Reduction in Energy Charge Rate @ (Ex-bus) 16%
Energy Availability & Requirement
State FY
Energy Availability
(MU)
Energy Requirement
(MU)
Energy Surplus
(MU)
Approx. Surplus
in MW
Old Coal based TPPs
(>30 Years
Old), MW
Madhya
Pradesh 2019-20 97,989 69,353 28,636 3,268.95 1850
* The approved norms for Vindhyachal STPS is comparable to New Station.
There is a reduction of about 16% in Energy Charges for
Satpura thermal station, in case the norms for latest thermal generating station is applied to old thermal generating station which is more than 30 years old.
As per Distribution company Tariff Order there is an Energy
Surplus of ~ 28,000 MU or ~ 3,200 MW approximately.
From the numbers provided in above table, it is observed that
the supply from Old Power Plants can be discontinued as Surplus Power is more than the MW capacity of Old Coal
based TPPs, which leads to significant reduction in Electricity Tariff.
Back

118
Retiring Old Coal based TPPs: Bihar Hypothesis: Retiring of Old Power Plants may lead to significant reduction in Electricity Tariff
Detailed analysis of Key Parameters (as per Norms) of Old Vs. latest Coal based Thermal Power Plants
Sl. No. State Sector Owner Name of Project Prime Mover Unit No. Total Units Installed Capacity
(MW) Year of Comm.
1 Bihar Central Sector NTPC BARAUNI TPS* Steam 6 & 7 2 210 1983
2 Bihar Central Sector KBUNL MUZAFFARPUR TPS Steam 1 & 2 2 220 1985
MUZAFFARPUR TPS
- Particulars Unit
Actual Norms,
as per TO
Norms, as per TO applicable
for Latest Generating Station
Installed Capacity MW 220 220
Plant Load Factor (%) % 85% 85%
Gross Generation MU 1638.12 1638.12
Auxiliary Consumption % 12.00% 9.00%
Net Generation MU 1,441.55 1,490.69
Station Heat Rate kCal/kWh 3000 2430
Secondary Fuel Oil Consumption ml/kWh 1 0.5
Price of oil Rs./kL 78122.76 78122.76
Price of coal Rs./MT 4,331.63 4,331.63
Energy Charge Rate (Ex-bus) Rs./kWh 3.82 2.99
Reduction in Energy Charge Rate @ (Ex-bus) 22%
* Tariff Oder is not available in public domain because these tw o units (6 & 7) are temporarily shutdow n for R&M since 2015-16.
Energy Availability & Requirement
State FY
Energy Availability
(MU)
Energy Requirement
(MU)
Energy Surplus
(MU)
Approx. Surplus
in MW
Old Coal based TPPs
(>30 Years
Old), MW
Bihar 2020-21 32,384 31,893 491 56.03 430
There is a reduction of about 22% in the Energy Charges, in
case the norms for latest thermal generating station is applied to old thermal generating station which is more than 30 years old.
There is very less gap between Energy Availability and
Requirement, almost all the available Energy is utilized by the State Discom. Retiring Old coal based TPPs in Bihar will have to be replaced with new capacity.
Back

119
Retiring Old Coal based TPPs: Odisha Hypothesis: Retiring of Old Power Plants may lead to significant reduction in Electricity Tariff
Detailed analysis of Key Parameters (as per Norms) of Old Vs. latest Coal based Thermal Power Plants
Sl. No. State Sector Owner Name of Project Prime Mover Unit No. Total Units Installed Capacity
(MW) Year of Comm.
1 Odisha Central Sector NTPC TALCHER (OLD) TPS Steam 1 to 6 6 460 1967 to 1983
TALCHER (OLD) TPS
- Particulars Unit
Actual Norms,
as per TO
Norms, as per TO
applicable for Latest
Generating Station
Installed Capacity MW 460 460
Plant Load Factor (%) % 85% 85%
Gross Generation MU 3425.16 3425.16
Auxiliary Consumption % 10.50% 8.50%
Net Generation MU 3,065.52 3,134.02
Station Heat Rate kCal/kWh 2850 2430
Secondary Fuel Oil
Consumption ml/kWh 0.5 0.5
Price of oil Rs./kL 52224.37 52224.37
Price of coal Rs./MT 1,166.20 1,166.20
Energy Charge Rate (Ex-
bus) Rs./kWh
0.99 0.83
Reduction in Energy Charge Rate @ (Ex-bus) 17%
There is a reduction of about 17% in the Energy Charges, in
case the norms for latest thermal generating station is applied to old thermal generating station which is more than 30 years old.
There is very less gap between Energy Availability and
Requirement, almost all the available Energy is utilized by the State Discom. Retiring Old coal based TPPs will have to be replaced with new capacity.
Back
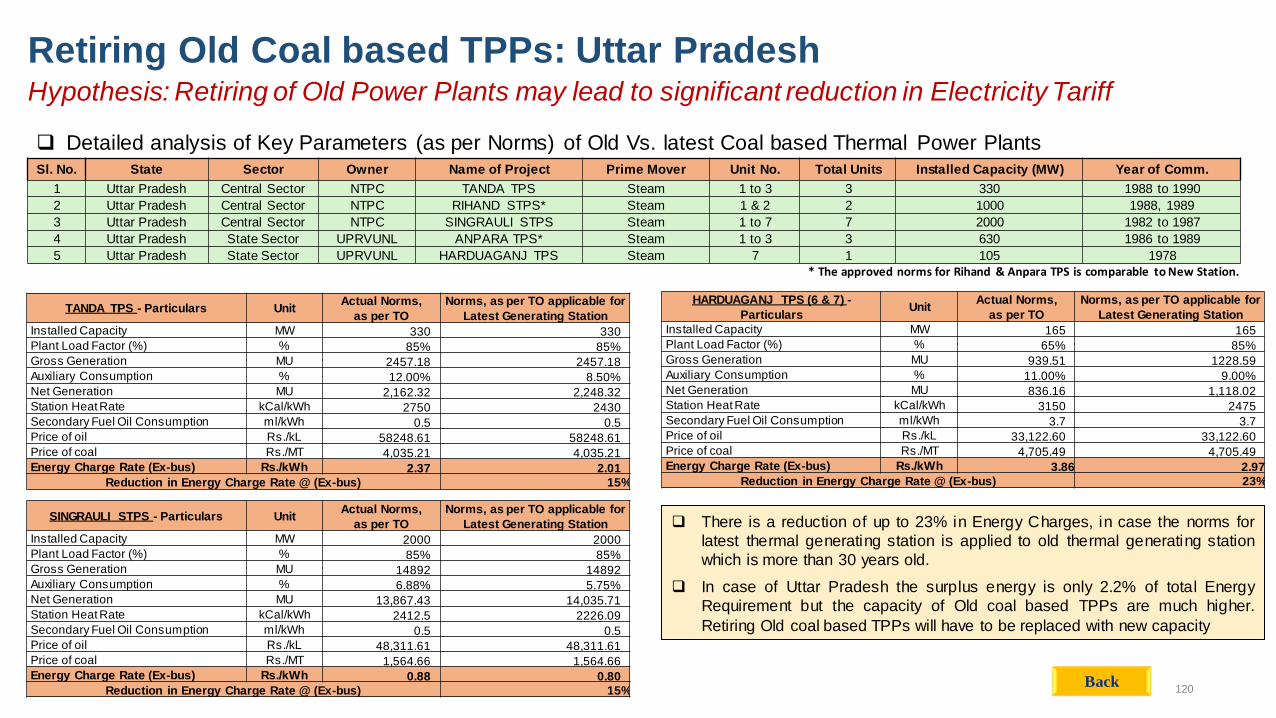
120
Retiring Old Coal based TPPs: Uttar Pradesh Hypothesis: Retiring of Old Power Plants may lead to significant reduction in Electricity Tariff
Detailed analysis of Key Parameters (as per Norms) of Old Vs. latest Coal based Thermal Power Plants Sl. No. State Sector Owner Name of Project Prime Mover Unit No. Total Units Installed Capacity (MW) Year of Comm.
1 Uttar Pradesh Central Sector NTPC TANDA TPS Steam 1 to 3 3 330 1988 to 1990
2 Uttar Pradesh Central Sector NTPC RIHAND STPS* Steam 1 & 2 2 1000 1988, 1989
3 Uttar Pradesh Central Sector NTPC SINGRAULI STPS Steam 1 to 7 7 2000 1982 to 1987
4 Uttar Pradesh State Sector UPRVUNL ANPARA TPS* Steam 1 to 3 3 630 1986 to 1989
5 Uttar Pradesh State Sector UPRVUNL HARDUAGANJ TPS Steam 7 1 105 1978
TANDA TPS - Particulars Unit Actual Norms,
as per TO
Norms, as per TO applicable for
Latest Generating Station
Installed Capacity MW 330 330
Plant Load Factor (%) % 85% 85%
Gross Generation MU 2457.18 2457.18
Auxiliary Consumption % 12.00% 8.50%
Net Generation MU 2,162.32 2,248.32
Station Heat Rate kCal/kWh 2750 2430
Secondary Fuel Oil Consumption ml/kWh 0.5 0.5 Price of oil Rs./kL 58248.61 58248.61
Price of coal Rs./MT 4,035.21 4,035.21
Energy Charge Rate (Ex-bus) Rs./kWh 2.37 2.01
Reduction in Energy Charge Rate @ (Ex-bus) 15%
SINGRAULI STPS - Particulars Unit Actual Norms,
as per TO
Norms, as per TO applicable for
Latest Generating Station
Installed Capacity MW 2000 2000
Plant Load Factor (%) % 85% 85% Gross Generation MU 14892 14892
Auxiliary Consumption % 6.88% 5.75%
Net Generation MU 13,867.43 14,035.71
Station Heat Rate kCal/kWh 2412.5 2226.09
Secondary Fuel Oil Consumption ml/kWh 0.5 0.5
Price of oil Rs./kL 48,311.61 48,311.61
Price of coal Rs./MT 1,564.66 1,564.66
Energy Charge Rate (Ex-bus) Rs./kWh 0.88 0.80
Reduction in Energy Charge Rate @ (Ex-bus) 15%
* The approved norms for Rihand & Anpara TPS is comparable to New Station.
HARDUAGANJ TPS (6 & 7) -
Particulars Unit
Actual Norms,
as per TO
Norms, as per TO applicable for
Latest Generating Station
Installed Capacity MW 165 165 Plant Load Factor (%) % 65% 85%
Gross Generation MU 939.51 1228.59
Auxiliary Consumption % 11.00% 9.00% Net Generation MU 836.16 1,118.02
Station Heat Rate kCal/kWh 3150 2475
Secondary Fuel Oil Consumption ml/kWh 3.7 3.7
Price of oil Rs./kL 33,122.60 33,122.60
Price of coal Rs./MT 4,705.49 4,705.49
Energy Charge Rate (Ex-bus) Rs./kWh 3.86 2.97
Reduction in Energy Charge Rate @ (Ex-bus) 23%
There is a reduction of up to 23% in Energy Charges, in case the norms for
latest thermal generating station is applied to old thermal generating station
which is more than 30 years old.
In case of Uttar Pradesh the surplus energy is only 2.2% of total Energy
Requirement but the capacity of Old coal based TPPs are much higher.
Retiring Old coal based TPPs will have to be replaced with new capacity
Back
121
IDENTIFIED ISSUES GUIDELINES
1. Guidelines for Zero
Schedule instructions to the Generating Units
• In case of anticipated generation availability in surplus, the Distribution Licensee (DL) needs to optimize
their cost of power procurement considering the contracted sources for the period of anticipated surplus,
• DL may consider giving Zero Schedule to some of its contracted sources. This should be a conscious
decision of the DL in consultation with Maharashtra State Load Despatch Centre (MSLDC) taking into account the demand supply position and transmission constraints.
• If grid constraints prevent the Zero Scheduling of the unit with highest Variable Charge (VC) in the MOD
stack, the unit with the next highest VC needs to be considered.
• The DL must give the Generating Company 24 hours prior notice of the Zero Scheduling.
• In case a particular unit is, in fact, required to be scheduled during the pre-declared Zero Scheduling
period, the DL must intimate the Generating station at least 72 hours in advance for the Unit(s) to come on
bar in cold start.
• Zero Scheduling to be carried out by DL considering the roles and obligations under the corresponding PPAs
• Additional cost implication in Variable Charges that arises on account of Zero Scheduling will not be allowed as pass through
Merit Order Dispatch (MOD): Issues & Guidelines (1/3)
Back
122
IDENTIFIED ISSUES GUIDELINES
2. Guidelines for Reserve
Shut Down (RSD) of Generating Units by MSDLC
• A Reserve Margin equivalent to the contracted capacity of the largest unit of the Power Station, contracted
by the Distribution Licensee needs to maintained. • The Reserve Shut Down (RSD) should be implemented for the capacity available in excess of the largest
Unit contracted by the DL.
• The RSD should be applied to Units with higher Variable Charges in the MOD stack, subject to grid conditions permitting the same.
3. Periodicity and date of
preparation of MOD stack
• Variable Charge of immediately preceding month and in case the Variable Charge (VC) of immediately
month is no available, the average of the latest available VC for the preceding 3 months needs considered for preparation of the MOD stack.
• SLDC to prepare the MOD stack by 15th of every month which will be effective from 16 th of the month till
15th of subsequent month • The MOD Stack may be subsequently revised by MSLDC-OD on account of new source, revision in
Variable Charges due to issuance of Tariff Order by CERC or SERC and impact of change in Law as per PPA
4. Basis of preparation of
MOD stack, including the variable charge to be considered
• DL need to submit data for variable charges of generating stations/units to MSLDC.
• For Generating Stations (GS) whose tariff is being determined by the Commission under sec 62, the VC for MOD purposes shall be the Energy Charge plus the actual FSA.
• For Central GS , the VC for MOD purposes shall be the landed cost at the State Periphery.
• For PPAs entered under sec 63, the VC for MOD purposes shall be the Energy Charge plus impact of change in law.
• For Intra State OA transactions above 50 MW, 60% of total tariff shall be considered as VC for MOD purpose.
Merit Order Dispatch (MOD): Issues & Guidelines (1/3)
Back
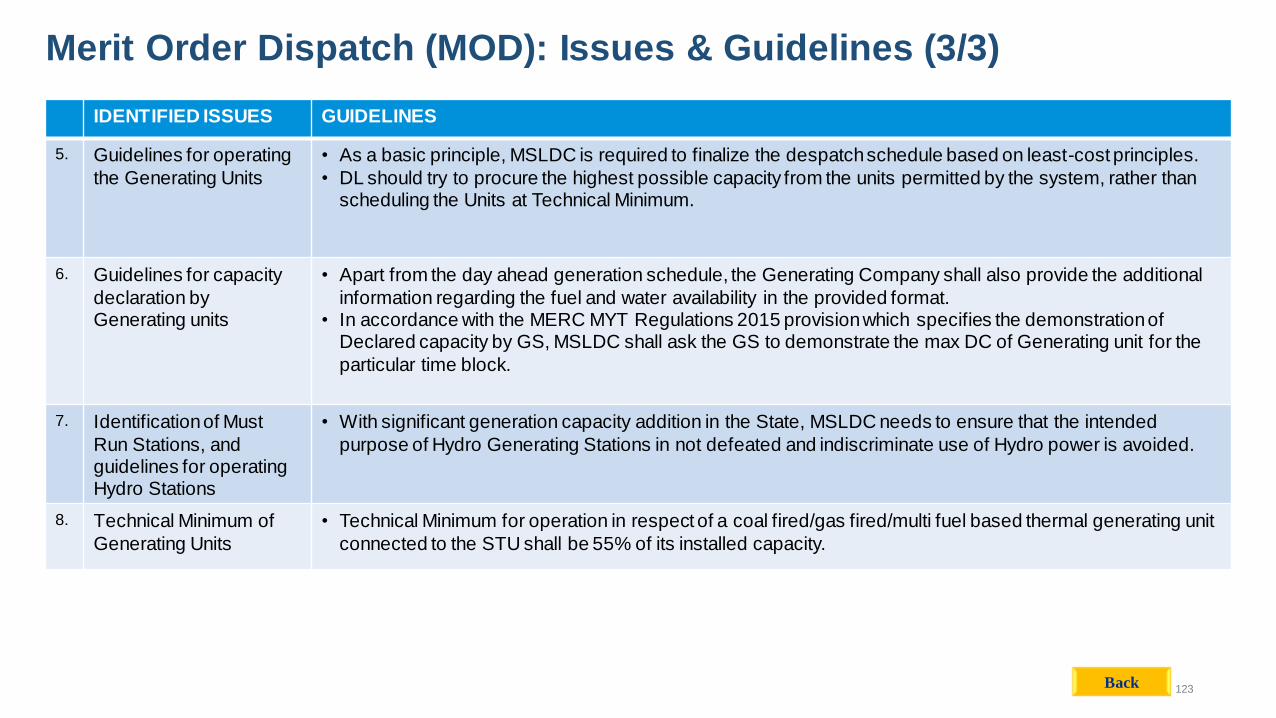
123
IDENTIFIED ISSUES GUIDELINES
5. Guidelines for operating
the Generating Units
• As a basic principle, MSLDC is required to finalize the despatch schedule based on least-cost principles.
• DL should try to procure the highest possible capacity from the units permitted by the system, rather than scheduling the Units at Technical Minimum.
6. Guidelines for capacity
declaration by Generating units
• Apart from the day ahead generation schedule, the Generating Company shall also provide the additional
information regarding the fuel and water availability in the provided format. • In accordance with the MERC MYT Regulations 2015 provision which specifies the demonstration of
Declared capacity by GS, MSLDC shall ask the GS to demonstrate the max DC of Generating unit for the
particular time block.
7. Identification of Must
Run Stations, and guidelines for operating Hydro Stations
• With significant generation capacity addition in the State, MSLDC needs to ensure that the intended
purpose of Hydro Generating Stations in not defeated and indiscriminate use of Hydro power is avoided.
8. Technical Minimum of
Generating Units
• Technical Minimum for operation in respect of a coal fired/gas fired/multi fuel based thermal generating unit
connected to the STU shall be 55% of its installed capacity.
Merit Order Dispatch (MOD): Issues & Guidelines (3/3)
Back
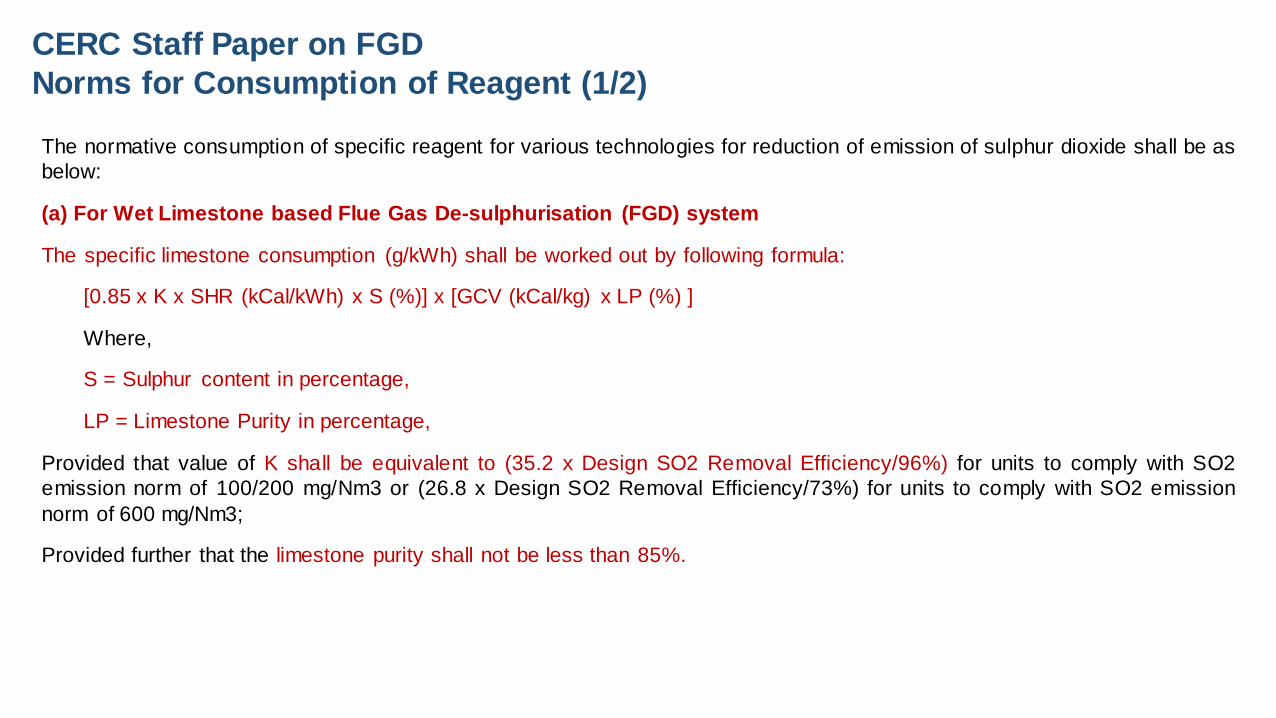
CERC Staff Paper on FGD
Norms for Consumption of Reagent (1/2)
The normative consumption of specific reagent for various technologies for reduction of emission of sulphur dioxide shall be as
below:
(a) For Wet Limestone based Flue Gas De-sulphurisation (FGD) system
The specific limestone consumption (g/kWh) shall be worked out by following formula:
[0.85 x K x SHR (kCal/kWh) x S (%)] x [GCV (kCal/kg) x LP (%) ]
Where,
S = Sulphur content in percentage,
LP = Limestone Purity in percentage,
Provided that value of K shall be equivalent to (35.2 x Design SO2 Removal Efficiency/96%) for units to comply with SO2
emission norm of 100/200 mg/Nm3 or (26.8 x Design SO2 Removal Efficiency/73%) for units to comply with SO2 emission
norm of 600 mg/Nm3;
Provided further that the limestone purity shall not be less than 85%.

CERC Staff Paper on FGD
Norms for Consumption of Reagent (2/2)
(b) For Lime Spray Dryer or Semi-dry Flue Gas Desulphurisation (FGD) system
The specific lime consumption shall be worked out based on minimum purity of lime (LP) as at 90% or more by applying
formula [ 6 x 0.90 / PL (%) ] gm/kWh
(c) For Dry Sorbent Injection System (using sodium bicarbonate)
The specific consumption of sodium bicarbonate shall be 12 g per kWh at 100% purity
(d) For CFBC Technology (furnace injection) based generating station
The specific limestone consumption for CFBC based generating station (furnace injection) shall be computed with the following
formula:
[62.9 x S(%) x SHR (kCal/kWh) /GCV (kCal/kg) ] x [ 0.85/ LP], Where
S = Sulphur content in percentage,
LP = Limestone Purity in percentage
(e) For Sea Water based Flue Gas Desulphurisation (FGD) system
The reagent used is sea water, therefore there is no requirement for any normative formulae for consumption of reagent.

Inter & Intra-State Transmission Charges (Rs. Crore & Rs./kWh)
Source: Tariff orders issued by respective state commissions for the last 4 years;
*Inter-state TC per unit is computed based on energy procured from ISGS and intra-state TC per unit is computed based on power procured from plants within the state
Change in Transmission Cost over the last 4 years
The share of intra-state transmission charges has increased in last 4
years whereas the share of inter-state transmission charges remain
constant.
1,477 1,406 1,412 1,532
2,252 2,532 2,750 2,754
2016-17 2017-18 2018-19 2019-20
Madhya Pradesh: Transmission Charges (Rs. Crore)
Inter-State TC Intra-State TC
7%
1%
CAGR
Per unit inter-state TC has reduced over the last 4 years whereas the
per unit intra-state TC has increased
0.93 0.95
0.84 0.77
0.32 0.34 0.37 0.35 0.44 0.44 0.46 0.44
2016-17 2017-18 2018-19 2019-20
Madhya Pradesh: Transmission Charges* (Rs./kWh)
Inter-State TC (Rs./kWh) Intra-State TC (Rs./kWh) Total TC (Rs./kWh)
CAGR
3%
-6%
0%
126

0.89
1.10
0.76
0.98
0.44
0.28 0.25 0.33
0.46 0.53
0.41
0.57
2016-17 2017-18 2018-19 2019-20
Uttarakhand: Transmission Charges* (Rs./kWh)
Inter-State TC (Rs./kWh) Intra-State TC (Rs./kWh) Total TC (Rs./kWh)
-9%
7%
CAGR
3%
Inter & Intra-State Transmission Charges (Rs. Crore & Rs./kWh) Change in Transmission Cost over the last 4 years
The share of inter-state transmission charges has increased in last
4 years whereas the share of intra-state transmission charges
remain constant.
385 506
388 510
271
253
209
266
2016-17 2017-18 2018-19 2019-20
Uttarakhand: Transmission Charges (Rs. Crore)
Inter-State TC Intra-State TC
-1%
10%
CAGR
Per unit inter-state TC has increased over the last 4 years whereas the
per unit intra-state TC has reduced.
Source: Tariff orders issued by respective state commissions for the last 4 years;
*Inter-state TC per unit is computed based on energy procured from ISGS and intra-state TC per unit is computed based on power procured from plants within the state 127
Inter & Intra-State Transmission Charges (Rs. Crore & Rs./kWh) Change in Transmission Cost over the last 4 years
The share of Inter-State transmission charges has increased @ 24%
CAGR in last 4 years whereas the share of Intra-State transmission
charges has increased @ 4% CAGR only.
949 1,066 1,550 1,823
3,113 2,778
3,004
3,525
2016-17 2017-18 2018-19 2019-20
Karnataka: Transmission Charges (Rs. Crore)
Inter-State TC Intra-State TC
4%
24%
CAGR
Per unit inter-state TC has increased significantly over the last 4
years whereas the per unit intra-state TC has remained the same
0.46 0.53
0.75
0.91
0.70 0.61 0.63
0.69 0.62 0.59
0.67 0.75
2016-17 2017-18 2018-19 2019-20
Karnataka: Transmission Charges* (Rs./kWh)
Inter-State TC (Rs./kWh) Intra-State TC (Rs./kWh) Total TC (Rs./kWh)
CAGR
0%
7%
26%
0%
Source: Tariff orders issued by respective state commissions for the last 4 years;
*Inter-state TC per unit is computed based on energy procured from ISGS and intra-state TC per unit is computed based on power procured from plants within the state 128

0.31 0.30 0.30 0.28
1.95
1.37
1.08
1.36
0.62 0.58 0.54 0.55
2016-17 2017-18 2018-19 2019-20
Kerala: Transmission Charges* (Rs./kWh)
Inter-State TC (Rs./kWh) Intra-State TC (Rs./kWh) Total TC (Rs./kWh)
CAGR
0%
-11%
-4%
-3%
Inter & Intra-State Transmission Charges (Rs. Crore & Rs./kWh) Change in Transmission Cost over the last 4 years
The share of intra-state transmission charges has decreased in last 4
years whereas the share of inter-state transmission charges has
increased.
Per unit inter-state TC has decreased over the last 4 years whereas the
per unit intra-state TC has reduced at a higher rate
608 564 543 558
881 905 875 984
2016-17 2017-18 2018-19 2019-20
Kerala : Transmission Charges (Rs. Crore)
Inter-State TC Intra-State TC
4%
-3%
CAGR
Source: Tariff orders issued by respective state commissions for the last 4 years;
*Inter-state TC per unit is computed based on energy procured from ISGS and intra-state TC per unit is computed based on power procured from plants within the state 129
0.37
0.27
0.33 0.35
0.15 0.19
0.21
0.36
0.20 0.22 0.24
0.36
2016-17 2017-18 2018-19 2019-20
Jharkhand: Transmission Charges (Rs./kWh)
Inter-State TC (Rs./kWh) Intra-State TC (Rs./kWh) Total TC (Rs./kWh)
CAGR
0%
34%
22%
-2%
Inter & Intra-State Transmission Charges (Rs. Crore & Rs./kWh) Change in Transmission Cost over the last 4 years
The share of Intra-state transmission charges has increased @ 32% CAGR
in last 4 years whereas the share of inter-state transmission charges has
increased @ 9% CAGR only.
Per unit inter-state TC has decreased marginally over the last 4 years
whereas per unit intra-state TC has increased significantly
116 119 122 152
141 160 208
327
2016-17 2017-18 2018-19 2019-20
Jharkhand: Transmission Charges (Rs. Crore)
Inter-State TC Intra-State TC
32%
9%
CAGR
Source: Tariff orders issued by respective state commissions for the last 4 years;
*Inter-state TC per unit is computed based on energy procured from ISGS and intra-state TC per unit is computed based on power procured from plants within the state 130
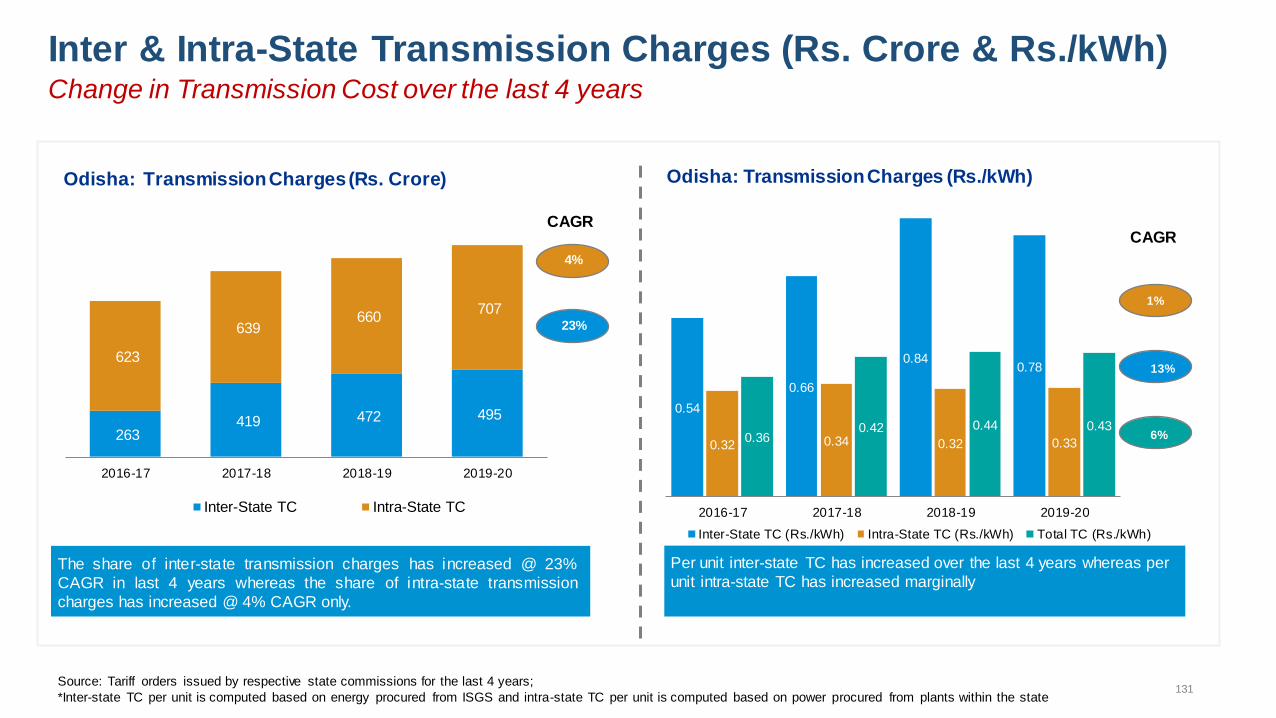
0.54
0.66
0.84 0.78
0.32 0.34 0.32 0.33 0.36 0.42 0.44 0.43
2016-17 2017-18 2018-19 2019-20
Odisha: Transmission Charges (Rs./kWh)
Inter-State TC (Rs./kWh) Intra-State TC (Rs./kWh) Total TC (Rs./kWh)
CAGR
0%
1%
6%
13%
Inter & Intra-State Transmission Charges (Rs. Crore & Rs./kWh) Change in Transmission Cost over the last 4 years
The share of inter-state transmission charges has increased @ 23%
CAGR in last 4 years whereas the share of intra-state transmission
charges has increased @ 4% CAGR only.
Per unit inter-state TC has increased over the last 4 years whereas per
unit intra-state TC has increased marginally
263 419 472 495
623
639 660
707
2016-17 2017-18 2018-19 2019-20
Odisha: Transmission Charges (Rs. Crore)
Inter-State TC Intra-State TC
4%
23%
CAGR
Source: Tariff orders issued by respective state commissions for the last 4 years;
*Inter-state TC per unit is computed based on energy procured from ISGS and intra-state TC per unit is computed based on power procured from plants within the state 131
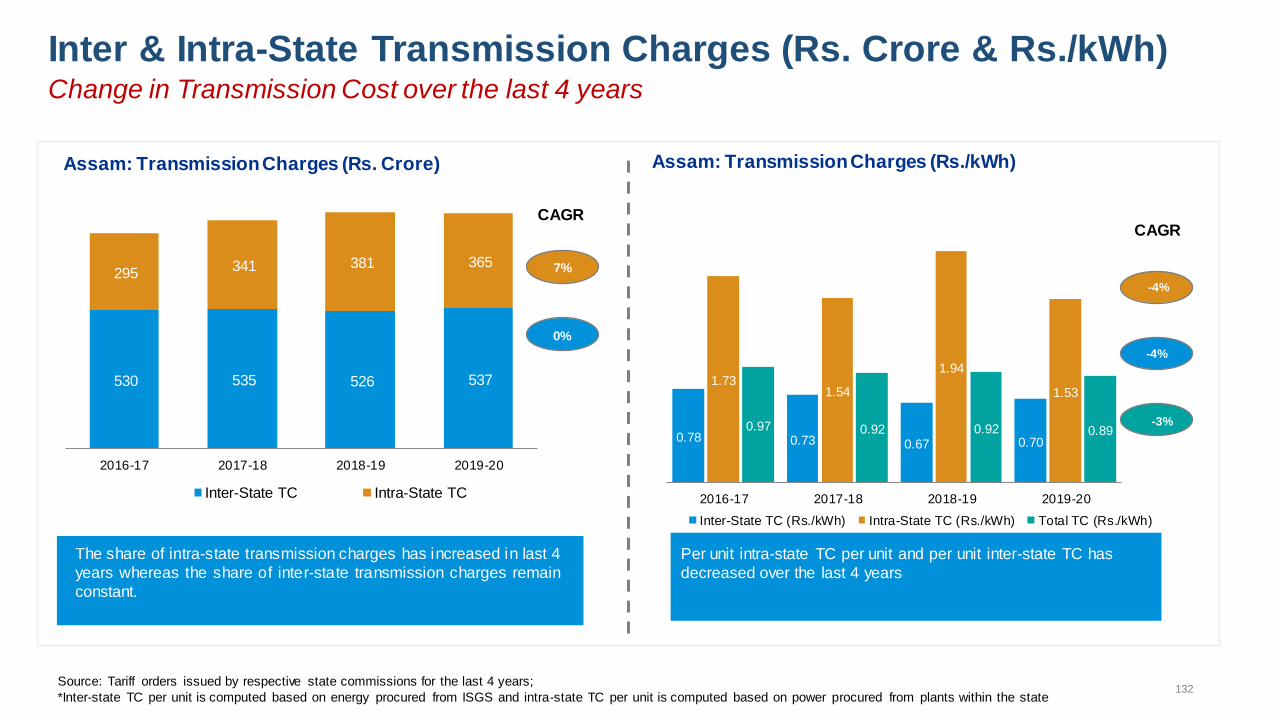
Inter & Intra-State Transmission Charges (Rs. Crore & Rs./kWh) Change in Transmission Cost over the last 4 years
The share of intra-state transmission charges has increased in last 4
years whereas the share of inter-state transmission charges remain
constant.
530 535 526 537
295 341 381 365
2016-17 2017-18 2018-19 2019-20
Assam: Transmission Charges (Rs. Crore)
Inter-State TC Intra-State TC
7%
0%
CAGR
Per unit intra-state TC per unit and per unit inter-state TC has
decreased over the last 4 years
0.78 0.73 0.67 0.70
1.73 1.54
1.94
1.53
0.97 0.92 0.92 0.89
2016-17 2017-18 2018-19 2019-20
Assam: Transmission Charges (Rs./kWh)
Inter-State TC (Rs./kWh) Intra-State TC (Rs./kWh) Total TC (Rs./kWh)
CAGR
0%
-4%
-3%
-4%
Source: Tariff orders issued by respective state commissions for the last 4 years;
*Inter-state TC per unit is computed based on energy procured from ISGS and intra-state TC per unit is computed based on power procured from plants within the state 132

Inter & Intra-State Transmission Charges (Rs. Crore & Rs./kWh) Change in Transmission Cost over the last 4 years
The share of intra-state transmission charges has increased at much
higher rate in comparison to inter-state transmission charges in last 4
years.
777 804 849 915
278
629
1,199 1,214
2016-17 2017-18 2018-19 2019-20
Bihar: Transmission Charges (Rs. Crore)
Inter-State TC Intra-State TC
63%
6%
CAGR
Per unit inter-state TC has decreased over the last 4 years whereas
the per unit intra-state TC has increased significantly
0.64 0.57
0.75
0.42
0.16
0.50
0.67
0.58
0.36
0.54
0.70
0.50
2016-17 2017-18 2018-19 2019-20
Bihar: Transmission Charges (Rs./kWh)
Inter-State TC (Rs./kWh) Intra-State TC (Rs./kWh) Total TC (Rs./kWh)
CAGR
0%
54%
12%
-13%
Source: Tariff orders issued by respective state commissions for the last 4 years;
*Inter-state TC per unit is computed based on energy procured from ISGS and intra-state TC per unit is computed based on power procured from plants within the state 133
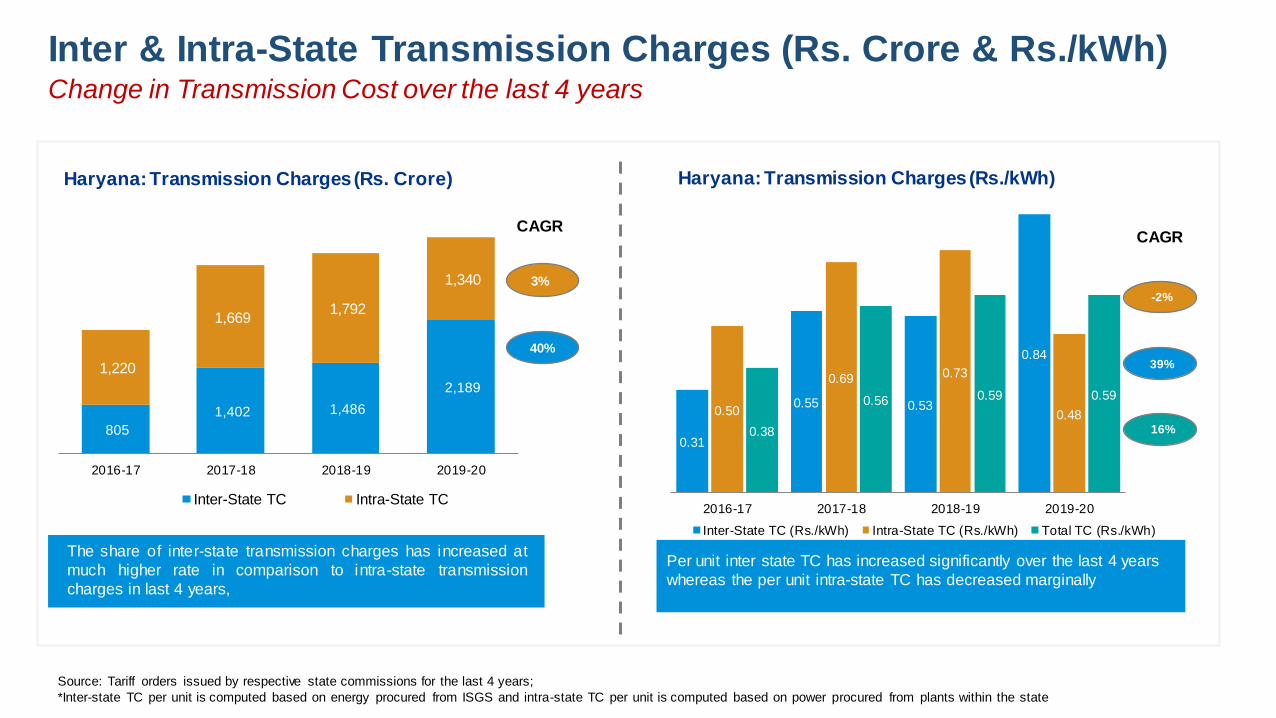
0.31
0.55 0.53
0.84
0.50
0.69 0.73
0.48
0.38
0.56 0.59 0.59
2016-17 2017-18 2018-19 2019-20
Haryana: Transmission Charges (Rs./kWh)
Inter-State TC (Rs./kWh) Intra-State TC (Rs./kWh) Total TC (Rs./kWh)
CAGR
0%
-2%
16%
39%
Inter & Intra-State Transmission Charges (Rs. Crore & Rs./kWh) Change in Transmission Cost over the last 4 years
The share of inter-state transmission charges has increased at
much higher rate in comparison to intra-state transmission
charges in last 4 years,
805
1,402 1,486
2,189
1,220
1,669 1,792
1,340
2016-17 2017-18 2018-19 2019-20
Haryana: Transmission Charges (Rs. Crore)
Inter-State TC Intra-State TC
3%
40%
CAGR
Per unit inter state TC has increased significantly over the last 4 years
whereas the per unit intra-state TC has decreased marginally
Source: Tariff orders issued by respective state commissions for the last 4 years;
*Inter-state TC per unit is computed based on energy procured from ISGS and intra-state TC per unit is computed based on power procured from plants within the state

Inter & Intra-State Transmission Charges (Rs. Crore & Rs./kWh) Change in Transmission Cost over the last 4 years
The share of intra-state transmission charges has remains constant in
last 4 years, but inter-state transmission charges increased by 25% in
last 4 years.
3,043
1,783 2,971
6,011
1,959
2,651
2,364
2,135
2016-17 2017-18 2018-19 2019-20
Uttar Pradesh: Transmission Charges (Rs. Crore)
Inter-State TC Intra-State TC
3%
25%
CAGR
Per unit inter-state TC has increased over the last 4 years whereas the
per unit intra-state TC has increased at a lower rate
1.12
0.59
1.06
1.81
0.19 0.29 0.26 0.26
0.38 0.36 0.41
0.70
2016-17 2017-18 2018-19 2019-20
Uttar Pradesh: Transmission Charges (Rs./kWh)
Inter-State TC (Rs./kWh) Intra-State TC (Rs./kWh) Total TC (Rs./kWh)
CAGR
0%
11%
23%
17%
Source: Tariff orders issued by respective state commissions for the last 4 years;
*Inter-state TC per unit is computed based on energy procured from ISGS and intra-state TC per unit is computed based on power procured from plants within the state 135
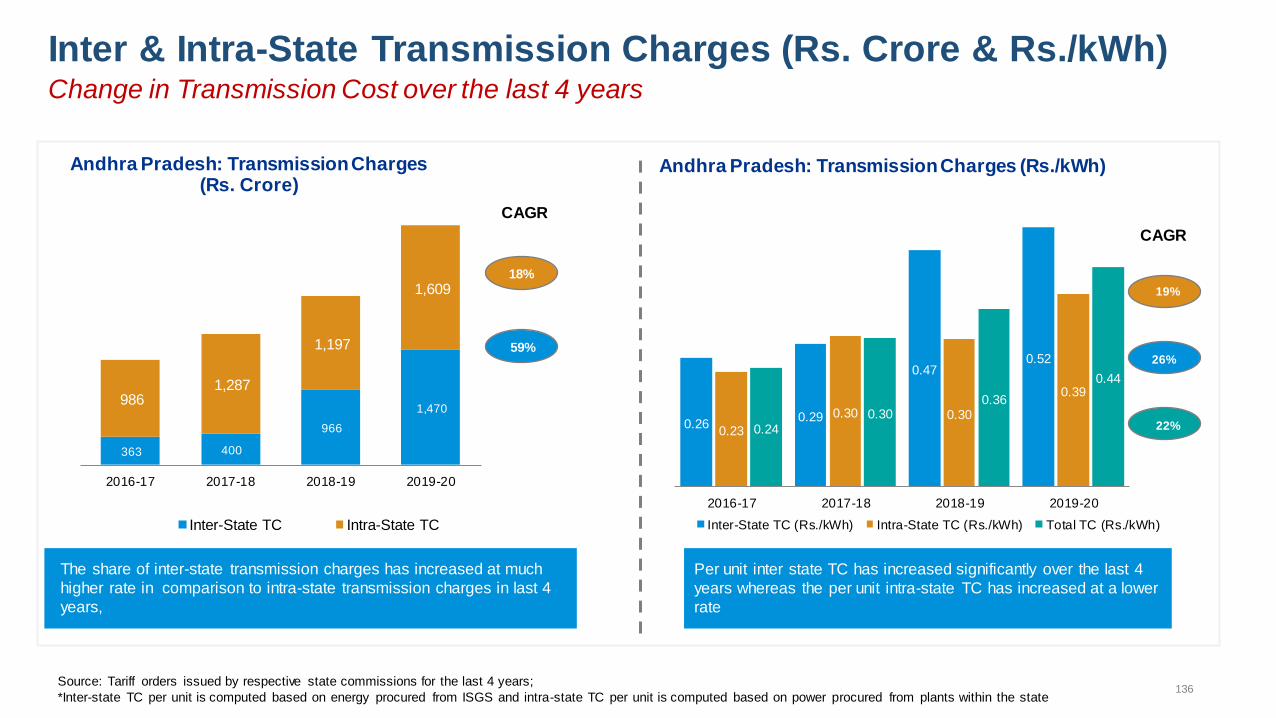
Inter & Intra-State Transmission Charges (Rs. Crore & Rs./kWh) Change in Transmission Cost over the last 4 years
The share of inter-state transmission charges has increased at much
higher rate in comparison to intra-state transmission charges in last 4
years,
Per unit inter state TC has increased significantly over the last 4
years whereas the per unit intra-state TC has increased at a lower
rate
363 400
966
1,470 986
1,287
1,197
1,609
2016-17 2017-18 2018-19 2019-20
Andhra Pradesh: Transmission Charges (Rs. Crore)
Inter-State TC Intra-State TC
18%
59%
CAGR
0.26 0.29
0.47 0.52
0.23
0.30 0.30
0.39
0.24 0.30
0.36
0.44
2016-17 2017-18 2018-19 2019-20
Andhra Pradesh: Transmission Charges (Rs./kWh)
Inter-State TC (Rs./kWh) Intra-State TC (Rs./kWh) Total TC (Rs./kWh)
CAGR
0%
19%
22%
26%
Source: Tariff orders issued by respective state commissions for the last 4 years;
*Inter-state TC per unit is computed based on energy procured from ISGS and intra-state TC per unit is computed based on power procured from plants within the state 136

Inter & Intra-State Transmission Charges (Rs. Crore & Rs./kWh) Change in Transmission Cost over the last 4 years
The share of intra & inter-state transmission charges has increased @
~10% CAGR in last 4 years.
1,515 1,591 1,670 2,077
3,058 3,407
3,749
4,115
2016-17 2017-18 2018-19 2019-20
Gujarat: Transmission Charges (Rs. Crore)
Inter-State TC Intra-State TC
10%
11%
CAGR
Per unit inter state TC has remained constant over the last 4
years whereas the per unit intra-state TC has increased
0.75 0.72
0.67
0.75
0.43 0.46 0.48 0.50 0.48 0.50 0.52
0.55
2016-17 2017-18 2018-19 2019-20
Gujarat: Transmission Charges (Rs./kWh)
Inter-State TC (Rs./kWh) Intra-State TC (Rs./kWh) Total TC (Rs./kWh)
CAGR
0%
5%
5%
0%
Source: Tariff orders issued by respective state commissions for the last 4 years;
*Inter-state TC per unit is computed based on energy procured from ISGS and intra-state TC per unit is computed based on power procured from plants within the state 137

EFFECT OF CAPACITORSIN AGRICULTURE SEGMENT IN REDUCTION
OF TECHNICAL LOSSBY WAY OF
VAR COMPENSATION
Presented by Chairman/TNERC

The energy Conservation Act 2001
India is the second country in the world next to
USA to enact an ACT called ‘The energy
Conservation Act 2001’.A lot of electrical energy can be conserved by
improving the efficiency of the electrical system. One
of the methods is the reactive power management.The core objective of all power reforms schemes
like, RAPDRP, IPDS, UDAY etc., is to reduce the AT&C
loss in the network.

Reactive power managementAt present the power factor correction is
internationally termed as the
management.
reactive power
An induction motor draws power from a far
off generating station. This power consists of two
components, one is the active power (kW) and the
other one is the reactive power (kVAr – or simply var).
When the two powers are added the power obtained is
the apparent power (kVA). This apparent power (kVA)
is to be delivered by the generating station.-contd..
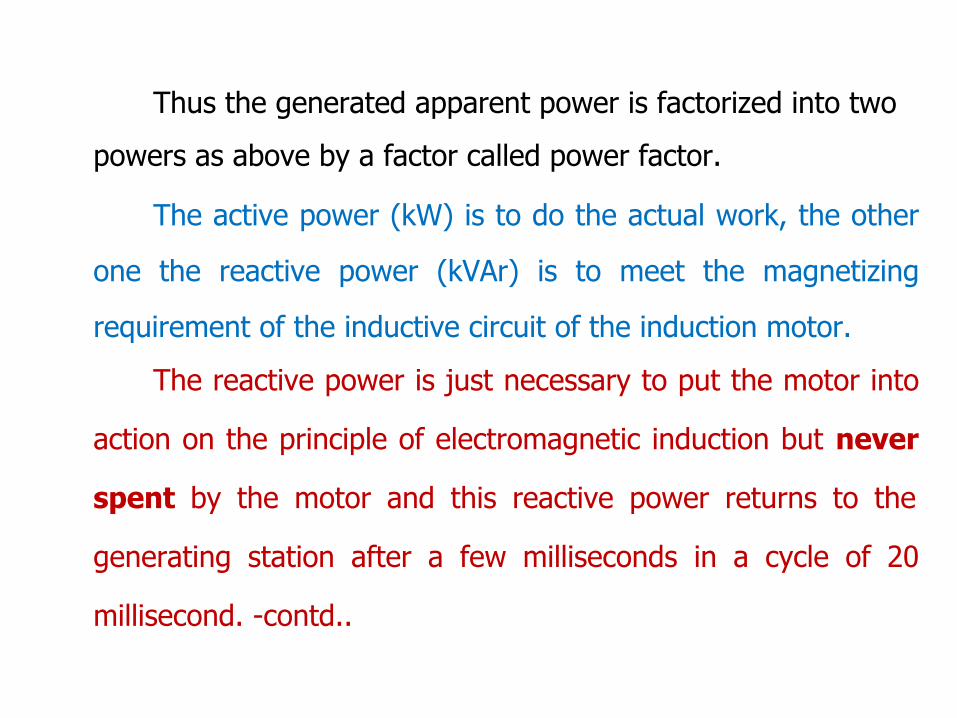
Thus the generated apparent power is factorized into two
powers as above by a factor called power factor.
The active power (kW) is to do the actual work, the other
one the reactive power (kVAr) is to meet the magnetizing
requirement of the inductive circuit of the induction motor.
The reactive power is just necessary to put the motor into
action on the principle of electromagnetic induction but never
spent by the motor and this reactive power returns to the
generating station after a few milliseconds in a cycle of 20
millisecond. -contd..
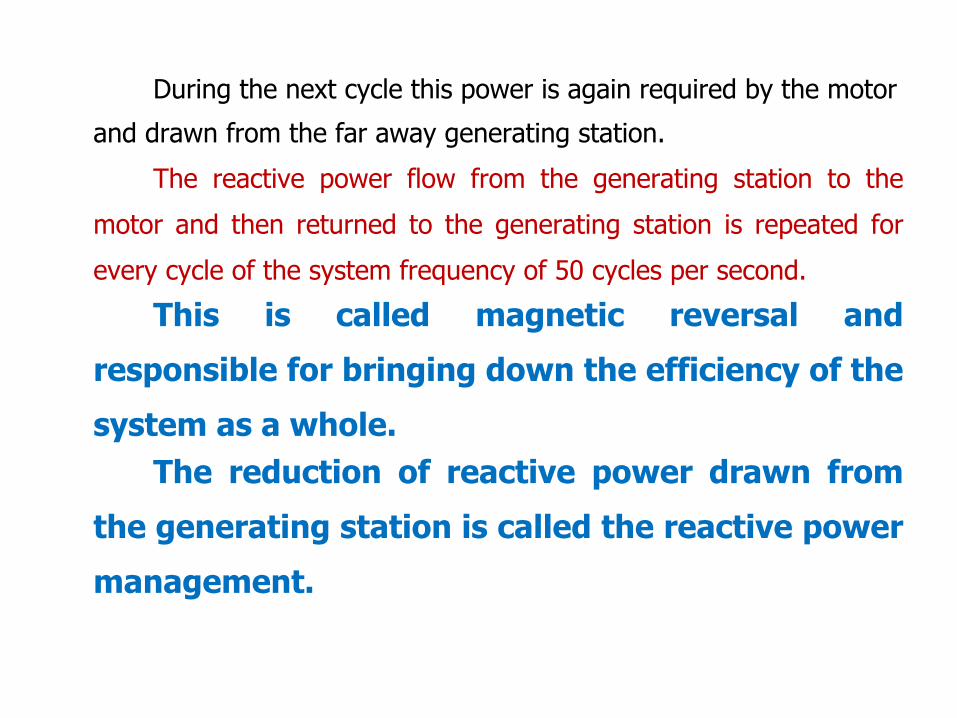
During the next cycle this power is again required by the motor
and drawn from the far away generating station.
The reactive power flow from the generating station to the
motor and then returned to the generating station is repeated for
every cycle of the system frequency of 50 cycles per second.
This is called magnetic reversal and
responsible for bringing down the efficiency of the
system as a whole.The reduction of reactive power drawn from
the generating station is called the reactive power
management.
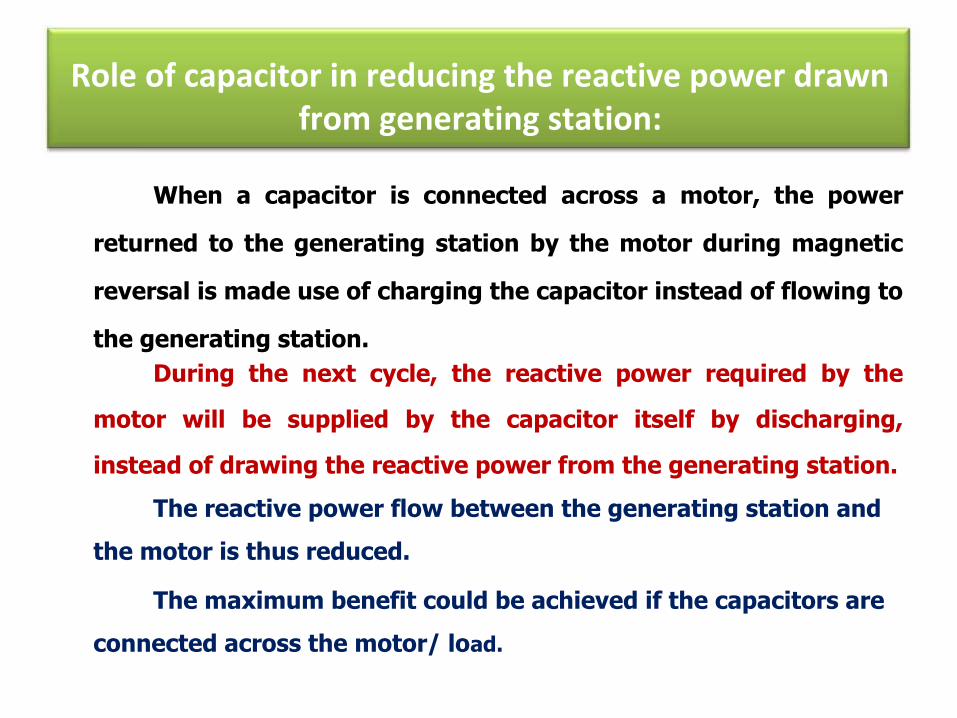
Role of capacitor in reducing the reactive power drawnfrom generating station:
When a capacitor is connected across a motor, the power
returned to the generating station by the motor during magnetic
reversal is made use of charging the capacitor instead of flowing to
the generating station.During the next cycle, the reactive power required by the
motor will be supplied by the capacitor itself by discharging,
instead of drawing the reactive power from the generating station.
The reactive power flow between the generating station and
the motor is thus reduced.
The maximum benefit could be achieved if the capacitors are
connected across the motor/ load.


KVA
KW KVAr
BEFORE INSTALLING CAPACITORSupply Bus
Input = KVA - 10 Output = KW - 9 Power Factor = 9/10 = 0.9
Efficiency = 90%
LOAD

KW KVAr
KVA
AFTER INSTALLING CAPACITORSupply Bus
Input = KVA - 9 Output = KW - 9 Power Factor = 9/9 = 1
Efficiency = 100%
LOAD
Capacitor

When No Capacitors are Connected in Electrical Network Generating Station
230/110/11KV SS
11KV Bus
11KV Feeders
Distribution Transformer
LT Line
AGRL SCM M M
INDL SCM
Consumers
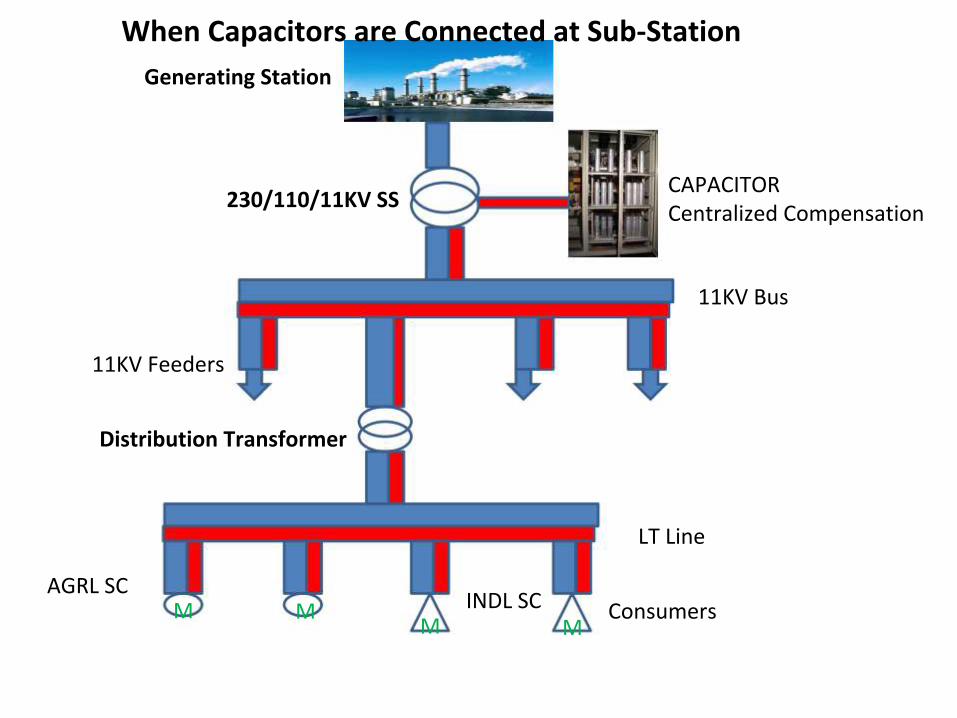
When Capacitors are Connected at Sub-Station Generating Station
230/110/11KV SS
11KV Feeders
Distribution Transformer
CAPACITORCentralized Compensation
11KV Bus
LT Line
AGRL SCM M M
INDL SCM
Consumers

When Capacitors are Connected at Distribution
Transformer Generating Station
230/110/11KV SS
11KV Feeders
Distribution Transformer
CAPACITORCentralized Compensation
11KV Bus
APFCGroup Compensation
LT Line
AGRL SCM M
MINDL SC
MConsumers

M M
When Capacitors are Connected at Load End Generating Station
230/110/11KV SS
11KV Feeders
Distribution Transformer
AGLSC INDL SC
MCapacitor at Load End (Individual Compensation)
M
CAPACITORCentralized Compensation
11KV Bus
APFCGroup Compensation
LT Line
Consumers
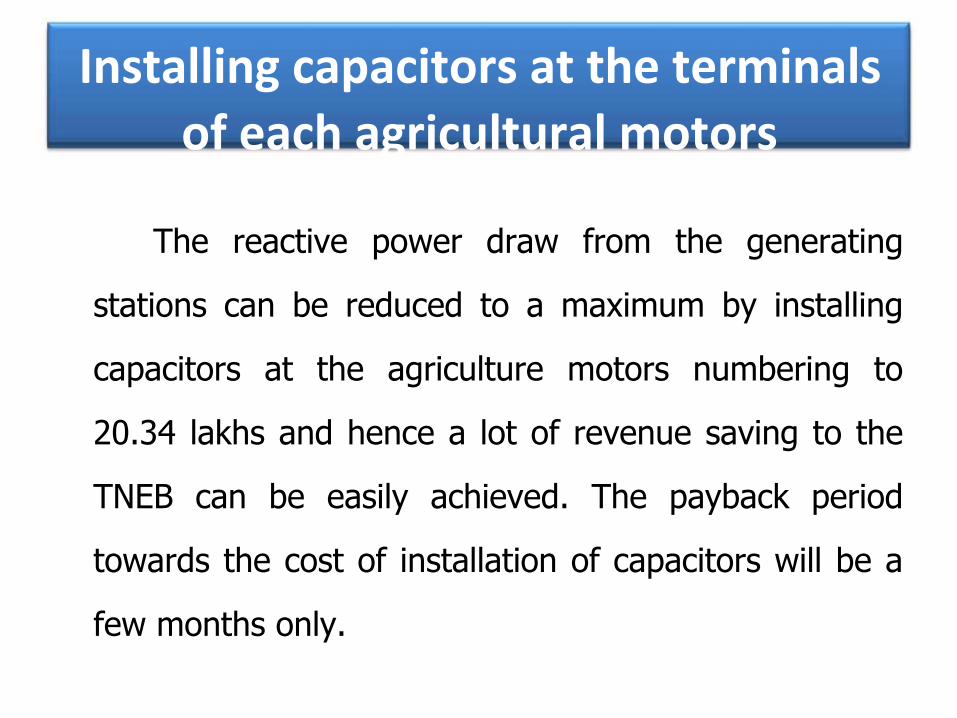
of each agricultural motorsInstalling capacitors at the terminals
The reactive power draw from the generating
stations can be reduced to a maximum by installing
capacitors at the agriculture motors numbering to
20.34 lakhs and hence a lot of revenue saving to the
TNEB can be easily achieved. The payback period
towards the cost of installation of capacitors will be a
few months only.
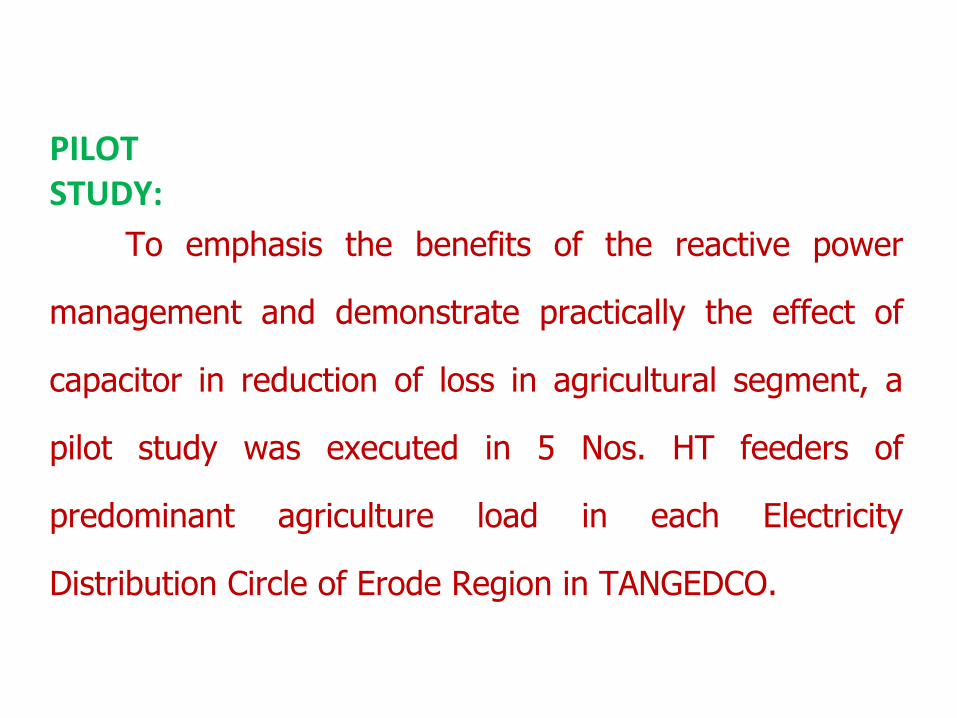
PILOT STUDY:
To emphasis the benefits of the reactive power
management and demonstrate practically the effect of
capacitor in reduction of loss in agricultural segment, a
pilot study was executed in 5 Nos. HT feeders of
predominant agriculture load in each Electricity
Distribution Circle of Erode Region in TANGEDCO.
Feeders selected for the study:Name of circle Name of substation Name of feeder
Erode Nadupalayam 110/22-11 KV Punjai Kalamangalam 22 KV
Gobi Kugalur 110/22-11 KV Athani 22 KV
Mettur Poolampatty 110/22 KV Poolampatty 22 KV
Namakkal Velur 110/11 KV Suriyampalayam 11 KV
Salem Karuppur 110/22 KV Sengaradu 22 KV
Procurement of Capacitors:Procurement of capacitors have been done through e-tendering for the amount of Rs 28.68 Lakhs for the above feeders.
Profile of Sample study in one of the five feeders- Poolampaati 22KV feeder of Mettur Circle:
Provision of capacitors in all agricultural services have been completed in Poolampatty 22 KV feeder of Poolampatty SS in Mettur EDC from 13.07.2018 to 13.08.2018.Number of services Capacitor provided :
3 HP 5HP 7.5 HP 10 HP Total44 517 240 77 878
Ratings of Capacitors Provided1 KVAR 2 KVAR 3 KVAR 4 KVAR Total
44 517 240 77 878
Total amount invested:1 KVAR 2 KVAR 3 KVAR 4 KVAR Total
44xRs 415.36=
Rs 18,276
517xRs 519.20
=Rs 2,68,426
240xRs 654.90
=Rs 1,57,176
77xRs 848.42
=Rs 65,328
Rs 5,09,206
Method of assessmentThe required data of 22Kv feeder such as KVA, KVAR,
KW , Amp, Voltage, P.F etc., were recorded with high
precision electronic meter installed in its feeder panel for
both period before and after installation of capacitors. The
stored data were downloaded by CMRI Data for
comparative analysis .Similarly the electrical parameters in the LT side were
measured and documented by using Clamp on meters by
taking readings at the spot itself before and after installing
the capacitors and analysed.
Date wise installation of CapacitorsCapacitor provided in Pollampatty 22 KV feederDate of commissioned 1 KVAR 2KVAR 3 KVAR 4 KVAR Total
13-Jul-18 13 1316-Jul-18 9 1 1017-Jul-18 3 19 2219-Jul-18 9 24 11 4420-Jul-18 23 14 3721-Jul-18 22 5 11 3823-Jul-18 27 9 6 4224-Jul-18 7 25 12 4425-Jul-18 30 16 12 5826-Jul-18 35 7 1 4327-Jul-18 3 35 12 12 62
01-Aug-18 34 9 4302-Aug-18 25 5 7 3703-Aug-18 2 28 30 5 6506-Aug-18 27 22 4907-Aug-18 35 19 5408-Aug-18 5 27 29 6109-Aug-18 25 20 4510-Aug-18 7 14 10 6 3711-Aug-18 8 12 10 9 3913-Aug-18 28 7 35
Total 44 517 240 77 878TOTAL KVAR 44x1=44 517X2=1034 240X3=720 77X4=308 2106

STUDYREPORT

The pre and post data of the study emerge thefollowing results
1. The power factor during the one month of installationgradually improved from 0.85 to 0.96, as the installation progressed day by day.
2. The quantum of reduction in Amp/Kw and allied lineloss is around 13% and can be conservatively concluded more than 10%.
3. The reduction in Kvar pumped from the Generation station, flowed through the upstream Grid making loss all the way and finally confluenced in to the Poolampatti feeder AND the reduction in overall Kva are proportionate to the reduction in feeder current.4. Improvement and stability in voltage profile is evident both in HT and downstream , post the event.
Before erection of
capacitor
Power factor Improvement before and after capacitor erection atregular intervals:
Readings taken through CMRIDate Average PF Remarks
01.07.2018 0.855
05.07.2018 0.862
10.07.2018 0.855
12.07.2018 0.856
20.07.2018 0.860
After erection of
capacitor
25.07.2018 0.877
30.07.2018 0.910
05.08.2018 0.918
10.08.2018 0.948
13.08.2018 0.966

Power factor Before and After capacitor erection0.980
0.960
0.9400.948
0.9662106KVAr
0.920
0.9000.910
0.918
1452
1924KVAr
KVAr0.880 0.877 1071
0.8600.855
0.862 0.855 0.856 0.860KVAr
0.840
0.820
0.800
0.780
724KVAr
Before erection After erection01.07.2018 05.07.2018 10.07.2018 15.07.2018 20.07.2018 25.07.2018 30.07.2018 05.08.2018 10.08.2018 13.08.2018
0.032
0.031
0.03
0.029
0.028
Reduction of Amps/Kw0.0315
0.02710.027
0.026
0.025
0.024
AMPS/KW
13.07.2018 13.08.2018
Before erection After erection
Curr
ent i
n Am
ps/K
W
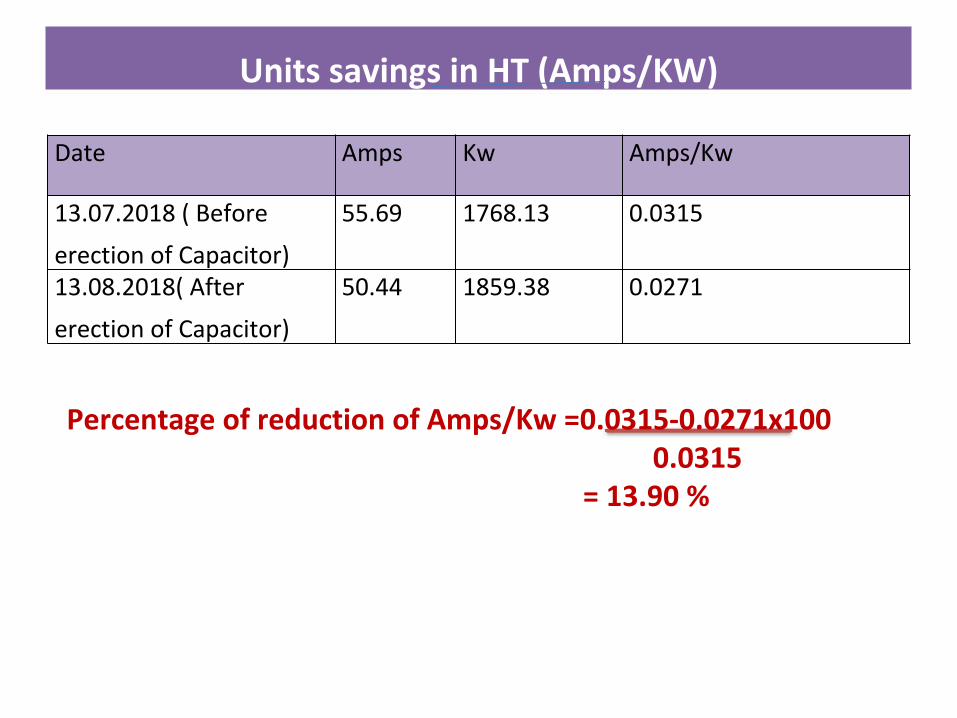
Units savings in HT (Amps/KW)
Date Amps Kw Amps/Kw
13.07.2018 ( Before
erection of Capacitor)
55.69 1768.13 0.0315
13.08.2018( After
erection of Capacitor)
50.44 1859.38 0.0271
Percentage of reduction of Amps/Kw =0.0315-0.0271x1000.0315
= 13.90 %
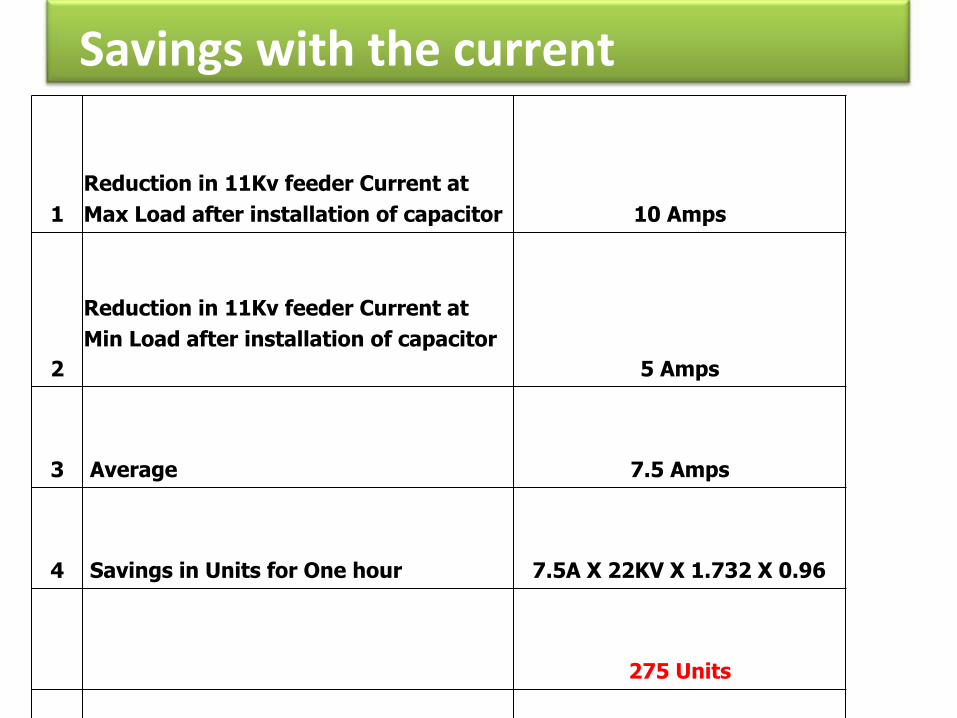
Savings with the current parameters
1Reduction in 11Kv feeder Current atMax Load after installation of capacitor 10 Amps
2
Reduction in 11Kv feeder Current at Min Load after installation of capacitor
5 Amps
3 Average 7.5 Amps
4 Savings in Units for One hour 7.5A X 22KV X 1.732 X 0.96
275 Units
5 Savings in Units for One Year 275Units X 24 Hrs X 365 Days
2,40,900 Units
6 Savings in Money Value 2,40,900Units X Rs. 5/-
Rs.1,20,45,000
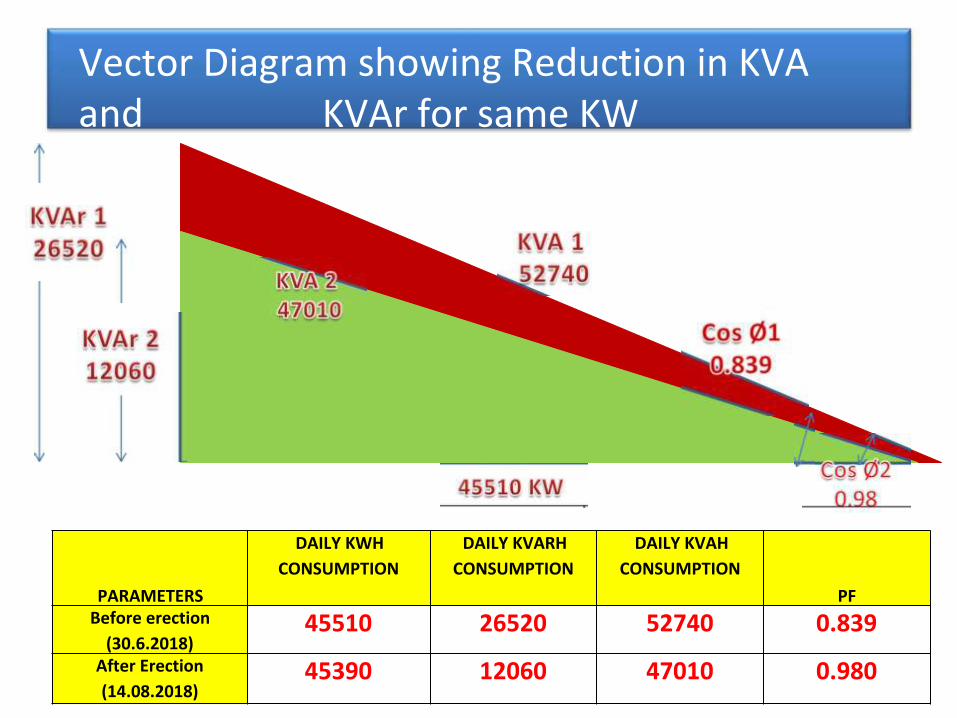
Vector Diagram showing Reduction in KVA and KVAr for same KW
PARAMETERS
DAILY KWHCONSUMPTION
DAILY KVARHCONSUMPTION
DAILY KVAHCONSUMPTION
PFBefore erection
(30.6.2018)45510 26520 52740 0.839
After Erection(14.08.2018)
45390 12060 47010 0.980
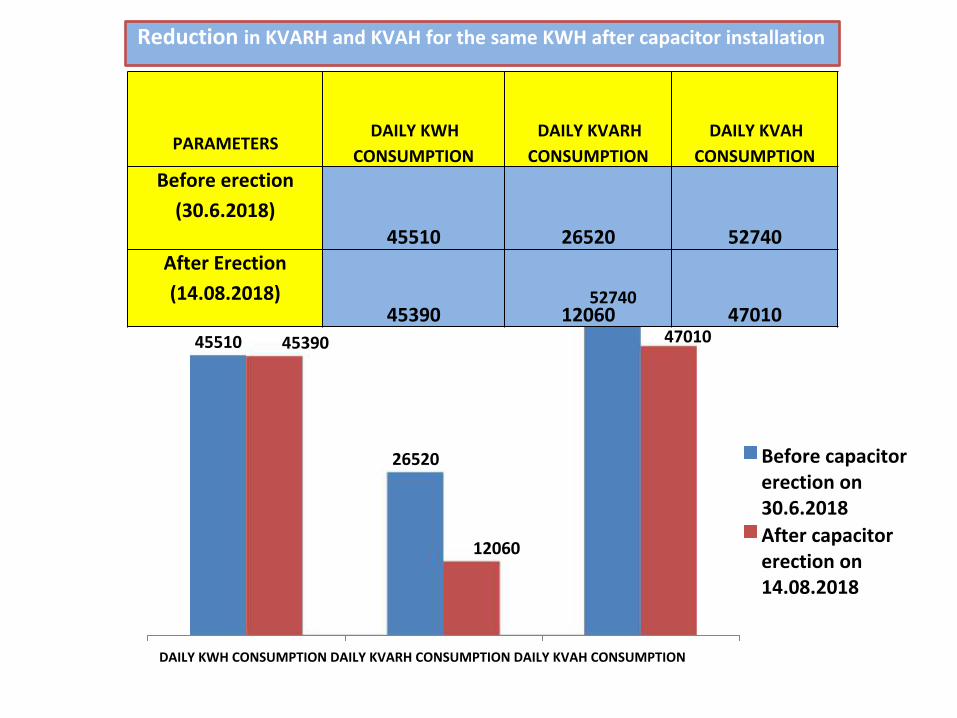
Reduction in KVARH and KVAH for the same KWH after capacitor installation
PARAMETERSDAILY KWH
CONSUMPTIONDAILY KVARH
CONSUMPTIONDAILY KVAH
CONSUMPTIONBefore erection
(30.6.2018)45510 26520 52740
After Erection(14.08.2018)
45390 12060 4701052740
45510 45390 47010
26520
12060
DAILY KWH CONSUMPTION DAILY KVARH CONSUMPTION DAILY KVAH CONSUMPTION
Before capacitorerection on30.6.2018After capacitorerection on14.08.2018
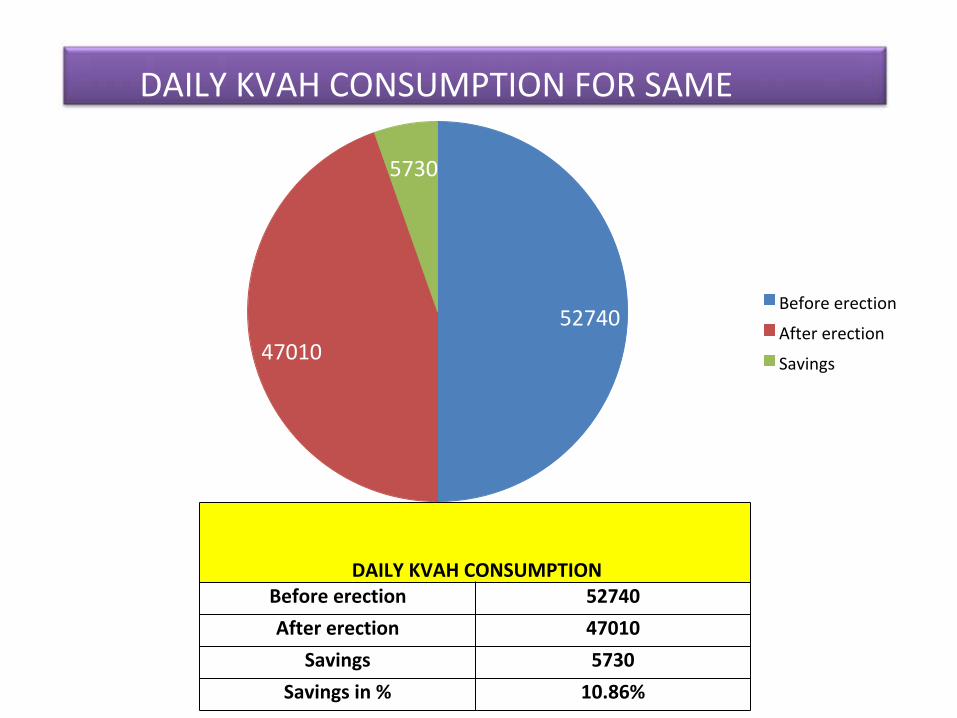
DAILY KVAH CONSUMPTION FOR SAME KWH
5730
4701052740
Before erection
After erection
Savings
DAILY KVAH CONSUMPTIONBefore erection 52740After erection 47010
Savings 5730Savings in % 10.86%
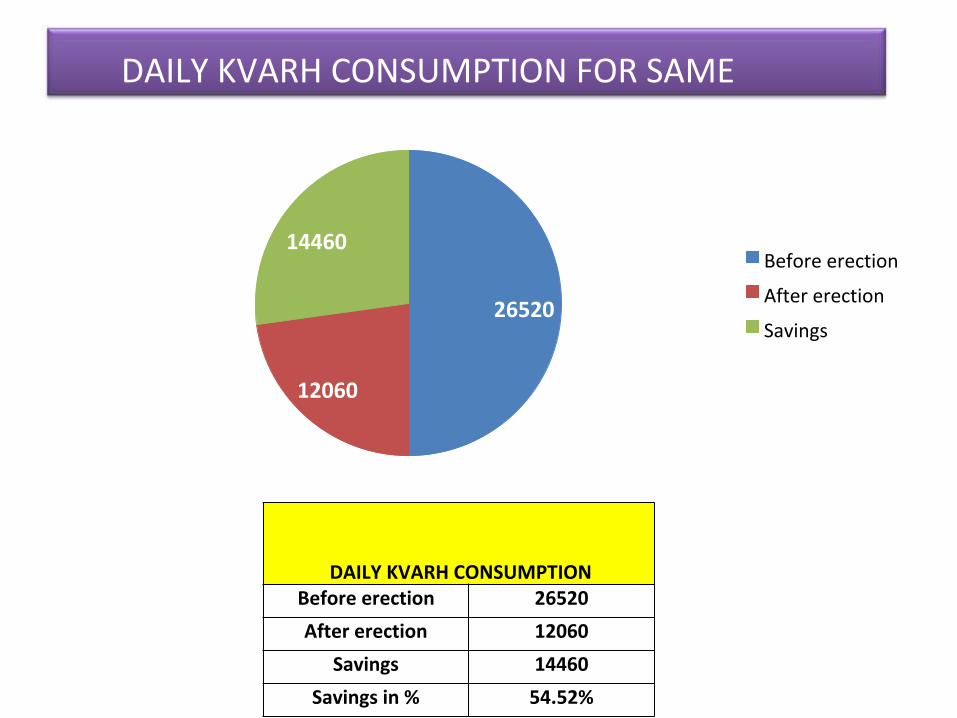
DAILY KVARH CONSUMPTION FOR SAME KWH
14460Before erection
26520 After erection
Savings
12060
DAILY KVARH CONSUMPTIONBefore erection 26520After erection 12060
Savings 14460Savings in % 54.52%

Data showing improved capability of feeder with additional KWhfor the same KVAH after installation of capacitor
DateKWH
READING
DAILY KWHCONSUMPTION (WITH MF
600)
HOURLY KWHCONSUMPTI
ON
KVARHREADING
DAILY KVARHCONSUMPTION (WITH MF
600)
HOURLYKVARHC
ONSUMPTI
ON
KVAHREADING
DAILY KVAHCONSUMPTION (WITH
MF 600)
HOURLYKVAHC
ONSUMP
TION
PF
Before capacitor erection
27.6.18 1047.85
37260
1552.5
616.55
21780 907.5 1216.25
43200
1800
0.8625
28.6.18 1109.95
64350
2681.25
652.85
37710 1571.25
1288.25
74610
3108.75
0.8624
29.6.18 1217.2
66960
2790 715.7
39810 1658.75
1412.6
77880
3245
0.8597
3375 168570
7023.75
1985.1
99300 4137.5
3917.1
195690
8153.75
After capacitor erection
14.8.18 5464.85
45390
1891.25
2948.6
12060 502.5 6228.9
47010
1958.75
0.9655
15.8.18 5540.5
46680
1945 2968.7
12330 513.75
6307.25
48300
2012.5
0.9664
16.8.18 5618.3
47640
1985 2989.25
11760 490 6387.75
49110
2046.25
0.9700
17.8.18 5697.7
49650
2068.75
3008.85
12450 518.75
6469.6
51180
2132.5
0.9701
189360
7890 11915.4
48600 2025 25393.5
195600
8150
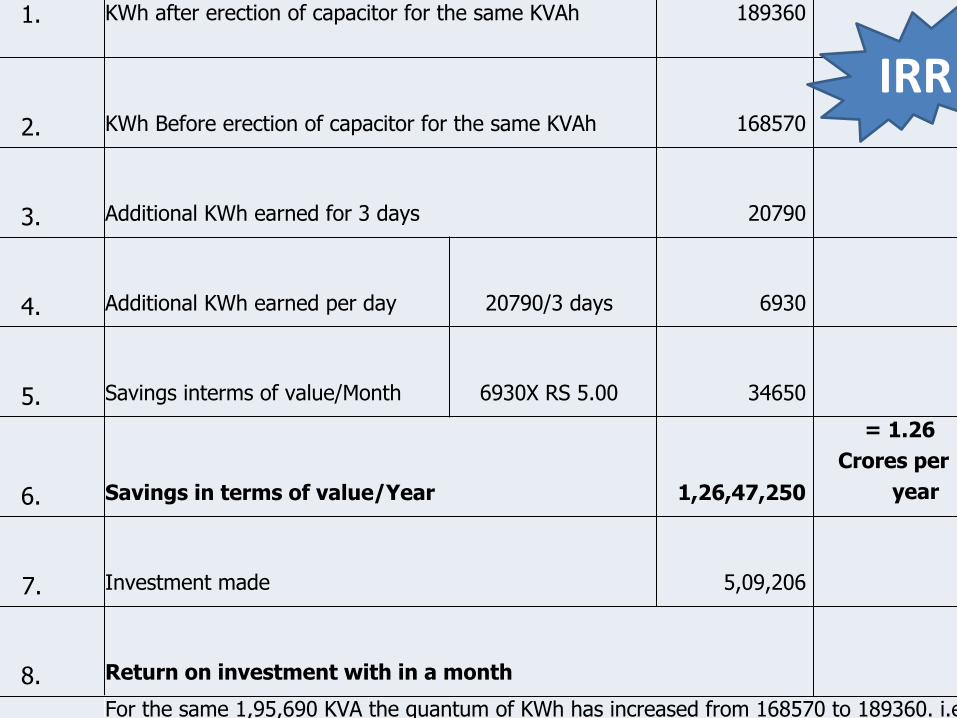
IRR1. KWh after erection of capacitor for the same KVAh 189360
2. KWh Before erection of capacitor for the same KVAh 168570
3. Additional KWh earned for 3 days 20790
4. Additional KWh earned per day 20790/3 days 6930
5. Savings interms of value/Month 6930X RS 5.00 34650
6. Savings in terms of value/Year 1,26,47,250
= 1.26Crores per
year
7. Investment made 5,09,206
8. Return on investment with in a month
For the same 1,95,690 KVA the quantum of KWh has increased from 168570 to 189360. i.e 11 % increased.
IRR
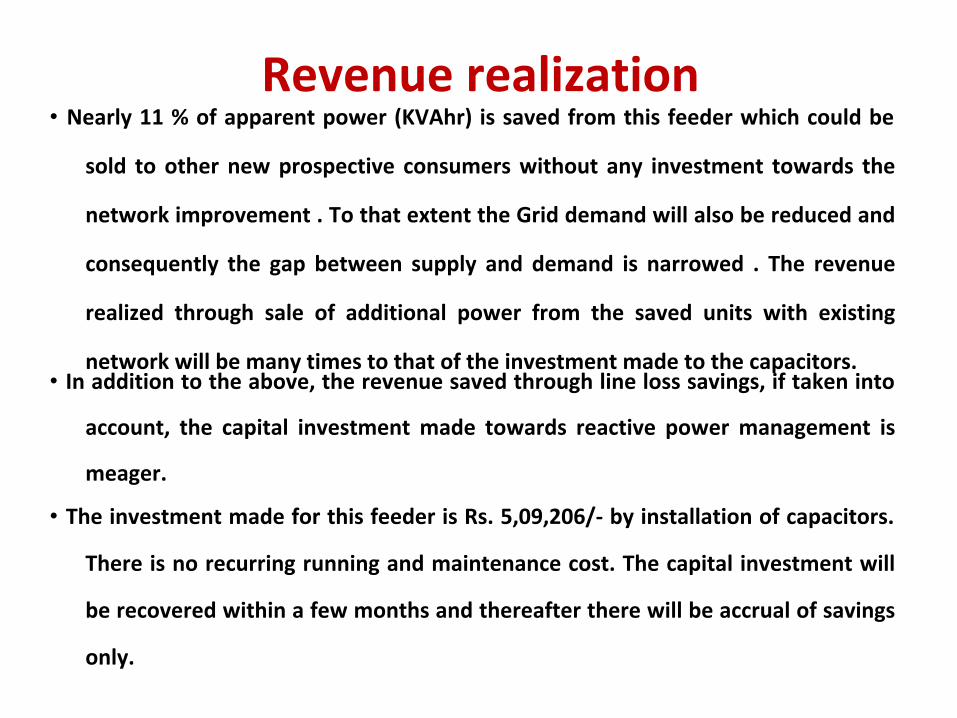
Revenue realization• Nearly 11 % of apparent power (KVAhr) is saved from this feeder which could be
sold to other new prospective consumers without any investment towards the
network improvement . To that extent the Grid demand will also be reduced and
consequently the gap between supply and demand is narrowed . The revenue
realized through sale of additional power from the saved units with existing
network will be many times to that of the investment made to the capacitors.• In addition to the above, the revenue saved through line loss savings, if taken into
account, the capital investment made towards reactive power management is
meager.
• The investment made for this feeder is Rs. 5,09,206/- by installation of capacitors.
There is no recurring running and maintenance cost. The capital investment will
be recovered within a few months and thereafter there will be accrual of savings
only.
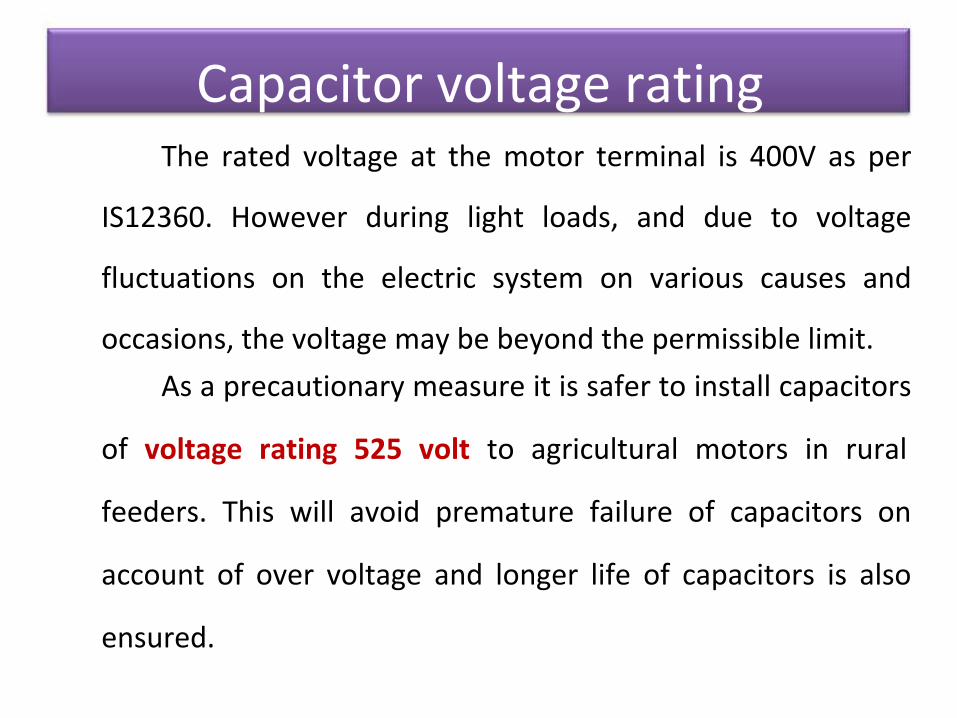
Capacitor voltage ratingThe rated voltage at the motor terminal is 400V as per
IS12360. However during light loads, and due to voltage
fluctuations on the electric system on various causes and
occasions, the voltage may be beyond the permissible limit.As a precautionary measure it is safer to install capacitors
of voltage rating 525 volt to agricultural motors in rural
feeders. This will avoid premature failure of capacitors on
account of over voltage and longer life of capacitors is also
ensured.

Strategies to be adopted for effectiveImplementation
1. Three phase Agriculture predominant feeders should be selected.
2. Feeders feeding to town Panchayat should be selected so as to
book the expenditure under IPD Scheme .3. To be erected only in working AGL SC .
4. Provision of capacitor to both motors if the SC with DPDT switch.
5. Consumers should be educated regarding benefits
of the erection of capacitors.
6. Consumers are also to be sensitised not to disconnect the capacitors at any circumstances.
7. The periodic inspection is to be carried out in the AGL SCs where the capacitors provided to ensure the mechanism in place.
Contd..

8. The feeders’ reading should be taken through CMRI before and after capacitors erection for analysis.
9. Capacitors should be connected after main switch. If the motor is star delta connection, capacitor should be connected in Delta connection side.
10. Capacitor to be purchased under e tendering .Labour rate should be approved at regional level. i.e Rs 150/- per service including tax.
11. Clamp on meter to be purchased and issued to field for taking readings.

•
•
•
•
Readings to be recorded before and after installation of capacitorsHourly reading of feeder meter for the parameters voltage,
current, Frequency, PF, KWHr, KVAHr, KVArh to be taken for the selected feeders and to be recorded in a separate register .DLMS compliant feeder meter to be provided in the selected feeder.No. of Distribution Transformer connected in the feeder along with DT metering arrangement.HP wise agriculture service connection in the selected feeders to be recorded.

Pilot study readings and otherdocuments

Before capacitor Installation (HT feeder ’s reading)
Date KWH READING
DAILY KWHCONSUMPT
ION(WITH MF
600)
HOURLY KWHCONSUMPTIO
N
KVARHREADING
DAILY KVARHCONSUMPTION (WITH MF
600)
HOURLYKVARHCO
NSUMPTIO
N KVAHREADING
DAILY KVAHCONSUMPTION(WITH MF 600)
HOURLYKVAH
CONSUMPTION PF
18-06-2018
122 48810 2033.75 74.95 29310 1221.25 143.3 56940 2372.5 0.857218
19-06-2018
203.35 53220 2217.5 123.8 31290 1303.75 238.2 61770 2573.75 0.861583
20-06-2018
292.05 62700 2612.5 175.95 37260 1552.5 341.15 72960 3040 0.859375
21-06-2018
396.55 66060 2752.5 238.05 38070 1586.25 462.75 76260 3177.5 0.866247
22-06-2018
506.65 67710 2821.25 301.5 39360 1640 589.85 78360 3265 0.864089
23-06-2018
619.5 64530 2688.75 367.1 37350 1556.25 720.45 74580 3107.5 0.865245
24-06-2018
727.05 66090 2753.75 429.35 38400 1600 844.75 76440 3185 0.8646
25-06-2018
837.2 60210 2508.75 493.35 35190 1466.25 972.15 69780 2907.5 0.862855
26-06-2018
937.55 66180 2757.5 552 38730 1613.75 1088.45 76680 3195 0.863067
27-06-2018
1047.85 37260 1552.5 616.55 21780 907.5 1216.25 43200 1800 0.8625
28-06-2018
1109.95 64350 2681.25 652.85 37710 1571.25 1288.25 74610 3108.75 0.862485
29-06-2018
1217.2 66960 2790 715.7 39810 1658.75 1412.6 77880 3245 0.859784
30-06-2018
1328.8 45510 1896.25 782.05 26520 1105 1542.4 52740 2197.5 0.862912
01-07-2018
1404.65 52140 2172.5 826.25 31440 1310 1630.3 60900 2537.5 0.856158
02-07-2018
1491.55 32400 1350 878.65 19590 816.25 1731.8 37860 1577.5 0.855784
03-07-2018
1545.55 31680 1320 911.3 19680 820 1794.9 37320 1555 0.848875
04-07-2018
1598.35 46830 1951.25 944.1 27870 1161.25 1857.1 54510 2271.25 0.859108
05-07-2018
1676.4 57060 2377.5 990.55 33360 1390 1947.95 66120 2755 0.862976
06-07-2018
1771.5 63690 2653.75 1046.15 36690 1528.75 2058.15 73500 3062.5 0.866531
07-07-2018
1877.65 67050 2793.75 1107.3 40620 1692.5 2180.65 78420 3267.5 0.855011
08-07-2018
1989.4 66030 2751.25 1175 41730 1738.75 2311.35 78120 3255 0.845238
09-07-2018
2099.45 54930 2288.75 1244.55 35430 1476.25 2441.55 65400 2725 0.839908
10-07-2018
2191 46080 1920 1303.6 30180 1257.5 2550.55 55110 2296.25 0.836146
11-07-2018
2267.8 32460 1352.5 1353.9 21210 883.75 2642.4 38790 1616.25 0.836814
12-07-2018
2321.9 33450 1393.75 1389.25 21660 902.5 2707.05 39870 1661.25 0.838977
13-07-2018
2377.65 42420 1767.5 1425.35 25530 1063.75
2773.5 49530 2063.75
0.856451
14-07-2018
2448.35 48600 2025 1467.9 28980 1207.5 2856.05
56610 2358.75
0.858506
15-07-2018
2529.35 58170 2423.75 1516.2 35250 1468.75
2950.4 68010 2833.75
0.855315
Date KWH READING
DAILY KWH
MF 600)
DAILY KVARHCONSUMPTIO
600)
HOURLY
ON
DAILY KVAH
MF 600)
HOURLY KVAHCONSUMPTIO
N
PF
16-07-2018 2626.3 0.85479117-07-2018 2727.55 0.85866718-07-2018 2840.25 0.85790719-07-2018 2912.4 0.86009320-07-2018 3033.2 0.85812821-07-2018 3151.45 0.85172322-07-2018 3273.8 0.8564223-07-2018 3392.2 0.86112124-07-2018 3508.15 0.87202925-07-2018 3618.2 0.87752626-07-2018 3724.6 0.88835527-07-2018 3807.75 0.89949528-07-2018 3887.85 0.90272429-07-2018 3980.65 0.90062730-07-2018 4081.25 0.90994831-07-2018 4177.75 0.90918301-08-2018 4267.35 0.90746302-08-2018 4373.75 0.91517503-08-2018 4481.1 0.91296804-08-2018 4586 0.91619905-08-2018 4683.85 0.91732506-08-2018 4770.95 0.92374507-08-2018 4866.65 0.93096408-08-2018 4958.35 0.92692509-08-2018 5052.85 0.93194210-08-2018 5146.65 0.94613811-08-2018 5239.75 0.96310412-08-2018 5315.45 0.96838713-08-2018 5390.5 0.96621214-08-2018 5464.85 0.96553915-08-2018 5540.5 0.9664616-08-2018 5618.3 0.97006717-08-2018 5697.7 0.970106
After capacitor Installation (HT feeder ’s reading) Condt.. CONSUMPTI HOURLY KWH KVARH
ON (WITH CONSUMPTION READINGKVARH KVAH CONSUMPTI
N (WITH MF CONSUMPTI READING ON (WITH
60750 2531.25 1574.95 36810 1533.75 3063.75 71070 2961.25 67620 2817.5 1636.3 40320 1680 3182.2 78750 3281.25 43290 1803.75 1703.5 25920 1080 3313.45 50460 2102.5 72480 3020 1746.7 42930 1788.75 3397.55 84270 3511.25 70950 2956.25 1818.25 42420 1767.5 3538 82680 3445 73410 3058.75 1888.95 45120 1880 3675.8 86190 3591.25 71040 2960 1964.15 42750 1781.25 3819.45 82950 3456.25 69570 2898.75 2035.4 41040 1710 3957.7 80790 3366.25 66030 2751.25 2103.8 37020 1542.5 4092.35 75720 3155 63840 2660 2165.5 34830 1451.25 4218.55 72750 3031.25 49890 2078.75 2223.55 25770 1073.75 4339.8 56160 2340 48060 2002.5 2266.5 23340 972.5 4433.4 53430 2226.25 55680 2320 2305.4 26460 1102.5 4522.45 61680 2570 60360 2515 2349.5 29070 1211.25 4625.25 67020 2792.5 57900 2412.5 2397.95 26340 1097.5 4736.95 63630 2651.25 53760 2240 2441.85 24540 1022.5 4843 59130 2463.75 63840 2660 2482.75 29520 1230 4941.55 70350 2931.25 64410 2683.75 2531.95 28410 1183.75 5058.8 70380 2932.5 62940 2622.5 2579.3 28110 1171.25 5176.1 68940 2872.5 58710 2446.25 2626.15 25680 1070 5291 64080 2670 52260 2177.5 2668.95 22650 943.75 5397.8 56970 2373.75 57420 2392.5 2706.7 23760 990 5492.75 62160 2590 55020 2292.5 2746.3 21630 901.25 5596.35 59100 2462.5 56700 2362.5 2782.35 22890 953.75 5694.85 61170 2548.75 56280 2345 2820.5 21870 911.25 5796.8 60390 2516.25 55860 2327.5 2856.95 18900 787.5 5897.45 59040 2460 45420 1892.5 2888.45 12570 523.75 5995.85 47160 1965 45030 1876.25 2909.4 11670 486.25 6074.45 46500 1937.5 44610 1858.75 2928.85 11850 493.75 6151.95 46170 1923.75 45390 1891.25 2948.6 12060 502.5 6228.9 47010 1958.75 46680 1945 2968.7 12330 513.75 6307.25 48300 2012.5 47640 1985 2989.25 11760 490 6387.75 49110 2046.25 49650 2068.75 3008.85 12450 518.75 6469.6 51180 2132.5
Set of Readings of same feeder to analyse Amp/KW .DATE VOLTAGE AVG PF KVA KVAr AMPS KW AMP/KW
01.07.2018 21.51 0.855 2537.63 1309.88 68.29 2172.75 0.0314
02.07.2018 21.86 0.847 1577.63 815.25 42.11 1349.75 0.0312
03.07.2018 21.82 0.847 1555.13 820.88 41.18 1319.63 0.0312
04.07.2018 21.50 0.858 2271.25 1161.50 62.11 1950.88 0.0318
05.07.2018 21.21 0.862 2755.25 1389.88 75.23 2379.00 0.0316
06.07.2018 20.63 0.866 3062.50 1527.88 84.06 2653.50 0.0317
07.07.2018 21.61 0.854 3266.88 1692.63 87.49 2793.63 0.0313
08.07.2018 21.89 0.844 3255.50 1739.63 86.01 2750.75 0.0313
09.07.2018 21.78 0.838 2725.75 1476.25 72.65 2289.88 0.0317
10.07.2018 21.83 0.835 2295.38 1257.13 60.92 1919.00 0.0317
11.07.2018 21.77 0.836 1616.50 884.25 42.94 1352.63 0.0317
12.07.2018 21.79 0.836 1661.75 902.00 44.14 1393.88 0.0317
13.07.2018 21.47 0.856 2063.75 1063.88 55.69 1768.13 0.0315
14.07.2018 21.47 0.857 2357.63 1208.25 63.62 2024.50 0.0314
15.07.2018 21.70 0.855 2834.38 1468.75 75.53 2424.25 0.0312
16.07.2018 21.53 0.854 2960.75 1534.00 81.04 2531.63 0.0320
17.07.2018 21.50 0.857 2960.75 1534.00 88.37 2531.63 0.0349
18.07.2018 21.51 0.904 3153.93 1619.62 87.82 2705.43 0.0325
19.07.2018 21.23 0.859 3510.88 1788.25 95.94 3019.75 0.0318
20.07.2018 21.30 0.857 3445.50 1768.50 93.74 2955.63 0.0317
Contd..
Set of Readings of same feeder to analyse Amp/KW .DATE VOLTAGE AVG PF KVA KVAr AMPS KW AMP/KW
21.07.2018 21.62 0.851 3591.88 1879.38 96.11 3059.00 0.031422.07.2018 21.55 0.856 3455.63 1781.88 92.73 2960.25 0.031323.07.2018 21.31 0.860 3366.13 1709.75 91.44 2898.88 0.031524.07.2018 21.07 0.871 3155.00 1543.00 86.75 2750.88 0.031525.07.2018 21.21 0.877 3031.13 1450.88 82.79 2660.75 0.031126.07.2018 21.46 0.889 2339.75 1072.88 62.98 2077.13 0.030327.07.2018 21.32 0.899 2226.75 972.88 60.54 2002.38 0.030228.07.2018 21.34 0.901 2570.00 1102.88 69.86 2320.88 0.030129.07.2018 21.66 0.901 605.38 1395.69 74.59 2515.13 0.029730.07.2018 21.41 0.910 2651.63 1098.25 71.78 2412.13 0.029831.07.2018 21.73 0.910 2240.88 1022.88 65.69 2464.00 0.026701.08.2018 21.92 0.908 2931.00 1230.13 77.56 2659.50 0.029202.08.2018 21.81 0.915 2933.13 1182.63 77.56 2683.25 0.028903.08.2018 22.16 0.913 2872.88 1171.88 74.81 2622.38 0.028504.08.2018 22.07 0.916 2669.50 1069.25 71.31 2445.63 0.029205.08.2018 22.11 0.918 2373.50 944.38 62.06 2178.13 0.028506.08.2018 21.69 0.923 2589.75 989.50 69.00 2392.88 0.028807.08.2018 21.62 0.930 2463.50 900.88 65.88 2292.13 0.028708.08.2018 22.04 0.929 2549.00 954.75 67.38 2362.63 0.028509.08.2018 21.76 0.933 2515.88 910.25 66.75 2345.75 0.028510.08.2018 21.55 0.948 2459.38 787.88 66.50 2328.63 0.028611.08.2018 21.93 0.964 1979.63 538.75 52.00 2328.63 0.022312.08.2018 22.09 0.967 1938.38 486.38 50.69 2328.63 0.021813.08.2018 22.06 0.966 1924.38 493.75 50.44 1859.38 0.0271

Study at LT side in Sample Services
SL NO DATE SC NOCAPACITORRATING IN
KVAr
AMPS/KW (Before
errection)
AMPS/KW (After
errection)
Reduction inAMPS
1 19.07.2018 83
2
5.53 5.13
7.84%2 19.07.2018 61
2
5.00 4.41
10.68%3 19.07.2018 4
3
5.49 5.00
8.51%4 19.07.2018 296
3
7.41 5.22
27.69%5 20.07.2018 455 3 5.57 4.79
12.61%6 20.07.2018 567 2 5.56 4.84
11.92%7 20.07.2018 470 3 5.34 4.48
17.92%8 20.07.2018 443 3 5.20 4.42
13.54%9 23.07.2018 184 2 5.77 4.74
15.59%Condt……

Study at LT side in sample Services
SL NO DATE SC NOCAPACITORRATING IN
KVAr
AMPS/KW (Before
errection)
AMPS/KW (After
errection)
Reduction inAMPS
10 23.07.2018 576 4 5.13 4.11
15.00%11 24.07.2018 295 2 5.69 4.73
16.42%12 24.07.2018 359 2 5.13 4.79
19.20%13 24.07.2018 329 2 6.01 4.93
19.44%14 25.07.2018 172 4 5.48 4.52
13.10%15 25.07.2018 254 3 5.85 5.05
14.04%16 30.07.2018 548 3 5.76 4.88
14.92%17 20.07.2018 550 2 5.88 5.24
16.02%18 20.07.2018 527 3 4.43 4.52
14.79%19 21.07.2018 174 2 5.50 4.94
12.07%Other services in the separate excel sheet
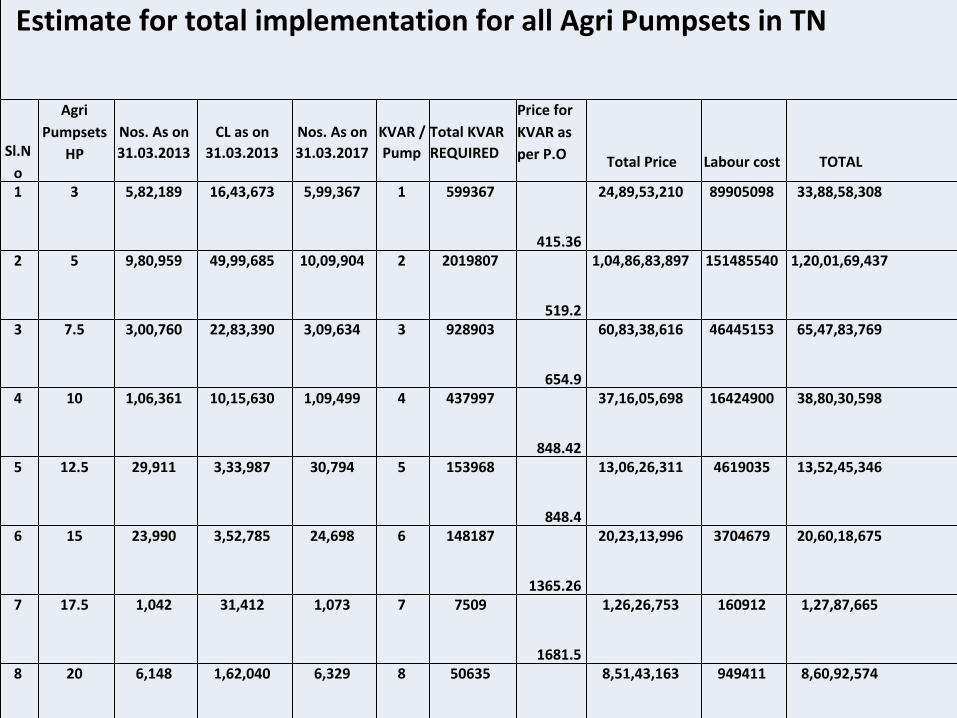
Estimate for total implementation for all Agri Pumpsets in TN
Sl.No
AgriPumpsets
HPNos. As on 31.03.2013
CL as on 31.03.2013
Nos. As on 31.03.2017
KVAR / Pump
Total KVAR REQUIRED
Price forKVAR asper P.O Total Price Labour cost TOTAL
1 3 5,82,189 16,43,673 5,99,367 1 599367
415.36
24,89,53,210 89905098 33,88,58,308
2 5 9,80,959 49,99,685 10,09,904 2 2019807
519.2
1,04,86,83,897 151485540 1,20,01,69,437
3 7.5 3,00,760 22,83,390 3,09,634 3 928903
654.9
60,83,38,616 46445153 65,47,83,769
4 10 1,06,361 10,15,630 1,09,499 4 437997
848.42
37,16,05,698 16424900 38,80,30,598
5 12.5 29,911 3,33,987 30,794 5 153968
848.4
13,06,26,311 4619035 13,52,45,346
6 15 23,990 3,52,785 24,698 6 148187
1365.26
20,23,13,996 3704679 20,60,18,675
7 17.5 1,042 31,412 1,073 7 7509
1681.5
1,26,26,753 160912 1,27,87,665
8 20 6,148 1,62,040 6,329 8 50635
1681.5
8,51,43,163 949411 8,60,92,574
9 above 20 2,095 73,975 2,157 9 19411
1681.5
3,26,40,175 323522 3,29,63,697
Total 20,33,455 1,08,96,577 20,93,455 4365786 2,74,09,31,819 314018250 3,05,49,50,069
Rs. 305 CroresApprx.

Capacitor
Capacitor erected in AGL SC
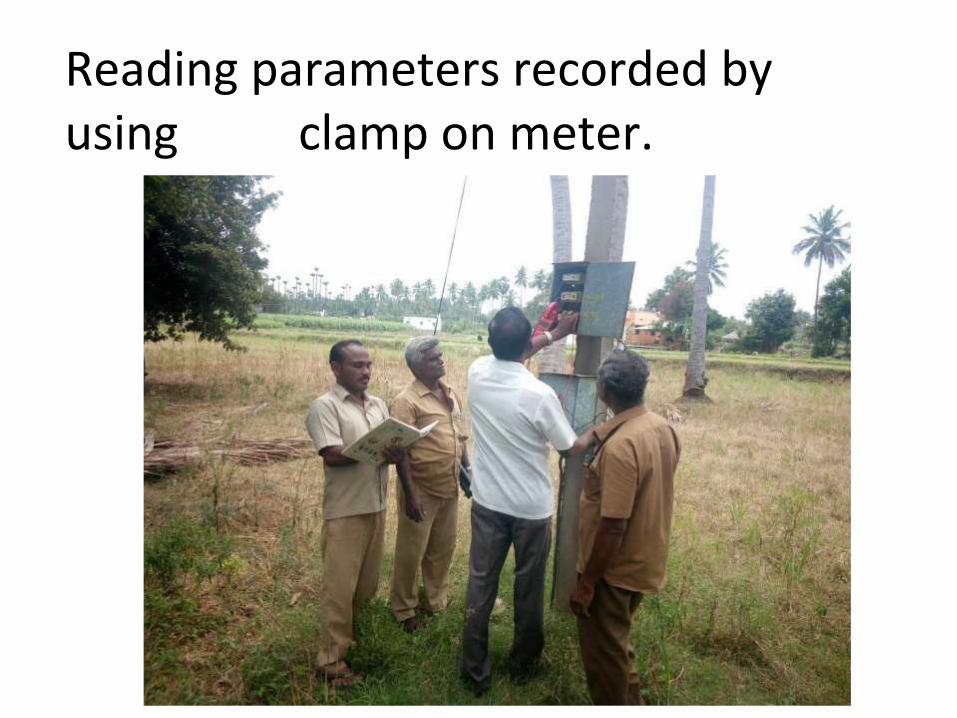
Reading parameters recorded by using clamp on meter.
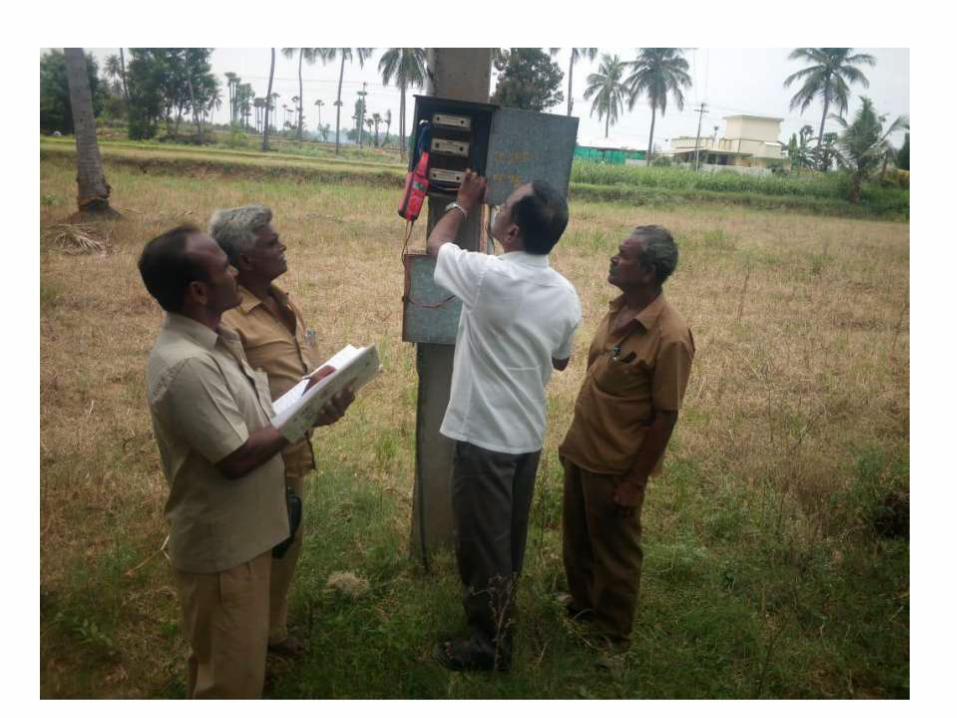

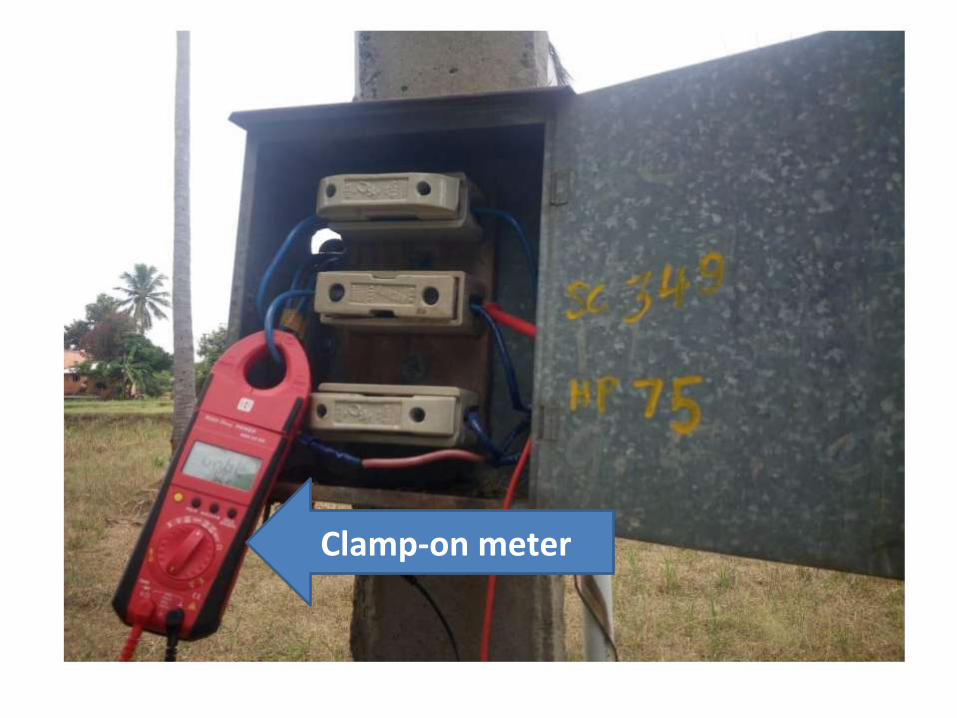
Clamp-on meter

Thank youSmall things matter
PERSPECTIVE OF MSEDCL
(MAHARASHTRA)
ON
REAL TIME MARKET
06.08.2020
2
Real Time Market (RTM)- Introduction
▪ CERC has introduced a Real Time Market (RTM) platform from
01st June-2020 in the Country.
▪ MSEDCL welcomes the good initiative taken by MoP & CERC for
implementation of Real Time Market in the Country .
▪ RTM is a Half Hourly market
❖Conducted every half an hour (48 times per day)
❖Delivery for 30 minutes in two time blocks of 15 minutes each
▪ RTM is helpful for the management of real-time Load Generation
Balance.

3
RTM – Benefits to MSEDCL
➢ Management of Real time deviations:
▪ Shortfall due to forced outages/unexpected rise in demand.
▪ Surplus due to sudden drop in demand.
▪ Unexpected variation in RE generation
➢ Cost optimization :
▪ Backing down of costly thermal generation & utilizing cheap power in
RTM
➢ Hydro Resource optimization:
▪ Koyna Hydro generation is utilized to meet peak demand and in real time
deviation,due to limited allocation of water quota, cheap RTM power
helps to save the water .
➢ Meeting out the shortfall in DAM purchase :
▪ Meeting out Balance Power requirement when complete Power in DAM is
not cleared.
➢ DSM sign change:
▪ RTM helps for DSM sign change to some extent.

4
Case-I – Management of UI with RTM after force outage of 660 MW APML
unit & unavailable of Koyna Hydro 4 M/cs(1000 MW) – Dt 14th July 2020
0.00
0.50
1.00
1.50
2.00
2.50
3.00
3.50
4.00
4.50
5.00
-300
-100
100
300
500
700
1 2 3 4 5 6 7 8 9 10 11 12 13 14 15 16 17 18 19 20 21 22 23 24
M
W
Hrs
UI (MW) RTM Purchase (MW) RTM Rate
-1.00
0.00
1.00
2.00
3.00
4.00
5.00
-200
0
200
400
600
800
1000
1200
1 2 3 4 5 6 7 8 9 10 11 12 13 14 15 16 17 18 19 20 21 22 23 24
M
W
HrsBackdown (MW) RTM Purchase/Sell (MW) RTM Avg Rate
Case-II – Cost Optimization with RTM – by back-down of on-bar thermal generation (
19th July 20

5
Case-III – Variation in wind generation is managed with RTM (12th June)
0.00
0.50
1.00
1.50
2.00
2.50
3.00
3.50
0
200
400
600
800
1000
1200
1400
1600
1800
1 2 3 4 5 6 7 8 9 10 11 12 13 14 15 16 17 18 19 20 21 22 23 24
11 Jun Wind (MW) 12 Jun Wind (MW) RTM Purchase 12 Jun(MW) RTM Avg. Rate
0.00
0.50
1.00
1.50
2.00
2.50
3.00
3.50
4.00
4.50
-400
-200
0
200
400
600
800
1000
1200
1400
1600
1800
1 2 3 4 5 6 7 8 9 10 11 12 13 14 15 16 17 18 19 20 21 22 23 24
Rise in demand on 9th wrt 8th Jun Demand (MW) RTM Purchase 9th Jun(MW) RTM Avg. Rate
Case-IV – Rise in Demand is managed partly with RTM (9th June)
6
MSEDCL – Power Purchase in DAM & RTM & RTM Benefits
0.00
0.50
1.00
1.50
2.00
2.50
3.00
3.50
0.00
5.00
10.00
15.00
20.00
25.00
30.00
35.00
40.00
45.00
DAM Buy Mus RTM Buy Mus DAM Rate (landed) RTM Rate (landed)
June-2020June-2020
DAM Buy MUs 431.16
DAM Rate (Landed)
(Rs/kWh)2.78
RTM Buy Mus 78.33
RTM Rate
(Landed)(Rs/kWh)2.65
RTM Benefits
(in CRs) 5.26
July-2020
DAM Buy MUS 212.64
DAM Rate (Landed)
(Rs/kWh)2.80
RTM Buy Mus 34.79
RTM Rate
(Landed)(Rs/kWh)2.42
RTM Benefits
(in CRs) 4.25
0.00
0.50
1.00
1.50
2.00
2.50
3.00
3.50
0.00
5.00
10.00
15.00
20.00
25.00
DAM Buy Mus RTM Buy Mus DAM Rate (landed) RTM Rate (landed)
July-2020
7
MSEDCL – Power Sell in DAM & RTM & RTM Benefits
July-2020
July-2020
DAM Sell MUS 2.77
DAM Rate (Landed)
(Rs/kWh)4.01
RTM Sell Mus 13.00
RTM Rate
(Landed)(Rs/kWh)3.22
RTM Benefits (in
CRs) 1.30
0
0.5
1
1.5
2
2.5
3
3.5
4
4.5
0.00
0.20
0.40
0.60
0.80
1.00
1.20
1.40
1.60
1.80
2.00
DAM sell Mus RTM sell Mus DAM Rate (landed) RTM Rate (landed)

8
▪ Presently, 4 time blocks are kept after Gate Closure time for RTM clearance for
checking of Corridor availability & for scheduling process.
• Issue
Reduction in flexibility available with DISCOM to manage deviation arising
mainly on account of variation in RE
• Observation
- From the last two months experience , it is seen that provisional result of
Market are available within 2-3 minute after closing of sessions.
- It is possible to reduce these 4 blocks to 2 blocks with the following process:
➢ NLDC to furnish the available transmission corridors to the Power
Exchange(s) before the trading for RTM before specific Gate Closure time.
➢ Result of Market to be provided to NLDC & all RLDC/SLDC immediately for
scheduling & based on corridor given by NLDC,
➢ Schedule to be prepared in immediate 2nd time block from bid submission
time block (instead of 4th time block) & SMS/Email alert to all Participant in
RTM by Market operator.
➢ Fast Track implementation of National Open Access Registry (NOAR)
• Possibility shall be explored to make market for 15 min instead of 30 min.
Suggestion for Betterment –
Reduction in Gate Closure time & Implementation of NOAR
9
Way forward
▪ For Reduction in power purchase cost and utilization of RTM Power,
- Accurate Demand Forecasting, Power Schedule Optimizer is required.
- Good communication network for monitoring generation & load point
data in real time is required.
▪ Development of National level Demand Forecasting &
Schedule Optimizer software and to be made available to all
DISCOMs/system operators.
▪ Strengthening of Communication network for real time data
transfer

10
THANK YOU