Embed Size (px)
Citation preview
1 | P a g e
MINUTES
BOARD MEETING
September 12, 2011
REGULAR MEETING
At 7:00 p.m. on September 12, 2011, Ms. Nelson convened the Watson Chapel
Board of Education Annual Report to the Public. Board members present were Mr.
Hartsfield, Mr. Holcomb, Mr. Reynolds, Mrs. Barker, Mrs. Boone, and Mr. Waddle.
School administrative personnel present were Mr. Hazelwood, Ms. Melton, Mr. Branch,
Ms. Martin, Dr. Johnson, Ms. Shaw, Ms. Dunn, Mr. Tietz, Mr. Glover, Mrs. Metcalf, Ms.
Williams, Dr. Willis, Mr. Taylor, Mrs. Barbaree, Mrs. Sharpmack, Mrs. Walker, Mr.
Rawls, and Mr. Webb.
ANNUAL REPORT TO THE PUBLIC
Ms. Nelson recognized Mr. Hazelwood who started the report with a welcome
and preview of the report agenda. He said all schools were fully accredited for the 2010-
2011 school year and he expects that will be again when the Department of Education
checks this year. He also reported that the starting enrollment number (3065) is the
lowest number we have started with in the last five years. He ended by reporting that the
school district is financially sound with no major funding issues or problems.
Brenda Melton, Assistant Superintendent for Instruction, presented the District
Mission Statement and Goals. She reported on Staff Development, Federal and State
Programs, Supplemental Educational Services, Achievement Test results, School
Improvement, Alternative Learning classes, Course Offerings, EAST program, and
programs for the Gifted and Talented.
Cornovious Branch, Transportation Director, reported on starting the school year,
number of buses, drivers, and students served, bus mechanic and drivers training, bus
schedules, and expansion of transportation services to serve after-school programs.
Natasha Dunn, Director of Special Services, reported on number of teachers,
speech therapist, consultants, and students served.
Ronette Metcalf reported on the Gifted and Talented programs. She reported on
number of students served, programs offered, student accomplishments in advanced
placement and Quiz Bowl competitions. She also explained how the GT programs is
transitioning into a pull-out program at Edgewood and L.L. Owen.
Brenda Sharpmack, Technology Coordinator, reported on CIPA compliance,
internet safety training, computer-based remediation programs, new hardware and
software implementations, and EDLINE utilization by teachers.
Bill Tietz, Facilities Director, reported on ongoing projects including, the stadium
upgrades, HVAC upgrade at the high school, roofing at the junior high and Coleman, and
the addition to the high school auto mechanics building.
2 | P a g e
Leydel Willis, Principal, at the high school reported that they had a successful
start to school and is very proud of the building improvements. She mentioned several
student programs that are showing great success like Vocational classes, APEX Learning
for credit recovery, East Lab News broadcast, Career Coaches, and extracurricular sports.
Henry Webb, Junior High School Principal reported a large turnout for the 7th
grade orientation, building and staff improvement, and a continued incentive program for
test score improvement.
Anne Shaw, Coleman Principal reported enrollment figures, improved test scores,
utilization of E2E and the math coaches. She also spoke about several software programs
like EDLINE and Accelerated Reader and Math that are showing high gains in
participation.
Tim Taylor, L.L. Owen Principal, reported enrollment numbers for each class and
several successful programs like Accelerated Math and Reading, Scouts, Compass
Learning, Education City, Learning Institute, E2E, and EDLINE/Grade-Quick. He also
spoke about current test scores and different strategies for remediation like the
afterschool program.
Jennifer Barbaree, Edgewood Principal, reported number of teachers and students
at her school. She listed the programs and technology used by her staff and invited board
members to visit her campus.
Jesse Rawls, Director of Jefferson County Regional Adult Center, reported
number of students served for the past year. He listed the satellite teaching classes and
thanked the Watson Chapel School District for being their LEA.
OLD BUSINESS
Minutes. The minutes of the previous regular meeting were approved on a motion
by Mr. Reynolds and a second by Mr. Waddle.
Financial Statement. Mr. Hazelwood presented the financial statement for the
month of August, reporting $1,875,508.53 in revenue and expenditures of
$1,858,170.81 in the non-activity funds, leaving an ending balance of
$7,168,040.06. On a motion by Mr. Hartsfield and a second by Mrs. Barker, the
Board voted unanimously to approve the district financial statement for the month
of August as presented.
NEW BUSINESS
Annual Financial Report & Budget. Mr. Hazelwood presented a summary of the
prior year’s revenues and expenditures and a proposed budget for the current year.
On a motion by Mr. Reynolds and a second by Mr. Holcomb, the motion passed
unanimously to approve the District’s Annual Report and Budget filing.
Minority Recruitment Plan. Mrs. Boone commented on her concern that the
District needed to work to hire a number of minority teachers that reflected the
percentage of minority students. With a motion from Mr. Hartsfield and a second
3 | P a g e
from Mr. Waddle the board unanimously approved the Arkansas Department of
Education Minority Teacher and Administrator Recruitment Plan.
Custodian/Maintenance Evaluation. On a motion by Mrs. Boone and a second by
Mr. Reynolds the board unanimously approved the use of the
Custodian/Maintenance evaluation.
BOARD COMMUNICATIONS
Mr. Hazelwood recognized Lois Chambless, High School Counselor for being
named “High School Counselor of the Year” for the Southeastern Region of the Arkansas
School Counselors Association.
Mr. Hazelwood also listed three opportunities for School Board Training that
have been scheduled.
New Board Member Workshop Oct. 18 Doubletree, Little Rock
Arkansas Regional School Boards Oct. 24 White Hall Cafeteria
School Board Audit Training Nov. 21 ARSC, Pine Bluff
PERSONNEL
Mr. Hazelwood reported accepting the resignations of Adrienne Metcalf Doles and
Juanita Buckmaster. He said we need to consider the employment of 6 Elementary teachers, a Jr. High Math Teacher, a Special Education Teacher, a School Nurse, 2 After
School Coordinators, 4 Cafeteria Worker Substitutes and 2 Bus Drivers. Ms. Nelson adjourned the board to executive session for that purpose.
After returning to open session, Mr. Hazelwood recommended the following:
1. Connie Spencer as an Elementary 1st Grade Teacher,
2. Michael Allen as a Elementary 5th Grade Teacher,
3. Kristi Massey as a Elementary 5th Grade Teacher,
4. Rhonda Lee as a Elementary 5th Grade Teacher,
5. Josh Sowards as a Elementary 6th Grade Teacher,
6. Michael Hartman as an Elementary 6th Grade Teacher,
7. Timothy Hendryx as a Jr. High Math Teacher,
8. Juanita King as a Junior High Special Education Teacher,
9. Kristine Brooks as a School Nurse,
10. Mary Downing as a After School Coordinator,
11. Ann Terrell as a After School Coordinator,
12. Tara Washington as a Cafeteria Worker Substitute,
13. Lena Willis as a Cafeteria Worker Substitute,
14. Sharon Duckworth as a Cafeteria Worker Substitute and,
15. Dorothy Girley as a Cafeteria Worker Substitute,
16. Monty Palmer as a Bus Driver,
17. Leron Tidwell as a Bus Driver.
4 | P a g e
On a motion by Mr. Hartsfield and a second by Mr. Waddle, the Board voted
unanimously to adopt the Superintendent’s recommendations.
There being no further business, Ms. Nelson adjourned the meeting.
Respectfully submitted, Danny Hazelwood and Brenda Melton, recorders.
Donnie Hartsfield
Board Secretary
5 | P a g e
Vision Statement
Preparing today’s students for tomorrow’s opportunities.
Mission Statement
Our mission is to educate students to become productive members of society and live a
healthy life. We plan to accomplish this mission by increasing achievement levels in
literacy, math, and science and providing a well-rounded curriculum in our schools.
Goals
The following goals apply to the entire student body:
1. Improvement of student achievement in all instructional areas
2. To meet and succeed average yearly progress as required by the state
3. To provide vocational programs beyond state requirements
4. To provide a curriculum that exceeds state requirements
5. To provide an enriched curriculum providing for advanced placement,
gifted and talented, and special education
6. To include concurrent courses enabling students to gain at least one year
of college credit before graduating from high school
7. To provide instruction in vocational and technology programs that will
increase the student’s ability to seek higher salaried employment after
graduating from high school
8. To provide credit recovery courses at the high school to enable students to
graduate as scheduled
Academic Goals
Expansion of Curriculum
a. Continued use of Elbow-2-Elbow including state school improvement
specialists
b. Continued use of The Learning Institute including academic improvement
plans for students scoring below proficient in math and literacy
Implementation of current 10 Year Facilities Plan
Staff Development
All certified staff members will gain 60 hours of staff development during the 2011-2012
school year. Included in these hours will be 6 hours of technology, 2 hours of Arkansas
History, and 2-3 hours of parental involvement. Other staff development topics include
6 | P a g e
health training, literacy and math inservice, special education, data disaggregation,
leadership, fiscal management, and student assessments.
Federal Programs
Title I All three elementary schools are Title I schools. This permits all
students the opportunity to receive additional tutorial assistance in
literacy and math. These funds are used to pay some salaries,
professional development, and purchase some supplies.
Title II-A This program provides for some salaries and additional staff
development to ensure teacher quality and enhancement.
Title VI-B The funds are used for some salaries, equipment and supplies and
services for handicapped students.
NSLA This funding is used for staff development in instructional areas,
technology and some salaries.
Professional
Development These funds are used for teacher training,
registration to conferences; and travel, meals, and lodging for
professional development activities.
ALE Funds are used for some salaries and supplies.
Carl Perkins Funds are used for new or expanded vocational programs.
Gifted & Talented
Students in grades 4-6 are served in self-contained and students in grades K-3 are served
in pull-out classrooms. Students in grades 7-9 are served in pre-AP courses and
advanced classes in all core-curriculum areas. Students in grades 10-12 are served in pre-
AP, AP and concurrent courses in core-curriculum areas. Any course offered by the
college that could count for high school graduation can be a concurrent course.
Special Education
Special education students are served in resource rooms and self-contained classrooms.
ACSIP
All schools submitted goals in their ACSIP plan to include improvement in literacy and
math. Special education and wellness are also a part of each school’s ACSIP plans. The
scholastic audit is a part of the ACSIP plans at Coleman Intermediate Schools, Junior
High and Senior High Schools.
Our ACTAAP results for 2011 indicate improvement in scores in some areas. These tests
are taken beginning with grade three through end-of-course in high school. This
comparison indicates improvement in test scores as reflected last school year and on the
2009 school report card on the ADE website.
7 | P a g e
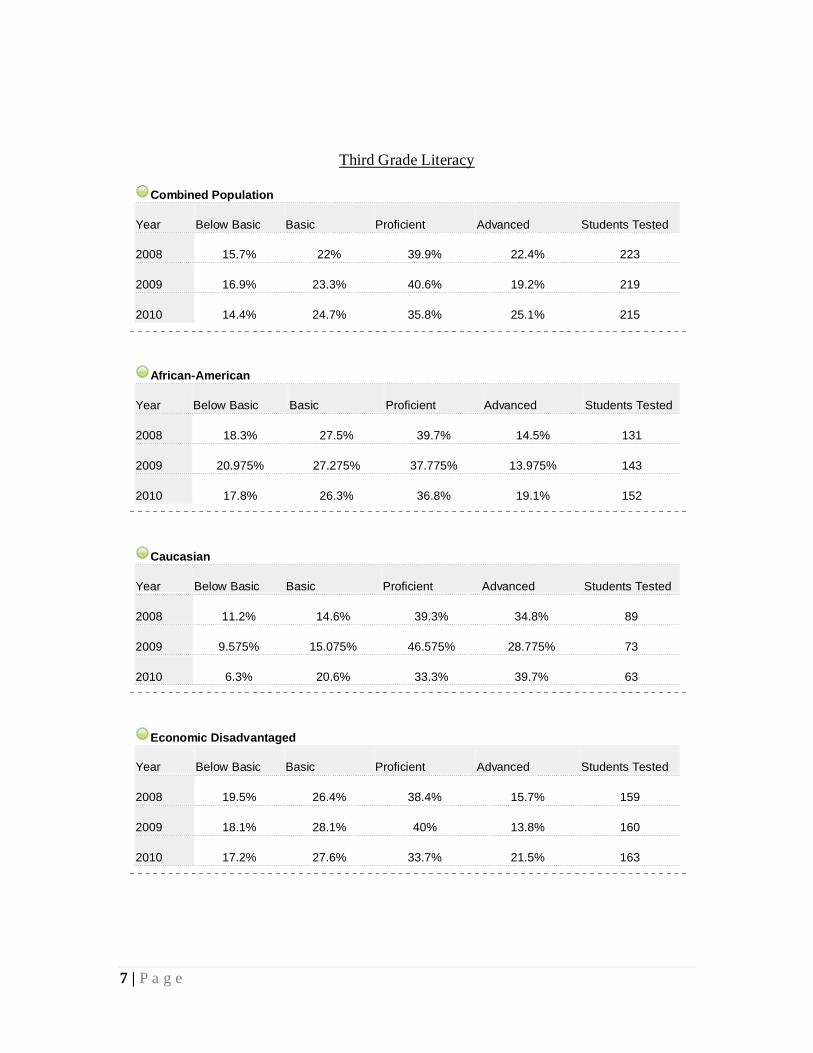
Third Grade Literacy
Combined Population
Year Below Basic Basic Proficient Advanced Students Tested
2008 15.7% 22% 39.9% 22.4% 223
2009 16.9% 23.3% 40.6% 19.2% 219
2010 14.4% 24.7% 35.8% 25.1% 215
African-American
Year Below Basic Basic Proficient Advanced Students Tested
2008 18.3% 27.5% 39.7% 14.5% 131
2009 20.975% 27.275% 37.775% 13.975% 143
2010 17.8% 26.3% 36.8% 19.1% 152
Caucasian
Year Below Basic Basic Proficient Advanced Students Tested
2008 11.2% 14.6% 39.3% 34.8% 89
2009 9.575% 15.075% 46.575% 28.775% 73
2010 6.3% 20.6% 33.3% 39.7% 63
Economic Disadvantaged
Year Below Basic Basic Proficient Advanced Students Tested
2008 19.5% 26.4% 38.4% 15.7% 159
2009 18.1% 28.1% 40% 13.8% 160
2010 17.2% 27.6% 33.7% 21.5% 163
8 | P a g e
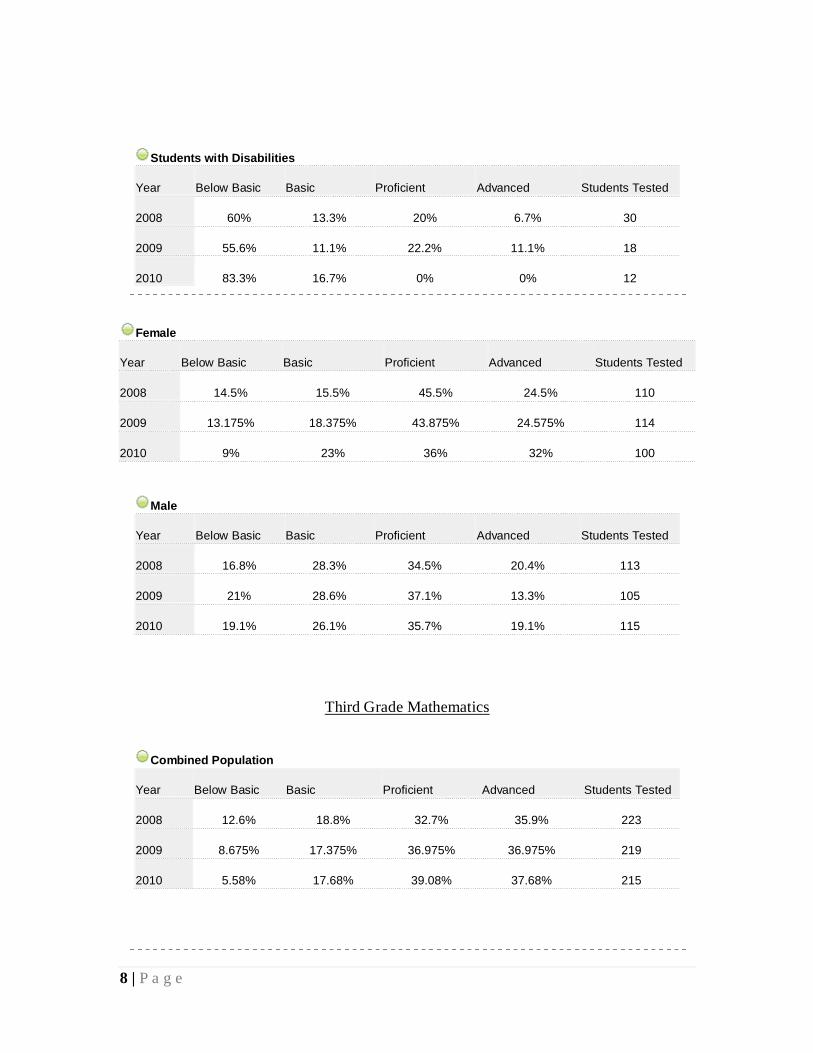
Students with Disabilities
Year Below Basic Basic Proficient Advanced Students Tested
2008 60% 13.3% 20% 6.7% 30
2009 55.6% 11.1% 22.2% 11.1% 18
2010 83.3% 16.7% 0% 0% 12
Female
Year Below Basic Basic Proficient Advanced Students Tested
2008 14.5% 15.5% 45.5% 24.5% 110
2009 13.175% 18.375% 43.875% 24.575% 114
2010 9% 23% 36% 32% 100
Male
Year Below Basic Basic Proficient Advanced Students Tested
2008 16.8% 28.3% 34.5% 20.4% 113
2009 21% 28.6% 37.1% 13.3% 105
2010 19.1% 26.1% 35.7% 19.1% 115
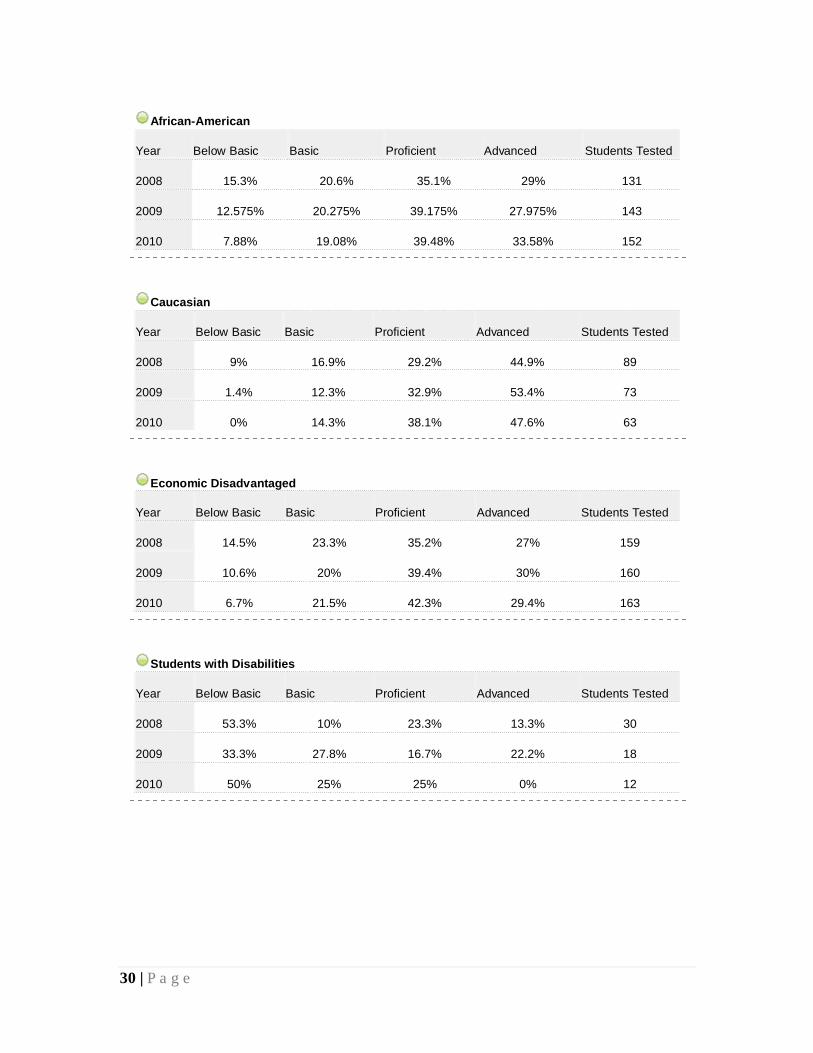
Third Grade Mathematics
Combined Population
Year Below Basic Basic Proficient Advanced Students Tested
2008 12.6% 18.8% 32.7% 35.9% 223
2009 8.675% 17.375% 36.975% 36.975% 219
2010 5.58% 17.68% 39.08% 37.68% 215
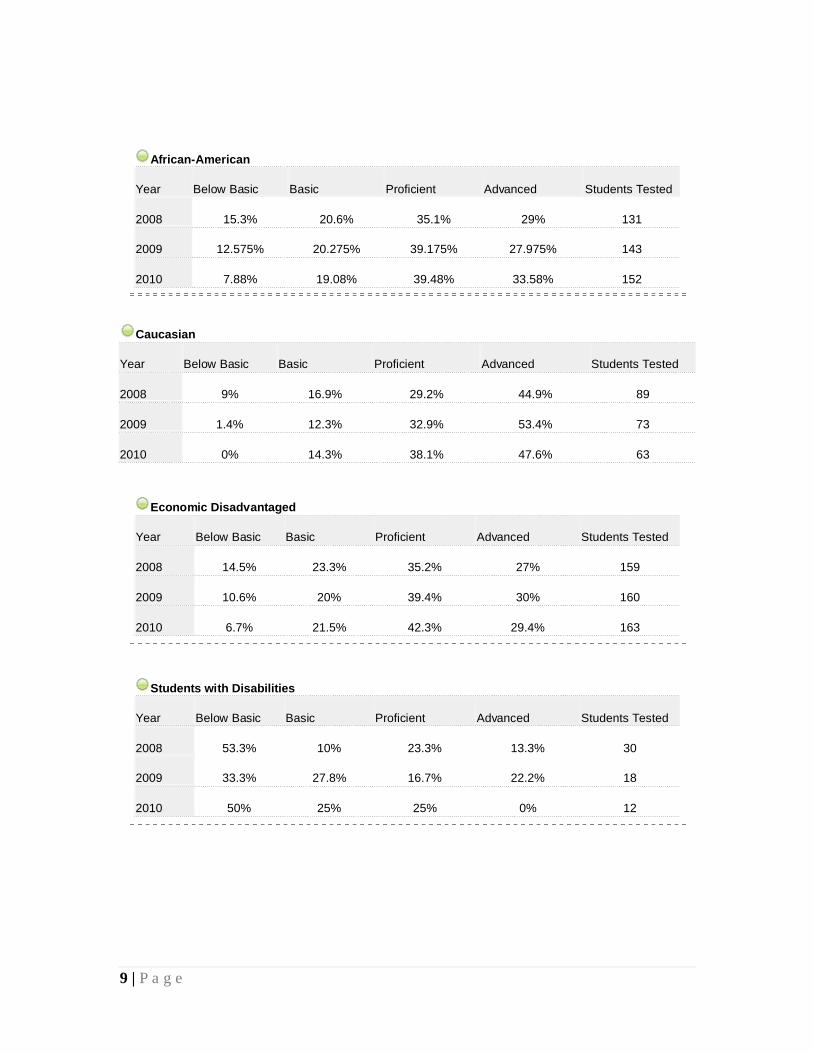
9 | P a g e
African-American
Year Below Basic Basic Proficient Advanced Students Tested
2008 15.3% 20.6% 35.1% 29% 131
2009 12.575% 20.275% 39.175% 27.975% 143
2010 7.88% 19.08% 39.48% 33.58% 152
Caucasian
Year Below Basic Basic Proficient Advanced Students Tested
2008 9% 16.9% 29.2% 44.9% 89
2009 1.4% 12.3% 32.9% 53.4% 73
2010 0% 14.3% 38.1% 47.6% 63
Economic Disadvantaged
Year Below Basic Basic Proficient Advanced Students Tested
2008 14.5% 23.3% 35.2% 27% 159
2009 10.6% 20% 39.4% 30% 160
2010 6.7% 21.5% 42.3% 29.4% 163
Students with Disabilities
Year Below Basic Basic Proficient Advanced Students Tested
2008 53.3% 10% 23.3% 13.3% 30
2009 33.3% 27.8% 16.7% 22.2% 18
2010 50% 25% 25% 0% 12
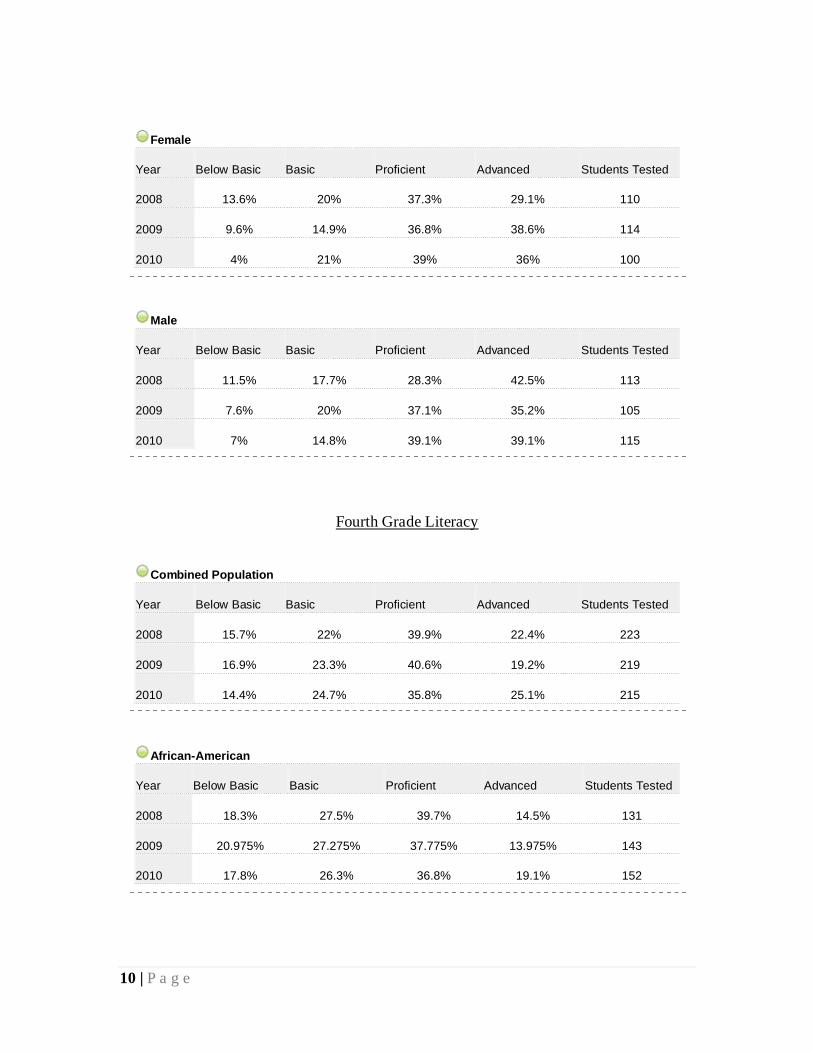
10 | P a g e
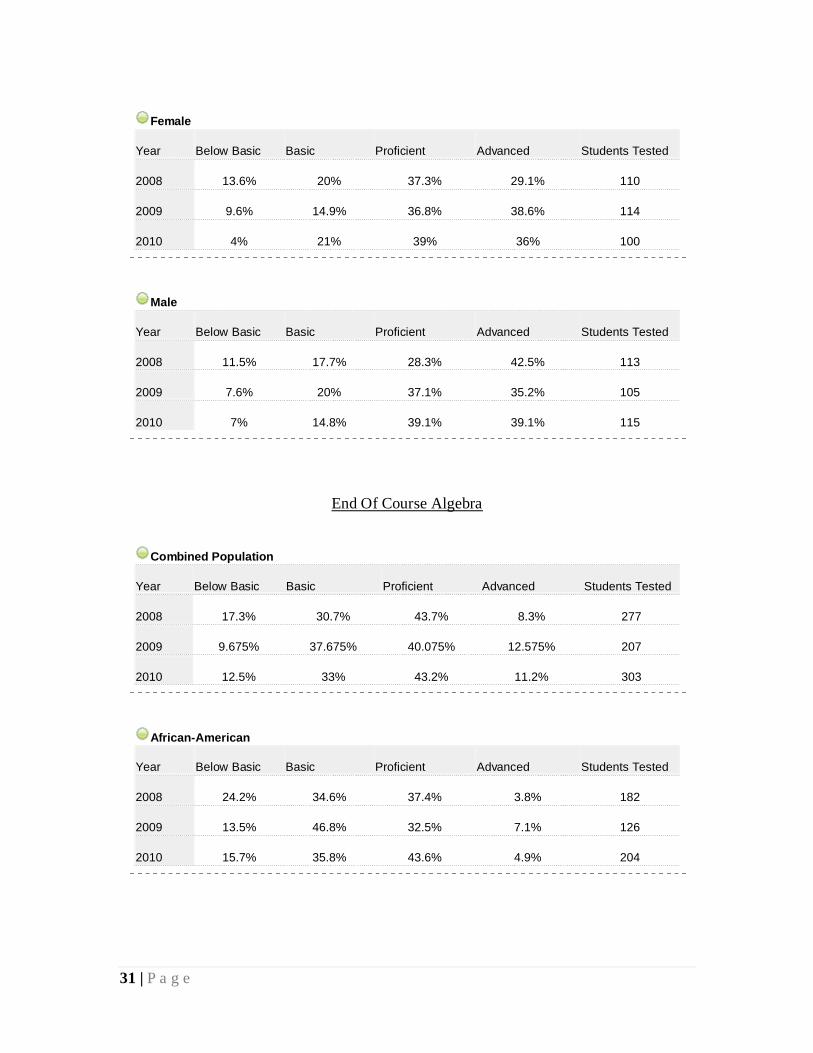
Female
Year Below Basic Basic Proficient Advanced Students Tested
2008 13.6% 20% 37.3% 29.1% 110
2009 9.6% 14.9% 36.8% 38.6% 114
2010 4% 21% 39% 36% 100
Male
Year Below Basic Basic Proficient Advanced Students Tested
2008 11.5% 17.7% 28.3% 42.5% 113
2009 7.6% 20% 37.1% 35.2% 105
2010 7% 14.8% 39.1% 39.1% 115
Fourth Grade Literacy
Combined Population
Year Below Basic Basic Proficient Advanced Students Tested
2008 15.7% 22% 39.9% 22.4% 223
2009 16.9% 23.3% 40.6% 19.2% 219
2010 14.4% 24.7% 35.8% 25.1% 215
African-American
Year Below Basic Basic Proficient Advanced Students Tested
2008 18.3% 27.5% 39.7% 14.5% 131
2009 20.975% 27.275% 37.775% 13.975% 143
2010 17.8% 26.3% 36.8% 19.1% 152
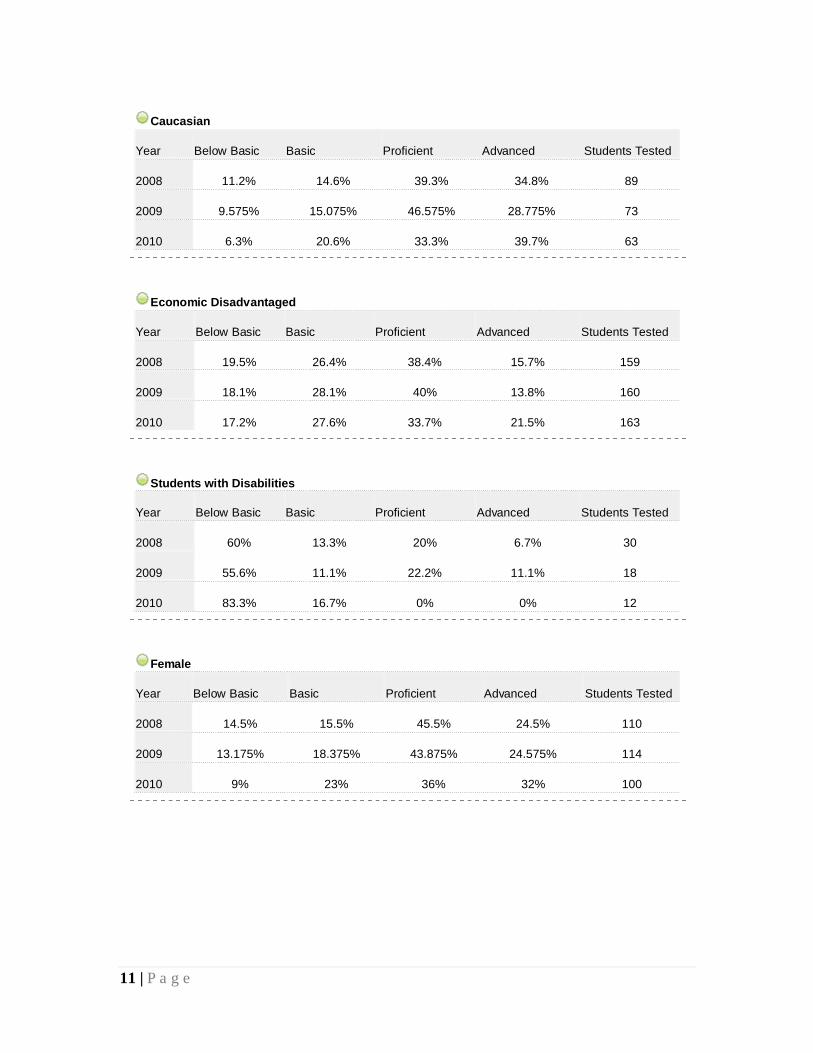
11 | P a g e
Caucasian
Year Below Basic Basic Proficient Advanced Students Tested
2008 11.2% 14.6% 39.3% 34.8% 89
2009 9.575% 15.075% 46.575% 28.775% 73
2010 6.3% 20.6% 33.3% 39.7% 63
Economic Disadvantaged
Year Below Basic Basic Proficient Advanced Students Tested
2008 19.5% 26.4% 38.4% 15.7% 159
2009 18.1% 28.1% 40% 13.8% 160
2010 17.2% 27.6% 33.7% 21.5% 163
Students with Disabilities
Year Below Basic Basic Proficient Advanced Students Tested
2008 60% 13.3% 20% 6.7% 30
2009 55.6% 11.1% 22.2% 11.1% 18
2010 83.3% 16.7% 0% 0% 12
Female
Year Below Basic Basic Proficient Advanced Students Tested
2008 14.5% 15.5% 45.5% 24.5% 110
2009 13.175% 18.375% 43.875% 24.575% 114
2010 9% 23% 36% 32% 100
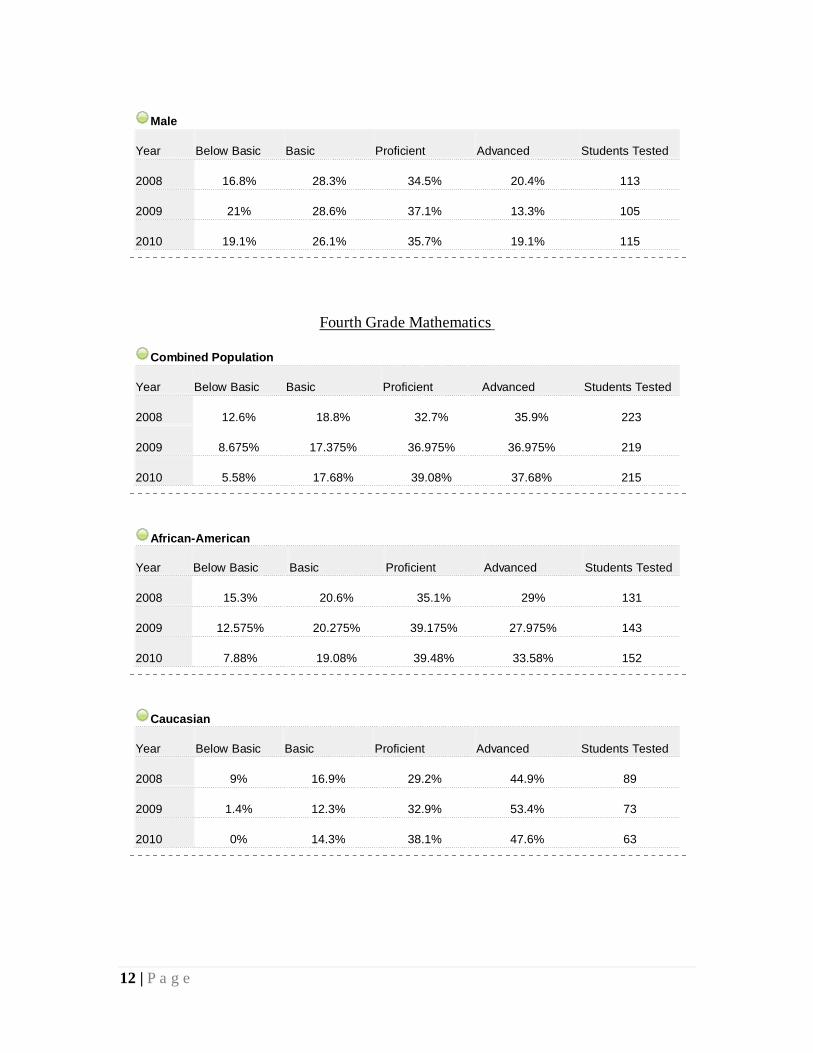
12 | P a g e
Male
Year Below Basic Basic Proficient Advanced Students Tested
2008 16.8% 28.3% 34.5% 20.4% 113
2009 21% 28.6% 37.1% 13.3% 105
2010 19.1% 26.1% 35.7% 19.1% 115
Fourth Grade Mathematics
Combined Population
Year Below Basic Basic Proficient Advanced Students Tested
2008 12.6% 18.8% 32.7% 35.9% 223
2009 8.675% 17.375% 36.975% 36.975% 219
2010 5.58% 17.68% 39.08% 37.68% 215
African-American
Year Below Basic Basic Proficient Advanced Students Tested
2008 15.3% 20.6% 35.1% 29% 131
2009 12.575% 20.275% 39.175% 27.975% 143
2010 7.88% 19.08% 39.48% 33.58% 152
Caucasian
Year Below Basic Basic Proficient Advanced Students Tested
2008 9% 16.9% 29.2% 44.9% 89
2009 1.4% 12.3% 32.9% 53.4% 73
2010 0% 14.3% 38.1% 47.6% 63
13 | P a g e
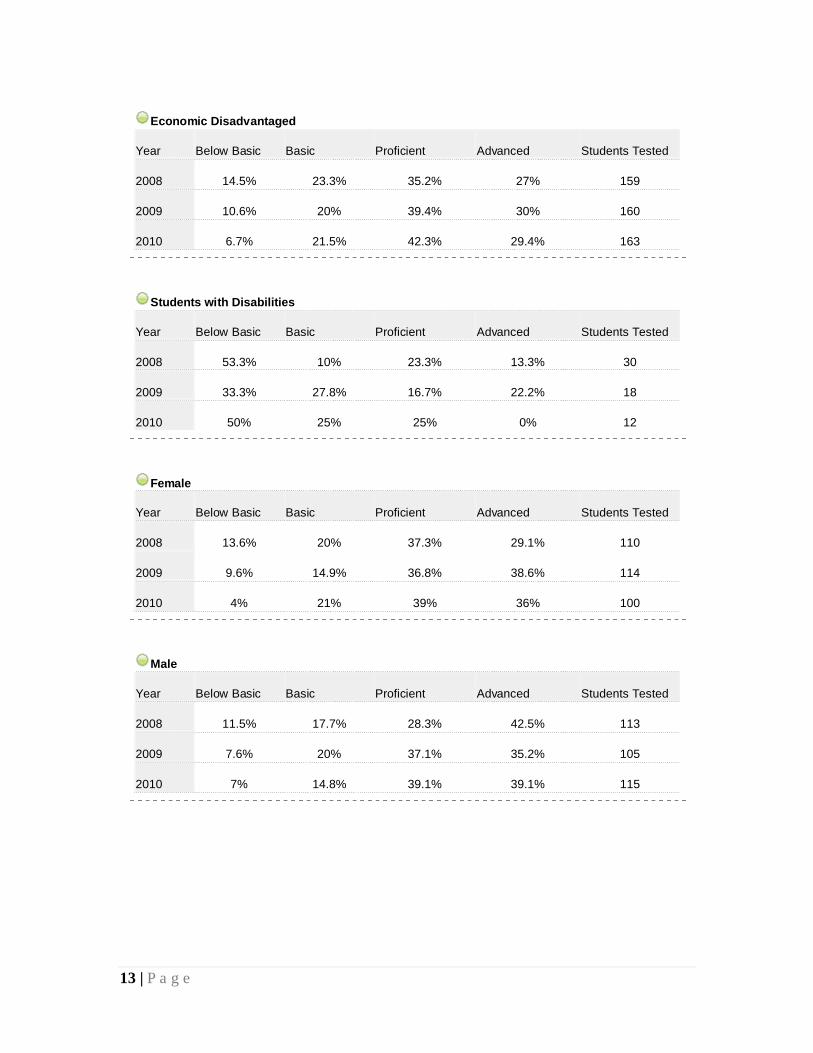
Economic Disadvantaged
Year Below Basic Basic Proficient Advanced Students Tested
2008 14.5% 23.3% 35.2% 27% 159
2009 10.6% 20% 39.4% 30% 160
2010 6.7% 21.5% 42.3% 29.4% 163
Students with Disabilities
Year Below Basic Basic Proficient Advanced Students Tested
2008 53.3% 10% 23.3% 13.3% 30
2009 33.3% 27.8% 16.7% 22.2% 18
2010 50% 25% 25% 0% 12
Female
Year Below Basic Basic Proficient Advanced Students Tested
2008 13.6% 20% 37.3% 29.1% 110
2009 9.6% 14.9% 36.8% 38.6% 114
2010 4% 21% 39% 36% 100
Male
Year Below Basic Basic Proficient Advanced Students Tested
2008 11.5% 17.7% 28.3% 42.5% 113
2009 7.6% 20% 37.1% 35.2% 105
2010 7% 14.8% 39.1% 39.1% 115
14 | P a g e
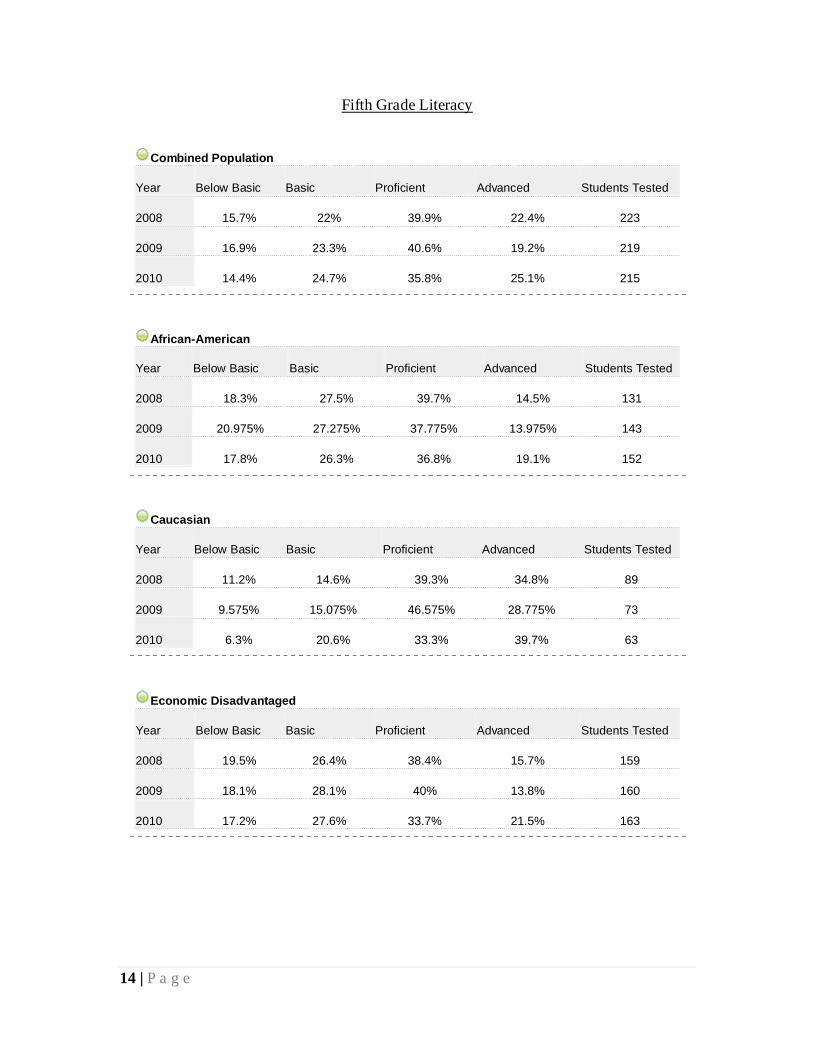
Fifth Grade Literacy
Combined Population
Year Below Basic Basic Proficient Advanced Students Tested
2008 15.7% 22% 39.9% 22.4% 223
2009 16.9% 23.3% 40.6% 19.2% 219
2010 14.4% 24.7% 35.8% 25.1% 215
African-American
Year Below Basic Basic Proficient Advanced Students Tested
2008 18.3% 27.5% 39.7% 14.5% 131
2009 20.975% 27.275% 37.775% 13.975% 143
2010 17.8% 26.3% 36.8% 19.1% 152
Caucasian
Year Below Basic Basic Proficient Advanced Students Tested
2008 11.2% 14.6% 39.3% 34.8% 89
2009 9.575% 15.075% 46.575% 28.775% 73
2010 6.3% 20.6% 33.3% 39.7% 63
Economic Disadvantaged
Year Below Basic Basic Proficient Advanced Students Tested
2008 19.5% 26.4% 38.4% 15.7% 159
2009 18.1% 28.1% 40% 13.8% 160
2010 17.2% 27.6% 33.7% 21.5% 163
15 | P a g e
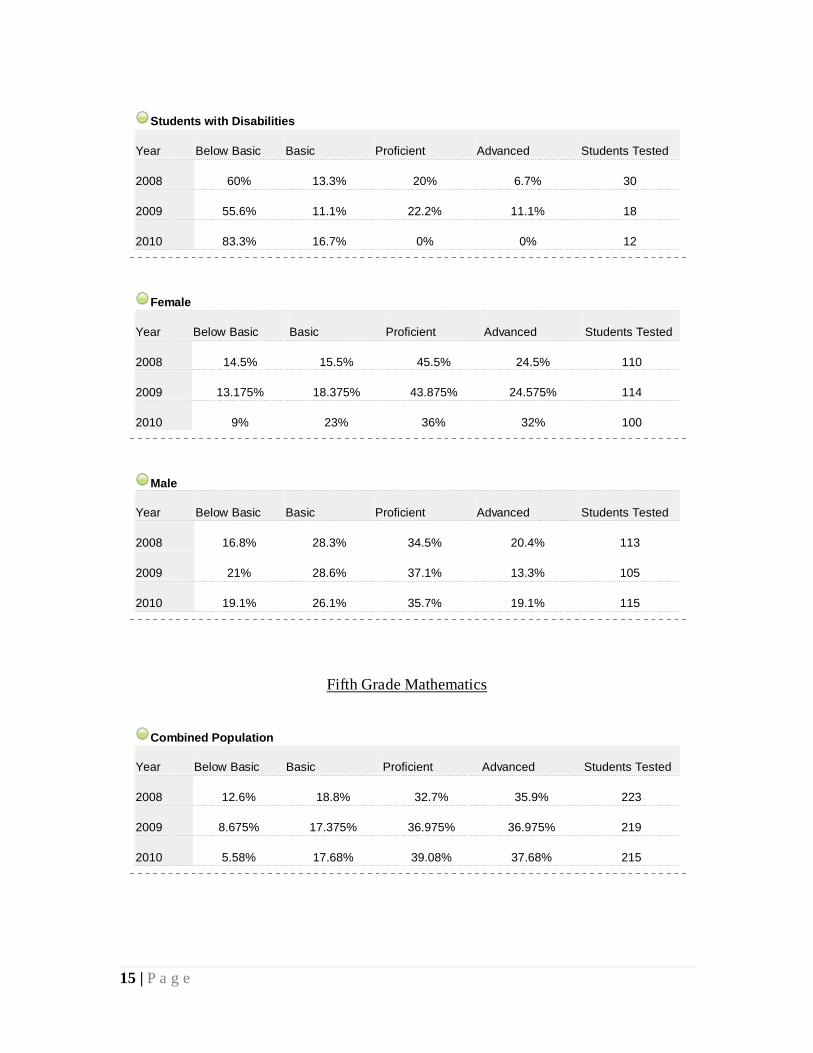
Students with Disabilities
Year Below Basic Basic Proficient Advanced Students Tested
2008 60% 13.3% 20% 6.7% 30
2009 55.6% 11.1% 22.2% 11.1% 18
2010 83.3% 16.7% 0% 0% 12
Female
Year Below Basic Basic Proficient Advanced Students Tested
2008 14.5% 15.5% 45.5% 24.5% 110
2009 13.175% 18.375% 43.875% 24.575% 114
2010 9% 23% 36% 32% 100
Male
Year Below Basic Basic Proficient Advanced Students Tested
2008 16.8% 28.3% 34.5% 20.4% 113
2009 21% 28.6% 37.1% 13.3% 105
2010 19.1% 26.1% 35.7% 19.1% 115
Fifth Grade Mathematics
Combined Population
Year Below Basic Basic Proficient Advanced Students Tested
2008 12.6% 18.8% 32.7% 35.9% 223
2009 8.675% 17.375% 36.975% 36.975% 219
2010 5.58% 17.68% 39.08% 37.68% 215

16 | P a g e
African-American
Year Below Basic Basic Proficient Advanced Students Tested
2008 15.3% 20.6% 35.1% 29% 131
2009 12.575% 20.275% 39.175% 27.975% 143
2010 7.88% 19.08% 39.48% 33.58% 152
Caucasian
Year Below Basic Basic Proficient Advanced Students Tested
2008 9% 16.9% 29.2% 44.9% 89
2009 1.4% 12.3% 32.9% 53.4% 73
2010 0% 14.3% 38.1% 47.6% 63
Economic Disadvantaged
Year Below Basic Basic Proficient Advanced Students Tested
2008 14.5% 23.3% 35.2% 27% 159
2009 10.6% 20% 39.4% 30% 160
2010 6.7% 21.5% 42.3% 29.4% 163
Students with Disabilities
Year Below Basic Basic Proficient Advanced Students Tested
2008 53.3% 10% 23.3% 13.3% 30
2009 33.3% 27.8% 16.7% 22.2% 18
2010 50% 25% 25% 0% 12
17 | P a g e
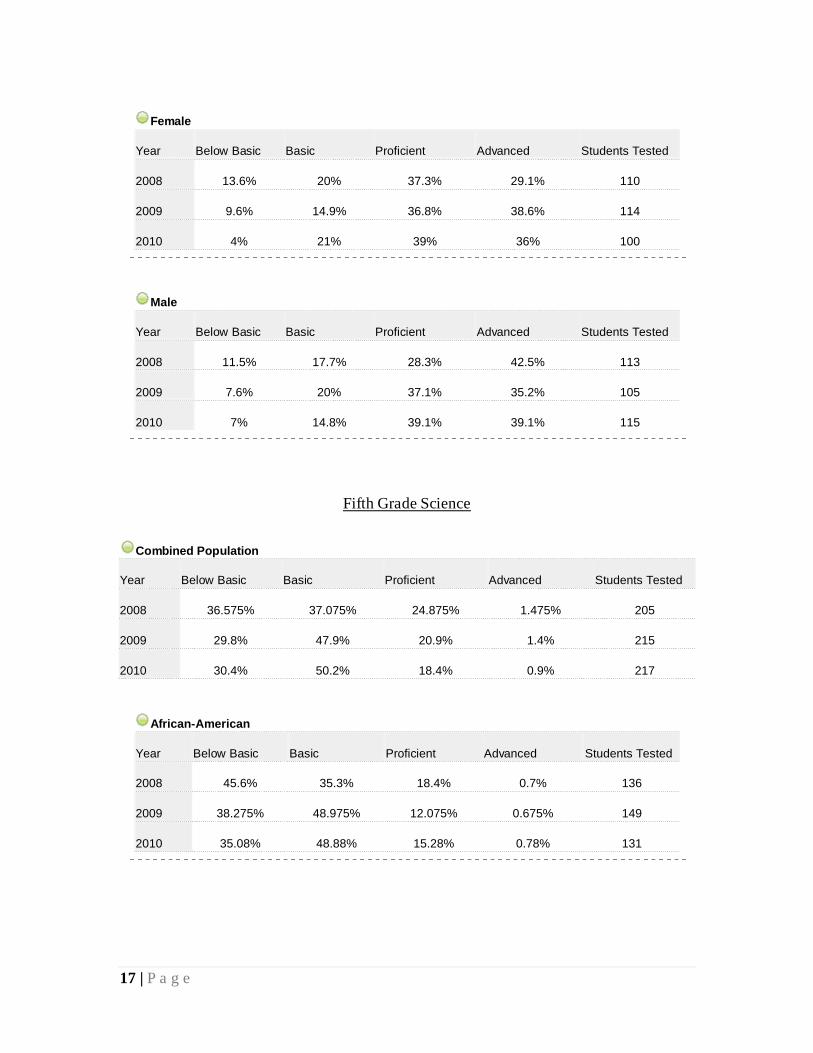
Female
Year Below Basic Basic Proficient Advanced Students Tested
2008 13.6% 20% 37.3% 29.1% 110
2009 9.6% 14.9% 36.8% 38.6% 114
2010 4% 21% 39% 36% 100
Male
Year Below Basic Basic Proficient Advanced Students Tested
2008 11.5% 17.7% 28.3% 42.5% 113
2009 7.6% 20% 37.1% 35.2% 105
2010 7% 14.8% 39.1% 39.1% 115
Fifth Grade Science
Combined Population
Year Below Basic Basic Proficient Advanced Students Tested
2008 36.575% 37.075% 24.875% 1.475% 205
2009 29.8% 47.9% 20.9% 1.4% 215
2010 30.4% 50.2% 18.4% 0.9% 217
African-American
Year Below Basic Basic Proficient Advanced Students Tested
2008 45.6% 35.3% 18.4% 0.7% 136
2009 38.275% 48.975% 12.075% 0.675% 149
2010 35.08% 48.88% 15.28% 0.78% 131
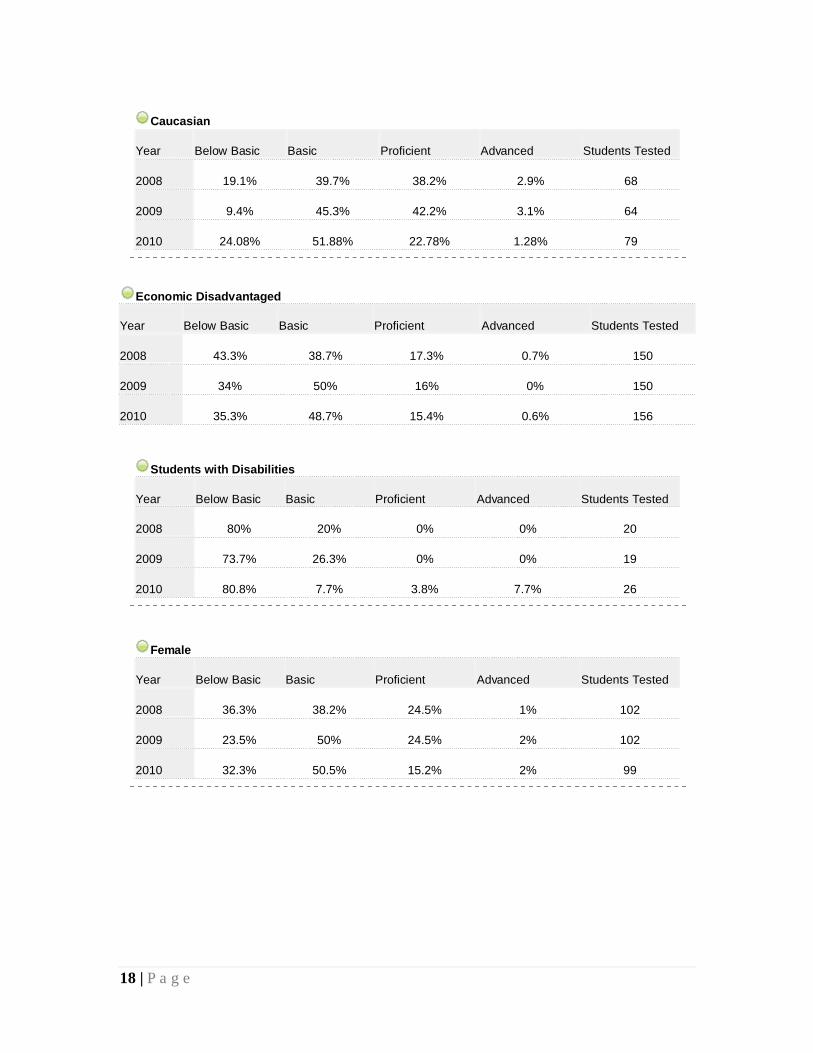
18 | P a g e
Caucasian
Year Below Basic Basic Proficient Advanced Students Tested
2008 19.1% 39.7% 38.2% 2.9% 68
2009 9.4% 45.3% 42.2% 3.1% 64
2010 24.08% 51.88% 22.78% 1.28% 79
Economic Disadvantaged
Year Below Basic Basic Proficient Advanced Students Tested
2008 43.3% 38.7% 17.3% 0.7% 150
2009 34% 50% 16% 0% 150
2010 35.3% 48.7% 15.4% 0.6% 156
Students with Disabilities
Year Below Basic Basic Proficient Advanced Students Tested
2008 80% 20% 0% 0% 20
2009 73.7% 26.3% 0% 0% 19
2010 80.8% 7.7% 3.8% 7.7% 26
Female
Year Below Basic Basic Proficient Advanced Students Tested
2008 36.3% 38.2% 24.5% 1% 102
2009 23.5% 50% 24.5% 2% 102
2010 32.3% 50.5% 15.2% 2% 99
19 | P a g e
Male
Year Below Basic Basic Proficient Advanced Students Tested
2008 36.9% 35.9% 25.2% 1.9% 103
2009 35.4% 46% 17.7% 0.9% 113
2010 28.8% 50% 21.2% 0% 118
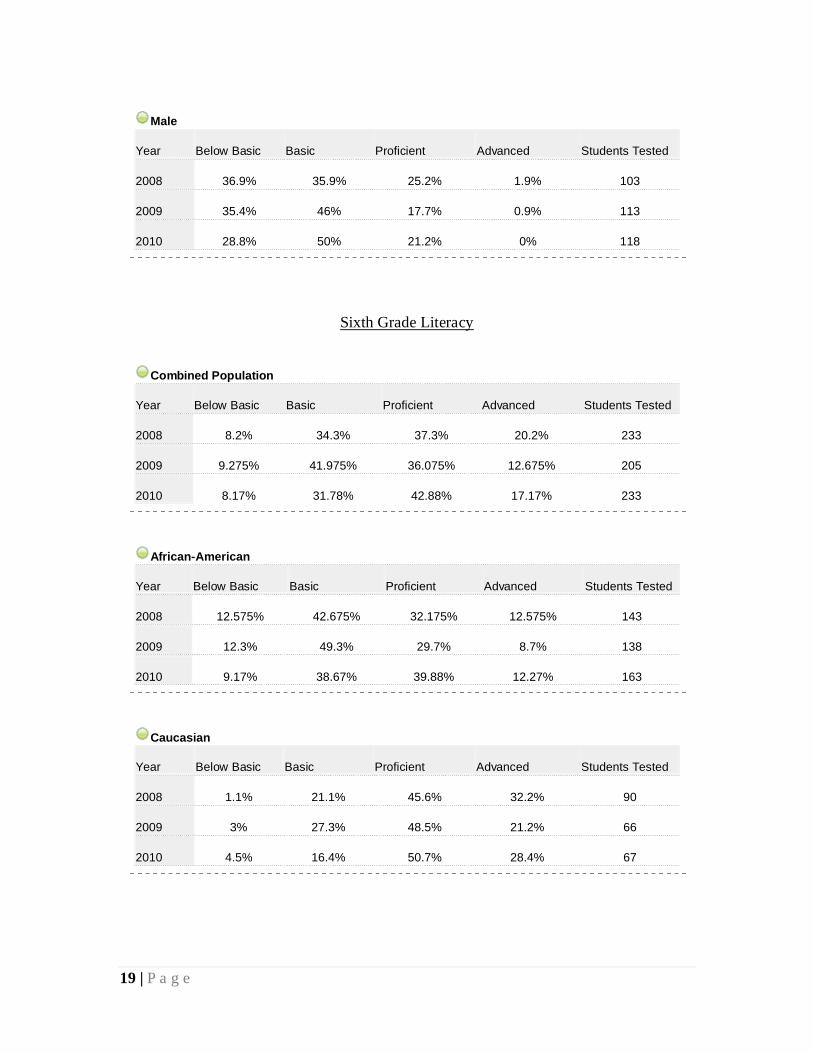
Sixth Grade Literacy
Combined Population
Year Below Basic Basic Proficient Advanced Students Tested
2008 8.2% 34.3% 37.3% 20.2% 233
2009 9.275% 41.975% 36.075% 12.675% 205
2010 8.17% 31.78% 42.88% 17.17% 233
African-American
Year Below Basic Basic Proficient Advanced Students Tested
2008 12.575% 42.675% 32.175% 12.575% 143
2009 12.3% 49.3% 29.7% 8.7% 138
2010 9.17% 38.67% 39.88% 12.27% 163
Caucasian
Year Below Basic Basic Proficient Advanced Students Tested
2008 1.1% 21.1% 45.6% 32.2% 90
2009 3% 27.3% 48.5% 21.2% 66
2010 4.5% 16.4% 50.7% 28.4% 67
20 | P a g e
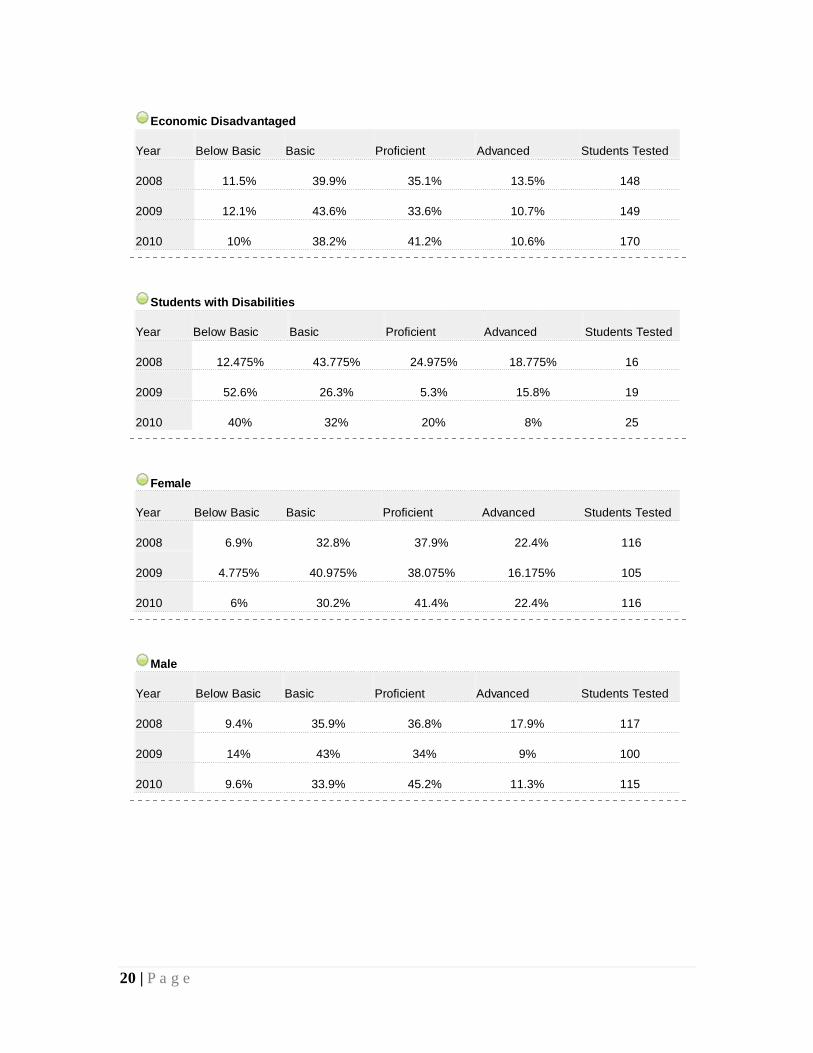
Economic Disadvantaged
Year Below Basic Basic Proficient Advanced Students Tested
2008 11.5% 39.9% 35.1% 13.5% 148
2009 12.1% 43.6% 33.6% 10.7% 149
2010 10% 38.2% 41.2% 10.6% 170
Students with Disabilities
Year Below Basic Basic Proficient Advanced Students Tested
2008 12.475% 43.775% 24.975% 18.775% 16
2009 52.6% 26.3% 5.3% 15.8% 19
2010 40% 32% 20% 8% 25
Female
Year Below Basic Basic Proficient Advanced Students Tested
2008 6.9% 32.8% 37.9% 22.4% 116
2009 4.775% 40.975% 38.075% 16.175% 105
2010 6% 30.2% 41.4% 22.4% 116
Male
Year Below Basic Basic Proficient Advanced Students Tested
2008 9.4% 35.9% 36.8% 17.9% 117
2009 14% 43% 34% 9% 100
2010 9.6% 33.9% 45.2% 11.3% 115
21 | P a g e
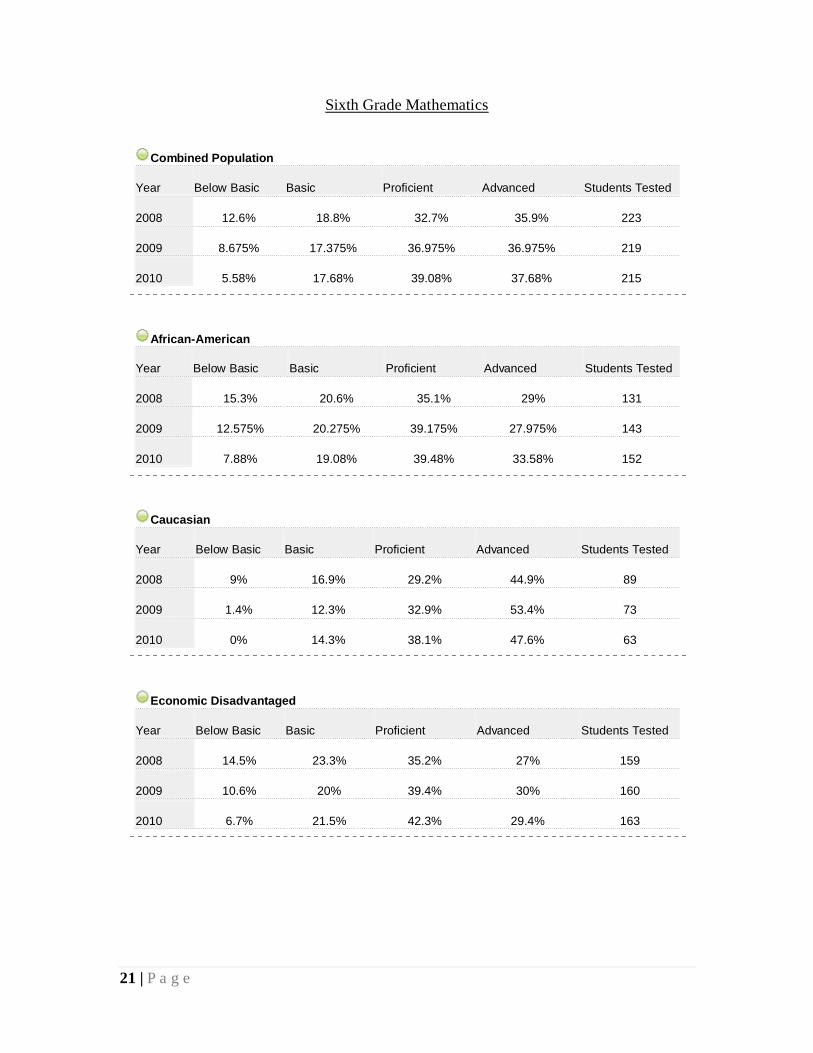
Sixth Grade Mathematics
Combined Population
Year Below Basic Basic Proficient Advanced Students Tested
2008 12.6% 18.8% 32.7% 35.9% 223
2009 8.675% 17.375% 36.975% 36.975% 219
2010 5.58% 17.68% 39.08% 37.68% 215
African-American
Year Below Basic Basic Proficient Advanced Students Tested
2008 15.3% 20.6% 35.1% 29% 131
2009 12.575% 20.275% 39.175% 27.975% 143
2010 7.88% 19.08% 39.48% 33.58% 152
Caucasian
Year Below Basic Basic Proficient Advanced Students Tested
2008 9% 16.9% 29.2% 44.9% 89
2009 1.4% 12.3% 32.9% 53.4% 73
2010 0% 14.3% 38.1% 47.6% 63
Economic Disadvantaged
Year Below Basic Basic Proficient Advanced Students Tested
2008 14.5% 23.3% 35.2% 27% 159
2009 10.6% 20% 39.4% 30% 160
2010 6.7% 21.5% 42.3% 29.4% 163
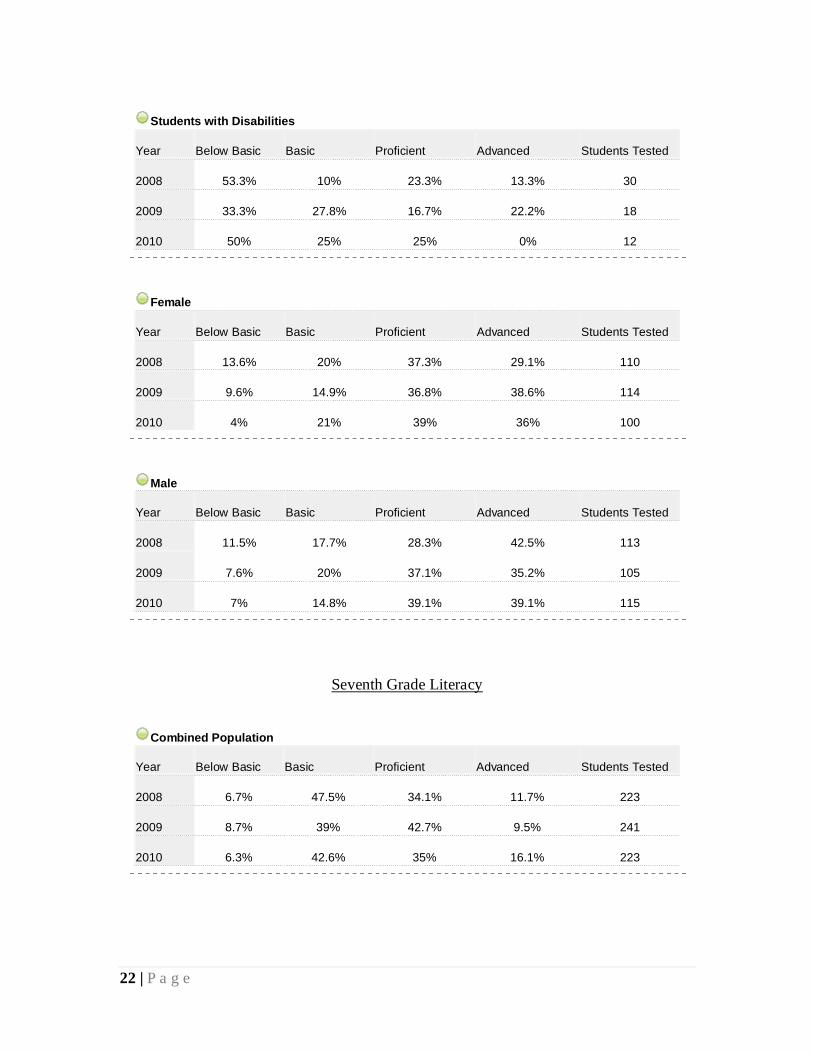
22 | P a g e
Students with Disabilities
Year Below Basic Basic Proficient Advanced Students Tested
2008 53.3% 10% 23.3% 13.3% 30
2009 33.3% 27.8% 16.7% 22.2% 18
2010 50% 25% 25% 0% 12
Female
Year Below Basic Basic Proficient Advanced Students Tested
2008 13.6% 20% 37.3% 29.1% 110
2009 9.6% 14.9% 36.8% 38.6% 114
2010 4% 21% 39% 36% 100
Male
Year Below Basic Basic Proficient Advanced Students Tested
2008 11.5% 17.7% 28.3% 42.5% 113
2009 7.6% 20% 37.1% 35.2% 105
2010 7% 14.8% 39.1% 39.1% 115
Seventh Grade Literacy
Combined Population
Year Below Basic Basic Proficient Advanced Students Tested
2008 6.7% 47.5% 34.1% 11.7% 223
2009 8.7% 39% 42.7% 9.5% 241
2010 6.3% 42.6% 35% 16.1% 223
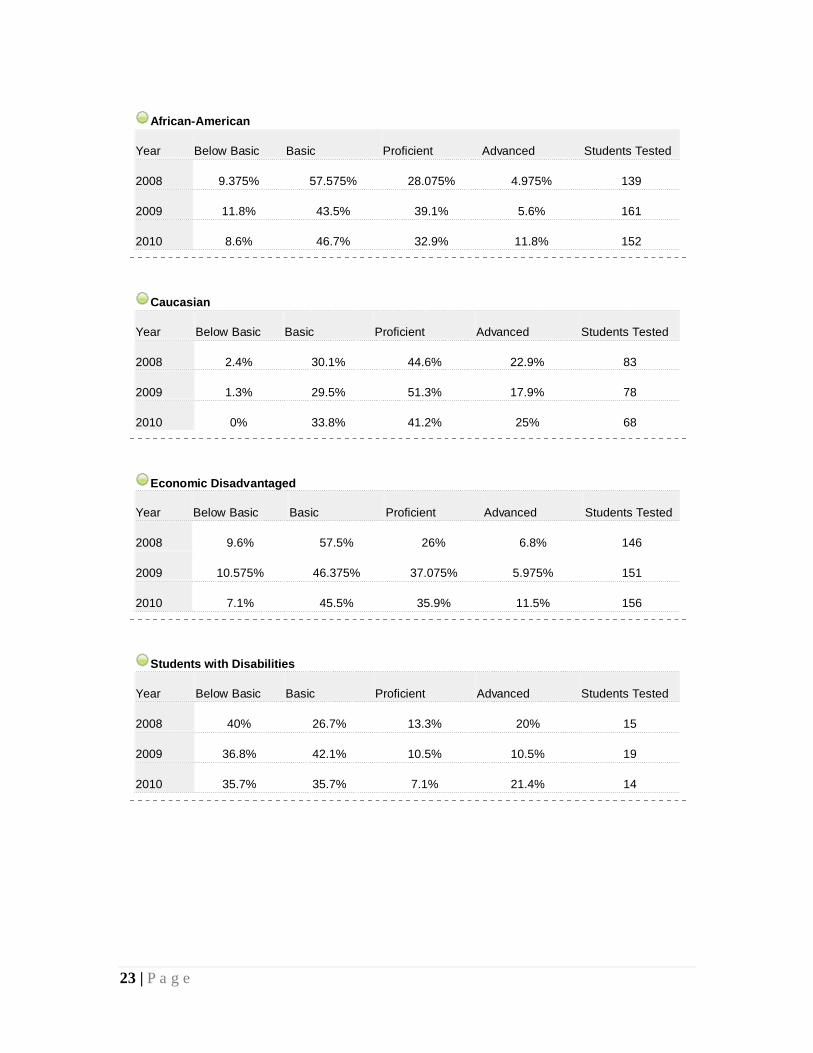
23 | P a g e
African-American
Year Below Basic Basic Proficient Advanced Students Tested
2008 9.375% 57.575% 28.075% 4.975% 139
2009 11.8% 43.5% 39.1% 5.6% 161
2010 8.6% 46.7% 32.9% 11.8% 152
Caucasian
Year Below Basic Basic Proficient Advanced Students Tested
2008 2.4% 30.1% 44.6% 22.9% 83
2009 1.3% 29.5% 51.3% 17.9% 78
2010 0% 33.8% 41.2% 25% 68
Economic Disadvantaged
Year Below Basic Basic Proficient Advanced Students Tested
2008 9.6% 57.5% 26% 6.8% 146
2009 10.575% 46.375% 37.075% 5.975% 151
2010 7.1% 45.5% 35.9% 11.5% 156
Students with Disabilities
Year Below Basic Basic Proficient Advanced Students Tested
2008 40% 26.7% 13.3% 20% 15
2009 36.8% 42.1% 10.5% 10.5% 19
2010 35.7% 35.7% 7.1% 21.4% 14
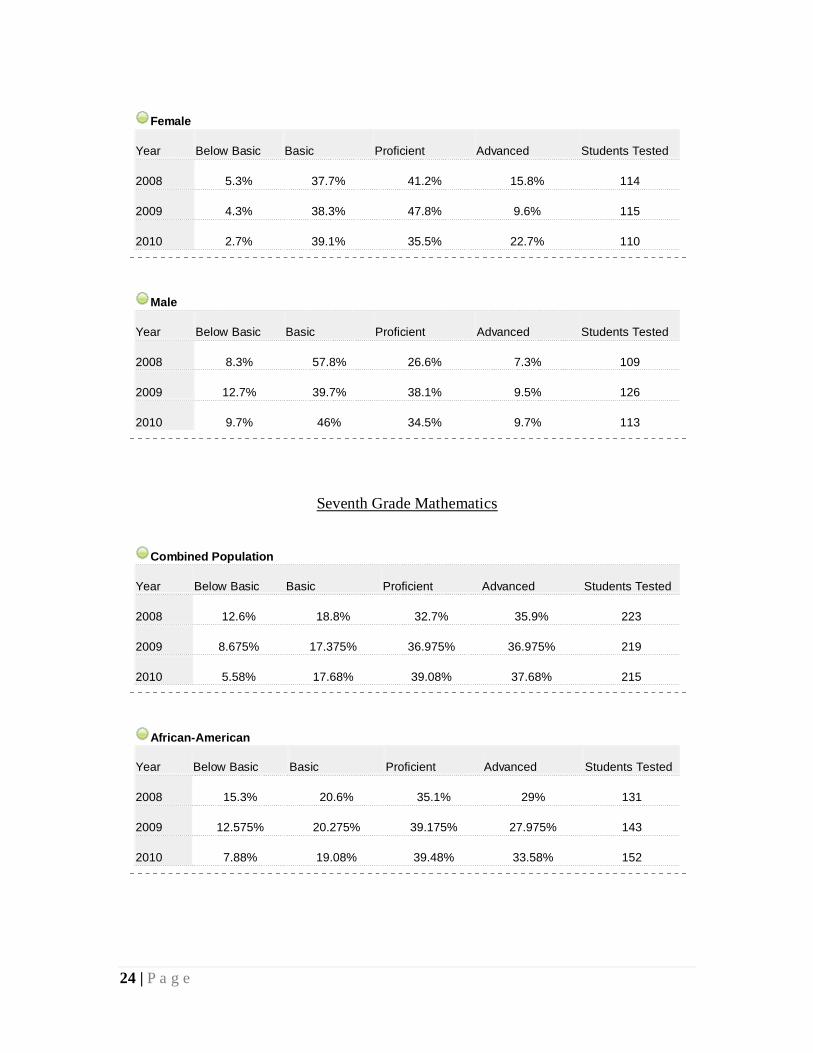
24 | P a g e
Female
Year Below Basic Basic Proficient Advanced Students Tested
2008 5.3% 37.7% 41.2% 15.8% 114
2009 4.3% 38.3% 47.8% 9.6% 115
2010 2.7% 39.1% 35.5% 22.7% 110
Male
Year Below Basic Basic Proficient Advanced Students Tested
2008 8.3% 57.8% 26.6% 7.3% 109
2009 12.7% 39.7% 38.1% 9.5% 126
2010 9.7% 46% 34.5% 9.7% 113
Seventh Grade Mathematics
Combined Population
Year Below Basic Basic Proficient Advanced Students Tested
2008 12.6% 18.8% 32.7% 35.9% 223
2009 8.675% 17.375% 36.975% 36.975% 219
2010 5.58% 17.68% 39.08% 37.68% 215
African-American
Year Below Basic Basic Proficient Advanced Students Tested
2008 15.3% 20.6% 35.1% 29% 131
2009 12.575% 20.275% 39.175% 27.975% 143
2010 7.88% 19.08% 39.48% 33.58% 152
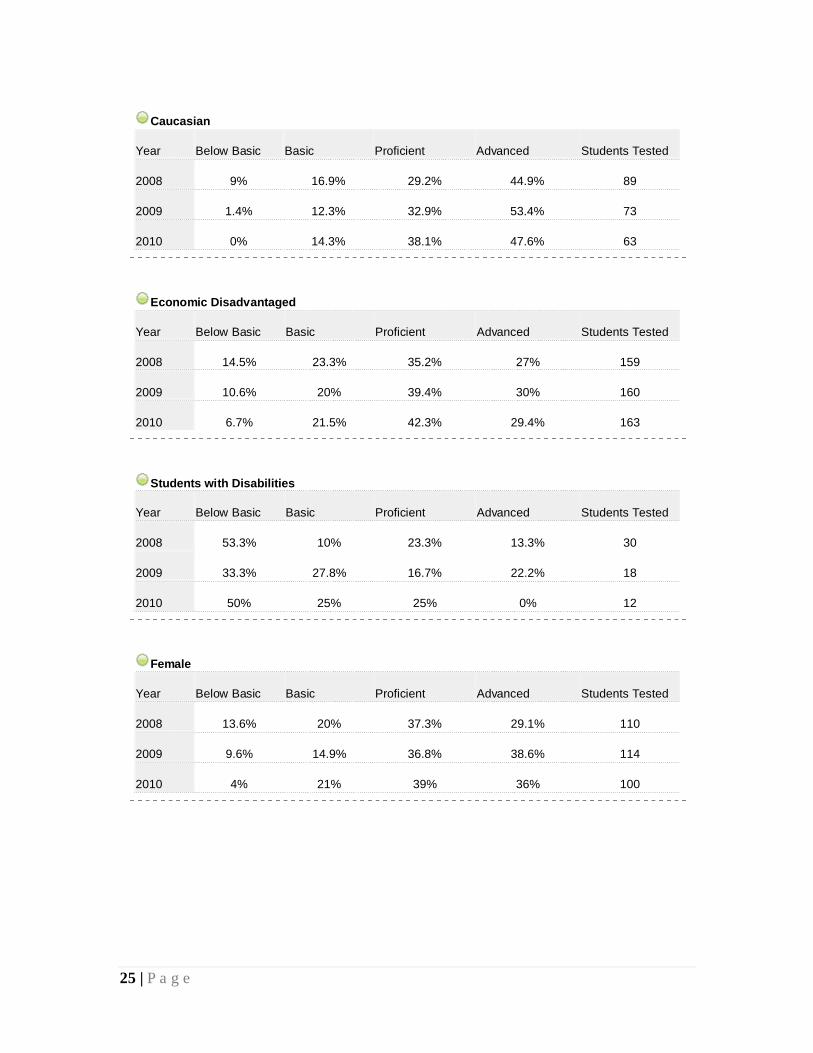
25 | P a g e
Caucasian
Year Below Basic Basic Proficient Advanced Students Tested
2008 9% 16.9% 29.2% 44.9% 89
2009 1.4% 12.3% 32.9% 53.4% 73
2010 0% 14.3% 38.1% 47.6% 63
Economic Disadvantaged
Year Below Basic Basic Proficient Advanced Students Tested
2008 14.5% 23.3% 35.2% 27% 159
2009 10.6% 20% 39.4% 30% 160
2010 6.7% 21.5% 42.3% 29.4% 163
Students with Disabilities
Year Below Basic Basic Proficient Advanced Students Tested
2008 53.3% 10% 23.3% 13.3% 30
2009 33.3% 27.8% 16.7% 22.2% 18
2010 50% 25% 25% 0% 12
Female
Year Below Basic Basic Proficient Advanced Students Tested
2008 13.6% 20% 37.3% 29.1% 110
2009 9.6% 14.9% 36.8% 38.6% 114
2010 4% 21% 39% 36% 100
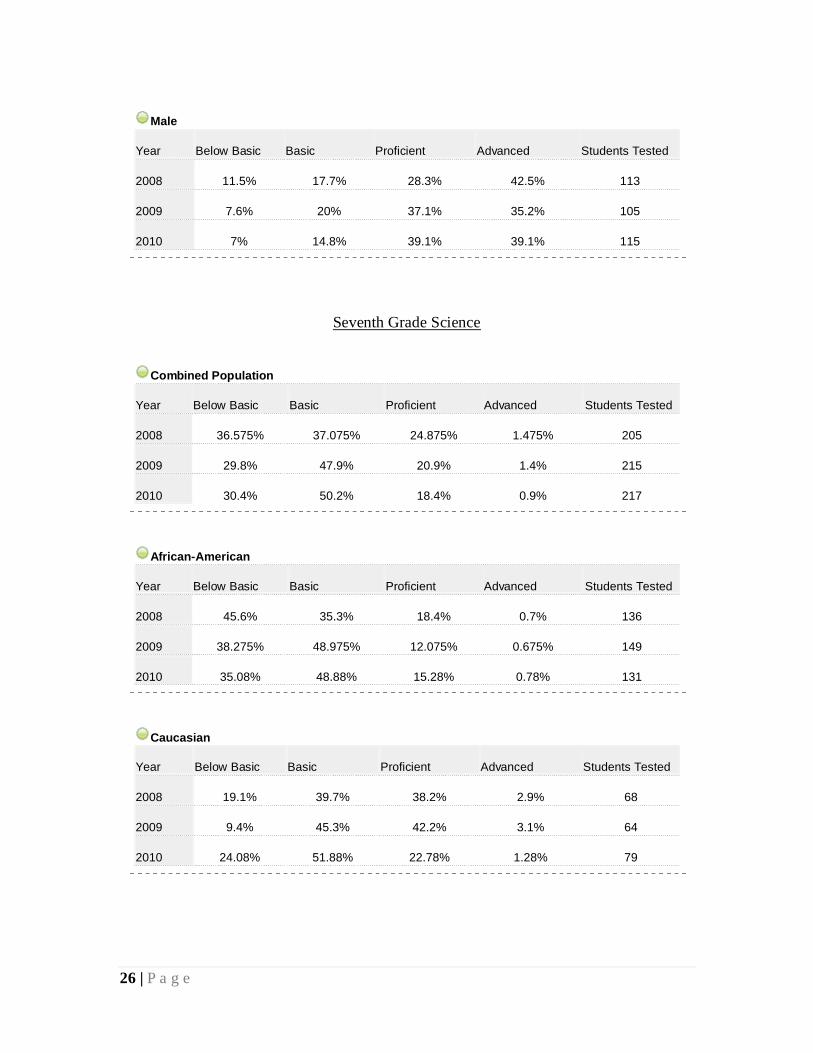
26 | P a g e
Male
Year Below Basic Basic Proficient Advanced Students Tested
2008 11.5% 17.7% 28.3% 42.5% 113
2009 7.6% 20% 37.1% 35.2% 105
2010 7% 14.8% 39.1% 39.1% 115
Seventh Grade Science
Combined Population
Year Below Basic Basic Proficient Advanced Students Tested
2008 36.575% 37.075% 24.875% 1.475% 205
2009 29.8% 47.9% 20.9% 1.4% 215
2010 30.4% 50.2% 18.4% 0.9% 217
African-American
Year Below Basic Basic Proficient Advanced Students Tested
2008 45.6% 35.3% 18.4% 0.7% 136
2009 38.275% 48.975% 12.075% 0.675% 149
2010 35.08% 48.88% 15.28% 0.78% 131
Caucasian
Year Below Basic Basic Proficient Advanced Students Tested
2008 19.1% 39.7% 38.2% 2.9% 68
2009 9.4% 45.3% 42.2% 3.1% 64
2010 24.08% 51.88% 22.78% 1.28% 79
27 | P a g e
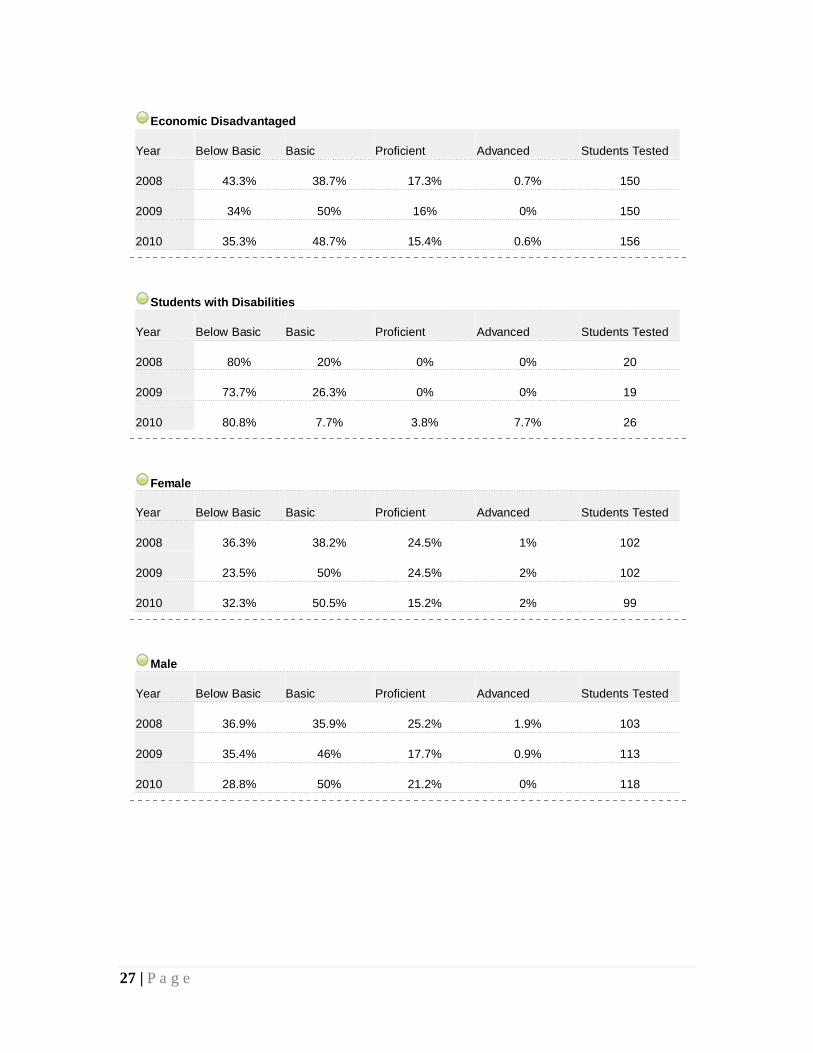
Economic Disadvantaged
Year Below Basic Basic Proficient Advanced Students Tested
2008 43.3% 38.7% 17.3% 0.7% 150
2009 34% 50% 16% 0% 150
2010 35.3% 48.7% 15.4% 0.6% 156
Students with Disabilities
Year Below Basic Basic Proficient Advanced Students Tested
2008 80% 20% 0% 0% 20
2009 73.7% 26.3% 0% 0% 19
2010 80.8% 7.7% 3.8% 7.7% 26
Female
Year Below Basic Basic Proficient Advanced Students Tested
2008 36.3% 38.2% 24.5% 1% 102
2009 23.5% 50% 24.5% 2% 102
2010 32.3% 50.5% 15.2% 2% 99
Male
Year Below Basic Basic Proficient Advanced Students Tested
2008 36.9% 35.9% 25.2% 1.9% 103
2009 35.4% 46% 17.7% 0.9% 113
2010 28.8% 50% 21.2% 0% 118
28 | P a g e
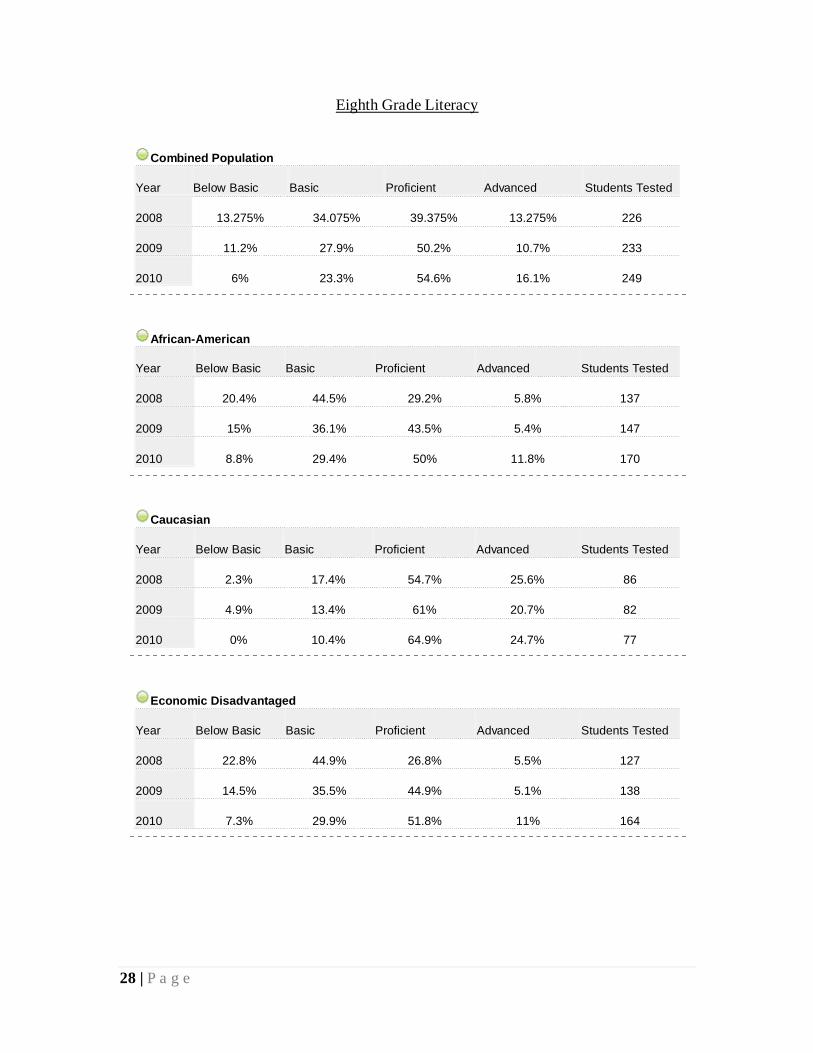
Eighth Grade Literacy
Combined Population
Year Below Basic Basic Proficient Advanced Students Tested
2008 13.275% 34.075% 39.375% 13.275% 226
2009 11.2% 27.9% 50.2% 10.7% 233
2010 6% 23.3% 54.6% 16.1% 249
African-American
Year Below Basic Basic Proficient Advanced Students Tested
2008 20.4% 44.5% 29.2% 5.8% 137
2009 15% 36.1% 43.5% 5.4% 147
2010 8.8% 29.4% 50% 11.8% 170
Caucasian
Year Below Basic Basic Proficient Advanced Students Tested
2008 2.3% 17.4% 54.7% 25.6% 86
2009 4.9% 13.4% 61% 20.7% 82
2010 0% 10.4% 64.9% 24.7% 77
Economic Disadvantaged
Year Below Basic Basic Proficient Advanced Students Tested
2008 22.8% 44.9% 26.8% 5.5% 127
2009 14.5% 35.5% 44.9% 5.1% 138
2010 7.3% 29.9% 51.8% 11% 164
29 | P a g e
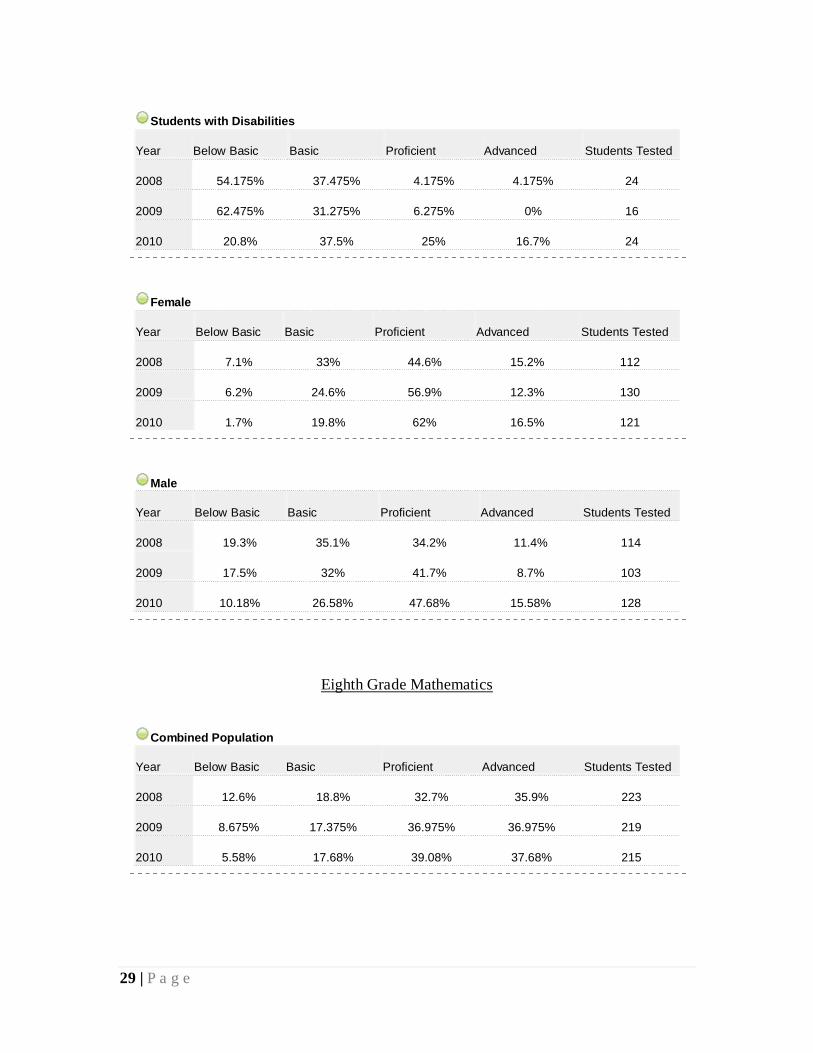
Students with Disabilities
Year Below Basic Basic Proficient Advanced Students Tested
2008 54.175% 37.475% 4.175% 4.175% 24
2009 62.475% 31.275% 6.275% 0% 16
2010 20.8% 37.5% 25% 16.7% 24
Female
Year Below Basic Basic Proficient Advanced Students Tested
2008 7.1% 33% 44.6% 15.2% 112
2009 6.2% 24.6% 56.9% 12.3% 130
2010 1.7% 19.8% 62% 16.5% 121
Male
Year Below Basic Basic Proficient Advanced Students Tested
2008 19.3% 35.1% 34.2% 11.4% 114
2009 17.5% 32% 41.7% 8.7% 103
2010 10.18% 26.58% 47.68% 15.58% 128
Eighth Grade Mathematics
Combined Population
Year Below Basic Basic Proficient Advanced Students Tested
2008 12.6% 18.8% 32.7% 35.9% 223
2009 8.675% 17.375% 36.975% 36.975% 219
2010 5.58% 17.68% 39.08% 37.68% 215
30 | P a g e
African-American
Year Below Basic Basic Proficient Advanced Students Tested
2008 15.3% 20.6% 35.1% 29% 131
2009 12.575% 20.275% 39.175% 27.975% 143
2010 7.88% 19.08% 39.48% 33.58% 152
Caucasian
Year Below Basic Basic Proficient Advanced Students Tested
2008 9% 16.9% 29.2% 44.9% 89
2009 1.4% 12.3% 32.9% 53.4% 73
2010 0% 14.3% 38.1% 47.6% 63
Economic Disadvantaged
Year Below Basic Basic Proficient Advanced Students Tested
2008 14.5% 23.3% 35.2% 27% 159
2009 10.6% 20% 39.4% 30% 160
2010 6.7% 21.5% 42.3% 29.4% 163
Students with Disabilities
Year Below Basic Basic Proficient Advanced Students Tested
2008 53.3% 10% 23.3% 13.3% 30
2009 33.3% 27.8% 16.7% 22.2% 18
2010 50% 25% 25% 0% 12
31 | P a g e
Female
Year Below Basic Basic Proficient Advanced Students Tested
2008 13.6% 20% 37.3% 29.1% 110
2009 9.6% 14.9% 36.8% 38.6% 114
2010 4% 21% 39% 36% 100
Male
Year Below Basic Basic Proficient Advanced Students Tested
2008 11.5% 17.7% 28.3% 42.5% 113
2009 7.6% 20% 37.1% 35.2% 105
2010 7% 14.8% 39.1% 39.1% 115
End Of Course Algebra
Combined Population
Year Below Basic Basic Proficient Advanced Students Tested
2008 17.3% 30.7% 43.7% 8.3% 277
2009 9.675% 37.675% 40.075% 12.575% 207
2010 12.5% 33% 43.2% 11.2% 303
African-American
Year Below Basic Basic Proficient Advanced Students Tested
2008 24.2% 34.6% 37.4% 3.8% 182
2009 13.5% 46.8% 32.5% 7.1% 126
2010 15.7% 35.8% 43.6% 4.9% 204
32 | P a g e
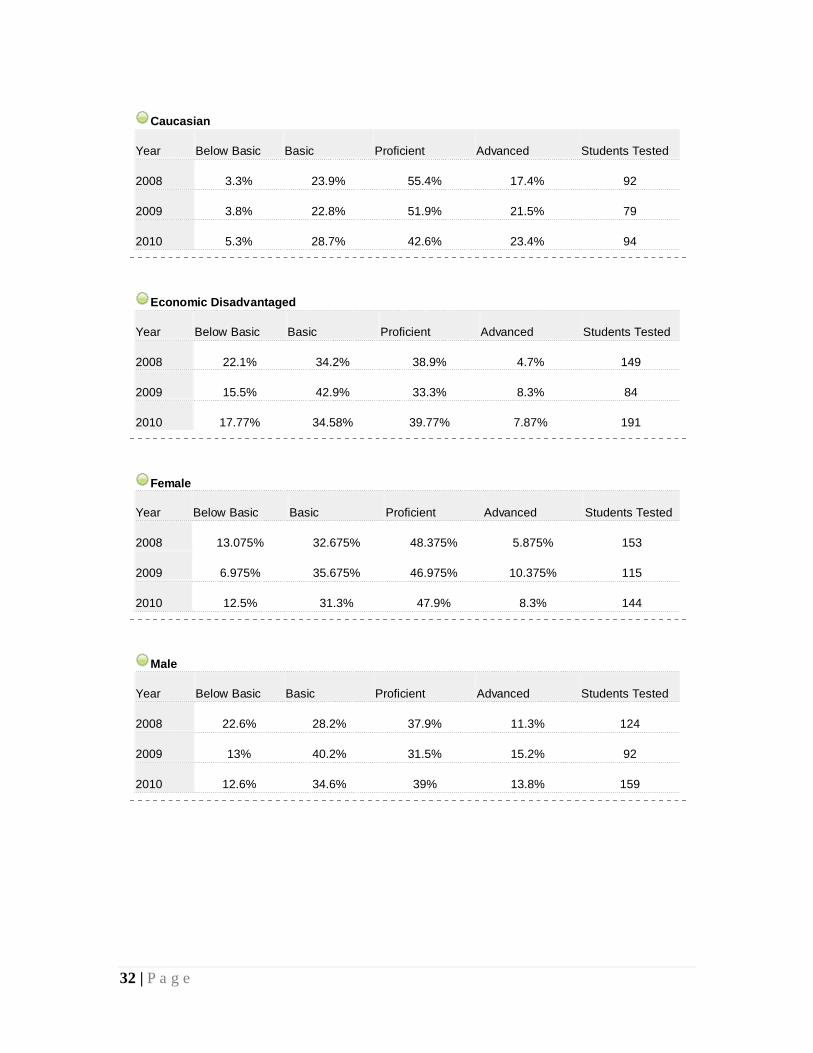
Caucasian
Year Below Basic Basic Proficient Advanced Students Tested
2008 3.3% 23.9% 55.4% 17.4% 92
2009 3.8% 22.8% 51.9% 21.5% 79
2010 5.3% 28.7% 42.6% 23.4% 94
Economic Disadvantaged
Year Below Basic Basic Proficient Advanced Students Tested
2008 22.1% 34.2% 38.9% 4.7% 149
2009 15.5% 42.9% 33.3% 8.3% 84
2010 17.77% 34.58% 39.77% 7.87% 191
Female
Year Below Basic Basic Proficient Advanced Students Tested
2008 13.075% 32.675% 48.375% 5.875% 153
2009 6.975% 35.675% 46.975% 10.375% 115
2010 12.5% 31.3% 47.9% 8.3% 144
Male
Year Below Basic Basic Proficient Advanced Students Tested
2008 22.6% 28.2% 37.9% 11.3% 124
2009 13% 40.2% 31.5% 15.2% 92
2010 12.6% 34.6% 39% 13.8% 159
33 | P a g e
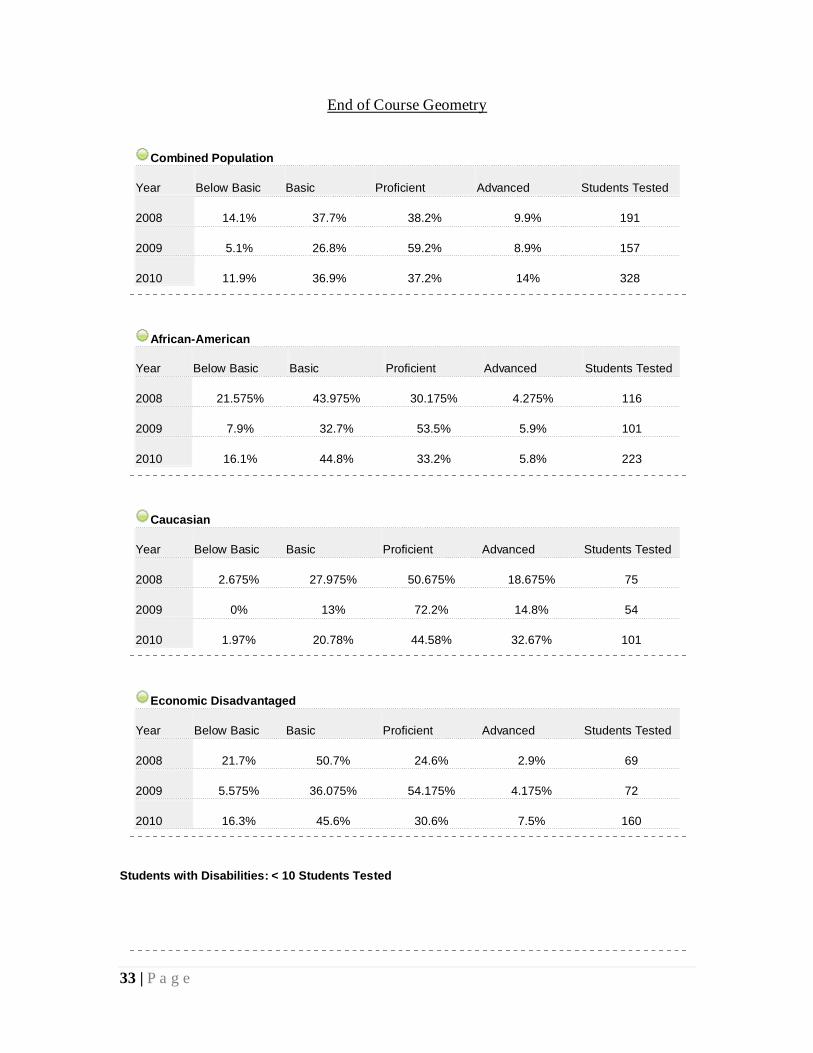
End of Course Geometry
Combined Population
Year Below Basic Basic Proficient Advanced Students Tested
2008 14.1% 37.7% 38.2% 9.9% 191
2009 5.1% 26.8% 59.2% 8.9% 157
2010 11.9% 36.9% 37.2% 14% 328
African-American
Year Below Basic Basic Proficient Advanced Students Tested
2008 21.575% 43.975% 30.175% 4.275% 116
2009 7.9% 32.7% 53.5% 5.9% 101
2010 16.1% 44.8% 33.2% 5.8% 223
Caucasian
Year Below Basic Basic Proficient Advanced Students Tested
2008 2.675% 27.975% 50.675% 18.675% 75
2009 0% 13% 72.2% 14.8% 54
2010 1.97% 20.78% 44.58% 32.67% 101
Economic Disadvantaged
Year Below Basic Basic Proficient Advanced Students Tested
2008 21.7% 50.7% 24.6% 2.9% 69
2009 5.575% 36.075% 54.175% 4.175% 72
2010 16.3% 45.6% 30.6% 7.5% 160
Students with Disabilities: < 10 Students Tested
34 | P a g e
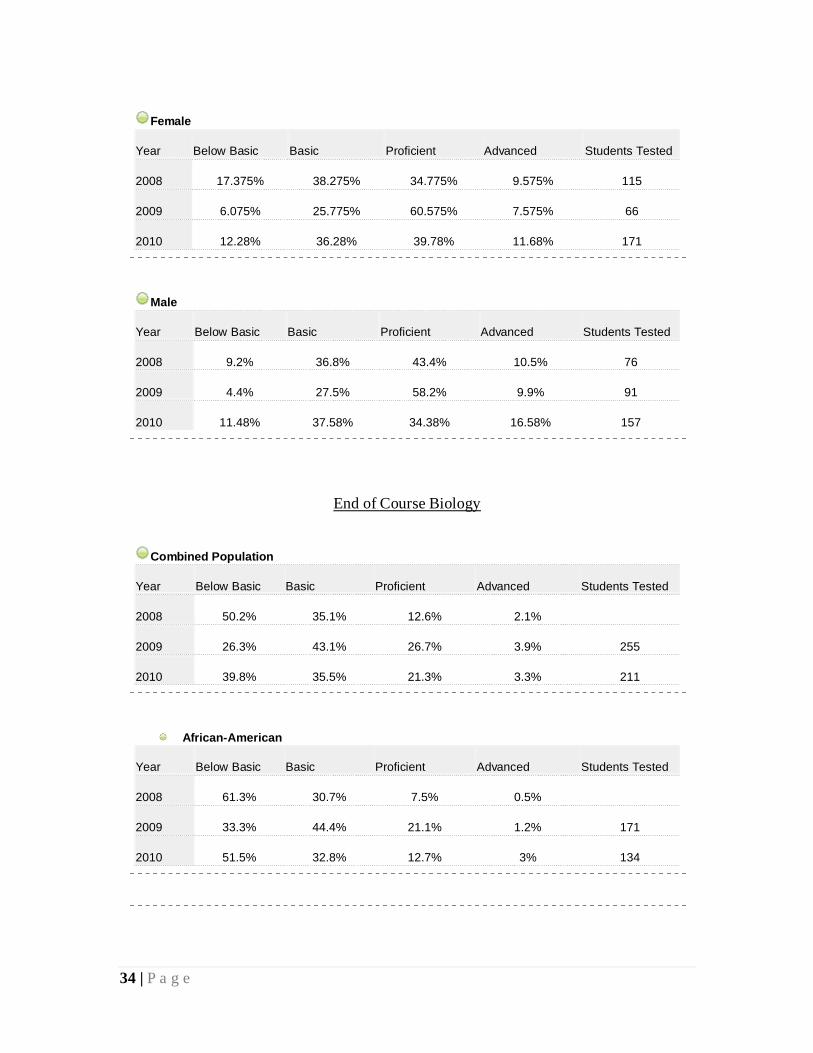
Female
Year Below Basic Basic Proficient Advanced Students Tested
2008 17.375% 38.275% 34.775% 9.575% 115
2009 6.075% 25.775% 60.575% 7.575% 66
2010 12.28% 36.28% 39.78% 11.68% 171
Male
Year Below Basic Basic Proficient Advanced Students Tested
2008 9.2% 36.8% 43.4% 10.5% 76
2009 4.4% 27.5% 58.2% 9.9% 91
2010 11.48% 37.58% 34.38% 16.58% 157
End of Course Biology
Combined Population
Year Below Basic Basic Proficient Advanced Students Tested
2008 50.2% 35.1% 12.6% 2.1%
2009 26.3% 43.1% 26.7% 3.9% 255
2010 39.8% 35.5% 21.3% 3.3% 211
African-American
Year Below Basic Basic Proficient Advanced Students Tested
2008 61.3% 30.7% 7.5% 0.5%
2009 33.3% 44.4% 21.1% 1.2% 171
2010 51.5% 32.8% 12.7% 3% 134
35 | P a g e
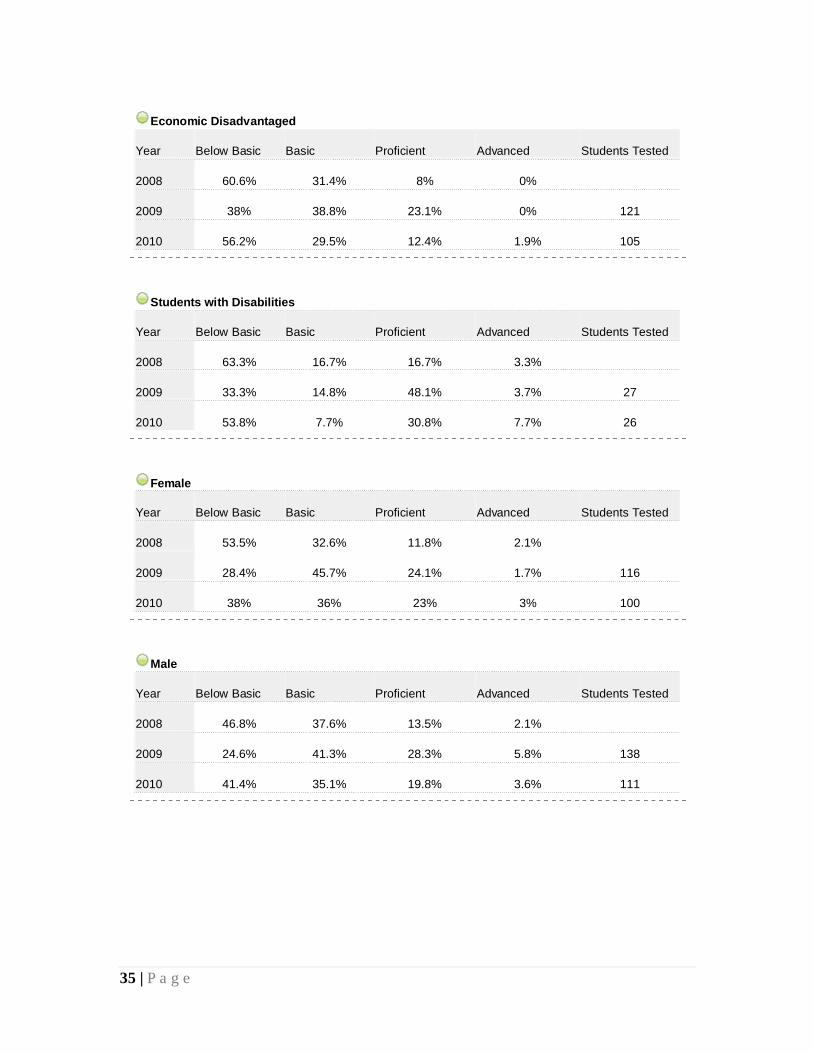
Economic Disadvantaged
Year Below Basic Basic Proficient Advanced Students Tested
2008 60.6% 31.4% 8% 0%
2009 38% 38.8% 23.1% 0% 121
2010 56.2% 29.5% 12.4% 1.9% 105
Students with Disabilities
Year Below Basic Basic Proficient Advanced Students Tested
2008 63.3% 16.7% 16.7% 3.3%
2009 33.3% 14.8% 48.1% 3.7% 27
2010 53.8% 7.7% 30.8% 7.7% 26
Female
Year Below Basic Basic Proficient Advanced Students Tested
2008 53.5% 32.6% 11.8% 2.1%
2009 28.4% 45.7% 24.1% 1.7% 116
2010 38% 36% 23% 3% 100
Male
Year Below Basic Basic Proficient Advanced Students Tested
2008 46.8% 37.6% 13.5% 2.1%
2009 24.6% 41.3% 28.3% 5.8% 138
2010 41.4% 35.1% 19.8% 3.6% 111
36 | P a g e
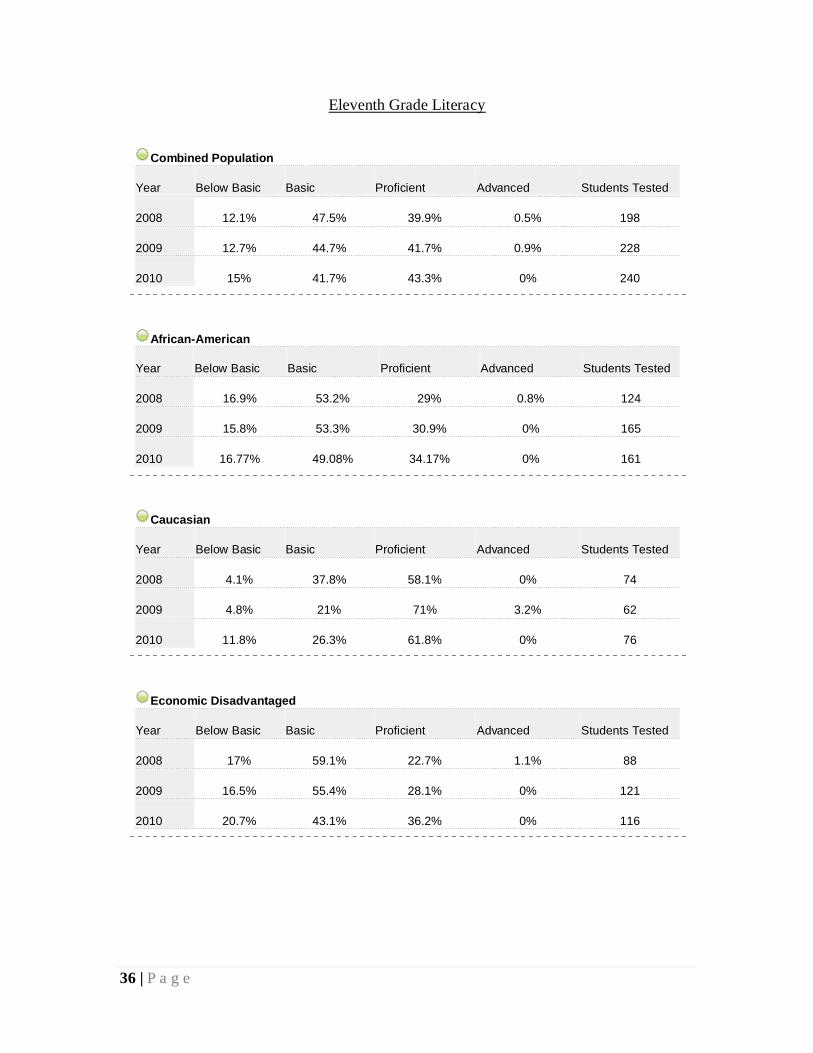
Eleventh Grade Literacy
Combined Population
Year Below Basic Basic Proficient Advanced Students Tested
2008 12.1% 47.5% 39.9% 0.5% 198
2009 12.7% 44.7% 41.7% 0.9% 228
2010 15% 41.7% 43.3% 0% 240
African-American
Year Below Basic Basic Proficient Advanced Students Tested
2008 16.9% 53.2% 29% 0.8% 124
2009 15.8% 53.3% 30.9% 0% 165
2010 16.77% 49.08% 34.17% 0% 161
Caucasian
Year Below Basic Basic Proficient Advanced Students Tested
2008 4.1% 37.8% 58.1% 0% 74
2009 4.8% 21% 71% 3.2% 62
2010 11.8% 26.3% 61.8% 0% 76
Economic Disadvantaged
Year Below Basic Basic Proficient Advanced Students Tested
2008 17% 59.1% 22.7% 1.1% 88
2009 16.5% 55.4% 28.1% 0% 121
2010 20.7% 43.1% 36.2% 0% 116
37 | P a g e
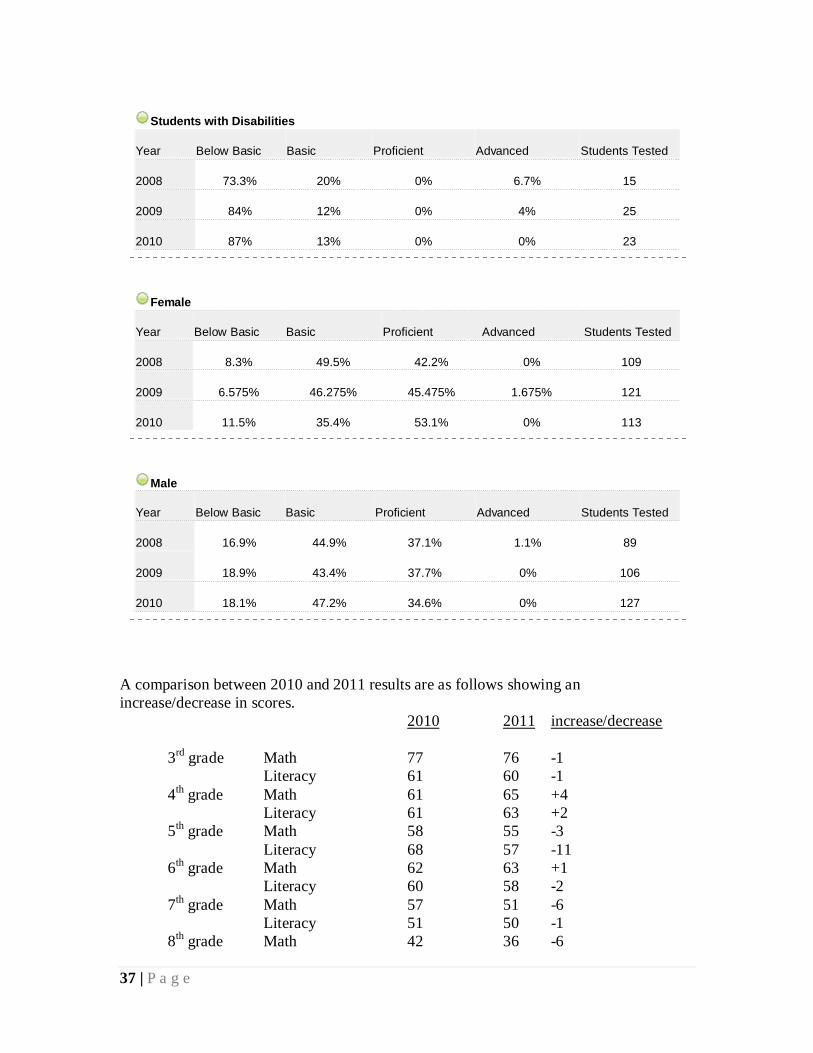
Students with Disabilities
Year Below Basic Basic Proficient Advanced Students Tested
2008 73.3% 20% 0% 6.7% 15
2009 84% 12% 0% 4% 25
2010 87% 13% 0% 0% 23
Female
Year Below Basic Basic Proficient Advanced Students Tested
2008 8.3% 49.5% 42.2% 0% 109
2009 6.575% 46.275% 45.475% 1.675% 121
2010 11.5% 35.4% 53.1% 0% 113
Male
Year Below Basic Basic Proficient Advanced Students Tested
2008 16.9% 44.9% 37.1% 1.1% 89
2009 18.9% 43.4% 37.7% 0% 106
2010 18.1% 47.2% 34.6% 0% 127
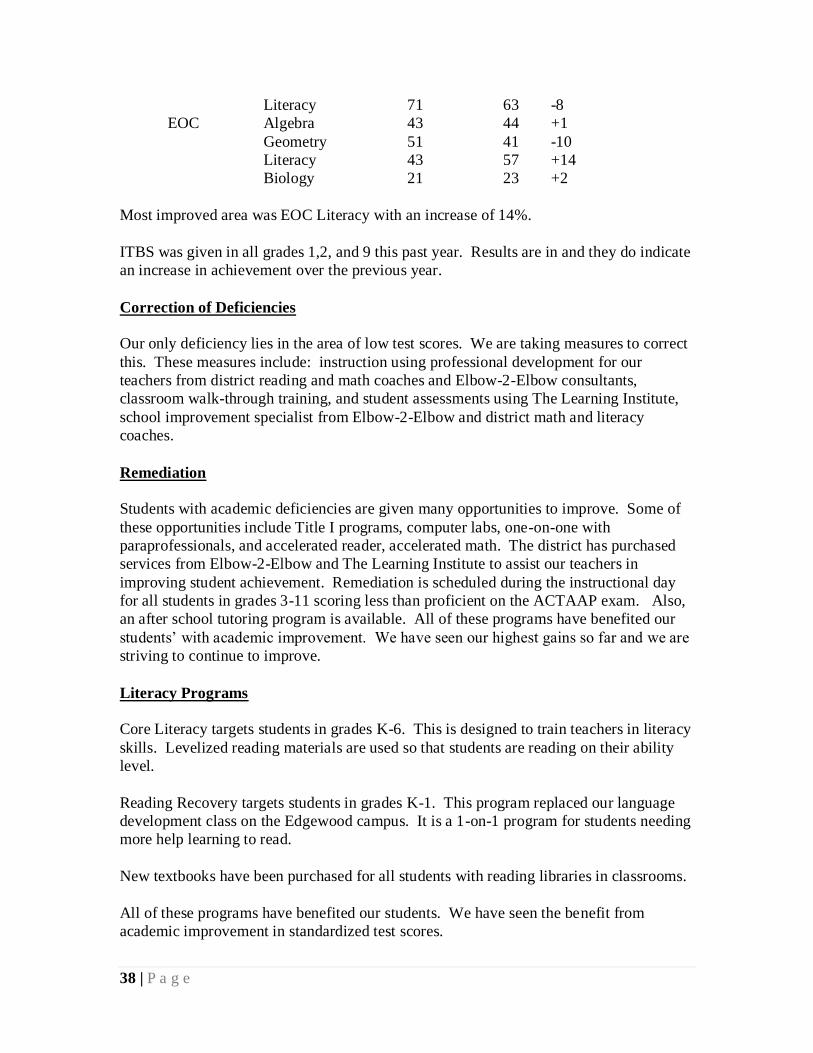
A comparison between 2010 and 2011 results are as follows showing an
increase/decrease in scores.
2010 2011 increase/decrease
3rd
grade Math 77 76 -1
Literacy 61 60 -1
4th grade Math 61 65 +4
Literacy 61 63 +2
5th grade Math 58 55 -3
Literacy 68 57 -11
6th grade Math 62 63 +1
Literacy 60 58 -2
7th grade Math 57 51 -6
Literacy 51 50 -1
8th grade Math 42 36 -6
38 | P a g e
Literacy 71 63 -8
EOC Algebra 43 44 +1
Geometry 51 41 -10
Literacy 43 57 +14
Biology 21 23 +2
Most improved area was EOC Literacy with an increase of 14%.
ITBS was given in all grades 1,2, and 9 this past year. Results are in and they do indicate
an increase in achievement over the previous year.
Correction of Deficiencies
Our only deficiency lies in the area of low test scores. We are taking measures to correct
this. These measures include: instruction using professional development for our
teachers from district reading and math coaches and Elbow-2-Elbow consultants,
classroom walk-through training, and student assessments using The Learning Institute,
school improvement specialist from Elbow-2-Elbow and district math and literacy
coaches.
Remediation
Students with academic deficiencies are given many opportunities to improve. Some of
these opportunities include Title I programs, computer labs, one-on-one with
paraprofessionals, and accelerated reader, accelerated math. The district has purchased
services from Elbow-2-Elbow and The Learning Institute to assist our teachers in
improving student achievement. Remediation is scheduled during the instructional day
for all students in grades 3-11 scoring less than proficient on the ACTAAP exam. Also,
an after school tutoring program is available. All of these programs have benefited our
students’ with academic improvement. We have seen our highest gains so far and we are
striving to continue to improve.
Literacy Programs
Core Literacy targets students in grades K-6. This is designed to train teachers in literacy
skills. Levelized reading materials are used so that students are reading on their ability
level.
Reading Recovery targets students in grades K-1. This program replaced our language
development class on the Edgewood campus. It is a 1-on-1 program for students needing
more help learning to read.
New textbooks have been purchased for all students with reading libraries in classrooms.
All of these programs have benefited our students. We have seen the benefit from
academic improvement in standardized test scores.
39 | P a g e
ACT Scores
The average composite score is 18. We have enhancement classes in high school for
students to better themselves on the ACT. A summer ACT program is planned for the
coming summer.
Vocational Program
All vocational courses meet state approval. Students are scoring equal to or higher than
state average.
Supplemental Educational Services
Services will be offered at all three elementary schools in the areas of literacy and math at
no cost to the parents. Students participating in SES services must score below proficient
on standardized testing and their parents must meet financial guidelines based up free and
reduced meal status.
Alternative Learning Environment
ALE is offered for students that cannot function appropriately in the regular classroom or
for credit recovery. ALE classes are available at the Jr. & Sr. High Schools.
Technology
CIPA - Children’s Internet Protection Act
The Children’s Internet Protection Act (CIPA) was signed into law on December 21,
2000. Under CIPA no school or library may receive free internet services unless it
certifies that it is enforcing a policy of internet safety that includes the use of filtering or
blocking technology. This internet safety policy must protect our students from visual
depictions that are obscene, child pornography, or harmful to minors.
Watson Chapel School District blocks materials inappropriate for students. Our
Acceptable User Policy is found in the student handbook concerning the use of school
computers, network, and internet access. It includes a discussion of cyber bullying and
disciplinary consequences. When students and teachers login to our school’s network
system, they agree to our Acceptable User Policy according to the Network Warning
Banner.
We provide email for students in the Distance Learning Lab, East Lab, and the
computerized Accounting classes through a web site named, Gaggle.net. Gaggle.net is a
safe web based internet communication system for students where the teacher is always
in control. It allows schools to feel confident about giving their students access to email.
40 | P a g e
It offers the highest degree of CIPA compliance. It blocks “visual depictions that are
obscene, child pornography, or harmful to minors”.
Distance Learning Lab
The Distance Learning Lab is available to students in the junior and senior high schools
allowing them to take courses that can not fit in a regular schedule. Also this lab can be
used for credit recovery. Oral Communications and Survey of Fine Arts is currently
taught to 9th
graders. Our distance learning lab is with the Arkansas Department of
Education Distance Learning Lab in Maumelle.
EAST Lab
Available to junior and senior high school students. The EAST Lab will allow students
to work on individual projects. These projects are community based.
21st Century After School Program
After school programs are offered for grades 2-6. More than 200 students are involved in
this activity. This program includes sessions for homework and tutorial as well as
physical activity.
Extra-Curricular Activities
Vocational clubs and organizations are available for student membership. Many students
are involved in athletics, music (instrumental and vocal) quiz bowl, and/or student
publications such as yearbook and school newspapers.
Curriculum
Thirty-eight units are required to be in the curriculum for grades 9-12. Watson Chapel
School offers 70 units. All schools in grades K-12 offer and teach all required courses.
Parent Involvement
Parents are always encouraged to be active in their child’s educational planning. Two
parent conferences will be scheduled each year. Parents are strongly advised to consult
with teachers during these meetings to determine each child’s progress.
All of our schools have a parent center located in each library. The librarians are the
facilitators for each center. The centers house materials to help parents and students.
Each facilitator can be reached by calling the principal’s office at each school.
41 | P a g e
ACT 1220
Watson Chapel Schools have formed a School Nutrition and Physical Activity Advisory
Committee. This committee includes members from the various levels of school
organization.
Volunteer Program
Volunteers are encouraged on each campus.
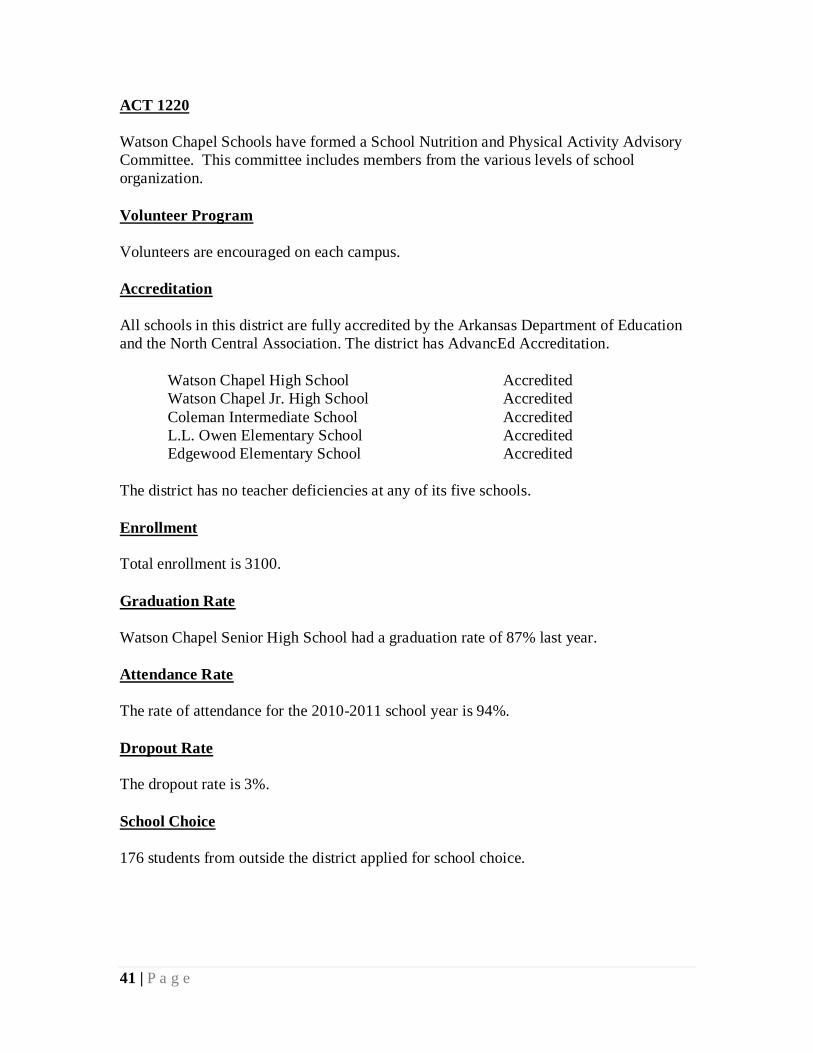
Accreditation
All schools in this district are fully accredited by the Arkansas Department of Education
and the North Central Association. The district has AdvancEd Accreditation.
Watson Chapel High School Accredited
Watson Chapel Jr. High School Accredited
Coleman Intermediate School Accredited
L.L. Owen Elementary School Accredited
Edgewood Elementary School Accredited
The district has no teacher deficiencies at any of its five schools.
Enrollment
Total enrollment is 3100.
Graduation Rate
Watson Chapel Senior High School had a graduation rate of 87% last year.
Attendance Rate
The rate of attendance for the 2010-2011 school year is 94%.
Dropout Rate
The dropout rate is 3%.
School Choice
176 students from outside the district applied for school choice.
42 | P a g e
State Reviews
The district will have a standards review this spring. The vocational programs at the Jr.
and Sr. High Schools will also be evaluated this year.
Statement
Watson Chapel School District is committed to providing our students an excellent
education. We want parents and the community involved in the educational process.
With everyone working toward the same goals, we can provide the education our students
needs.
District Website
wc-web.k12.ar.us