Embed Size (px)
Citation preview
1
Annual General Meeting 17 November 2016
Minotaur Exploration Limited | ASX: MEP
2
Minotaur’s points of difference
§ Enviable record of exploration success
§ Focus and quality of core assets underpins exploration potential in Queensland and South Australia
§ Business model based on JV partnerships optimises cash reserves and maximises exploration breadth
§ In the top 5% of most active ‘junior miners’ for exploration activity through FY2016
§ History of responsible capital management with a strong balance sheet
§ High profile share register including Sprott, OZ Minerals, Sandfire and FMR Investments
§ Extensive work programs with OZ Minerals underway at flagship Eloise JV and around Prominent Hill mine
§ Iris (part of the Eloise JV with OZ Minerals) confirmed as a new Iron Sulphide Copper-Gold discovery
3
-
3
6
9
12
15
18
21
-
2
4
6
8
10
12
14
Nov-15 Feb-16 May-16 Aug-16 Nov-16
MEP daily volume Minotaur ASX 300 Metals & Mining Index (rebased)
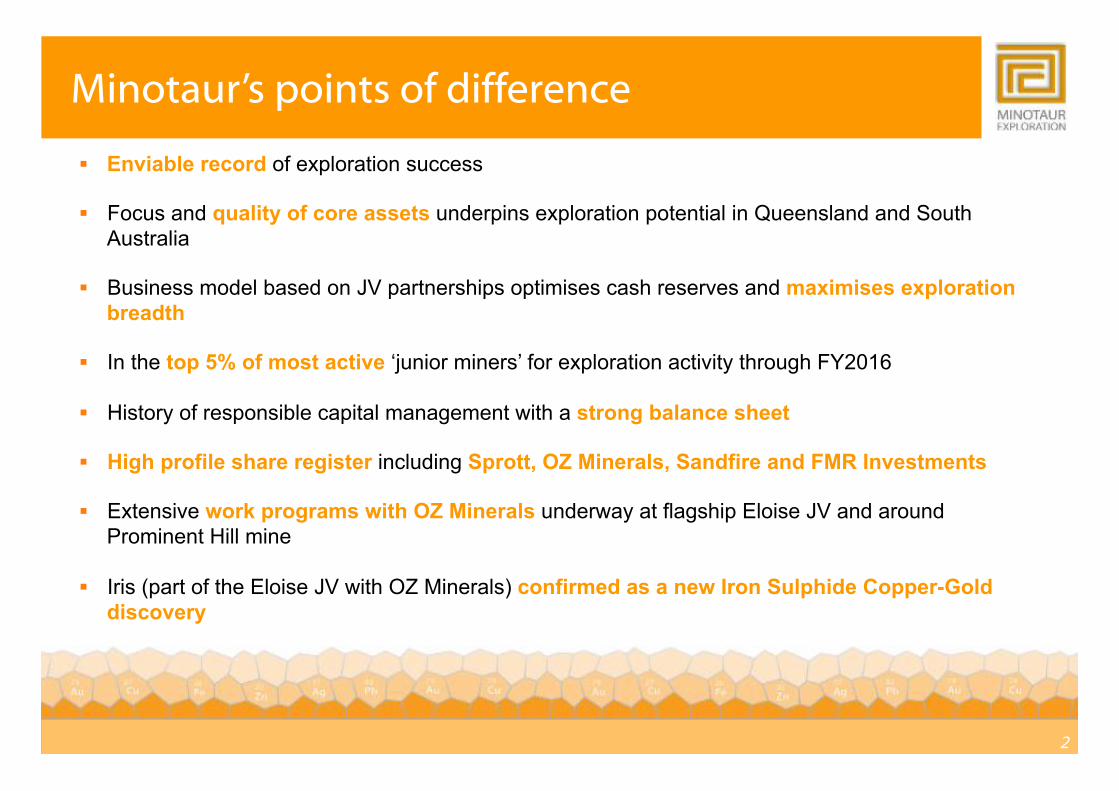
Corporate snapshot
Financial information
Number of shares 212.4m
Share price (14-Nov-16) A$0.097
Market capitalisation A$20.6m
Cash (30-Sep-16) A$2.9m
Listed investments (14-Nov-16) A$0.6m
Enterprise value A$17.1m
About Minotaur Exploration (ASX: MEP) § Primary focus on copper and gold exploration in Queensland
and S.A.
§ Well regarded for exploration technical excellence
§ Supportive and high quality JV partners
§ Monetising non-core assets (S.A. and W.A. projects)
JV partners and collaborators
OZ Minerals Australian copper-gold producer
Sandre Resources Australian copper-gold producer
JOGMEC Japan Oil, Gas and Metals National Corporation; Japanese Government entity
Sumitomo Metal Mining Oceania Major global metals producer & rener
Major shareholders
Sprott Inc. (TSX: SII) a global resources fund 12.9%
Yarraandoo Private Australian mining investor 6.2%
OZ Minerals ASX-listed copper-gold miner with a market capitalisation of c. A$1.8bn 3.8%
FMR Investments Owner/operator of the Eloise Copper Mine, Queensland 1.4%
Sandre Resources ASX-listed copper miner with a market capitalisation of c. A$0.8bn 1.2%
Top 20 35%
Strong mining shareholders, smart mining money and high quality JV partners
Source: IRESS
Share price (Ac per share) Volume (m)
Share price performance over last 12 months
Recent period of outperformance and increased liquidity post drilling program announcements
4
(15)
(10)
(5)
-
5
10
FY 2012 FY 2013 FY 2014 FY 2015 FY 2016
Development Other operating cash ow (JV receipts, R&D refunds, etc.) Admin Exploration
Notes: 1. Chart totals correspond to quarterly exploration plus administration expenditure by Minotaur and the average of junior miners 2. Junior miners includes ASX-listed metals & mining companies with a market capitalisation of <A$100m as at 30-Jun-16 (c. 500 companies)
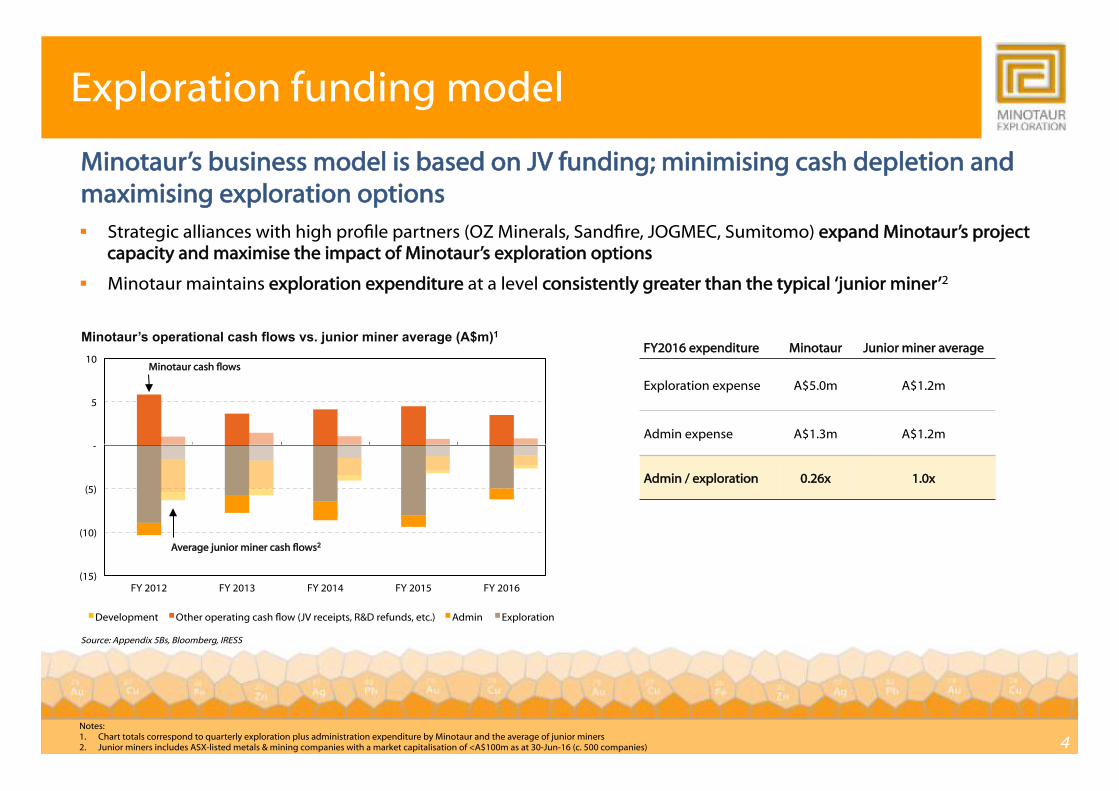
Minotaur’s business model is based on JV funding; minimising cash depletion and maximising exploration options § Strategic alliances with high prole partners (OZ Minerals, Sandre, JOGMEC, Sumitomo) expand Minotaur’s project
capacity and maximise the impact of Minotaur’s exploration options
§ Minotaur maintains exploration expenditure at a level consistently greater than the typical ‘junior miner’2
Exploration funding model
Minotaur’s operational cash flows vs. junior miner average (A$m)1
Source: Appendix 5Bs, Bloomberg, IRESS
Minotaur cash ows
Average junior miner cash ows2
FY2016 expenditure Minotaur Junior miner average
Exploration expense A$5.0m A$1.2m
Admin expense A$1.3m A$1.2m
Admin / exploration 0.26x 1.0x
5
9%
41%
24%
2%
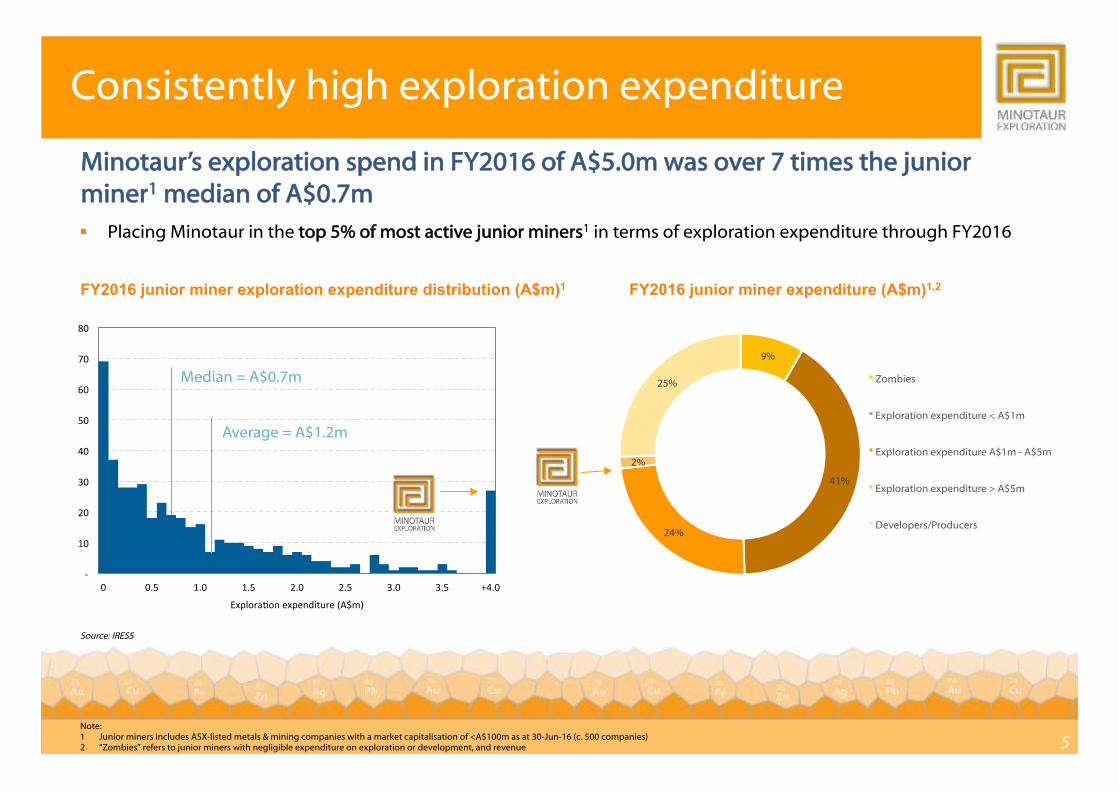
25% Zombies
Exploration expenditure < A$1m
Exploration expenditure A$1m - A$5m
Exploration expenditure > A$5m
Developers/Producers
-‐
10
20
30
40
50
60
70
80
0 0.5 1.0 1.5 2.0 2.5 3.0 3.5 +4.0
Explora5on expenditure (A$m)
Median = A$0.7m
Average = A$1.2m
FY2016 junior miner exploration expenditure distribution (A$m)1
Minotaur’s exploration spend in FY2016 of A$5.0m was over 7 times the junior miner1 median of A$0.7m
Source: IRESS
Consistently high exploration expenditure
FY2016 junior miner expenditure (A$m)1,2
§ Placing Minotaur in the top 5% of most active junior miners1 in terms of exploration expenditure through FY2016
Note: 1 Junior miners includes ASX-listed metals & mining companies with a market capitalisation of <A$100m as at 30-Jun-16 (c. 500 companies) 2 “Zombies” refers to junior miners with negligible expenditure on exploration or development, and revenue
6
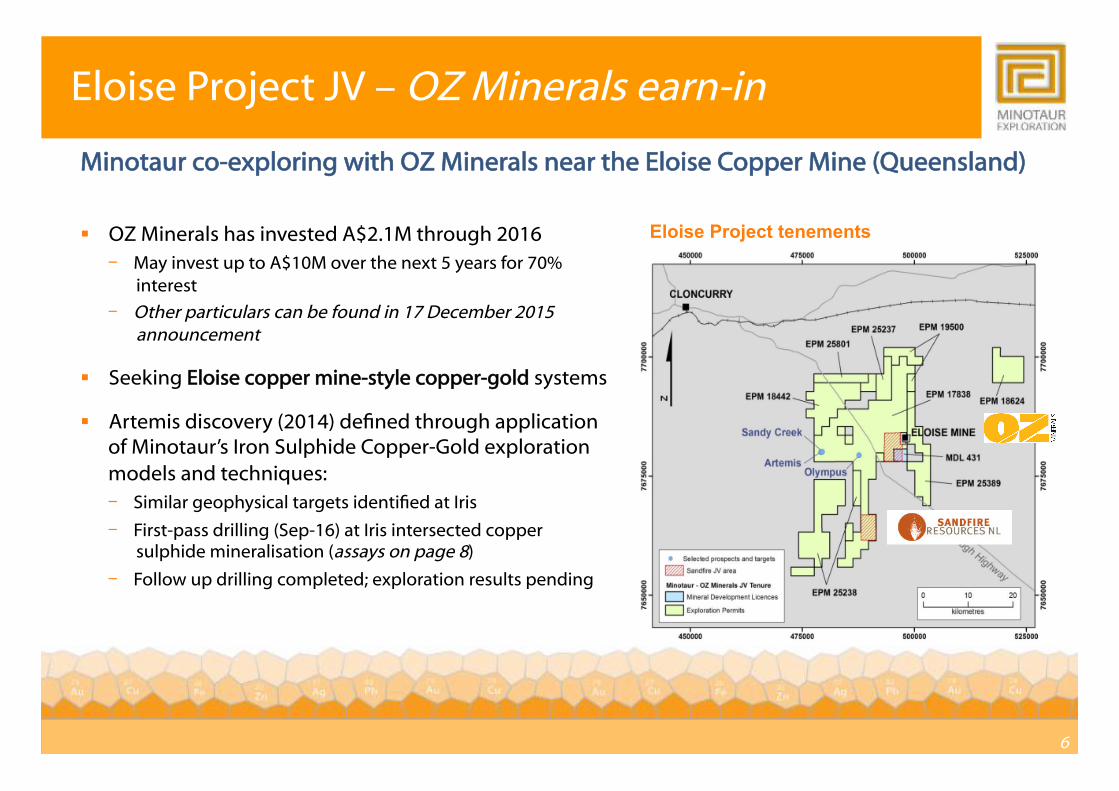
Eloise Project JV – OZ Minerals earn-in
§ OZ Minerals has invested A$2.1M through 2016 ‒ May invest up to A$10M over the next 5 years for 70%
interest
‒ Other particulars can be found in 17 December 2015 announcement
§ Seeking Eloise copper mine-style copper-gold systems
§ Artemis discovery (2014) dened through application of Minotaur’s Iron Sulphide Copper-Gold exploration models and techniques: ‒ Similar geophysical targets identied at Iris
‒ First-pass drilling (Sep-16) at Iris intersected copper sulphide mineralisation (assays on page 8)
‒ Follow up drilling completed; exploration results pending
Eloise Project tenements
Minotaur co-exploring with OZ Minerals near the Eloise Copper Mine (Queensland)
7
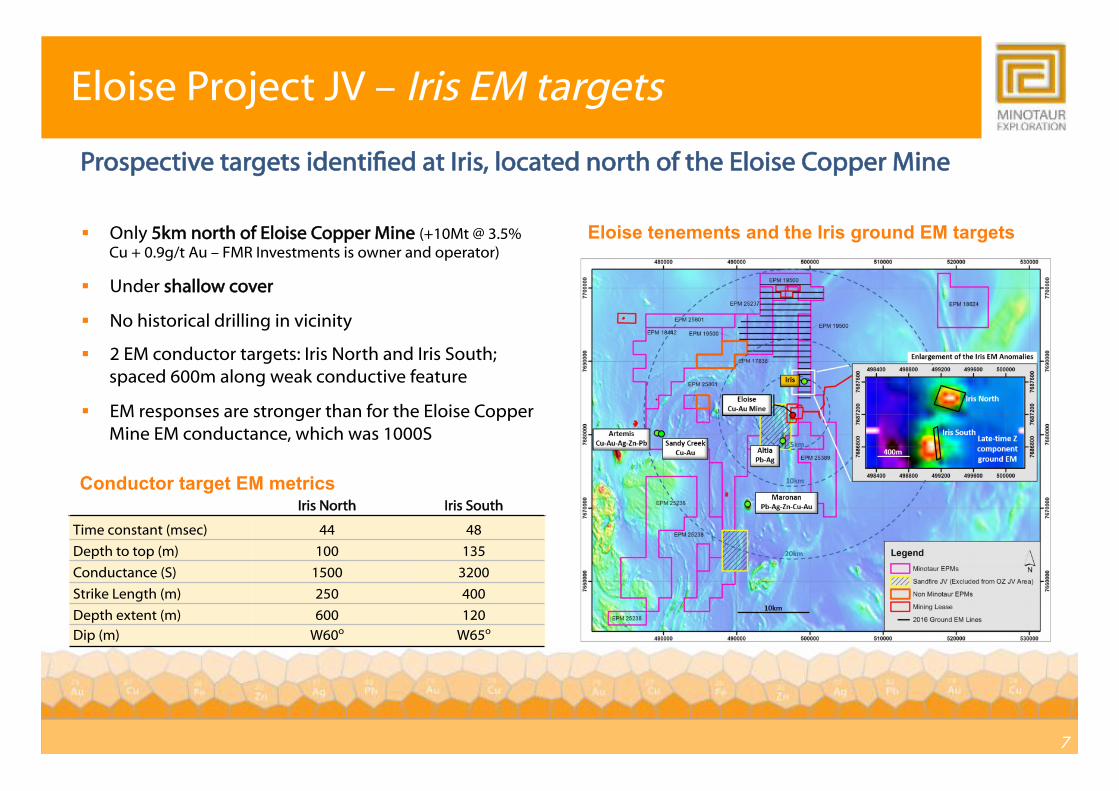
§ Only 5km north of Eloise Copper Mine (+10Mt @ 3.5% Cu + 0.9g/t Au – FMR Investments is owner and operator)
§ Under shallow cover
§ No historical drilling in vicinity
§ 2 EM conductor targets: Iris North and Iris South; spaced 600m along weak conductive feature
§ EM responses are stronger than for the Eloise Copper Mine EM conductance, which was 1000S
Iris North Iris South
Time constant (msec) 44 48
Depth to top (m) 100 135
Conductance (S) 1500 3200
Strike Length (m) 250 400
Depth extent (m) 600 120 Dip (m) W60o W65o
Prospective targets identied at Iris, located north of the Eloise Copper Mine
Eloise tenements and the Iris ground EM targets
Eloise Project JV – Iris EM targets
Conductor target EM metrics
8
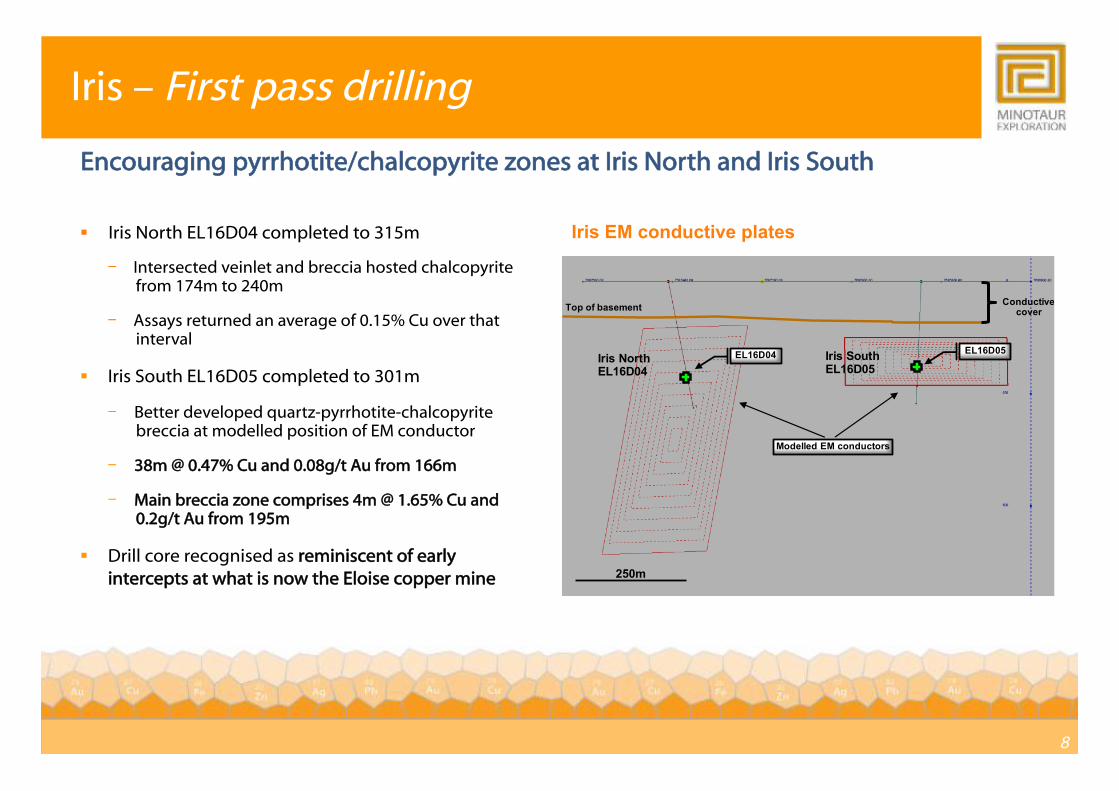
§ Iris North EL16D04 completed to 315m
‒ Intersected veinlet and breccia hosted chalcopyrite from 174m to 240m
‒ Assays returned an average of 0.15% Cu over that interval
§ Iris South EL16D05 completed to 301m
‒ Better developed quartz-pyrrhotite-chalcopyrite breccia at modelled position of EM conductor
‒ 38m @ 0.47% Cu and 0.08g/t Au from 166m
‒ Main breccia zone comprises 4m @ 1.65% Cu and 0.2g/t Au from 195m
§ Drill core recognised as reminiscent of early intercepts at what is now the Eloise copper mine
Encouraging pyrrhotite/chalcopyrite zones at Iris North and Iris South
Iris – First pass drilling
Iris EM conductive plates
250m
Top of basement Conductive cover
Iris NorthEL16D04
Iris SouthEL16D05
Modelled EM conductors
EL16D04 EL16D05

9
§ 1,500m of extra reconnaissance drilling completed
‒ 2 holes down-dip to follow-up the Iris North and Iris South intersections
‒ 1 hole 100m north of Iris South
‒ 1 hole 100m south of Iris South
§ Drill assays and interpretation will be published in week commencing 21 November 2016
§ Additional 18 line km of ground EM covering Iris and Electra anomalies (see next slide)
u Osborne JV (in collaboration with JOGMEC)
‒ Ground geophysical surveys completed
‒ Data processing underway, showing several anomalies recorded
Iris – Follow-up drilling and EM
Follow-up drilling activity at Iris completed, with assays pending
Drill hole locations
✚ Original drill holes ✚ / ✚ Follow-up drilling
200m
SouthNorth
EL16D04
EL16D09
EL16D10EL16D05
EL16D08
EL16D07
Modelled EM conductors
Iris South
Iris North
10
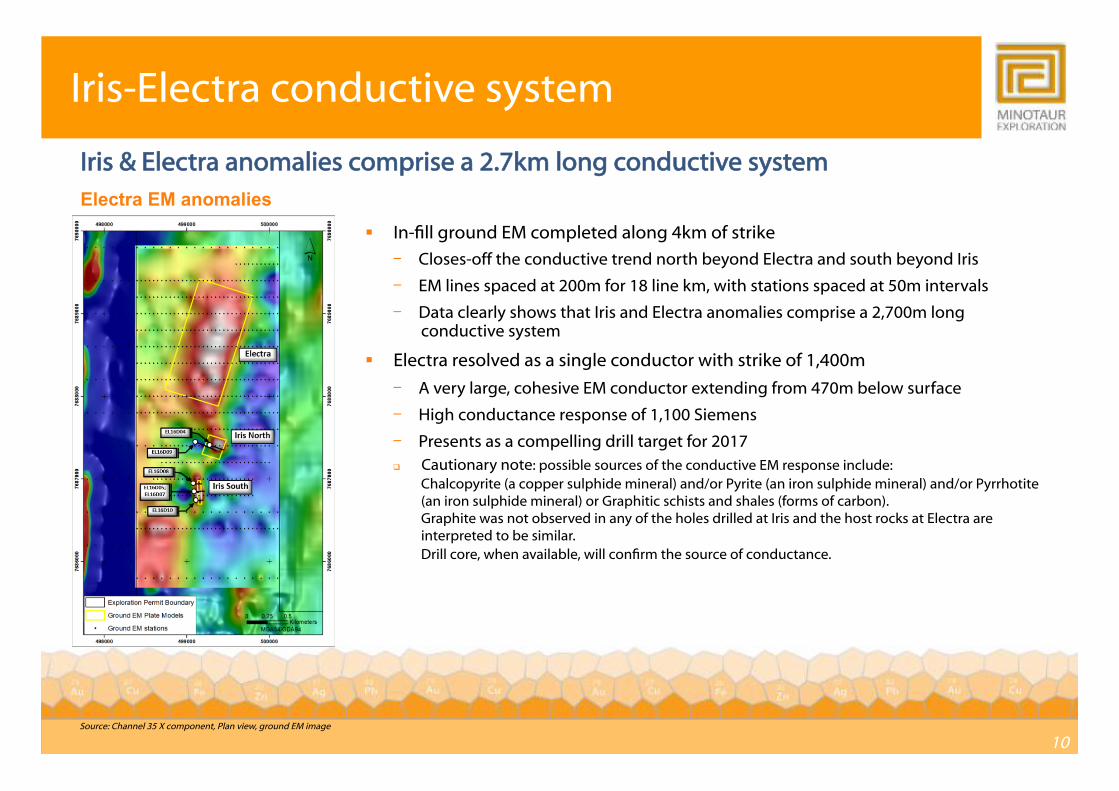
Iris-Electra conductive system
§ In-ll ground EM completed along 4km of strike
‒ Closes-off the conductive trend north beyond Electra and south beyond Iris
‒ EM lines spaced at 200m for 18 line km, with stations spaced at 50m intervals
‒ Data clearly shows that Iris and Electra anomalies comprise a 2,700m long conductive system
§ Electra resolved as a single conductor with strike of 1,400m
‒ A very large, cohesive EM conductor extending from 470m below surface
‒ High conductance response of 1,100 Siemens
‒ Presents as a compelling drill target for 2017 q Cautionary note: possible sources of the conductive EM response include:
Chalcopyrite (a copper sulphide mineral) and/or Pyrite (an iron sulphide mineral) and/or Pyrrhotite (an iron sulphide mineral) or Graphitic schists and shales (forms of carbon). Graphite was not observed in any of the holes drilled at Iris and the host rocks at Electra are interpreted to be similar. Drill core, when available, will conrm the source of conductance.
Source: Channel 35 X component, Plan view, ground EM image
Iris & Electra anomalies comprise a 2.7km long conductive system Electra EM anomalies
11
This presentation has been prepared by the management of Minotaur Exploration Limited (“Minotaur”, ASX: MEP) for the general benefit of analysts, brokers and investors and does not constitute specific advice to any particular party or persons. Information herein is based on publicly available information, internally developed data and other sources. Where an opinion, projection or forward looking statement is expressed in this presentation, it is based on the assumptions and limitations mentioned herein and is an expression of present opinion only. No warranties or representations are made or implied as to origin, validity, accuracy, completeness, currency or reliability of the information. Minotaur specifically disclaims and excludes all liability (to the extent permitted by law) for losses, claims, damages, demands, costs and expenses of whatever nature arising in any way out of or in connection with the information, its accuracy, completeness or by reason of reliance by any person on any of it. Where Minotaur expresses or implies an expectation or belief as to the success of future exploration and the economic viability of future project evaluations, such expectation or belief is expressed in good faith and is believed to have a reasonable basis. However, such projected outcomes are subject to risks, uncertainties and other factors which could cause actual results to differ materially from projected future results. Such risks include, but are not limited to, exploration success, metal price volatility, changes to current mineral resource estimates or targets, changes to assumptions for capital and operating costs as well as political and operational risks and government regulatory outcomes. MEP disclaims any obligation to advise any person if it becomes aware of any inaccuracy in or omission from any forecast or to update such forecast.
Information in this presentation that relates to exploration results for Minotaur Exploration Ltd is based on information compiled by Mr Glen Little, who is a full-time employee of the Company and a Member of the Australian Institute of Geoscientists (AIG). Mr Little has sufficient experience relevant to the style of mineralisation and type of deposits under consideration and to the activity that he has undertaken to qualify as a Competent Person as defined in the 2012 Edition of the “Australasian Code for Reporting of Exploration Results, Mineral Resources and Ore Reserves” (JORC Code). Mr Little consents to inclusion of this information in the form and context in which it appears.
Competent Person’s Statement
Explanatory statements
Disclaimer
About the Eloise Joint Venture OZ Minerals Ltd (ASX: OZL) has, through calendar 2016, funded $2.1 million of exploration expenditure on Minotaur’s 100% owned ‘Eloise’ tenements, 65km south-east of Cloncurry, Queensland. OZ Minerals may sole fund up to $10 million over six years for which it will earn 70% beneficial interest in the tenement package. Minotaur is manager and operator of the joint venture, with the parties collaborating closely so as to maximise the probability of discovery success.