Embed Size (px)
Citation preview
Minor Projects on Water & Soil
Analysis
1
Minor Projects on Water and Soil Analysis
Workshop on Student Projects for B.Sc. Chemistry (Core)
07th September 2012
Department of Chemistry, UoK, Kariavattom Campus, Trivandrum
Joined Programme of DoC & ACT
Dr. K. Anoop Krishnan
Scientist
Chemical Sciences Division
Centre for Earth Science Studies (CESS)
Trivandrum, India
OUTLINE
• Water distribution
• Physic-chemical parameters
• Instruments & accessories
• Analytical Procedures
• General methodology
• Type of research projects
• Proposed titles for research programme
• Major ion Chemistry (Modeling)
2
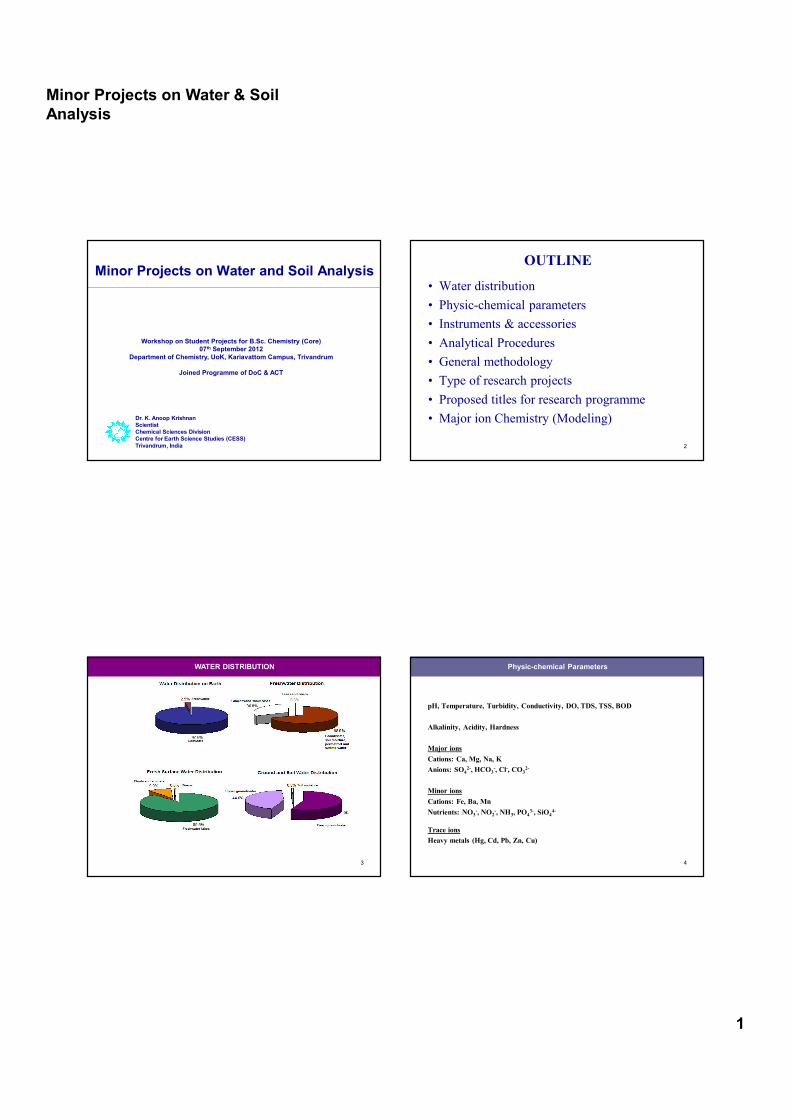
WATER DISTRIBUTION
3
pH, Temperature, Turbidity, Conductivity, DO, TDS, TSS, BOD
Alkalinity, Acidity, Hardness
Major ions
Cations: Ca, Mg, Na, K
Anions: SO42-, HCO3
-, Cl-, CO32-
Minor ions
Cations: Fe, Ba, Mn
Nutrients: NO3-, NO2
-, NH3, PO43-, SiO4
4-
Trace ions
Heavy metals (Hg, Cd, Pb, Zn, Cu)
Physic-chemical Parameters
4
Minor Projects on Water & Soil
Analysis
2
INSTRUMENTS & ACCESSORIES
FIELD
GPS, High end Camera
Portable Water Quality Analyser
Bottles (Normal type, DO Bottles, BOD Bottles)
Bucket, Mug and funnels, Vials for microbiology, measuring tape, rope,
filter papers, Secchi disc
LAB
Bench type multiparameter analyser, Turbidimeter, Spectrophotometer,
Flame photometer, Cadmium column, APHA (analytical manual)
5
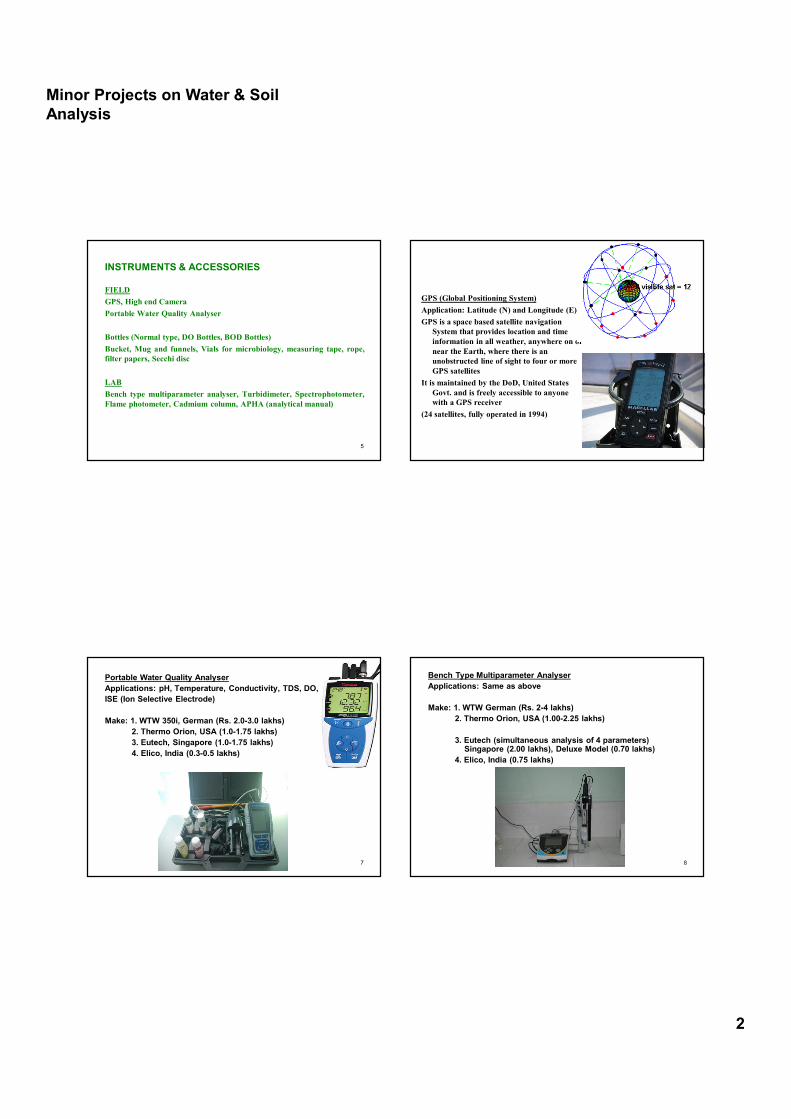
GPS (Global Positioning System)
Application: Latitude (N) and Longitude (E)
GPS is a space based satellite navigation
System that provides location and time
information in all weather, anywhere on or
near the Earth, where there is an
unobstructed line of sight to four or more
GPS satellites
It is maintained by the DoD, United States
Govt. and is freely accessible to anyone
with a GPS receiver
(24 satellites, fully operated in 1994)
Portable Water Quality Analyser
Applications: pH, Temperature, Conductivity, TDS, DO, Salinity
ISE (Ion Selective Electrode)
Make: 1. WTW 350i, German (Rs. 2.0-3.0 lakhs)
2. Thermo Orion, USA (1.0-1.75 lakhs)
3. Eutech, Singapore (1.0-1.75 lakhs)
4. Elico, India (0.3-0.5 lakhs)
7
Bench Type Multiparameter Analyser
Applications: Same as above
Make: 1. WTW German (Rs. 2-4 lakhs)
2. Thermo Orion, USA (1.00-2.25 lakhs)
3. Eutech (simultaneous analysis of 4 parameters)Singapore (2.00 lakhs), Deluxe Model (0.70 lakhs)
4. Elico, India (0.75 lakhs)
8
Minor Projects on Water & Soil
Analysis
3
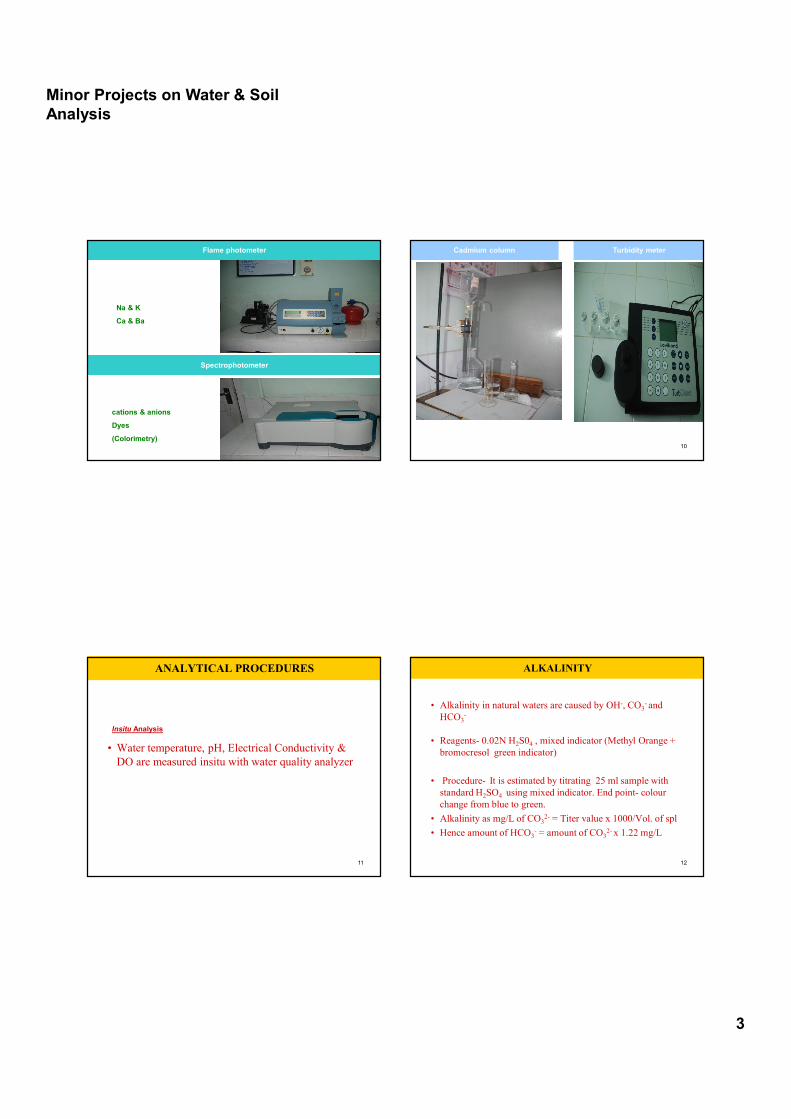
Flame photometer
Na & K
Ca & Ba
Spectrophotometer
cations & anions
Dyes
(Colorimetry)
Flame photometer Turbidity meterCadmium column
10
ANALYTICAL PROCEDURES
• Water temperature, pH, Electrical Conductivity &
DO are measured insitu with water quality analyzer
Insitu Analysis
11
ALKALINITY
• Alkalinity in natural waters are caused by OH-, CO3- and
HCO3-
• Reagents- 0.02N H2S04 , mixed indicator (Methyl Orange +
bromocresol green indicator)
• Procedure- It is estimated by titrating 25 ml sample with
standard H2SO4 using mixed indicator. End point- colour
change from blue to green.
• Alkalinity as mg/L of CO32- = Titer value x 1000/Vol. of spl
• Hence amount of HCO3- = amount of CO3
2- x 1.22 mg/L
12
Minor Projects on Water & Soil
Analysis
4
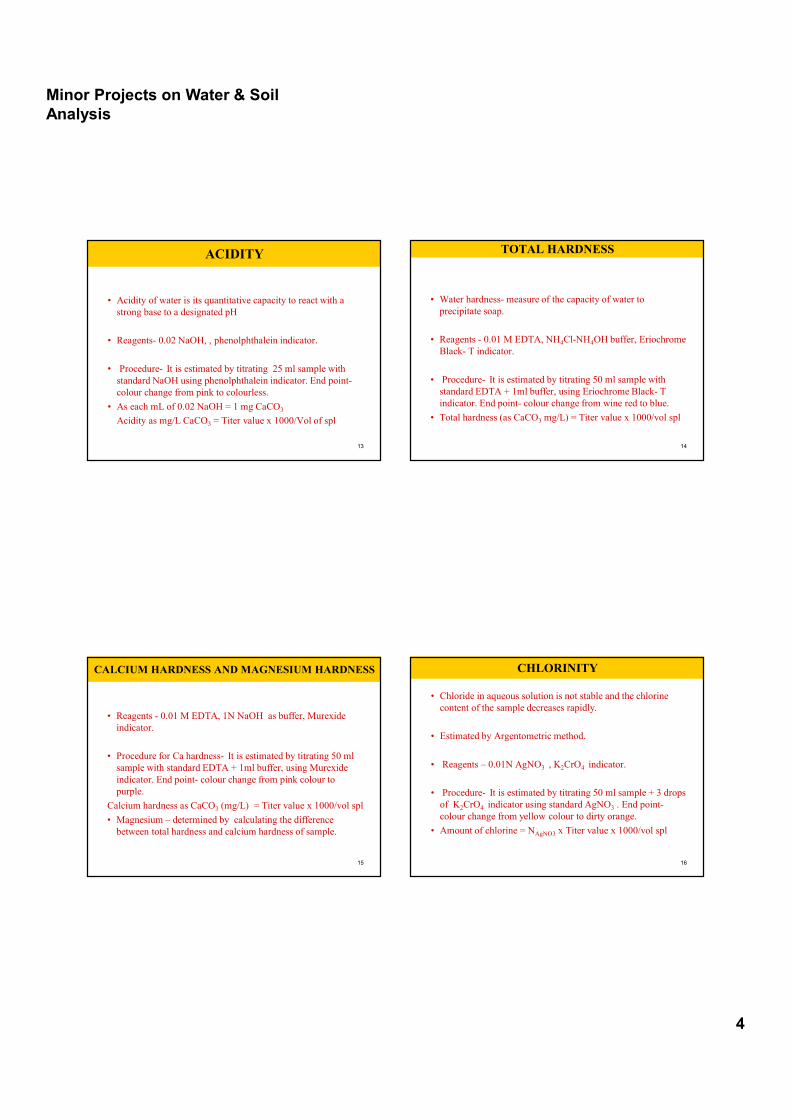
ACIDITY
• Acidity of water is its quantitative capacity to react with a
strong base to a designated pH
• Reagents- 0.02 NaOH, , phenolphthalein indicator.
• Procedure- It is estimated by titrating 25 ml sample with
standard NaOH using phenolphthalein indicator. End point-
colour change from pink to colourless.
• As each mL of 0.02 NaOH = 1 mg CaCO3
Acidity as mg/L CaCO3 = Titer value x 1000/Vol of spl
13
TOTAL HARDNESS
• Water hardness- measure of the capacity of water to
precipitate soap.
• Reagents - 0.01 M EDTA, NH4Cl-NH4OH buffer, Eriochrome
Black- T indicator.
• Procedure- It is estimated by titrating 50 ml sample with
standard EDTA + 1ml buffer, using Eriochrome Black- T
indicator. End point- colour change from wine red to blue.
• Total hardness (as CaCO3 mg/L) = Titer value x 1000/vol spl
14
CALCIUM HARDNESS AND MAGNESIUM HARDNESS
• Reagents - 0.01 M EDTA, 1N NaOH as buffer, Murexide
indicator.
• Procedure for Ca hardness- It is estimated by titrating 50 ml
sample with standard EDTA + 1ml buffer, using Murexide
indicator. End point- colour change from pink colour to
purple.
Calcium hardness as CaCO3 (mg/L) = Titer value x 1000/vol spl
• Magnesium – determined by calculating the difference
between total hardness and calcium hardness of sample.
15
CHLORINITY
• Chloride in aqueous solution is not stable and the chlorine
content of the sample decreases rapidly.
• Estimated by Argentometric method.
• Reagents – 0.01N AgNO3 , K2CrO4 indicator.
• Procedure- It is estimated by titrating 50 ml sample + 3 drops
of K2CrO4 indicator using standard AgNO3 . End point-
colour change from yellow colour to dirty orange.
• Amount of chlorine = NAgNO3 x Titer value x 1000/vol spl
16
Minor Projects on Water & Soil
Analysis
5
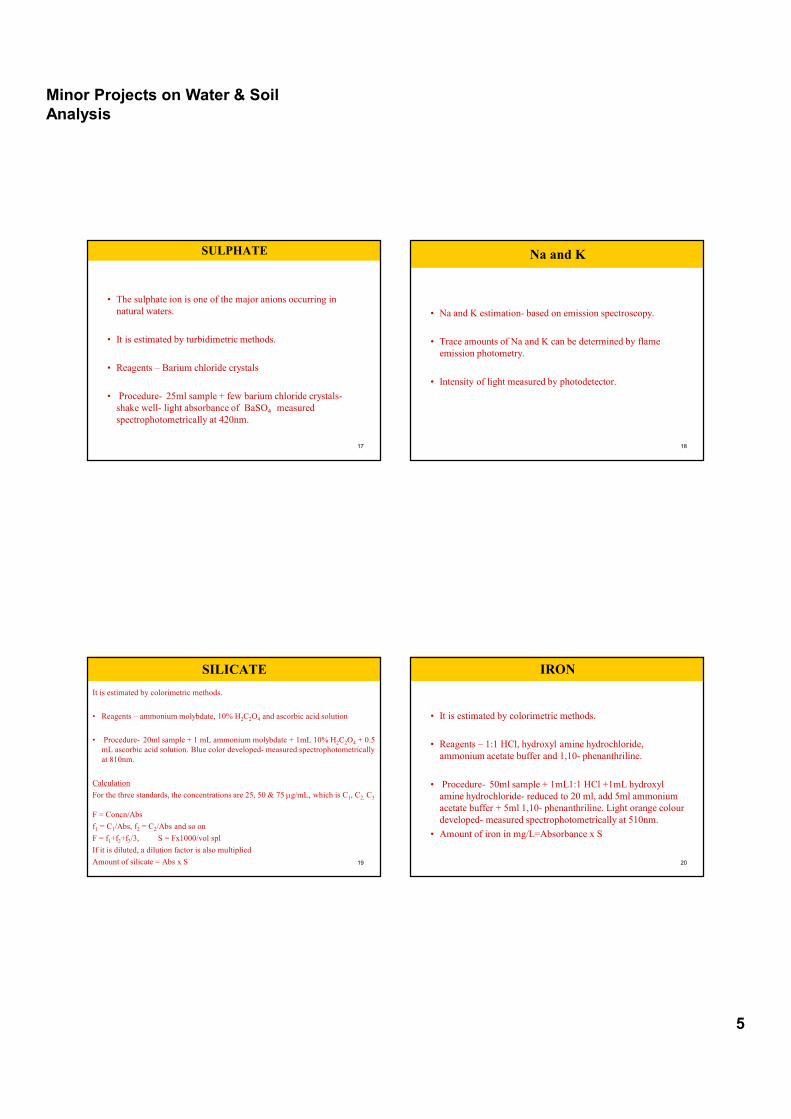
SULPHATE
• The sulphate ion is one of the major anions occurring in
natural waters.
• It is estimated by turbidimetric methods.
• Reagents – Barium chloride crystals
• Procedure- 25ml sample + few barium chloride crystals-
shake well- light absorbance of BaSO4 measured
spectrophotometrically at 420nm.
17
Na and K
• Na and K estimation- based on emission spectroscopy.
• Trace amounts of Na and K can be determined by flame
emission photometry.
• Intensity of light measured by photodetector.
18
SILICATE
It is estimated by colorimetric methods.
• Reagents – ammonium molybdate, 10% H2C2O4 and ascorbic acid solution
• Procedure- 20ml sample + 1 mL ammonium molybdate + 1mL 10% H2C2O4 + 0.5
mL ascorbic acid solution. Blue color developed- measured spectrophotometrically
at 810nm.
Calculation
For the three standards, the concentrations are 25, 50 & 75 µg/mL, which is C1, C2, C3
F = Concn/Abs
f1 = C1/Abs, f2 = C2/Abs and so on
F = f1+f2+f3/3, S = Fx1000/vol spl
If it is diluted, a dilution factor is also multiplied
Amount of silicate = Abs x S 19
IRON
• It is estimated by colorimetric methods.
• Reagents – 1:1 HCl, hydroxyl amine hydrochloride,
ammonium acetate buffer and 1,10- phenanthriline.
• Procedure- 50ml sample + 1mL1:1 HCl +1mL hydroxyl
amine hydrochloride- reduced to 20 ml, add 5ml ammonium
acetate buffer + 5ml 1,10- phenanthriline. Light orange colour
developed- measured spectrophotometrically at 510nm.
• Amount of iron in mg/L=Absorbance x S
20
Minor Projects on Water & Soil
Analysis
6
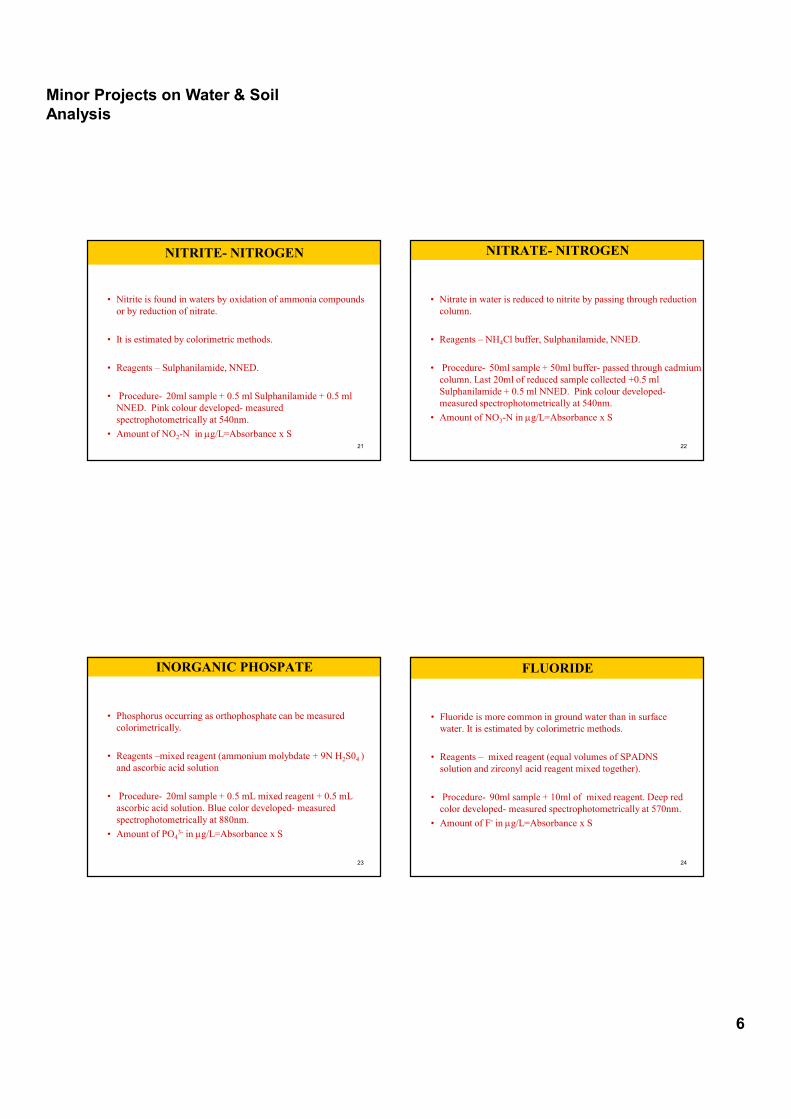
NITRITE- NITROGEN
• Nitrite is found in waters by oxidation of ammonia compounds
or by reduction of nitrate.
• It is estimated by colorimetric methods.
• Reagents – Sulphanilamide, NNED.
• Procedure- 20ml sample + 0.5 ml Sulphanilamide + 0.5 ml
NNED. Pink colour developed- measured
spectrophotometrically at 540nm.
• Amount of NO2-N in µg/L=Absorbance x S21
NITRATE- NITROGEN
• Nitrate in water is reduced to nitrite by passing through reduction
column.
• Reagents – NH4Cl buffer, Sulphanilamide, NNED.
• Procedure- 50ml sample + 50ml buffer- passed through cadmium
column. Last 20ml of reduced sample collected +0.5 ml
Sulphanilamide + 0.5 ml NNED. Pink colour developed-
measured spectrophotometrically at 540nm.
• Amount of NO3-N in µg/L=Absorbance x S
22
INORGANIC PHOSPATE
• Phosphorus occurring as orthophosphate can be measured
colorimetrically.
• Reagents –mixed reagent (ammonium molybdate + 9N H2S04 )
and ascorbic acid solution
• Procedure- 20ml sample + 0.5 mL mixed reagent + 0.5 mL
ascorbic acid solution. Blue color developed- measured
spectrophotometrically at 880nm.
• Amount of PO43- in µg/L=Absorbance x S
23
FLUORIDE
• Fluoride is more common in ground water than in surface
water. It is estimated by colorimetric methods.
• Reagents – mixed reagent (equal volumes of SPADNS
solution and zirconyl acid reagent mixed together).
• Procedure- 90ml sample + 10ml of mixed reagent. Deep red
color developed- measured spectrophotometrically at 570nm.
• Amount of F- in µg/L=Absorbance x S
24
Minor Projects on Water & Soil
Analysis
7
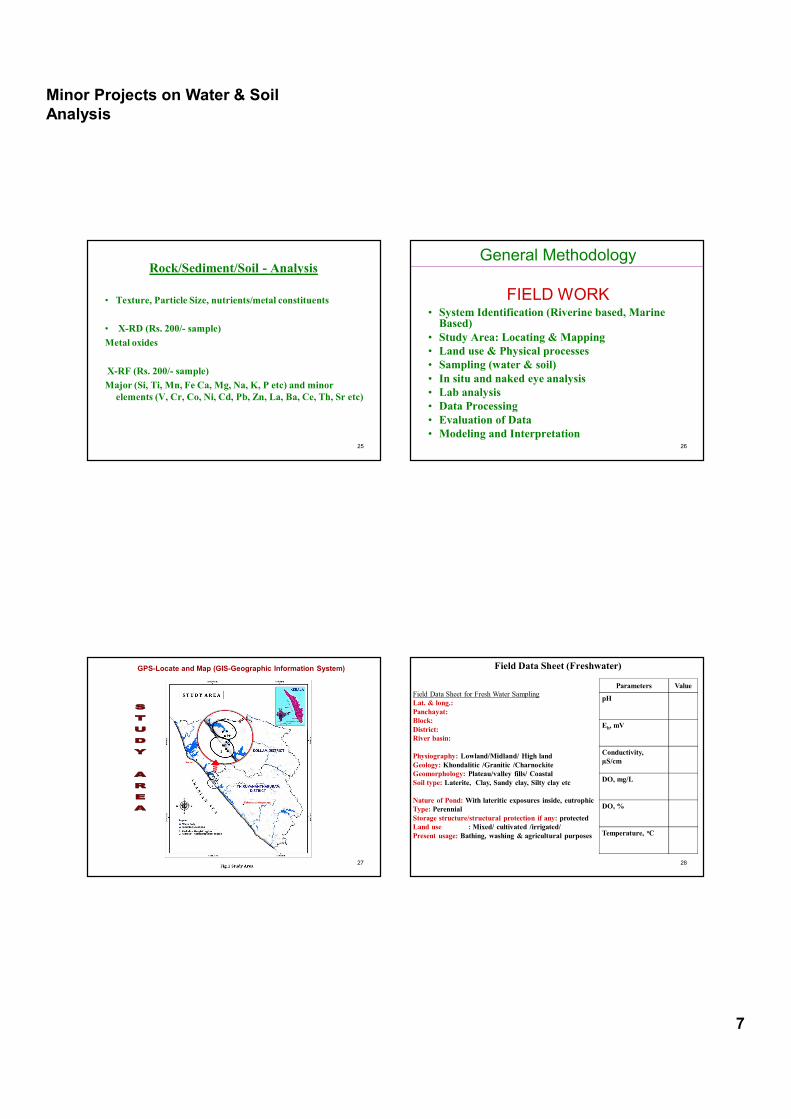
Rock/Sediment/Soil - Analysis
• Texture, Particle Size, nutrients/metal constituents
• X-RD (Rs. 200/- sample)
Metal oxides
X-RF (Rs. 200/- sample)
Major (Si, Ti, Mn, Fe Ca, Mg, Na, K, P etc) and minor
elements (V, Cr, Co, Ni, Cd, Pb, Zn, La, Ba, Ce, Th, Sr etc)
25
General Methodology
FIELD WORK• System Identification (Riverine based, Marine
Based)
• Study Area: Locating & Mapping
• Land use & Physical processes
• Sampling (water & soil)
• In situ and naked eye analysis
• Lab analysis
• Data Processing
• Evaluation of Data
• Modeling and Interpretation 26
GPS-Locate and Map (GIS-Geographic Information System)
27
Field Data Sheet (Freshwater)
Field Data Sheet for Fresh Water Sampling
Lat. & long.:
Panchayat:
Block:
District:
River basin:
Physiography: Lowland/Midland/ High land
Geology: Khondalitic /Granitic /Charnockite
Geomorphology: Plateau/valley fills/ Coastal
Soil type: Laterite, Clay, Sandy clay, Silty clay etc
Nature of Pond: With lateritic exposures inside, eutrophic
Type: Perennial
Storage structure/structural protection if any: protected
Land use : Mixed/ cultivated /irrigated/
Present usage: Bathing, washing & agricultural purposes
Parameters Value
pH
Eh, mV
Conductivity,
µS/cm
DO, mg/L
DO, %
Temperature, oC
28
Minor Projects on Water & Soil
Analysis
8
Field Data Sheet (Marine)
29
Land Use & Physical Processes
Visual Observation:
Type of agricultural activities, industries
(local/small scale/etc) Presence of
Road/bridges/etc, In general, manmade
activities
Natural observations
Heavy rain, Strong wind, Geomorphology,
Geology
30
Sampling
Niskin Water Sampler (Deep Water), Bottom Sampler (just 2/3 m), Simple pot (surface water sampling-Bucket)
Floating particulates should be removed during sampling
Labelling most important (including date and time of collection)
Normally, 2 L of water sample is required for Major ions and nutrient analysis ( 1 L each)
1 L for Heavy metals (fixed using conc. HNO3, pH < 2.0)
1 L for major ions and nutrients
But for DO and BOD, separate bottles (250 mL and 300 mL, respectively)
Preserving Temp. for all samples: < 5.0oC
DO – fix using Winkler A & B
31
Research Project Type: 1
Focus on River basin
Eg: Neyyar Basin
System: five Ponds, Five Well water, Five river water samples
(Total 15 sampling points)
GPS Lat (N) and Long (E)
For each sampling point cover the land use
Water & Soil Samples – Initial observation
32
Minor Projects on Water & Soil
Analysis
9
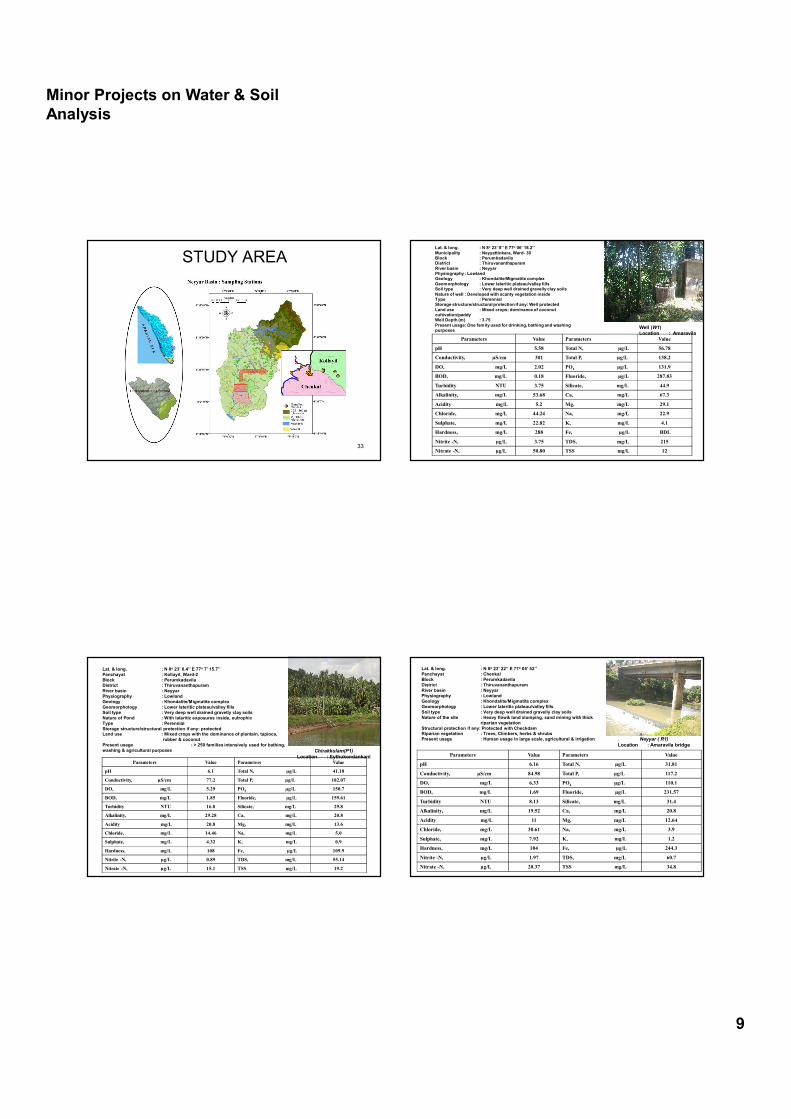
STUDY AREA
33
Well (W1)
Location : Amaravila
Lat. & long. : N 8o 23’ 8’’ E 77o 06’ 18.2’’
Municipality : Neyyattinkara, Ward- 30
Block : Perumkadavila
District : Thiruvananthapuram
River basin : Neyyar
Physiography : Lowland
Geology : Khondalite/Migmatite complex
Geomorphology : Lower lateritic plateau/valley fills
Soil type : Very deep well drained gravelly clay soils
Nature of well : Developed with scanty vegetation inside
Type : Perennial
Storage structure/structural protection if any: Well protected
Land use : Mixed crops; dominance of coconut
cultivation/paddy
Well Depth (m) : 3.75
Present usage: One family used for drinking, bathing and washing
purposes
Parameters Value Parameters Value
pH 5.58 Total N, µg/L 56.78
Conductivity, µS/cm 301 Total P, µg/L 138.2
DO, mg/L 2.02 PO4 µg/L 131.9
BOD, mg/L 0.18 Fluoride, µg/L 287.83
Turbidity NTU 3.75 Silicate, mg/L 44.9
Alkalinity, mg/L 53.68 Ca, mg/L 67.3
Acidity mg/L 5.2 Mg, mg/L 29.1
Chloride, mg/L 44.24 Na, mg/L 22.9
Sulphate, mg/L 22.82 K, mg/L 4.1
Hardness, mg/L 288 Fe, µg/L BDL
Nitrite -N, µg/L 3.75 TDS, mg/L 215
Nitrate -N, µg/L 50.80 TSS mg/L 12
Chirakkulam(P1)
Location : Eythukondankani
Lat. & long. : N 8o 23’ 0.4’’ E 77o 7’ 15.7’’
Panchayat : Kollayil, Ward-2
Block : Perumkadavila
District : Thiruvananthapuram
River basin : Neyyar
Physiography : Lowland
Geology : Khondalite/Migmatite complex
Geomorphology : Lower lateritic plateau/valley fills
Soil type : Very deep well drained gravelly clay soils
Nature of Pond : With lateritic exposures inside, eutrophic
Type : Perennial
Storage structure/structural protection if any: protected
Land use : Mixed crops with the dominance of plantain, tapioca,
rubber & coconut
Present usage : > 250 families intensively used for bathing,
washing & agricultural purposes
Parameters Value Parameters Value
pH 6.1 Total N, µg/L 41.18
Conductivity, µS/cm 77.2 Total P, µg/L 182.07
DO, mg/L 5.29 PO4 µg/L 150.7
BOD, mg/L 1.85 Fluoride, µg/L 159.61
Turbidity NTU 16.8 Silicate, mg/L 29.8
Alkalinity, mg/L 29.28 Ca, mg/L 20.8
Acidity mg/L 20.8 Mg, mg/L 13.6
Chloride, mg/L 14.46 Na, mg/L 5.0
Sulphate, mg/L 4.32 K, mg/L 0.9
Hardness, mg/L 108 Fe, µg/L 109.9
Nitrite -N, µg/L 0.89 TDS, mg/L 55.14
Nitrate -N, µg/L 15.1 TSS mg/L 19.2
Neyyar ( R1)
Location : Amaravila bridge
Lat. & long. : N 8o 23’ 22’’ E 77o 05’ 52’’
Panchayat : Chenkal
Block : Perumkadavila
District : Thiruvananthapuram
River basin : Neyyar
Physiography : Lowland
Geology : Khondalite/Migmatite complex
Geomorphology : Lower lateritic plateau/valley fills
Soil type : Very deep well drained gravelly clay soils
Nature of the site : Heavy flow& land slumping, sand mining with thick
riparian vegetation
Structural protection if any: Protected with Checkdam
Riparian vegetation : Trees, Climbers, herbs & shrubs
Present usage : Human usage in large scale, agricultural & irrigation
Parameters Value Parameters Value
pH 6.16 Total N, µg/L 31.81
Conductivity, µS/cm 84.98 Total P, µg/L 117.2
DO, mg/L 6.33 PO4 µg/L 110.1
BOD, mg/L 1.69 Fluoride, µg/L 231.57
Turbidity NTU 8.13 Silicate, mg/L 31.4
Alkalinity, mg/L 19.52 Ca, mg/L 20.8
Acidity mg/L 11 Mg, mg/L 12.64
Chloride, mg/L 30.61 Na, mg/L 3.9
Sulphate, mg/L 7.92 K, mg/L 1.2
Hardness, mg/L 104 Fe, µg/L 244.3
Nitrite -N, µg/L 1.97 TDS, mg/L 60.7
Nitrate -N, µg/L 20.37 TSS mg/L 34.8
Minor Projects on Water & Soil
Analysis
10
Research Project Type: 2
Focus on Springs
37
Study Area
The study area consists of three districts - Pathanamthitta, Kottayam and Idukki, Covers an aerial extend of nearly 9995 km2
38
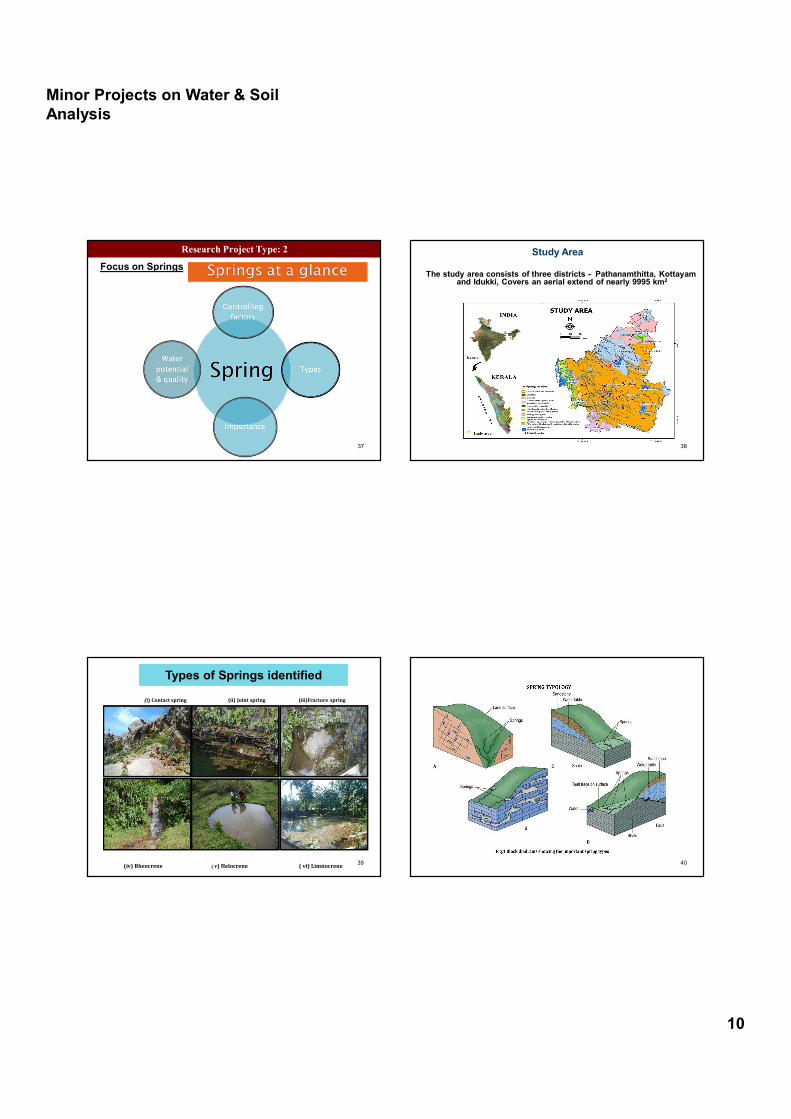
Types of Springs identified
(i) Contact spring (ii) Joint spring (iii)Fracture spring
(iv) Rheocrene ( v) Helocrene ( vi) Limnocrene39 40
Minor Projects on Water & Soil
Analysis
11
Spring classes identified:
• Contact spring: Water discharges where the contact zone between the strata intersects the land surface
• Joint Spring: Occurs along joints, fractures or faults where they intersect the land surface
• Fracture spring: The fracture zone between two opposing rock strata provides a flow path for groundwater to discharge
• Spring typology:
• Rheocrene: Spring’s discharges form a flowing stream
• Helocrene: Small springs (seepages) form a spring-fed marsh
• Limnocrene: Spring dischrges through the bed of a pond or lake
41
Direct method Pumping
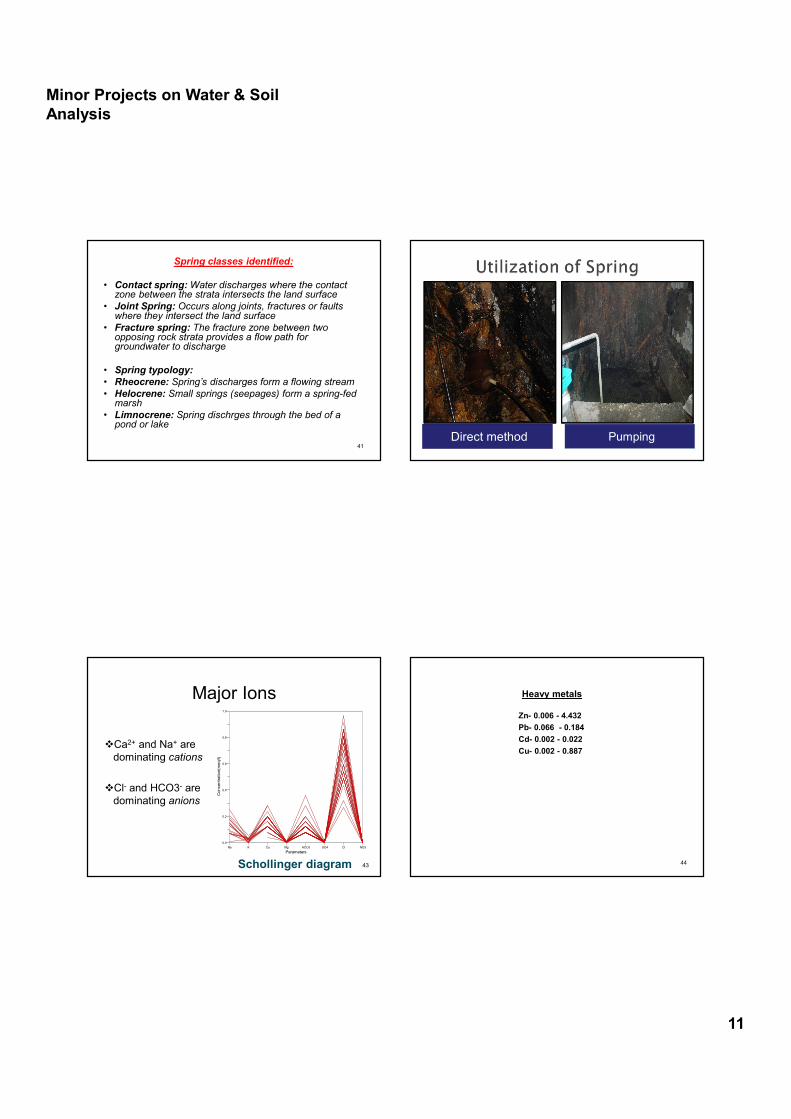
Major Ions
�Ca2+ and Na+ are
dominating cations
�Cl- and HCO3- are
dominating anions
Na K Ca Mg HCO3 SO4 Cl NO3
Parameters
0.0
0.2
0.4
0.6
0.8
1.0
Con
ce
ntr
atio
n(m
eq/l)
Schollinger diagram 43
Heavy metals
Zn- 0.006 - 4.432
Pb- 0.066 - 0.184
Cd- 0.002 - 0.022
Cu- 0.002 - 0.887
44
Minor Projects on Water & Soil
Analysis
12
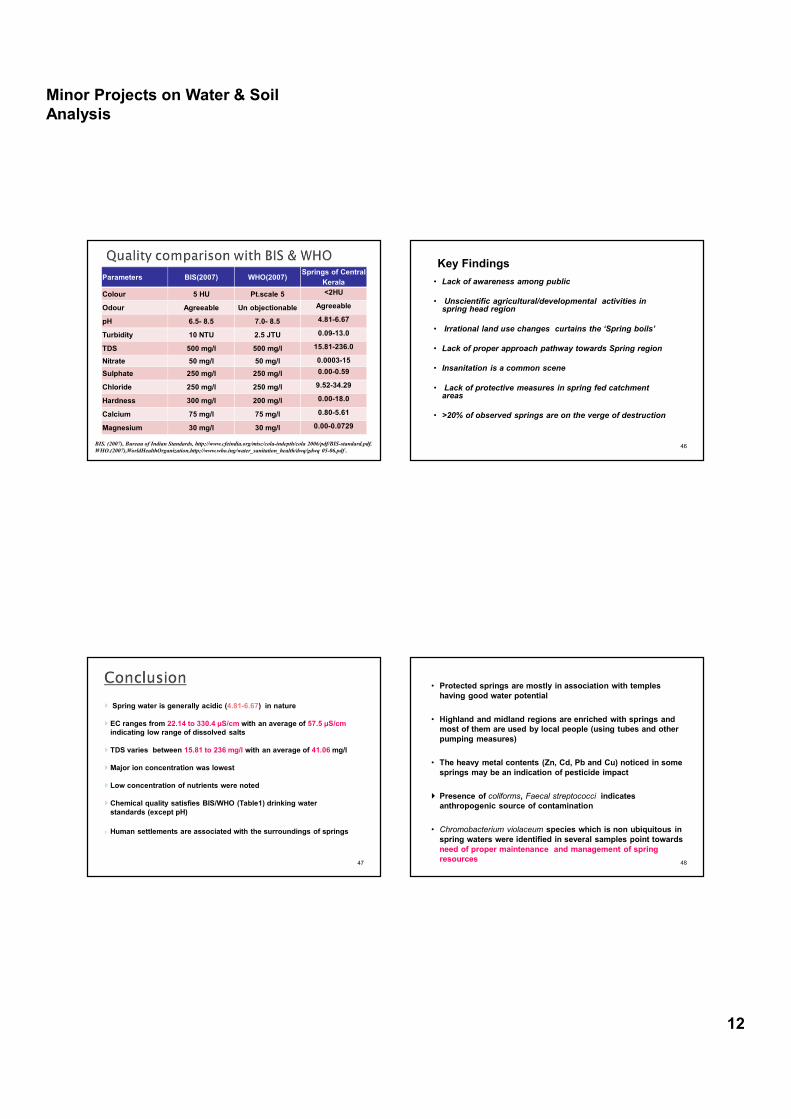
Parameters BIS(2007) WHO(2007)Springs of Central
Kerala
Colour 5 HU Pt.scale 5 <2HU
Odour Agreeable Un objectionable Agreeable
pH 6.5- 8.5 7.0- 8.5 4.81-6.67
Turbidity 10 NTU 2.5 JTU 0.09-13.0
TDS 500 mg/l 500 mg/l 15.81-236.0
Nitrate 50 mg/l 50 mg/l 0.0003-15
Sulphate 250 mg/l 250 mg/l 0.00-0.59
Chloride 250 mg/l 250 mg/l 9.52-34.29
Hardness 300 mg/l 200 mg/l 0.00-18.0
Calcium 75 mg/l 75 mg/l 0.80-5.61
Magnesium 30 mg/l 30 mg/l 0.00-0.0729
BIS. (2007), Bureau of Indian Standards, http;//www.cfeindia.org/misc/cola-indepth/cola 2006/pdf/BIS-standard.pdf.
WHO.(2007),WorldHealthOrganization,http;//www.who.ing/water_sanitation_health/dwq/gdwq 05-06.pdf .
Key Findings
• Lack of awareness among public
• Unscientific agricultural/developmental activities in spring head region
• Irrational land use changes curtains the ‘Spring boils’
• Lack of proper approach pathway towards Spring region
• Insanitation is a common scene
• Lack of protective measures in spring fed catchment areas
• >20% of observed springs are on the verge of destruction
46
� Spring water is generally acidic (4.81-6.67) in nature
� EC ranges from 22.14 to 330.4 µS/cm with an average of 57.5 µS/cm
indicating low range of dissolved salts
� TDS varies between 15.81 to 236 mg/l with an average of 41.06 mg/l
� Major ion concentration was lowest
� Low concentration of nutrients were noted
� Chemical quality satisfies BIS/WHO (Table1) drinking water
standards (except pH)
� Human settlements are associated with the surroundings of springs
47
• Protected springs are mostly in association with temples
having good water potential
• Highland and midland regions are enriched with springs and
most of them are used by local people (using tubes and other
pumping measures)
• The heavy metal contents (Zn, Cd, Pb and Cu) noticed in some
springs may be an indication of pesticide impact
� Presence of coliforms, Faecal streptococci indicates
anthropogenic source of contamination
• Chromobacterium violaceum species which is non ubiquitous in
spring waters were identified in several samples point towards
need of proper maintenance and management of spring
resources48
Minor Projects on Water & Soil
Analysis
13
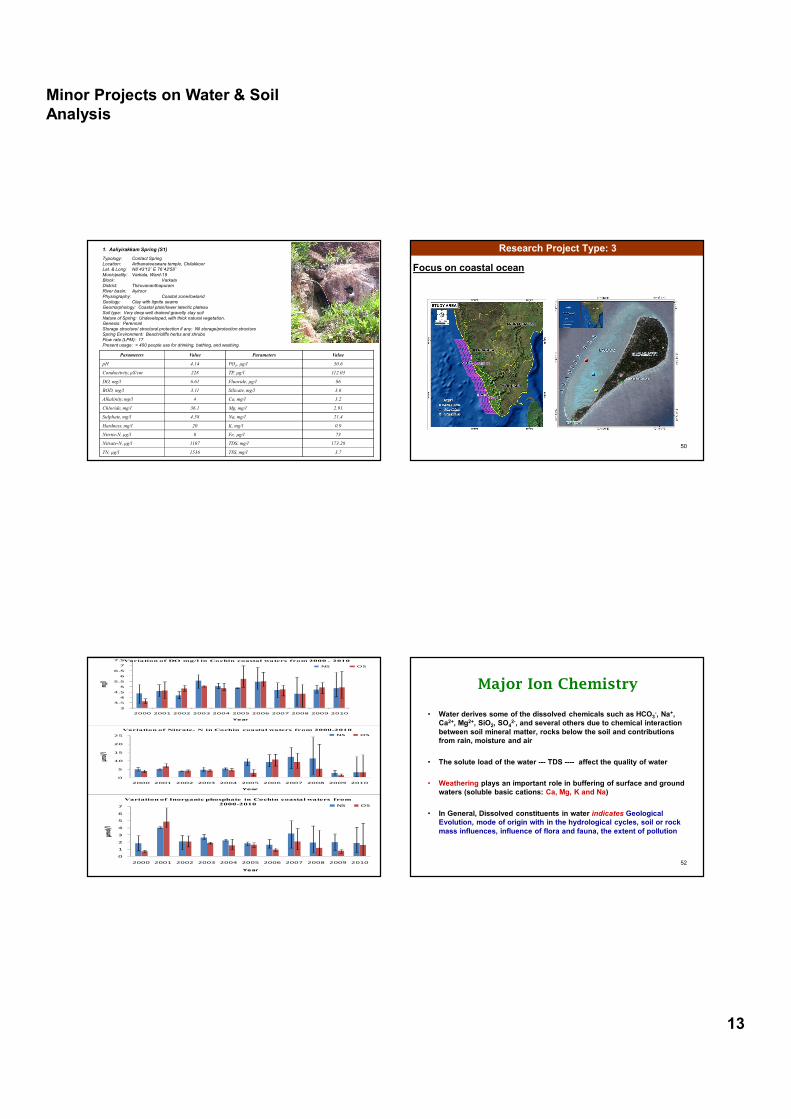
1. Aaliyirakkam Spring (S1)
Typology: Contact Spring
Location: Arthanareeswara temple, Chilakkoor
Lat. & Long: N8˚43'12 ̋E 76˚42'58˝
Municipality: Varkala, Ward-19
Block: Varkala
District: Thiruvananthapuram
River basin: Ayiroor
Physiography: Coastal zone/lowland
Geology: Clay with lignite seams
Geomorphology: Coastal plain/lower lateritic plateau
Soil type: Very deep well drained gravelly clay soil
Nature of Spring: Undeveloped, with thick natural vegetation.Genesis: Perennial
Storage structure/ structural protection if any: Nil storage/protection structure
Spring Environment: Beach/cliffs herbs and shrubs
Flow rate (LPM): 17
Present usage: > 400 people use for drinking, bathing, and washing.
Parameters Value Parameters Value
pH 4.14 PO4, µg/l 50.6
Conductivity, µS/cm 228 TP, µg/l 112.03
DO, mg/l 6.61 Fluoride, µg/l 86
BOD, mg/l 3.11 Silicate, mg/l 3.6
Alkalinity, mg/l 4 Ca, mg/l 3.2
Chloride, mg/l 36.1 Mg, mg/l 2.91
Sulphate, mg/l 4.58 Na, mg/l 21.4
Hardness, mg/l 20 K, mg/l 0.9
Nitrite-N, µg/l 0 Fe, µg/l 73
Nitrate-N, µg/l 1107 TDS, mg/l 173.28
TN, µg/l 1536 TSS, mg/l 3.7
Focus on coastal ocean
Research Project Type: 3
50
3
3.5
4
4.5
5
5.5
6
6.5
7
7.5
2000 2001 2002 2003 2004 2005 2006 2007 2008 2009 2010
mg/l
Year
Variation of DO mg/l in Cochin coastal waters from 2000 - 2010
NS OS
0
5
10
15
20
25
2000 2001 2002 2003 2004 2005 2006 2007 2008 2009 2010
μmol/
l
Year
Variation of Nitrate- N in Cochin coastal waters from 2000-2010
NS OS
0
1
2
3
4
5
6
7
2000 2001 2002 2003 2004 2005 2006 2007 2008 2009 2010
µmol/
l
Year
Variation of Inorganic phosphate in Cochin coastal waters from
2000-2010NS OS
Major Ion Chemistry
• Water derives some of the dissolved chemicals such as HCO3-, Na+,
Ca2+, Mg2+, SiO2, SO42-, and several others due to chemical interaction
between soil mineral matter, rocks below the soil and contributions
from rain, moisture and air
• The solute load of the water --- TDS ---- affect the quality of water
• Weathering plays an important role in buffering of surface and ground
waters (soluble basic cations: Ca, Mg, K and Na)
• In General, Dissolved constituents in water indicates Geological
Evolution, mode of origin with in the hydrological cycles, soil or rock
mass influences, influence of flora and fauna, the extent of pollution
52
Minor Projects on Water & Soil
Analysis
14
• The Box Plot
• Stiff’s Diagram
• Piper (Trilinear) Diagram
• Durov Diagram
Softwares
AquaChem
Interpretation of Physic-chemical Data
53
The BOX Plot
• Simple visual method to interpret data
• The box plot uses the median, the approximate quartiles, and the
lowest and highest data points to convey the level, spread, and
symmetry of a distribution of data values
• The box plot is more than a substitute for a table
• It is a tool that can improve our reasoning about quantitative
information
54
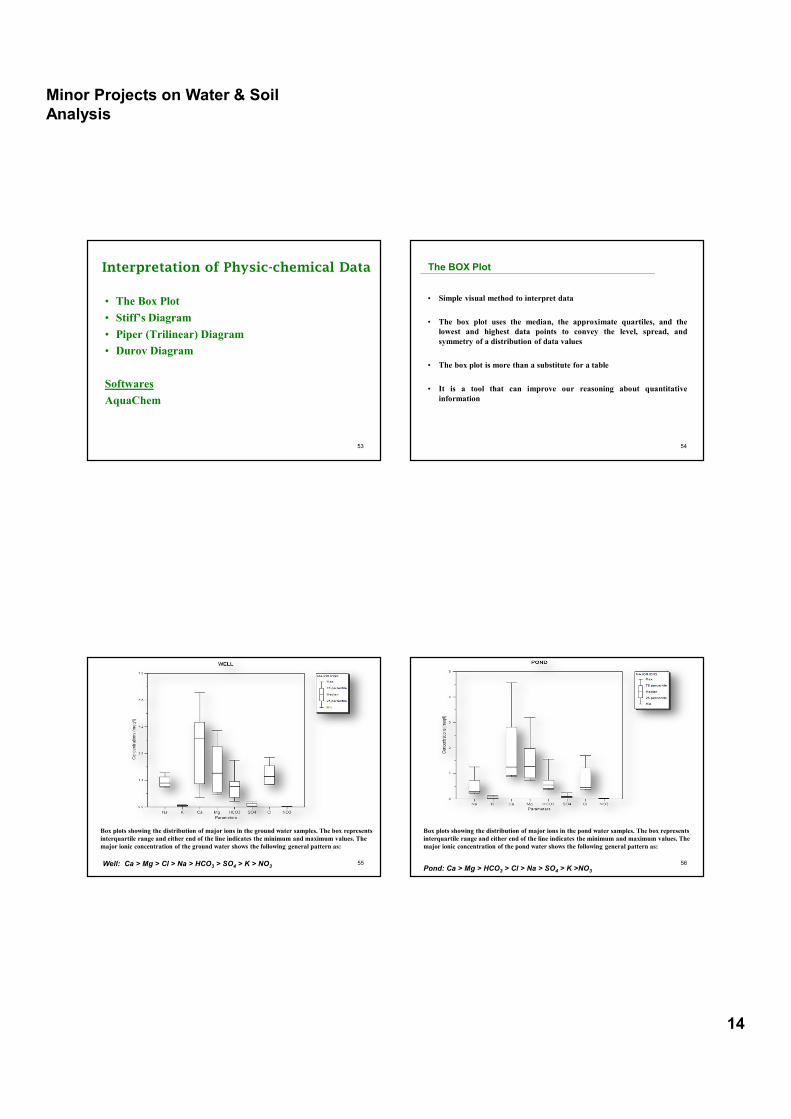
Well: Ca > Mg > Cl > Na > HCO3 > SO4 > K > NO3
Box plots showing the distribution of major ions in the ground water samples. The box represents
interquartile range and either end of the line indicates the minimum and maximum values. The
major ionic concentration of the ground water shows the following general pattern as:
55Pond: Ca > Mg > HCO3 > Cl > Na > SO4 > K >NO3
Box plots showing the distribution of major ions in the pond water samples. The box represents
interquartile range and either end of the line indicates the minimum and maximum values. The
major ionic concentration of the pond water shows the following general pattern as:
56
Minor Projects on Water & Soil
Analysis
15
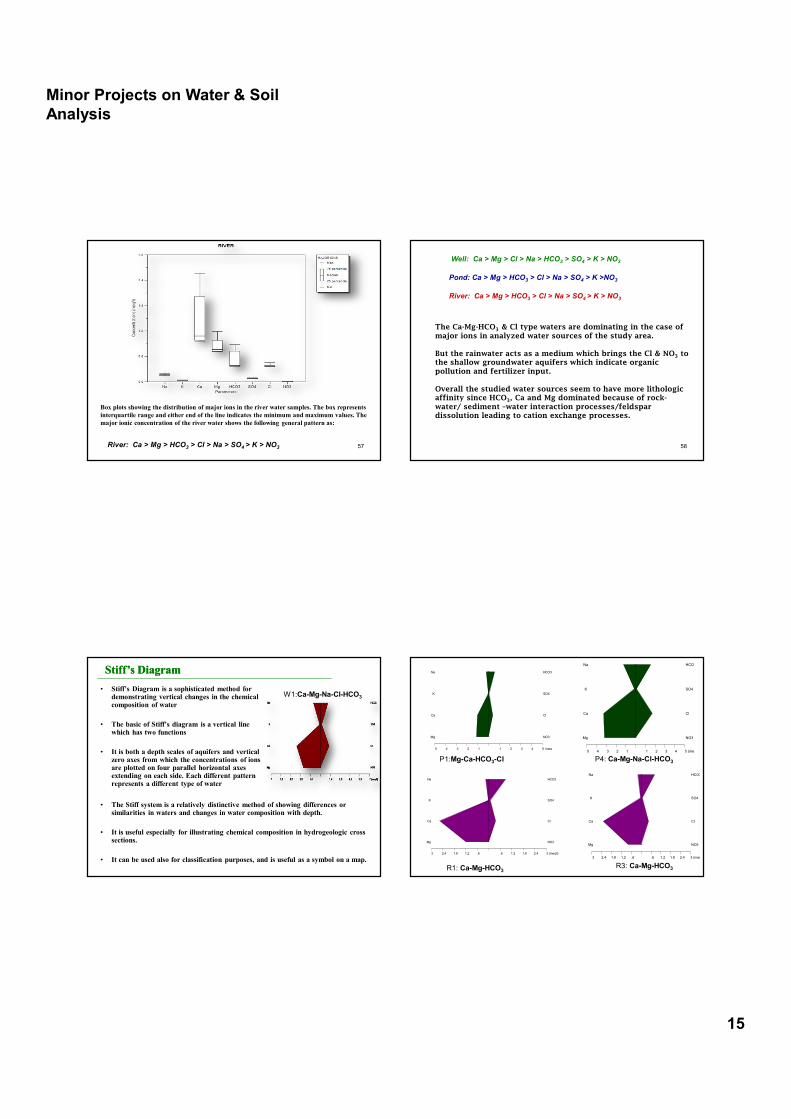
Box plots showing the distribution of major ions in the river water samples. The box represents
interquartile range and either end of the line indicates the minimum and maximum values. The
major ionic concentration of the river water shows the following general pattern as:
River: Ca > Mg > HCO3 > Cl > Na > SO4 > K > NO3 57
Well: Ca > Mg > Cl > Na > HCO3 > SO4 > K > NO3
River: Ca > Mg > HCO3 > Cl > Na > SO4 > K > NO3
Pond: Ca > Mg > HCO3 > Cl > Na > SO4 > K >NO3
The Ca-Mg-HCO3 & Cl type waters are dominating in the case of major ions in analyzed water sources of the study area.
But the rainwater acts as a medium which brings the Cl & NO3 to the shallow groundwater aquifers which indicate organic pollution and fertilizer input.
Overall the studied water sources seem to have more lithologic affinity since HCO3, Ca and Mg dominated because of rock-water/ sediment –water interaction processes/feldspar dissolution leading to cation exchange processes.
58
• Stiff’s Diagram is a sophisticated method for demonstrating vertical changes in the chemical composition of water
• The basic of Stiff’s diagram is a vertical line which has two functions
• It is both a depth scales of aquifers and vertical zero axes from which the concentrations of ions are plotted on four parallel horizontal axes extending on each side. Each different pattern represents a different type of water
Stiff’s Diagram
W1:Ca-Mg-Na-Cl-HCO3
• The Stiff system is a relatively distinctive method of showing differences or similarities in waters and changes in water composition with depth.
• It is useful especially for illustrating chemical composition in hydrogeologic cross sections.
• It can be used also for classification purposes, and is useful as a symbol on a map.
Stiff’s Diagram
1 1 2 2 3 3 4 4 5 (meq/l) 5
Na HCO3
K SO4
Ca Cl
Mg NO3
1 1 2 2 3 3 4 4 5 (meq/l) 5
Na HCO3
K SO4
Ca Cl
Mg NO3
P1:Mg-Ca-HCO3-Cl P4: Ca-Mg-Na-Cl-HCO3
.6 .6 1.2 1.2 1.8 1.8 2.4 2.4 3 (meq/l) 3
Na HCO3
K SO4
Ca Cl
Mg NO3
R3: Ca-Mg-HCO3
.6 .6 1.2 1.2 1.8 1.8 2.4 2.4 3 (meq/l) 3
Na HCO3
K SO4
Ca Cl
Mg NO3
R1: Ca-Mg-HCO3
Minor Projects on Water & Soil
Analysis
16
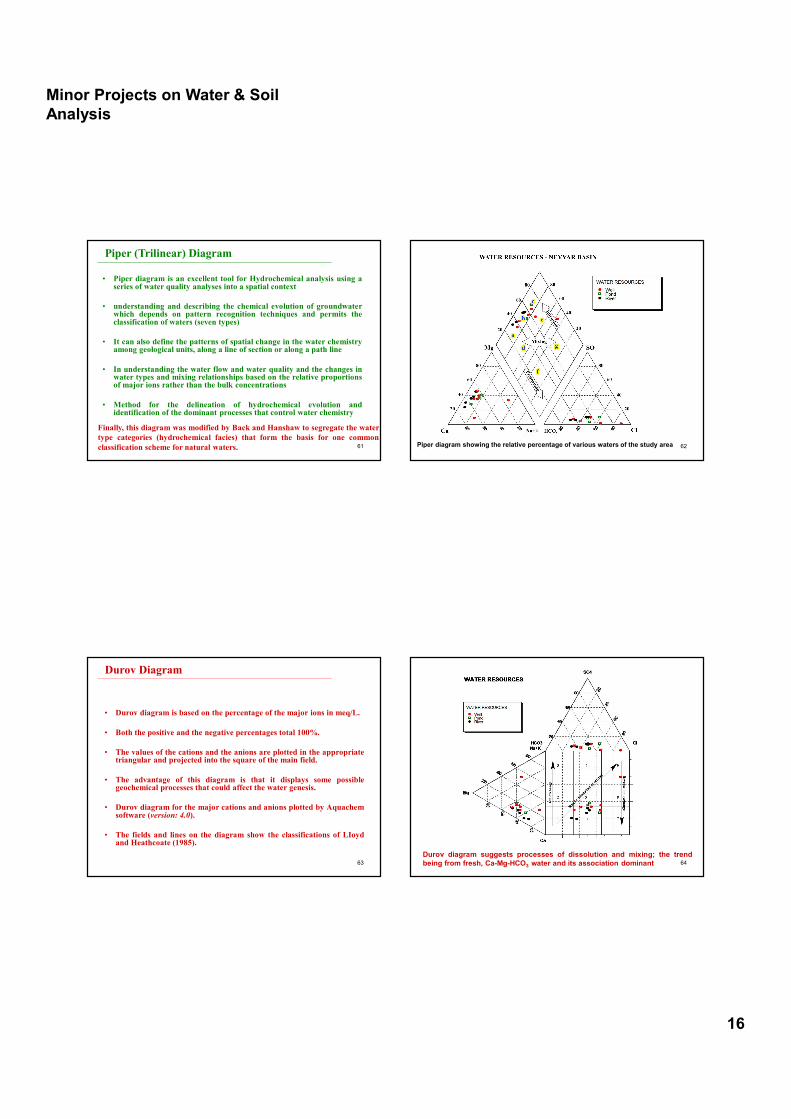
• Piper diagram is an excellent tool for Hydrochemical analysis using aseries of water quality analyses into a spatial context
• understanding and describing the chemical evolution of groundwaterwhich depends on pattern recognition techniques and permits theclassification of waters (seven types)
• It can also define the patterns of spatial change in the water chemistryamong geological units, along a line of section or along a path line
• In understanding the water flow and water quality and the changes inwater types and mixing relationships based on the relative proportionsof major ions rather than the bulk concentrations
• Method for the delineation of hydrochemical evolution andidentification of the dominant processes that control water chemistry
Piper (Trilinear) Diagram
Finally, this diagram was modified by Back and Hanshaw to segregate the water
type categories (hydrochemical facies) that form the basis for one common
classification scheme for natural waters. 61 Piper diagram showing the relative percentage of various waters of the study area 62
• Durov diagram is based on the percentage of the major ions in meq/L.
• Both the positive and the negative percentages total 100%.
• The values of the cations and the anions are plotted in the appropriatetriangular and projected into the square of the main field.
• The advantage of this diagram is that it displays some possiblegeochemical processes that could affect the water genesis.
• Durov diagram for the major cations and anions plotted by Aquachemsoftware (version: 4.0).
• The fields and lines on the diagram show the classifications of LIoydand Heathcoate (1985).
Durov Diagram
63
Durov diagram suggests processes of dissolution and mixing; the trend
being from fresh, Ca-Mg-HCO3 water and its association dominant 64
Minor Projects on Water & Soil
Analysis
17
1. Major ion chemistry in selected well water resources
2. Nutrient flux in Pamba River at Pamba (your place), Kerala, India
3. Appraisal of physico-chemical characteristics of various water resources from Karamana river surroundings at Vilappilsala (at your place), Trivandrum
4. Hydrological studies on the coastal spring water along the southwest coast of India in Kollam district of Kerala.
5. Hydrography of Temple Ponds in Chempazhanthy rural area (at your place) of Trivandrum district, Southern Kerala
6. Modeling of groundwater chemistry of Palakkad urban area (at your place) using statistical tools
7. Physico-chemical aspects of well water resources in coastal areas of Neendakara, Kollam district
PROPOSED TITLES
65
Conti<<.
1. geochemical characterization of recently deposited sediments
of ashtamudi estuary, kollam, southwestern india
• hydrochemical framework of killi ar, a major tributary of
karamana river, thiruvananthapuram, southern kerala
• major ion chemistry and compositional structure of selected
groundwater sources of karamana river basin, southern kerala
• hydrochemistry of peppara and aruvikkara reservoirs with
special reference to drinking water quality
• the dynamics of phosphorus in an urban-fringe estuarine
system:an example from cochin, sw coast of india
• “mercury geochemistry of recent sedimentary environs of the
river dominated mixing zone in a tropical coastal estuarine
system”, sw india
66
Conti<<.
• hydrochemical framework and the reaction of subsurface coastal
aquifers to climate and land use changes in kerala: modelling of
groundwater refreshening patterns under natural recharge conditions
•
• investigation of groundwater quality for domestic and irrigation
• purposes around palakkad and environs, northern kerala
•
• transfer of nutrients and heavymetals from kallada basin, south-west
coast of india: a geochemical perspective
•
• hydrochemical investigation of water from southern kerala wells and
springs
•
• geochemical evolution of groundwater in the quaternary aquifers of
kerala67
CONTACT DETAILS
Dr. K. ANOOP KRISHNAN
Scientist
Chemical Sciences Division, Centre for Earth Science Studies (CESS)
P.B. No. 7250, Akkulam, Trivandrum-31, Kerala, India
Ph: +91-(0)471 2511690 (off), +91-(0)471 2442280 (fax), +91-(0)9447402468 (cell)
E-mail: [email protected], [email protected], [email protected]
URL: http://cess.res.in/people/dr-anoop-krishnan-k/profile.html
68
Minor Projects on Water & Soil
Analysis
18
ACKNOWLEDGEMENTS
• Dr. T.S. Anirudhan, Prof. & Head, DoC, UoK
• Dr. I.G. Shibi, Associate Professor & General Secretary ACT,
DoC, SN College, Chempazhanthy
• Dr. D.M. Manohar, Assistant Professor & Secretary ACT, DoC
FMN College, Kollam
• Academy of Chemistry Teachers (ACT)
• Dr. N.P. Kurian, Director, CESS
• Research Team Members, CSD, CESS
• COMAPS, ICMAM, MoES, Govt. of India
• KSCSTE, Govt. of Kerala
69