Embed Size (px)
Citation preview
Worel, Mulvaney & Andersen
Minnesota Road Research Project
1999 MnROAD SuperPave Tracking (S.P. 8816-40)
Low Volume Road Cells 33-35
Manuscript Word Count 5,490
24 Tables and 6 Figures
Benjamin Worel, P.E.
[email protected](651) 779-5522 Fax (651) 779-5616
Tim Andersen, P.E. [email protected]
(651) 779-5609 Fax (651) 779-5616
Ronald Mulvaney, P.E. [email protected](651) 779-5499 Fax (651) 779-5616
Minnesota Department of Transportation Office of Materials and Road Research
1400 Gervais Avenue St. Paul, Minnesota 55109
December 2003
This report represents the results of research conducted by the authors and does not necessarily represent the view or policy of the Minnesota Department of Transportation. This report does not contain a standard or specified technique
Worel, Mulvaney & Andersen
ABSTRACT This paper’s purpose is to provide an update on the pavement condition of MnROAD’s three low volume road (LVR) Superpave test cells constructed in 1999 with different asphalt binders, see table below. These cells were built to field validate the current low temperature performance grading (PG) system currently being used at Mn/DOT and many other agencies around the world. The paper will document the mix designs, laboratory testing, forensics, environmental conditions, and the resulting distresses observed include rutting, transverse cracking, fatigue cracking and how they are affecting pavement performance and ride. TABLE MnROAD 1999 Low Volume Road Superpave Test Cells
Cell Asphalt Binder Used Design (4” HMA / 12” Class-6 base / Clay Subgrade)
33 Unmodified PG 58-28 34 Polymer Modified PG 58-34 35 Polymer Modified PG 58-40
Worel, Mulvaney & Andersen
INTRODUCTION MnROAD Facility The Minnesota Department of Transportation (Mn/DOT) constructed the Minnesota Road Research Project (MnROAD) between 1990 and 1994. MnROAD is located 40 miles northwest of Minneapolis/St.Paul and is an extensive pavement research facility consisting of two separate roadway segments containing 51 distinct test cells. Each MnROAD test cell is approximately 500 feet long. Subgrade, aggregate base, and surface materials, as well as, roadbed structure and drainage methods vary from cell to cell. All data presented herein, as well as historical sampling, testing, and construction information, can be found in the MnROAD database and in various publications. Layout and designs used for the Mainline and Low Volume Road are shown in figures 2 and 3. Additional information on MnROAD can also be found on its web site at http://mnroad.dot.state.mn.us/research/mnresearch.asp . Mainline Test Road The 3 ½-mile Mainline Test Road (Mainline) is part of westbound Interstate 94. The two-lane facility contains 31 test cells. The Mainline consists of both 5-year and 10-year pavement designs. The 5-year cells were completed in 1992 and the 10-year cells were completed in 1993. Originally, a total of 23 cells were constructed consisting of fourteen hot mix asphalt (HMA) test cells and nine Portland Cement Concrete (PCC) test cells. In 1997, two Superpave HMA test cells and six ultra-thin whitetopping concrete cells were added. Traffic on the Mainline comes from the traveling public on westbound I-94. Typically the Mainline is closed once a month and the traffic is rerouted to the original interstate highway to allow MnROAD researchers the ability to collect data and record test cell performance. The traffic volume has increased 40% since the test facility first opened in 1994 and 2003. The Mainline equivalent single axel loads (ESALs) are determined from two weigh-in-motion (WIM) devices located at MnROAD. This data is collected, shared and used to calculate the Mainline ESALs, which are stored in the MnROAD database. An IRD Inc. hydraulic load scale was installed in 1989, east of the mainline test cells. In 2000, a Kistler quartz WIM was installed between PCC cells 10 and 11. Low Volume Road Parallel and adjacent to the Mainline is the Low Volume Road (LVR). The LVR is a 2-lane, 2 ½-mile closed loop that contains 20 test cells. Traffic on the LVR is restricted to an MnROAD operated vehicle, which is an 18-wheel, 5-axle, tractor/trailer with two different loading configurations. The "heavy" load configuration results in a gross vehicle weight of 102 kips (102K configuration). The “legal” load configuration has a gross vehicle weight of 80 kips (80K configuration). On Wednesdays, the tractor/trailer operates in the 102K configuration and travels in the outside lane of the LVR loop. The tractor/trailer travels on the inside lane of the LVR loop in the 80K configuration on all other weekdays. This results in a similar number of ESALs being delivered to both lanes. ESALs on the LVR are determined by the number of laps (80 per day) for each day and are entered into the MnROAD database. LVR SUPERPAVE TEST CELL CONSTRUCTION In early 1998, six test cells on the MnROAD (LVR) were considered for rehabilitation. The six test cells included four aggregate cells (32, 33, 34, & 35) and two asphalt cells (27 & 28), originally constructed in 1993. The MnROAD Bituminous & Concrete Committee, Local Road Research Board (LRRB) and the MnROAD Rehabilitation Committee came up with a number of research needs during the summer of 1998. The needs were developed into two projects, which were constructed in 1999. This paper serves as a summary of the 1999 construction and the continued monitoring of the Superpave test cells 33, 34, and 35. Cells 27 and 28 are covered in a separate document, as is cell 32, which was reconstructed with PCC in 2000.
Test cells 33, 34 and 35 were reconstructed to field verify the current Superpave criteria related to low temperature cracking (thermal and/or transverse cracking). Each test cell used the same mix design
Worel, Mulvaney & Andersen
which calls for 4" of HMA Superpave mix over a 12" Class-6 Special aggregate base. The only difference in the design is the type of asphalt binder to be used. It was believed that this design would allow thermal cracks to develop before fatigue cracking or significant levels of rutting. The design is based on a 20-year ESAL of 375,000.
The Class 6 Special aggregate base was chosen because past experience at MnROAD indicated that this base material induced more thermal cracks in the HMA pavements. This is based on past performance of the 1993 LVR test cells.
The difference in the HMA mix design for the three test cells is the use of three different Superpave PG binders, they are PG 58-28, PG 58-34 and PG 58-40. Note that each of these binders have the same high-end temperature value of 58°C, but the low-end temperature value varies from -28°C, -34°C, and -40°C. Also note that the PG 58-34 and PG 58-40 are polymer-modified binders, which was required in order to met the Superpave specifications. This was done despite the fact that PG grading tests developed by SHRP are based on unmodified binders.
In summary, MnROAD wanted to examine the effects of using different PG graded asphalt binders on ride and performance. Each cell was constructed with the same HMA Superpave mix design and materials, is placed in same environment, and are subject to the same traffic loadings (ESALs). LVR Superpave Test Cell Contract Letting The project was let on June 11, 1999 as State Project (S.P.) 8816-40. The original bids were 167% over budget and the project was re-evaluated and re-bid. The project was re-bid later in the summer and came within 10% of the estimate. The project was awarded to the apparent low bidder, Bituminous Roadways, Inc., Inver Grove Heights, MN. Construction on the LVR test cells started on July 26 and finished on September 2, 1999. See table 1 for construction related activities for S.P. 8816-40. TABLE 1 Construction Summary for S.P. 8816-40
Cell Purpose
27 Remove 3" HMA surface and 11" of aggregate base and replace with 14" of Crushed Stone Base & Double Chip Seal surfacing
28 Remove 3" bituminous pavement & 13" of aggregate base and replace with 14" of Crushed Stone Base & Oil-Gravel surfacing
33 Remove 12" aggregate surfacing & 4" of subgrade material and replace with 4" HMA (PG 58-28) and 12" Class 6 Special
34 Remove 12" aggregate surfacing & 4" of subgrade material and replace with 4" HMA (PG 58-34) and 12" Class 6 Special.
35 Remove 12" aggregate surfacing & 4" of subgrade material and replace with 4" HMA (PG 58-40) and 12" Class 6 Special.
LVR Test Cell Condition Before Construction The LVR Superpave test cells before reconstruction were aggregate base cells designed to model a typical aggregate road in Minnesota. However, based on the MnROAD method of loading the LVR with the 80K and 102K semi-truck, it was soon discovered that these loading were more consistent with a haul road than a typical aggregate road. The MnROAD Aggregate Committee decided it was best to conduct its research efforts off MnROAD and on actual aggregate roads throughout the state. Therefore, these three cells became available for the Superpave study. The MnROAD Aggregate Committee sited the these reasons for abandoning cells 33,34 and 35
• Materials needed to be evaluated under the varied traffic of a typical low-volume road. • Test sections needed a variety of materials, subgrade types, and environments found in
Minnesota.
Worel, Mulvaney & Andersen
• The transitions from paved to aggregate surface caused distresses not related to the actual aggregate structural design at MnROAD.
• Longer test sections are needed to develop adequate evaluation. • High maintenance of test cells, especially in the transition zones between cells. • Damage to test equipment and the semi-truck caused by driving on the aggregate test cells.
Construction Field Notes Table 2 is a summary of Mn/DOT’s filed notes taken during construction by Tim Andersen. TABLE 2 Reconstruction Field Notes
Date PG Activities Noted (Cells 33-35)
July 26 Milled 2 inches of HMA surface and shoulders in the transition area at the beginning of Cell 33 and end of Cell 35. The bituminous millings were hauled to the MnROAD stockpile area.
July 27-28
The existing Class 1 aggregate surfacing and some of the existing subgrade was excavated and stockpiled at the MnROAD stockpile site.
July 29– August 4
A motor grader was used to tolerance the grade and bring the subgrade up to the correct elevation and cross section. The contractor had some difficulty in shaping the subgrade because of dry conditions.
August 5-10
Mn/DOT researchers placed sensors and the wire leads into the subgrade. The trenches for the wire leads were dug and recompacted by hand. During this time, the St. Cloud survey crew surveyed the sensor locations and cross section the roadway
August 11-18 The contractor hauled, compacted, and tolerance the Class 6 Special on the Cells 33-35.
August 19-24
Mn/DOT researchers placed sensors, the wire leads, and the conduit for the thermal crack tape into the Class 6 Special aggregate base in all the cells.
The contractor placed the first 2" lift of HMA mix on Cells 33 - 35. Each cell had a different grade of asphaltic cement in the hot mix asphalt (HMA).
Before each cell was paved, a small area of each mix was paved on the access road, west of the Low Volume Road.
Three rollers were used in compacting the bituminous mix. A double steel was used for the break down, a new pneumatic roller was used as a intermittent roller, and the finish roller was a double steel.
August 25
Dan Boerner (Asst. Bituminous Engineer) Cassandra Isackson (MnROAD Forensic Engineer) experimented with a infrared camera. They looked at how the bituminous mat cools behind the paver to see how the paver influences the bituminous mix temperature when it comes out of the truck. Locations are documented in a separate spreadsheet.

Worel, Mulvaney & Andersen
August 26-27
U of M students and MnROAD site personnel placed the thermal crack tape 11 feet from the centerline on the 102k lane (outside lane) between the two asphalt lifts. This procedure is documented in another document.
August 30
The PG 58-28 mix was paved on the access road before it started to rain and the paving was called off due to rain.
The contractor placed the last 2" lift of bituminous mix on Cells 33, 34, & 35. Each cell utilized the same type of mix that was placed for the first layer.
August 31 The contractor tried to eliminate the use of the pneumatic roller on the PG 58-40 mix (cell
35) on the access road and found out that density dropped by 2 lbs/cu. ft., so the contractor put it back into the rolling pattern. It continued to pick up some of the fines in the PG 58-40 mix.
Sept 1 The shoulders received a variable depth of Class 2 shoulder aggregate on cells 33-35. Sept 2 The topsoil was brought up to the edge of the aggregate shoulders.
Sept 8
Dwayne Stenlund, U of M, and St.Cloud Maintenance placed the turf establishment on cells 33-35. The north inslope was divided into 50 foot wide test plots for researching the best methods to grow grasses after the inplace topsoil was be disturbed during construction. The south in-slope was planted with typical seed used by St. Cloud Maintenance personnel.
Sensors and Data Collection Systems Installed Listed below is the equipment used to collect data from the sensors in each test cell. TABLE 3 Data Collection Equipment Installed
Data Collection Equipment Purpose Campbell Scientific – CR10X datalogger Collects all the data from the sensors in each cell Tektronix 1502CSI cable tester Measure travel time for the TDR probes Campbell Scientific – AM25T multiplexer Allows the datalogger to read multiple thermocouples
Campbell Scientific – AM416 multiplexer Allows the datalogger to read multiple thermal crack tape, watermark moisture blocks, and other sensors.
Campbell Scientific - SDMX multiplexer Allows the datalogger to read multiple TDR traces.

Worel, Mulvaney & Andersen
TABLE 4 Sensors Installed Sensor Type Codes / (Use)
Cell Sensor Type
# of Sensors
# of Locations TC Thermal Couple
(measures the temperature of the soil and pavement) TC 6 WM Water Mark / Moisture Block
(measures the depth of frozen/thawed soil) 1
PK 16 2 TDR Time Domain Reflectometer
TDR 5 1 (measures the amount of moisture in the soil) OS Open Stand Pipe LE 4 (measures the location of the water table) RS Reflectometer (measures the amount of soil moisture) PK Pressure Sensor
(measures the amount of vertical pressure - top subgrade soil)
LE Longitudinal Strain Gauge (measures the strain at the bottom of HMA) PG Pressure Gauges (measures the vertical pressure in the aggregate base) Note: Aluminum foil tape was installed on the outside of the 102k lane under the fog line. Its purpose is to set a alarm when a thermal crack appears.
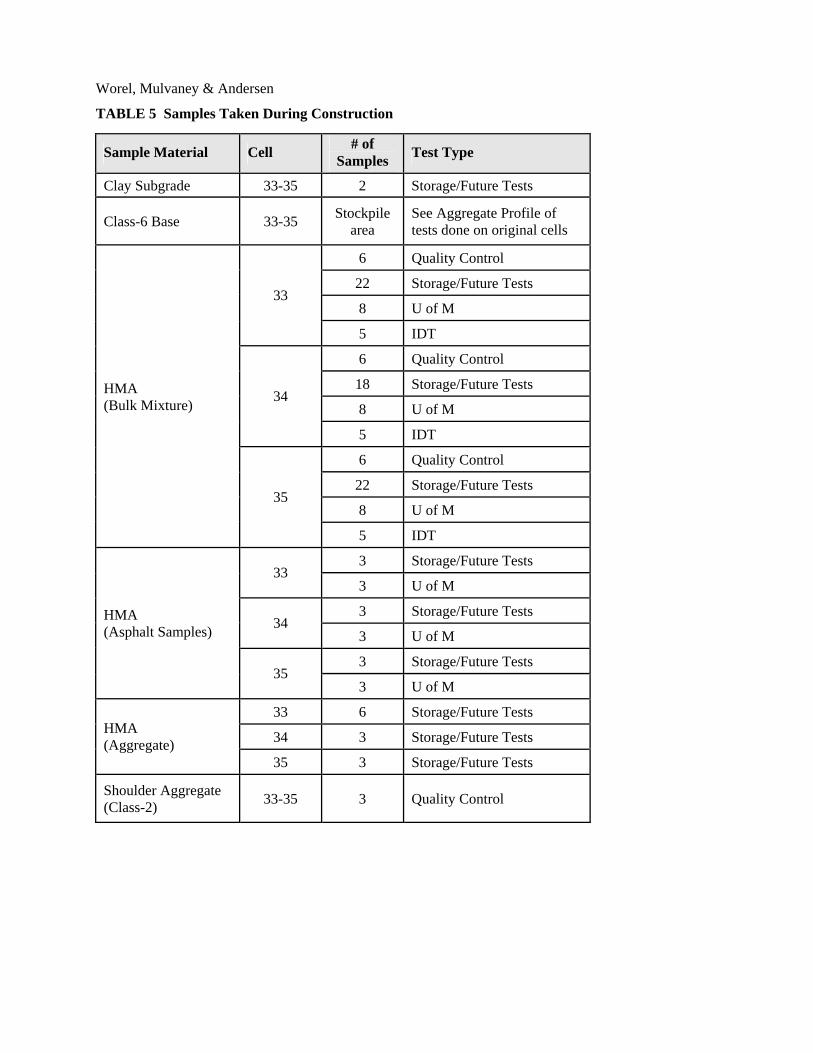
Construction Samples Taken The following samples were taken for testing during construction and are shown in Table 5.
4 PG 6 6
33
OS 1 1 TC 17 3
WM 15 2 TDR 5 2 OS 1 1 RS 5 1
34
LE 4 4 TC 75 1
TDR 45 2 LE 14 4
35
OS 1 1
Worel, Mulvaney & Andersen
TABLE 5 Samples Taken During Construction
Sample Material Cell # of Samples Test Type
Clay Subgrade 33-35 2 Storage/Future Tests
Class-6 Base 33-35 Stockpile area
See Aggregate Profile of tests done on original cells
6 Quality Control
22 Storage/Future Tests
8 U of M 33
5 IDT
6 Quality Control
18 Storage/Future Tests
8 U of M 34
5 IDT
6 Quality Control
22 Storage/Future Tests
8 U of M
HMA (Bulk Mixture)
35
5 IDT
3 Storage/Future Tests 33
3 U of M
3 Storage/Future Tests 34
3 U of M
3 Storage/Future Tests
HMA (Asphalt Samples)
35 3 U of M
33 6 Storage/Future Tests
34 3 Storage/Future Tests HMA (Aggregate)
35 3 Storage/Future Tests
Shoulder Aggregate (Class-2) 33-35 3 Quality Control

Worel, Mulvaney & Andersen
Construction Testing Results Tables 6, 7, 8, 9 and 10 show the results of the construction testing performed during this project. TABLE 6 Aggregate Base Moisture and Densities
Requirements
Material Test Min Max
Ave Field Results
# of Samples Sample Type
Class 6 Special Relative Moisture 65 102 66 13 From roadway
Class 6 Special Relative Density 100 ----- 112 5 From roadway Class-6 special was used from the MnROAD stockpile area for the 12” base material. TABLE 7 Aggregate Base Gradations
Requirements Sieve
Min Max Average
Field Result # of
Samples Sample Type
1" 100 100 100
¾" 85 100 96
3/8" 50 70 65
# 4 30 50 41
# 10 15 30 27
# 40 5 15 13
# 200 0 5 5.7
5 Sample
from Roadway
Class 6 Special was used for the base material consisted of Class A aggregate (Original class-6 from the stockpile area) TABLE 8 HMA Aggregate Gradations
Requirements Sieve
Min Max PG 58-28 Average
PG 58-34 Average
PG 58-40 Average
¾" 100 100 100 100 100
3/8" 90 100 93 94 93
# 4 79 90 85 86 85
# 10 59 73 68 68 67
# 40 48 58 56 56 55
# 200 2.7 6.7 5.2 5.2 5.0
# of Samples
6a 5b 6a
Sample Type
Mix from Truck Box
Mix from Truck Box
Mix from Truck Box
Aggregate sources and percentages are shown in table 5 in the appendix (Mn/DOT Trial Mix Designs) a Two samples from the paver and the rest of the samples were obtained from the truck box
Worel, Mulvaney & Andersen
b One sample from the paver and the rest of the samples were obtained from the truck box TABLE 9 LVR HMA Superpave Mix Testing Results
Required Material Test
Min. Max. Average Results
# of Tests
Sample/Test Type
PG 58-28 HMA 92.0% ------- 93.6% 4 PG 58-34 HMA 92.0% ------- 94.2% 4 PG 58-40 HMA
Relative Density 92.0% ------- 93.0% 4
Cores from Roadway
PG58-28 HMA 44 mm 56 mm 51 mm 4 PG 58-34 HMA 44 mm 56 mm 50 mm 4 PG 58-40 HMA
Pavement Thickness 44 mm 56 mm 50 mm 4
Cores from Roadway
PG 58-28 HMA 5.4% 6.2% 5.5% 6a
PG 58-34 HMA 5.4% 6.2% 5.5% 5b
PG 58-40 HMA
%AC (Field Cores)
5.4% 6.2% 5.5% 6a
Incinerator & Extraction
PG 58-28 HMA 75 ------- 91 4 PG 58-34 HMA 75 ------- 90 4 PG 58-40 HMA
Lottman (TSR ratio) 75 ------- 78 6a
Mix from Truck Box
PG 58-28 HMA ------- ------- PG (59.5 - 30.6) PG 58-34 HMA ------- ------- PG (60.4 - 35.1) PG 58-40 HMA
SHRP PG Grade (AC Binder)
------- ------- PG (61.9 - 41.2)
DSR and BBR
PG 58-28 HMA ------- ------- 2.381 4 PG 58-34 HMA ------- ------- 2.390 4 PG 58-40 HMA
Bulk Specific Gravity ------- ------- 2.393 4
Mix from Truck Box
PG 58-28 HMA ------- ------- 2.501 4 PG 58-34 HMA ------- ------- 2.494 4 PG 58-40 HMA
Max. Specific Gravity
------- ------- 2.491 4
Mix from Truck Box
PG 58-28 HMA 75/0 ------- 98/98 4 PG 58-34 HMA 75/0 ------- 97/97 4 PG 58-40 HMA
Course Aggregate Angularity
75/0 ------- 98/97 4
Mix from Truck Box
PG 58-28 HMA 40 ------- 41.3 4 PG 58-34 HMA 40 ------- 41.3 4 PG 58-40 HMA
Fine Aggregate Angularity
40 ------- 41.2 4
Mix from Truck Box
PG 58-28 HMA ------- 0.3% 0.04% 2 PG 58-34 HMA ------- 0.3% 0.04% 2 PG 58-40 HMA
Mix Moisture ------- 0.3% 0.03% 2
Mix from back of Paver
PG 58-28 HMA 2.7% 5.3% 4.9% 4 PG 58-34 HMA 2.7% 5.3% 4.1% 4 PG 58-40 HMA
Production Air Voids 2.7% 5.3% 4.3% 4
Mix from Truck Box
PG 58-28 HMA 13.7% ------- 15.0% 4 PG 58-34 HMA 13.7% ------- 14.6% 4 PG 58-40 HMA
Voids in Mineral Aggregate
13.7% ------- 14.7% 4
Mix from Truck Box
a Two samples obtained from the paver and the rest of the samples were obtained from the truck box
b One sample obtained from the paver and the rest of the samples were obtained from the truck box
Worel, Mulvaney & Andersen
TABLE 10 Aggregate Shoulder Gradations Requirements
Sieve Min Max
Average Field Result
# of Samples
Sample Type
¾" 100 100 100
3/8" 65 90 79
#4 35 70 51
#10 25 45 33
#40 12 30 16
#200 5 13 6.7
3 Sample
from Roadway
Class-2 was used for the gravel shoulder surface consisting of Class A aggregate (Meridian Granite, St. Cloud) Construction Summary Final construction comments from the MnROAD Construction & Planning Engineer are shown in table 11. TABLE 11 Construction Comments
Category Comments on LVR Test Cells 33-35
Due to the short length of each cell, about 560 feet, the transitions between each cell is rough. It should be noted that the paving crew used a 30-foot ski on the paver and the paving crew had very little experience working with electronic controls.
The paving crew had to back up the paver near the start of the different cells. At the transition area between Cells 34 & 35, 80K lane, the paver backed up four times before the paver continued to pave the rest of the lane. This produced a very noticeable bump between Cells 34 & 35, 80K lane, this was documented. The pneumatic roller picked up bituminous fines and oil on Cells 33, 34, & 35
Challenges
The contractor tried to warm the tires and reduced the amount of pick up on Cells 33 & 34. But on Cell 35, the PG 58-40 mix still was picked up, without much success
Successes The contractor got an incentive on density on 4 out of 6 lifts.
Before each cell was paved, a small area of each mix was paved on the access road, west of the Low Volume Road. This was done to give the contractor an opportunity to try different rolling patterns before the mix was placed on the cells. The mix types are documented for possible further research on non-traffic cells.
Look at different methods of paving short stretches of roadway and still obtain a acceptable ride. Future
Construction Practices Examine different methods of preventing the pneumatic roller from picking up the HMA
fines.
TESTING COMPLETED SINCE CONSTRUCTION The following is a partial listing of some of the documents that has been prepared using construction

Worel, Mulvaney & Andersen
materials of the three LVR Superpave test cells.
Worel, Mulvaney & Andersen
Mathy Construction - 2000 Mr. Gerald Reinke of Mathy Construction developed a report based on bulk mix samples from LVR test cells 33-35. The report is available on the MnROAD web page and the data is located in the MnROAD database. (Refer to earlier location of MnROAD website). The report contains the following tests: SHRP PG Grading, Indirect Tensile, Torsional Fatigue, Modulus (High Temperature). The report can be found at, Reinke, G. Investigation into the Low Temperature and Fatigue Properties of Three MnROAD Bituminous Mixtures. December 11, 2000. http://mnroad/dot.state.mn.us/research/mnresearch.asp University of Minnesota – 2002 The University of Minnesota tested bulk mix samples from cells 33-35. The complex dynamic modulus was measured over a range of temperatures and frequencies, as recommended by the 2002 Design Guide. The data is available from the MnROAD database. The report is unpublished, but is being prepared at the time this document was being written. Marasteanu, M., Skok, E., and Clyne, T. Dynamic and Resilient Modulus of Mn/DOT Asphalt Mixtures (undated) University of Minnesota – 2003 The University of Minnesota tested bulk mix samples taken from cells 33-35. This testing was conducted under the current pooled states study for Low Temperature Cracking. The data and final report are not complete at this time. The University of Minnesota is currently testing mixtures under a newly developed test performed on semicircular samples cut from gyratory-compacted specimens. Fracture mechanics principles are being used to better understand the low-temperature properties of asphalt mixtures. Reports are expected once the testing and data analysis are complete. LVR SUPERPAVE TEST CELL PERFORMANCE MnROAD has monitored the test cells since they were constructed in July 1999. Here is a brief summary of the data collected. Rutting Rutting has developed in all three Superpave test cells as shown in table 12. Measurements are taken using a six-foot straight edge. More rutting is developing in the 80K lane than the 102K lane despite the same number of ESALs in each lane. This is consistent with the original 1994 HMA test cells on the LVR. These cells also had more rutting in the 80K lane than the 102K lane, which seems to indicate that the number of passes impacts the amount of rutting more than weight or the standard ESAL. Note the inside 80K lane is driven 4 days per week and the 102K lane is driven 1 day per week, each averaging 80 laps per day. TABLE 12 Rutting (6-foot Straight Edge)
80K Inside Lane 102K Outside Lane Cell
Outside WP Inside WP Outside WP Inside WP 33 .4752" .4374" .3064" .2312" 34 .4628" .4248" .3628" .3002" 35 .5504" .4624" .3438" .2252"
Transverse Cracking The initial transverse cracking developed during February 2003. Currently, these cracks do not exhibit a
Worel, Mulvaney & Andersen
“typical” thermal cracking pattern, which runs perpendicular and across the entire width of both lanes. These cracks are more random in nature. The forensic observation includes more information on these cracks. See table 13 for the amount of transverse cracks through November, 2003. TABLE 13 Transverse Cracking
80K Inside Lane 102K Outside Lane Cell
Number of Cracks Linear Feet Number of Cracks Linear Feet 33 0 0 6 13 34 0 0 0 0 35 14 66 5 24
Longitudinal Cracking Some longitudinal cracking has developed and is shown in table 14. Forensic cores have shown cell 35 is cracking from the top down. TABLE 14 Longitudinal Cracking
80K Inside Lane 102K Outside Lane Cell
Outside WP Inside WP Outside WP Inside WP 33 0 0 0 0 34 0 0 0 0 35 2 4 3 16
Fatigue Cracking Cell 35 contains some fatigue cracking, see table 15. These cracks may have developed in areas that were not constructed to the full 4-inch HMA thickness. This is consistent with LVR test cells 27-28 when forensic cores were taken. TABLE 15 Fatigue Cracking
80K Inside Lane 102K Outside Lane Cell
Outside WP Inside WP Outside WP Inside WP 33 0 0 0 0 34 0 0 0 0 35 0 6 lin-ft 16 lin-ft 0
Ride Ride is measured with a Pathways data collection van Mn/DOT owns. The data is recorded using the International Roughness Index (IRI) in meters/kilometer (m/km). An IRI of zero indicates a perfectly smooth pavement, while IRI values above 3.00 m/km indicate a very rough ride. The current ride index is very similar for each cell as shown in table 16. TABLE 16 PATHWAYS IRI Ride Measurements (m/km)
80K Inside Lane 102K Outside Lane Cell
Outside WP Inside WP Outside WP Inside WP
Worel, Mulvaney & Andersen
33 2.23 1.91 1.33 1.50 34 2.00 2.62 1.42 1.40 35 1.96 2.10 1.83 1.96
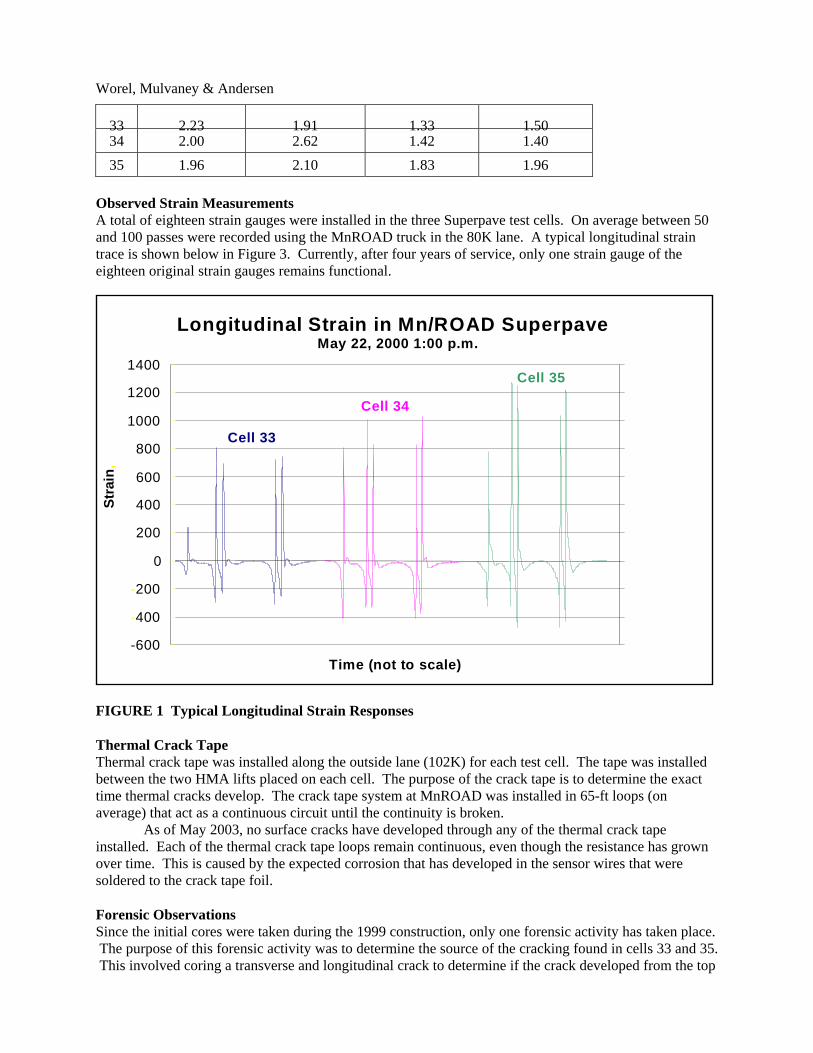
Observed Strain Measurements A total of eighteen strain gauges were installed in the three Superpave test cells. On average between 50 and 100 passes were recorded using the MnROAD truck in the 80K lane. A typical longitudinal strain trace is shown below in Figure 3. Currently, after four years of service, only one strain gauge of the eighteen original strain gauges remains functional.
Longitudinal Strain in Mn/ROAD Superpave C ll May 22, 2000 1:00 p.m.
-600 -400 -200
0 200 400 600 800
1000 1200 1400
Time (not to scale)
Stra
in,
Cell 33 Cell 34
Cell 35
FIGURE 1 Typical Longitudinal Strain Responses Thermal Crack Tape Thermal crack tape was installed along the outside lane (102K) for each test cell. The tape was installed between the two HMA lifts placed on each cell. The purpose of the crack tape is to determine the exact time thermal cracks develop. The crack tape system at MnROAD was installed in 65-ft loops (on average) that act as a continuous circuit until the continuity is broken. As of May 2003, no surface cracks have developed through any of the thermal crack tape installed. Each of the thermal crack tape loops remain continuous, even though the resistance has grown over time. This is caused by the expected corrosion that has developed in the sensor wires that were soldered to the crack tape foil. Forensic Observations Since the initial cores were taken during the 1999 construction, only one forensic activity has taken place. The purpose of this forensic activity was to determine the source of the cracking found in cells 33 and 35. This involved coring a transverse and longitudinal crack to determine if the crack developed from the top
Worel, Mulvaney & Andersen
or the bottom of the asphalt layer. The forensic activity involved taking five cores from cell 35 on May 2, 2003. See table 17 for core data and table 18 for forensic observations. TABLE 17 Forensic Core Locations
Core
Number
STA (Ft)
Offset (in)a
Thicknessb
Lifts 1+2 =Total (in) Comment
3503BC001 7828 + 48 1.75+2.125 = 3.875 On transverse crack #1 / separated at tack coat 3503BC002 7828 + 32 2.25+2.00 = 4.25 3” off the end of transverse crack #1 3503BC003 7817 + 28 1.75+1.50 = 3.25 On longitudinal crack in wheel path 3503BC004 7817 + 70 2.00+2.00 = 4.00 Midlane at same station as longitudinal crack 3503BC005 7731 + 60 2.50+1.75 = 4.25
a A positive offset indicates the inside 80K lane for cells 33-35. On transverse crack #2
b Lift (1) is the bottom lift and lift (2) is the surface lift TABLE 18 Forensic Observations Observation Category Observation / Comment
The cores taken at the same station as the longitudinal cracking show a ¾” difference in thickness. Air voids and density will be determined but the difference appears to be construction related due to the other cores taken in the wheel path were more consistent thickness than the one containing the longitudinal crack.
Thickness Variations
Transverse Cracks
Three cores were taken to observe the transverse cracking on two different cracks. On the first crack, one core was taken in the middle of the transverse crack and one just as it disappeared, about 3”, from the end. We observed that the core taken on the transverse crack debonded between the two lifts and the crack was observed in both lifts but it appeared it developed from the surface. The bottom lift was “flexed” by hand from the top down to observe the crack better. It was noticeable but only slight at the HMA lift interface before it was broke. The second core contained no visible cracking. The second crack core showed the same as the first crack. The cracking appears to be top down. Overall the transverse cracking appears to be construction related and do not exhibit the same characteristics as traditional thermal cracks at this point.
The thickness of the cores in the area of the longitudinal cracking were ¾” thinner then any of the other cores. The crack went all the way through the core and no determination of top down cracking can be made. MnROAD has observed in the past other areas on other cells that contained localized areas of “thinner” spots that eventually fatigued.
Longitudinal Cracks
PRELIMINARY FINDINGS The three test cells in the LVR are behaving in such a manner to warrant additional study into the performance of polymer modified asphalt binders.
Rutting in the three cells are similar, however, the 80K lane has more rutting than the 102K lane.

Worel, Mulvaney & Andersen
Each lane has had the same number of ESALs loaded to it by way of the MnROAD semi-truck. Therefore, according to current design practices, this should indicate the same amount of rutting for each lane, which is not the case at MnROAD.
Rutting is occurring the HMA Superpave pavements even though the high temperatures in the pavements have never reached the high-end grade of the asphalt binders, or 58° C. According to SHRP protocol, the mix designs should be rut resistant up to the high-end temperature grade. This inconsistency warrants additional study.
In regards to transverse or thermal cracking, cell # 35 with a PG 58-40 modified asphalt binder has cracked more than the unmodified PG 58-28 test cell and the modified PG 58-34 test cell. While it is uncertain as to whether the cracks are true thermal cracks or cracks caused by the aggregate base, it is known that the lowest pavement temperatures recorded at MnROAD are well above the low-end temperature grade of the PG binders for the three test cells. Again, this inconsistency should be studied.
It is recognized that the SHRP testing protocols for asphalt binders were not established using polymer modified asphalt binders and in fact, they may not be well suited for modified binders. It is this premise that Mn/DOT has begun a national pooled fund study with the University of Minnesota as the lead agency, to address these SHRP protocols and possibly establish new and better test methods. Specifically, the pooled study is looking at the low-end temperature grading for modified asphalt binders since thermal cracking is the number one cause of pavement distress in this part of the country. MnROAD is perfectly situated to be the test site to conduct field-testing of the HMA mix designs that come out of this study.

Worel, Mulvaney & Andersen
List of Figures
Figure 1 MnROAD Test Cell Layout (Mainline)
Figure 2 MnROAD Test Cell Layout (Low Volume Road)
Figure 4 Cell 33 (PG 58-28) Mix Design
Figure 5 Cell 34 (PG 58-34) Mix Design
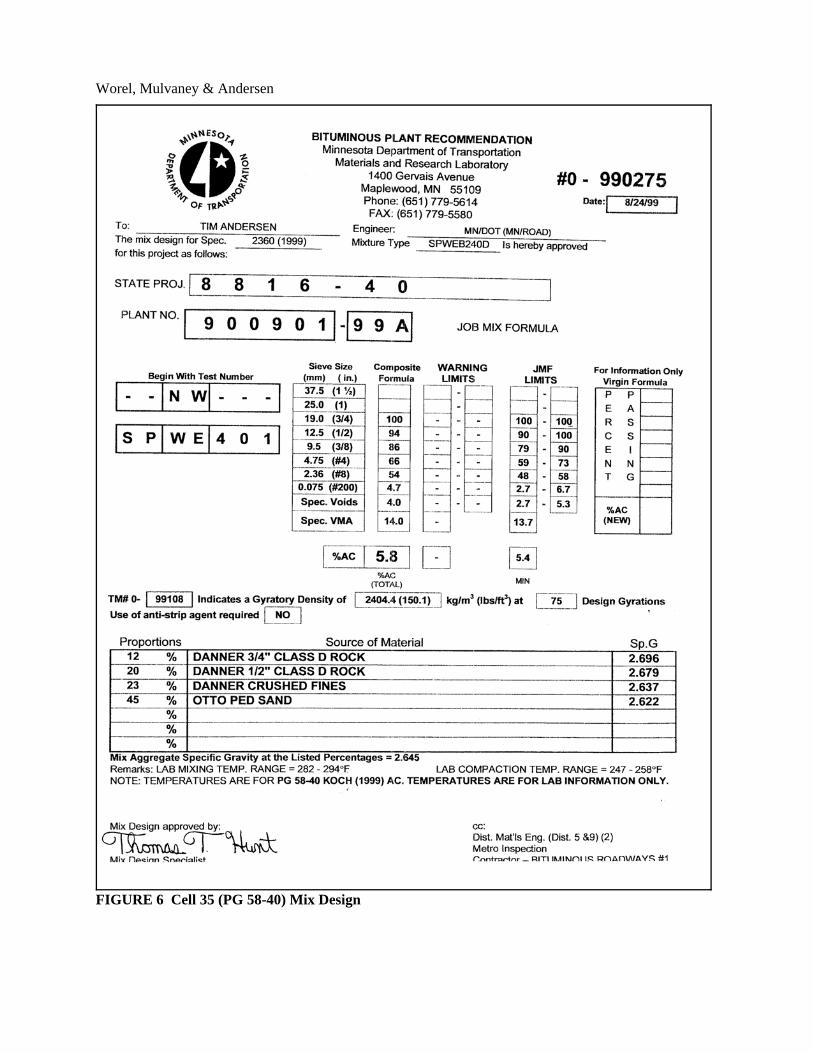
Figure 6 Cell 35 (PG 58-40) Mix Design
Worel, Mulvaney & Andersen
5051
9"9"
4"4"
Depth Below Pavement Surface
10"
20"
30"
40"0"
Res
trict
edZo
neC
oars
eM
ix G
rada
tion
Con
stru
ctio
n D
ate
Jul 9
7Ju
l 97
Supe
rpav
e Te
stSe
ctio
ns (T
op 4
")
Lege
ndH
ot M
ix A
spha
ltC
oncr
ete
Cla
ss 3
Sp.
Cla
ss 4
Sp.
Cla
ss 5
Sp.
Cla
ss 6
Sp.
Perm
eabl
e A
spha
lt St
abili
zed
Bas
e
56
78
97.
14"
27"
3"
7.39
"
5"3"
7.55
"
3"
7.43
"
3"
7.43
"
4" d
rain
ed4"
dra
ined
4" d
rain
ed
Depth Below Pavement Surface
10"
20"
30"
40"0"
20'
1"
13' /
14'
Pane
l Wid
th **
Pane
l Len
gth
Dow
el D
iam
eter
12Su
bgra
de "
R"
Valu
e
15'
1"
13' /
14'
12
20'
1"
13' /
14'
12
15'
1"
13' /
13' /
14'
121" 12
Supp
l. St
eel
15'
13' /
13' /
14'
1011
1213
9.86
"
3"
4" d
rain
ed5"
9.64
"9.
91"
5" d
rain
ed
9.73
"
5"
1 ¼
"1220
'12
' / 12
'
1 ¼
"1224
'12
' / 12
'
1 ¼
"1215
'12
' / 12
'
1 ½
"1220
'12
' / 12
'
** P
assi
ng/D
rivin
g or
Sho
ulde
r/Pas
sing
/Driv
ing
Con
stru
ctio
n D
ate
Sep
92Se
p 92
Sep
92Se
p 92
Sep
92Ju
n 93
Jun
93Ju
n 93
Jun
93
10-y
ear T
est S
ectio
ns5-
year
Tes
t Sec
tions
Long
itudi
nal J
oint
Spa
cing
Tran
sver
se J
oint
Spa
cing
4' 4' No
4' 4' No
6' 5'Po
lyol
efin
No
6' 5' No
12'
10'
No
12'
10'
Yes
3.9"
2.8"
9394
9596
9792
3"
9"10
"10
"
5.9"
6.3"
6"
7"7"
7"
Depth Below Pavement Surface
10"
20"
30"
40"0"
Fibe
rsD
owel
sC
onst
ruct
ion
Dat
eO
ct 9
7O
ct 9
7O
ct 9
7O
ct 9
7O
ct 9
7O
ct 9
7
Ultr
a-th
in W
hite
topp
ing
Test
Sec
tions
Con
stru
ctio
n D
ate
10.9
"8" 28
"
11.1
"7.
9" 28"
7.9"
9.2"
7.9"
23"
18"
3"
1415
1617
1819
20
* 199
9 M
icro
-sur
faci
ng C
ell 2
0 &
Cel
l 23
Dat
e R
evis
ed: 0
7/01
/200
2
**
2122
23
4" d
rain
ed
12
34
5.9"
33"
9.1"
6.1" 4" 28"
6.3" 4" 33"
Depth Below Pavement Surface
10"
20"
30"
40"0"
75 12
AC
120/
150
Asp
halt
Bin
der
Mar
shal
l Des
ign
Subg
rade
"R
" Va
lue
35 12
AC
120/
150
Gyr
ator
y12
AC
120/
150
7.9" 9"12"
drai
ned
7.8" 28"
28"
7.8"
50 12
AC
120/
150
75 12
AC
120/
150
75 12
AC
20
Gyr
ator
y12
AC
20
75 12
AC
20
50 12
AC
20
35 12
AC
20
35 12
AC
120/
150
50 12
AC
120/
150
75 12
AC
120/
150
50 12
AC
120/
150
Jul 9
3Ju
l 93
Jul 9
3Ju
l 93
Sep
93Se
p 92
Sep
92Se
p 92
Sep
92Ju
l 93
Jul 9
3Ju
l 93
Jul 9
3Ju
l 93
5-ye
ar T
est S
ectio
ns10
-yea
r Tes
t Sec
tions
Wes
tbou
nd I-
94
East
boun
d I-9
4
34
56
78
910
1112
1314
1516
1718
1920
2123
22
Mai
nlin
e Te
st R
oad
12
5051
9394
9596
9792
FIGURE 2 MnROAD TEST CELL LAYOUT (Mainline)

Worel, Mulvaney & Andersen
Low
Vol
ume
Test
Roa
d
3334
3536
3738
3940
2425
2627
2829
3031
32
Min
neso
ta R
oad
Res
earc
h Pr
ojec
t
Mn
RO
AD
Con
stru
ctio
n D
ate
3637
3839
406.
35"
5"
6.40
"6.
35"
6.38
"
12"
5"5"
6.3"
7.6"
7.6
"
0 "
Depth Below Pavement Surface
10 " 20 " 30 "
5"
12' /
12'
15'
1" 70
12' /
12'
12'
Non
e70
12' /
12'
15'
1" 12
12' /
12'
20'
1" 12
12' /
12'
15'
Non
e12
Subg
rade
"R
" Va
lue
Dow
el D
iam
eter
Pane
l Len
gth
Pane
l Wid
th**
Jul 9
3Ju
l 93
Jul 9
3Ju
l 93
Jul 9
3C
ells
that
hav
e be
en re
-con
stru
cted
with
new
mat
eria
ls
Lege
nd
Hot
Mix
Asp
halt
Con
cret
eC
rush
ed S
tone
Bas
eC
lass
1C
lass
1c
Cla
ss 1
f
Cla
ss 3
Sp.
Cla
ss 4
Sp.
Cla
ss 5
Sp.
Cla
ss 6
Sp.
Oil
/ Gra
vel
Dou
ble
Chi
p Se
al
0 "
Depth Below Pavement Surface
10 " 20 " 30 "
Subg
rade
"R
" Va
lue
Asp
halt
Bin
der
1212
12
6" 6"
6" 6"
6" 6"
4.04
"
12"
3.92
"3.
96"
12"
12"
Sep
96Se
p 96
Sep
96C
onst
ruct
ion
Dat
e
3435
3334
3533
5253
54R
ecla
imed
HM
A
2930
31
Depth Below Pavement Surface 10"
20"
30"
2832
5253
5424
25 5.2" 50 70
AC 12
0/150
Aug
93
5.9"
14"
10"
5.1"
12Se
p 96
12"
5.1"
4"3.3" 12"
6"6"
Oct
00
12Ju
n 00
12Ju
n 00
12
0"26
11"
3.3"
13"
3.2"
4" 12"
2.5" 14"27
12A
ug 9
912
Aug
99
Subg
rade
"R
" Va
lue
Con
stru
ctio
n D
ate
Asp
halt
Bin
der
Mar
shal
l Des
ign
AC 12
0/150
35 70A
ug 9
312
Sept
00
1250AC
120/1
50
Aug
93
50 12
AC 12
0/150
Aug
93
75 12
AC 12
0/150
Aug
93
75 12
AC 12
0/150
Aug
93
1250AC
120/1
50
Aug
93
PVC
Cul
vert
Stu
dy
5" 1" 6"5"7.5"
5"7.5"
3.1" 4"
2.5 8"
2727
2832
12
PG 5
8-28
Aug
99
12
PG 5
8-34
Aug
99
12
PG 5
8-40
Aug
99
12Se
p 00
1250AC
120/1
50
Aug
93
Jun
0012
261"
2"
14"
Dat
e R
evis
ed: 0
7/01
/200
2
FIGURE 3 MnROAD TEST CELL LAYOUT (Low Volume Road)

Worel, Mulvaney & Andersen
FIGURE 4 Cell 33 (PG 58-28) Mix Design
Worel, Mulvaney & Andersen
FIGURE 5 Cell 34 (PG 58-34) Mix Design
Worel, Mulvaney & Andersen
FIGURE 6 Cell 35 (PG 58-40) Mix Design