Embed Size (px)
Citation preview

Minnesota Part C Annual Performance Report Fiscal Year 2017 Report to the Legislature
As Required by Minnesota Statutes, section 125A.28
This document is made available electronically by the Minnesota Legislative Reference Library as part of an ongoing digital archiving project. http://www.leg.state.mn.us/lrl/lrl.asp

For more information:
Lisa Backer Minnesota Department of Education 1500 Highway 36 West Roseville, MN 55113 (651) 582-8473 [email protected] education.state.mn.us
As requested by Minnesota Statutes, section 3.197: This report cost approximately $412.00 to prepare, including staff time, printing and mailing expenses.
Upon request, this material will be made available in an alternative format such as large print, Braille or audio recording. Printed on recycled paper.

FFY 2015 Part C State Performance Plan (SPP)/Annual Performance Report (APR) 3
Legislative Charge
Minnesota Stautes, section 125A.28:
Annually, the council must prepare and submit a report to the governor and the secretary of the federal Department of Education on the status of early intervention services and programs for infants and toddlers with disabilities and their families under the Individuals with Disabilities Education Act, United States Code, title 20, sections 1471 to 1485 (Part C, Public Law 102-119), as operated in Minnesota. The Minnesota Part C annual performance report may serve as the report.
Executive Summary
The Minnesota Department of Education (MDE), as the state's designated lead agency for the implementation of Part C, extends heartfelt gratitude to all those whose efforts are captured within this years' Annual Performance Report. Our thanks goes out to primary referral sources, families, service providers, interagency colleagues, members of our regional interagency early intervention committee and team members from all divisions at MDE who support the work of early intervention and early childhood special education. The positive performance communicated within this report throughout the compliance and results is a reflection of all of you.
For FFY 2015, Minnesota met its targets with no slippage on five indicators. Of the other targets that were not met, as a state we demonstrated no slippage on all but two indicators, which indicates that we are beginning to "turn the curve" on our performance, particularly related to child outcomes. Through efforts at the state level and through our regional Centers of Excellence professional development system, Minnesota has been focusing on local districts not just "doing it right" from a compliance perspective, but on "doing it well," and is beginning to see evidence of our focus on quality. Similarly, our focus on quality also extends to data collection through our child outcome summary process.
General Supervision System
The systems that are in place to ensure that IDEA Part C requirements are met (e.g., monitoring systems, dispute resolution systems).
The Minnesota Department of Education administers a comprehensive system of general supervision including special education program and fiscal compliance monitoring, special education complaints, due process hearings and alternative dispute resolution options for parents, districts and other stakeholders in the special education and early intervention systems.
Program monitoring provides general supervision and oversight of special education and early intervention programs using the Minnesota Continuous Improvement Monitoring Process (MNCIMP). MNCIMP is the vehicle for MDE’s Division of Compliance and Assistance program monitoring unit to ensure a free appropriate public education (FAPE) is available for children with disabilities beginning at birth.

FFY 2015 Part C State Performance Plan (SPP)/Annual Performance Report (APR) 4
Each special education administrative unit (SEAU) is monitored for compliance through MDE’s MNCIMP web-based data system which gathers data from early intervention records reviewed. Compliance monitoring takes place on a six-year cycle. In year one of the cycle, the SEAU conducts a self-review of records. A computer-generated sample is used to select the records to be reviewed from the most recent SEAU enrollment data chosen to accurately represent the SEAU as a whole. Selection is based on a stratified random sampling with consideration given to race/ethnicity, age, gender, and primary disability. During the record review process, the most current Individual Family Service Plan (IFSP) and corresponding due process documentation are reviewed for compliance with legal standards. In year two, the SEAU must demonstrate correction of any noncompliance identified in the self-review consistent with the requirements of OSEP Memo 09-02.
In year three of the cycle, MDE conducts an on-site review of the SEAU including a review of early intervention records (following the same process for record selection as used in year one). Stakeholder input is gathered from early intervention service providers, parents and administrators. Data gathered from the various stakeholders helps to determine compliance within the district as well as identify areas of needed technical assistance.
In year four of the cycle, the SEAU must demonstrate correction of noncompliance identified during the MDE review and implement any corrective action, again consistent with the requirements of OSEP Memo 09-02. The fifth year of the cycle is used to verify results of the implemented corrective action plan. In any given year, data is collected through the self-review of records for 20 percent of the local programs in Minnesota. In the sixth year, an SEAU that has met all requirements has no formal monitoring obligations.
Fiscal monitors from MDE’s Fiscal Monitoring Team work to ensure that Part C funds are used only to serve eligible children and are administered under appropriate internal controls in the SEAU. Fiscal monitoring and program monitoring teams follow the same five-year schedule with the exception that there is no self-review process in fiscal monitoring. Annually, a risk assessment is completed in order to determine if an SEAU will receive an on-site review or one of two types of desk reviews. Once the SEAUs have been striated into their appropriate risk category, the fiscal monitors utilize the Electronic Data Reporting System (EDRS) and the Minnesota Automated Reporting Student System (MARSS) to pick samples related to time and effort, procurement, and transportation. Additionally, information is requested from the SEAUs for inventory management. Each of the three levels of review request additional samples, more documentation, and monitor additional details of the data as the SEAU progresses higher in risk.
Corrective action by the local program as needed takes place in the year following a fiscal monitoring. Corrective action may include documenting processes, changing documents so they contain appropriate data, or making corrections within the EDRS or MARSS systems so data entered is accurate. The department also reserves the right to reclaim funds should it be deemed funds were used for ineligible purposes.
Finally, the fiscal monitoring team receives fiscally based complaints and conducts investigations as necessary. When complaints come in to the agency, the investigation is led by the supervisor of this group but is also assigned to a monitor to assist. A complaint can be filed about any entity that provides publicly funded intervention services directly to families and children with disabilities that has violated a state or federal special

FFY 2015 Part C State Performance Plan (SPP)/Annual Performance Report (APR) 5
education law or rule. Before filing a complaint, MDE encourages parents or other persons to first contact the school district’s special education director, who may be able to help resolve the issue.
Once a fiscal investigation is opened, the entity is notified and provided a short timeline to provide requested documentation based on the nature of the complaint. Interviews with staff may be conducted, if necessary, and an on-site visit may occur. If the local education agency (LEA) is found to be in violation and a corrective action is deemed necessary, a corrective action plan is developed and the responsible education agencies must complete the corrective action within the specified timeframe. Through active follow-up, MDE ensures that corrective action plans are appropriately implemented and individual correction occurs within one year.
As noted, MDE administers a comprehensive dispute resolution system for the state. Minnesota Special Education Mediation Service (MNSEMS) provides conflict resolution assistance for students, schools, parents and agencies. Parents and program staff can use mediation or facilitated IFSP meeting(s) to address issues of conflict. During the summer of 2014, MDE’s Special Education ADR Services conducted a continuous improvement process involving internal and external stakeholders, examined its procedures, and made changes to improve ADR’s efficiency and effectiveness. Some changes included submission of requests online, faster online scheduling, automated emails, and the development of a vision of success for parents, older students, and educators.
Parents and districts are entitled to an impartial due process hearing to resolve disputes over identification, evaluation, education placement, or provision of a free appropriate public education to an infant, toddler or student with a disability. Parents and districts are encouraged to use mediation, conciliation or some other mutually agreed-upon alternative before proceeding to a hearing.
Information about the hearing system is available on the MDE website including a Hearing Request form, information on free or low-cost legal resources and Minnesota’s procedural safeguards notice. While the majority of due process hearing requests are settled or resolved without a hearing, MDE continues to work with the Office of Administrative hearings, who conducts the hearings, districts, and parent advocates to educate parents and districts on their rights and responsibilities regarding due process hearing resolution sessions. Through these efforts, district participation in documenting the occurrence of the resolution sessions has increased by 100 percent. In addition, MDE is obtaining more accurate data regarding when the sessions are held and the results of the resolution session.
The special education complaint system is designed to ensure that all children with disabilities, including infants and toddlers, are provided a free appropriate public education. A complaint can be filed about any entity that provides publicly funded intervention services directly to families and children with disabilities that has violated a state or federal special education law or rule. Before filing a complaint, MDE encourages parents or other persons to first contact the school district’s special education director, who may be able to help resolve the issue. Sample complaint forms for use by parents, other entities or private school stakeholders are available on the MDE website.
When MDE receives a complaint, an investigator is assigned who reviews the written complaint to determine the issues to be investigated. The individual or entity that filed the complaint is contacted and the issues, claims

FFY 2015 Part C State Performance Plan (SPP)/Annual Performance Report (APR) 6
and facts are discussed. The department has 60 calendar days to fully investigate and resolve the complaint from the date the complaint is received in writing. If the LEA is found to be in violation and a corrective action is deemed necessary, a corrective action plan is developed and the responsible education agencies must complete the corrective action within the specified timeframe. Through active follow-up, MDE ensures that corrective action plans are appropriately implemented and individual correction occurs within one year.
Compliance and Assistance staff collaborates with other departmental divisions regarding the provision of early intervention and special education services.
Technical Assistance System
The mechanisms that the state has in place to ensure the timely delivery of high quality, evidenced-based technical assistance and support to early intervention service (EIS) programs.
The Early Childhood Special Education Team at the Minnesota Department of Education believes their role is to support local programs to "do it right and do it well" so that infants, toddlers and young children with disabilities and their families experience positive outcomes. "Doing it right" refers to those aspects of the work where there is a generally agreed-upon right way and wrong way. "Doing it well" refers to efforts to achieve high levels of quality including the use of evidence-based practices. Our technical assistance (TA) efforts are our efforts to help programs do it right.
The department uses a variety of mechanisms to provide technical assistance to leaders and providers within early childhood special education programs, which are responsible to deliver early intervention services. Our website is a constant source of information for families, administrators and direct service providers. MDE hosts two face-to-face opportunities annually to provide TA to local program leaders. Each fall, a three-day leadership conference is held in partnership with the Minnesota Division for Early Childhood of the Council for Exceptional Children. A one-day leadership forum is held each spring. Leaders from greater Minnesota have the option to participate in the forum virtually. A monthly call is held for program leaders focused almost exclusively on TA. The call takes place the first Wednesday of each month at 1 p.m. which coincides with our state's civil defense drills. Our local leaders know "if the siren is blowing" they should be on the call. Members of the ECSE team provide individualized TA over the phone or on-site as needed or requested by a local program. The department has established a team email box, [email protected], to make it easier for local programs to consistently receive a timely, high-quality answer to their technical questions. Kara Tempel, our Part C Coordinator, triages all messages to this mailbox, forwarding each message to the team member with the deepest knowledge in the needed subject.
Professional Development System
The mechanisms the state has in place to ensure that service providers are effectively providing services that improve results for infants and toddlers with disabilities and their families.

FFY 2015 Part C State Performance Plan (SPP)/Annual Performance Report (APR) 7
Strengthening our professional development system has been a team priority for the past seven years. During that time we have benefited considerably from participation in several important federal initiatives.
1. National Professional Development Center on Inclusion (NPDCI): Minnesota was one of four statesselected to work with experts from the University of North Carolina at Chapel Hill. This opportunityhelped us establish a cross-sector state leadership team, create regional cross-sector professionaldevelopment councils and launch regionalized professional development focused on selected evidence-based practices.
2. Technical Assistance Center on Social Emotional Intervention (TACSEI): Minnesota was one of four statesselected to be supported to implement the practices of the pyramid model. We started with threedemonstration sites and are now implementing in 53 local programs.
3. State Implementation and Scaling-up of Evidence-based Practices (SISEP): Minnesota was one of sixstates selected to participate in the initial cohort. Karen Blase has provided the ECSE team withconsiderable guidance and support in refining and refocusing our professional development system. Theframeworks of active implementation are foundational to our enhanced professional developmentsystem.
4. Early Childhood Technical Assistance Center: Minnesota was the first state selected to receive targetedtechnical assistance to implement the revised Recommended Practices developed by the Division ofEarly Childhood of the Council for Exceptional Children. Commonly referred to as DEC's RecommendedPractices, this work is focused on those practices that support child and family engagement inintervention.
5. Early Childhood Personnel Center (ECPC): Minnesota's Part C and 619 Coordinators have beensupported by ECPC related to their personal professional development. Minnesota is now receivingintensive technical support from ECPC to engage stakeholders in the development of ourComprehensive System of Personnel Development.
6. DaSY: Minnesota's ECSE team has participated in two cohorts sponsored by DaSY. The first is thePowerful 619 Data cohort which, because of our state's 0-5 system, has equally benefitted Part C. Wehave also participated in TA to better support local programs to use data.
Our professional development system is referred to as the Centers of Excellence for Young Children with Disabilities (CoE). The stated vision of the CoE is that early childhood professionals will have the knowledge, skills and supports necessary to be effective in their respective roles in order to increase the probability that young children with disabilities and their families achieve positive outcomes. Structured components included in the COE are:
• Professional development facilitators located within each region of the state. The 10.0 FTE of individuals in this role actively partner with local program leaders to identify opportunities to improve quality and serve as the external coach to those programs implementing one of the three evidence-based usable interventions formally promoted through the CoE.
• State leadership team of cross-sector state agency personnel, higher education faculty, parents, and other stakeholders in the system.
• Consistent use of the frameworks of active implementation.

FFY 2015 Part C State Performance Plan (SPP)/Annual Performance Report (APR) 8
• Three usable interventions that are evidence-informed. These include the Pyramid Model (TACSEI),Family-guided Routines-based Intervention (FGRBI), and the Classroom Engagement Model.
During FFY15 we continued to target discretionary federal funds to support local programs committing to the implementation of one of three usable interventions. The funds are available to selected programs over a five-year period to eliminate identified barriers to scaling and sustaining use of these practices.
Stakeholder Involvement
The mechanism for soliciting broad stakeholder input on targets in the SPP, including revisions to targets.
A workgroup was convened to review data and develop preliminary targets prior to our FFY 13 APR submission. That workgroup was comprised of volunteer members of Minnesota’s Interagency Coordinating Council (ICC) and state agency staff from the Minnesota Departments of Health and Education. That group reviewed historical performance and target data for each indicator and discussed past contextual factors that helped or hindered the state’s effort to meet or exceed each target. The group also identified factors that might similarly help or hinder the state’s efforts to make progress from baseline for each indicator. From those discussions, preliminary targets were set for each indicator for each year included within the State Performance Plan (SPP). Preliminary targets were shared with local program leaders during a monthly Leadership Call and with the ICC during the quarterly meeting of the ICC. Each target was finalized through a vote of the ICC during its quarterly meeting on January 8, 2015.
Performance and targets have been similarly reviewed by the ICC for each of the two subsequent APR submissions; most recently on January 13, 2017. No revisions to targets were considered.
Reporting to the Public
How and where the state reported to the public on the FFY 2014 performance of each EIS Program or Provider located in the state on the targets in the SPP/APR as soon as practicable, but no later than 120 days following the state’s submission of its FFY 2014 APR, as required by 34 CFR § 303.702(b)(1)(i)(A); and a description of where, on its website, a complete copy of the state’s SPP, including any revision if the state has revised the SPP that it submitted with its FFY 2014 APR in 2016, is available.
The department makes an annual determination on the performance of each Special Education Administrative Unit (SEAU) against specific criteria. MDE reviews all SEAU performance against selected targets in the Annual Performance Report (APR) and determines whether each SEAU met the requirements of Part C of the Individuals with Disabilities Education Act (IDEA).
The department publicly reports the performance of each SEAU by member district in its Data Center website under the Special Education District Profiles section. Performance on Part C indicators 1-8 are displayed on a data sheet that includes the program performance, the state rate and the state target. These district data profiles can be found on the MDE’s Data Center site (http://w20.education.state.mn.us/MDEAnalytics/Data.jsp).

FFY 2015 Part C State Performance Plan (SPP)/Annual Performance Report (APR) 9
A complete copy of Minnesota's SPP and current APR are located on MDE’s website on the landing page for the Governor's Interagency Coordinating Council (http://education.state.mn.us/MDE/about/adv/active/ICC/).
Indicator 1: Timely Provision of Services
Monitoring Priority: Early Intervention Services in Natural Environments
Compliance Indicator: Percent of infants and toddlers with IFSPs who receive their early intervention services on their IFSPs in a timely manner.
(20 U.S.C. 1416(a)(3)(A) and 1442)
Historical Data
Baseline Data: 2005
FFY 2004 2005 2006 2007 2008 2009 2010 2011 2012 2013 2014
Target No
data No
data 100% 100% 100% 100% 100% 100% 100% 100% 100%
Data No
data 91.00% 98.80% 98.00% 99.40% 98.80% 98.00% 99.75% 100% 100% 100%
FFY 2015 – FFY 2018 Targets
FFY 2015 2016 2017 2018
Target 100% 100% 100% 100%

FFY 2015 Part C State Performance Plan (SPP)/Annual Performance Report (APR) 10
FFY 2015 SPP/APR Data
Number of infants and toddlers with IFSPs who receive the early intervention services on their IFSPs in a timely manner
Total number of infants and toddlers with IFSPs
FFY 2014 Data*
FFY 2015 Target*
FFY 2015 Data
244 244 100% 100% 100%
Number of documented delays attributable to exceptional family circumstances: 0 (This number will be added to the "Number of infants and toddlers with IFSPs who receive their early intervention services on their IFSPs in a timely manner" field above to calculate the numerator for this indicator.)
What is the data provided for this indicator? State Monitoring
Describe the method used to select EIS programs for monitoring.
Data for this indicator has been collected through MDE’s Minnesota Continuous Improvement Monitoring Process (MNCIMP) web-based data system. The MNCIMP web-based data system is used in part for gathering data from record reviews completed as part of compliance monitoring. Compliance monitoring of Early Intervention (EI) programs occurs through the monitoring of the Local Education Agencies (LEAs) through special education administrative units (SEAUs) which has been scheduled on a five-year cycle, but in FFY 2015, MDE moved to a six-year monitoring cycle. In year one of the cycle, the SEAU conducts a self-review of records. In year two, the SEAU must demonstrate correction of any noncompliance identified in the self-review consistent with the requirements of OSEP Memo 09-02. In year three, MDE conducts an on-site review of the SEAU including a review of student records, facilities, and the SEAU’s Total Special Education System (TSES). In year four of the cycle, the SEAU must demonstrate correction of noncompliance identified during the MDE review and implement any corrective action, again consistent with the requirements of OSEP Memo 09-02. The fifth year of the cycle is used to verify results of the implemented corrective action plan. The sixth year of the cycle provides an additional year for SEAUs to implement corrective action and changes to their systems prior to the start of the new monitoring cycle and self-review of records.
As part of the record review, a computer-generated sample is used to determine the student records to be reviewed. Records are selected from the most recent SEAU enrollment data and are chosen in order to be accurately representative of the SEAU as a whole. Selection is based on a stratified random sampling with consideration given to race/ethnicity, age, gender, and primary disability of the student. During the record review, the most current Evaluation Report (ER), Individualized Education Program (IEP) or Individual Family Service Plan (IFSP) and corresponding due process documentation are monitored to determine that legal standards are met.

FFY 2015 Part C State Performance Plan (SPP)/Annual Performance Report (APR) 11
Data for this indicator are gathered from examining records of children receiving Part C services and determining whether the services were provided in a timely manner. The FFY 2015 data are based on MDE reviews and SEAU self-review of 38 SEAUs, comprised of 67 individual districts.
Correction of Findings of Noncompliance Identified in FFY 2014
Findings of Noncompliance Identified
Findings of Noncompliance Verified as Corrected Within One Year
Findings of Noncompliance Subsequently Corrected
Findings Not Yet Verified as Corrected
0 0 0 0
Indicator 2: Services in Natural Environments
Monitoring Priority: Early Intervention Services In Natural Environments
Results indicator: Percent of infants and toddlers with IFSPs who primarily receive early intervention services in the home or community-based settings.
(20 U.S.C. 1416(a)(3)(A) and 1442)
Historical Data
Baseline Data: 2005
FFY 2004 2005 2006 2007 2008 2009 2010 2011 2012 2013 2014
Target≥ No
data No
data 90.00% 91.00% 92.00% 92.50% 96.00% 95.00% 95.00% 95.00% 95.00%
Data No
data 90.30% 92.30% 93.80% 94.50% 95.50% 95.35% 95.90% 96.00% 96.61% 97.27%

FFY 2015 Part C State Performance Plan (SPP)/Annual Performance Report (APR) 12
FFY 2015 – FFY 2018 Targets
FFY 2015 2016 2017 2018
Target≥ 95.00% 95.00% 95.00% 95.00%
Prepopulated Data
Source Date Description Data Overwrite
Data
SY 2015-16 Child Count/Educational
Environment Data Groups July 14, 2016
Number of infants and toddlers with IFSPs who primarily receive early
intervention services in the home or community-based settings
5,534 No data
SY 2015-16 Child Count/Educational
Environment Data Groups July 14, 2016
Total number of infants and toddlers with IFSPs
5,524 No data
FFY 2015 SPP/APR Data
Number of infants and toddlers with IFSPs who primarily receive early intervention services in the home or community-based settings
Total number of infants and toddlers with IFSPs
FFY 2014 Data*
FFY 2015 Target*
FFY 2015 Data
5,534 5,524 97.27% 95.00% 96.92%
Indicator 3: Early Childhood Outcomes
Monitoring Priority: Early Intervention Services in Natural Environments
Results Indicator: Percent of infants and toddlers with IFSPs who demonstrate improved:
A. Positive social-emotional skills (including social relationships); B. Acquisition and use of knowledge of use and skills (including early language/communication); and C. Use of appropriate behaviors to meet their needs.

FFY 2015 Part C State Performance Plan (SPP)/Annual Performance Report (APR) 13
(20 U.S.C. 1416(a)(3)(A) and 1442)
Does your state's Part C eligibility criteria include infants and toddlers who are at risk of having substantial developmental delays (or “at-risk infants and toddlers”) under IDEA section 632(5)(B)(i)? No
Historical Data
No data prior to 2008
Results Indicator
Baseline Year
FFY 2008 2009 2010 2011 2012 2013 2014
A1 2013 Target≥ No data 66.00% 64.00% 65.00% 66.00% 54.13% 54.20%
A1 2013 Data 64.10% 63.80% 63.00% 58.80% 57.70% 54.13% 51.17%
A2 2013 Target≥ No data 41.00% 42.00% 42.50% 43.00% 49.82% 50.00%
A2 2013 Data 40.40% 42.20% 44.00% 48.30% 49.50% 49.82% 47.51%
B1 2013 Target≥ No data 70.00% 66.00% 67.00% 68.00% 60.20% 60.30%
B1 2013 Data 68.20% 65.10% 65.00% 62.50% 61.20% 60.20% 57.16%
B2 2013 Target≥ No data 42.00% 43.00% 43.50% 44.00% 44.11% 44.50%
B2 2013 Data 40.70% 42.20% 41.00% 43.40% 45.10% 44.11% 41.67%
C1 2013 Target≥ No data 70.00% 68.00% 69.00% 70.00% 61.91% 62.00%
C1 2013 Data 68.00% 67.30% 66.00% 64.00% 62.70% 61.91% 59.60%
C2 2013 Target≥ No data 44.00% 45.00% 45.50% 46.00% 51.26% 51.50%
C2 2013 Data 42.70% 44.20% 46.00% 49.20% 49.70% 51.26% 49.83%

FFY 2015 Part C State Performance Plan (SPP)/Annual Performance Report (APR) 14
FFY 2015-2018 Targets
FFY 2015 2016 2017 2018
Target A1 ≥ 54.30% 54.40% 54.50% 54.60%
Target A2 ≥ 51.00% 52.00% 53.00% 54.00%
Target B1 ≥ 60.40% 60.50% 60.60% 60.70%
Target B2 ≥ 45.00% 45.50% 46.50% 47.50%
Target C1 ≥ 62.10% 62.20% 62.30% 62.40%
Target C2 ≥ 52.00% 53.00% 54.00% 55.00%
FFY 2015 SPP/APR Data
Number of infants and toddlers with IFSPs assessed: 3,223
Outcome A: Positive social-emotional skills (including social relationships)
Progress Categories Number of Children
Percentage of Children
a. Infants and toddlers who did not improve functioning 37.00 1.15%
b. Infants and toddlers who improved functioning but not sufficient to move nearer to functioning comparable to same-aged peers
1117.00 34.66%
c. Infants and toddlers who improved functioning to a level nearer to same-aged peers but did not reach it
495.00 15.36%
d. Infants and toddlers who improved functioning to reach a level comparable to same-aged peers
700.00 21.72%

FFY 2015 Part C State Performance Plan (SPP)/Annual Performance Report (APR) 15
Progress Categories Number of Children
Percentage of Children
e. Infants and toddlers who maintained functioning at a level comparable to same-aged peers
874.00 27.12%
Summary Statement Numerator Denominator FFY 2014 Data*
FFY 2015 Target*
FFY 2015 Data
A1. Of those children who entered or exited the program below age expectations in Outcome A, the percent who substantially increased their rate of growth by the time they turned 3 years of age or exited the program (c+d)/(a+b+c+d).
1195.00 2349.00 51.17% 54.30% 50.87%
A2. The percent of infants and toddlers who were functioning within age expectations in Outcome A by the time they turned 3 years of age or exited the program (d+e)/(a+b+c+d+e).
1574.00 3223.00 47.51% 51.00% 48.84%
Outcome B: Acquisition and use of knowledge and skills (including early language/communication)
Progress Categories Number of Children
Percentage of Children
a. Infants and toddlers who did not improve functioning 32.00 0.99%
b. Infants and toddlers who improved functioning but not sufficient to move nearer to functioning comparable to same-aged peers
1116.00 34.63%

FFY 2015 Part C State Performance Plan (SPP)/Annual Performance Report (APR) 16
Progress Categories Number of Children
Percentage of Children
c. Infants and toddlers who improved functioning to a level nearer to same-aged peers but did not reach it
680.00 21.10%
d. Infants and toddlers who improved functioning to reach a level comparable to same-aged peers
862.00 26.75%
e. Infants and toddlers who maintained functioning at a level comparable to same-aged peers
533.00 16.54%
Summary Statement Numerator Denominator FFY 2014 Data*
FFY 2015 Target*
FFY 2015 Data
B1. Of those children who entered or exited the program below age expectations in Outcome A, the percent who substantially increased their rate of growth by the time they turned 3 years of age or exited the program (c+d)/(a+b+c+d).
1542.00 2690.00 57.16% 60.40% 57.32%
B2. The percent of infants and toddlers who were functioning within age expectations in Outcome A by the time they turned 3 years of age or exited the program (d+e)/(a+b+c+d+e).
1395.00 3223.00 41.67% 45.00% 43.28%

FFY 2015 Part C State Performance Plan (SPP)/Annual Performance Report (APR) 17
Outcome C: Use of appropriate behaviors to meet their needs
Progress Categories Number of Children
Percentage of Children
a. Infants and toddlers who did not improve functioning 24.00 0.74%
b. Infants and toddlers who improved functioning but not sufficient to move nearer to functioning comparable to same-aged peers
1027.00 31.86%
c. Infants and toddlers who improved functioning to a level nearer to same-aged peers but did not reach it
556.00 17.25%
d. Infants and toddlers who improved functioning to reach a level comparable to same-aged peers
912.00 28.30%
e. Infants and toddlers who maintained functioning at a level comparable to same-aged peers
704.00 21.84%
Summary Statement Numerator Denominator FFY 2014 Data*
FFY 2015 Target*
FFY 2015 Data
C1. Of those children who entered or exited the program below age expectations in Outcome A, the percent who substantially increased their rate of growth by the time they turned 3 years of age or exited the program (c+d)/(a+b+c+d).
1468.00 2519.00 59.60% 62.10% 58.28%
C2. The percent of infants and toddlers who were functioning within age expectations in Outcome A by the time they turned 3 years of age or exited the program (d+e)/(a+b+c+d+e).
1616.00 3223.00 49.83% 52.00% 50.14%

FFY 2015 Part C State Performance Plan (SPP)/Annual Performance Report (APR) 18
Explanation of C1 Slippage
We have made great strides in improving the quality of data reported using the child outcome summary form and process over the past ten years. Over the past two years, we have focused on supporting the home-based and center-based teams within local programs to reach consensus on the single rating that is used for Part C exit and Part B entrance. Ratings made based on child observations made only in the home tended to be higher than those made following a child's transition into a center-based program option. Now, many more teams have implemented a consensus-building process which has resulted in a slight deflation of exit ratings and data that we believe more accurately reflects the developmental status of exiting toddlers who are simultaneously entering Part B.
To further explain our slippage, the children in category b were carefully examined. More than 20 percent of the children included in category b entered Part C demonstrating age-expected skills. Of these 216 children, more than half entered early intervention before age 1. This identifiable pattern of infants entering Part C demonstrating age-expected skills and exiting demonstrating some, but not all age-expected skills is common. Minnesota will carefully monitor this phenomenon and consider a future revision to our targets.
Of the 1,027 children in category b, more than half entered and exited with the same numerical rating using the child outcome summary process. Only children who entered demonstrating some skills that were not age-expected can exit with the same rating and be in category b. It is reasonable to consider that children who entered on a delayed developmental trajectory would exit demonstrating skills even more discrepant from age-expectations had early intervention not supported them to increase their rate of development such that they maintained their rate of discrepancy as evidenced by the same rating at entrance and exit.
Minnesota's performance on this indicator would not have been designated as slippage if eight additional children out of the 1,027 in category b had increased their COSF ratings by one or had not decreased from their initial ratings of 6 or 7. Of the three child outcomes, this is the outcome on which the most children exit demonstrating age expected skills and the outcome on which the most children demonstrate greater than expected developmental gains.
Was sampling used? No
Did you use the Early Childhood Outcomes Center (ECO) Child Outcomes Summary Form (COSF)? Yes
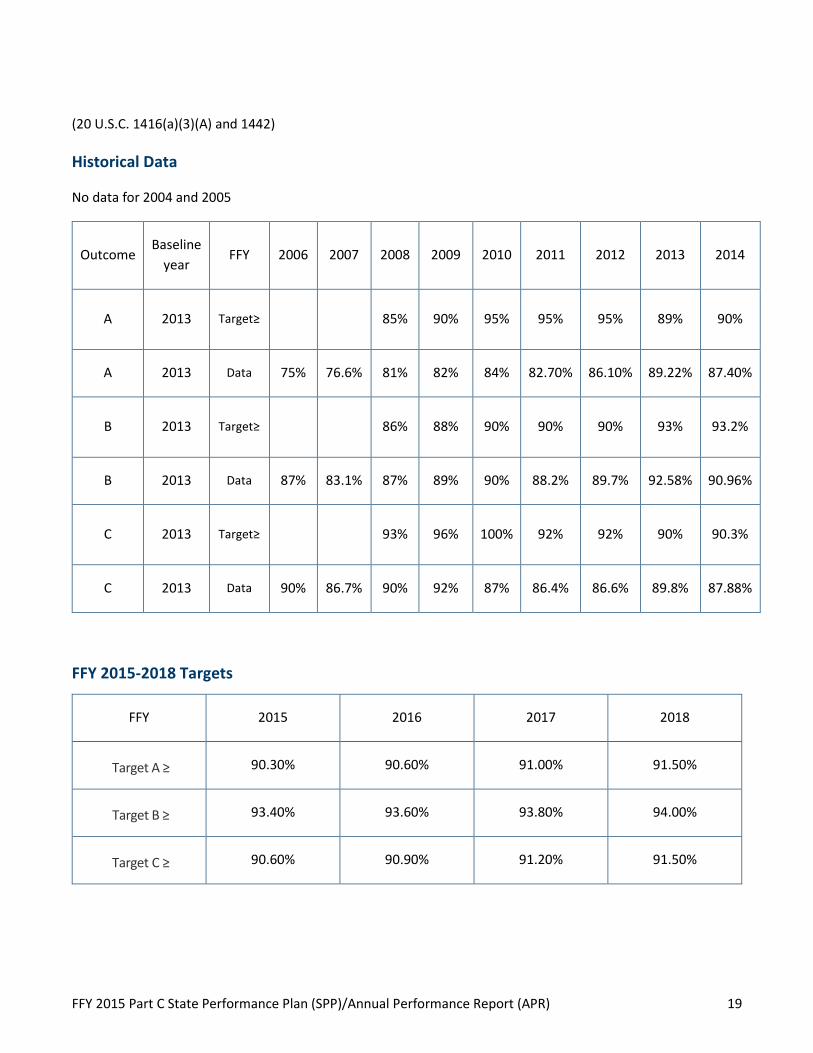
Indicator 4: Family Involvement
Monitoring Priority: Early Intervention Services in Natural Environments
Results indicator: Percent of families participating in Part C who report that early intervention services have helped the family:
A. Know their rights; B. Effectively communicate their children’s needs; and C. Help their children develop and learn.
FFY 2015 Part C State Performance Plan (SPP)/Annual Performance Report (APR) 19
(20 U.S.C. 1416(a)(3)(A) and 1442)
Historical Data
No data for 2004 and 2005
Outcome Baseline
year FFY 2006 2007 2008 2009 2010 2011 2012 2013 2014
A 2013 Target≥ No
data No data 85% 90% 95% 95% 95% 89% 90%
A 2013 Data 75% 76.6% 81% 82% 84% 82.70% 86.10% 89.22% 87.40%
B 2013 Target≥ No
data No data 86% 88% 90% 90% 90% 93% 93.2%
B 2013 Data 87% 83.1% 87% 89% 90% 88.2% 89.7% 92.58% 90.96%
C 2013 Target≥ No
data No data 93% 96% 100% 92% 92% 90% 90.3%
C 2013 Data 90% 86.7% 90% 92% 87% 86.4% 86.6% 89.8% 87.88%
FFY 2015-2018 Targets
FFY 2015 2016 2017 2018
Target A ≥ 90.30% 90.60% 91.00% 91.50%
Target B ≥ 93.40% 93.60% 93.80% 94.00%
Target C ≥ 90.60% 90.90% 91.20% 91.50%

FFY 2015 Part C State Performance Plan (SPP)/Annual Performance Report (APR) 20
FFY 2015 SPP/APR Data
Number of respondent families participating in Part C: 1025
A1. Number of respondent families participating in Part C who report that early intervention services have helped the family know their rights: 912
A2. Number of responses to the question of whether early intervention services have helped the family know their rights: 1,025
B1. Number of respondent families participating in Part C who report that early intervention services have helped the family effectively communicate their children's needs: 935
B2. Number of responses to the question of whether early intervention services have helped the family effectively communicate their children's needs: 1,024
C1. Number of respondent families participating in Part C who report that early intervention services have helped the family help their children develop and learn: 918
C2. Number of responses to the question of whether early intervention services have helped the family help their children develop and learn: 1,025
Family Outcome FFY 2014*
Data FFY 2015 Target*
FFY 2015 Data
A. Percent of families participating in Part C who report that early intervention services have helped the family know their rights
87.40% 90.30% 88.98%
B. Percent of families participating in Part C who report that early intervention services have helped the family effectively communicate their children's needs
90.96% 93.40% 91.31%
C. Percent of families participating in Part C who report that early intervention services have helped the family help their children develop and learn
87.88% 90.60% 89.56%
Describe how the state has ensured that any response data are valid and reliable, including how the data represent the demographics of the state:
Minnesota does not use sampling in collecting data or reporting this indicator. The pool of potential respondents exactly matches the demographics of families served by and exiting Part C. All families who have participated in early intervention services for six months or more are provided the Family Outcome Survey at the time of transition to Part B or to other community supports and services. The Family Outcome Survey has been translated into thirteen languages to limit barriers attributable to a family's home primary language being a

FFY 2015 Part C State Performance Plan (SPP)/Annual Performance Report (APR) 21
language other than English. The Minnesota Department of Education has provided local programs with procedures to use to obtain survey data from families who do not read or whose primary language is not a written language.
During FFY15 many local programs continued to implement special efforts to increase response rates started during FFY14. In spite of those efforts, the number of family outcome surveys returned by families decreased slightly from 1040 in FFY14 to 1,025 (31.9% of potential respondents) this year. This still represents a considerable increase from 864 surveys returned in FFY13.
Minnesota's received responses were analyzed using multiple demographic variables and by employing the Representedness Calculator provided by the Early Childhood Technical Assistance Center (ECTA) and DaSY. Minnesota acknowledges that families who are Black, Hispanic, Multi-racial or American Indian are under-represented among the returned surveys. Families who speak a language other than English or who were experiencing poverty were also under-represented.
When the responses of all groups were analyzed using ECTA's Meaningful Differences calculator, there were no meaningful differences in the benefit attributed to early intervention across groups when compared to the overall state rate of performance.
Was sampling used? No
Was a collection tool used? No
Is it a new or revised collection tool? No
Does the date accurately represent the demographics of the state? No
Additional information about this indicator:
The department has worked diligently to support local programs to improve their response rates and has implemented strategies to improve overall response rates and increase the extent to which our respondents represent the demographics of our state and of each program. Most specifically, surveys have been translated into 13 languages. Our distribution process includes steps to be taken by a local program when a parent is a non-reader. During the 2017-2018 school year, we will be working to create an online version of the Family Outcomes Survey to further increase our response rate and representedness of our data. We plan to use a "mobile first" approach so that a service coordinator will be able to pull up the survey, in the home language of each exiting family, on an Ipad or similar device. Or, a family will be provided a "token" that will direct them to the survey to be completed at their convenience. The department will carefully track the extent to which these steps positively impact our response rates and the representation of all groups within our respondent group.
OSEP Response:
The state reported that the data for this indicator were collected from a response group that was not representative of the population. OSEP notes that the state included strategies and/or improvement activities to address this issue in the future.

FFY 2015 Part C State Performance Plan (SPP)/Annual Performance Report (APR) 22
Indicator 5: Child Find (Birth to One)
Monitoring Priority: Effective General Supervision Part C/Child Find
Results indicator: Percent of infants and toddlers birth to 1 with IFSPs compared to national data.
(20 U.S.C. 1416(a)(3)(B) and 1442)
Historical Data
Baseline Data: 2005
FFY 2005 2006 2007 2008 2009 2010 2011 2012 2013 2014
Target ≥ Prior to Baseline
0.55% 0.60% 0.80% 0.85% 0.85% 0.88% 0.90% 0.98% 1.00%
Data 0.46% 0.63% 0.62% 0.79% 0.74% 0.91% 0.87% 0.98% 0.97% 1.06%
FFY 2015-FFY 2018 Targets
FFY 2015 2016 2017 2018
Target ≥ 1.05% 1.10% 1.15% 1.20%
Prepopulated Data
Source Date Description Data Overwrite Data
SY 2015-16 Child Count/Educational Environment Data
Groups
July 14, 2016 Number of infants and toddlers birth
to 1 with IFSPs 666 null

FFY 2015 Part C State Performance Plan (SPP)/Annual Performance Report (APR) 23
Source Date Description Data Overwrite Data
U.S. Census Annual State Resident
Population Estimates April 1,
2010, to July 1, 2015
June 30, 2016 Population of infants and toddlers
birth to 1 70,248 null
FFY 2015 SPP/APR Data
Number of infants and toddlers birth to 1 with IFSPs
Population of infants and toddlers birth to 1
FFY 2014 Data* FFY 2015 Target* FFY 2015 Data
666 70,248 1.06% 1.05% 0.95%
Explanation of Slippage
Minnesota has demonstrated almost a decade of continuous improvement in effectively identifying, evaluating and serving infants and toddlers with disabilities birth to age 1. We were therefore surprised at the decrease in the number of infants served on December 1, 2015. Our commitment to better understand our performance drove multiple analyses of children served by each of the following attributes of eligible infants or their families, looking for meaningful differences from prior-year performance:
• race and ethnicity• home primary language• economic status• primary disability category• resident school district
These analyses are graphically displayed on the document attached to this indicator.
We also considered the number of overall referrals to our system, the number of evaluations conducted and the number and proportion of initial Part C evaluations that resulted in a finding of eligibility compared to similar data in FFY 2014. No significant differences were identified. What we discovered is a small increase in the number of infants served by resident school districts and a small decrease in the number served across slightly more programs. Only one program demonstrated a decrease in the number of infants served of 10 or more and that program was Anoka-Hennepin, which is the state's largest school district.

FFY 2015 Part C State Performance Plan (SPP)/Annual Performance Report (APR) 24
We engaged stakeholders to offer hypotheses about slippage on this indicator by posing the question during our monthly call with local program leaders, as well as during the January 13, 2017, ICC meeting. It was hypothesized that the state's use of the data base of established conditions, developed and published by Early Intervention Colorado, resulted in greater understanding by local programs of the need to conduct a comprehensive evaluation of infants referred due to prenatal exposure to some controlled substances. We learned that many teams would have considered such exposure to be an established condition.
Not knowing whether this decrease was an anomaly, a result of a change in guidance or the beginning of a trend, we were pleased to learn that our December 1, 2016, child count showed an increase in the number of infants and toddlers birth to age 1 to a level almost equal to that reported in our FFY 14 APR.
Indicator 6: Child Find (Birth to Three)
Monitoring Priority: Effective General Supervision Part C/Child Find
Results indicator: Percent of infants and toddlers birth to 3 with IFSPs compared to national data.
(20 U.S.C. 1416(a)(3)(B) and 1442)
Historical Data
Baseline Data: 2005
FFY 2005 2006 2007 2008 2009 2010 2011 2012 2013 2014
Target ≥ Prior to Baseline
1.70% 1.90% 2.10% 2.25% 2.30% 2.35% 2.40% 2.50% 2.53%
Data 1.56% 1.70% 1.83% 2.10% 2.15% 2.37% 2.45% 2.44% 2.49% 2.61%
FFY 2015-FFY 2018 Targets
FFY 2015 2016 2017 2018
Target ≥ 2.60% 2.68% 2.75% 2.82%

FFY 2015 Part C State Performance Plan (SPP)/Annual Performance Report (APR) 25
Prepopulated Data
Source Date Description Data Overwrite Data
SY 2015-16 Child Count/Educational Environment Data
Groups
July 14, 2016 Number of infants and toddlers birth
to 3 with IFSPs 5,524 No data
U.S. Census Annual State Resident
Population Estimates April 1,
2010, to July 1, 2015
June 30, 2016 Population of infants and toddlers
birth to 3 210,833 No data
FFY 2015 SPP/APR Data
Number of infants and toddlers birth to 3 with IFSPs
Population of infants and toddlers birth to 3
FFY 2014 Data* FFY 2015 Target* FFY 2015 Data
5,524 210,833 2.61% 2.60% 2.62%
Indicator 7: 45-Day Timeline
Monitoring Priority: Effective General Supervision Part C/Child Find
Compliance indicator: Percent of eligible infants and toddlers with IFSPs for whom an initial evaluation and initial assessment and an initial IFSP meeting were conducted within Part C’s 45-day timeline.
(20 U.S.C. 1416(a)(3)(B) and 1442)
Historical Data
Baseline Data: 2005

FFY 2015 Part C State Performance Plan (SPP)/Annual Performance Report (APR) 26
FFY 2005 2006 2007 2008 2009 2010 2011 2012 2013 2014
Target Prior to Baseline
100% 100% 100% 100% 100% 100% 100% 100% 100%
Data 83.40% 86.30% 83.90% 83.40% 77.30% 90.70% 93.60% 91.10% 97.85% 98.64%
FFY 2015-FFY 2018 Targets
FFY 2015 2016 2017 2018
Target 100% 100% 100% 100%
FFY 2015 SPP/APR Data
Number of eligible infants and toddlers with IFSPs for whom an initial evaluation
and assessment and an initial IFSP meeting was conducted within Part C’s
45-day timeline
Number of eligible infants and toddlers evaluated and
assessed for whom an initial IFSP meeting was required to
be conducted
FFY 2014 Data*
FFY 2015 Target*
FFY 2015 Data
184 217 98.64% 100% 97.70%
Number of documented delays attributable to exceptional family circumstances: 28
This number will be added to the "Number of eligible infants and toddlers with IFSPs for whom an initial evaluation and assessment and an initial IFSP meeting was conducted within Part C's 45-day timeline" field above to calculate the numerator for this indicator.
What is the source of the data provided for this indicator? State Monitoring
Describe the method used to select EIS programs for monitoring.
Data for this indicator has been collected through MDE’s Minnesota Continuous Improvement Monitoring Process (MNCIMP) web-based data system. The MNCIMP web-based data system is used in part for gathering data from record reviews completed as part of compliance monitoring. Compliance monitoring of Early Intervention (EI) programs occurs through the monitoring of the Local Education Agencies (LEAs) through special education administrative units (SEAUs) which has been scheduled on a five-year cycle, however in FFY 2015,

FFY 2015 Part C State Performance Plan (SPP)/Annual Performance Report (APR) 27
MDE moved to a six-year monitoring cycle. In year one of the cycle, the SEAU conducts a self-review of records. In year two, the SEAU must demonstrate correction of any noncompliance identified in the self-review consistent with the requirements of OSEP Memo 09-02. In year three, MDE conducts an on-site review of the SEAU including a review of student records, facilities, and the SEAU’s Total Special Education System (TSES). In year four of the cycle, the SEAU must demonstrate correction of noncompliance identified during the MDE review and implement any corrective action, again consistent with the requirements of OSEP Memo 09-02. The fifth year of the cycle is used to verify results of the implemented corrective action plan. The sixth year of the cycle provides an additional year for SEAUs to implement corrective action and changes to their systems prior to the start of the new monitoring cycle and self-review of records.
As part of the record review, a computer-generated sample is used to determine the student records to be reviewed. Records are selected from the most recent SEAU enrollment data and are chosen in order to be accurately representative of the SEAU as a whole. Selection is based on a stratified random sampling with consideration given to race/ethnicity, age, gender, and primary disability of the student. During the record review, the most current Evaluation Report (ER), Individualized Education Program (IEP) or Individual Family Service Plan (IFSP) and corresponding due process documentation are monitored to determine that legal standards are met.
Data for this indicator are gathered from examining records of children receiving Part C services and determining whether the services were provided in a timely manner. The FFY 2015 data are based on MDE reviews and SEAU self-review of 38 SEAUs, comprised of 63 individual districts.
Correction of Findings of Noncompliance Identified in FFY 2014
Findings of Noncompliance
Identified
Findings of Noncompliance Verified as Corrected Within One
Year
Findings of Noncompliance
Subsequently Corrected
Findings Not Yet Verified as Corrected
4 4 0 0

FFY 2015 Part C State Performance Plan (SPP)/Annual Performance Report (APR) 28
FFY 2014 Findings of Noncompliance Verified as Corrected
Describe how the state verified that the source of noncompliance is correctly implementing the regulatory requirements:
SEAUs with identified noncompliance are required to develop Corrective Action Plans (CAPs), with a subsequent review of student records, in order to demonstrate the SEAU is now correctly implementing 34 CFR § 303.310. The SEAUs must track timelines for a minimum of three months to verify the SEAU is in 100 percent compliance with the timeline. The SEAUs submit Letters of Assurance along with information on the student records that were reviewed, assuring that the SEAU is now in compliance. MDE has reviewed additional data from subsequent student record reviews conducted as part of an on-site review by MDE or by the SEAU as part of a Corrective Action Plan to verify that the SEAUs are now correctly implementing 34 CFR § 303.310. All SEAUs were able to successfully complete the Corrective Action Plans within the required one-year timeframe.
Describe how the state verified that each individual case of noncompliance was corrected:
All record review data from FFY 2014 was collected through MDE’s MNCIMP web-based data system. Once noncompliance is identified, it is tracked through the same web-based data system which includes a compliance tracking system. For post-referral timelines, when record reviews are completed and data entered into the MNCIMP system, data is requested detailing the date of the referral, the date the evaluation and assessments were completed, and the date of the IFSP meeting. This allows MDE to verify that the evaluations and assessments and IFSP meetings have been completed, although they may have been late. If the date the evaluations and assessments were completed or the date of the IFSP meeting is missing, MDE requires the SEAU to submit the completed IFSP to demonstrate the evaluation and assessments and IFSP meeting has been completed, although late. If the student is no longer within the jurisdiction of the SEAU, the SEAU must submit to MDE the reason (moved, for example) and the date of the occurrence to release the SEAU from further demonstration of correction for that specific student. Based on a review of the data, MDE verified all of the evaluations and assessments and IFSP meetings had been completed and that each SEAU with noncompliance reflected in the data the state reported for this indicator had completed the evaluations and assessments and IFSP meetings, although late, for any child whose initial evaluation and assessment and IFSP meeting was not timely unless the child is no longer within the jurisdiction of the SEAU, consistent with OSEP Memo 09-02. All correction of individual student record noncompliance was completed within the one-year timeframe.
OSEP Response
Because the state reported less than 100 percent compliance for FFY 2015, the state must report on the status of correction of noncompliance identified in FFY 2015 for this indicator. When reporting on the correction of noncompliance, the state must report, in the FFY 2016 SPP/APR, that it has verified that each EIS program or provider with noncompliance identified in FFY 2015 for this indicator: (1) is correctly implementing the specific regulatory requirements (i.e., achieved 100 percent compliance) based on a review of updated data such as data subsequently collected through on-site monitoring or a State data system; and, (2) has corrected each individual case of noncompliance, unless the child is no longer within the jurisdiction of the EIS program or provider,
FFY 2015 Part C State Performance Plan (SPP)/Annual Performance Report (APR) 29
consistent with OSEP Memo 09-02. In the FFY 2016 SPP/APR, the state must describe the specific actions that were taken to verify the correction.
If the state did not identify any findings of noncompliance in FFY 2015, although its FFY 2015 data reflect less than 100 percent compliance, provide an explanation of why the state did not identify any findings of noncompliance in FFY 2015.
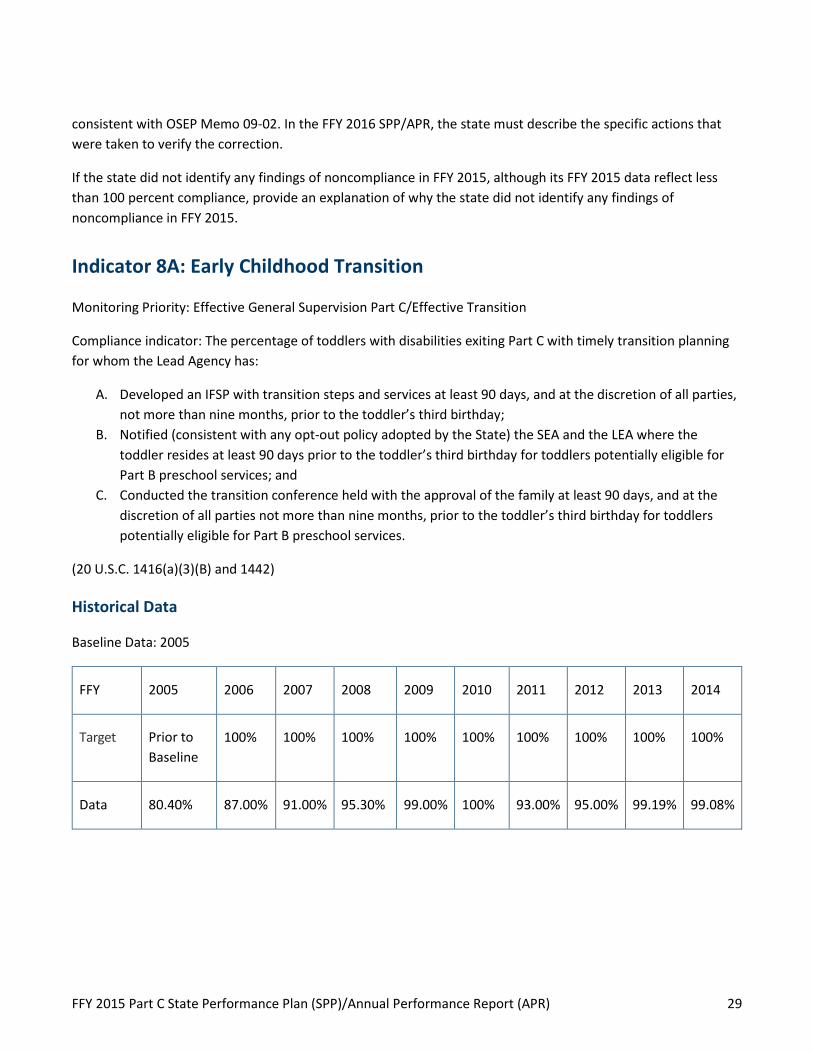
Indicator 8A: Early Childhood Transition
Monitoring Priority: Effective General Supervision Part C/Effective Transition
Compliance indicator: The percentage of toddlers with disabilities exiting Part C with timely transition planning for whom the Lead Agency has:
A. Developed an IFSP with transition steps and services at least 90 days, and at the discretion of all parties, not more than nine months, prior to the toddler’s third birthday;
B. Notified (consistent with any opt-out policy adopted by the State) the SEA and the LEA where the toddler resides at least 90 days prior to the toddler’s third birthday for toddlers potentially eligible for Part B preschool services; and
C. Conducted the transition conference held with the approval of the family at least 90 days, and at the discretion of all parties not more than nine months, prior to the toddler’s third birthday for toddlers potentially eligible for Part B preschool services.
(20 U.S.C. 1416(a)(3)(B) and 1442)
Historical Data
Baseline Data: 2005
FFY 2005 2006 2007 2008 2009 2010 2011 2012 2013 2014
Target Prior to Baseline
100% 100% 100% 100% 100% 100% 100% 100% 100%
Data 80.40% 87.00% 91.00% 95.30% 99.00% 100% 93.00% 95.00% 99.19% 99.08%

FFY 2015 Part C State Performance Plan (SPP)/Annual Performance Report (APR) 30
FFY 2015-FFY 2018 Targets
FFY 2015 2016 2017 2018
Target 100% 100% 100% 100%
FFY 2015 SPP/APR Data
Data include only those toddlers with disabilities exiting Part C with timely transition planning for whom the Lead Agency has developed an IFSP with transition steps and services at least 90 days, and at the discretion of all parties not more than nine months, prior to the toddler’s third birthday? Yes
Number of children exiting Part C who have an IFSP with transition
steps and services
Number of toddlers with disabilities exiting Part C
FFY 2014 Data*
FFY 2015 Target*
FFY 2015 Data
96 96 99.08% 100% 100%
Number of documented delays attributable to exceptional family circumstances: 0
This number will be added to the "Number of children exiting Part C who have an IFSP with transition steps and services" field to calculate the numerator for this indicator.
What is the source of the data provided for this indicator? State monitoring
Describe the method used to select EIS programs for monitoring.
Data for this indicator has been collected through MDE’s Minnesota Continuous Improvement Monitoring Process (MNCIMP) web-based data system. The MNCIMP web-based data system is used in part for gathering data from record reviews completed as part of compliance monitoring. Compliance monitoring of Early Intervention (EI) programs occurs through the monitoring of the Local Education Agencies (LEAs) through special education administrative units (SEAUs) which has been scheduled on a five-year cycle, but in FFY 2015 MDE moved to a six-year monitoring cycle. In year one of the cycle, the SEAU conducts a self-review of records. In year two, the SEAU must demonstrate correction of any noncompliance identified in the self-review consistent with the requirements of OSEP Memo 09-02. In year three, MDE conducts an on-site review of the SEAU including a review of student records, facilities, and the SEAU’s Total Special Education System (TSES). In year four of the cycle, the SEAU must demonstrate correction of noncompliance identified during the MDE review and implement any corrective action, again consistent with the requirements of OSEP Memo 09-02. The fifth year of the cycle is used to verify results of the implemented corrective action plan. The sixth year of the cycle

FFY 2015 Part C State Performance Plan (SPP)/Annual Performance Report (APR) 31
provides an additional year for SEAUs to implement corrective action and changes to their systems prior to the start of the new monitoring cycle and self-review of records.
As part of the record review, a computer-generated sample is used to determine the student records to be reviewed. Records are selected from the most recent SEAU enrollment data and are chosen in order to be accurately representative of the SEAU as a whole. Selection is based on a stratified random sampling with consideration given to race/ethnicity, age, gender, and primary disability of the student. During the record review, the most current Evaluation Report (ER), Individualized Education Program (IEP) or Individual Family Service Plan (IFSP) and corresponding due process documentation are monitored to determine that legal standards are met.
Data for this indicator are gathered from examining records of children exiting Part C services and determining whether the IFSPs included transition steps and services. The FFY 2015 data are based on MDE reviews and SEAU self-review of 38 SEAUs, comprised of 67 individual districts.
Correction of Findings of Noncompliance Identified in FFY 2014
Findings of Noncompliance
Identified
Findings of Noncompliance Verified as Corrected Within One
Year
Findings of Noncompliance
Subsequently Corrected
Findings Not Yet Verified as Corrected
9 9 0 0
FFY 2014 Findings of Noncompliance Verified as Corrected
Describe how the state verified that the source of noncompliance is correctly implementing the regulatory requirements:
SEAUs with identified noncompliance are required to develop Corrective Action Plans (CAPs), with a subsequent review of student records, in order to demonstrate the SEAU is now correctly implementing 34 CFR § 303.344. The SEAUs must review additional records to verify that each record includes an IFSP with appropriate transition steps and services. The SEAUs submit Letters of Assurance along with information on the student records that were reviewed, assuring that the SEAU is now in compliance. The department has reviewed additional data from subsequent student record reviews conducted as part of an on-site review by MDE or by the SEAU as part of a Corrective Action Plan to verify that the SEAUs are now correctly implementing 34 CFR § 303.344.
Describe how the state verified that each individual case of noncompliance was corrected:
All record review data from FFY 2014 was collected through MDE’s MNCIMP web-based data system. Once noncompliance is identified, it is tracked through the same web-based data system which includes a compliance tracking system. For correction of noncompliance, the SEAUs must submit documentation to MDE as

FFY 2015 Part C State Performance Plan (SPP)/Annual Performance Report (APR) 32
demonstration of correction. Resubmission is required until the SEAU can demonstrate correction. If the student is no longer within the jurisdiction of the SEAU, the SEAU must submit to MDE the reason (moved, for example) and the date of the occurrence to release the SEAU from further demonstration of correction for that specific student. Based on a review of the data, MDE verified all of the IFSPs included the required transition steps and services and that each SEAU with noncompliance reflected in the data the state reported for this indicator had corrected all identified noncompliance, unless the child is no longer within the jurisdiction of the SEAU, consistent with OSEP Memo 09-02. All SEAUs were able to demonstrate correction of the identified noncompliance within the one year timeframe.
Indicator 8B: Early Childhood Transition
Monitoring Priority: Effective General Supervision Part C / Effective Transition
Compliance indicator: The percentage of toddlers with disabilities exiting Part C with timely transition planning for whom the Lead Agency has:
A. Developed an IFSP with transition steps and services at least 90 days, and at the discretion of all parties, not more than nine months, prior to the toddler’s third birthday;
B. Notified (consistent with any opt-out policy adopted by the state) the SEA and the LEA where the toddler resides at least 90 days prior to the toddler’s third birthday for toddlers potentially eligible for Part B preschool services; and,
C. Conducted the transition conference held with the approval of the family at least 90 days, and at the discretion of all parties not more than nine months, prior to the toddler’s third birthday for toddlers potentially eligible for Part B preschool services.
(20 U.S.C. 1416(a)(3)(B) and 1442)
Historical Data
Baseline Data: 2005
FFY 2005 2006 2007 2008 2009 2010 2011 2012 2013 2014
Target Prior to Baseline
100% 100% 100% 100% 100% 100% 100% 100% 100%
Data 100% 100% 100% 100% 100% 100% 100% 100% 100% 100%

FFY 2015 Part C State Performance Plan (SPP)/Annual Performance Report (APR) 33
FFY 2015-FFY 2018 Targets
FFY 2015 2016 2017 2018
Target 100% 100% 100% 100%
FFY 2015 SPP/APR Data
Data include notification to both the SEA and LEA? Yes
Number of toddlers with disabilities exiting Part C where notification to
the SEA and LEA occurred at least 90 days prior to their third birthday for toddlers potentially eligible for Part
B preschool services
Number of toddlers with disabilities exiting Part C who
were potentially eligible for Part B
FFY 2014 Data*
FFY 2015 Target*
FFY 2015 Data
77 77 100% 100% 100%
Number of parents who opted out: 0
This number will be subtracted from the "Number of toddlers with disabilities exiting Part C who were potentially eligible for Part B" field to calculate the denominator for this indicator.
Describe the method used to collect these data
The department includes the following among the "statement of assurances" required to be signed annually by local Early Intervention Program administrators prior to receipt of Part C funds. This has been accepted by OSEP as a component of Minnesota's Part C Application.
The state confirms notification of LEAs by local early intervention programs as required by the annual statement of assurances.
"The Part C program must provide notification to the State Education Agency (SEA) and the appropriate Local Education Agency (LEA) no fewer than 90 days prior to the child’s third birthday, for those children who are potentially eligible for Part B services. 34 CFR §303.209(b)(1)-(2) However, per MDE policy, this notification only needs to be provided to the LEA, who is acting as an agent of the SEA for this specific purpose, to satisfy the notification requirements."
Do you have a written opt-out policy? No
What is the source of the data provided for this indicator? State monitoring

FFY 2015 Part C State Performance Plan (SPP)/Annual Performance Report (APR) 34
Describe the method used to select EIS programs for monitoring
Data for this indicator has been collected through MDE’s Minnesota Continuous Improvement Monitoring Process (MNCIMP) web-based data system. The MNCIMP web-based data system is used in part for gathering data from record reviews completed as part of compliance monitoring. Compliance monitoring of Early Intervention (EI) programs occurs through the monitoring of the Local Education Agencies (LEAs) through special education administrative units (SEAUs) which has been scheduled on a five-year cycle, but in FFY 2015 MDE moved to a six-year monitoring cycle. In year one of the cycle, the SEAU conducts a self-review of records. In year two, the SEAU must demonstrate correction of any noncompliance identified in the self-review consistent with the requirements of OSEP Memo 09-02. In year three, MDE conducts an on-site review of the SEAU including a review of student records, facilities, and the SEAU’s Total Special Education System (TSES). In year four of the cycle, the SEAU must demonstrate correction of noncompliance identified during the MDE review and implement any corrective action, again consistent with the requirements of OSEP Memo 09-02. The fifth year of the cycle is used to verify results of the implemented corrective action plan. The sixth year of the cycle provides an additional year for SEAUs to implement corrective action and changes to their systems prior to the start of the new monitoring cycle and self-review of records.
As part of the record review, a computer-generated sample is used to determine the student records to be reviewed. Records are selected from the most recent SEAU enrollment data and are chosen in order to be accurately representative of the SEAU as a whole. Selection is based on a stratified random sampling with consideration given to race/ethnicity, age, gender, and primary disability of the student. During the record review, the most current Evaluation Report (ER), Individualized Education Program (IEP) or Individual Family Service Plan (IFSP) and corresponding due process documentation are monitored to determine that legal standards are met.
Data for this indicator are gathered from examining records of children exiting Part C services. The FFY 2015 data are based on MDE reviews and SEAU self-review of 38 SEAUs, comprised of 67 individual districts. Since Education is the lead agency for both Part C and Part B services, the notification of the LEA is a seamless process.
Correction of Findings of Noncompliance Identified in FFY 2014
Findings of Noncompliance
Identified
Findings of Noncompliance Verified as Corrected Within One
Year
Findings of Noncompliance
Subsequently Corrected
Findings Not Yet Verified as Corrected
0 0 0 0
FFY 2015 Part C State Performance Plan (SPP)/Annual Performance Report (APR) 35
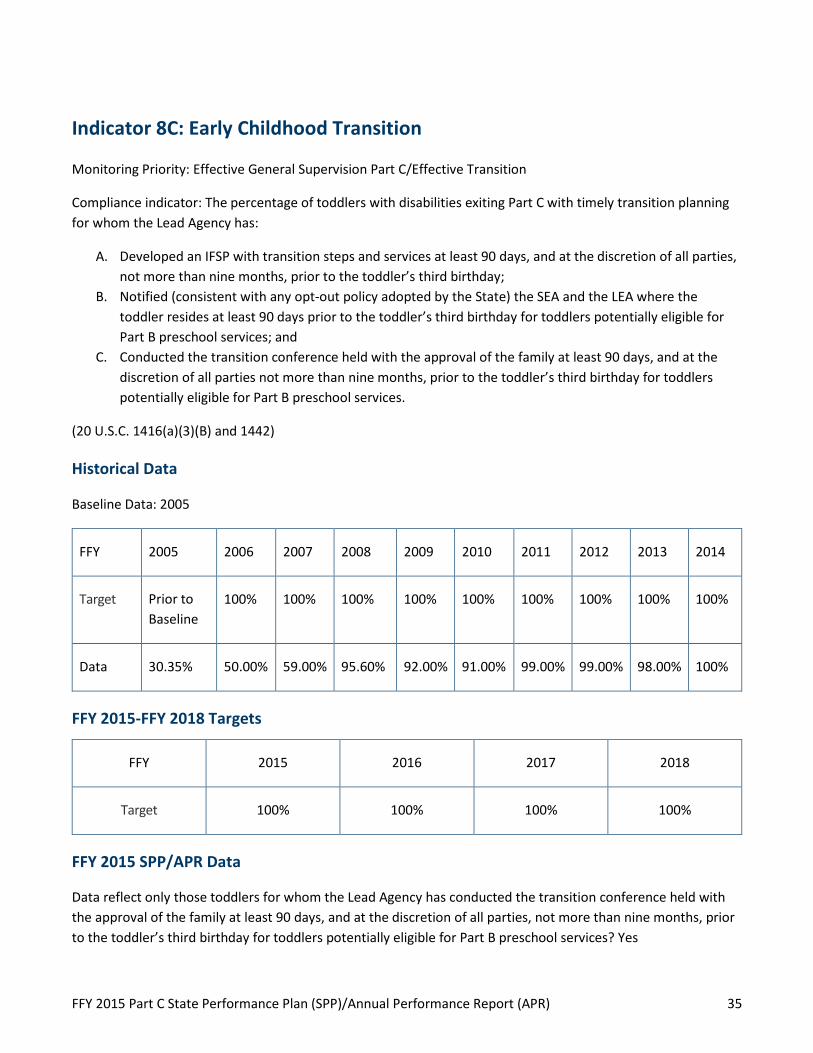
Indicator 8C: Early Childhood Transition
Monitoring Priority: Effective General Supervision Part C/Effective Transition
Compliance indicator: The percentage of toddlers with disabilities exiting Part C with timely transition planning for whom the Lead Agency has:
A. Developed an IFSP with transition steps and services at least 90 days, and at the discretion of all parties, not more than nine months, prior to the toddler’s third birthday;
B. Notified (consistent with any opt-out policy adopted by the State) the SEA and the LEA where the toddler resides at least 90 days prior to the toddler’s third birthday for toddlers potentially eligible for Part B preschool services; and
C. Conducted the transition conference held with the approval of the family at least 90 days, and at the discretion of all parties not more than nine months, prior to the toddler’s third birthday for toddlers potentially eligible for Part B preschool services.
(20 U.S.C. 1416(a)(3)(B) and 1442)
Historical Data
Baseline Data: 2005
FFY 2005 2006 2007 2008 2009 2010 2011 2012 2013 2014
Target Prior to Baseline
100% 100% 100% 100% 100% 100% 100% 100% 100%
Data 30.35% 50.00% 59.00% 95.60% 92.00% 91.00% 99.00% 99.00% 98.00% 100%
FFY 2015-FFY 2018 Targets
FFY 2015 2016 2017 2018
Target 100% 100% 100% 100%
FFY 2015 SPP/APR Data
Data reflect only those toddlers for whom the Lead Agency has conducted the transition conference held with the approval of the family at least 90 days, and at the discretion of all parties, not more than nine months, prior to the toddler’s third birthday for toddlers potentially eligible for Part B preschool services? Yes

FFY 2015 Part C State Performance Plan (SPP)/Annual Performance Report (APR) 36
Number of toddlers with disabilities exiting Part C where the transition
conference occurred at least 90 days, and at the discretion of all
parties at least nine months, prior to the toddler’s third birthday for
toddlers potentially eligible for Part B
Number of toddlers with disabilities exiting Part C who
were potentially eligible for Part B
FFY 2014 Data*
FFY 2015 Target*
FFY 2015 Data
77 77 100% 100% 100%
Number of toddlers for whom the parent did not provide approval for the transition conference: 0
This number will be subtracted from the "Number of toddlers with disabilities exiting Part C who were potentially eligible for Part B" field to calculate the denominator for this indicator.
Number of documented delays attributable to exceptional family circumstances: 0
This number will be added to the "Number of toddlers with disabilities exiting Part C where the transition conference occurred at least 90 days, and at the discretion of all parties at least nine months prior to the toddler’s third birthday for toddlers potentially eligible for Part B" field to calculate the numerator for this indicator.
What is the source of the data provided for this indicator? State monitoring
Describe the method used to select EIS programs for monitoring
Data for this indicator has been collected through MDE’s Minnesota Continuous Improvement Monitoring Process (MNCIMP) web-based data system. The MNCIMP web-based data system is used in part for gathering data from record reviews completed as part of compliance monitoring. Compliance monitoring of Early Intervention (EI) programs occurs through the monitoring of the Local Education Agencies (LEAs) through special education administrative units (SEAUs) which has been scheduled on a five-year cycle, but in FFY 2015 MDE moved to a six-year monitoring cycle. In year one of the cycle, the SEAU conducts a self-review of records. In year two, the SEAU must demonstrate correction of any noncompliance identified in the self-review consistent with the requirements of OSEP Memo 09-02. In year three, MDE conducts an on-site review of the SEAU including a review of student records, facilities, and the SEAU’s Total Special Education System (TSES). In year four of the cycle, the SEAU must demonstrate correction of noncompliance identified during the MDE review and implement any corrective action, again consistent with the requirements of OSEP Memo 09-02. The fifth year of the cycle is used to verify results of the implemented corrective action plan. The sixth year of the cycle provides an additional year for SEAUs to implement corrective action and changes to their systems prior to the start of the new monitoring cycle and self-review of records.

FFY 2015 Part C State Performance Plan (SPP)/Annual Performance Report (APR) 37
As part of the record review, a computer-generated sample is used to determine the student records to be reviewed. Records are selected from the most recent SEAU enrollment data and are chosen in order to be accurately representative of the SEAU as a whole. Selection is based on a stratified random sampling with consideration given to race/ethnicity, age, gender, and primary disability of the student. During the record review, the most current Evaluation Report (ER), Individualized Education Program (IEP) or Individual Family Service Plan (IFSP) and corresponding due process documentation are monitored to determine that legal standards are met.
Data for this indicator are gathered from examining records of children exiting Part C services and determining whether a transition conference was held during the required timeframe for toddlers potentially eligible for Part B. The FFY 2015 data are based on MDE reviews and SEAU self-review of 38 SEAUs, comprised of 67 individual districts.
Correction of Findings of Noncompliance Identified in FFY 2014
Findings of Noncompliance
Identified
Findings of Noncompliance Verified as Corrected Within One
Year
Findings of Noncompliance
Subsequently Corrected
Findings Not Yet Verified as Corrected
0 0 0 0
Indicator 9: Resolution Sessions
Monitoring Priority: Effective General Supervision Part C/Effective Transition
Results indicator: Percent of hearing requests that went to resolution sessions that were resolved through resolution session settlement agreements (applicable if Part B due process procedures are adopted).
(20 U.S.C. 1416(a)(3)(B) and 1442)

FFY 2015 Part C State Performance Plan (SPP)/Annual Performance Report (APR) 38
Historical Data
Baseline Data:
FFY 2005 2006 2007 2008 2009 2010 2011 2012 2013 2014
Target ≥ Prior to Baseline
No data
No data
No data No data
No data
No data
No data
No data
No data
Data No data No data
No data
No data No data
No data
No data
No data
No data
No data
FFY 2015-FFY 2018 Targets
FFY 2015 2016 2017 2018
Target ≥ No data No data No data No data
Prepopulated Data
Source Date Description Data Overwrite Data
SY 2015-16 EMAPS IDEA Part C Dispute Resolution Survey;
Section C: Due Process Complaints
November 2, 2016
3.1(a) Number resolution sessions resolved through settlement
agreements n null
SY 2015-16 EMAPS IDEA Part C Dispute Resolution Survey;
Section C: Due Process Complaints
November 2, 2016
3.1(a) Number resolution sessions n null

FFY 2015 Part C State Performance Plan (SPP)/Annual Performance Report (APR) 39
FFY 2015 SPP/APR Data
3.1(a) Number resolution sessions resolved through settlement
agreements
3.1(a) Number resolution sessions
FFY 2014 Data*
FFY 2015 Target*
FFY 2015 Data
0 0 No data No data No data
OSEP Response
The state reported fewer than 10 resolution sessions held in FFY 2015. The state is not required to provide targets until any fiscal year in which 10 or more resolution sessions were held.
Indicator 10: Mediation
Monitoring Priority: Effective General Supervision Part C/General Supervision
Results indicator: Percent of mediations held that resulted in mediation agreements.
(20 U.S.C. 1416(a)(3)(B) and 1442)
Historical Data
Baseline Data: 2005
FFY 2005 2006 2007 2008 2009 2010 2011 2012 2013 2014
Target ≥ Prior to Baseline
No data
83.00% No data No data
No data
No data
No data
No data
No data
Data No data No data
No data
100% No data
No data
No data
100% No data
No data
FFY 2015-FFY 2018 Targets
FFY 2015 2016 2017 2018
Target ≥ No data No data No data No data

FFY 2015 Part C State Performance Plan (SPP)/Annual Performance Report (APR) 40
Prepopulated Data
Source Date Description Data Overwrite Data
SY 2015-16 EMAPS IDEA Part C Dispute Resolution Survey;
Section B: Mediation Requests
November 2, 2016
2.1.a.i Mediation agreements related to due process complaints
n null
SY 2015-16 EMAPS IDEA Part C Dispute Resolution Survey;
Section B: Mediation Requests
November 2, 2016
2.1.a.i Mediation agreements not related to due process complaints
n Null
SY 2015-16 EMAPS IDEA Part C Dispute Resolution Survey;
Section B: Mediation Requests
November 2, 2016
2.1 Mediations held n Null
FFY 2015 SPP/APR Data
2.1.a.i Mediation agreements related to due process
complaints
2.1.a.i Mediation agreements not related to
due process complaints
2.1 Mediations
held
FFY 2014 Data*
FFY 2015 Target*
FFY 2015 Data
0 0 No data No data No data No data
OSEP Response
The state reported fewer than 10 mediation sessions held in FFY 2015. The state is not required to provide targets until any fiscal year in which 10 or more resolution sessions were held.
Indicator 11: State Systemic Improvement Plan
Monitoring Priority: General Supervision

FFY 2015 Part C State Performance Plan (SPP)/Annual Performance Report (APR) 41
Results Indicator: The state’s SPP/APR includes a State Systemic Improvement Plan (SSIP) that meets the requirements set forth for this indicator.
Reported Data
Baseline Data: 2013
FFY 2013 2014 2015
Target Data Prior to Baseline No data No data
Data No data 60.30% No data
FFY 2016-FFY 2018 Targets
FFY 2015 2016 2017 2018
Target No data No data No data No data
I certify that I am the director of the state's Lead Agency under Part C of the IDEA, or his or her designee, and that the State's submission of its IDEA Part C State Performance Plan/Annual Performance Report is accurate.
Selected: Designated by the Lead Agency director to certify
Name and title of the individual certifying the accuracy of the state's submission of its IDEA Part C State Performance Plan/Annual Performance Report.
Name: Lisa Backer
Title: Education Supervisor
Email: [email protected]
Phone: 651-582-8473