Embed Size (px)
Citation preview
Greater Port land-Vancouver Indicators
September 27, 2010
Paul W. Mattessich, Ph.D.
Wilder Research
Saint Paul, Minnesota
Minnesota Compass:Measuring progress. Inspiring action.
www.mncompass.orgSeptember 2010
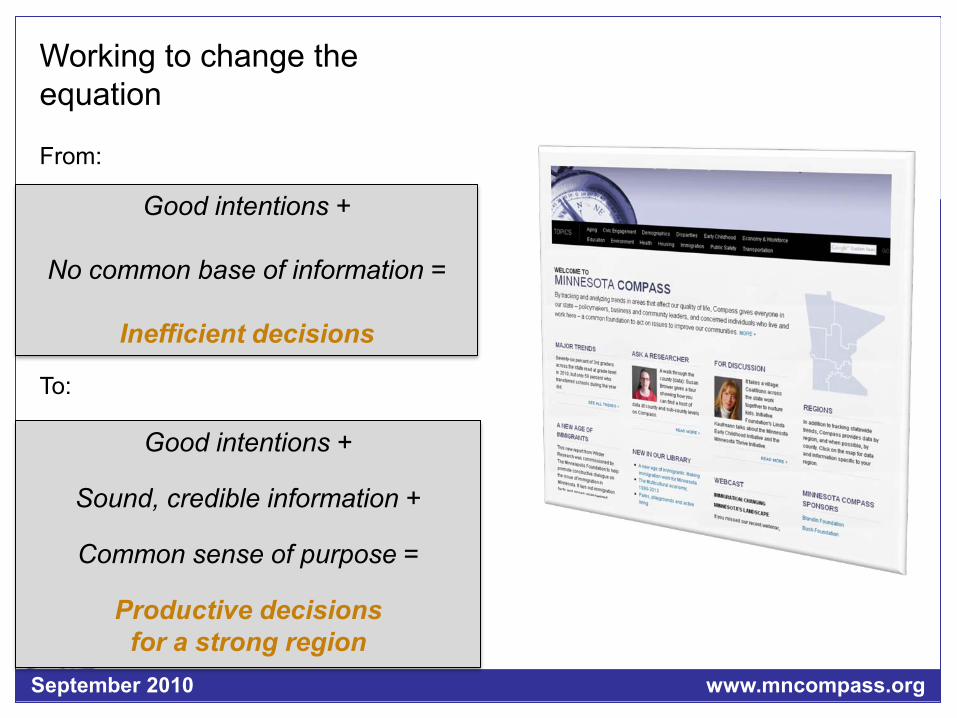
Working to change the equation
From:
To:
Good intentions +
No common base of information =
Inefficient decisions
Good intentions +
Sound, credible information +
Common sense of purpose =
Productive decisions for a strong region
www.mncompass.orgSeptember 2010

wilderresearch.org
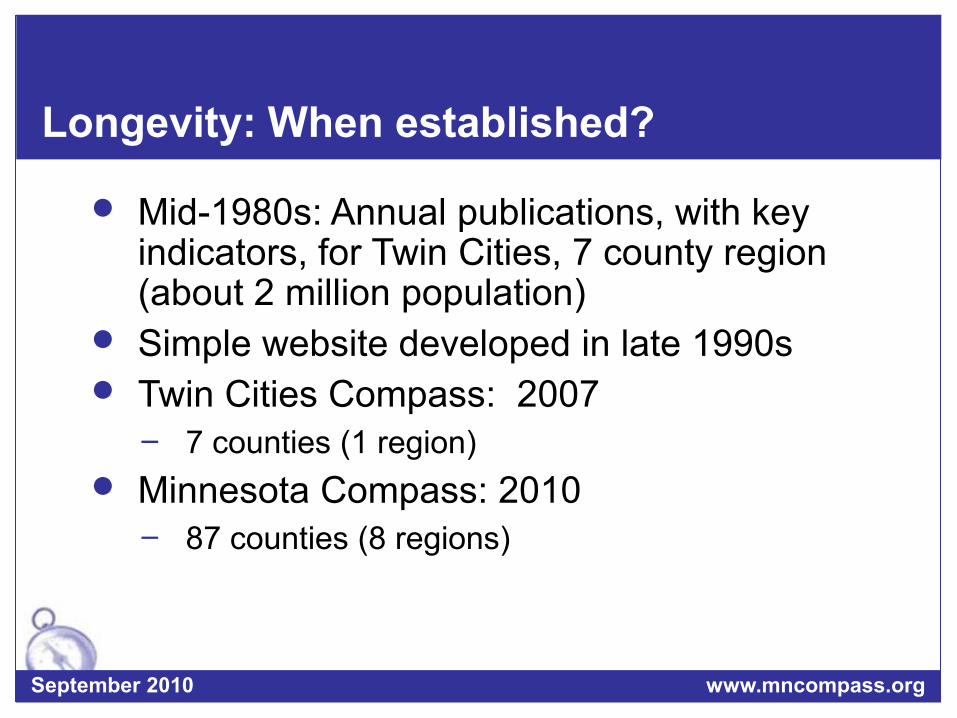
Longevity: When established?
Mid-1980s: Annual publications, with key indicators, for Twin Cities, 7 county region (about 2 million population)
Simple website developed in late 1990s Twin Cities Compass: 2007 7 counties (1 region)
Minnesota Compass: 2010 87 counties (8 regions)
www.mncompass.orgSeptember 2010
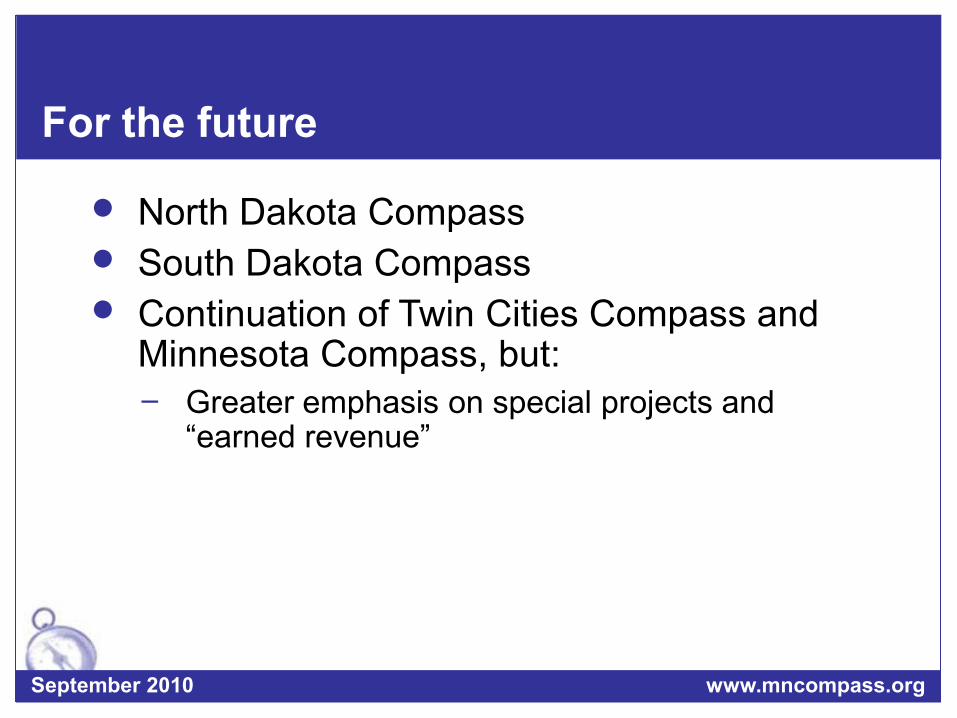
For the future
North Dakota Compass South Dakota Compass Continuation of Twin Cities Compass and
Minnesota Compass, but: Greater emphasis on special projects and
“earned revenue”
www.mncompass.orgSeptember 2010
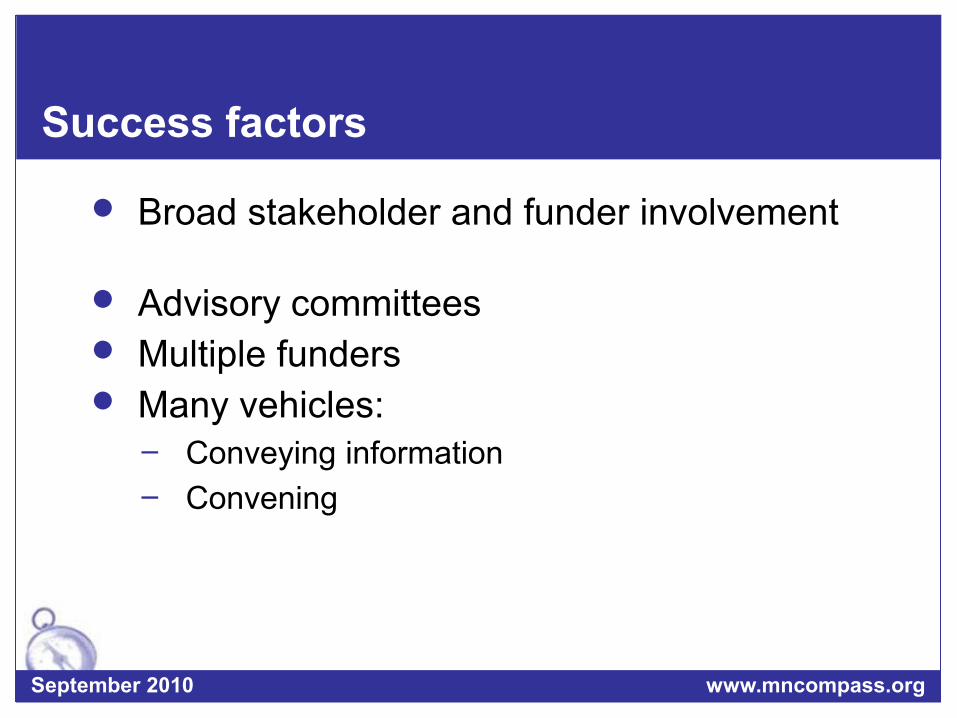
Success factors
Broad stakeholder and funder involvement
Advisory committees Multiple funders Many vehicles: Conveying information Convening
www.mncompass.orgSeptember 2010
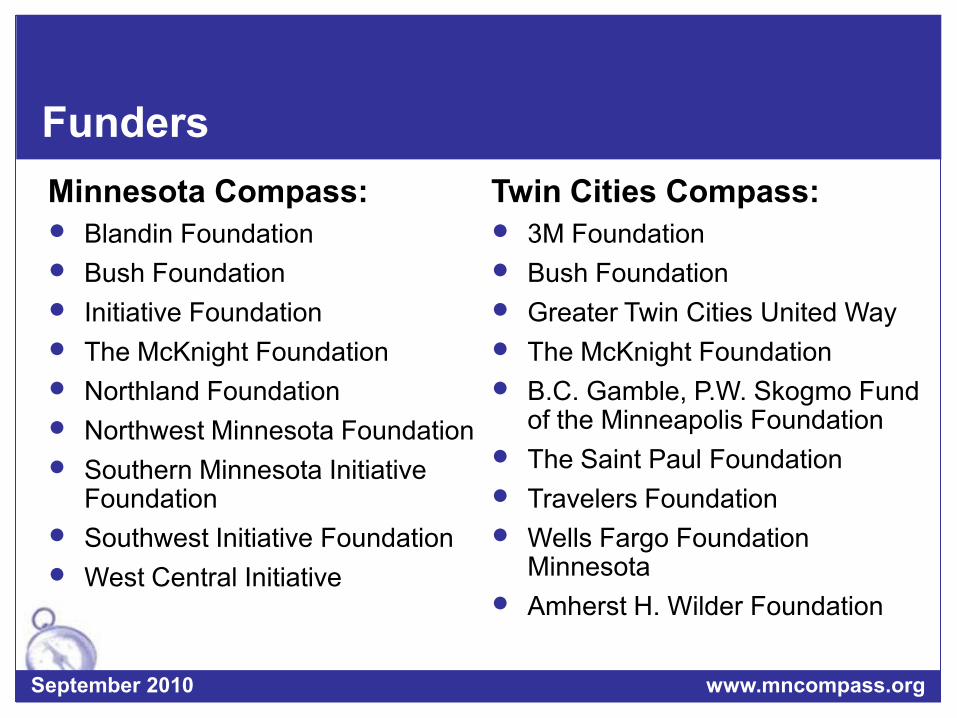
FundersTwin Cities Compass: 3M Foundation Bush Foundation Greater Twin Cities United Way The McKnight Foundation B.C. Gamble, P.W. Skogmo Fund
of the Minneapolis Foundation The Saint Paul Foundation Travelers Foundation Wells Fargo Foundation
Minnesota Amherst H. Wilder Foundation
Minnesota Compass: Blandin Foundation Bush Foundation Initiative Foundation The McKnight Foundation Northland Foundation Northwest Minnesota Foundation Southern Minnesota Initiative
Foundation Southwest Initiative Foundation West Central Initiative
www.mncompass.orgSeptember 2010
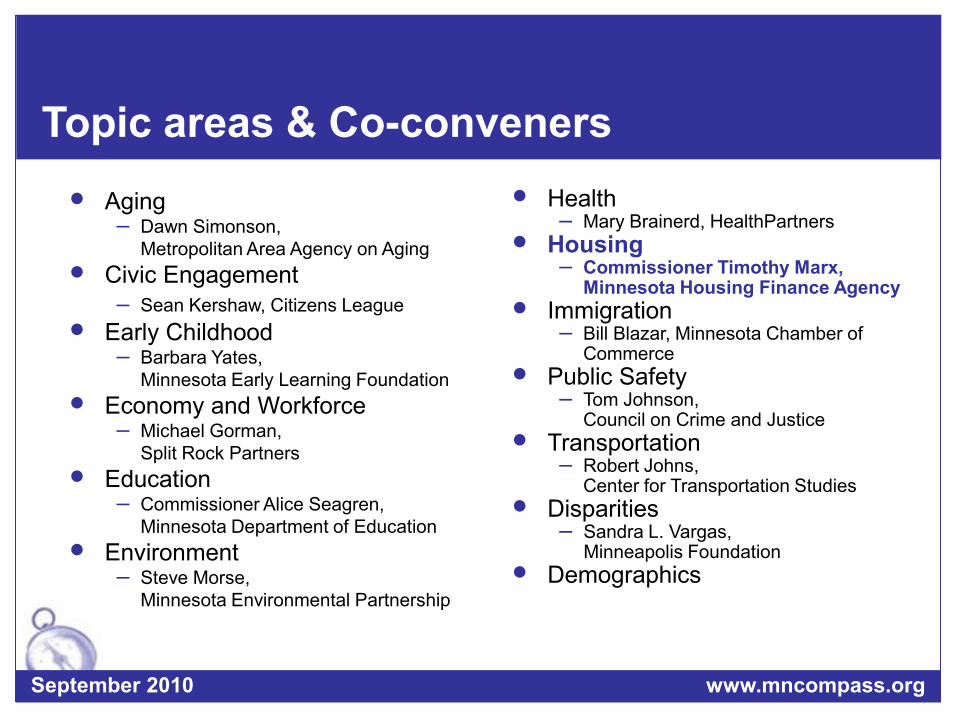
Topic areas & Co-conveners Aging
– Dawn Simonson, Metropolitan Area Agency on Aging
Civic Engagement – Sean Kershaw, Citizens League
Early Childhood– Barbara Yates,
Minnesota Early Learning Foundation Economy and Workforce
– Michael Gorman, Split Rock Partners
Education – Commissioner Alice Seagren,
Minnesota Department of Education Environment
– Steve Morse, Minnesota Environmental Partnership
Health– Mary Brainerd, HealthPartners
Housing– Commissioner Timothy Marx,
Minnesota Housing Finance Agency Immigration
– Bill Blazar, Minnesota Chamber of Commerce
Public Safety– Tom Johnson,
Council on Crime and Justice Transportation
– Robert Johns, Center for Transportation Studies
Disparities– Sandra L. Vargas,
Minneapolis Foundation Demographics
www.mncompass.orgSeptember 2010
Important vehicles
Advisory groups Brochures “Champions” Forums convened
by the project Invited presentations Media
Newsletters Reports Web 2.0 venues
(Blogs, Facebook, Twitter, YouTube, etc.)
Website Other?
www.mncompass.orgSeptember 2010
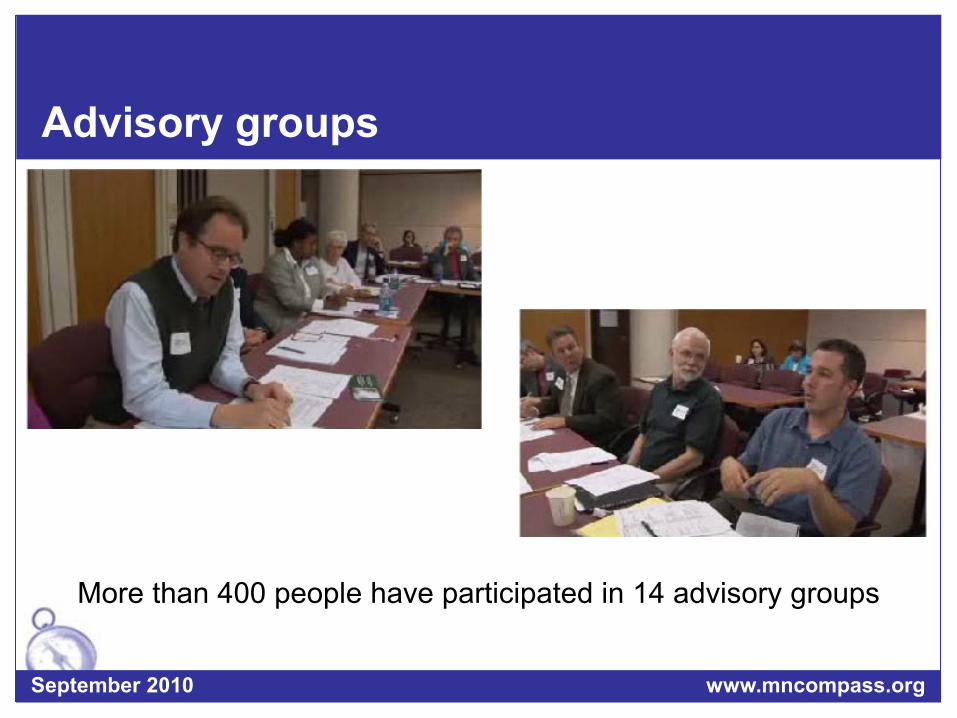
Advisory groups
More than 400 people have participated in 14 advisory groups
www.mncompass.orgSeptember 2010
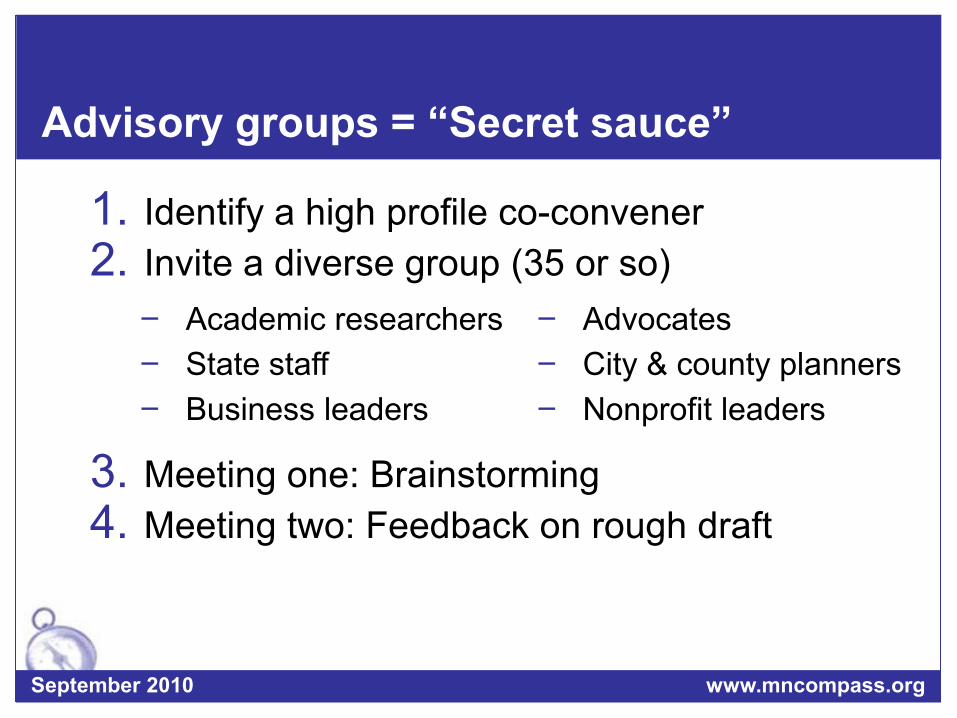
Advisory groups = “Secret sauce”
1. Identify a high profile co-convener2. Invite a diverse group (35 or so)
3. Meeting one: Brainstorming4. Meeting two: Feedback on rough draft
Academic researchers State staff Business leaders
Advocates City & county planners Nonprofit leaders
www.mncompass.orgSeptember 2010
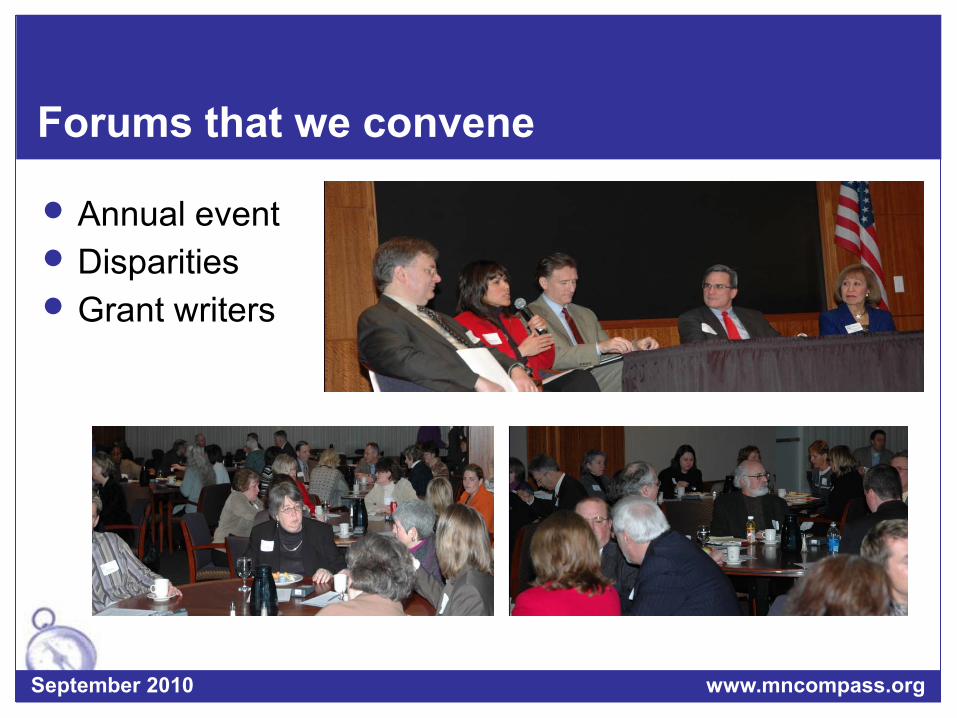
Forums that we convene
Annual event Disparities Grant writers
www.mncompass.orgSeptember 2010
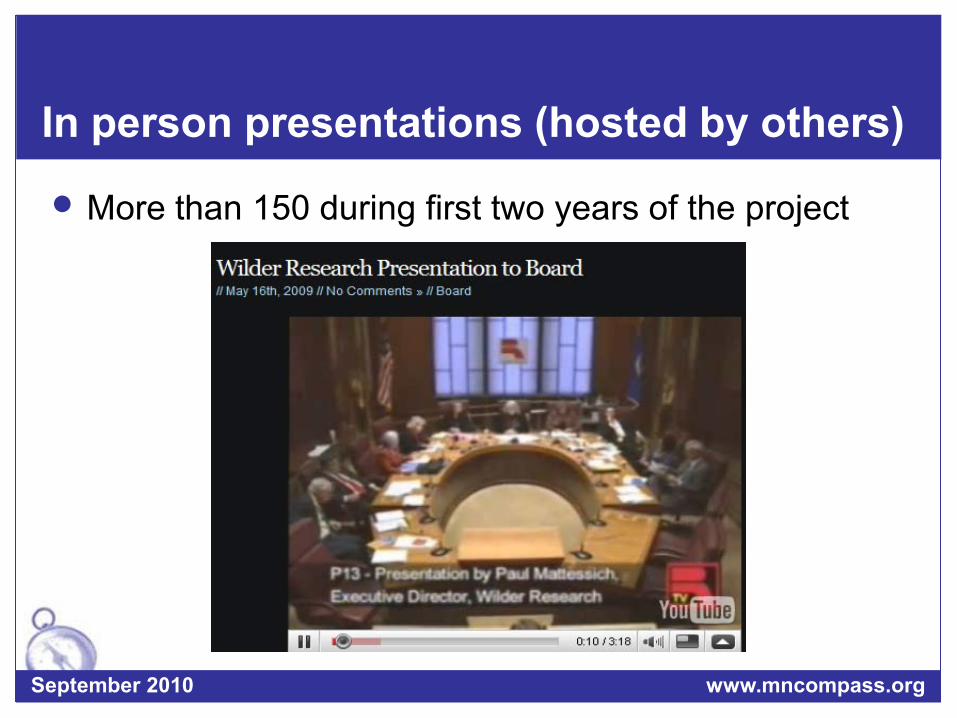
In person presentations (hosted by others)
More than 150 during first two years of the project
www.mncompass.orgSeptember 2010
www.mncompass.orgSeptember 2010
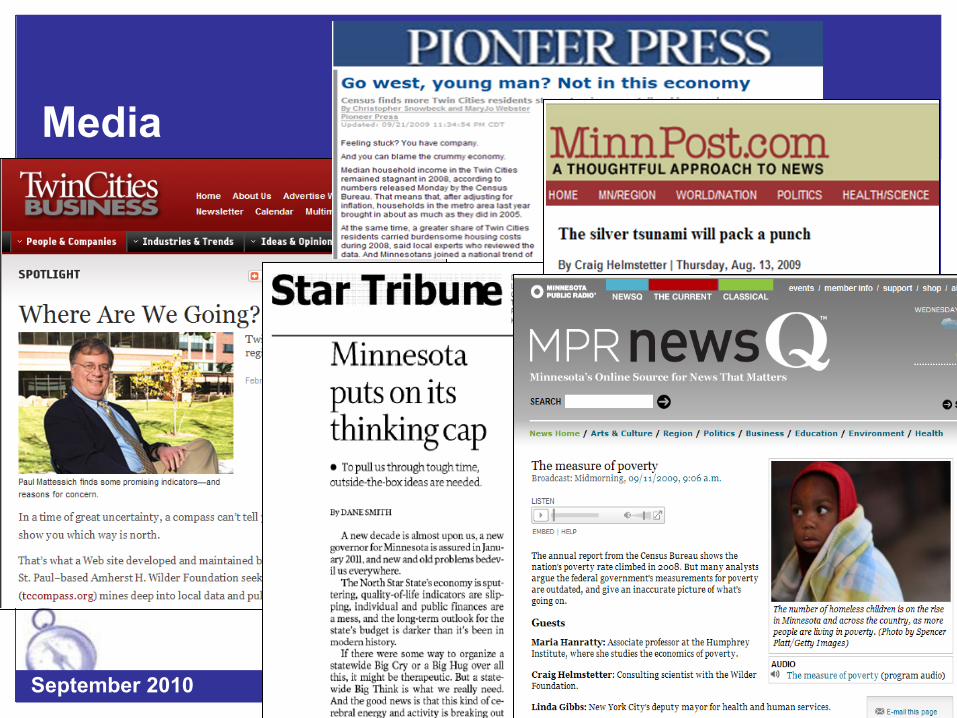
Media
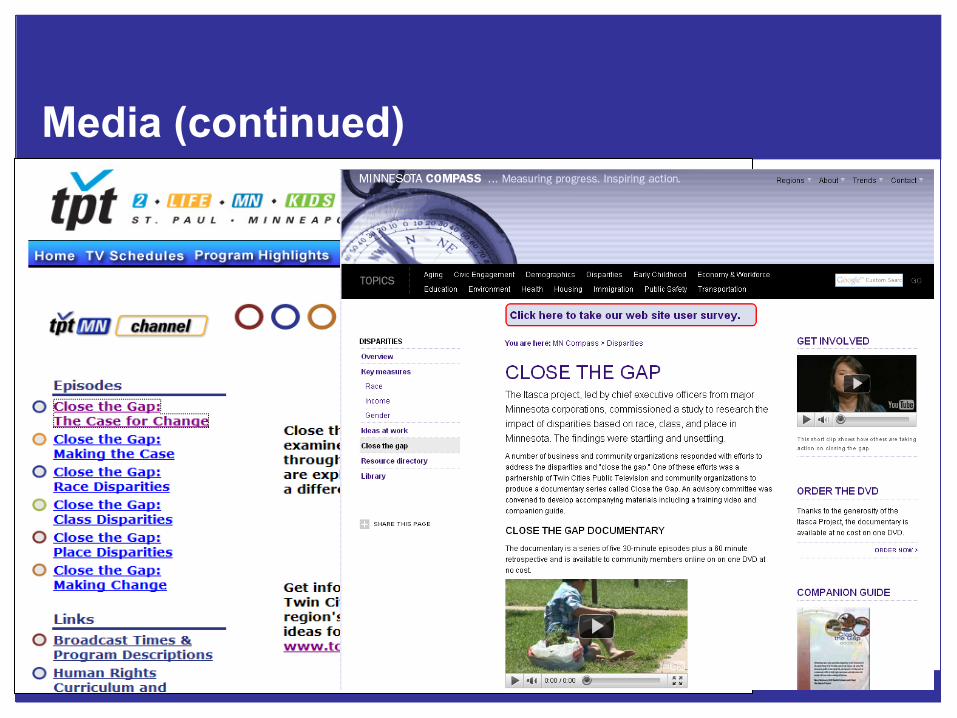
Media (continued)
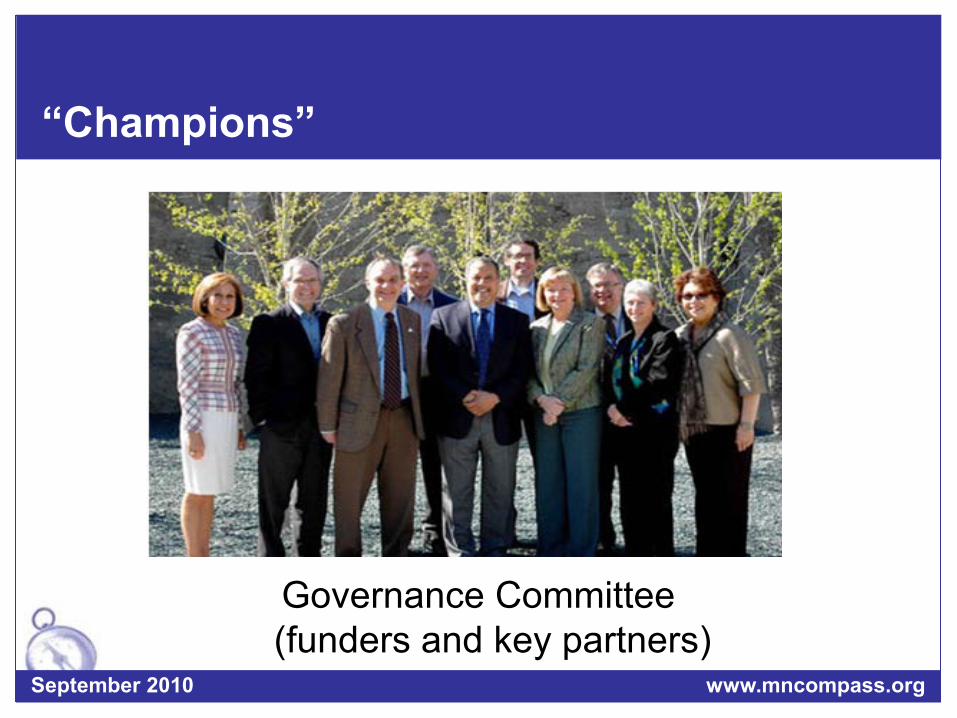
“Champions”
Governance Committee(funders and key partners)
www.mncompass.orgSeptember 2010
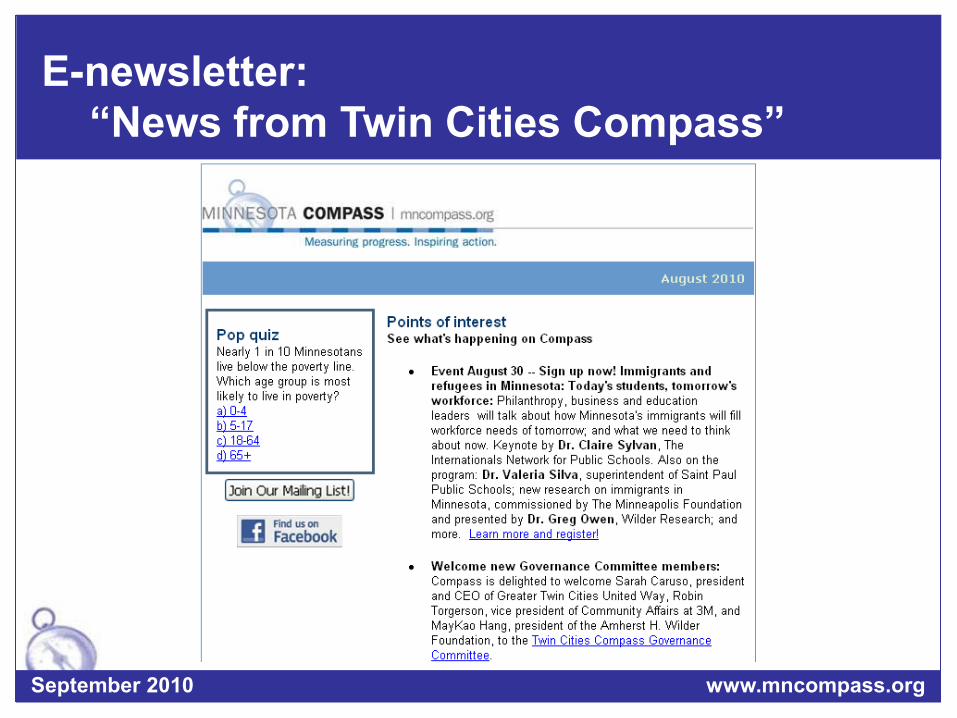
E-newsletter: “News from Twin Cities Compass”
www.mncompass.orgSeptember 2010
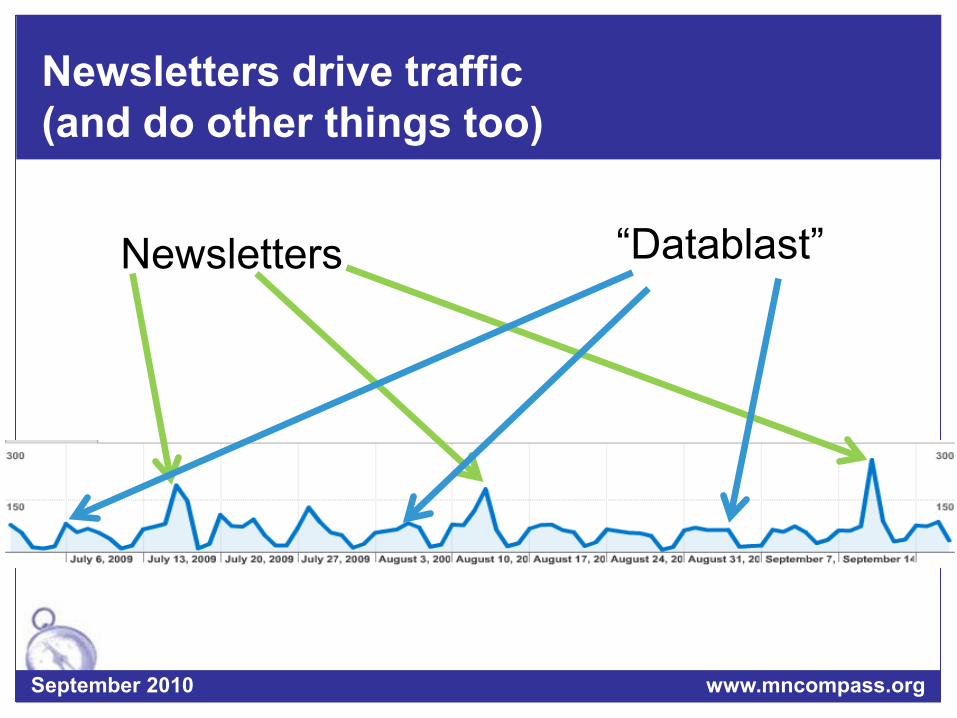
Newsletters drive traffic (and do other things too)
Newsletters “Datablast”
www.mncompass.orgSeptember 2010
Success factors
High standards for quality of information Relevant information Nonpartisan Easy-to-use website Willingness to partner with others on
initiatives
www.mncompass.orgSeptember 2010
How is Compass funded?
www.mncompass.orgSeptember 2010
Foundation grants Almost the sole source of revenue in
pre-Compass projects, and in first years of Compass
Earned income
What are the funding Issues?
Funders love us However, resources are scarce Need to increase proportion of
“earned revenue”
www.mncompass.orgSeptember 2010
Governance
www.mncompass.orgSeptember 2010
Managed and operated by Wilder Research Relatively autonomous
Governance Committee Foundation chief executives, plus a few other
community leaders Rules for quality: established by Technical
Advisory Committee
Equity
www.mncompass.orgSeptember 2010
“Disparities” Special section of web site Part of every topic: comparisons of
indictors Much convening on topic: Immigration (with Minnesota Chamber of
Commerce) Health inequities Education Etc.
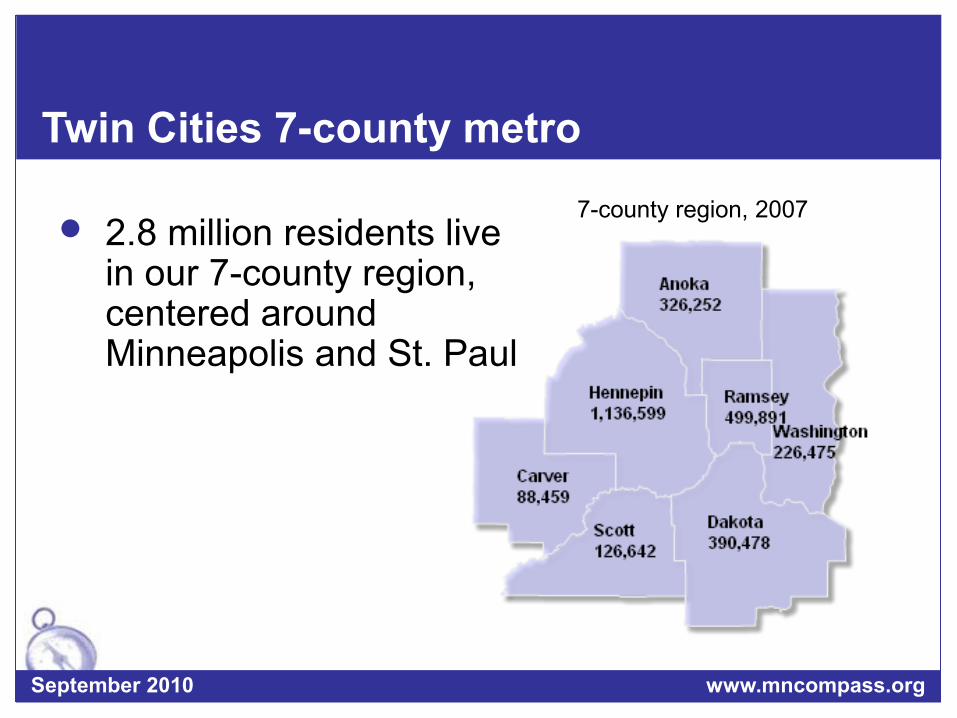
Twin Cities 7-county metro
7-county region, 2007 2.8 million residents live
in our 7-county region, centered around Minneapolis and St. Paul
www.mncompass.orgSeptember 2010
Community initiatives
www.mncompass.orgSeptember 2010
“Close the Gap” – documentary produced with public television (Compass as partner with Twin Cities Public Television and a coalition of business and government)
“CommUNITY” – cross-sector initiative to improve a portion of the region (Compass as a major partner)
Annual “State of Housing” – forum to foster progress on supply of affordable housing (Compass as partner with McKnight Foundation)
Early Childhood Business Plan Monitoring –statewide monitoring and annual forum, to foster progress on early childhood assessment and education
Community initiatives (continued)
www.mncompass.orgSeptember 2010
Health Inequities Initiative – special study commissioned by Blue Cross and Blue Shield of MN Foundation
“Challenging Expectations” – documentary produced with Twin Cities Public Television and Travelers Foundation
“Results Minneapolis” – a public-friendly gateway to performance information on Minneapolis’ key issues, which aligns with Compass measures and information
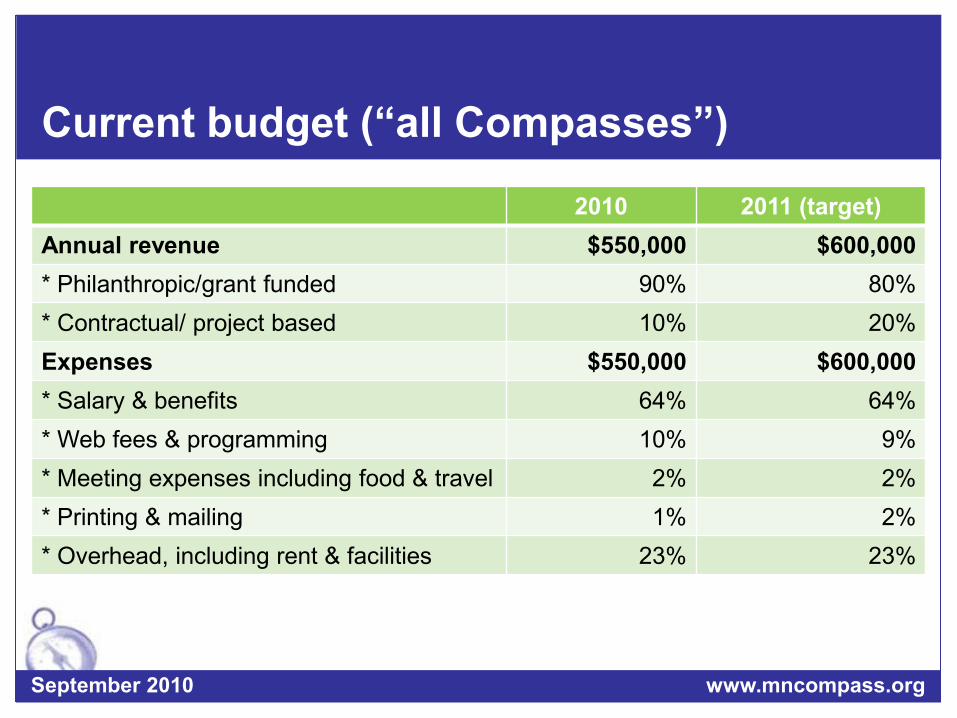
Current budget (“all Compasses”)
www.mncompass.orgSeptember 2010
2010 2011 (target)Annual revenue $550,000 $600,000* Philanthropic/grant funded 90% 80%* Contractual/ project based 10% 20%Expenses $550,000 $600,000* Salary & benefits 64% 64%* Web fees & programming 10% 9%* Meeting expenses including food & travel 2% 2%* Printing & mailing 1% 2%* Overhead, including rent & facilities 23% 23%
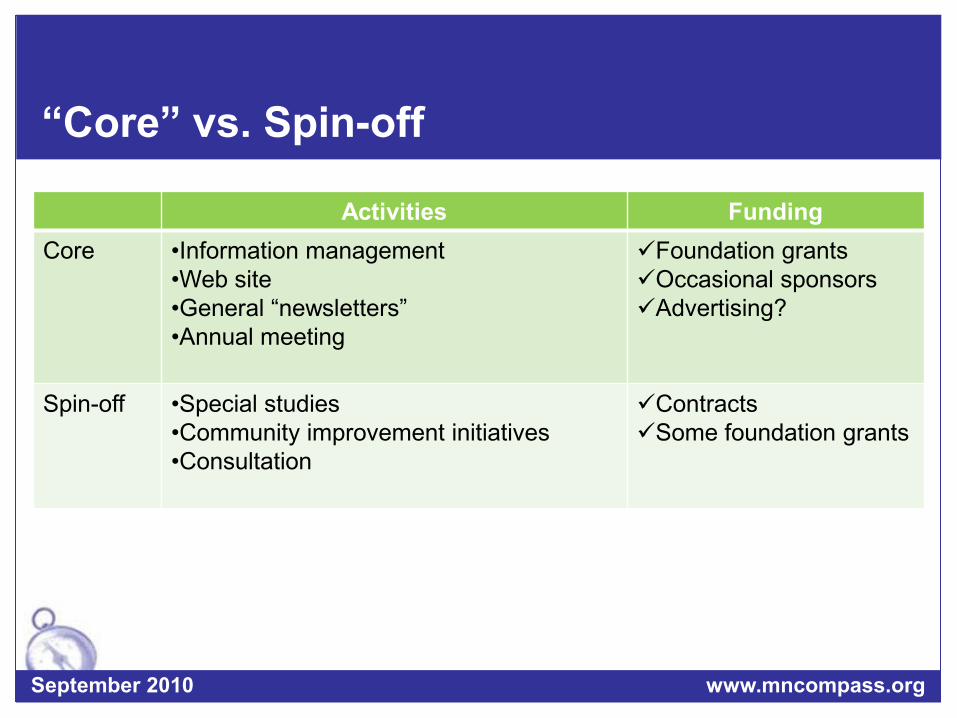
“Core” vs. Spin-off
www.mncompass.orgSeptember 2010
Activities FundingCore •Information management
•Web site •General “newsletters”•Annual meeting
Foundation grantsOccasional sponsorsAdvertising?
Spin-off •Special studies•Community improvement initiatives•Consultation
ContractsSome foundation grants
Staying “top of mind”
Collateral in the 2.0 age
www.mncompass.orgSeptember 2010
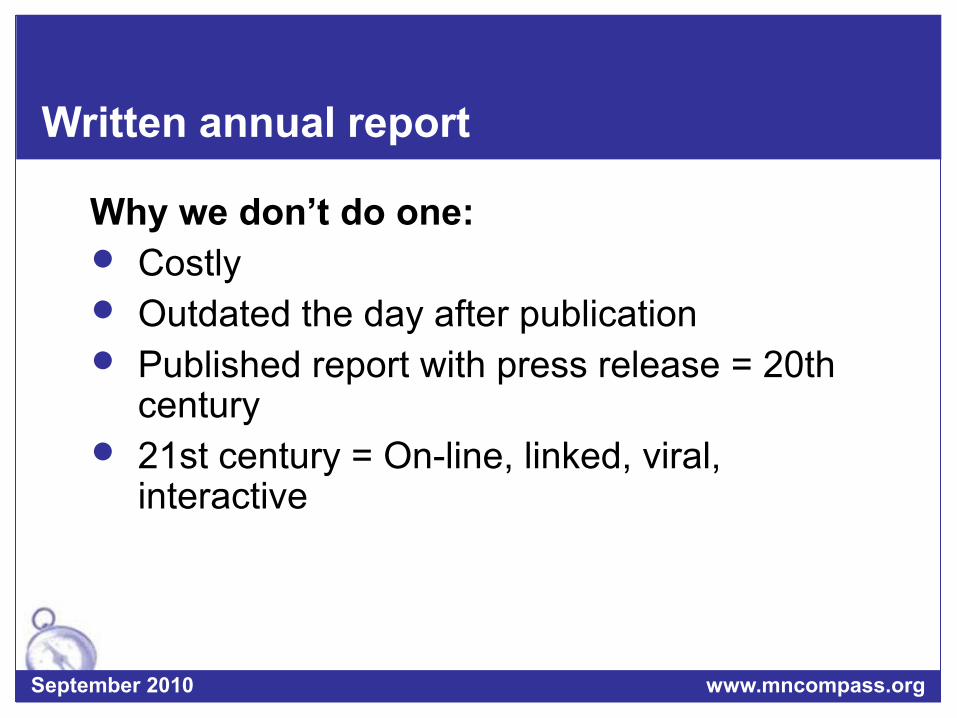
Written annual report
www.mncompass.orgSeptember 2010
Why we don’t do one: Costly Outdated the day after publication Published report with press release = 20th
century 21st century = On-line, linked, viral,
interactive
Becoming an “essential ingredient”
… for efforts to improve the region
www.mncompass.orgSeptember 2010
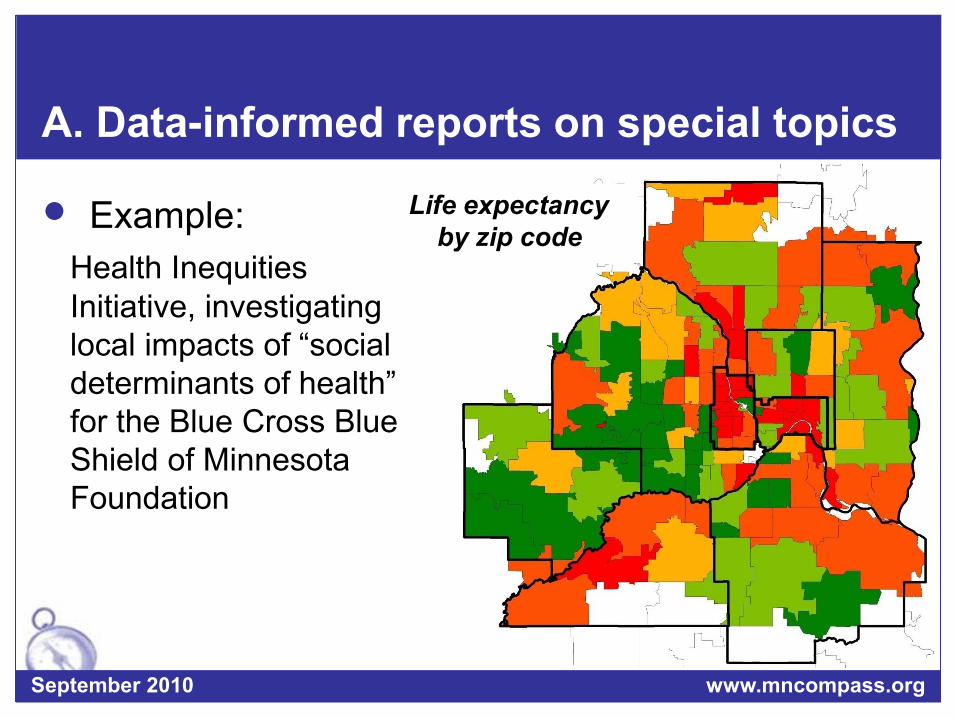
A. Data-informed reports on special topics
Example:Health Inequities Initiative, investigating local impacts of “social determinants of health” for the Blue Cross Blue Shield of Minnesota Foundation
Life expectancy by zip code
www.mncompass.orgSeptember 2010
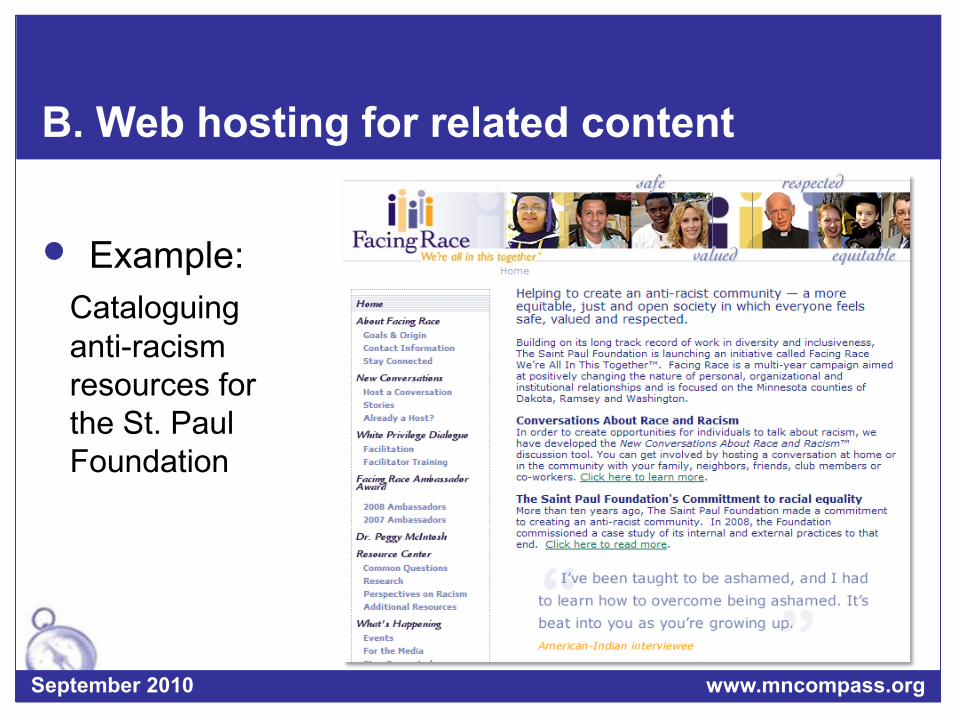
B. Web hosting for related content
Example:Cataloguing anti-racism resources for the St. Paul Foundation
www.mncompass.orgSeptember 2010
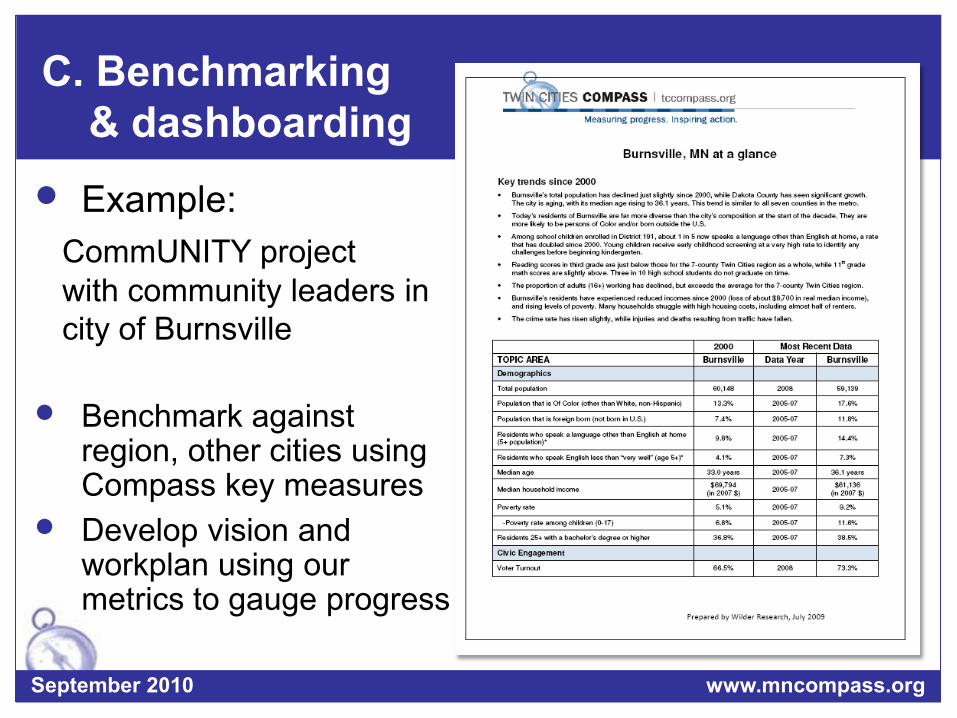
C. Benchmarking & dashboarding
Example:CommUNITY project with community leaders in city of Burnsville
Benchmark against region, other cities using Compass key measures
Develop vision and workplan using our metrics to gauge progress
www.mncompass.orgSeptember 2010
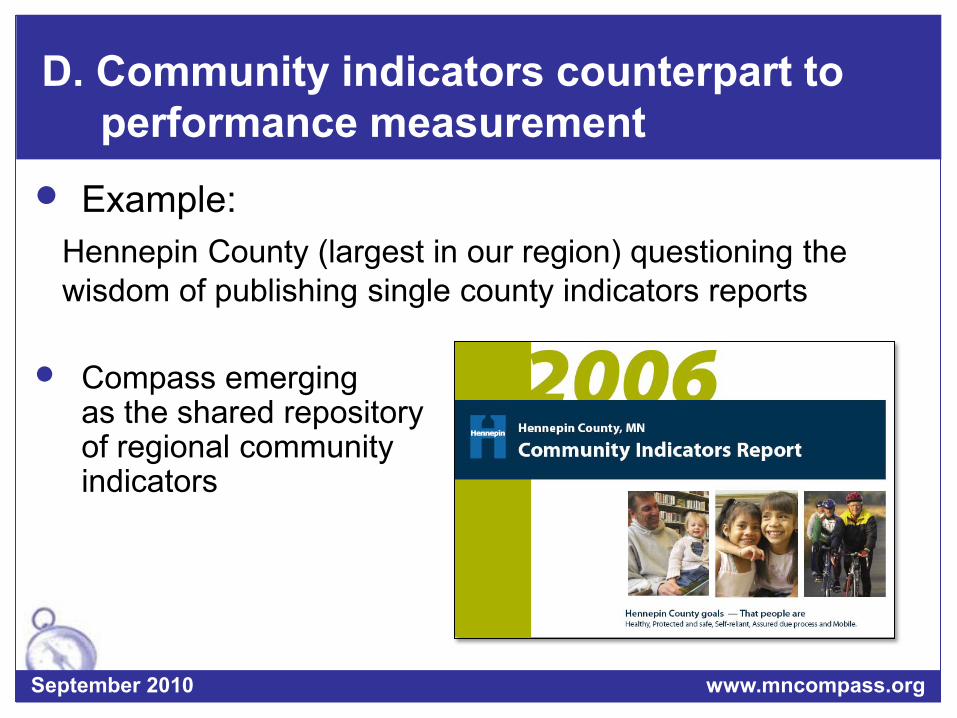
D. Community indicators counterpart to performance measurement
Example:Hennepin County (largest in our region) questioning the wisdom of publishing single county indicators reports
Compass emerging as the shared repository of regional community indicators
www.mncompass.orgSeptember 2010
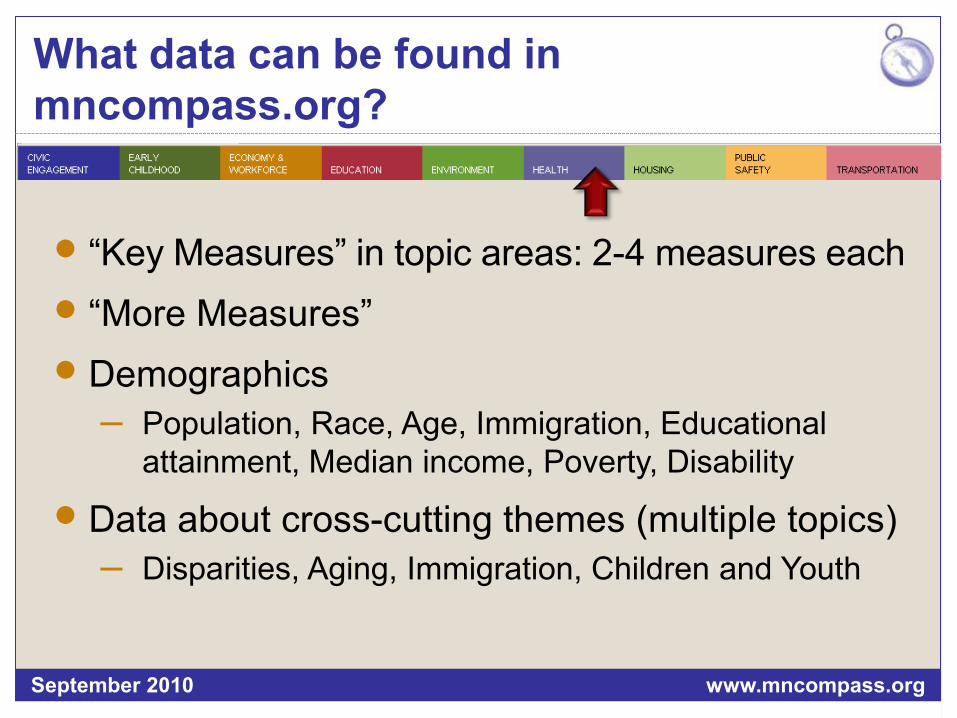
What data can be found in mncompass.org?
“Key Measures” in topic areas: 2-4 measures each “More Measures” Demographics
– Population, Race, Age, Immigration, Educational attainment, Median income, Poverty, Disability
Data about cross-cutting themes (multiple topics)– Disparities, Aging, Immigration, Children and Youth
www.mncompass.orgSeptember 2010
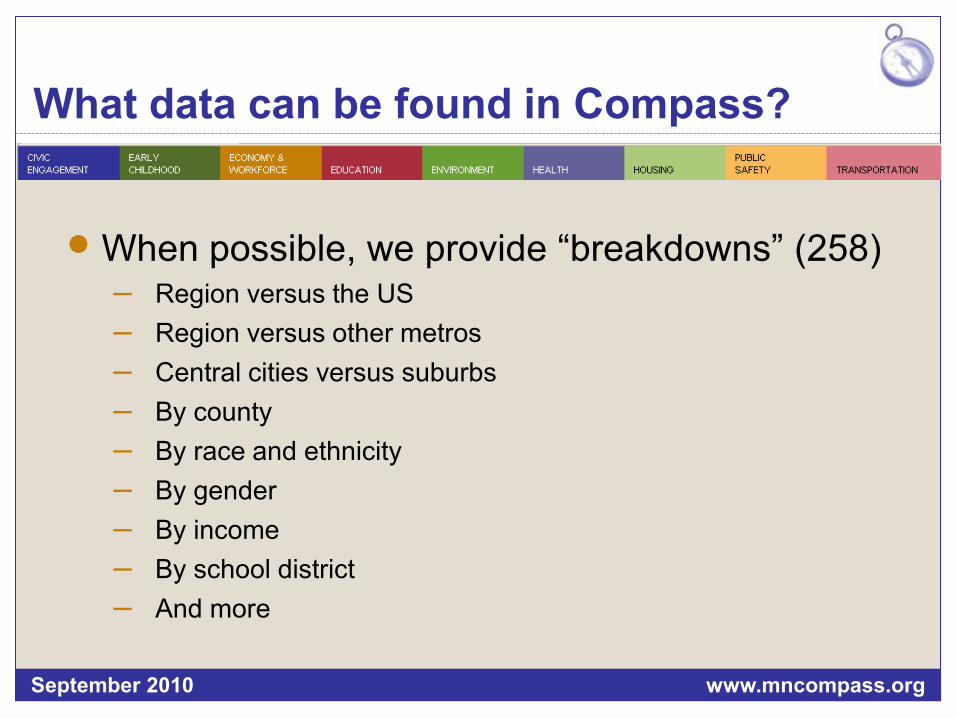
What data can be found in Compass?
When possible, we provide “breakdowns” (258) – Region versus the US– Region versus other metros– Central cities versus suburbs– By county– By race and ethnicity– By gender– By income– By school district– And more
www.mncompass.orgSeptember 2010