Embed Size (px)
Citation preview
Minnesota and the New Normal
Tom StinsonTom GillaspyApril 2012
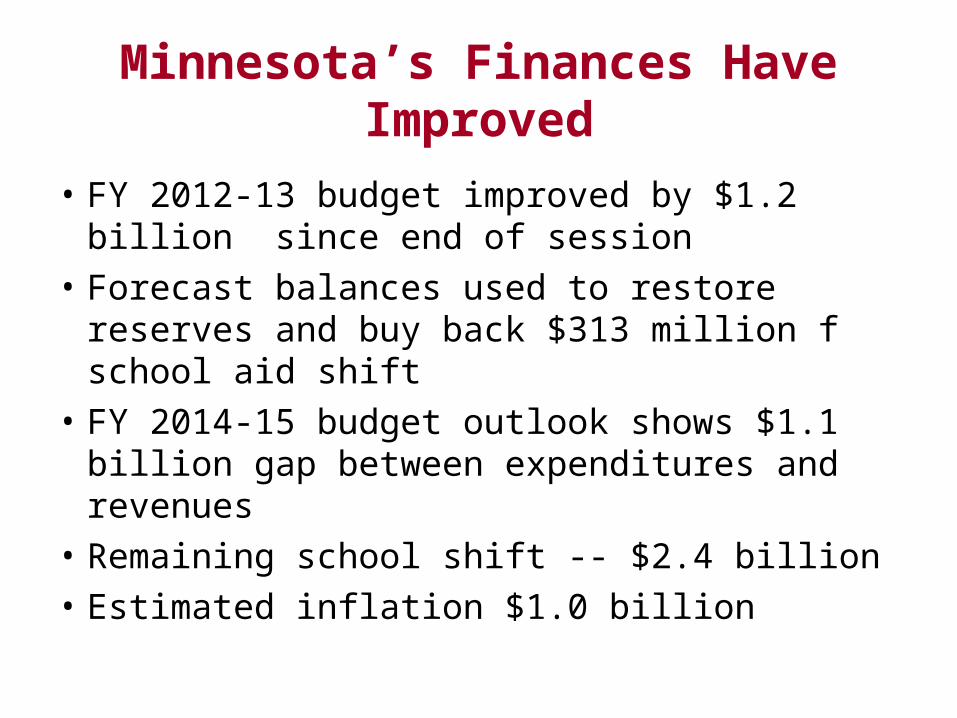
Minnesota’s Finances Have Improved
• FY 2012-13 budget improved by $1.2 billion since end of session
• Forecast balances used to restore reserves and buy back $313 million f school aid shift
• FY 2014-15 budget outlook shows $1.1 billion gap between expenditures and revenues
• Remaining school shift -- $2.4 billion• Estimated inflation $1.0 billion

Recent Economic and Demographic Events Have Changed the Outlook for
as Far as We Can See
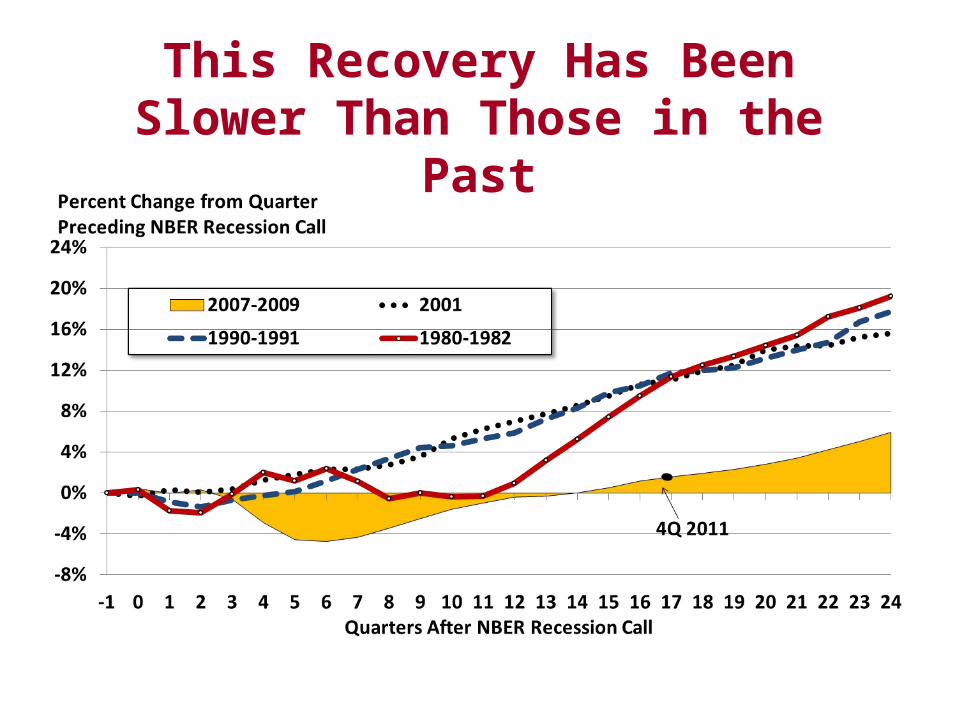
This Recovery Has Been Slower Than Those in the Past
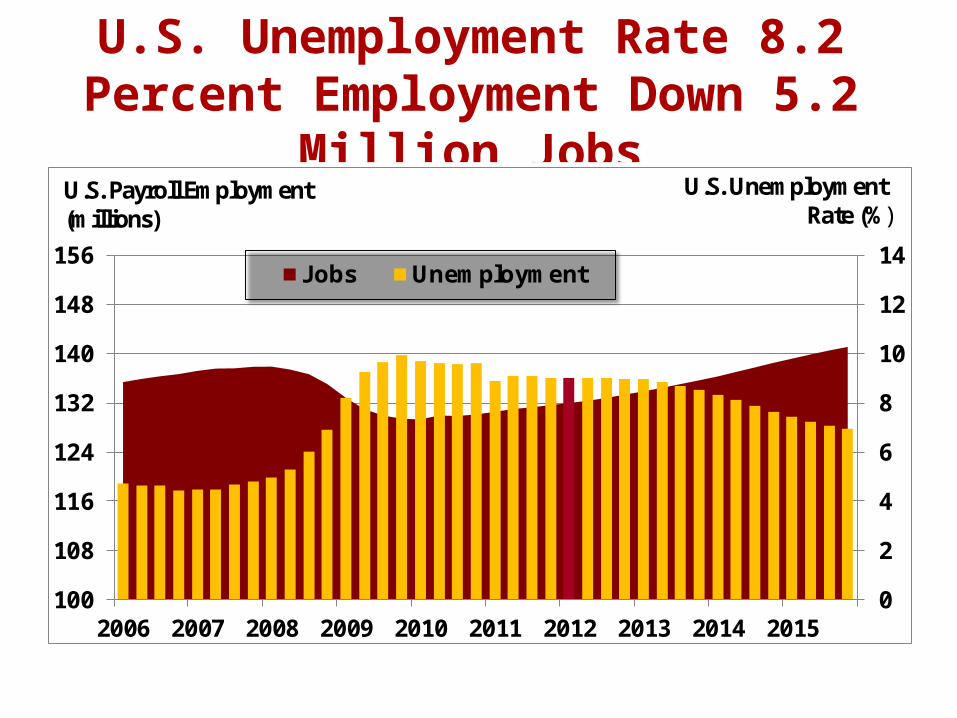
U.S. Unemployment Rate 8.2 Percent Employment Down 5.2 Million Jobs
0
2
4
6
8
10
12
14
100
108
116
124
132
140
148
156
2006 2007 2008 2009 2010 2011 2012 2013 2014 2015
Jobs Unemployment
U.S. Payroll Employment(millions)
U.S. Unemployment Rate (%)
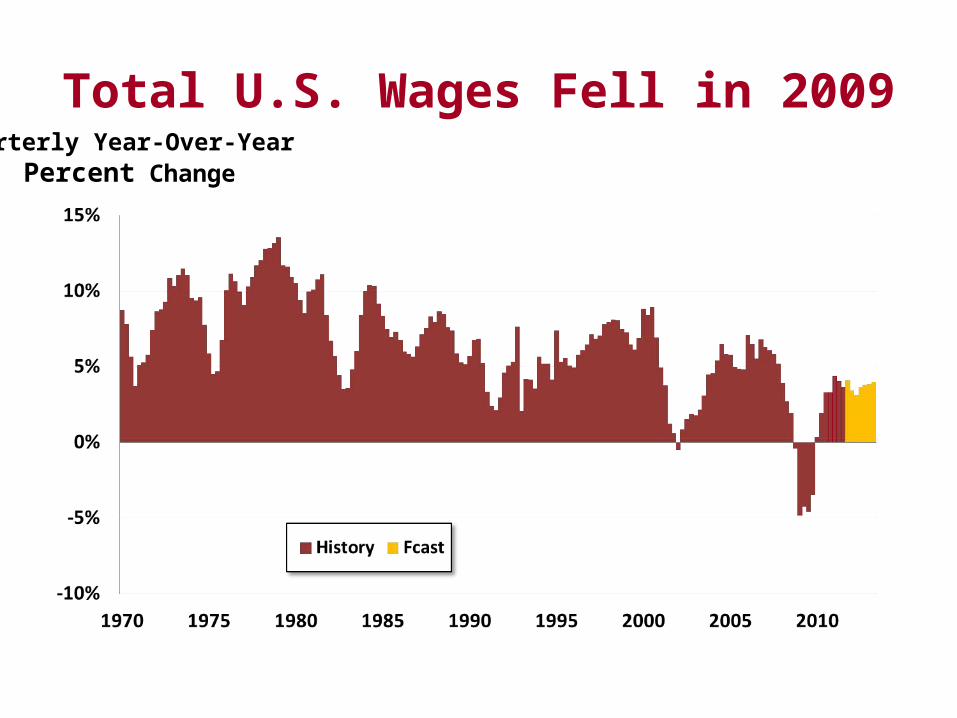
Total U.S. Wages Fell in 2009Quarterly Year-Over-Year
Percent Change
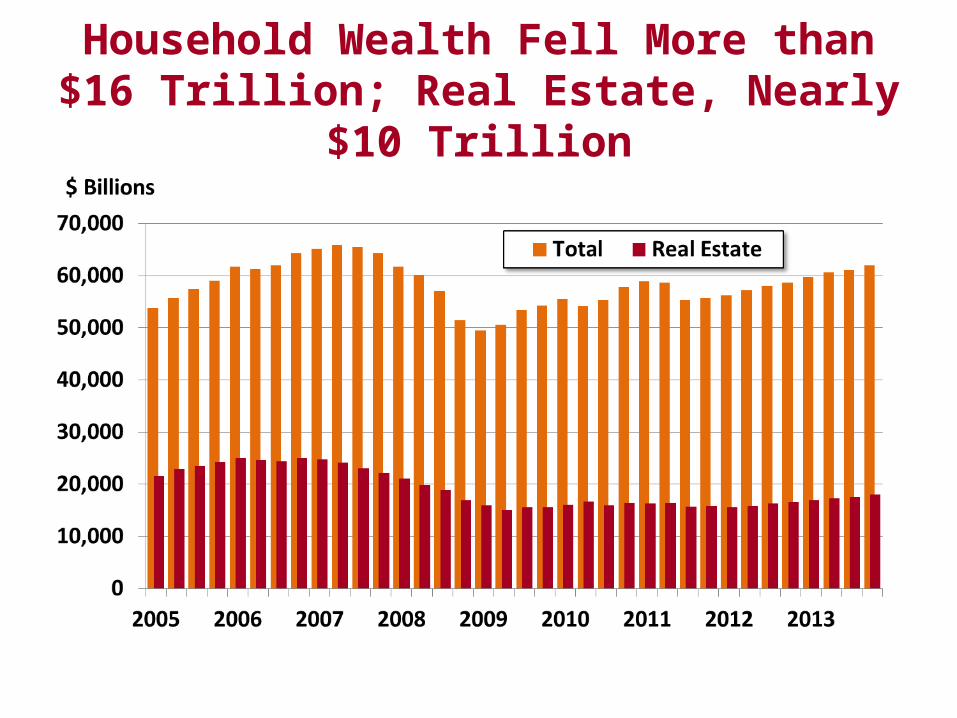
Household Wealth Fell More than $16 Trillion; Real Estate, Nearly $10 Trillion
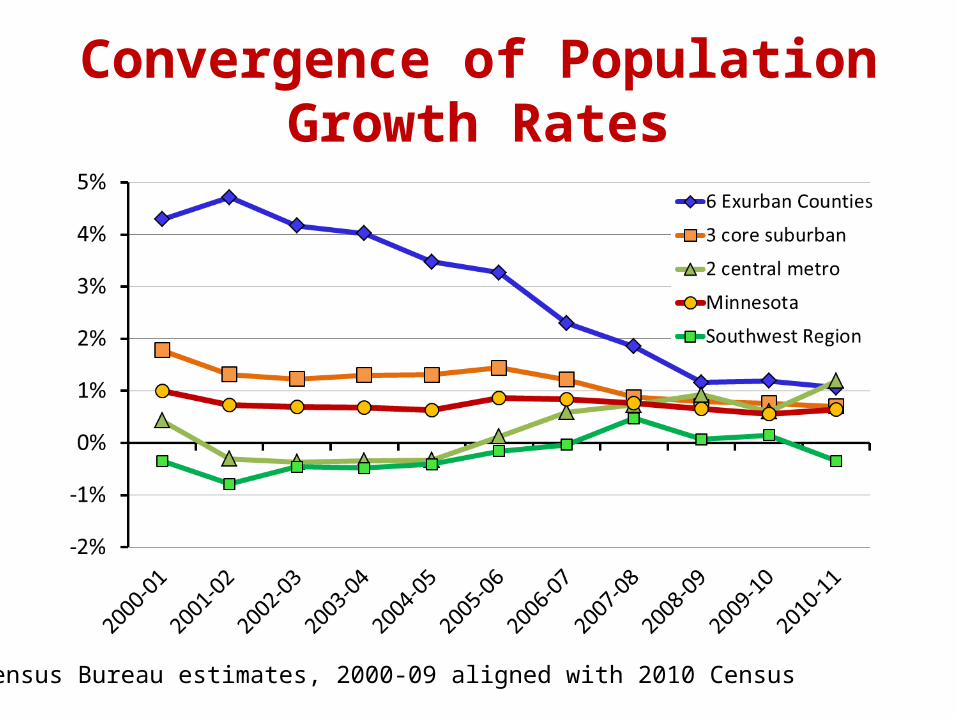
Convergence of Population Growth Rates
Census Bureau estimates, 2000-09 aligned with 2010 Census
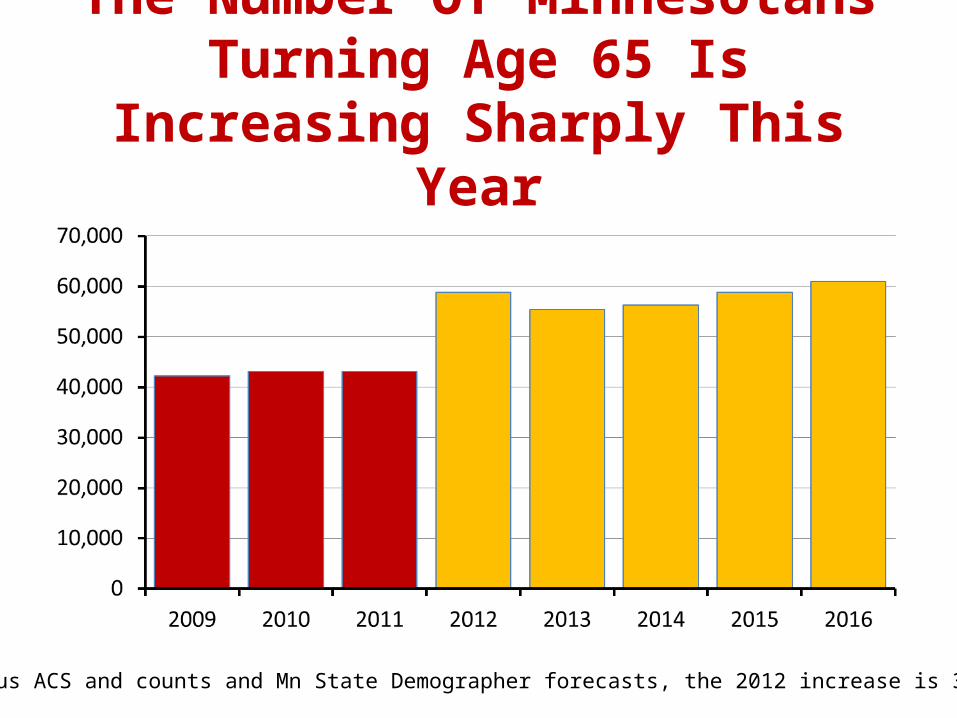
The Number Of Minnesotans Turning Age 65 Is Increasing Sharply This Year
Census ACS and counts and Mn State Demographer forecasts, the 2012 increase is 36%
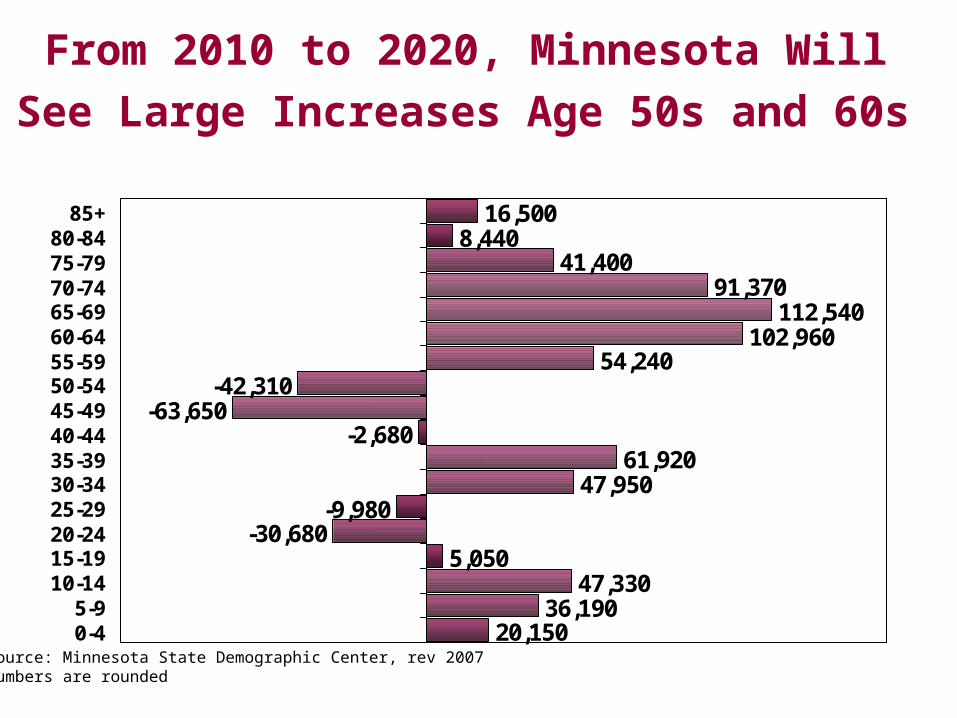
From 2010 to 2020, Minnesota Will See Large Increases Age 50s and 60s
20,15036,190
47,3305,050
-30,680-9,980
47,95061,920
-2,680-63,650
-42,31054,240
102,960112,540
91,37041,400
8,44016,500
0-45-9
10-1415-1920-2425-2930-3435-3940-4445-4950-5455-5960-6465-6970-7475-7980-84
85+
Source: Minnesota State Demographic Center, rev 2007Numbers are rounded
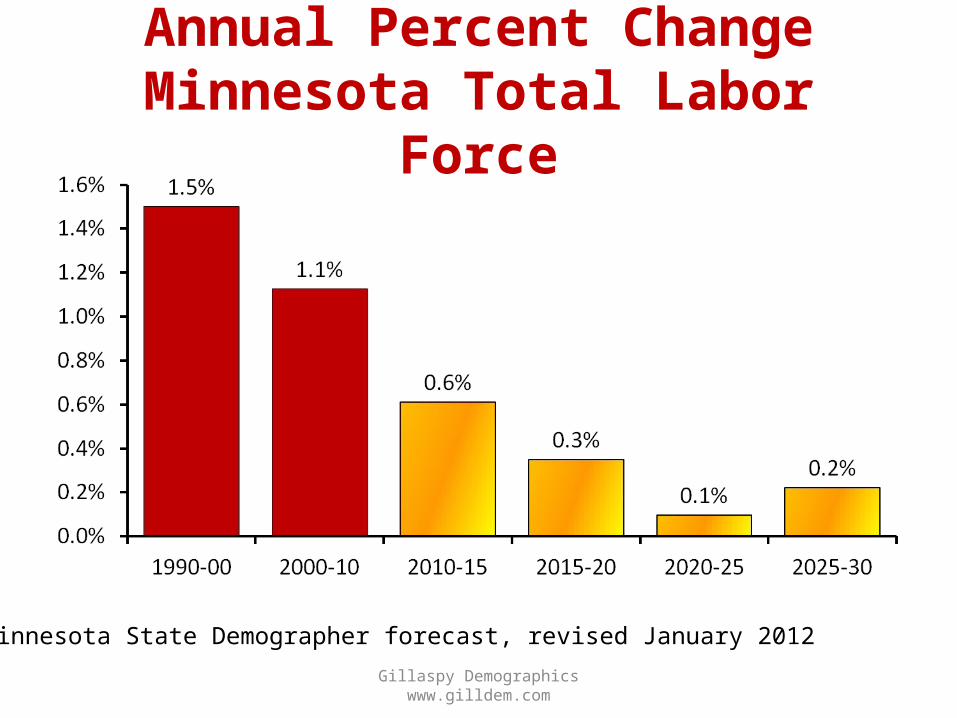
Annual Percent Change Minnesota Total Labor Force
Minnesota State Demographer forecast, revised January 2012
Gillaspy Demographics www.gilldem.com
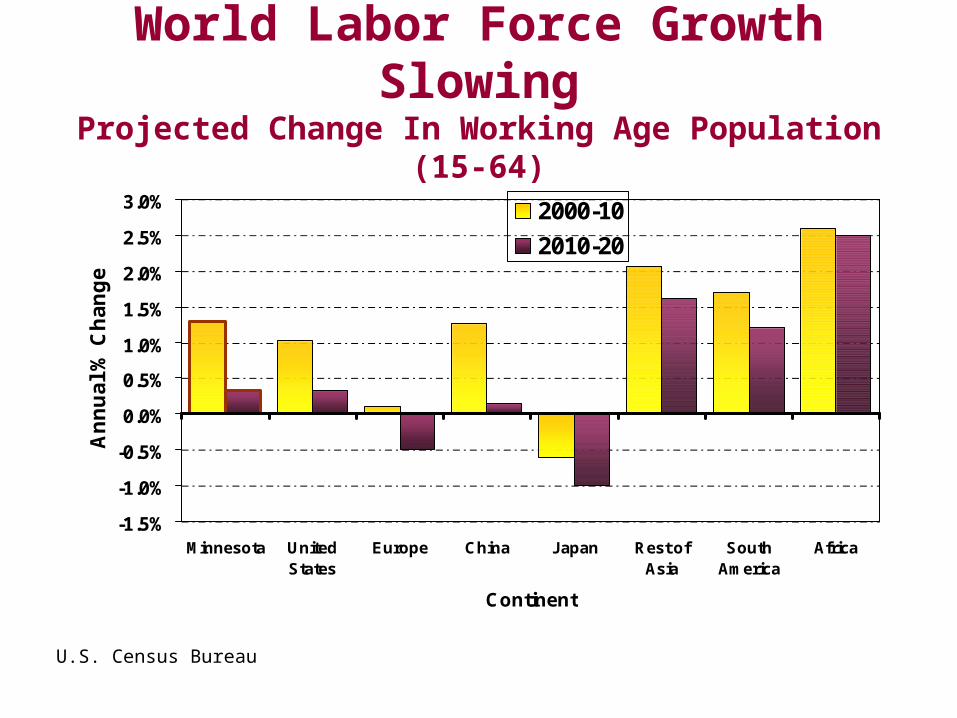
World Labor Force Growth SlowingProjected Change In Working Age Population (15-64)
-1.5%
-1.0%
-0.5%
0.0%
0.5%
1.0%
1.5%
2.0%
2.5%
3.0%
Minnesota UnitedStates
Europe China Japan Rest ofAsia
SouthAmerica
Africa
Continent
An
nu
al
% C
ha
ng
e
2000-10
2010-20
U.S. Census Bureau
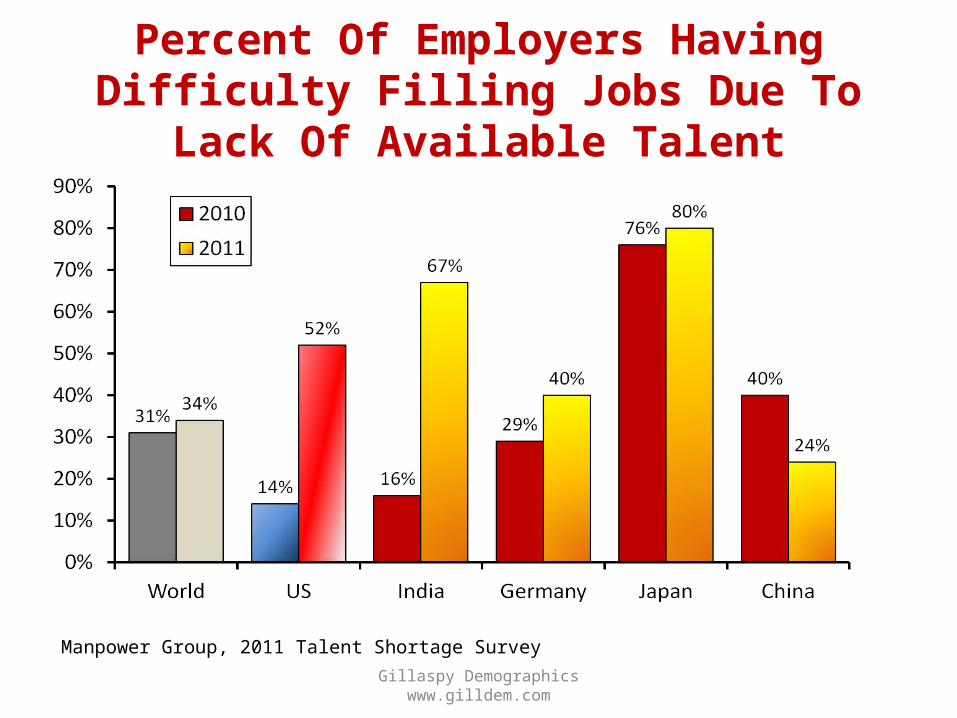
Percent Of Employers Having Difficulty Filling Jobs Due To Lack Of Available Talent
Manpower Group, 2011 Talent Shortage Survey
Gillaspy Demographics www.gilldem.com
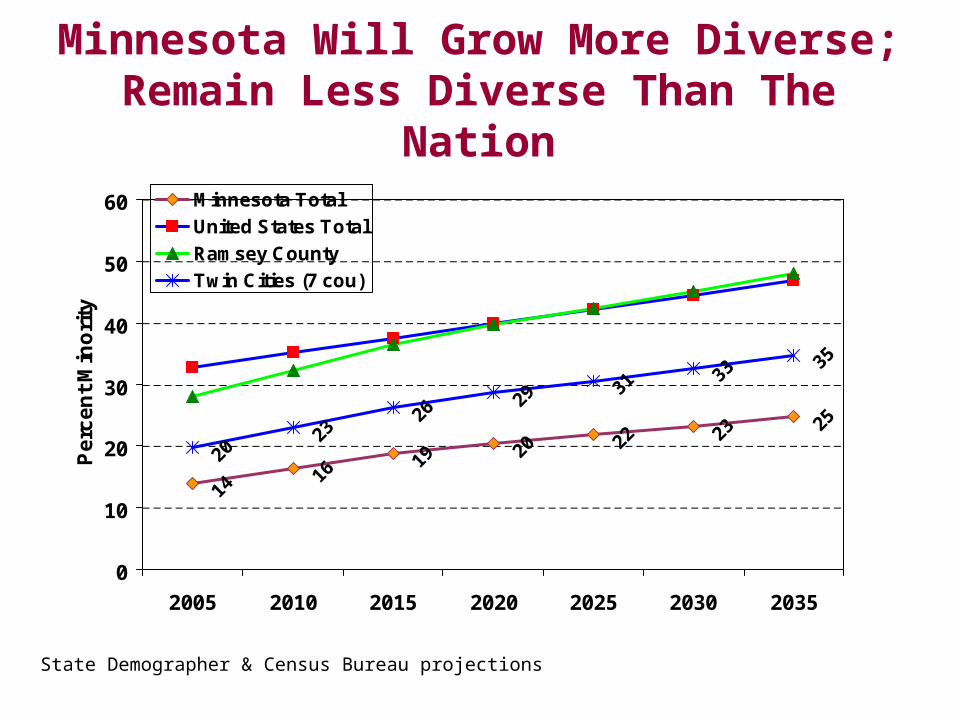
Minnesota Will Grow More Diverse; Remain Less Diverse Than The Nation
1416
19 20 22 23 25
2023
2629
3133
35
0
10
20
30
40
50
60
2005 2010 2015 2020 2025 2030 2035
Pe
rce
nt
Min
ori
ty
Minnesota Total
United States Total
Ramsey County
Twin Cities (7 cou)
State Demographer & Census Bureau projections
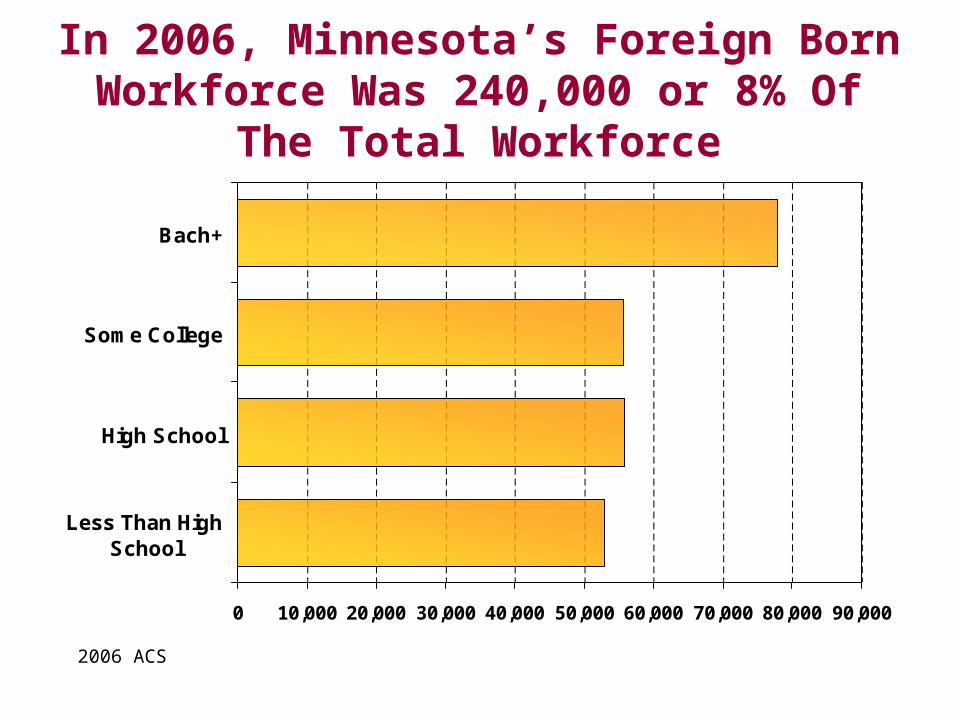
In 2006, Minnesota’s Foreign Born Workforce Was 240,000 or 8% Of The Total Workforce
0 10,000 20,000 30,000 40,000 50,000 60,000 70,000 80,000 90,000
Less Than HighSchool
High School
Some College
Bach+
2006 ACS
The Old Normal+ The Great Recession
+ Long Run Demographic Changes= The New Normal
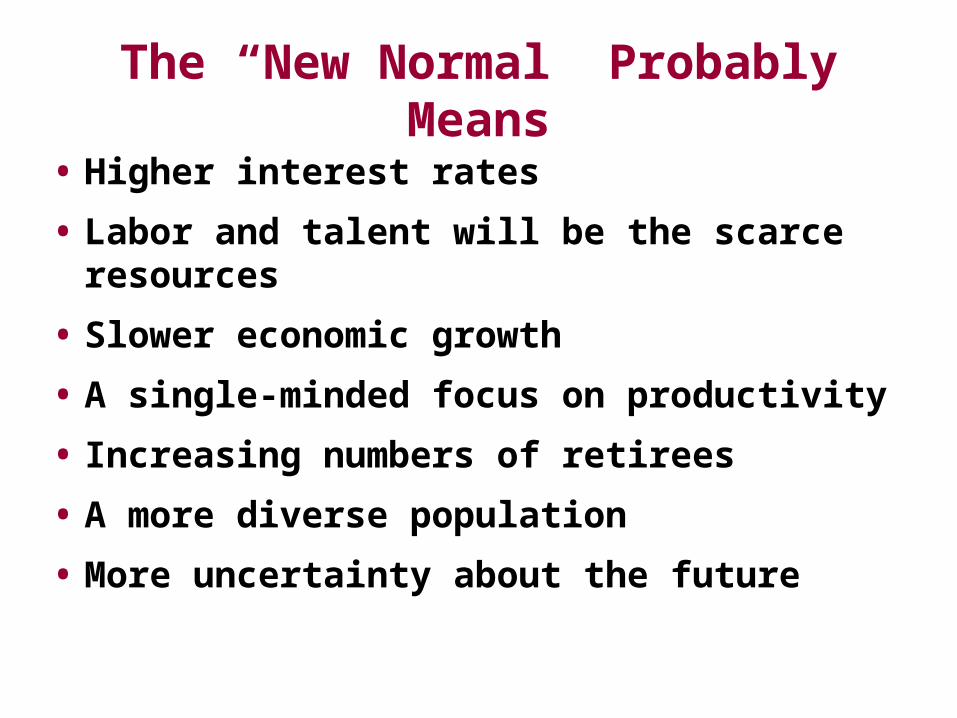
The “New Normal” Probably Means
• Higher interest rates
• Labor and talent will be the scarce resources
• Slower economic growth
• A single-minded focus on productivity
• Increasing numbers of retirees
• A more diverse population
• More uncertainty about the future
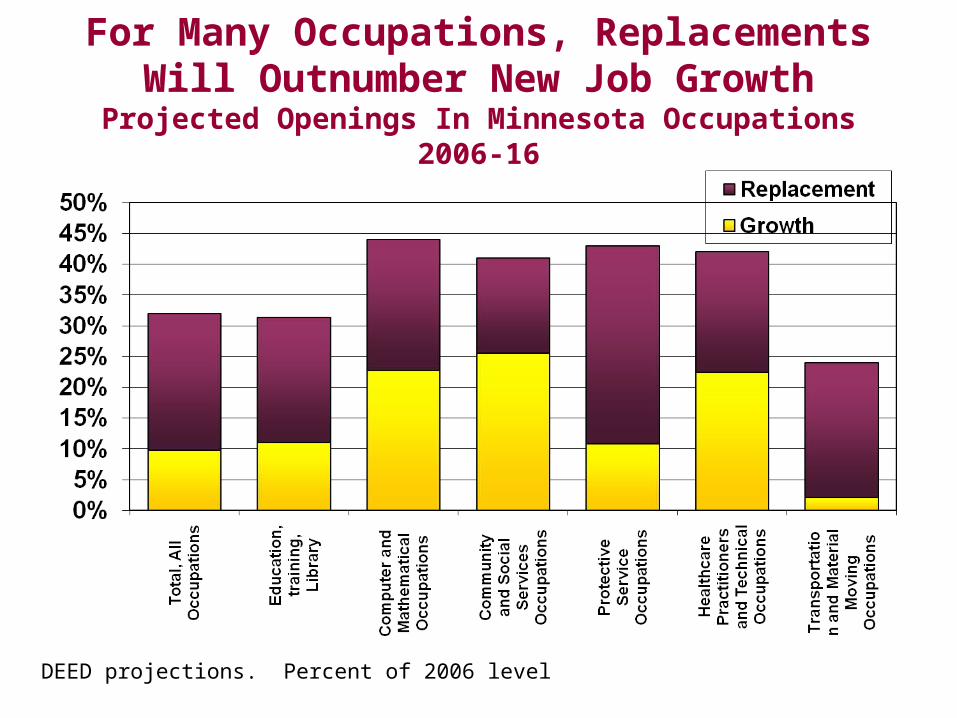
For Many Occupations, Replacements Will Outnumber New Job Growth
Projected Openings In Minnesota Occupations 2006-16
DEED projections. Percent of 2006 level
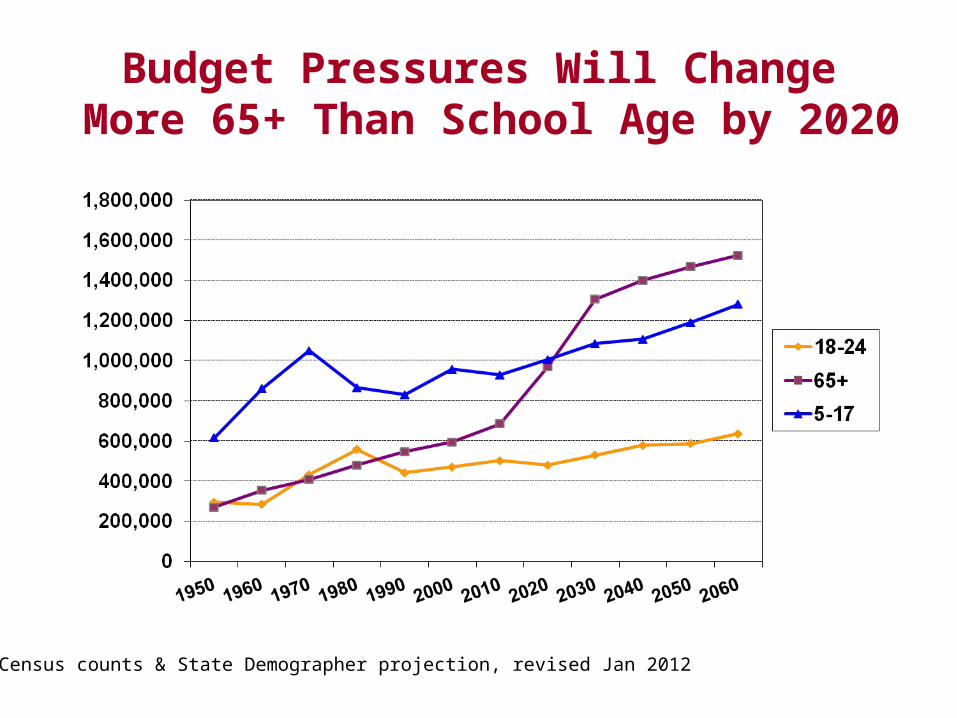
Budget Pressures Will Change More 65+ Than School Age by 2020
Census counts & State Demographer projection, revised Jan 2012
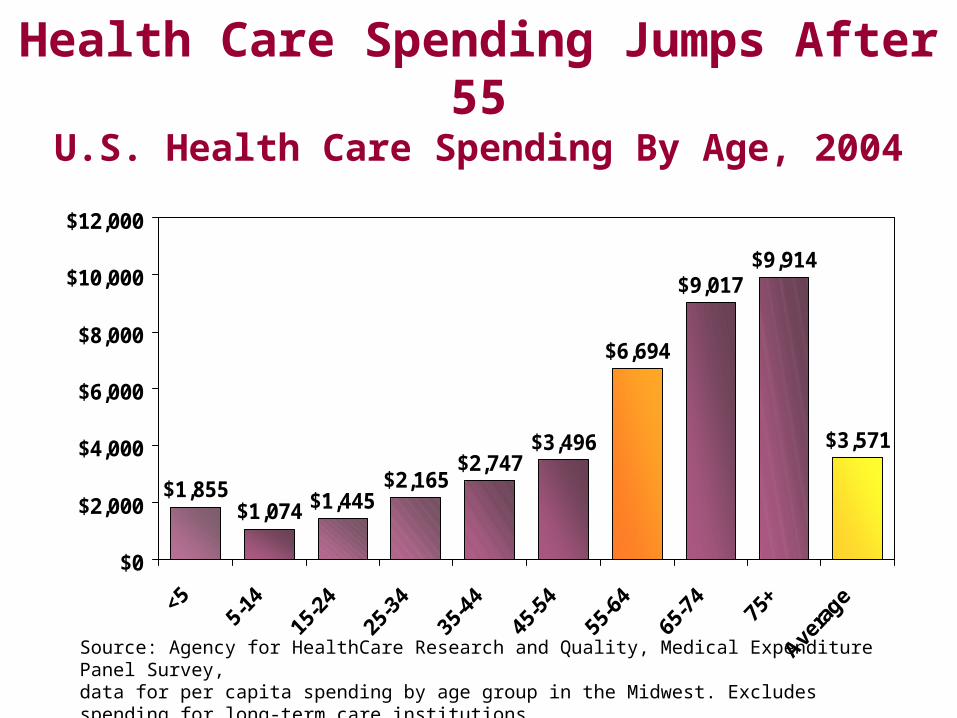
Health Care Spending Jumps After 55U.S. Health Care Spending By Age, 2004
$1,855$1,074 $1,445
$2,165$2,747
$3,496
$6,694
$9,017$9,914
$3,571
$0
$2,000
$4,000
$6,000
$8,000
$10,000
$12,000
Source: Agency for HealthCare Research and Quality, Medical Expenditure Panel Survey,data for per capita spending by age group in the Midwest. Excludes spending for long-term care institutions.
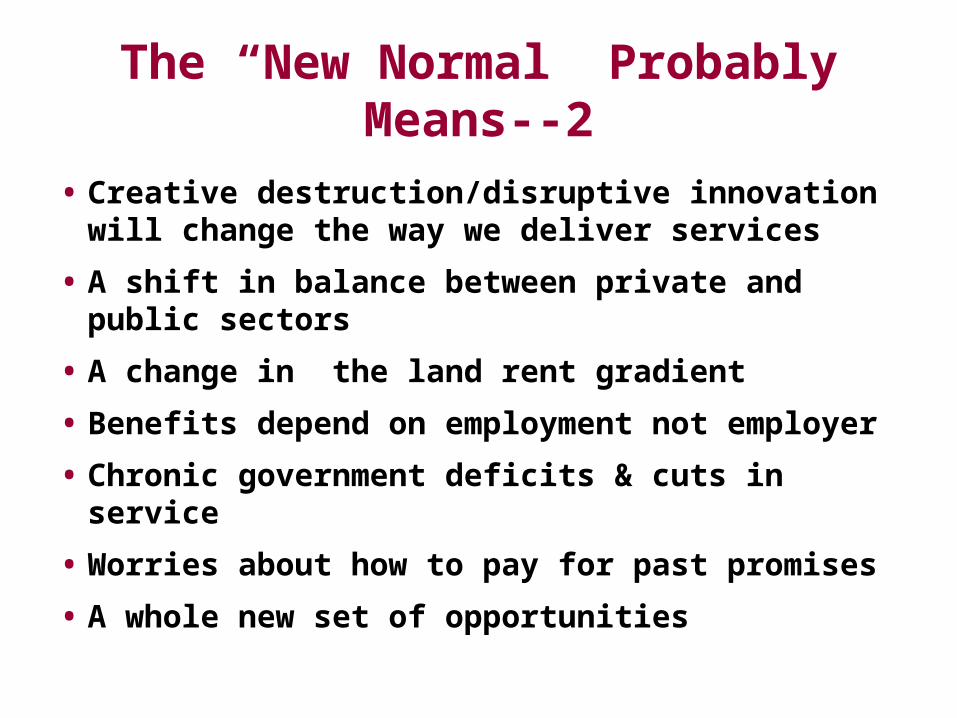
The “New Normal” Probably Means--2
• Creative destruction/disruptive innovation will change the way we deliver services
• A shift in balance between private and public sectors
• A change in the land rent gradient
• Benefits depend on employment not employer
• Chronic government deficits & cuts in service
• Worries about how to pay for past promises
• A whole new set of opportunities
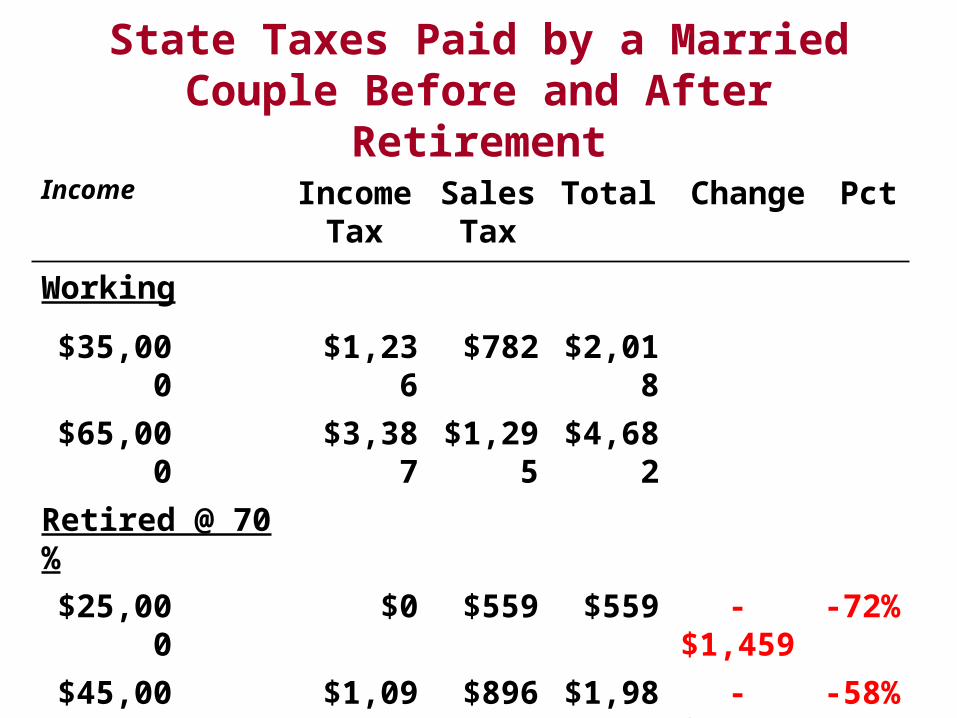
State Taxes Paid by a Married Couple Before and After Retirement
Income Income Tax
Sales Tax
Total Change Pct
Working
$35,000 $1,236 $782 $2,018
$65,000 $3,387 $1,295 $4,682
Retired @ 70 %
$25,000 $0 $559 $559 -$1,459 -72%
$45,000 $1,091 $896 $1,987 -$2,695 -58%
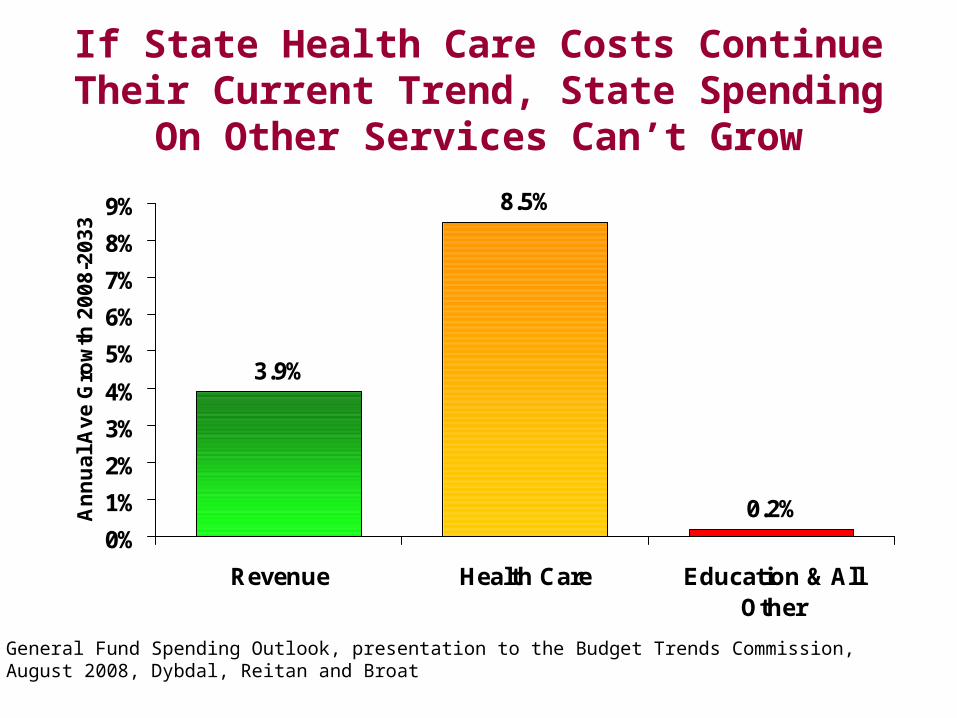
If State Health Care Costs Continue Their Current Trend, State Spending On Other Services Can’t Grow
3.9%
8.5%
0.2%0%
1%
2%
3%
4%
5%
6%
7%
8%
9%
Revenue Health Care Education & AllOther
An
nu
al
Av
e G
row
th 2
00
8-2
03
3
General Fund Spending Outlook, presentation to the Budget Trends Commission,August 2008, Dybdal, Reitan and Broat

Minnesota Faces a Fiscal Trap1. The issue is a long run, structural one— short run
solutions will not solve the problem
2. Trend growth alone will not be sufficient. Fundamental changes are necessary
3. Revenue growth will slow. Efforts to increase it will be met with resistance
4. Spending pressures will increase driven largely by issues of aging and health
5. State spending will shift its focus from education, infrastructure and higher education to care and support of the aging
The Great Recession Has Been Blamed for The Great Recession Has Been Blamed for Raising the Level of Social AngstRaising the Level of Social Angst
But What Is Really HappeningBut What Is Really Happening
Is That We Have Entered A Is That We Have Entered A
““NNeeww NNormal”ormal”
But Why Fear The New Normal?It Plays To Our Strengths!
Future economic growth will depend increasingly on increasing productivity and less on labor force size
Education has been the key to Minnesota’s productivity and prosperity
Future productivity increases will depend on decisions and the investments we make now
Public Sector Productivity Growth Will Be Essential
Productivity Is Not Just Producing at a Lower Cost
Increasing Productivity Also Means
Making things better
(improved quality)
Making better things
(innovation, new products)
Long term cost saving may require investments which
increase short term expenditures
Focusing Just On Expenditure Cuts May Be Short Sighted
“Making Things Better” May Offer the Greatest Potential
• Cost cutting efforts have focused on transactional jobs
• Largest future productivity gains are likely to come from investments that lead to better outcomesLower lifetime health care costs, reduced recidivism rates, improved graduation rates
• Adapting service delivery plans to meet the needs of the “New Normal”
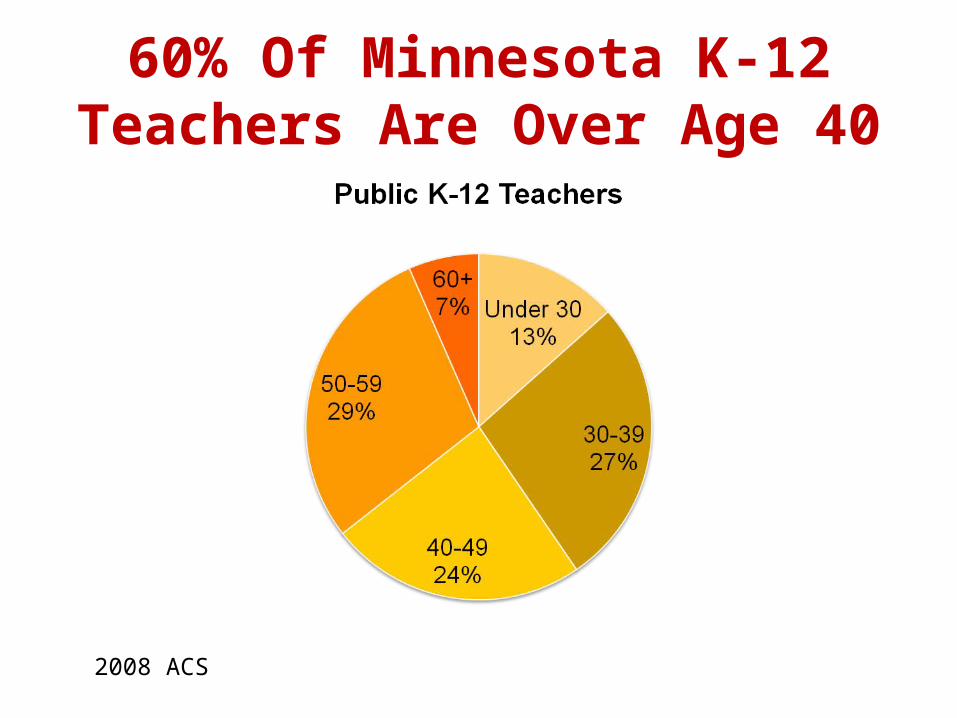
60% Of Minnesota K-12 Teachers Are Over Age 40
2008 ACS
3 R’s of Opportunity
• Restructure government costs
• Replace retiring government workers wisely
• Re-engage the growing retiree population

3 More R’s Of Opportunity
• Restructure government revenues
• Research to solve problems—for example improved graduation rates
• Restore entrepreneurship, initiative, invention in the private and public sectors
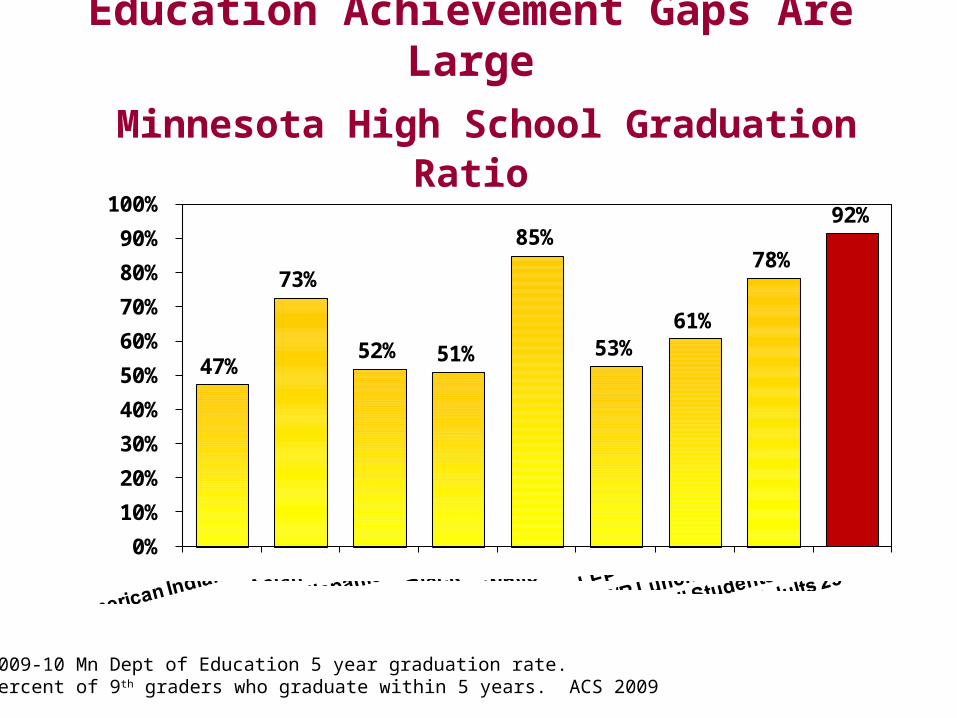
Education Achievement Gaps Are Large Minnesota High School Graduation Ratio
47%
73%
52% 51%
85%
53%61%
78%
92%
0%
10%
20%
30%
40%
50%
60%
70%
80%
90%
100%
2009-10 Mn Dept of Education 5 year graduation rate. Percent of 9th graders who graduate within 5 years. ACS 2009
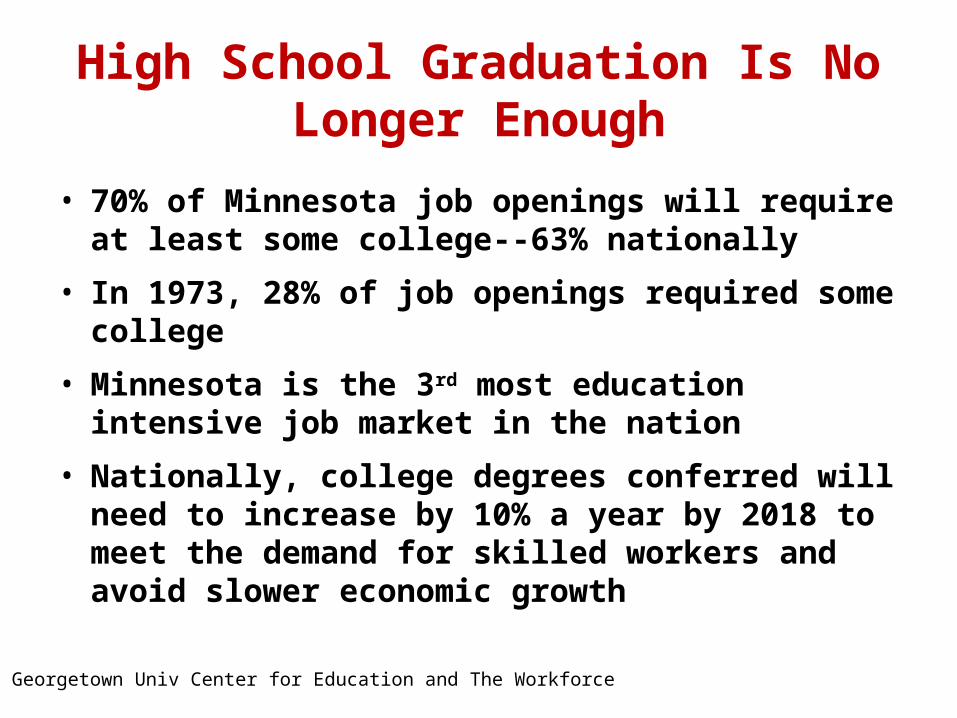
High School Graduation Is No Longer Enough
• 70% of Minnesota job openings will require at least some college--63% nationally
• In 1973, 28% of job openings required some college
• Minnesota is the 3rd most education intensive job market in the nation
• Nationally, college degrees conferred will need to increase by 10% a year by 2018 to meet the demand for skilled workers and avoid slower economic growth
Georgetown Univ Center for Education and The Workforce
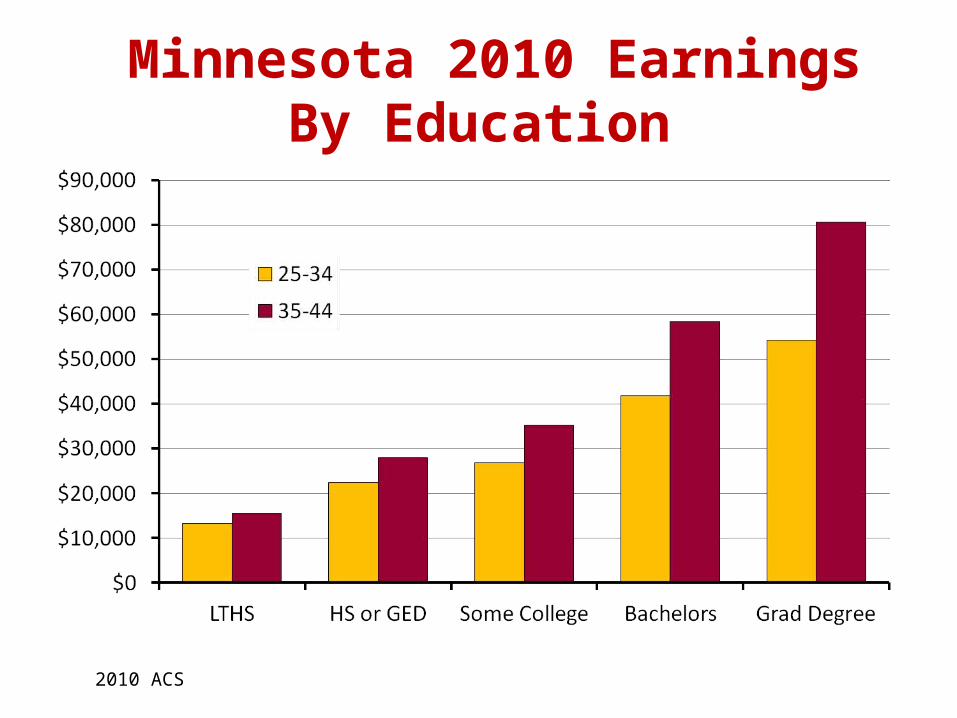
Minnesota 2010 Earnings By Education
2010 ACS
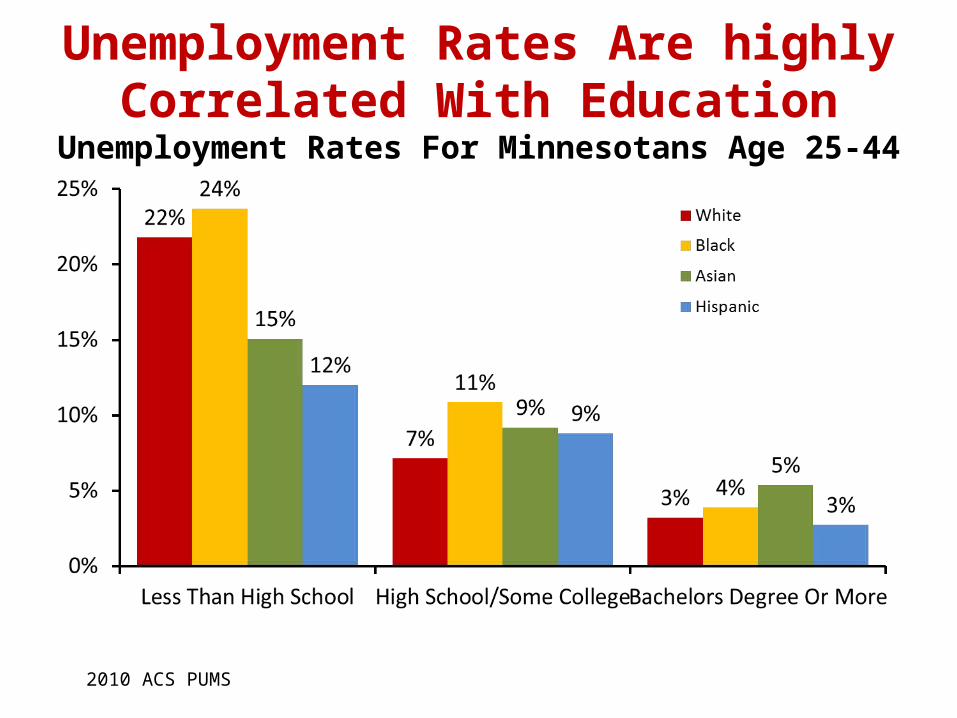
Unemployment Rates Are highly Correlated With Education
Unemployment Rates For Minnesotans Age 25-44
2010 ACS PUMS
The Fiscal Catch-22
If we don’t make the necessary public investments in human capital, research and infrastructure, then we won’t have the productivity gains needed to provide the resources to make those investments.
“If something can't go on forever, it will stop.”
Herbert Stein, Chair President Nixon’sCouncil of Economic Advisors

“I skate to where the puck will be, not to where it has been.”Wayne GretzkyFamous Canadian Philosopher