Embed Size (px)
Citation preview
Design by Nancy Ellefson
1
Minnesota Air, Water, and Minnesota Air, Water, and Waste Environmental Conf.Waste Environmental Conf.
Air Modeling – Training (8am-noon)Sheraton Bloomington Hotel, Atrium 7
February 14, 2006Chris Nelson & Dennis Becker
Minnesota Pollution Control Agency
X:\Old_P_Fox\AQPRJ\TOXTEAM\ModelTraining\
aq-ppt1-05

2
Air Modeling (98 Slides)Air Modeling (98 Slides)
AERMOD Status and MPCA “Draft” DataAERMOD Urban Modeling Developments
Metropolitan Statistical Areas and Micropolitan Statistical AreasNew MPCA NAAQS/MAAQS Feature: FAR DataBreak - slide 40Rochester and Olmsted County SIP Work
RPU-Silver Lake Plant Sensitivity AnalysesBreak - slide 75AERA/RASS with supplemental Post-RASS OptionFugitive PM10 emissions: roads, cooling towers, etc.VISCREEN (Nearby areas v. Class I areas)Future Possibilities

3
AERMODAERMODAERMOD promulgated Nov. 9, 2005
AERMOD/AERMAP/AERMET (04300)AERSCREEN (early 2006?)AERSURFACE (mid 2006?)
First PSD Project: RPU (March 2003)MPCA “Trial” Data (September 2004)MPCA “Draft” Data (October 2005)
http://www.pca.state.mn.us/air/modeling-data2.htmlSee next 15 slides

4
MPCA “Draft” Data for AERMODMPCA “Draft” Data for AERMOD

5
MPCA “Draft” Data for AERMODMPCA “Draft” Data for AERMOD

6
AERMAP “Draft” DataAERMAP “Draft” Data
AERMAP (04300) released Dec. 2005USGS 7.5 minute DEM files (Refined)
“Close-in” receptors (within ~10 km)“Distant” receptors too, if easy to do
USGS 1-degree DEM files (Screening)Maybe “Distant” receptors (beyond ~10 km)
Beware of AERMAP 03107 bugsVerify! Compare with DRG TOPO maps!

7
AERMET “Draft” Data AERMET “Draft” Data [National Weather Service (NWS)][National Weather Service (NWS)]Standard Meteorological Parameters
Wind speed, wind direction, temperature, etc.
Additional Land Use Land Cover ParametersAlbedo (solar reflection)
• Dark soil~0.1; snow cover~0.5Bowen Ratio (moisture term)
• Lower values for wet conditions• Higher values for dry conditions
Roughness Height (surface roughness)• Grass<0.1m; cropland~0.2m; dense forest~1m; big city~1m

8
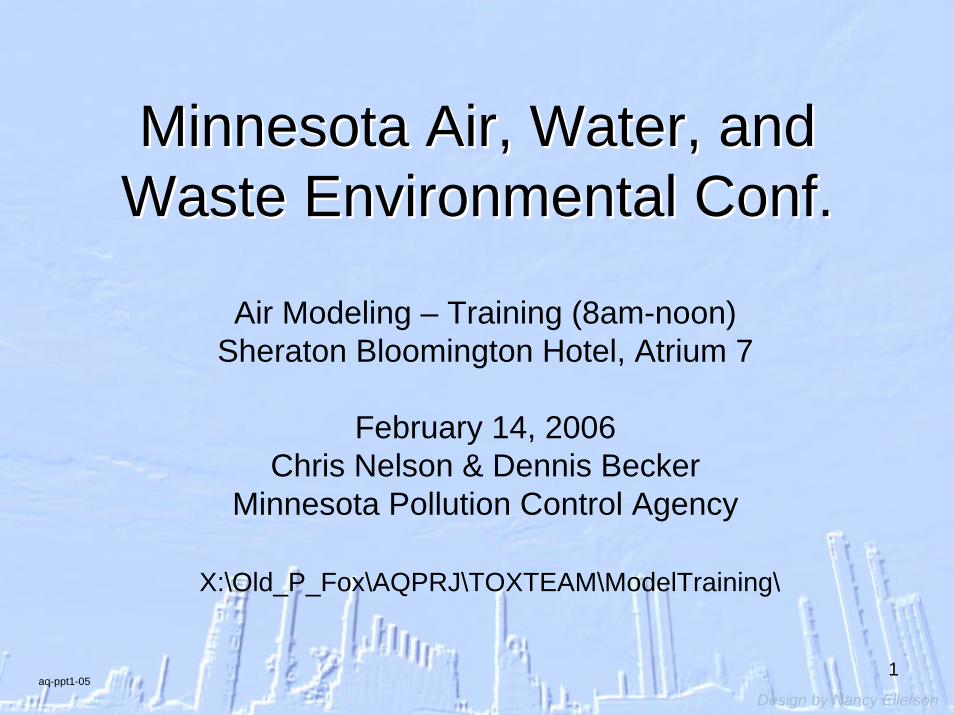
AERMET “Draft” Data AERMET “Draft” Data [National Weather Service (NWS)][National Weather Service (NWS)]Nine Surface Stations
Minnesota Sites: INL, HIB, DLH, MSP, RSTAdjacent States: FAR, SXF, EAU, LACMostly 1986-1990 (Hibbing: 1972-1976)National Land Cover Data (NLCD)Draft Values (Albedo, Bowen Ratio, Zo)
Two Upper Air Stations (INL, STC)Processed each 0.5 degrees lat./long.
9
NWS Sites (Yellow Stars) & NWS Sites (Yellow Stars) & Processed Sites (Red Dots)Processed Sites (Red Dots)
")
!(!(!(!(!(!(!(!(!(!(!(!(!(
!(!(!(!(!(!(!(!(!(!(!(!(!(
!(!(!(!(!(!(!(!(!(!(!(!(!(
!(!(!(!(!(!(!(!(!(!(!(!(!(
!(!(!(!(!(!(!(!(!(!(!(!(!(
!(!(!(!(!(!(!(!(!(!(!(!(!(
!(!(!(!(!(!(!(!(!(!(!(!(!(
!(!(!(!(!(!(!(!(!(!(!(!(!(
!(!(!(!(!(!(!(!(!(!(!(!(!(
!(!(!(!(!(!(!(!(!(!(!(!(!(
!(!(!(!(!(!(!(!(!(!(!(!(!(
!(!(!(!(!(!(!(!(!(!(!(!(!(
!(!(!(!(!(!(!(!(!(!(!(!(!(
[_
[_
[_
[_
[_
[_
[_[_
[_
98°0'0"W
97°0'0"W
97°0'0"W
96°0'0"W
96°0'0"W
95°0'0"W
95°0'0"W
94°0'0"W
94°0'0"W
93°0'0"W
93°0'0"W 92°0'0"W
92°0'0"W
91°0'0"W
91°0'0"W
90°0'0"W
3°0'0"N 43°0'0"
4°0'0"N 44°0'0"
5°0'0"N 45°0'0"
6°0'0"N 46°0'0"
7°0'0"N 47°0'0"
8°0'0"N 48°0'0"
9°0'0"N 49°0'0"

10
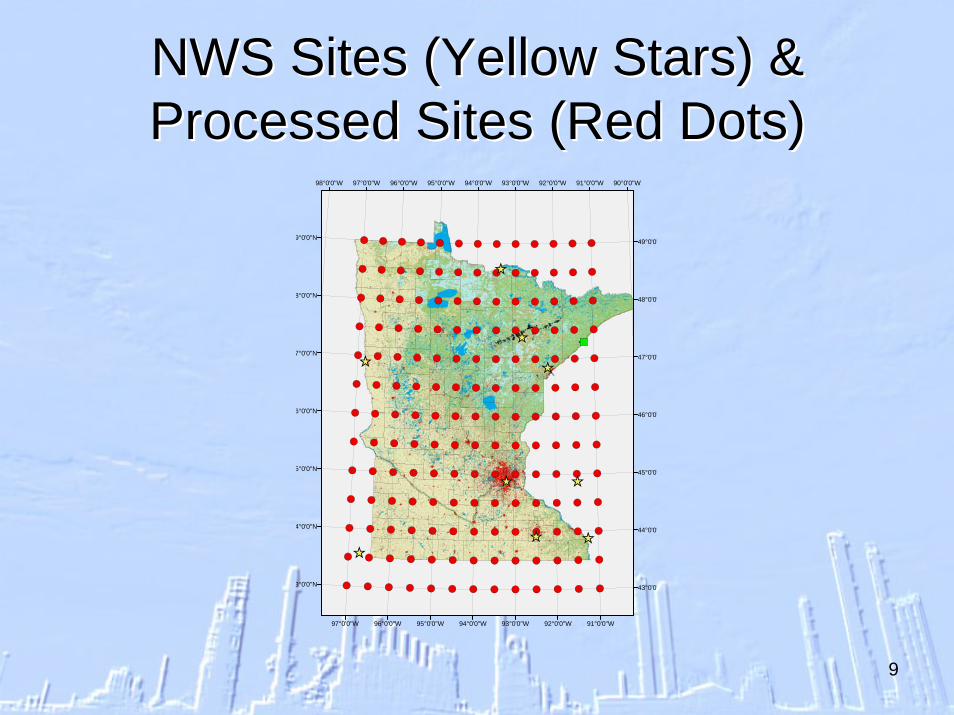
AERMET “Draft” Surface DataAERMET “Draft” Surface Data
Compare project site vs. NWS sites:Prevailing winds (annual, season, month?)Land Use Land Cover (LULC)
• Monthly and annual values• Twelve 30 degree sectors• 3 kilometer radius
Roughness Height (Zo) very importantAlbedo and Bowen Ratio less important
Select most representative NWS site

11
AERMET “Draft” Surface DataAERMET “Draft” Surface Data
12
AERMET “Draft” Surface DataAERMET “Draft” Surface Data
13
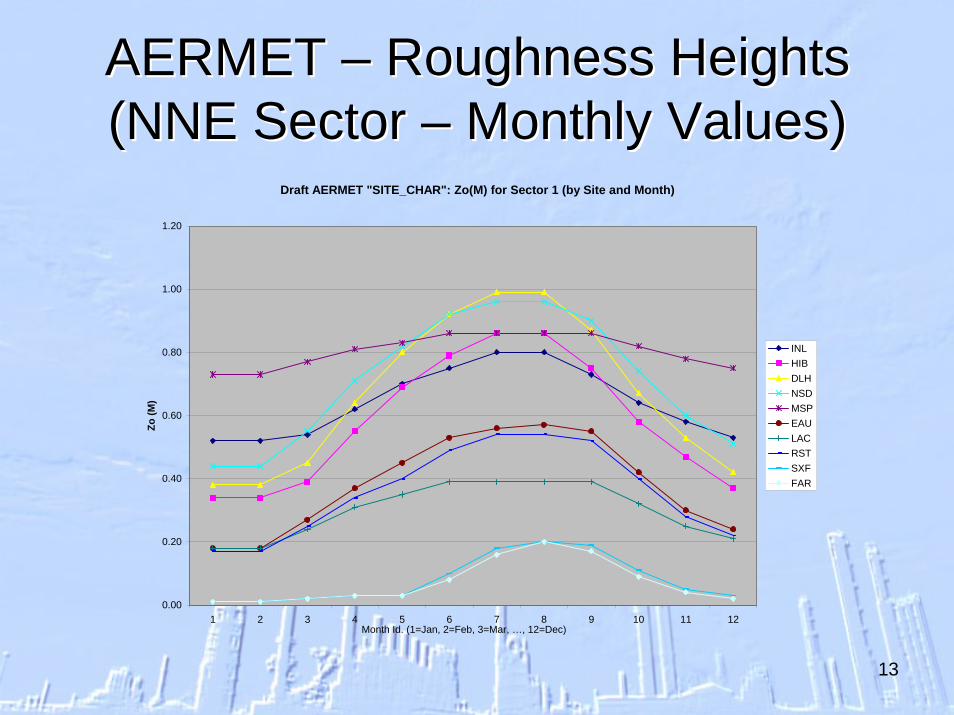
AERMET AERMET –– Roughness Heights Roughness Heights (NNE Sector (NNE Sector –– Monthly Values)Monthly Values)
Draft AERMET "SITE_CHAR": Zo(M) for Sector 1 (by Site and Month)
0.00
0.20
0.40
0.60
0.80
1.00
1.20
1 2 3 4 5 6 7 8 9 10 11 12
Zo (M
)
INLHIBDLHNSDMSPEAULACRSTSXFFAR
Month Id. (1=Jan, 2=Feb, 3=Mar, …, 12=Dec)

14
AERMET AERMET –– Roughness Heights Roughness Heights (ALL 12 Sectors (ALL 12 Sectors –– Monthly Values)Monthly Values)
Draft AERMET "SITE_CHAR": Zo(M) (12 Sectors & 12 Months [144 Values])
0.00
0.20
0.40
0.60
0.80
1.00
1.20
1 13 25 37 49 61 73 85 97 109 121 133
12 Sectors * 12 Months
Zo (M
)
INLHIBDLHNSDMSPEAULACRSTSXFFAR

15
AERMET AERMET –– Roughness Heights Roughness Heights (Northern MN (Northern MN –– All 12 Sectors)All 12 Sectors)
Draft AERMET "SITE_CHAR": Zo(M) (12 Sectors & 12 Months [144 Values])
0.00
0.20
0.40
0.60
0.80
1.00
1.20
1 13 25 37 49 61 73 85 97 109 121 133
12 Sectors * 12 Months
Zo (M
)
INLHIBDLHNSD

16
AERMET AERMET –– Roughness Heights Roughness Heights (Southern MN (Southern MN –– All 12 Sectors)All 12 Sectors)
Draft AERMET "SITE_CHAR": Zo(M) (12 Sectors & 12 Months [144 Values])
0.00
0.20
0.40
0.60
0.80
1.00
1.20
1 13 25 37 49 61 73 85 97 109 121 133
12 Sectors * 12 Months
Zo (M
) RSTSXFFAR

17
AERMET “Draft” Upper Air DataAERMET “Draft” Upper Air Data
Generally use INL in northern MNGenerally use STC in southern MNLess important than selecting surface site
18
AERMOD SummaryAERMOD SummaryMPCA expects AERMOD (04300):
State Air Emission Risk Analyses (AERA)Federal PSD and SIP modeling
Possible Exceptions:ScreeningResidual Title V modeling (state requirement)Miscellaneous non-regulatory applications
Questions?

19
AERMOD AERMOD –– Urban ApplicationsUrban Applications
“AERMOD Implementation Guide”“Urban Determination”
• “Selecting population data for AERMOD’s urban mode”• See Metropolitan Statistical Area (MSA) web sites
– See next slide for examples
U. S. Census Bureau Web site:http://www.census.gov/population/www/estimates/metrodef.html
“OMB Bulletin No. 05-02”• Metropolitan Statistical Areas (MSA)
– Also includes Micropolitan Statistical Areas

20
Some MSA Web SitesSome MSA Web Sites

21
AERMOD AERMOD -- Urban ApplicationsUrban Applications
“AERMOD Implementation Guide”“Urban Determination”
• “Selecting population data for AERMOD’s urban mode”• See Metropolitan Statistical Area (MSA) web sites
U. S. Census Bureau Web site:http://www.census.gov/population/www/estimates/metrodef.html
“OMB Bulletin No. 05-02”• Metropolitan Statistical Areas (MSA)
– Also includes Micropolitan Statistical Areas
22
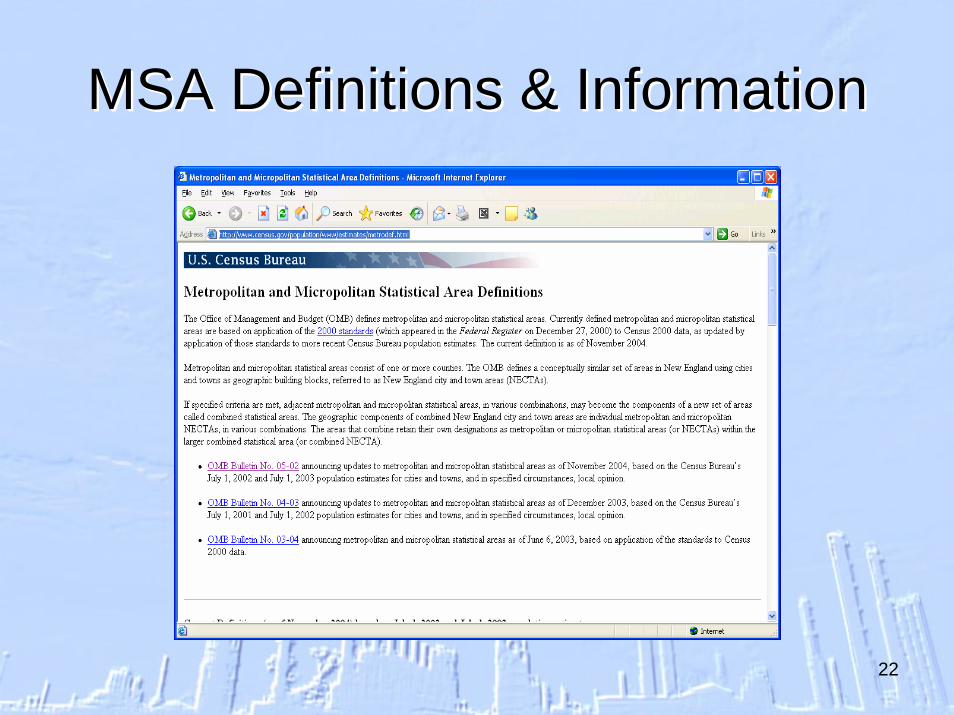
MSA Definitions & InformationMSA Definitions & Information

23
OMB Bulletin No. 05OMB Bulletin No. 05--0202

24
OMB Bulletin No. 05OMB Bulletin No. 05--02 (Appendix)02 (Appendix)

25
Appendix Appendix –– List of Statistical AreasList of Statistical Areas

26
Metropolitan Statistical Areas andMetropolitan Statistical Areas andMicropolitanMicropolitan Statistical Areas in MinnesotaStatistical Areas in Minnesota

27
Metropolitan Statistical AreasMetropolitan Statistical Areasand and MicropolitanMicropolitan Statistical AreasStatistical Areas

28
Metropolitan Statistical Areas andMetropolitan Statistical Areas andMicropolitanMicropolitan Statistical Areas in Northern MNStatistical Areas in Northern MN
29
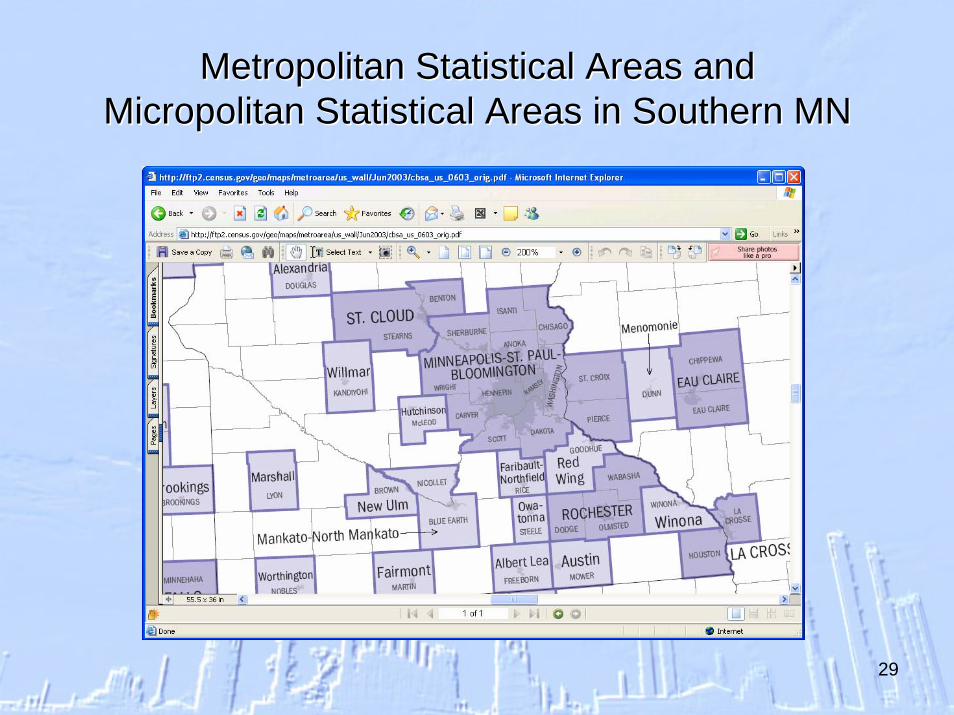
Metropolitan Statistical Areas andMetropolitan Statistical Areas andMicropolitanMicropolitan Statistical Areas in Southern MNStatistical Areas in Southern MN

30
Urban Guidance Urban Guidance –– Stay TunedStay Tuned
More Urban Guidance (Pending)Just know this out there (for now)Questions?
31
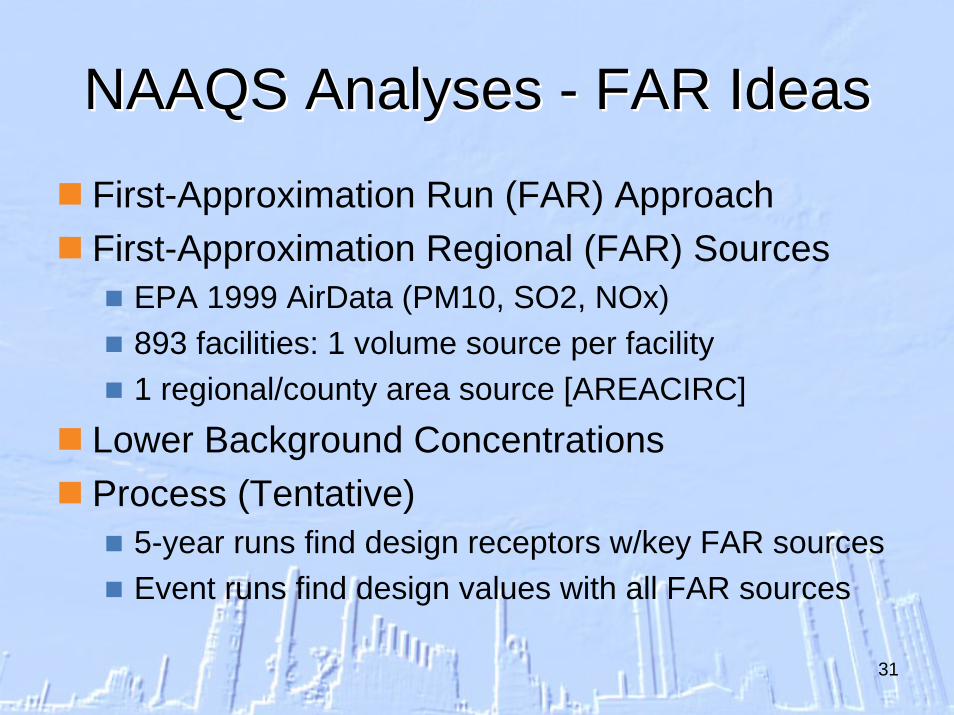
NAAQS Analyses NAAQS Analyses -- FAR IdeasFAR Ideas
First-Approximation Run (FAR) ApproachFirst-Approximation Regional (FAR) Sources
EPA 1999 AirData (PM10, SO2, NOx)893 facilities: 1 volume source per facility1 regional/county area source [AREACIRC]
Lower Background ConcentrationsProcess (Tentative)
5-year runs find design receptors w/key FAR sourcesEvent runs find design values with all FAR sources

32
EPA Facility “EPA Facility “AirDataAirData” (1999)” (1999)
33
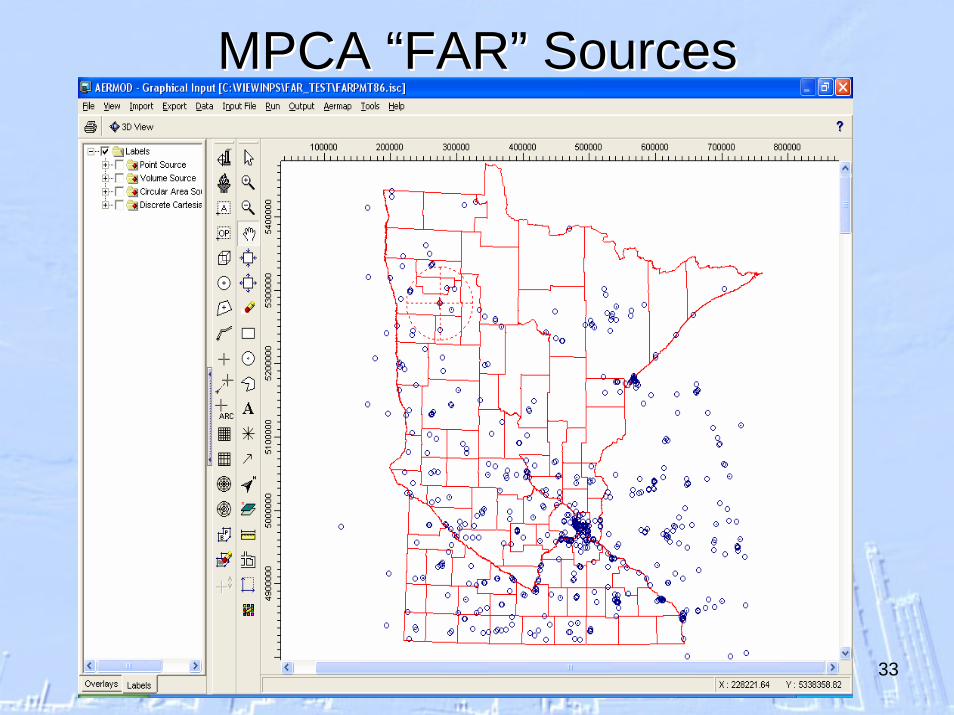
MPCA “FAR” SourcesMPCA “FAR” Sources

34
NAAQS Analyses NAAQS Analyses -- FAR IdeasFAR IdeasFirst-Approximation Run (FAR) Approach
893 Facilities (1 volume source/facility)Release Height depends on SO2Sigma-Y (~20m) and Sigma-Z (~10m)EMISFACT scalars for facilities < 50km
• Re-computed for each project location!!!No EMISFACT scalars for facilities > 50km
1 regional/county area source [AREACIRC]Release Height (~10m)Radius (50,000m)Sigma-Z (0m)No EMISFACT scalars
35
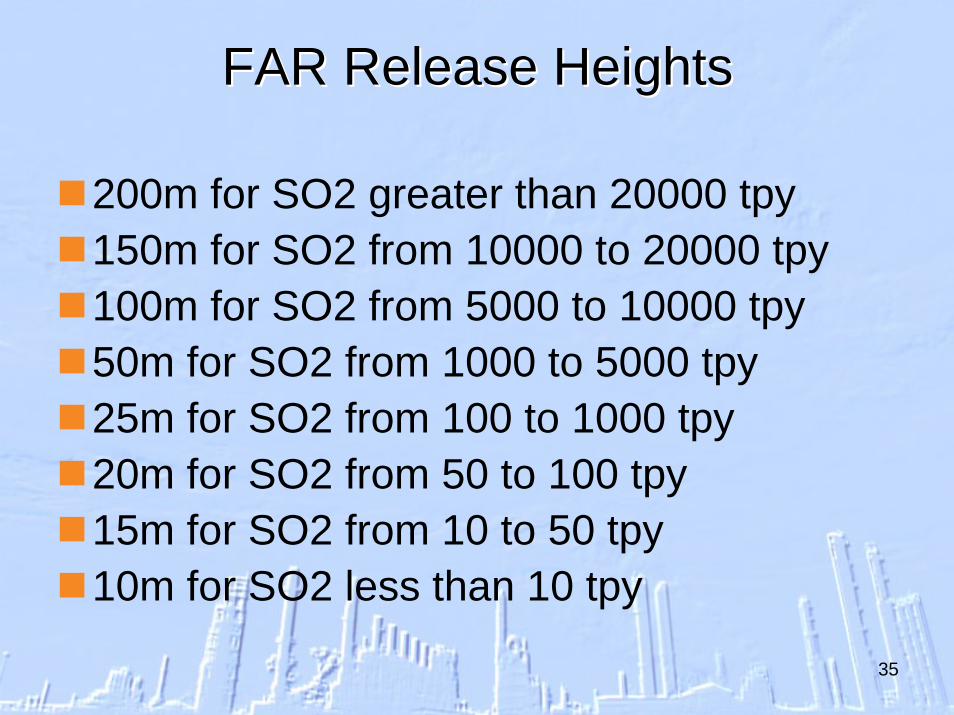
FAR Release HeightsFAR Release Heights
200m for SO2 greater than 20000 tpy150m for SO2 from 10000 to 20000 tpy100m for SO2 from 5000 to 10000 tpy50m for SO2 from 1000 to 5000 tpy25m for SO2 from 100 to 1000 tpy20m for SO2 from 50 to 100 tpy15m for SO2 from 10 to 50 tpy10m for SO2 less than 10 tpy
36
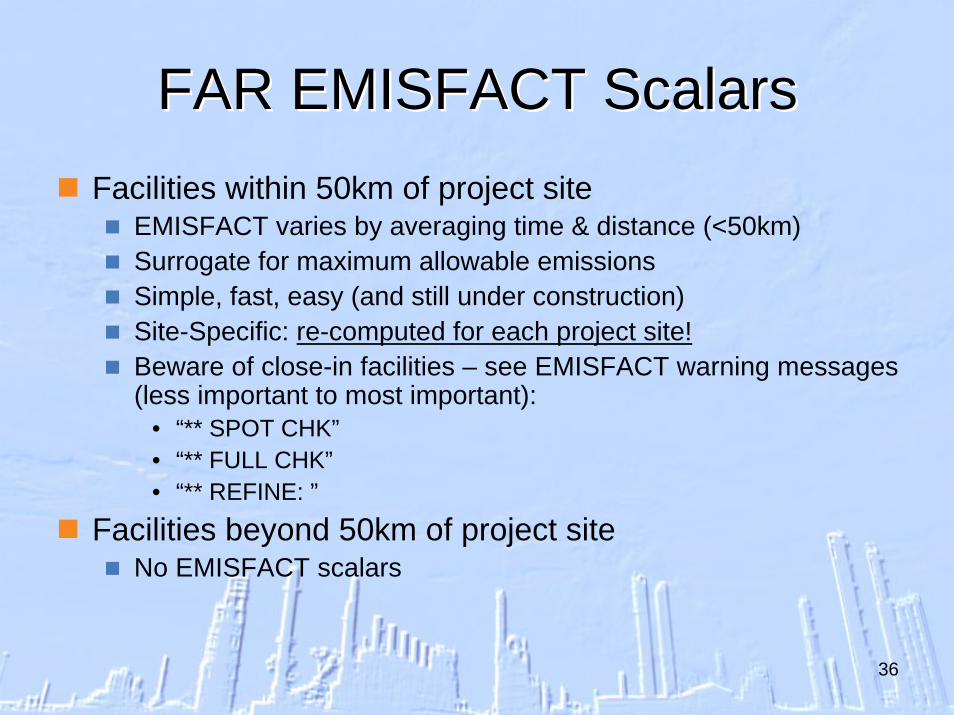
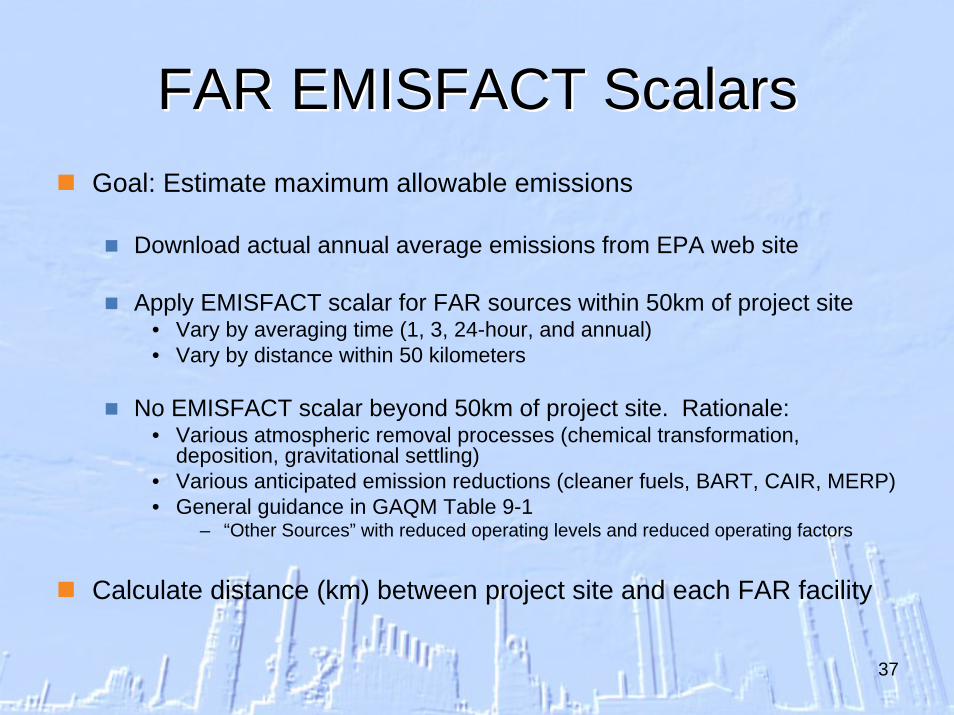
FAR EMISFACT ScalarsFAR EMISFACT ScalarsFacilities within 50km of project site
EMISFACT varies by averaging time & distance (<50km)Surrogate for maximum allowable emissionsSimple, fast, easy (and still under construction)Site-Specific: re-computed for each project site!Beware of close-in facilities – see EMISFACT warning messages (less important to most important):
• “** SPOT CHK”• “** FULL CHK”• “** REFINE: ”
Facilities beyond 50km of project siteNo EMISFACT scalars
37
FAR EMISFACT ScalarsFAR EMISFACT ScalarsGoal: Estimate maximum allowable emissions
Download actual annual average emissions from EPA web site
Apply EMISFACT scalar for FAR sources within 50km of project site• Vary by averaging time (1, 3, 24-hour, and annual)• Vary by distance within 50 kilometers
No EMISFACT scalar beyond 50km of project site. Rationale:• Various atmospheric removal processes (chemical transformation,
deposition, gravitational settling)• Various anticipated emission reductions (cleaner fuels, BART, CAIR, MERP)• General guidance in GAQM Table 9-1
– “Other Sources” with reduced operating levels and reduced operating factors
Calculate distance (km) between project site and each FAR facility

38
FAR EMISFACT ScalarsFAR EMISFACT ScalarsCalculate DISTKM (distance [km] to each FAR facility)
Calculate EMISFACT
EF01HOUR = 1000.00 / DISTKMEF03HOUR = 1000.00 / DISTKMEF24HOUR = 500.00 / DISTKMEFANNUAL = 100.00 / DISTKM
Annual Examples:EMISFACT = 2.00 at 50.0 kmEMISFACT = 20.0 at 5.00 kmEMISFACT = 200 at 0.50 km

39
FAR SummaryFAR SummaryRelatively simple, fast, easy
Still under construction (work-in-progress)Re-compute for each project location
EMISFACT scalarsPossible Improvements:
Post 1999 dataMore pollutants (e.g., CO, Lead, H2S)More release heightsRefined scalars (e.g. by industry sector?)
Questions?
40
BreakBreak
Back in 15 Minutes
41
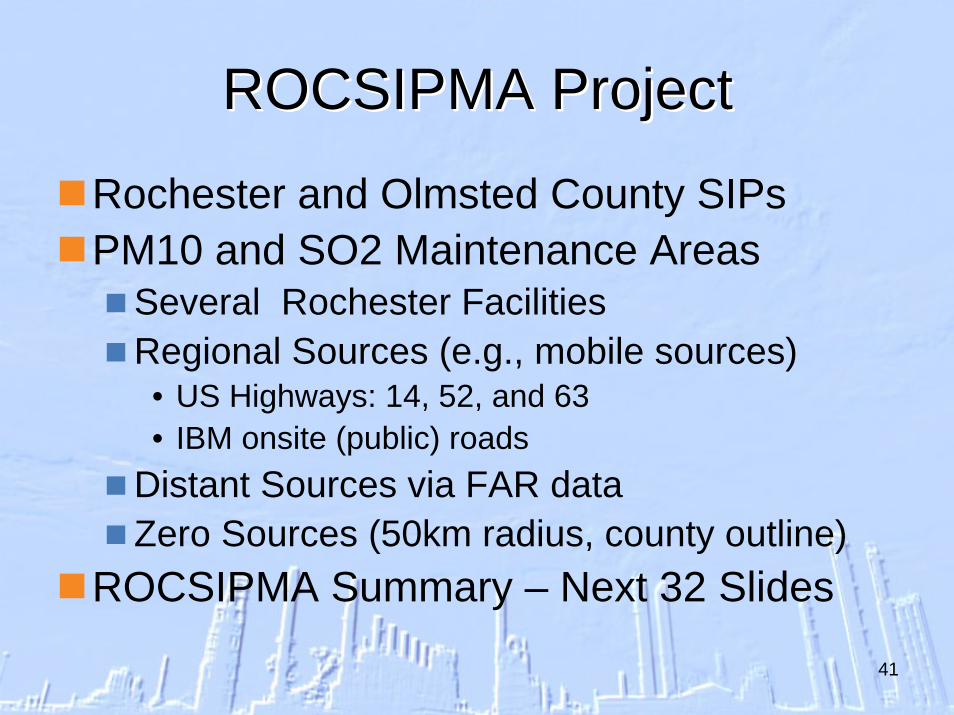
ROCSIPMA ProjectROCSIPMA Project
Rochester and Olmsted County SIPsPM10 and SO2 Maintenance Areas
Several Rochester FacilitiesRegional Sources (e.g., mobile sources)
• US Highways: 14, 52, and 63• IBM onsite (public) roads
Distant Sources via FAR dataZero Sources (50km radius, county outline)
ROCSIPMA Summary – Next 32 Slides

42
ROCSIPMA TasksROCSIPMA Tasks
Data CollectionWork Orders for Key FacilitiesLiterature values for roads and other sources
• Paved Roads and Highways; Unpaved Roads• Other Sources (e.g., cooling towers)
“Actual” emissions for distant “FAR” sourcesComputational Challenges
Many sources and many receptors“Key” sources for slow, 5-year runs“ALL” sources for fast, event runs

43
Rochester Highway AssumptionsRochester Highway Assumptions
Average Daily Traffic (ADT) RatesUS Highway 14 at 25,000US Highway 52 at 65,000US Highway 63 at 25,000
Fleet-average vehicle weight of 5 TonsPaved road silt loading at 0.03 grams/m2Receptors at 10, 20, 50, 100, 200 metersUrban Dispersion
“CO URBANOPT 100000 Rochester 0.4”

44
Minnesota Traffic Count DataMinnesota Traffic Count Data

45
Rochester ADT (2004 Data)Rochester ADT (2004 Data)

46
Rochester Highways (14,52,63)Rochester Highways (14,52,63)
47
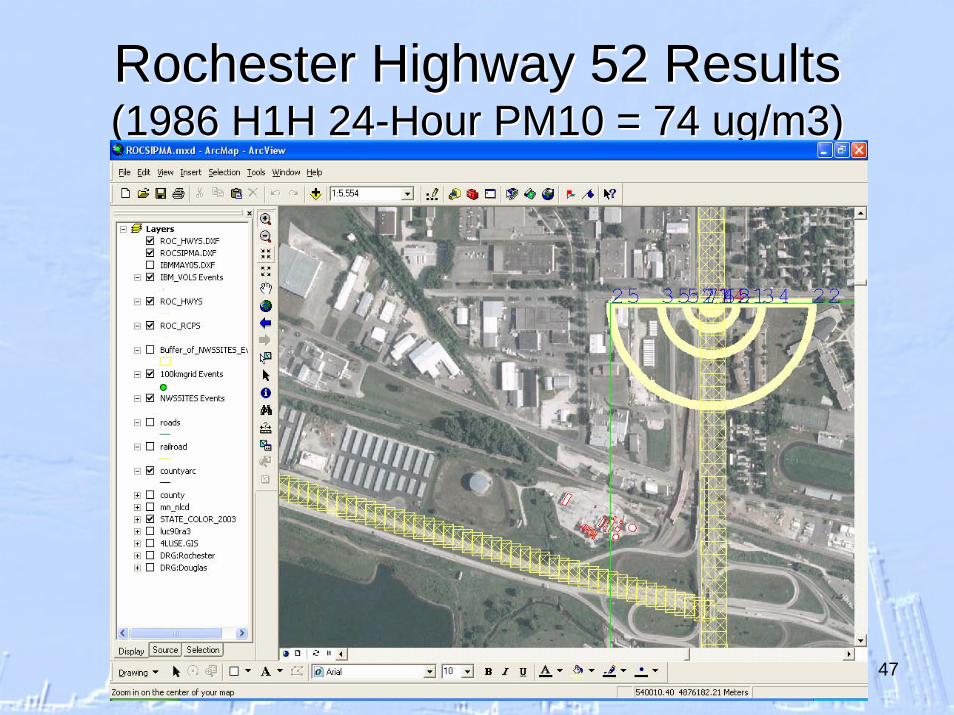
Rochester Highway 52 ResultsRochester Highway 52 Results(1986 H1H 24(1986 H1H 24--Hour PM10 = 74 ug/m3)Hour PM10 = 74 ug/m3)

48
Rochester Highway PM10 Tests Rochester Highway PM10 Tests (ISCST3, ISC(ISCST3, ISC--PRIME, AERMOD)PRIME, AERMOD)

49
Rochester Public Utilities Rochester Public Utilities –– Silver Lake Plant Silver Lake Plant Sensitivity AnalysesSensitivity Analyses
Receptor Grid360 polar receptors (36 directions and 10 downwind distances)94 discrete receptors (property line)
6 Stacks: 4 Boilers and 2 Cooling TowersGroup 1: SV03 (SH~90m) minimal building downwashGroup 2: SV01 (SH~61m) moderate building downwashGroup 3: SV02 (SH~61m) moderate building downwashGroup 4: SV04 (SH~27m) extreme building downwash
Group 5: CT03 (SH~19m) cooling towerGroup 6: CT02 (SH~14m) cooling tower
7 Fugitive Sources (groups 7-13, respectively)“ALL” Source Group (group 14)

50
Site Layout (2D View)Site Layout (2D View)

51
Site Layout (2D View)Site Layout (2D View)
52
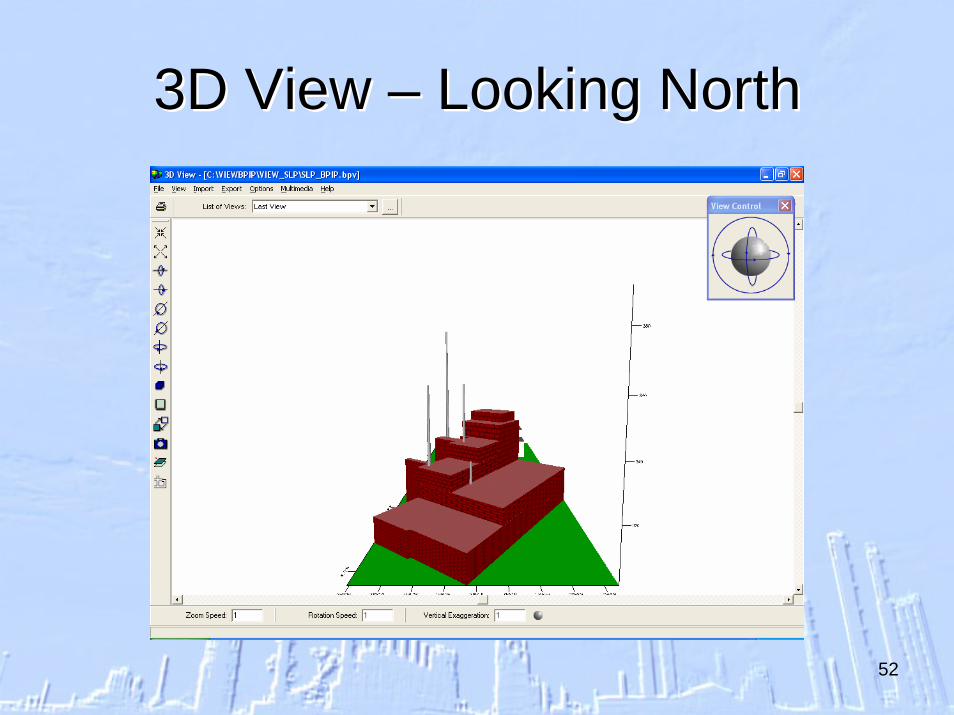
3D View 3D View –– Looking NorthLooking North

53
3D View 3D View –– Looking ENELooking ENE

54
Polar ReceptorsPolar Receptors

55
Discrete ReceptorsDiscrete Receptors

56
Base Case vs. 84 “ABZ” TestsBase Case vs. 84 “ABZ” TestsAERMOD/AERMET/AERMAP (02222)
First 100 Days of 1990 (Meteorology)Base Case: RPU-SLP 24-Hour PM10 Modeling
All “urban” LULC [Zo=1m]84 “ABZ” Combinations [3*4*7=84]
3 Albedos (A=0.1, 0.3, and 0.5) [dark to light]4 Bowen Ratios (B=0.1, 0.5, 0.9, and 4.0) [wet to dry]7 Roughness Heights (Zo=0.01, 0.2, 0.4, 0.6, 0.8, 1.0, and 1.2 meters) [smooth to rough]
Results: “Percent of Base Case”

57
Group 1 (SV03) Group 1 (SV03) RuralRural ResultsResults

58
Group 1 (SV03) Group 1 (SV03) UrbanUrban ResultsResults

59
Groups 1Groups 1--6 6 RuralRural Results Results (SV03,SV01,SV02,SV04,CT03,CT02)(SV03,SV01,SV02,SV04,CT03,CT02)

60
Groups 1Groups 1--6 6 UrbanUrban Results Results (SV03,SV01,SV02,SV04,CT03,CT02)(SV03,SV01,SV02,SV04,CT03,CT02)

61
Groups 7Groups 7--13 13 RuralRural ResultsResults(Various Fugitive Sources)(Various Fugitive Sources)

62
Groups 7Groups 7--13 13 UrbanUrban ResultsResults(Various Fugitive Sources)(Various Fugitive Sources)

63
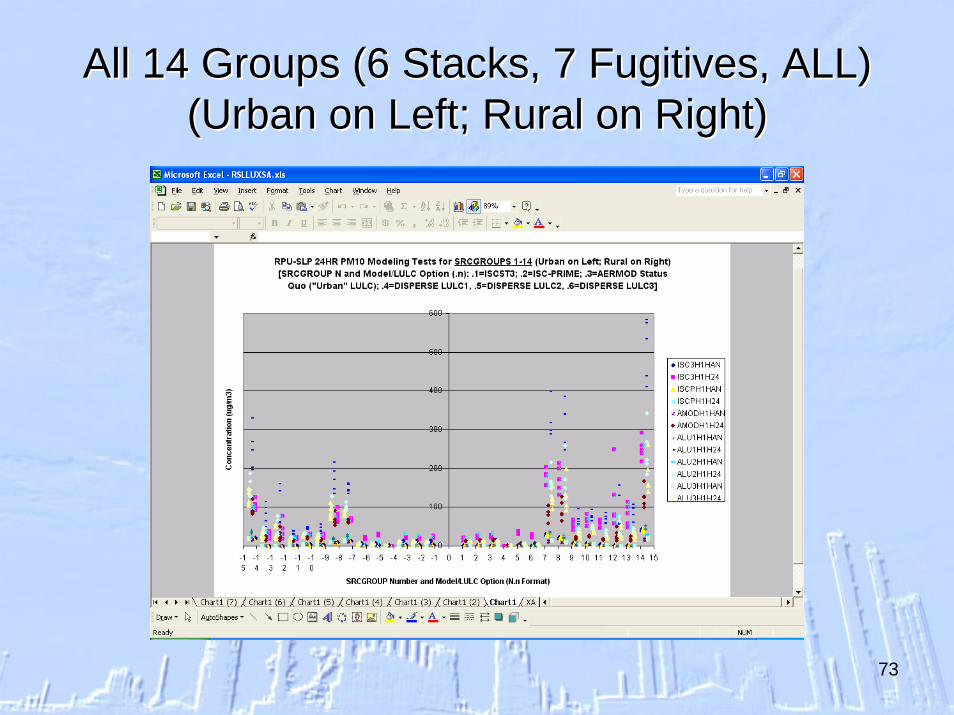
All 14 Groups (6 Stacks, 7 Fugitives, ALL)All 14 Groups (6 Stacks, 7 Fugitives, ALL)(Urban on Left; Rural on Right)(Urban on Left; Rural on Right)
64
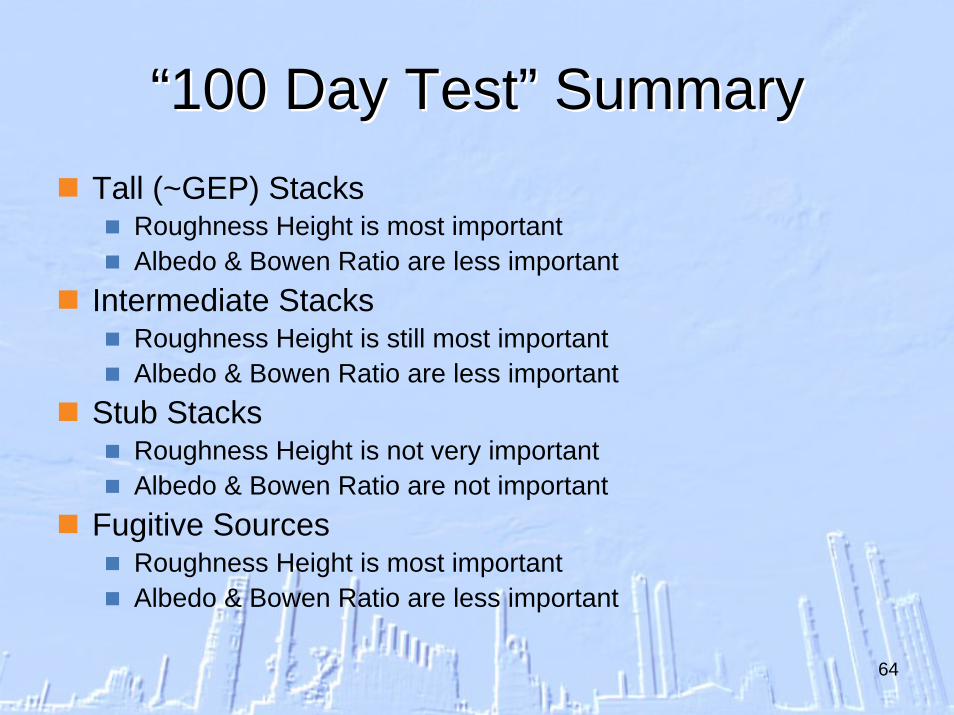
““100 Day Test” Summary100 Day Test” SummaryTall (~GEP) Stacks
Roughness Height is most importantAlbedo & Bowen Ratio are less important
Intermediate StacksRoughness Height is still most importantAlbedo & Bowen Ratio are less important
Stub StacksRoughness Height is not very importantAlbedo & Bowen Ratio are not important
Fugitive SourcesRoughness Height is most importantAlbedo & Bowen Ratio are less important
65
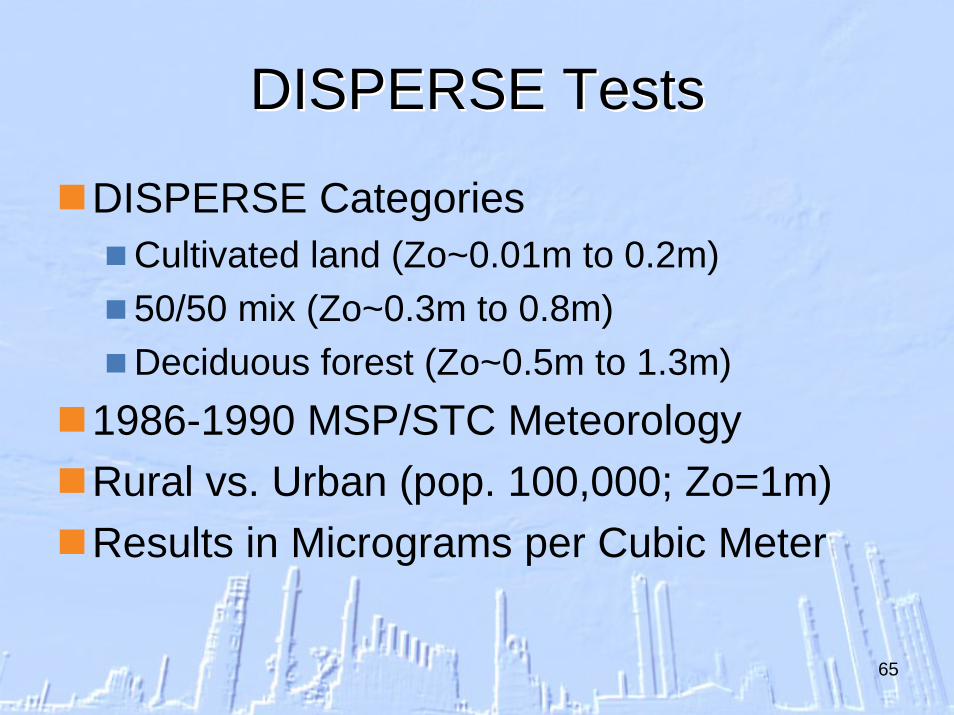
DISPERSE TestsDISPERSE Tests
DISPERSE CategoriesCultivated land (Zo~0.01m to 0.2m)50/50 mix (Zo~0.3m to 0.8m)Deciduous forest (Zo~0.5m to 1.3m)
1986-1990 MSP/STC MeteorologyRural vs. Urban (pop. 100,000; Zo=1m)Results in Micrograms per Cubic Meter

66
DISPERSE ComparisonsDISPERSE ComparisonsDisplay Format (Group N; Modeling Method M)
N.1 denotes ISCST3N.2 denotes ISC-PRIMEN.3 denotes AERMOD with 100% “urban” LULC (RPU-Silver Lake [PSD] Project)N.4 denotes AERMOD with DISPERSE LULC1 (cultivated land)N.5 denotes AERMOD with DISPERSE LULC2 (50/50 mix of cultivated land and deciduous forest)N.6 denotes AERMOD with DISPERSE LULC3 (deciduous forest)

67
Group 1 (SV03) Group 1 (SV03) RuralRural ResultsResults

68
Group 1 (SV03) Group 1 (SV03) UrbanUrban ResultsResults

69
Groups 1Groups 1--6 6 RuralRural Results Results (SV03,SV01,SV02,SV04,CT03,CT02)(SV03,SV01,SV02,SV04,CT03,CT02)

70
Groups 1Groups 1--6 6 UrbanUrban Results Results (SV03,SV01,SV02,SV04,CT03,CT02)(SV03,SV01,SV02,SV04,CT03,CT02)

71
Groups 7Groups 7--13 13 RuralRural ResultsResults(Various Fugitive Sources)(Various Fugitive Sources)

72
Groups 7Groups 7--13 13 UrbanUrban ResultsResults(Various Fugitive Sources)(Various Fugitive Sources)
73
All 14 Groups (6 Stacks, 7 Fugitives, ALL)All 14 Groups (6 Stacks, 7 Fugitives, ALL)(Urban on Left; Rural on Right)(Urban on Left; Rural on Right)

74
DISPERSE SummaryDISPERSE Summary
Significant changes from ISC to AERMOD
DISPERSE cases are (surprisingly) similarRecall: AERMOD and 3 LULC casesSignificant seasonal variability seems to yield the surprisingly similar results

75
BreakBreak
Back in 15 Minutes

76
AERA/RASS with Q/CHI SumsAERA/RASS with Q/CHI Sums
AERA option - computationally efficientEliminates conservative unpaired events
Input is “Q / CHI” instead of “Q”Output is “Risk” instead of “Concentration”

77
AERA/RASS with Q/CHI SumsAERA/RASS with Q/CHI Sums
Input is “Q / CHI” instead of “Q”Critical Health Index (CHI “concentration standard”)
Past approaches:Unit emission rates (Q=1 gram/second)Other (MCES) approachesEquivalent Risk Emission Rate (proposed by Mr. Dustin Hamari, NRG)
• Goal: incorporate into RASS spreadsheet

78
Q/CHI Sums Q/CHI Sums –– The MathThe MathQ/CHI for Source (i) = SUM (Qi,j / Ti)
Q(i,j) denotes source (i) and pollutant (j)T(j) denotes Toxicity of pollutant (j)
Example: 1 source with M chemicalsQ1/T1 + Q2/T2 + Q3/T3 + … + Qm/Tm
Example: N sources with M chemicalsSV001 = SUM (Q1m / Tm) for m=1 to M.SV002 = SUM (Q2m / Tm) for m=1 to M.SV003 = SUM (Q3m / Tm) for m=1 to M.SV00N = SUM (Qnm / Tm) for m=1 to M.

79
Q/CHI Sums Advantages vs. RASSQ/CHI Sums Advantages vs. RASS
Less conservative than DISPERSEReason: events are paired in time & space
Run many sources (RASS = 10 stacks)Run all AERMOD source types
Point and VolumeArea (AREA, AREACIRC, AREAPOLY)
Needs no PLOTFILE or POSTFILE filesuse PLOTFILE for plots & culpability tables

80
Q/CHI Sums Q/CHI Sums –– “Disadvantages”“Disadvantages”Need separate runs for each risk type
4 runs for total inhalation pathway risks• Acute, sub-chronic, chronic, cancer
4 runs for total indirect pathway risks• Farmer non-cancer and cancer• Resident non-cancer and cancer
4 runs for total multi-pathway risks• Farmer non-cancer and cancer• Resident non-cancer and cancer
Large AERMOD run times20 hours for 4 risks with 15 sources & 1140 receptors
Internal calculations-less transparent than RASSPost-RASS software???

81
Fugitive PM10 EmissionsFugitive PM10 Emissions
Paved RoadsUnpaved RoadsCooling Towers
82
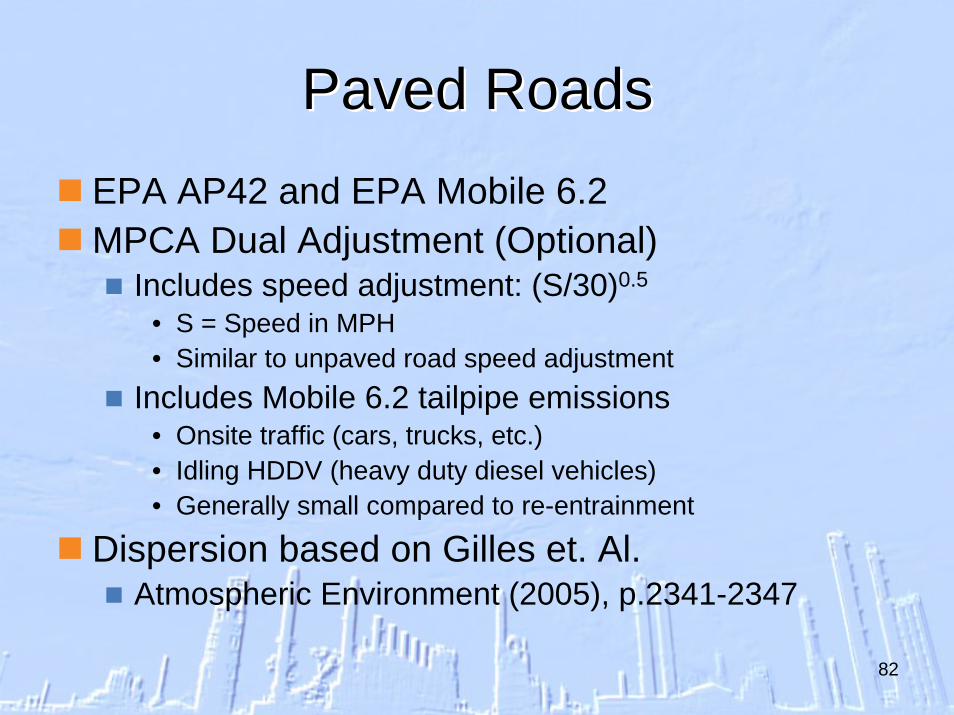
Paved RoadsPaved RoadsEPA AP42 and EPA Mobile 6.2MPCA Dual Adjustment (Optional)
Includes speed adjustment: (S/30)0.5
• S = Speed in MPH• Similar to unpaved road speed adjustment
Includes Mobile 6.2 tailpipe emissions• Onsite traffic (cars, trucks, etc.)• Idling HDDV (heavy duty diesel vehicles)• Generally small compared to re-entrainment
Dispersion based on Gilles et. Al.Atmospheric Environment (2005), p.2341-2347
83
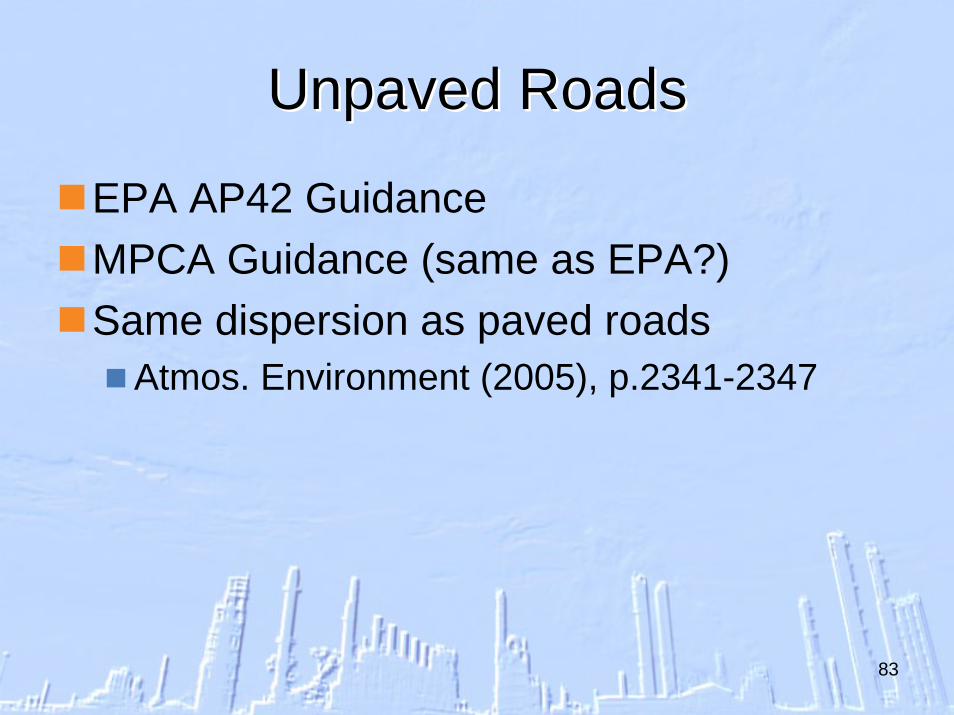
Unpaved RoadsUnpaved Roads
EPA AP42 GuidanceMPCA Guidance (same as EPA?)Same dispersion as paved roads
Atmos. Environment (2005), p.2341-2347

84
Road Dispersion Road Dispersion -- Volume SourcesVolume Sources
Volume Source Parameters (Rochester roads)TOP = 1.7 * Vehicle HeightRelease Height = TOP / 2.0Initial Sigma-Z = TOP / 2.15Initial Sigma-Y = Spacing / 2.15
• Rochester Examples:• Spacing ~10m for roads with 1 lane each way• Spacing ~20m for roads with 2 lanes each way• Spacing ~25m for roads with 3 lanes each way
Reference: Gilles et. al.Atmospheric Environment (2005), p. 2341-2347

85
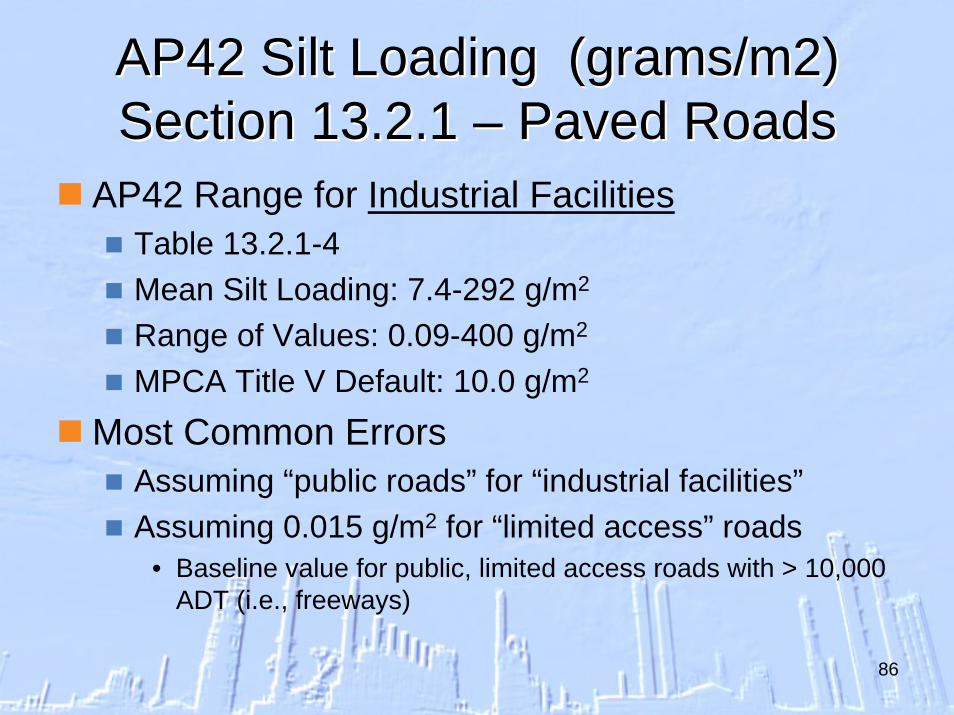
AP42 Silt Loading (grams/m2) AP42 Silt Loading (grams/m2) Section 13.2.1 Section 13.2.1 –– Paved RoadsPaved Roads
AP42 Range for ”Public” Roads (Table 13.2.1-3)Non-winter Conditions
• 0.6 for ADT<500• 0.2 for ADT 500-5000• 0.06 for ADT 5000-10000• 0.03 for ADT>10000
Winter Conditions• 2.4 for ADT<500• 0.6 for ADT 500-5000• 0.12 for ADT 5000-10000• 0.03 for ADT>10000
86
AP42 Silt Loading (grams/m2) AP42 Silt Loading (grams/m2) Section 13.2.1 Section 13.2.1 –– Paved RoadsPaved Roads
AP42 Range for Industrial FacilitiesTable 13.2.1-4Mean Silt Loading: 7.4-292 g/m2
Range of Values: 0.09-400 g/m2
MPCA Title V Default: 10.0 g/m2
Most Common ErrorsAssuming “public roads” for “industrial facilities”Assuming 0.015 g/m2 for “limited access” roads
• Baseline value for public, limited access roads with > 10,000 ADT (i.e., freeways)

87
Measured Silt Loading ValuesMeasured Silt Loading ValuesMeasured Values in Minnesota (Summer)
OSB Manufacturers (Ainsworth [formerly Potlatch] –Grand Rapids, Bemidji): GR=0.39, B=1.19 g/m2
• Similar facilities• Both use natural gas and wood• Silt loadings differ by factor of 3
Cereal Production (N. Gas) (Malt-O-Meal -Northfield): 0.5 g/m2
Soybean Processing (N. Gas, Diesel) (Minnesota Soybean Processors - Brewster): 0.11 g/m2
Coal-Fired Public Utility (Virginia Public Utilities): 0.67 to 9.3 g/m2

88
Measured Silt Loading Values at Measured Silt Loading Values at Selected Ethanol FacilitiesSelected Ethanol Facilities
Measured Values at Ethanol Plants (Summer)Chippewa Valley-Benson (N. Gas): 0.37, 0.6 g/m2
ADM-Marshall (2001): 0.76 to 2.93 g/m2 (no cleaning)ADM-Marshall (2003): 0.70 to 0.72 g/m2 (w/ cleaning)
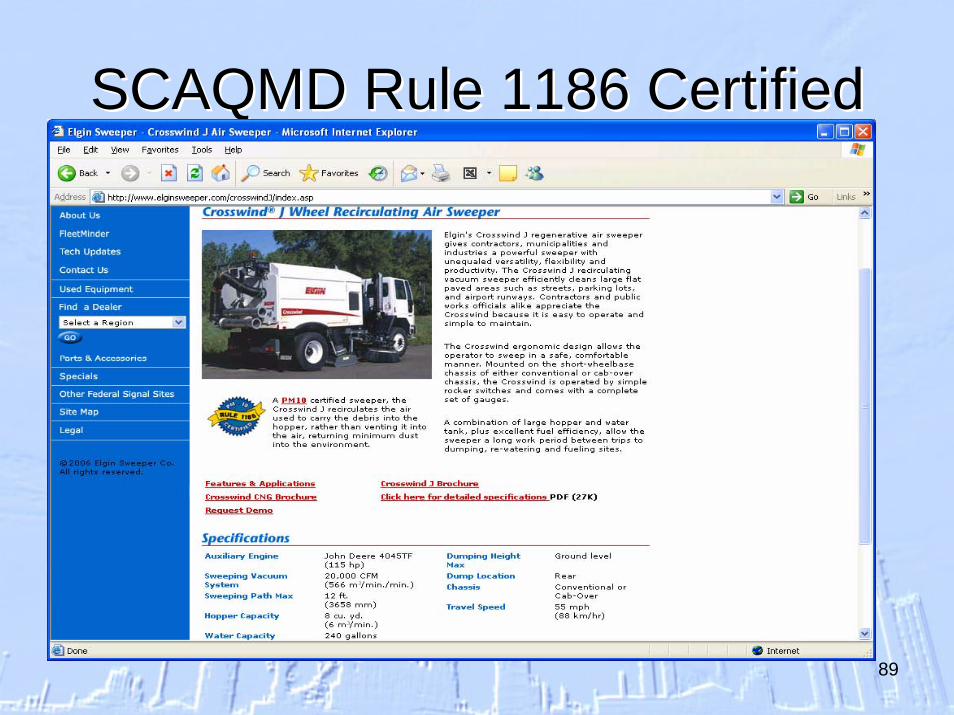
• Two coal-fired boilers; truck & rail delivery of grain, coal, etc.• Silt loading approach and exposure profiling method• Daily road cleaning (sweeping, vacuuming, and washing)• Onsite speed limit of 5 MPH• South Coast Air Quality Management District (SCAQMD)
Rule 1186 Certified (80% control) – see next slide
Companies should expect “some” testing
89
SCAQMD Rule 1186 CertifiedSCAQMD Rule 1186 Certified

90
Exposure Profiling MethodExposure Profiling Method

91
Exposure Profiling MethodExposure Profiling Method

92
MPCA Expectations MPCA Expectations -- Silt LoadingSilt LoadingMPCA Expectations
Good documentation for proposed silt loading valuesCompanies will do some (extensive) on-site testing/cleaning, or use
• AP42 Table 13.2.1-4 (Industrial Facilities)
Permit RequirementsCleaning: sweeping, vacuuming, washingFrequency: daily, weekly, monthly, annualTesting: silt loading and/or exposure profiling
Other possible solutionsSpeed limitsSalt applications only – no sandingEMISFACT scalars (e.g., SHRDOW7)

93
Silt Content Silt Content –– Unpaved RoadsUnpaved Roads
MPCA Title V Default: 10%EPA AP-42 Range for Industrial Sites
Mean Silt Content: 4.3 – 24%Range of Values: 0.2 – 29%
No recent testing in MinnesotaUsual control: paving or watering or chemical dust suppression

94
Cooling TowersCooling Towers
EPA Guidance: AP42 Emission FactorsMPCA Emission Guidance (EPA or below)
Reisman and Frisbie“Calculating Realistic PM10 Emissions from Cooling Towers”MPCA Leads Meeting (Jan. 2002)
Model as point sources or volume sources
95
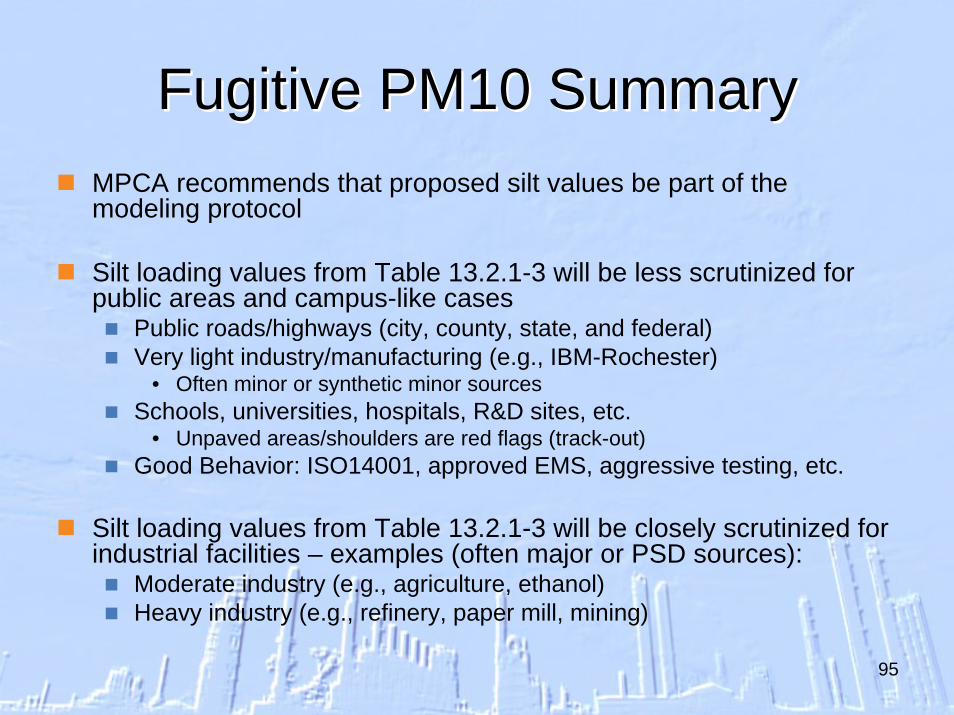
Fugitive PM10 SummaryFugitive PM10 SummaryMPCA recommends that proposed silt values be part of the modeling protocol
Silt loading values from Table 13.2.1-3 will be less scrutinized for public areas and campus-like cases
Public roads/highways (city, county, state, and federal)Very light industry/manufacturing (e.g., IBM-Rochester)
• Often minor or synthetic minor sourcesSchools, universities, hospitals, R&D sites, etc.
• Unpaved areas/shoulders are red flags (track-out)Good Behavior: ISO14001, approved EMS, aggressive testing, etc.
Silt loading values from Table 13.2.1-3 will be closely scrutinized for industrial facilities – examples (often major or PSD sources):
Moderate industry (e.g., agriculture, ethanol)Heavy industry (e.g., refinery, paper mill, mining)
96
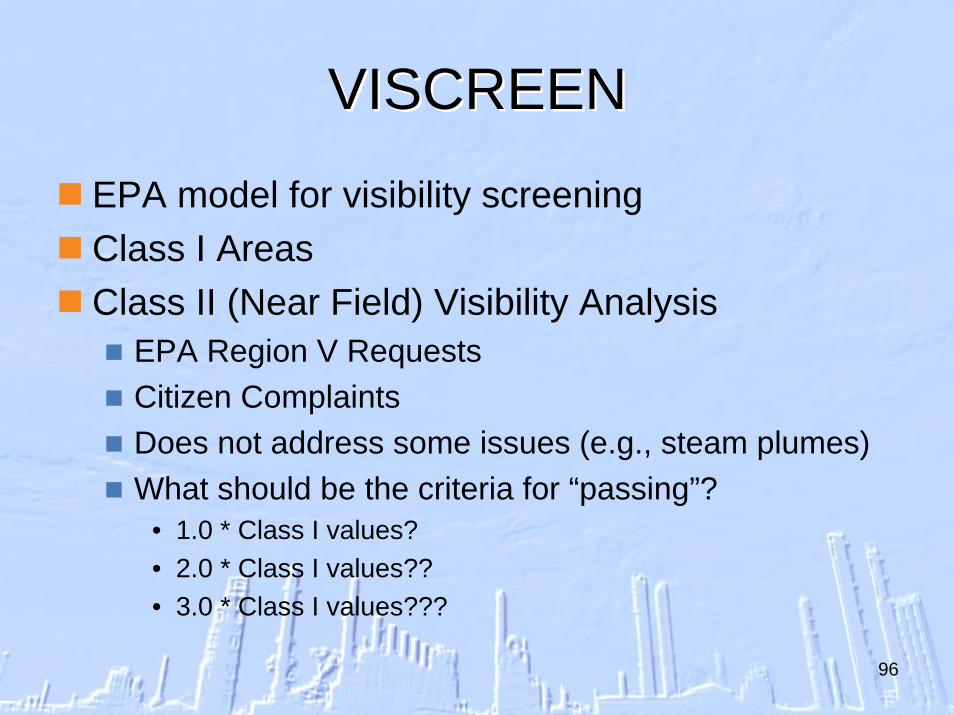
VISCREENVISCREEN
EPA model for visibility screeningClass I AreasClass II (Near Field) Visibility Analysis
EPA Region V RequestsCitizen ComplaintsDoes not address some issues (e.g., steam plumes)What should be the criteria for “passing”?
• 1.0 * Class I values?• 2.0 * Class I values??• 3.0 * Class I values???
97
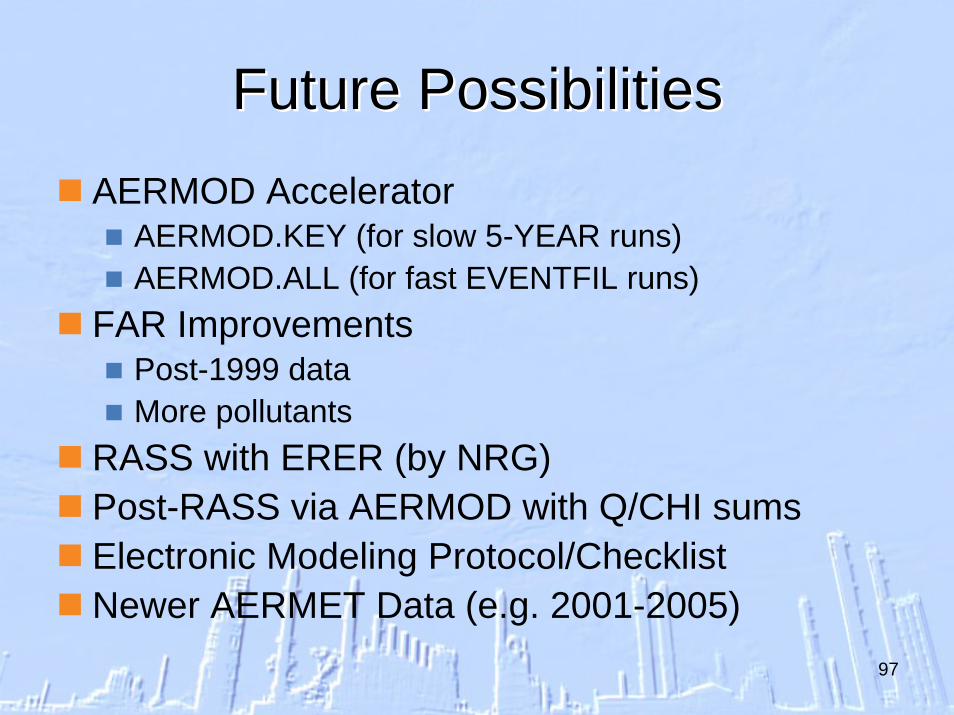
Future PossibilitiesFuture PossibilitiesAERMOD Accelerator
AERMOD.KEY (for slow 5-YEAR runs)AERMOD.ALL (for fast EVENTFIL runs)
FAR ImprovementsPost-1999 dataMore pollutants
RASS with ERER (by NRG)Post-RASS via AERMOD with Q/CHI sumsElectronic Modeling Protocol/ChecklistNewer AERMET Data (e.g. 2001-2005)

98
Questions?Questions?
Contact:Chris Nelson at (651) 296-7750Dennis Becker at (651) 297-7364
MPCA Web Sitehttp://www.pca.state.mn.us/
MPCA Air Dispersion Modeling web pagehttp://www.pca.state.mn.us/air/modeling.html
MPCA “Draft” AERMOD Data (Oct. 2005)http://www.pca.state.mn.us/air/modeling-data2.html