Embed Size (px)
Citation preview
Access to Essential Medicines
in Kenya
Republic of Kenya
Ministry of Public Health and Sanitation
Ministry of Medical Services
A Household Survey
i
Access to Essential Medicines in KenyaA Household Survey
Published by the Ministry of Medical Services and Ministry of Public Health & Sanitationwww.health.go.ke
December 2009
Any part of this document may be freely reviewed, quoted, reproduced, or translated in full or in part,provided that the source is acknowledged.
It may not be sold, or used in conjunction with commercial purposes or for profit.
Users of this publication are encouraged to send any comments and queries to the followingaddress from which additional copies may be obtained:
The Chief PharmacistMinistry of Medical Services
Afya House, PO Box 30016 GPO, Nairobi 00100Email: [email protected]
This document was produced with the support of the World Health Organization (WHO) Kenya CountryOffice, and all reasonable precautions have been taken to verify the information contained herein.The published material does not imply the expression of any opinion whatsoever on the part of the
World Health Organization, and is being distributed without any warranty of any kind – eitherexpressed or implied. The responsibility for interpretation and use of the material lies with the reader.
In no event shall the World Health Organization be liable for damages arising from its use.

ii
iii
Table of contentsLIST OF TABLES………………………………………………………………………………………………………………. v LIST OF FIGURES……………………….……………………………………………………………………………………. vi ABBREVIATIONS AND ACRONYMS………………………………………………….……………………………… vi FOREWORD……………………………………………………….………………………………………………………….. vii ACKNOWLEDGEMENTS…………………………………………………….……………………………………………. viii EXECUTIVE SUMMARY………………………………………………………………….……………………………….. ix SOME KEY INDICATORS……………………………………………………………………………………………………………………… xii
1 INTRODUCTION……….………………………………………………………………………….…………………………. 11.1 Background…………………………………………………………………………………….……………. 21.2 Implementation of the survey………………………………………………………………………………. 31.3 Objective……………………………………………………………………………………………………. 4 2. COUNTRY BACKGROUND…………………………………………………………………………………………………….….……. 4 2.1 Health sector…………………………………………………………………………………………………………………………….……..… 5 2.1.1 Health status and indicators…………………………………………………………………………………………………………… 5 2.1.2 Health policy and strategic planning………………………………………………………………………………………………. 5 2.1.3 Health system structure, status and challenges……………………………………………………………………………… 6 2.1.4 Health partnership and coordination……………………………………………………………………………………………… 7 2.2 Pharmaceutical sector…………………………………………………………………………………………………………………………. 7 2.2.1 National Pharmaceutical Policy……………………………………………………………………………………………………… 8 2.2.2 Regulatory system…………………………………………………………………………………………………………………………. 8 2.2.3 Medicines supply system……………………………………………………………………………………………………………….. 9 2.2.4 Medicines financing……………………………………………………………………………………………………………………….. 9 2.2.5 Rational use of medicines………………………………………………………………………………….…………………………… 10
3. SURVEY DESIGN AND METHODOLOGY……………………..………………………………………………… 11 3.1 Definition of terms……………………………………………………………………………………………………………………………… 11
Use of Medians and Averages………………………………………………………………………………………………………………… 11 Reporting of Quartiles/Percentiles…………………………………………………………………………………………………………. 11
3.2 Sampling Methodology……………………………………………………………………………………………………………………. 11 3.2.1 Sampling of regions (provinces)…………………………………………………………………………………………………….. 11 3.2.2 Sampling of reference health facilities………………………………………………………………………………………….. 11 3.2.3 Sampling of households…………………………………………………………………………………………………………………. 11 3.2.4 Selection of the household respondent………………………………………………………………………………………….. 12
3.3 Data collection……………………………………………………………………………………………………………………………………. 12 3.4 Data entry and analysis………………………………………………………………………………………………………………………. 12 3.5 Data quality and limitations…………………………………………………………………………………………………………………. 12
4. RESULTS……………………………………………………………………………………………………………………. 13 4.1 Characteristics of households………………………………………………………………………………………………………………. 13
4.1.1 Size and composition…………………………………………………………………………………………………………………….. 13 4.1.2 Socio-economic status (SES)………………………………………………………………………………………………………….. 14
a) Self-selected SES Categories………………………………………………………………………………………………………… 14 b) Expenditures………………………………………………………………………………………………………………………………… 15 i) Food and discretionary expenditures……………………………………………………………………………………………. 15 ii) Catastrophic Medicines Expenditures………………………………………………………………………………………….. 17 c) Assets…………………………………………………………………………………………………………………………………………… 17
iv
4.1.3 Geographical Location……………………………………………………………………………………………………………………. 18 a) Regions……………………………………………………………………………………………………………………………………….. 18 b) Reference Facilities………………………………………………………………………………………………………………........ 19 c) Proximity to Health Care Facilities…………………………………………………………………………………………...... 20 d) Overall Proximity to Nearest and Public Health Care Facility…………………………………………………...... 20 e) SES and Proximity to Health Facilities…………………………………………………………………………………………… 20
4.1.4 Morbidity…………………………………………………………………………………………………………………………………… 22 a) Acute Illnesses………………………………………………………………………………………………………………………………. 22 i) Acute Illnesses Prevalence and Household SES……………………………………………………………………………… 22 ii) Acute Illnesses Prevalence and Gender………………………………………………………………………………………… 23 iii) Occurrence and Perceived Seriousness of Acute Illnesses…………………………………………………………… 24 iv) Acute Illnesses in Children…………………………………………………………………………………………………………… 25 b) Chronic Illnesses………………………………………………………………………………………………………………………….. 25 i) Chronic Illnesses and Household SES……………………………………………………………………………………………… 25 ii) Chronic Diseases and Gender………………………………………………………………………………………………………. 26 iii) Chronic Conditions in Children……………………………………………………………………………………………………. 27
4.2 Respondents and Opinions…………………………………………………………………………………………………………….….… 28 4.2.1 Respondents…………………………………………………………………………………………………………………………………... 28
a) Gender and Age…………………………………………………………………………………………………………………………… 28 b) Gender and Education……………………………………………………………………………………………………………….…. 28
4.2.2 Opinions…………………………………………………………………………………………………………………………………………. 29 a) Geographical Access and Availability of Medicines……………………………………………………………………… 29 b) Affordability of Medicines……………………………………………………………………………………………………………. 29 c) Quality of Care and Medicines…………………………………………………………………………………………………….. 30
4.3 Medicines……………………………………………………………………………………………………………………………………………. 31 4.3.1 Medicines at Home……………………………………………………………………………………………………………………….. 31
a) Categories of Medicines………………………………………………………………………………………………………………. 31 i) Antimalarials………………………………………………………………………………………………………………………………… 32 ii) Antimicrobials……………………………………………………………………………………………………………………………… 33 b) Sources of Medicines…………………………………………………………………………………………………………………… 33 c) Label and packaging…………………………………………………………………………………………………………………….. 34
4.3.2 Medicines for Acute Illnesses…………………………………………………………………………………………………………. 35 a) Actions taken………………………………………………………………………………………………………………………………… 35 b) Medicines Taken for a Recent Acute Illness…………………………………………………………………………………. 35 c) Prescribers of Medicines……………………………………………………………………………………………………………… 36 d) Sources of Medicines for Acute Illness…………………………………………………………………………………………. 37 e) Reasons for Not Taking Medicines as Prescribed for Acute Illness………………………………………………. 38
4.3.3 Medicines for Chronic Diseases……………………………………………………………………………………………………… 38 a) Actions Taken………………………………………………………………………………………………………………………………. 39 b) Medicines Prescribed for Chronic Diseases…………………………………………………………………………………. 40 c) Reasons for Not Taking Medicines Prescribed for Chronic Diseases…………………………………………….. 42
4.4 Cost of Medicines…………………………………………………………………………………………………………………………………. 42 4.4.1 Acute illnesses…………………………………………………………………………………………………………………………….…. 42 4.4.2 Chronic diseases……………………………………………………………………………………………………………………………. 43
4.5 Insurance coverage……………………………………………………………………………………………………………..…………….. 43 5. KEY FINDINGS AND DISCUSSION……………………………………………………………………………………………………………. 44 6. CONCLUSIONS………………………………………………………………………………………………………………………………………. 46 7. RECOMMENDATIONS……………………………………………………………………………………………………………………………. 47 Annex 1: THE QUESTIONNAIRE……………………………………………………………………………………………………………………. 49 ANNEX 2: LIST OF DATA COLLECTORS…………………………………………………………………………………………………………. 59 ANNEX 3: LIST OF REFERENCE GOVERNMENT HEALTH FACILITIES……………………………………………………………… 60 References…………………………………………………………………………………………………………………….………………………….. 61
iv
v
List of Tables
Table 1: Kenya Economic & Health Indicators ................................................................................... 5Table 2: Key Pharmaceutical Sector Indicators ................................................................................... 7Table 3: Characteristics of Surveyed Population ............................................................................... 13Table 4: Composition, Size and SES of Surveyed Population .......................................................... 15Table 5: Monthly Household Expenditures (in KES) ........................................................................ 16Table 6: Monthly Median Household Expenditures by SES ............................................................. 16Table 7: Assets and Self-selected Level of Household SES .............................................................. 18Table 8: Proximity to Health Care Facilities ..................................................................................... 20Table 9: Households’ Travel Time to Various Health Facilities ....................................................... 21Table 10: Prevalence of Acute and Chronic Conditions .................................................................... 22Table 11: Acute Illnesses and Gender................................................................................................ 23Table 12: Households with Perceived Very Serious Acute Illness (VSAI) ....................................... 24Table 13: Proportion of Children under 15 and under 5 with Acute Illness ...................................... 25Table 14: Chronic Diseases and Gender ............................................................................................ 26Table 15: Prevalence of Chronic Illnesses in Children under 15years .............................................. 27Table 16: Education & Gender of Respondents/Health-care Decision Makers ................................. 29Table 17: Opinions of Respondents on Geographical Access and Availability of Medicines .......... 29Table 18: Opinions of Respondents on Affordability of Medicines .................................................. 30Table 19: Opinions of Respondents About Quality of Care and Medicines ...................................... 30Table 20: Categories of Medicines Found at Home .......................................................................... 32Table 21: Types of Antimalarials Found in Households ................................................................... 32Table 22: Types of Antimicrobials Found in Households ................................................................. 33Table 23: Label and Primary Package of Medicines Kept at Home .................................................. 35Table 24: Actions Taken for a Recent Acute Illness as Related to Perception of Seriousness ......... 35Table 25: Types of Medicines Taken During Acute Illness and ........................................................ 36Table 26: Chronic Illness and Medicines Advice .............................................................................. 39Table 27: Categories of Medicines Prescribed for Chronic Diseases ................................................ 41Table 28: Diuretics and Antihypertensives Prescribed by Household SES ....................................... 41Table 29: Cost of Prescriptions for Acute Illnesses by SES .............................................................. 42Table 30: Monthly Chronic Diseases Medicines Costs by Level of Household SES........................ 43Table 31: Medicines Insurance Coverage for Acute Conditions ....................................................... 43
vi
List of Figures
Figure 1: Core indicators used to assess the national pharmaceutical situation .................................. 2Figure 2: Map of Kenya ....................................................................................................................... 4Figure 3: Health Sector Pyramid .......................................................................................................... 6Figure 4: Socio-economic Categories of Households That Experienced Catastrophic Medicines Expenditures....................................................................................................................................... 17Figure 5: Household Location by Region and SES .......................................................................... 19Figure 6: Household Clusters and Self-selected Socio-economic Strata ........................................... 20Figure 7: Proximity to Health Facilities by SES ................................................................................ 21Figure 8: Number of Acute Illnesses per Household by SES ............................................................ 23Figure 9: Reported Symptoms and Perceived Seriousness of Acute Illness...................................... 24Figure 10: Number and Occurrence of Chronic Illnesses per Household by SES ............................ 26Figure 11: Number of Chronic Illnesses Reported by Gender........................................................... 27Figure 12: Gender and Age of Respondents/Health-care Decision Makers ...................................... 28Figure 13: Households with Medicines at Home by SES .................................................................. 31Figure 14: Sources of Medicines Found at Home .............................................................................. 33Figure 15: Sources of Medicines Found at Home by SES ................................................................. 34Figure 16: Prescribers of Medicines and Household SES ................................................................. 37Figure 17: Sources of Medicines and Household SES ...................................................................... 37Figure 18: Reasons for Not Taking Prescribed Medicines for Acute Illness by Household SES .... 38Figure 19: Households with Medicines at Home for Chronic illnesses ............................................. 39Figure 20: Chronic Illness and Medicines ......................................................................................... 40Figure 21: Reasons for Not Taking Prescribed Chronic Medication ................................................. 42
ABBREVIATIONS AND ACRONYMSAIDS Acquired Immune Deficiency Syndrome EML Essential Medicines List KES Kenya Shilling NGO Non-Governmental Organization SES Socio-economic status AIDS HIVGDP EMLHDIHPIKEMSA KEPHKES KHPF KNPP MDGMOMSNGONHSSP PPBSESSTGs THEWHO
Acquired Immune Deficiency Syndrome Human Immunodeficiency Virus Gross Domestic Product Essential Medicines ListHuman Development Index Human Poverty Index Kenya Medical Supplies Agency Kenya Essential Package for Health Kenya Shilling Kenya Health Policy Framework Kenya National Pharmaceutical Policy Millennium Development Goal Ministry of Medical Services Non-Governmental Organization National Health Sector Strategic Plan Pharmacy and Poisons Board Socio-economic status Standard Treatment Guidelines Total Health Expenditure World Health Organization
vii
FOREWORDThe stated goal of the revised Kenya National Pharmaceutical Policy (KNPP) is Universal Access to quality pharmaceutical services, Essential Medicines, essential health technologies in Kenya. This national goal resonates with MDG8 Target E: in collaboration with the pharmaceutical industry, ensure access to affordable essential medicines in a sustainable manner. The attainment of this MDG target would also contribute to the attainment of MDG 4, 5 and 6, i.e. improving child health, maternal health, as well as control of HIV/AIDS, TB, Malaria and other diseases. Accessencompasses the availability of Essential Medicines, their affordability, storage, record-keeping,prescribing, dispensing and the personnel concerned – all with reference to national laws, established norms and standards.
Because the pharmaceutical sector is complex and multi-faceted, several cross-cutting factors influence access to Essential Medicines. Therefore, regular monitoring and evaluation is critical in determining the extent to which existing policies, strategies and interventions are impacting on access. Pharmaceutical services in Kenya are provided in the context of the KNPP, the National Health Sector Strategic Plan (NHSSP II) and the strategic plans of the Ministries of Medical Services and Public Health and Sanitation. Pharmaceutical situation assessments are thus a core element of health sector M&E; and a key source of evidence for policy development and strategic planning.
This health facility survey is a timely addition to the body of evidence on the goal of NHSSP II: reversing the declining trends in key health sector indicators. The findings and recommendations provide valuable insights into the status of access to Essential Medicines in Kenya, and the factors positively or adversely influencing access. The information is expected to facilitate evidence-based planning, thus contributing to better integration of pharmaceuticals within the health sector strategic and coordinating frameworks. Consequently, the evidence will be used as a platform for developing a Pharmaceutical Strategy to guide coordinated investment and resource allocation towards achieving universal access to Essential Medicines in Kenya.
This assessment was greatly facilitated by the existence of a comprehensive package of tools developed by WHO, which were subsequently adapted to the health sector in Kenya. It is expected that standardized pharmaceutical situation assessments will be integrated into the health sector M&E framework, in order to inform evidence-based investment (financial, infrastructure and human resources) that is aligned towards impacting outcomes across the entire spectrum of pharmaceutical services within the KEPH.
We strongly encourage all health stakeholders to make the best use of this report in their health planning and monitoring activities. The information will be particularly useful to Government institutions and departments, health development and implementing partners, training and research institutions as well as other national and international stakeholders. We also welcome feedback and any suggestions towards improvement of future assessments.
Dr Francis M Kimani Dr S Sharif MBS, MBchB, MMed DLSHPM, MSc Director of Medical Services Director of Public Health & Sanitation
ACKNOWLEDGEMENTS
The 2008 Pharmaceutical Situation Assessment was conducted by the Ministries of MedicalServices and Public Health and Sanitation, facilitated through the office of the Chief Pharmacist.This was the second such assessment after the baseline survey of 2003. The exercise culminated inthe production of two reports on Access to Essential Medicines in Kenya – this household survey,and a separate health facility survey. The two studies would not have been possible without thecooperation of the Provincial Medical Officers in all the six provinces surveyed. The Ministries alsoappreciate the support, cooperation and information provided by the public health facilities, theFaith Based Health Services (FBHS). Special thanks go to all the departments/sections of theMinistries, the health personnel who facilitated the undertaking of this survey and of course to thehouseholds which willingly provided the information analyzed in this report.
Special gratitude is extended to all those who participated in the data collection and data entry(see Annex 4) and to the following members of the Advisory Group, for their invaluable inputs intothe study design, sampling and analysis:
Fred Siyoi Deputy Chief Pharmacist/Deputy Registrar, MOMS
Ahmed Mohammed Deputy Registrar, Pharmacy and Poisons Board
Njeri Mucheru Deputy Chief Pharmacist, Division of Pharmaceutical Policy, MOMS
Christa Cepuch Programme Director, Health Action International (HAI Africa)
Joan Wakori Regional Liaison Officer, Kenya Medical Supplies Agency (KEMSA)
Jennifer Orwa Chairperson, INRUD/Kenya
Jane Masiga Head of Operations, Mission for Essential Drugs and Supplies (MEDS)
Regina Mbindyo National Medicines Adviser, World Health Organization Kenya
Martin Auton Consultant, HAI Africa
This facility survey was conducted with financial support through the World Health Organization(WHO) from the UK Department for International Development (DFID) project on Access toEssential Medicines; and the European Commission’s EC/ACP/WHO Partnership on PharmaceuticalPolicies. The World Health Organization provided technical support for the survey in collaborationwith HAI Africa, in the context of the DFID supported WHO/HAI Collaboration project on Access toEssential Medicines. This assistance is gratefully acknowledged.
Special gratitude is extended to Njeri Mucheru (MOMS), Joan Wakori (KEMSA), Christa Cepuch(HAI Africa) and Regina Mbindyo (WHO), for their tireless efforts in the data analysis andcompilation of the report; and to Chris Forshaw who assisted with report editing and formatting.
DR KIPKERICH KOSKEIChief Pharmacist/Registrar, Ministry of Medical Services
viii
ix
EXECUTIVE SUMMARY
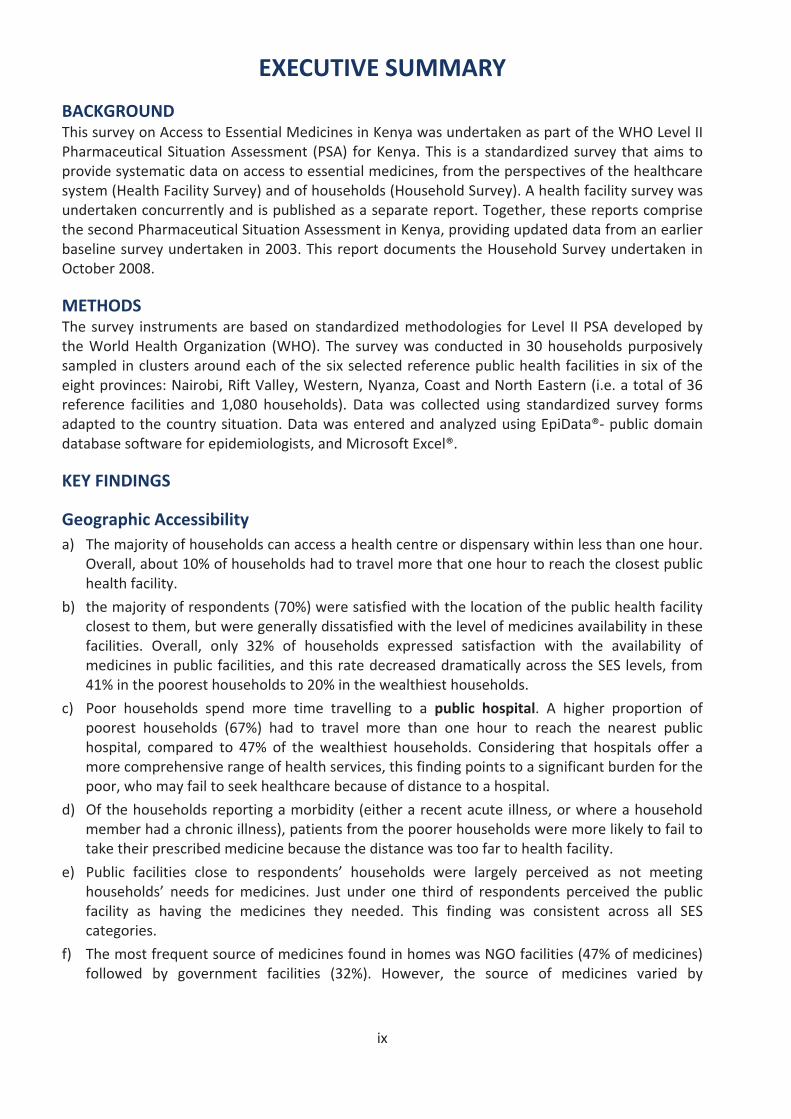
BACKGROUNDThis survey on Access to Essential Medicines in Kenya was undertaken as part of the WHO Level IIPharmaceutical Situation Assessment (PSA) for Kenya. This is a standardized survey that aims toprovide systematic data on access to essential medicines, from the perspectives of the healthcaresystem (Health Facility Survey) and of households (Household Survey). A health facility survey wasundertaken concurrently and is published as a separate report. Together, these reports comprisethe second Pharmaceutical Situation Assessment in Kenya, providing updated data from an earlierbaseline survey undertaken in 2003. This report documents the Household Survey undertaken inOctober 2008.
METHODSThe survey instruments are based on standardized methodologies for Level II PSA developed bythe World Health Organization (WHO). The survey was conducted in 30 households purposivelysampled in clusters around each of the six selected reference public health facilities in six of theeight provinces: Nairobi, Rift Valley, Western, Nyanza, Coast and North Eastern (i.e. a total of 36reference facilities and 1,080 households). Data was collected using standardized survey formsadapted to the country situation. Data was entered and analyzed using EpiData® public domaindatabase software for epidemiologists, and Microsoft Excel®.
KEY FINDINGS
Geographic Accessibilitya) The majority of households can access a health centre or dispensary within less than one hour.
Overall, about 10% of households had to travel more that one hour to reach the closest publichealth facility.
b) the majority of respondents (70%) were satisfied with the location of the public health facilityclosest to them, but were generally dissatisfied with the level of medicines availability in thesefacilities. Overall, only 32% of households expressed satisfaction with the availability ofmedicines in public facilities, and this rate decreased dramatically across the SES levels, from41% in the poorest households to 20% in the wealthiest households.
c) Poor households spend more time travelling to a public hospital. A higher proportion ofpoorest households (67%) had to travel more than one hour to reach the nearest publichospital, compared to 47% of the wealthiest households. Considering that hospitals offer amore comprehensive range of health services, this finding points to a significant burden for thepoor, who may fail to seek healthcare because of distance to a hospital.
d) Of the households reporting a morbidity (either a recent acute illness, or where a householdmember had a chronic illness), patients from the poorer households were more likely to fail totake their prescribed medicine because the distance was too far to health facility.
e) Public facilities close to respondents’ households were largely perceived as not meetinghouseholds’ needs for medicines. Just under one third of respondents perceived the publicfacility as having the medicines they needed. This finding was consistent across all SEScategories.
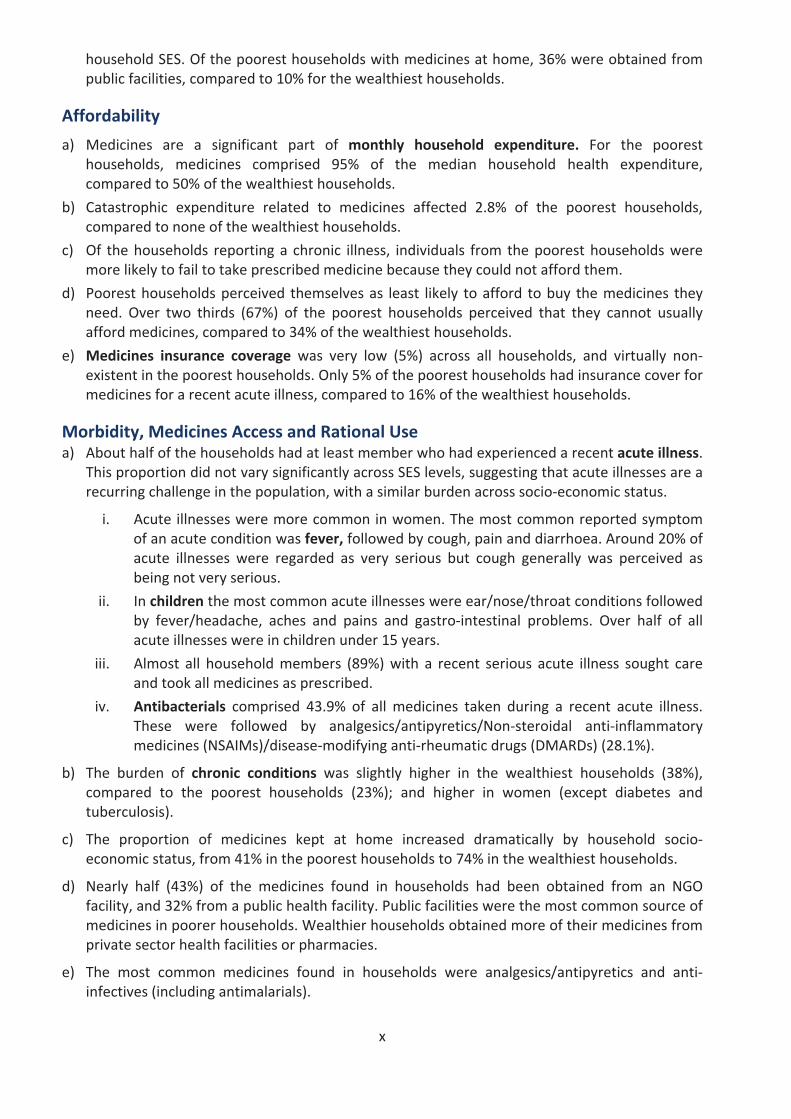
f) The most frequent source of medicines found in homes was NGO facilities (47% of medicines)followed by government facilities (32%). However, the source of medicines varied by
x
household SES. Of the poorest households with medicines at home, 36% were obtained frompublic facilities, compared to 10% for the wealthiest households.
Affordability
a) Medicines are a significant part of monthly household expenditure. For the pooresthouseholds, medicines comprised 95% of the median household health expenditure,compared to 50% of the wealthiest households.
b) Catastrophic expenditure related to medicines affected 2.8% of the poorest households,compared to none of the wealthiest households.
c) Of the households reporting a chronic illness, individuals from the poorest households weremore likely to fail to take prescribed medicine because they could not afford them.
d) Poorest households perceived themselves as least likely to afford to buy the medicines theyneed. Over two thirds (67%) of the poorest households perceived that they cannot usuallyafford medicines, compared to 34% of the wealthiest households.
e) Medicines insurance coverage was very low (5%) across all households, and virtually nonexistent in the poorest households. Only 5% of the poorest households had insurance cover formedicines for a recent acute illness, compared to 16% of the wealthiest households.
Morbidity, Medicines Access and Rational Usea) About half of the households had at least member who had experienced a recent acute illness.
This proportion did not vary significantly across SES levels, suggesting that acute illnesses are arecurring challenge in the population, with a similar burden across socio economic status.
i. Acute illnesses were more common in women. The most common reported symptomof an acute condition was fever, followed by cough, pain and diarrhoea. Around 20% ofacute illnesses were regarded as very serious but cough generally was perceived asbeing not very serious.
ii. In children the most common acute illnesses were ear/nose/throat conditions followedby fever/headache, aches and pains and gastro intestinal problems. Over half of allacute illnesses were in children under 15 years.
iii. Almost all household members (89%) with a recent serious acute illness sought careand took all medicines as prescribed.
iv. Antibacterials comprised 43.9% of all medicines taken during a recent acute illness.These were followed by analgesics/antipyretics/Non steroidal anti inflammatorymedicines (NSAIMs)/disease modifying anti rheumatic drugs (DMARDs) (28.1%).
b) The burden of chronic conditions was slightly higher in the wealthiest households (38%),compared to the poorest households (23%); and higher in women (except diabetes andtuberculosis).
c) The proportion of medicines kept at home increased dramatically by household socioeconomic status, from 41% in the poorest households to 74% in the wealthiest households.
d) Nearly half (43%) of the medicines found in households had been obtained from an NGOfacility, and 32% from a public health facility. Public facilities were the most common source ofmedicines in poorer households. Wealthier households obtained more of their medicines fromprivate sector health facilities or pharmacies.
e) The most common medicines found in households were analgesics/antipyretics and antiinfectives (including antimalarials).
xii
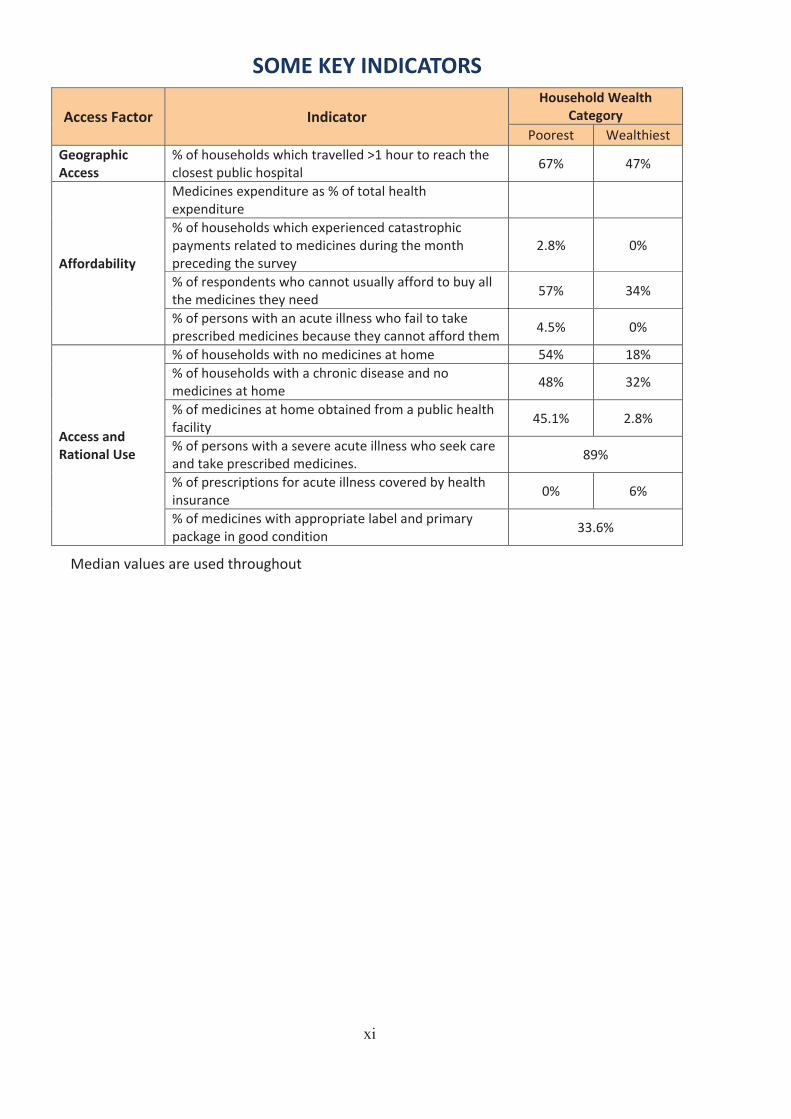
SOME KEY INDICATORS
Access Factor IndicatorHousehold Wealth
CategoryPoorest Wealthiest
GeographicAccess
% of households which travelled >1 hour to reach theclosest public hospital
67% 47%
Affordability
Medicines expenditure as % of total healthexpenditure% of households which experienced catastrophicpayments related to medicines during the monthpreceding the survey
2.8% 0%
% of respondents who cannot usually afford to buy allthe medicines they need
57% 34%
% of persons with an acute illness who fail to takeprescribed medicines because they cannot afford them
4.5% 0%
Access andRational Use
% of households with no medicines at home 54% 18%% of households with a chronic disease and nomedicines at home
48% 32%
% of medicines at home obtained from a public healthfacility
45.1% 2.8%
% of persons with a severe acute illness who seek careand take prescribed medicines.
89%
% of prescriptions for acute illness covered by healthinsurance
0% 6%
% of medicines with appropriate label and primarypackage in good condition
33.6%
Median values are used throughout
xi
1
1. INTRODUCTION
1.1 BACKGROUNDAccess to medicines is part of the fundamental Right to Health, and its attainment is a prerequisite to achieve universal access to health services. Access to medicines implies access toEssential Medicines as defined by WHO:
The development, implementation and regular updating of a national pharmaceutical policyunderscore Government's commitment to ensure access to medicines for its population. Such apolicy should address primary determinants in the development, production, selection, pricing andfinancing of essential medicines; the regulatory framework for assuring medicines quality, safetyand efficacy; an effective supply system that ensures availability and rational use; and overallgovernance of functional and administrative processes. Access to medicines would therefore implythe availability, affordability, quality, and appropriate use (handling, prescribing and dispensing) ofEssential Medicines.
Assessment, monitoring and evaluation underpin evidence based policy development andstrategic planning. The complexity of the pharmaceutical sector, with multiple and cross cuttingfactors that can influence access to and rational use1 of quality medicines, makes it is extremelyimportant to have a standardized and systematic method for assessing the pharmaceuticalsituation at country, regional and global levels. Pharmaceutical sector assessment, monitoring andevaluation aim to answer the following vital questions:
Do people have access to essential medicines?Are people obtaining medicines that are safe, effective and of good quality?Are these medicines being prescribed, dispensed and used properly?
As part of its mandate to provide technical support in the monitoring of health trends, WHO hasdeveloped standardized methodologies for monitoring and assessing the national pharmaceuticalsituation, which require systematic surveys and data gathering at health care facilities. In order toensure their relevance and applicability to diverse country situations, these tools are periodicallyreviewed in consultation with global experts and using feedback from countries that haveundertaken such assessments, as well as trainers and experts who have used the survey tools. TheWHO tools are intended to be used as guides for countries to adapt to their specific situation.
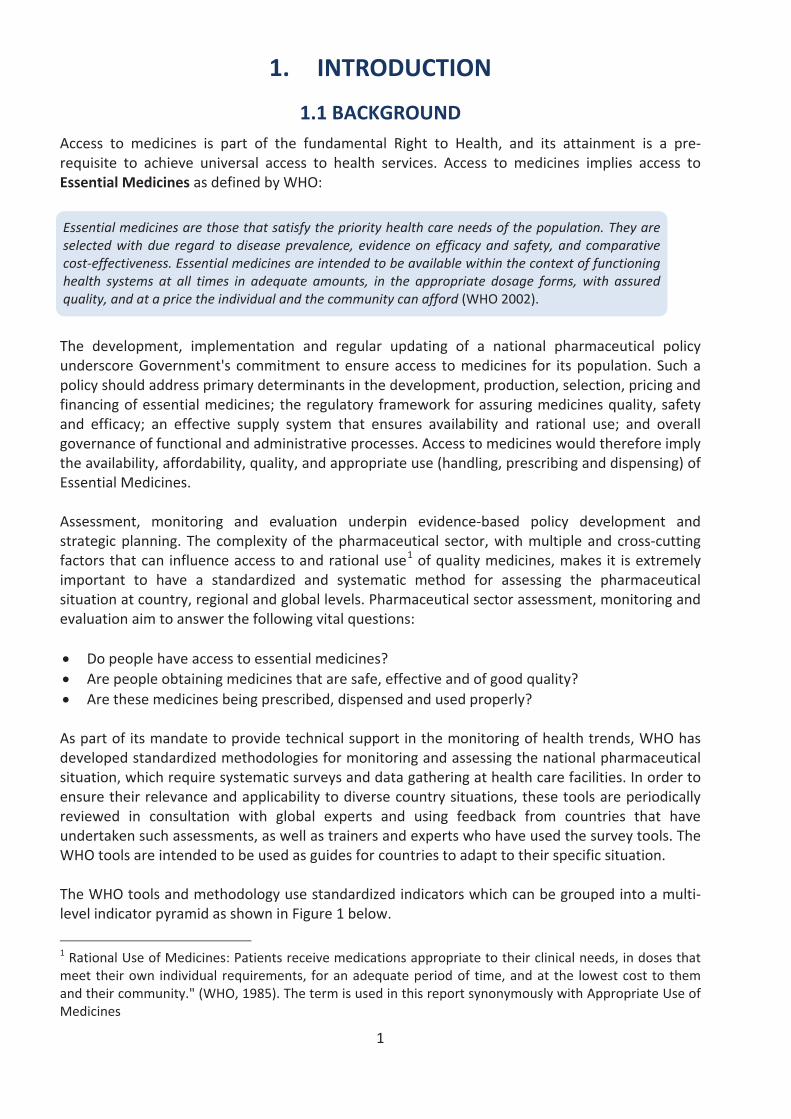
The WHO tools and methodology use standardized indicators which can be grouped into a multilevel indicator pyramid as shown in Figure 1 below.
1 Rational Use of Medicines: Patients receive medications appropriate to their clinical needs, in doses thatmeet their own individual requirements, for an adequate period of time, and at the lowest cost to themand their community." (WHO, 1985). The term is used in this report synonymously with Appropriate Use ofMedicines
Essential medicines are those that satisfy the priority health care needs of the population. They areselected with due regard to disease prevalence, evidence on efficacy and safety, and comparativecost effectiveness. Essential medicines are intended to be available within the context of functioninghealth systems at all times in adequate amounts, in the appropriate dosage forms, with assuredquality, and at a price the individual and the community can afford (WHO 2002).
2
Figure 1: Core indicators used to assess the national pharmaceutical situation
Level 1Core structure
& processindicators
Level 2Core outcome/ impact indicators
to essential medicinesUse of Medicines
Level 3In depth assessments of specific components of the
pharmaceutical sector
Pricing QualityHIV/ Capacity
TB Traditional Medicines
Key informant questionnairesent to countries
survey(health facilities andhouseholds)
methodologies
Level 1Core structure
& processindicators
Level 2Core outcome/ impact indicators
to essential medicinesUse of Medicines
Level 3In depth assessments of specific components of the
pharmaceutical sector
Pricing QualityHIV/ Capacity
TB Traditional Medicines
Key informant questionnairesent to countries
survey(health facilities andhouseholds)
methodologiesmethodologies
Monitoring of the pharmaceutical situation therefore aims to:i) assess country capacity (infrastructures and resources)ii) review implementation strategies so adjustments can be madeiii) measure outcomes of pharmaceutical objectives (access and rational use of quality
medicines)iv) evaluate progress towards identified objectives.
Policy makers and managers can refer to study results when developing strategies to strengthenthe pharmaceutical sector. can also be used to synchronize policy actions related topharmaceuticals.
Indicators provide policy makers and managers with a clear picture of national and institutionalperformance, capacities and gaps in ensuring access to essential medicines. Level II indicators aremeasured in public health facilities, private drug outlets and in warehouses supplying the publicsector. Other sectors which provide a significant proportion of health services (e.g. thesector in Kenya) can also be included. They measure the expected outcomes and impact ofstrategic pharmaceutical programmes in a country: improved access, quality and rational use.
The availability and affordability of essential medicines are assessed in all sectors, but especially inthe public sector where the majority of the poor access healthcare. The presence of expiredmedicines on pharmacy shelves as well as the adequacy of handling and conservation conditionsare used as proxy indicators of the quality of medicines made available to the population, sincedetermination of the actual quality of medicine samples would be not be feasible under the surveyconditions. Finally, rational use is measured by examining the prescribing and dispensing habits ofhealth providers and the implementation of key strategies such as the presence and use ofstandard treatment guidelines and essential medicines lists (EML).
This survey undertaken in 2008 using the standardized WHO methodologies is to date the secondto be carried out, the first having been undertaken in 2003 which was able to establish some key
3
baseline figures against which subsequent progress could be measured. It is recommended thatsuch surveys should be repeated at least once every four years in order to maintain an accurateprofile of the pharmaceutical sector and thereby provide a vital evidence base for use informulating and developing pharmaceutical policy and related strategic interventions.
1.2 IMPLEMENTATION OF THE SURVEYIn September 2008, a nationwide study of the pharmaceutical situation was undertaken inhouseholds clustered around selected reference government health facilities in 6 regions of thecountry. The study was conducted using standardized methodology (a structured questionnaire)developed by the World Health Organization (WHO) to assess the pharmaceutical situation at thehousehold level (i.e. the WHO Level II Assessment). The questionnaire covers health seekingbehavior, as well as source, availability, cost, affordability, and appropriate use of medicines. Itgathers information on household practices, as well as beliefs and other factors that influence thedecision to seek professional advice or to take medicines. Through this information, thequestionnaire provides important data on access to medicines in the community. This is anindicator based survey that provides systematic data on access, rational use and quality ofmedicines through a household based approach. A complementary health facility survey wascarried out concurrently to provide data on access from the perspective of the healthcare system.
1.3 OBJECTIVESThe overall aim of the study was to provide systematic data on access to essential medicines, fromthe perspectives of households in Kenya. The main objectives of the study were to obtaininformation on the status and outcomes related to the following key medicines policy questions:
How easily do households access their medicines and where do they get them from?How affordable are the medicines and how much do they pay?What are the main barriers to medicines affordability?How are medicines used in households in treatment of acute and chronic diseases?
4
2. COUNTRY BACKGROUND
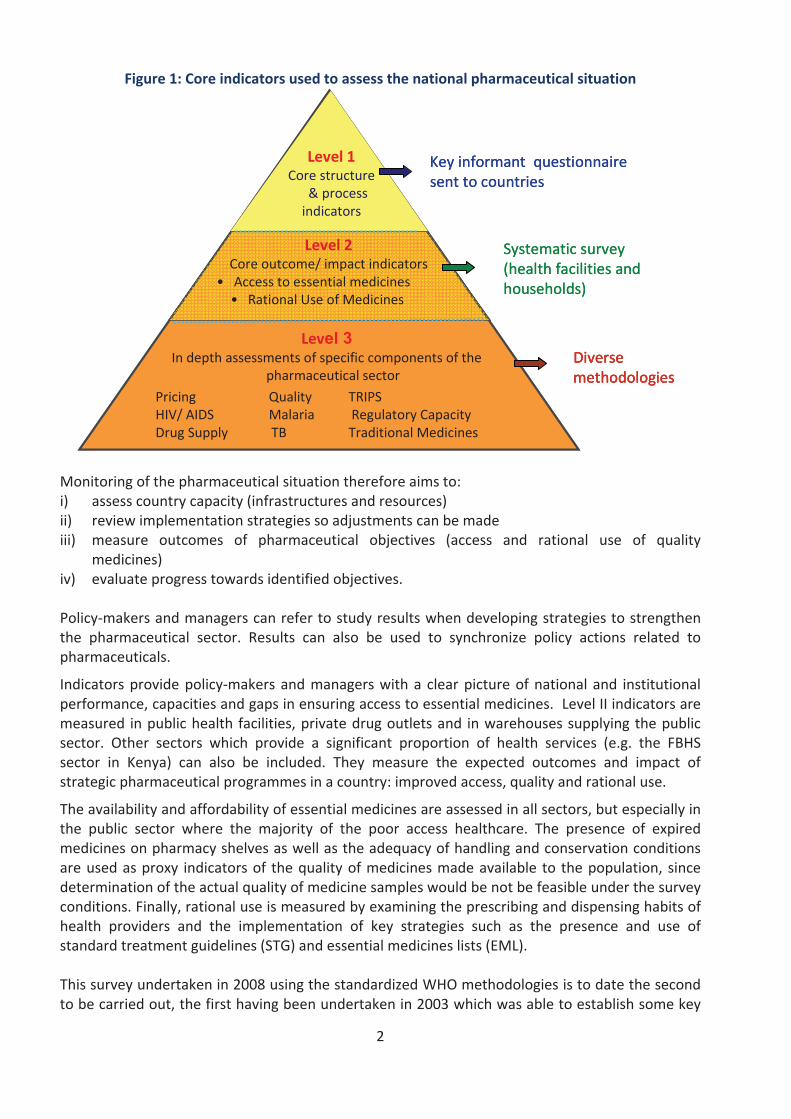
Kenya lies along the Equator in Eastern Africa between Somalia and Uganda and borders Tanzania,Sudan, Ethiopia and the Indian Ocean. The total area is 582,650 sq km of which 13,400 sq km iswater. Administratively, the country is divided into 8 provinces and 712 districts, the district beingthe main administrative unit for health service delivery.
Figure 2: Map of Kenya
© United Nations Cartographic Section
The total population was estimated at 37.2 million in 2007, of which about 43% is below 15 years3.Kenya is a low income country with a GDP of US $778 per capita (2007). The Human DevelopmentIndex (HDI) is 0.532, ranking the country 144th out of 179 countries for which data are available;whereas the Human Poverty Index (HPI 1) of 31.4%, ranks the country 91st among 135 developingcountries for which the index has been calculated4. The country’s employment to population ratio(both sexes) was 73% in 20085. According to the Kenya Demographic and Health Survey of 2008,the mean size of a Kenyan household is 4.2 persons; the rate of under 5 mortality has declinedfrom 92 per 1,000 live births in 2003 to 74 per 1,000 live births; while maternal mortality remainshigh, having increased from 414 per 100,000 live births in 2003 to a figure of 448 in 20086. Theadult (15+) literacy rate was 61.5% in 2007 being higher for males (64%) than females (59%)7.
2 The survey was undertaken during an ongoing review of district boundaries at which time 71 districts were recognized.3 Kenya Facts and Figures, Kenya National Bureau of Statistics, 20084 Human Development Report, UNDP 2008 Update5 Source: United Nations Statistics Division http://data.un.org6 Kenya Demographic and Health Survey, 2008-097 Kenya National Bureau of Statistics Literacy Survey 2007
5
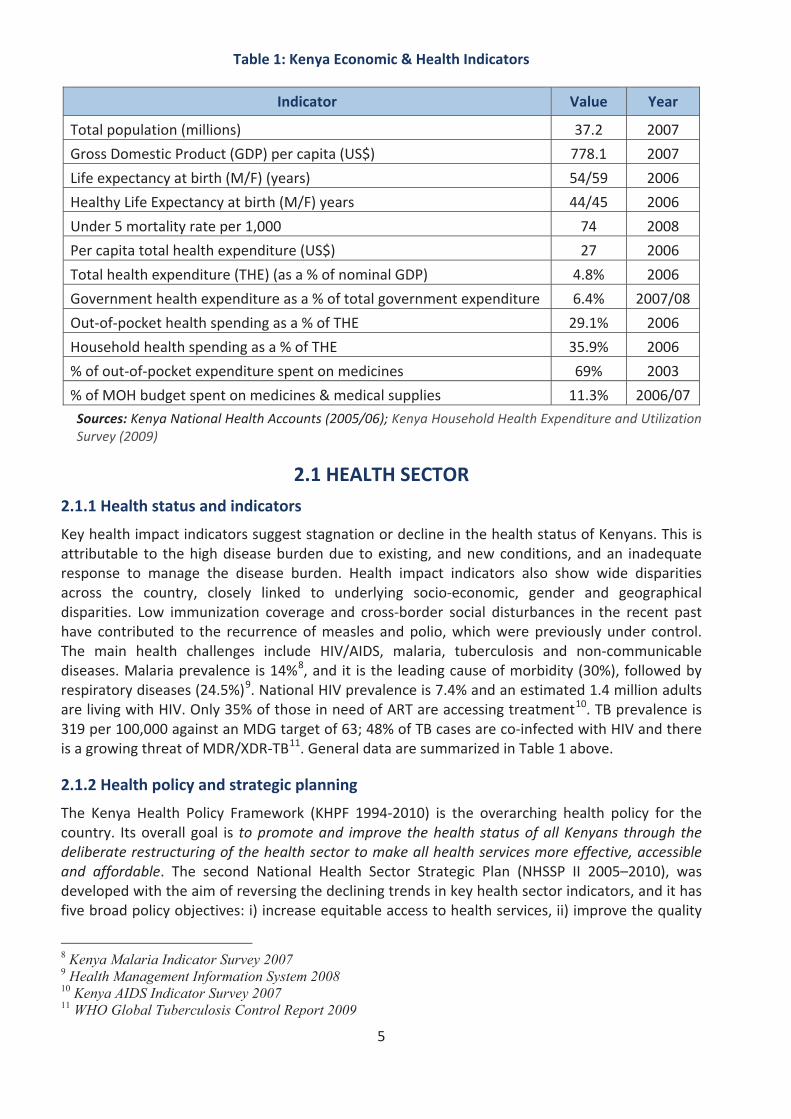
Table 1: Kenya Economic & Health Indicators
Indicator Value Year
Total population (millions) 37.2 2007
Gross Domestic Product (GDP) per capita (US$) 778.1 2007
Life expectancy at birth (M/F) (years) 54/59 2006
Healthy Life Expectancy at birth (M/F) years 44/45 2006
Under 5 mortality rate per 1,000 74 2008
Per capita total health expenditure (US$) 27 2006
Total health expenditure (THE) (as a % of nominal GDP) 4.8% 2006
Government health expenditure as a % of total government expenditure 6.4% 2007/08
Out of pocket health spending as a % of THE 29.1% 2006
Household health spending as a % of THE 35.9% 2006
% of out of pocket expenditure spent on medicines 69% 2003
% of MOH budget spent on medicines & medical supplies 11.3% 2006/07
Sources: Kenya National Health Accounts (2005/06); Kenya Household Health Expenditure and UtilizationSurvey (2009)
2.1 HEALTH SECTOR2.1.1 Health status and indicators
Key health impact indicators suggest stagnation or decline in the health status of Kenyans. This isattributable to the high disease burden due to existing, and new conditions, and an inadequateresponse to manage the disease burden. Health impact indicators also show wide disparitiesacross the country, closely linked to underlying socio economic, gender and geographicaldisparities. Low immunization coverage and cross border social disturbances in the recent pasthave contributed to the recurrence of measles and polio, which were previously under control.The main health challenges include HIV/AIDS, malaria, tuberculosis and non communicablediseases. Malaria prevalence is 14%8, and it is the leading cause of morbidity (30%), followed byrespiratory diseases (24.5%)9. National HIV prevalence is 7.4% and an estimated 1.4 million adultsare living with HIV. Only 35% of those in need of ART are accessing treatment10. TB prevalence is319 per 100,000 against an MDG target of 63; 48% of TB cases are co infected with HIV and thereis a growing threat of MDR/XDR TB11. General data are summarized in Table 1 above.
2.1.2 Health policy and strategic planning
The Kenya Health Policy Framework (KHPF 1994 2010) is the overarching health policy for thecountry. Its overall goal is to promote and improve the health status of all Kenyans through thedeliberate restructuring of the health sector to make all health services more effective, accessibleand affordable. The second National Health Sector Strategic Plan (NHSSP II 2005–2010), wasdeveloped with the aim of reversing the declining trends in key health sector indicators, and it hasfive broad policy objectives: i) increase equitable access to health services, ii) improve the quality
8 Kenya Malaria Indicator Survey 20079 Health Management Information System 200810 Kenya AIDS Indicator Survey 200711 WHO Global Tuberculosis Control Report 2009
6
and responsiveness of services in the sector, iii) improve the efficiency and effectiveness of servicedelivery, iv) enhance the regulatory capacity of MOH, v) foster partnerships in improving healthand delivering services and vi) improve the financing of the health sector.
Ministerial strategic plans for the Ministry of Public Health and Sanitation and Ministry of MedicalServices outline the investment decisions for the years 2008–2012 for strengthening the capacityof the two ministries to deliver public health, sanitation and medical services in line with Vision2030. The plans outline strategic thrusts for each Ministry, which serve to guide investment andprogramming in the key priority areas towards the overall goals of the NHSSP II. Planning forhealth services and interventions is through Annual Operational Plans (AOP), capturing the shortterm actions and expected achievements for all health sector players within the planning year.These also serve to align health planning with the national budgeting process. Lessons learnt fromprevious AOP development and implementation stages usually inform the focus and process ofplanning for the successive year.
2.1.3 Health system structure, status and challenges
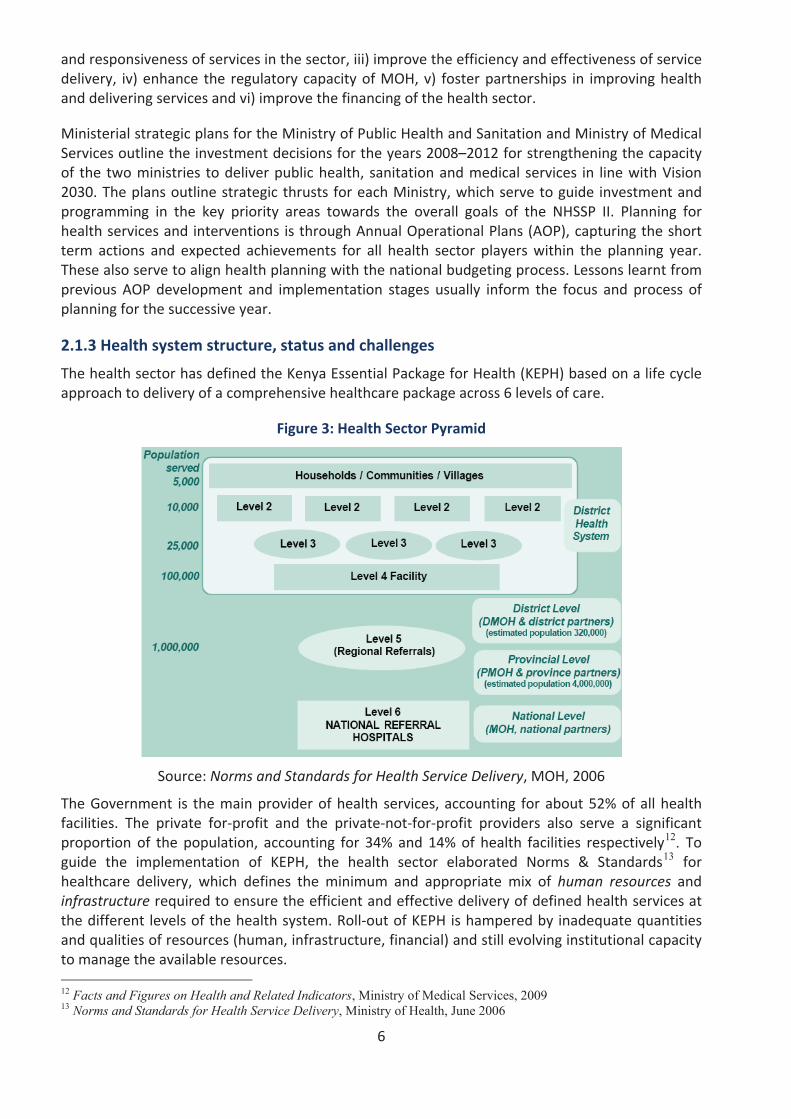
The health sector has defined the Kenya Essential Package for Health (KEPH) based on a life cycleapproach to delivery of a comprehensive healthcare package across 6 levels of care.
Figure 3: Health Sector Pyramid
Source: Norms and Standards for Health Service Delivery, MOH, 2006
The Government is the main provider of health services, accounting for about 52% of all healthfacilities. The private for profit and the private not for profit providers also serve a significantproportion of the population, accounting for 34% and 14% of health facilities respectively12. Toguide the implementation of KEPH, the health sector elaborated Norms & Standards13 forhealthcare delivery, which defines the minimum and appropriate mix of human resources andinfrastructure required to ensure the efficient and effective delivery of defined health services atthe different levels of the health system. Roll out of KEPH is hampered by inadequate quantitiesand qualities of resources (human, infrastructure, financial) and still evolving institutional capacityto manage the available resources.
12 Facts and Figures on Health and Related Indicators, Ministry of Medical Services, 2009 13 Norms and Standards for Health Service Delivery, Ministry of Health, June 2006
7
2.1.4 Health partnership and coordinationAccording to the National Health Accounts14, 29.3% of health expenditure is public, with 31.0%from donors and 35.9% from households. Coordination mechanisms are continuously beingstrengthened between the various partners, with a Code of Conduct guiding partner engagementin the sector. The major development partners15 came together under the Joint SupportProgramme to design areas of focus for their support. There is also active engagement with theformal faith based16 and the non governmental service providers. Underlying socioeconomicfactors and cross border issues require a broader based partnership platform, encompassinggovernance, political reform and regional collaboration to address underlying determinants ofhealth and to tackle cross border health challenges.
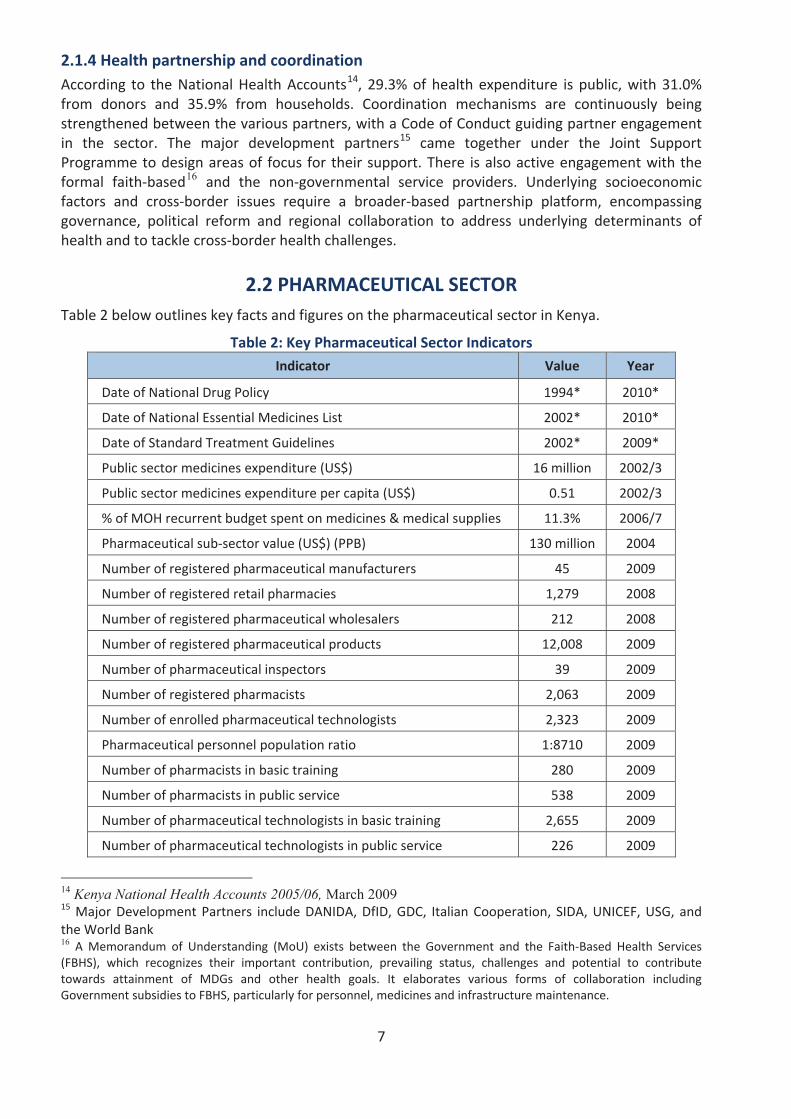
2.2 PHARMACEUTICAL SECTORTable 2 below outlines key facts and figures on the pharmaceutical sector in Kenya.
Table 2: Key Pharmaceutical Sector Indicators
Indicator Value Year
Date of National Drug Policy 1994* 2010*
Date of National Essential Medicines List 2002* 2010*
Date of Standard Treatment Guidelines 2002* 2009*
Public sector medicines expenditure (US$) 16 million 2002/3
Public sector medicines expenditure per capita (US$) 0.51 2002/3
% of MOH recurrent budget spent on medicines & medical supplies 11.3% 2006/7
Pharmaceutical sub sector value (US$) (PPB) 130 million 2004
Number of registered pharmaceutical manufacturers 45 2009
Number of registered retail pharmacies 1,279 2008
Number of registered pharmaceutical wholesalers 212 2008
Number of registered pharmaceutical products 12,008 2009
Number of pharmaceutical inspectors 39 2009
Number of registered pharmacists 2,063 2009
Number of enrolled pharmaceutical technologists 2,323 2009
Pharmaceutical personnel population ratio 1:8710 2009
Number of pharmacists in basic training 280 2009
Number of pharmacists in public service 538 2009
Number of pharmaceutical technologists in basic training 2,655 2009
Number of pharmaceutical technologists in public service 226 2009
14 Kenya National Health Accounts 2005/06, March 2009 15 Major Development Partners include DANIDA, DfID, GDC, Italian Cooperation, SIDA, UNICEF, USG, andthe World Bank16 A Memorandum of Understanding (MoU) exists between the Government and the Faith Based Health Services(FBHS), which recognizes their important contribution, prevailing status, challenges and potential to contributetowards attainment of MDGs and other health goals. It elaborates various forms of collaboration includingGovernment subsidies to FBHS, particularly for personnel, medicines and infrastructure maintenance.
8
*Under revision at the time of the Survey. Date in Year column is the expected publication date of new edition
2.2.1 National Pharmaceutical Policy
Kenya published the first National Drug Policy (KNDP) in 1994, addressing important issuesimpacting on pharmaceutical services. However, there was no clear and sustainable strategy for itsimplementation, and monitoring and evaluation of its impact were minimal.
The revised Kenya National Pharmaceutical Policy (KNPP) of 201017 whose goal is Universal Accessto quality pharmaceutical services, Essential Medicines and essential health technologies in Kenya,outlines relevant policy direction and strategies for the pharmaceutical sector, and the keyinstitutional framework required to ensure access to, and rational use of, essential medicines bythe population. A 5 year Pharmaceutical Strategic Plan for KNPP implementation is underdevelopment; and implementation plans are developed annually, integrated within the healthsector Annual Operational Plans (AOPs).
A baseline assessment of the pharmaceutical situation was undertaken in 200318 and repeated in2008 using WHO standard tools and methodology. The 2008 assessment covers the overallpharmaceutical situation, with two separate reports covering the perspectives of the healthsystem (this report) and of households. A comprehensive medicine price survey was undertaken in200419, and a medicine price component study in 200720. Quarterly monitoring of medicine pricesand availability is in place, coordinated by the Department of Pharmacy21.
2.2.2 Regulatory system
Kenya’s medicines regulatory authority is the Pharmacy and Poisons Board (PPB). It is fundedthrough the exchequer and through fees from regulatory services (e.g. registration of medicines,inspection and licensing) and for the issuing of professional and practice licenses. Regulatorypersonnel are subject to the civil service code of conduct, but no specific legal provisions existrequiring transparency and accountability and promoting a code of conduct in regulatory work.The medicines regulatory authority provides information on legislation, regulatory procedures,prescribing information (such as indications, contra indications, side effects, etc.), authorizedcompanies, and/or approved medicines.
Legal provisions exist for marketing authorization, and registration fees differ between importedand locally produced medicines. A cumulative total of 12,009 medicinal products have beenapproved for marketing and a list of all registered products is publicly accessible on the PPBwebsite. Legal provisions are in place for the licensing of manufacturers, wholesalers, distributors,importers or exporters of medicines; and for regulation of medicines promotion and advertising.Regulatory procedures are in place to ensure the quality of imported and locally manufacturedmedicines as part of the registration process. A quality management system with an officiallydefined protocol for ensuring the quality of medicines is not in place in Kenya. Even so, medicinessamples are routinely tested as part of the registration process and sometimes for post marketingsurveillance. In a survey of the quality of antimalarial medicines in the market in 2006, 43 batcheswere quality tested, with 16% failing to meet quality standards.
17 Expected date of publication18 Assessment of the pharmaceutical situation in Kenya: a baseline survey, Ministry of Health/WHO/HAI,200319 A Survey of Medicine Prices in Kenya, Ministry of Health, 200420 Price components and essential medicines in Nairobi, Kenya, WHO Kenya 2007 (unpublished draft)21 Monitoring Medicines Pricing & Availability (MMePA) in Kenya, undertaken quarterly since 2006
9
Legal provisions are in place for the licensing and practice of prescribers, pharmaceuticalpersonnel and pharmacies. No legal provisions exist requiring the prescribing of medicines bygeneric name or obligating the dispensing of generic medicines in any sector. Generic substitutionis permitted in public, FBHS and private pharmacies and through the essential medicines concept,the public and FBHS sectors encourage the dispensing of generic medicines.
2.2.3 Medicines supply system
Public and FBO sector procurement is pooled at the national level with separate centralizedprocurement systems for the government and FBHS facilities respectively. There are two supplysystems in place, push and pull. However, the demand driven (pull) system which started in 2005is (pending consolidation and strengthening) only currently operating in 3 Provinces and parts of 2others. Procurement and distribution of medicines for government is the responsibility of theMinistry of Medical Services. International competitive tender processes are used for public sectorprocurement with provisions for alternative methods in specified circumstances. Public sectorprocurement is limited to medicines on the Essential Medicines List (EML) and any relevant andrecently updated standard treatment guidelines. To guide the procurement of medicines for thepublic sector, the public procurement agency develops and reviews an annual formulary list inconsultation with stakeholders. This process aims to fine tune the specific products to beprocured, derived from the EML and/or other relevant treatment protocols. The FBHSprocurement agency undertakes a similar process; hence the supply lists of the two systems maybe similar, but are not identical. There are no regulations for local preference in public sectorprocurement.
2.2.4 Medicines financing
Public financing of the health sector through the exchequer is US$ 10.9 per capita22, which fallsbelow the WHO recommended level of US$ 34 per capita (of which a minimum of $2.50 should beon essential medicines). This is far short of the Government’s commitment to spend 15% of thenational budget on health, as agreed in the Abuja Declarations of 2001 and 2006. Such underfunding has reduced the sector’s ability to ensure an adequate level of service provision to thepopulation, and has led to significant levels of out of pocket expenditure. For example,households accounted for 36% of the total health expenditure (THE) in 2005/06 and of this, 29%was out of pocket. Cost sharing accounted for 7.4% of the Ministry’s recurrent expenditures in2005/200623, and this contributes to inequity in access to healthcare for the poor anddisadvantaged groups.
There is a national policy (the ‘10/20 policy’) that requires public primary care facilities (Levels2&3) to provide health care (including medicines) free of charge, with patients only payingminimal registration fees24. Children under 5 years are entitled to free health care (includingmedicines) in public and FBHS facilities and a waiver system is in place for patients who cannotafford treatment. Publicly procured medicines for priority health programmes, such ascontraceptives and medicines for malaria, HIV/AIDS and TB, are also provided for free throughpublic and FBHS facilities. Cost sharing applies for treatment of other conditions in adults andchildren over 5 years, at levels 4 6 in the public facilities. Revenues from patients’ fees ormedicines sales are never used to pay the salaries or supplement the income of public healthpersonnel in the same facility. FBHS facilities charge for the cost of treatment for most conditions,
22 Facts and Figures on Health and Related Indicators, Ministry of Medical Services, 200923 Adapted from the Health Sector Report 200724 Registration fee at Level 2 (Dispensary) and Level 3 (Health Centre) is KES 10 (equivalent to USD 0.14) andKES 20 (USD 0.28) respectively.
10
but some provisions exist for subsidies and waivers. The private sector provides health servicesincluding medicines on a full cost recovery basis. Prescribers in the public and private sectorssometimes dispense medicines.
In Kenya, only about 10% of the population has some form of health insurance. Amongst theinsured, the National Health Insurance Fund (NHIF) has the widest coverage of about 84% overall,and it covers all or part of in patient treatment, but does not cover out patient medicines. About8% and 12% of the population has private or employer based health insurance respectively, whichcovers some or all medicines costs25. There is no policy to guide the pricing of medicines in anysector, but publicly procured medicines are highly subsidized. There is no import tax onpharmaceutical raw materials or finished products; however, the Government levies a 2.75% feeon all imported medicines for processing of import documentation, i.e. the Import DeclarationForm (IDF) fee.
The national EML does not play a direct role in the setting of medicine prices in the private sector,and price setting is not part of marketing authorization. Kenya has a national medicine pricemonitoring system for retail/patient prices. There are no regulations mandating retail/patientmedicine price information to be made publicly accessible. There are official written guidelines onmedicine donations that provide rules and regulations for donors and provide guidance to thepublic, private and/or NGO sectors on accepting and handling donated medicines26.
2.2.5 Rational use of medicines
The national Essential Medicines List (EML) is the basis for public sector procurement. The EMLwas last updated in 2002, and it was under revision at the time of the survey, with reference tothe most current WHO Model List. The National Medicines and Therapeutics Committee (NMTC)isresponsible for the selection of products on the national EML, although it was not functional atthe time of the survey. The health ministry produces national Standard Treatment Guidelines(STG) for major conditions. These were last updated in 2002, and were also under revision.However, some disease specific guidelines for priority health programmes have been updatedmore recently. Antibiotics are frequently sold over the counter without a prescription, and eveninjections are occasionally also sold in this way.
25 Kenya Household Health Expenditure and Utilization Survey, Ministry of Health, 2007 26 Kenya National Guidelines on Donations of Drugs and Medical Supplies, Ministry of Health, March 2001
11
3. SURVEY DESIGN ANDMETHODOLOGY
This study was conducted using the standardized WHO Level II Assessment methodology forhousehold surveys. This is an indicator based survey that applies a standardized structuredquestionnaire for data collection, and entry of the data into a data base for calculation of therequired indicators. A survey advisory group systematically adapted the questionnaire to thecountry situation following detailed WHO guidelines, and provided technical oversight throughoutthe survey design, fieldwork, data interpretation and report writing.
3.1 DEFINITION OF TERMS
Use of Medians and Averages As averages can be skewed by outlying values, median values are generally used (unless otherwisestated) throughout the presentation of results and discussion as a better representation of themidpoint value.
Reporting of Quartiles/Percentiles A quartile is a percentile rank that divides distribution into 4 equal parts. The range of valuescontaining the central half of the observations, that is, the range between the 25th and 75thpercentiles (the range including values up to 25% below or above the median) is called the interquartile range. In this section on findings, where medians and inter quartile ranges are notpresented in tables, the following format will be used to report the number of occurrences andthe inter quartile range: n = 29; 25th and 75th percentiles = 0.60, 0.83.
3.2 SAMPLING METHODOLOGY
3.2.1 Sampling of regions (provinces)
Six provinces (regions) were selected as "survey areas" for data collection. The major urban centreand capital city (Nairobi) was purposively selected as one survey area while North Eastern wasselected as representative of a low income area. Other provinces selected were Coast, Rift Valley,Nyanza and Western. Central province was excluded from the sample due to its similarity toNairobi province whilst parts of Eastern province were considered to be represented by Nairobi,Coast and North Eastern provinces.
3.2.2 Sampling of reference health facilitiesFrom each region 6 public health facilities were selected giving a total of 36 reference healthfacilities). The facilities were identified as follows: the largest public hospital, then from two otherselected districts in the province, all government hospitals were listed and one primary hospitalselected randomly. Similarly, one health centre was selected from a third district from which nohospital had been selected. To complete the list, all the public dispensaries from the three districtswere listed, and three government dispensaries were selected at random from the list whilstensuring that not more than two facilities (of any type) were selected per any given district.
3.2.3 Sampling of householdsPurposive sampling was used to select 10 households within 5 km, 10 within 5 10 km and 10 over10 km from each of the 36 reference health facilities giving a total of 30 households per facilityand 1080 target households overall. Households were chosen which were not next to each otherand which had an economic status representative of the area
12
3.2.4 Selection of the household respondentRespondents were selected who met at least 3 of the following criteria:
The main health care decision makerThe most knowledgeable about health of household membersThe most knowledgeable about health expenditures of householdThe most knowledgeable about health utilization by household membersThe designated care giver for sick household members
3.3 DATA COLLECTIONData for this survey were collected through use of a structured questionnaire. A total of 1,069households were surveyed (from the planned total sample of 1,080), covering a population of5,955 individuals.
3.4 DATA ENTRY AND ANALYSISTo obtain quantifiable information, raw data from the survey tools were coded and then edited toascertain accuracy and completeness. Data was then entered into the computer system usingEpiData and analyzed using Epi Info version 3.4.3. The analyzed data has been presented inFrequency Tables, Percentages, Pie Charts and Bar Graphs.
3.5 DATA QUALITY AND LIMITATIONSThe structure and design of the questionnaire minimize variability in the types of questions whichare asked and the way in which they are presented to the respondent. However there is alwaysthe possibility of human error in both entering the (correct codes for the) responses onto thequestionnaire and in transferring the field data onto the EpiData database forms. Thecomprehensive training provided for data collectors and data entry clerks mitigated the chances ofthese errors occurring.
13
4. RESULTS
4.1 CHARACTERISTICS OF HOUSEHOLDSInterpretation of survey results depends on the composition, size, and location of households, aswell as the morbidity of the population included in the survey. Understanding the characteristicsof sampled households is critical to assessing their representativeness in order to extrapolatesurvey findings to a larger population.
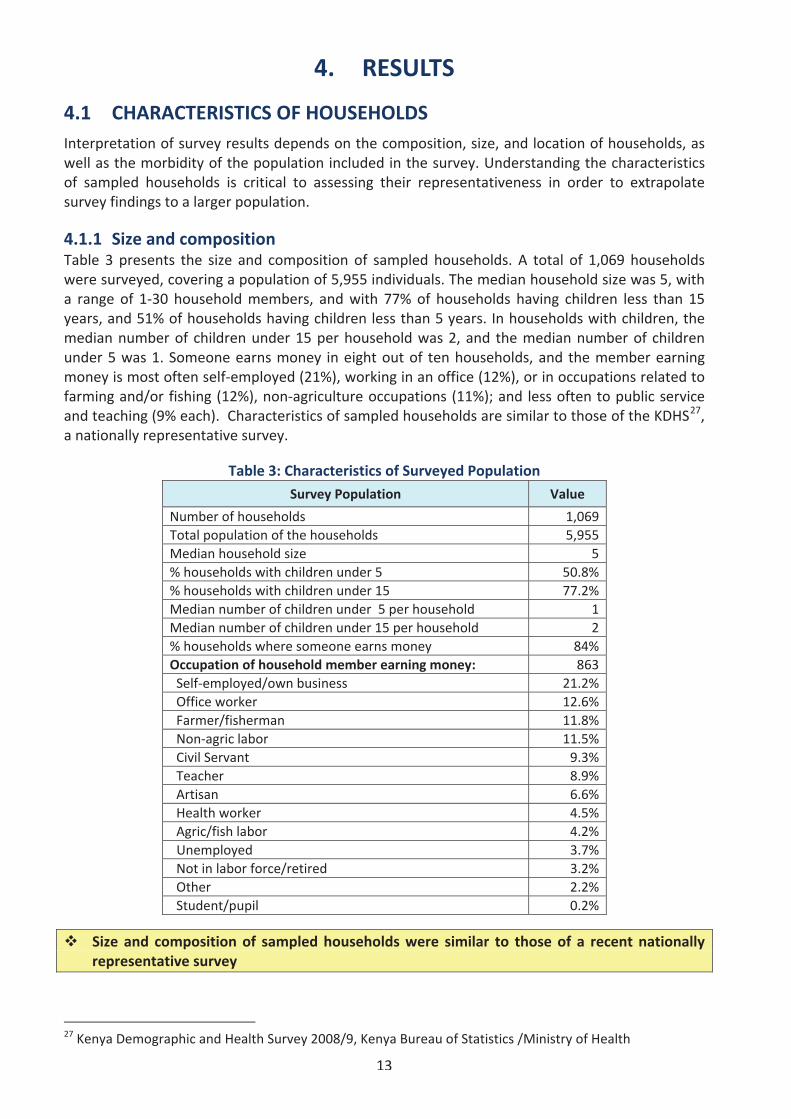
4.1.1 Size and compositionTable 3 presents the size and composition of sampled households. A total of 1,069 householdswere surveyed, covering a population of 5,955 individuals. The median household size was 5, witha range of 1 30 household members, and with 77% of households having children less than 15years, and 51% of households having children less than 5 years. In households with children, themedian number of children under 15 per household was 2, and the median number of childrenunder 5 was 1. Someone earns money in eight out of ten households, and the member earningmoney is most often self employed (21%), working in an office (12%), or in occupations related tofarming and/or fishing (12%), non agriculture occupations (11%); and less often to public serviceand teaching (9% each). Characteristics of sampled households are similar to those of the KDHS27,a nationally representative survey.
Table 3: Characteristics of Surveyed Population
Survey Population Value
Number of households 1,069Total population of the households 5,955Median household size 5% households with children under 5 50.8%% households with children under 15 77.2%Median number of children under 5 per household 1Median number of children under 15 per household 2% households where someone earns money 84%Occupation of household member earning money: 863Self employed/own business 21.2%Office worker 12.6%Farmer/fisherman 11.8%Non agric labor 11.5%Civil Servant 9.3%Teacher 8.9%Artisan 6.6%Health worker 4.5%Agric/fish labor 4.2%Unemployed 3.7%Not in labor force/retired 3.2%Other 2.2%Student/pupil 0.2%
Size and composition of sampled households were similar to those of a recent nationallyrepresentative survey
27 Kenya Demographic and Health Survey 2008/9, Kenya Bureau of Statistics /Ministry of Health
14
4.1.2 Socio economic status (SES)Socio economic status is a key attribute of households, influencing their options and decisions. Itcan be estimated by collecting information on expenditures/income and assets of households.
a) Self selected SES CategoriesThe medicines survey used a novel approach to identify the poor by asking respondents to matchtheir household expenditures with one of five pre defined ranges (See methodology). The lowestrange of expenditures was range A, defined as expenditure less than 1,200 Kenya Shillings (KES)per person per month. Range B corresponded to spending between KES 1,200 and 1,800 perperson per month, range C to spending between KES 1,801 to KES 2,600 per person per month,range D to spending between 2,601 and KES 5,200 per person per month. Range E was the highestpossible range of expenditures, defined as spending more than KES 5,200 per person per month.These five ranges of expenditures correspond the five SES categories used in the survey analysis.
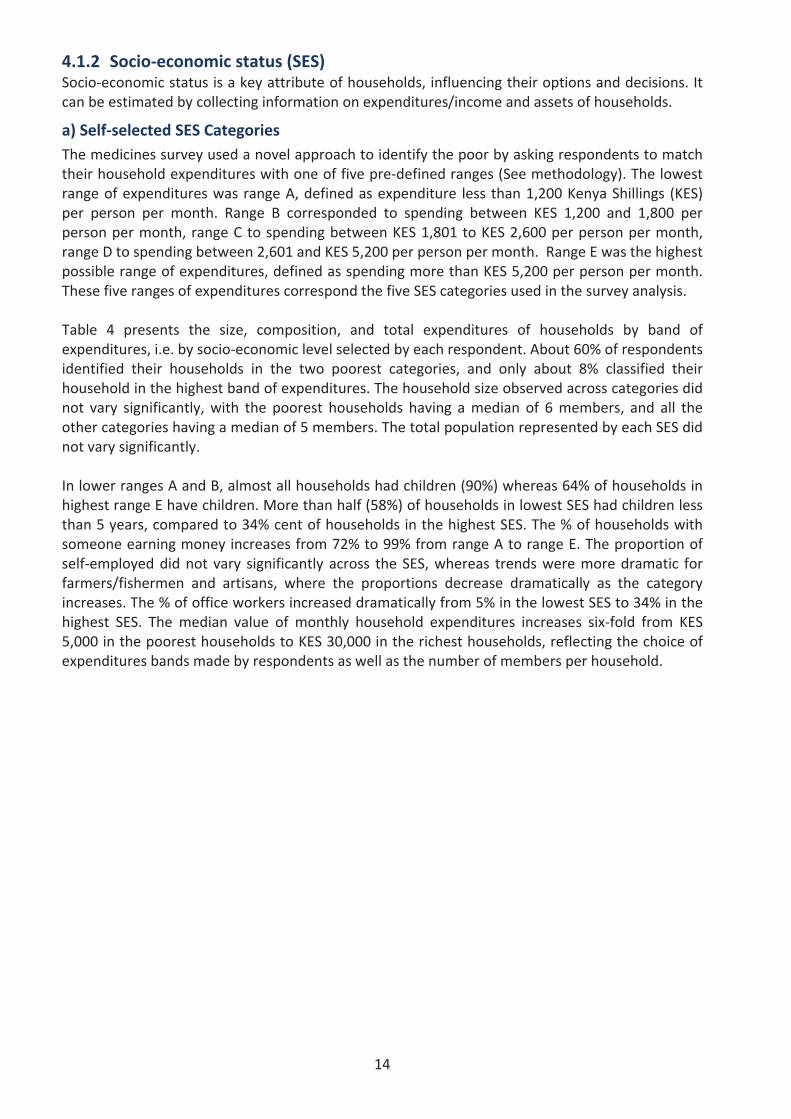
Table 4 presents the size, composition, and total expenditures of households by band ofexpenditures, i.e. by socio economic level selected by each respondent. About 60% of respondentsidentified their households in the two poorest categories, and only about 8% classified theirhousehold in the highest band of expenditures. The household size observed across categories didnot vary significantly, with the poorest households having a median of 6 members, and all theother categories having a median of 5 members. The total population represented by each SES didnot vary significantly.
In lower ranges A and B, almost all households had children (90%) whereas 64% of households inhighest range E have children. More than half (58%) of households in lowest SES had children lessthan 5 years, compared to 34% cent of households in the highest SES. The % of households withsomeone earning money increases from 72% to 99% from range A to range E. The proportion ofself employed did not vary significantly across the SES, whereas trends were more dramatic forfarmers/fishermen and artisans, where the proportions decrease dramatically as the categoryincreases. The % of office workers increased dramatically from 5% in the lowest SES to 34% in thehighest SES. The median value of monthly household expenditures increases six fold from KES5,000 in the poorest households to KES 30,000 in the richest households, reflecting the choice ofexpenditures bands made by respondents as well as the number of members per household.
15
Table 4: Composition, Size and SES of Surveyed Population
Survey PopulationSelf selected Socio economic Status
A B C D ENumber of households 432 211 163 164 89% of households 41% 20% 15% 16% 8%Population in the households 2620 1168 894 789 425% of population 44% 20% 15% 13% 7%Median household size 6 5 5 5 5% of households with children under 5(number)
58%(249)
58%(122)
45%(74)
38%(62)
34%(30)
% of households with children under 15(number)
90%(387)
87%(184)
83%(136)
77%(127)
64%(57)
Median number of children under 5 1.5 1.4 1.3 1.2 1.2Median number of children under 15 3 3 2 2 2% of households with a member earning money 72% 78% 87% 92% 99%Occupation of household member earning money (n): 311 167 142 151 87Farmer/fisherman 18.3% 12.0% 12.0% 2.6% 4.6%Teacher 5.1% 15.6% 9.9% 7.9% 10.3%Artisan 9.3% 7.2% 6.3% 3.3% 1.1%Office Worker 5.1% 9.0% 10.6% 20.5% 34.5%Civil Servant 4.5% 4.8% 14.1% 19.9% 8.0%Agric/fish labor 7.4% 3.6% 0.7% 3.3% 1.1%Non agric labor 19.3% 11.4% 3.5% 7.3% 3.4%Health worker 1.6% 4.2% 7.0% 8.6% 4.6%Self employed 20.6% 22.8% 23.2% 19.2% 21.8%Student/pupil 0.0% 1.2% 0.0% 0.0% 0.0%Unemployed 3.9% 4.2% 4.2% 4.0% 1.1%Not in labor force/retired 2.9% 1.2% 6.3% 2.0% 5.7%Other 1.9% 3.0% 2.1% 1.3% 3.4%Median of 4 week household total expenditure* (KES) 5,000 8,400 12,000 16,000 30,000
*Data on SES was not provided by 10 households SES: A=lowest, E=highest
A majority of respondents classified their household in lower socio economic groups
b) ExpendituresThe survey collected direct information on food and health expenditures. Providing an actual valueof 4 week total expenditures was optional. The recall period of total and health expenditures wasthe the four previous weeks whereas for food expenditures it was limited to the previous week.Food expenditure figures have been adjusted to take into account this difference in recall period.Discretionary expenditures were calculated as the difference between total 4 week expendituresand 4 week food expenditures.
i) Food and discretionary expenditures
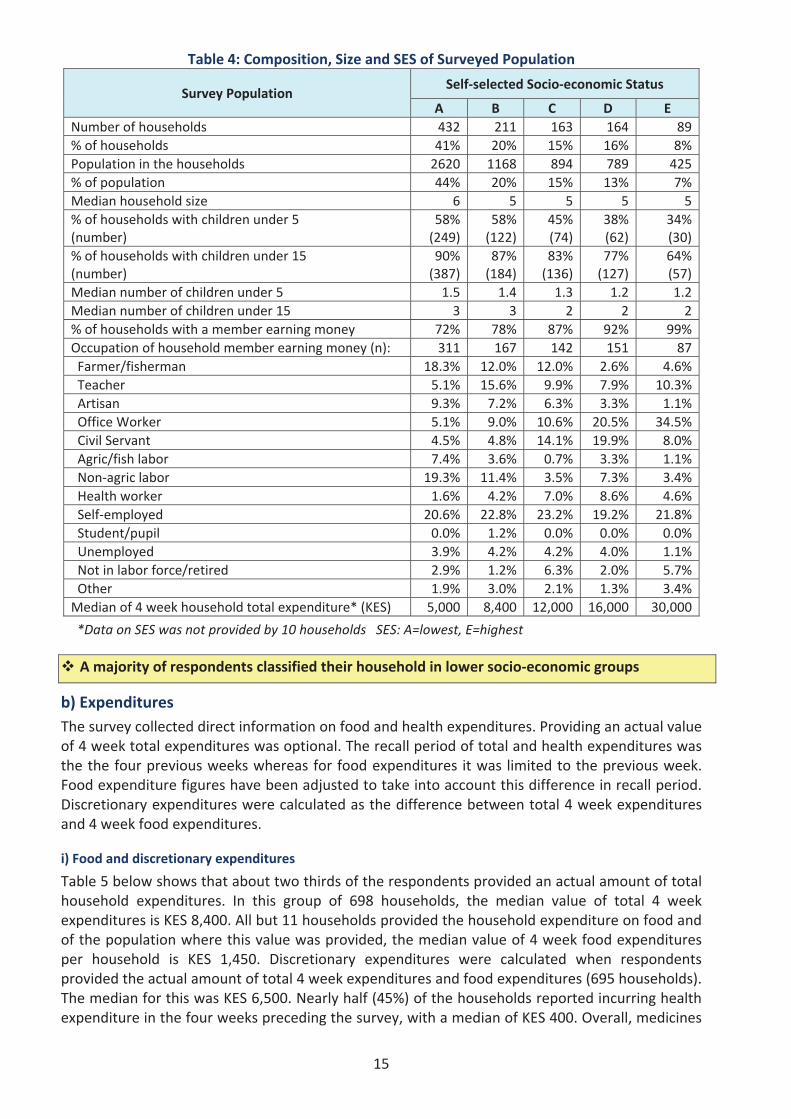
Table 5 below shows that about two thirds of the respondents provided an actual amount of totalhousehold expenditures. In this group of 698 households, the median value of total 4 weekexpenditures is KES 8,400. All but 11 households provided the household expenditure on food andof the population where this value was provided, the median value of 4 week food expendituresper household is KES 1,450. Discretionary expenditures were calculated when respondentsprovided the actual amount of total 4 week expenditures and food expenditures (695 households).The median for this was KES 6,500. Nearly half (45%) of the households reported incurring healthexpenditure in the four weeks preceding the survey, with a median of KES 400. Overall, medicines
16
expenditure accounted for almost all health expenditures (95%) in the lowest SES, compared tohalf (50%) in the highest SES. The large difference between means and medians of expendituresdisplayed in the Table is due to the presence of outliers in the higher ranges of expenditures.
Table 5: Monthly Household Expenditures (in KES)4 week Household Expenditures N Mean 25th %ile Median 75th %ile
Total 698 12,174 5,000 8,400 15,000Food 1058 2,014 900 1,450 2,500Discretionary 695 10,156 4,000 6,500 12,000Health 486 2,320 100 400 1,090Medicine 451 1,247 100 300 750Hospital 43 6,978 700 1,545 8,500Voluntary health insurance 56 2,834 320 320 915Other health 116 1,028 100 250 600
1 USD = KES 75 (for comparison)
Table 6 gives some more detail on household expenditures by splitting these into the medianvalues for each type of expenditure by SES.
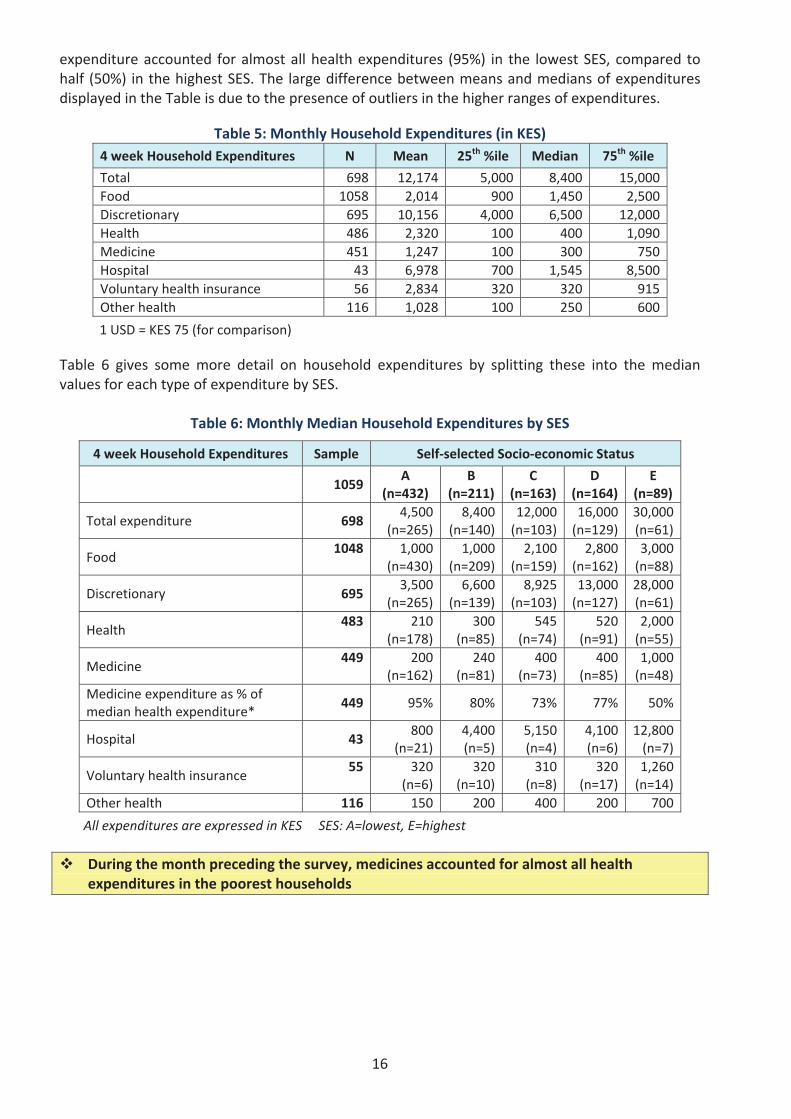
Table 6: Monthly Median Household Expenditures by SES
4 week Household Expenditures Sample Self selected Socio economic Status
1059A
(n=432)B
(n=211)C
(n=163)D
(n=164)E
(n=89)
Total expenditure 6984,500
(n=265)8,400
(n=140)12,000(n=103)
16,000(n=129)
30,000(n=61)
Food1048 1,000
(n=430)1,000
(n=209)2,100
(n=159)2,800
(n=162)3,000(n=88)
Discretionary 6953,500
(n=265)6,600
(n=139)8,925
(n=103)13,000(n=127)
28,000(n=61)
Health483 210
(n=178)300
(n=85)545
(n=74)520
(n=91)2,000(n=55)
Medicine449 200
(n=162)240
(n=81)400
(n=73)400
(n=85)1,000(n=48)
Medicine expenditure as % ofmedian health expenditure*
449 95% 80% 73% 77% 50%
Hospital 43800
(n=21)4,400(n=5)
5,150(n=4)
4,100(n=6)
12,800(n=7)
Voluntary health insurance55 320
(n=6)320
(n=10)310
(n=8)320
(n=17)1,260(n=14)
Other health 116 150 200 400 200 700
All expenditures are expressed in KES SES: A=lowest, E=highest
During the month preceding the survey, medicines accounted for almost all healthexpenditures in the poorest households
17
ii) Catastrophic Medicines Expenditures
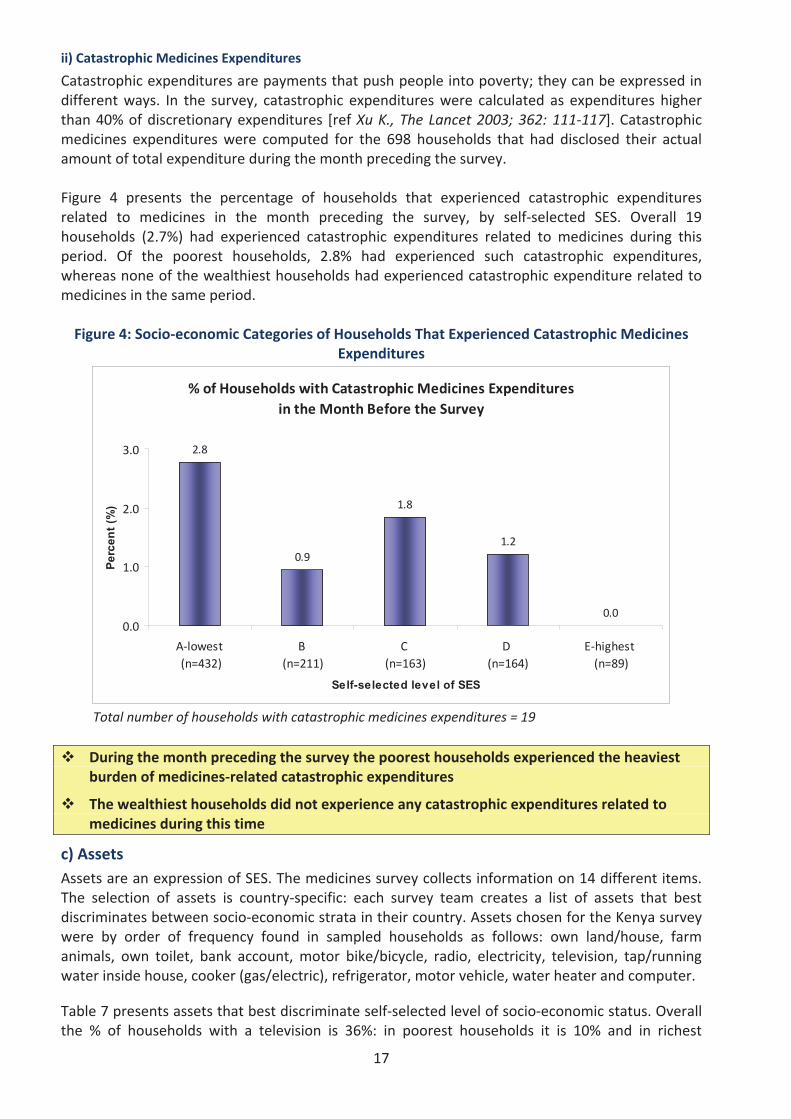
Catastrophic expenditures are payments that push people into poverty; they can be expressed indifferent ways. In the survey, catastrophic expenditures were calculated as expenditures higherthan 40% of discretionary expenditures [ref Xu K., The Lancet 2003; 362: 111 117]. Catastrophicmedicines expenditures were computed for the 698 households that had disclosed their actualamount of total expenditure during the month preceding the survey.
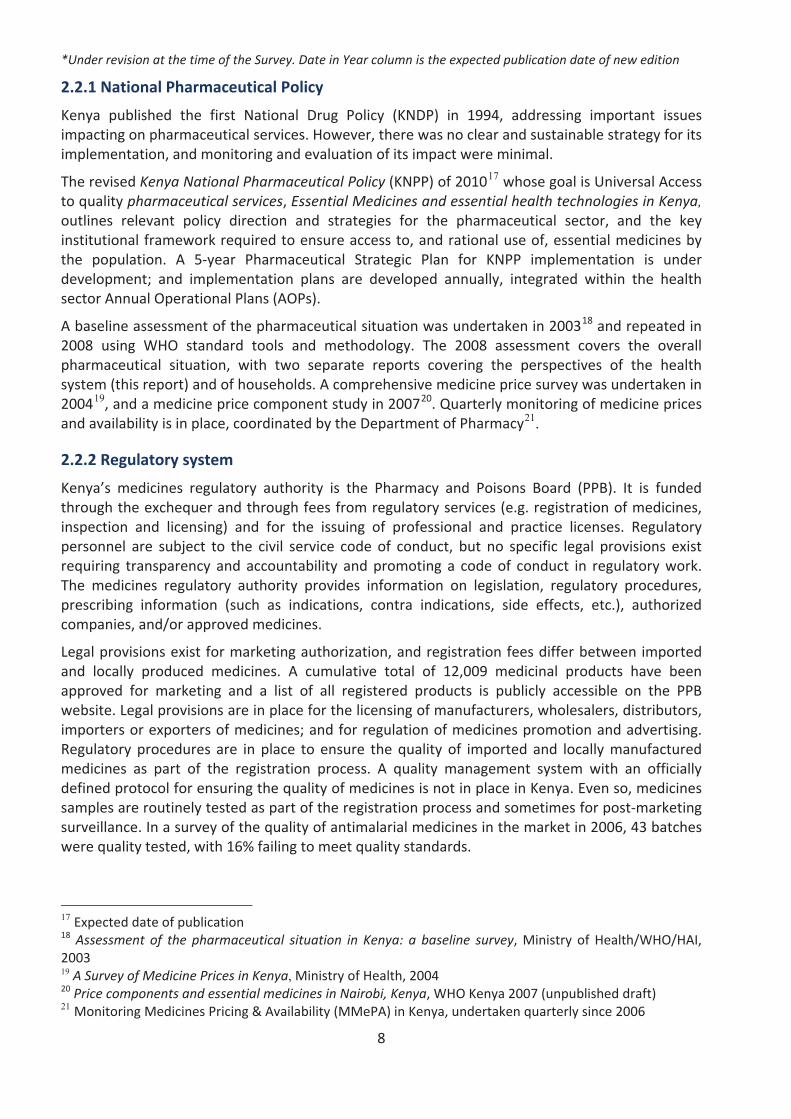
Figure 4 presents the percentage of households that experienced catastrophic expendituresrelated to medicines in the month preceding the survey, by self selected SES. Overall 19households (2.7%) had experienced catastrophic expenditures related to medicines during thisperiod. Of the poorest households, 2.8% had experienced such catastrophic expenditures,whereas none of the wealthiest households had experienced catastrophic expenditure related tomedicines in the same period.
Figure 4: Socio economic Categories of Households That Experienced Catastrophic MedicinesExpenditures
% of Households with Catastrophic Medicines Expendituresin the Month Before the Survey
2.8
0.9
1.8
1.2
0.00.0
1.0
2.0
3.0
A lowest(n=432)
B(n=211)
C(n=163)
D(n=164)
E highest(n=89)
Self-selected level of SES
Perc
ent (
%)
Total number of households with catastrophic medicines expenditures = 19
During the month preceding the survey the poorest households experienced the heaviestburden of medicines related catastrophic expenditures
The wealthiest households did not experience any catastrophic expenditures related tomedicines during this time
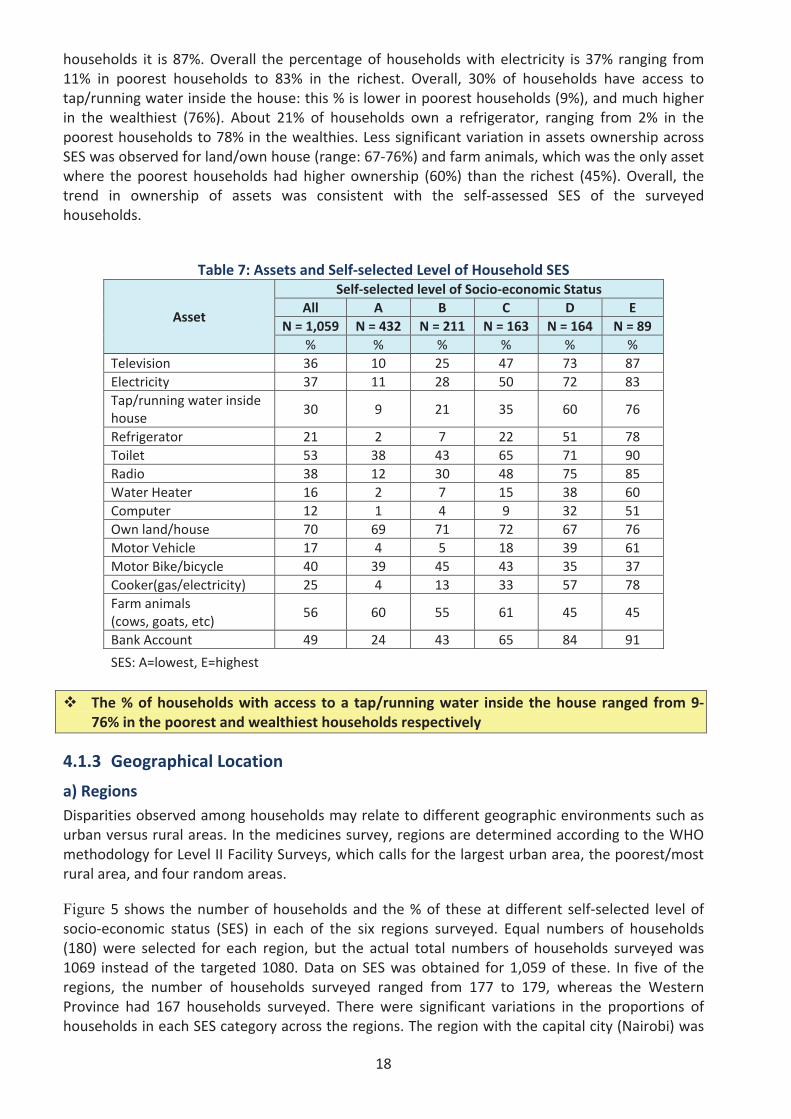
c) AssetsAssets are an expression of SES. The medicines survey collects information on 14 different items.The selection of assets is country specific: each survey team creates a list of assets that bestdiscriminates between socio economic strata in their country. Assets chosen for the Kenya surveywere by order of frequency found in sampled households as follows: own land/house, farmanimals, own toilet, bank account, motor bike/bicycle, radio, electricity, television, tap/runningwater inside house, cooker (gas/electric), refrigerator, motor vehicle, water heater and computer.
Table 7 presents assets that best discriminate self selected level of socio economic status. Overallthe % of households with a television is 36%: in poorest households it is 10% and in richest
18
households it is 87%. Overall the percentage of households with electricity is 37% ranging from11% in poorest households to 83% in the richest. Overall, 30% of households have access totap/running water inside the house: this % is lower in poorest households (9%), and much higherin the wealthiest (76%). About 21% of households own a refrigerator, ranging from 2% in thepoorest households to 78% in the wealthies. Less significant variation in assets ownership acrossSES was observed for land/own house (range: 67 76%) and farm animals, which was the only assetwhere the poorest households had higher ownership (60%) than the richest (45%). Overall, thetrend in ownership of assets was consistent with the self assessed SES of the surveyedhouseholds.
Table 7: Assets and Self selected Level of Household SES
Asset
Self selected level of Socio economic StatusAll A B C D E
N = 1,059 N = 432 N = 211 N = 163 N = 164 N = 89% % % % % %
Television 36 10 25 47 73 87Electricity 37 11 28 50 72 83Tap/running water insidehouse
30 9 21 35 60 76
Refrigerator 21 2 7 22 51 78Toilet 53 38 43 65 71 90Radio 38 12 30 48 75 85Water Heater 16 2 7 15 38 60Computer 12 1 4 9 32 51Own land/house 70 69 71 72 67 76Motor Vehicle 17 4 5 18 39 61Motor Bike/bicycle 40 39 45 43 35 37Cooker(gas/electricity) 25 4 13 33 57 78Farm animals(cows, goats, etc)
56 60 55 61 45 45
Bank Account 49 24 43 65 84 91
SES: A=lowest, E=highest
The % of households with access to a tap/running water inside the house ranged from 976% in the poorest and wealthiest households respectively
4.1.3 Geographical Location
a) RegionsDisparities observed among households may relate to different geographic environments such asurban versus rural areas. In the medicines survey, regions are determined according to the WHOmethodology for Level II Facility Surveys, which calls for the largest urban area, the poorest/mostrural area, and four random areas.
Figure 5 shows the number of households and the % of these at different self selected level ofsocio economic status (SES) in each of the six regions surveyed. Equal numbers of households(180) were selected for each region, but the actual total numbers of households surveyed was1069 instead of the targeted 1080. Data on SES was obtained for 1,059 of these. In five of theregions, the number of households surveyed ranged from 177 to 179, whereas the WesternProvince had 167 households surveyed. There were significant variations in the proportions ofhouseholds in each SES category across the regions. The region with the capital city (Nairobi) was
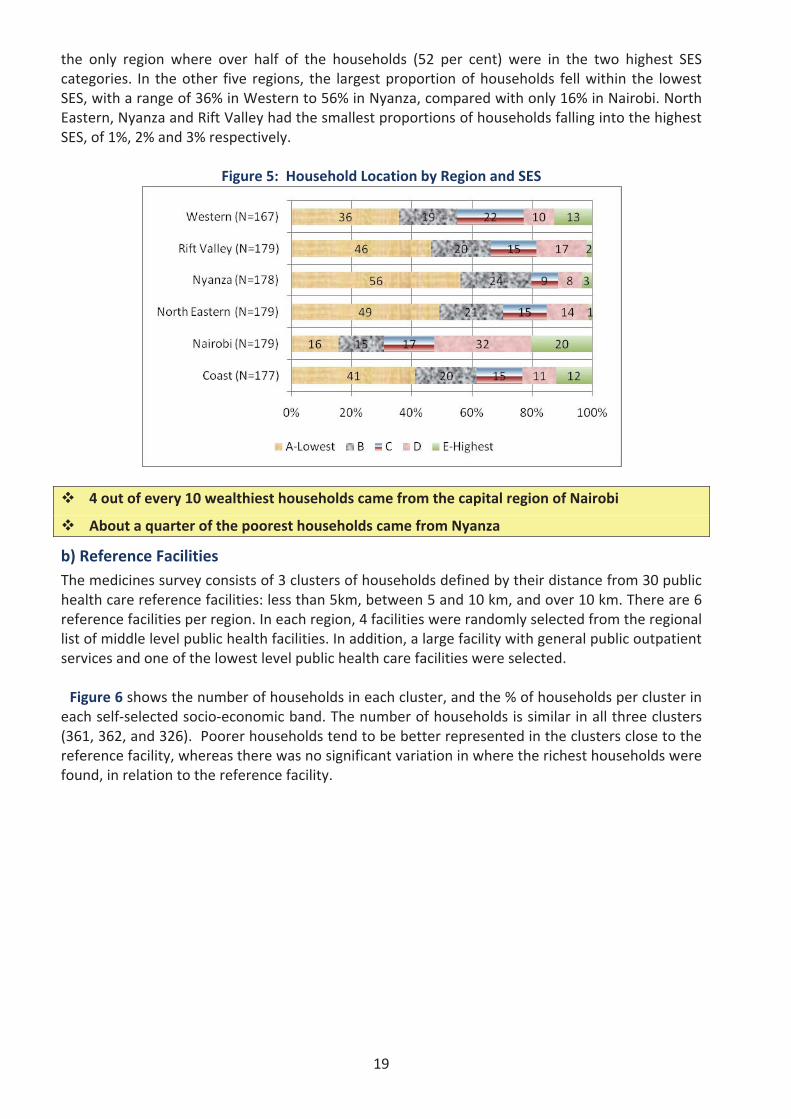
19
the only region where over half of the households (52 per cent) were in the two highest SEScategories. In the other five regions, the largest proportion of households fell within the lowestSES, with a range of 36% in Western to 56% in Nyanza, compared with only 16% in Nairobi. NorthEastern, Nyanza and Rift Valley had the smallest proportions of households falling into the highestSES, of 1%, 2% and 3% respectively.
Figure 5: Household Location by Region and SES
4 out of every 10 wealthiest households came from the capital region of Nairobi
About a quarter of the poorest households came from Nyanza
b) Reference FacilitiesThe medicines survey consists of 3 clusters of households defined by their distance from 30 publichealth care reference facilities: less than 5km, between 5 and 10 km, and over 10 km. There are 6reference facilities per region. In each region, 4 facilities were randomly selected from the regionallist of middle level public health facilities. In addition, a large facility with general public outpatientservices and one of the lowest level public health care facilities were selected.
Figure 6 shows the number of households in each cluster, and the % of households per cluster ineach self selected socio economic band. The number of households is similar in all three clusters(361, 362, and 326). Poorer households tend to be better represented in the clusters close to thereference facility, whereas there was no significant variation in where the richest households werefound, in relation to the reference facility.
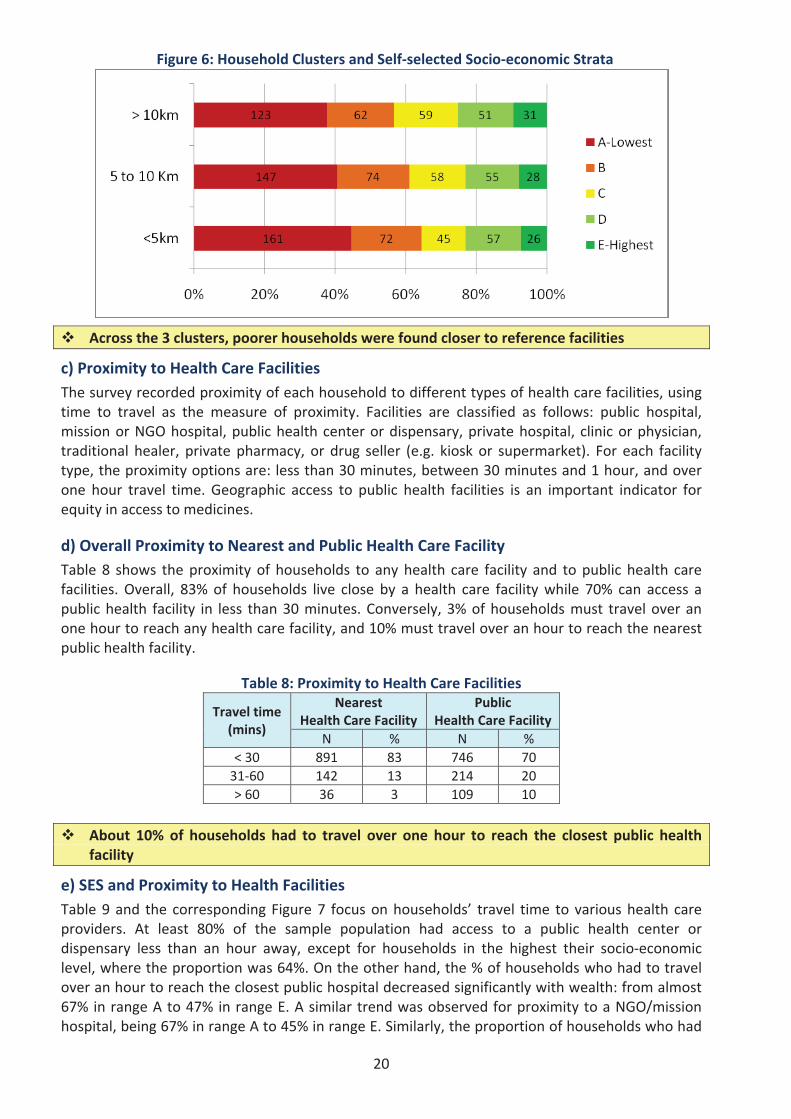
20
Figure 6: Household Clusters and Self selected Socio economic Strata
Across the 3 clusters, poorer households were found closer to reference facilities
c) Proximity to Health Care FacilitiesThe survey recorded proximity of each household to different types of health care facilities, usingtime to travel as the measure of proximity. Facilities are classified as follows: public hospital,mission or NGO hospital, public health center or dispensary, private hospital, clinic or physician,traditional healer, private pharmacy, or drug seller (e.g. kiosk or supermarket). For each facilitytype, the proximity options are: less than 30 minutes, between 30 minutes and 1 hour, and overone hour travel time. Geographic access to public health facilities is an important indicator forequity in access to medicines.
d) Overall Proximity to Nearest and Public Health Care FacilityTable 8 shows the proximity of households to any health care facility and to public health carefacilities. Overall, 83% of households live close by a health care facility while 70% can access apublic health facility in less than 30 minutes. Conversely, 3% of households must travel over anone hour to reach any health care facility, and 10% must travel over an hour to reach the nearestpublic health facility.
Table 8: Proximity to Health Care Facilities
Travel time(mins)
NearestHealth Care Facility
PublicHealth Care Facility
N % N %< 30 891 83 746 7031 60 142 13 214 20> 60 36 3 109 10
About 10% of households had to travel over one hour to reach the closest public healthfacility
e) SES and Proximity to Health FacilitiesTable 9 and the corresponding Figure 7 focus on households’ travel time to various health careproviders. At least 80% of the sample population had access to a public health center ordispensary less than an hour away, except for households in the highest their socio economiclevel, where the proportion was 64%. On the other hand, the % of households who had to travelover an hour to reach the closest public hospital decreased significantly with wealth: from almost67% in range A to 47% in range E. A similar trend was observed for proximity to a NGO/missionhospital, being 67% in range A to 45% in range E. Similarly, the proportion of households who had
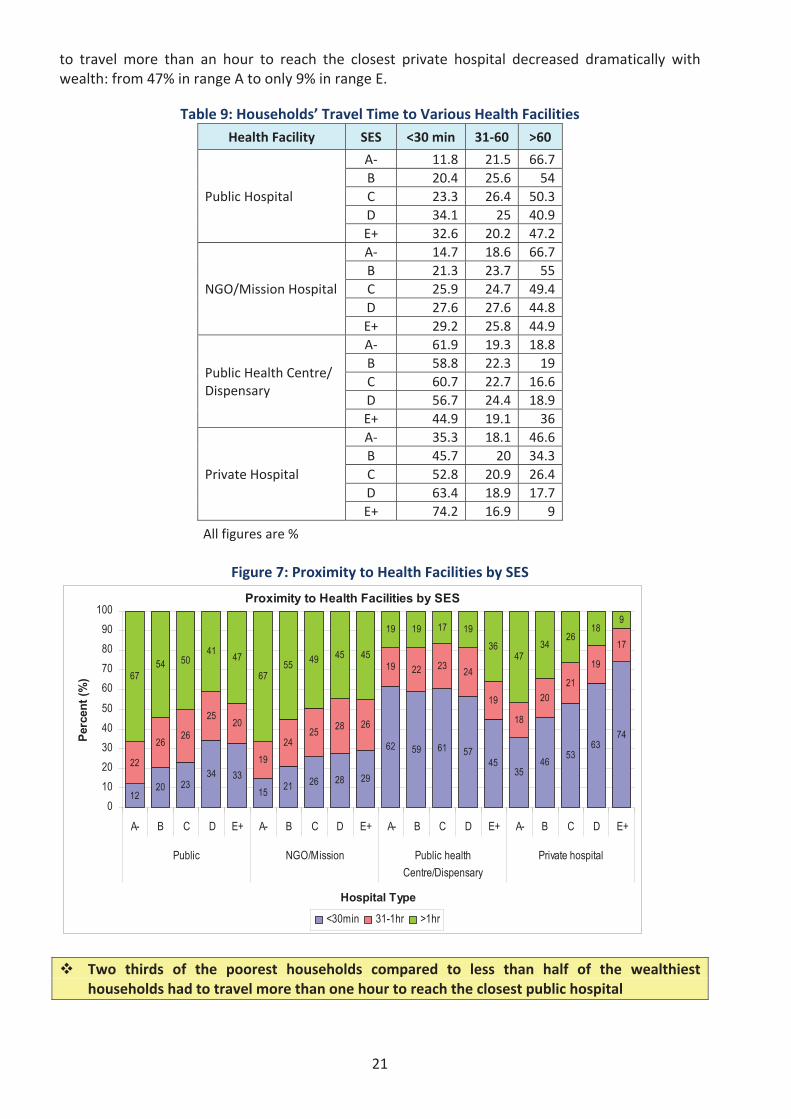
21
to travel more than an hour to reach the closest private hospital decreased dramatically withwealth: from 47% in range A to only 9% in range E.
Table 9: Households’ Travel Time to Various Health FacilitiesHealth Facility SES <30 min 31 60 >60
Public Hospital
A 11.8 21.5 66.7B 20.4 25.6 54C 23.3 26.4 50.3D 34.1 25 40.9E+ 32.6 20.2 47.2
NGO/Mission Hospital
A 14.7 18.6 66.7B 21.3 23.7 55C 25.9 24.7 49.4D 27.6 27.6 44.8E+ 29.2 25.8 44.9
Public Health Centre/Dispensary
A 61.9 19.3 18.8B 58.8 22.3 19C 60.7 22.7 16.6D 56.7 24.4 18.9E+ 44.9 19.1 36
Private Hospital
A 35.3 18.1 46.6B 45.7 20 34.3C 52.8 20.9 26.4D 63.4 18.9 17.7E+ 74.2 16.9 9
All figures are %
Figure 7: Proximity to Health Facilities by SES
Proximity to Health Facilities by SES
1220 23
34 3315 21 26 28 29
62 59 61 5745
3546 53
6374
22
2626
2520
1924
25 28 26
19 22 23 24
19
18
2021
19
17
6754 50
41 47
6755 49 45 45
19 19 17 1936
4734
2618
9
0102030405060708090
100
A- B C D E+ A- B C D E+ A- B C D E+ A- B C D E+
Public NGO/Mission Public healthCentre/Dispensary
Private hospital
Hospital Type
Perc
ent (
%)
<30min 31-1hr >1hr
Two thirds of the poorest households compared to less than half of the wealthiesthouseholds had to travel more than one hour to reach the closest public hospital
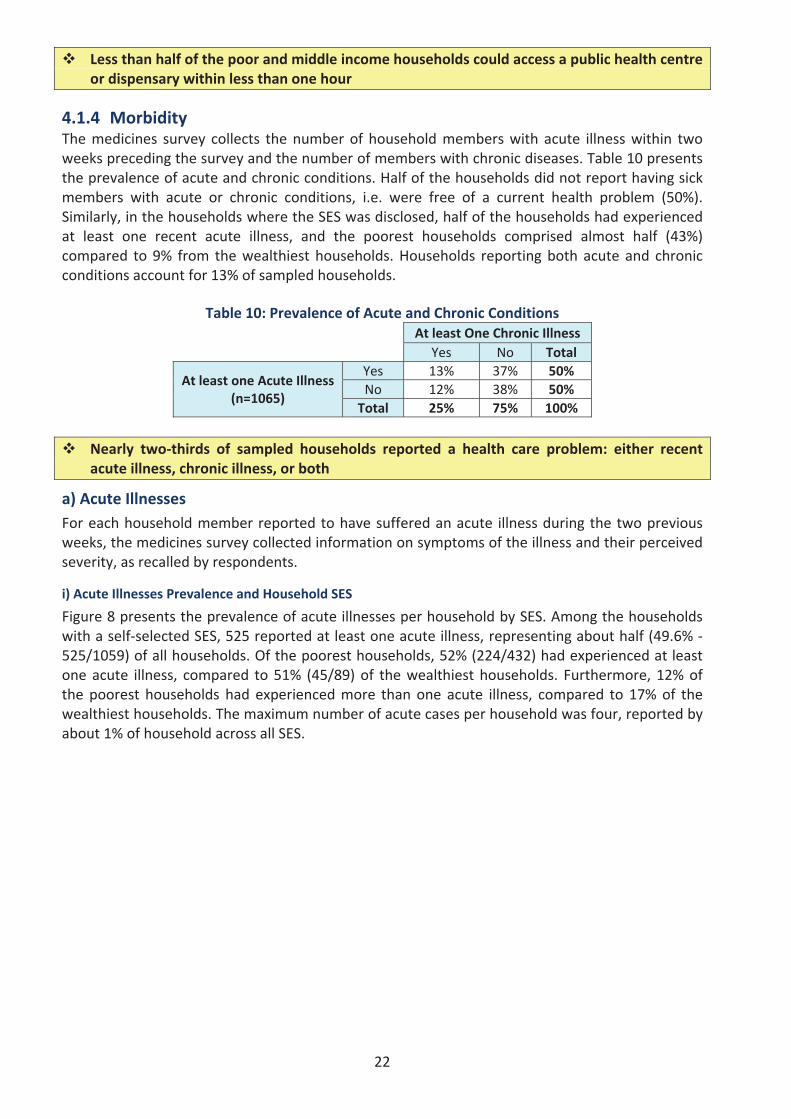
22
Less than half of the poor and middle income households could access a public health centreor dispensary within less than one hour
4.1.4 MorbidityThe medicines survey collects the number of household members with acute illness within twoweeks preceding the survey and the number of members with chronic diseases. Table 10 presentsthe prevalence of acute and chronic conditions. Half of the households did not report having sickmembers with acute or chronic conditions, i.e. were free of a current health problem (50%).Similarly, in the households where the SES was disclosed, half of the households had experiencedat least one recent acute illness, and the poorest households comprised almost half (43%)compared to 9% from the wealthiest households. Households reporting both acute and chronicconditions account for 13% of sampled households.
Table 10: Prevalence of Acute and Chronic ConditionsAt least One Chronic Illness
Yes No Total
At least one Acute Illness(n=1065)
Yes 13% 37% 50%No 12% 38% 50%Total 25% 75% 100%
Nearly two thirds of sampled households reported a health care problem: either recentacute illness, chronic illness, or both
a) Acute IllnessesFor each household member reported to have suffered an acute illness during the two previousweeks, the medicines survey collected information on symptoms of the illness and their perceivedseverity, as recalled by respondents.
i) Acute Illnesses Prevalence and Household SES
Figure 8 presents the prevalence of acute illnesses per household by SES. Among the householdswith a self selected SES, 525 reported at least one acute illness, representing about half (49.6%525/1059) of all households. Of the poorest households, 52% (224/432) had experienced at leastone acute illness, compared to 51% (45/89) of the wealthiest households. Furthermore, 12% ofthe poorest households had experienced more than one acute illness, compared to 17% of thewealthiest households. The maximum number of acute cases per household was four, reported byabout 1% of household across all SES.
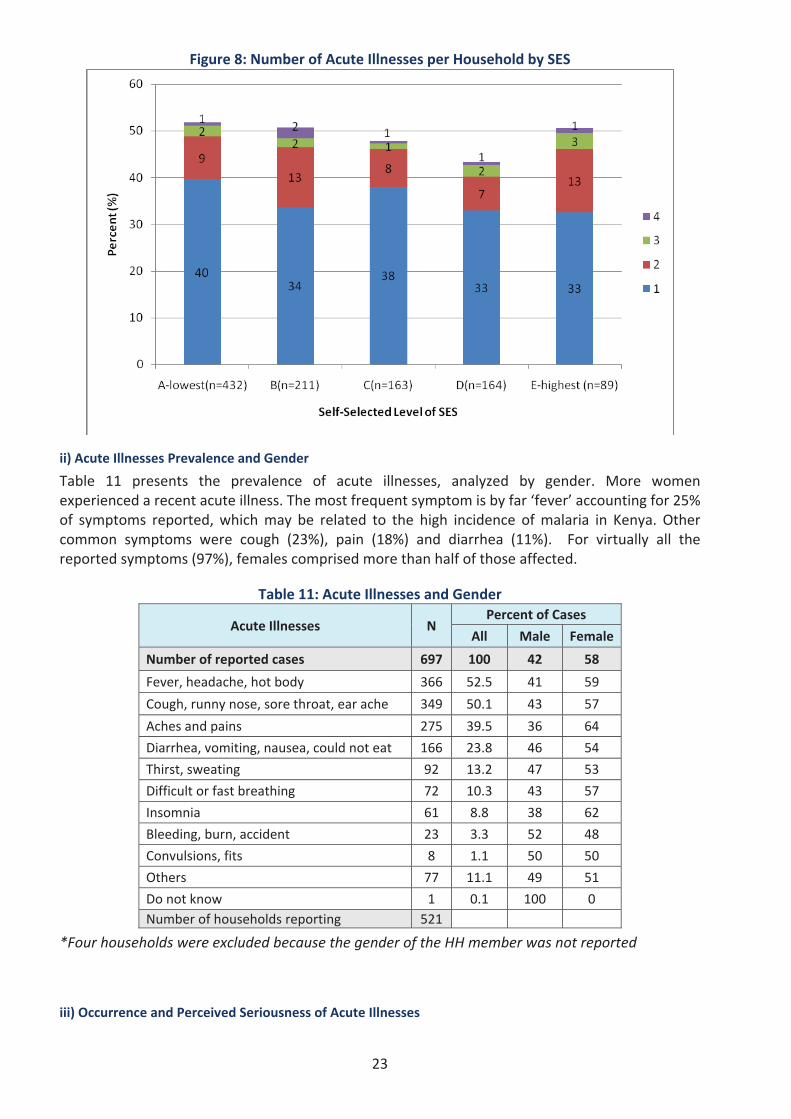
23
Figure 8: Number of Acute Illnesses per Household by SES
ii) Acute Illnesses Prevalence and Gender
Table 11 presents the prevalence of acute illnesses, analyzed by gender. More womenexperienced a recent acute illness. The most frequent symptom is by far ‘fever’ accounting for 25%of symptoms reported, which may be related to the high incidence of malaria in Kenya. Othercommon symptoms were cough (23%), pain (18%) and diarrhea (11%). For virtually all thereported symptoms (97%), females comprised more than half of those affected.
Table 11: Acute Illnesses and Gender
Acute Illnesses NPercent of Cases
All Male Female
Number of reported cases 697 100 42 58
Fever, headache, hot body 366 52.5 41 59
Cough, runny nose, sore throat, ear ache 349 50.1 43 57
Aches and pains 275 39.5 36 64
Diarrhea, vomiting, nausea, could not eat 166 23.8 46 54
Thirst, sweating 92 13.2 47 53
Difficult or fast breathing 72 10.3 43 57
Insomnia 61 8.8 38 62
Bleeding, burn, accident 23 3.3 52 48
Convulsions, fits 8 1.1 50 50
Others 77 11.1 49 51
Do not know 1 0.1 100 0Number of households reporting 521
*Four households were excluded because the gender of the HH member was not reported
iii) Occurrence and Perceived Seriousness of Acute Illnesses
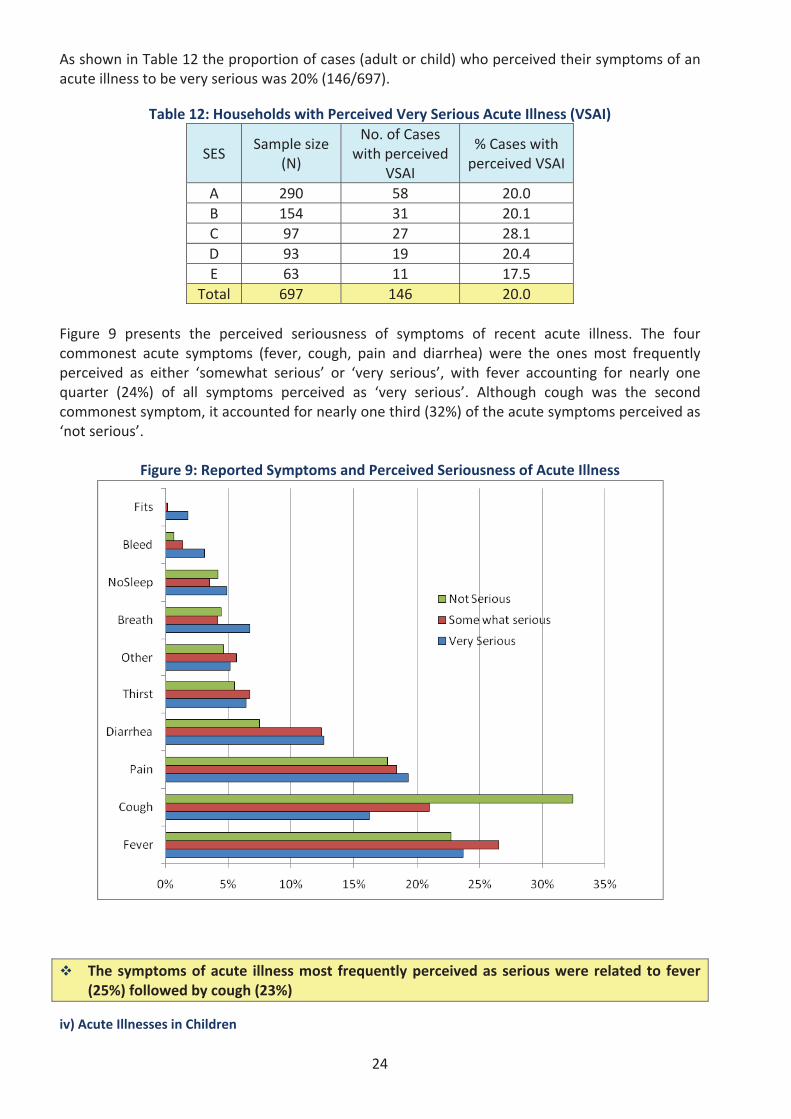
24
As shown in Table 12 the proportion of cases (adult or child) who perceived their symptoms of anacute illness to be very serious was 20% (146/697).
Table 12: Households with Perceived Very Serious Acute Illness (VSAI)
SESSample size
(N)
No. of Caseswith perceived
VSAI
% Cases withperceived VSAI
A 290 58 20.0B 154 31 20.1C 97 27 28.1D 93 19 20.4E 63 11 17.5
Total 697 146 20.0
Figure 9 presents the perceived seriousness of symptoms of recent acute illness. The fourcommonest acute symptoms (fever, cough, pain and diarrhea) were the ones most frequentlyperceived as either ‘somewhat serious’ or ‘very serious’, with fever accounting for nearly onequarter (24%) of all symptoms perceived as ‘very serious’. Although cough was the secondcommonest symptom, it accounted for nearly one third (32%) of the acute symptoms perceived as‘not serious’.
Figure 9: Reported Symptoms and Perceived Seriousness of Acute Illness
The symptoms of acute illness most frequently perceived as serious were related to fever(25%) followed by cough (23%)
iv) Acute Illnesses in Children
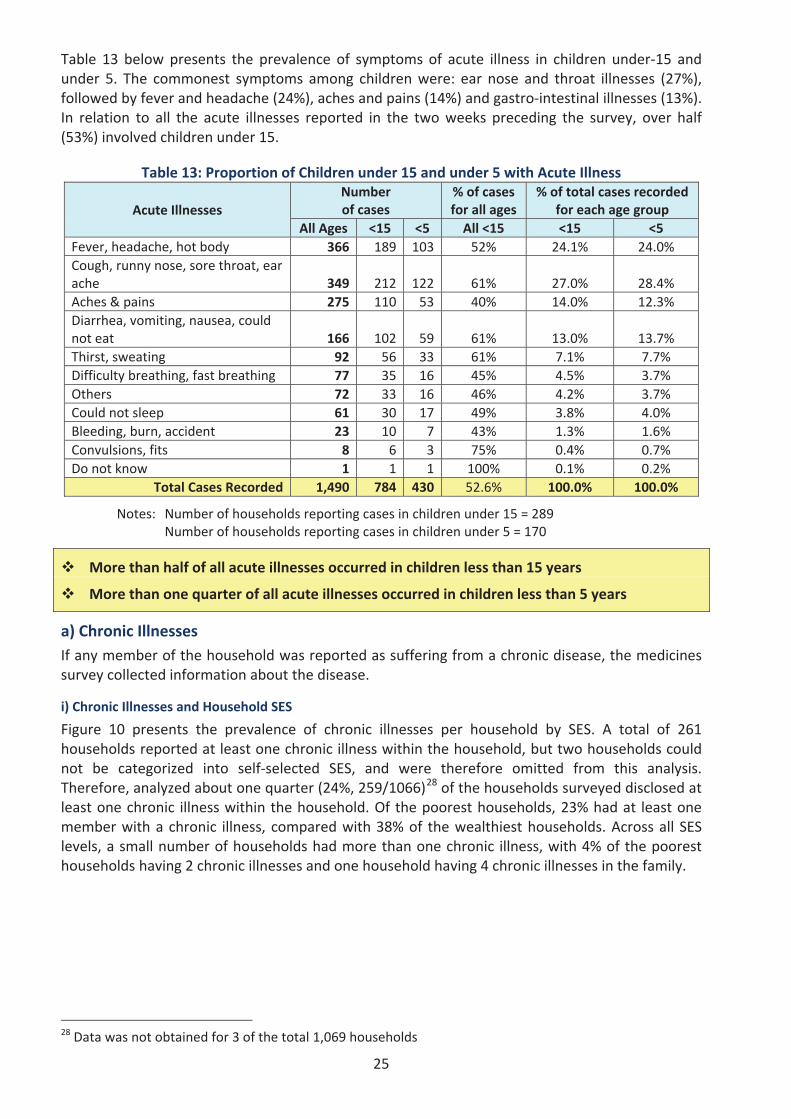
25
Table 13 below presents the prevalence of symptoms of acute illness in children under 15 andunder 5. The commonest symptoms among children were: ear nose and throat illnesses (27%),followed by fever and headache (24%), aches and pains (14%) and gastro intestinal illnesses (13%).In relation to all the acute illnesses reported in the two weeks preceding the survey, over half(53%) involved children under 15.
Table 13: Proportion of Children under 15 and under 5 with Acute Illness
Acute IllnessesNumberof cases
% of casesfor all ages
% of total cases recordedfor each age group
All Ages <15 <5 All <15 <15 <5Fever, headache, hot body 366 189 103 52% 24.1% 24.0%Cough, runny nose, sore throat, earache 349 212 122 61% 27.0% 28.4%Aches & pains 275 110 53 40% 14.0% 12.3%Diarrhea, vomiting, nausea, couldnot eat 166 102 59 61% 13.0% 13.7%Thirst, sweating 92 56 33 61% 7.1% 7.7%Difficulty breathing, fast breathing 77 35 16 45% 4.5% 3.7%Others 72 33 16 46% 4.2% 3.7%Could not sleep 61 30 17 49% 3.8% 4.0%Bleeding, burn, accident 23 10 7 43% 1.3% 1.6%Convulsions, fits 8 6 3 75% 0.4% 0.7%Do not know 1 1 1 100% 0.1% 0.2%
Total Cases Recorded 1,490 784 430 52.6% 100.0% 100.0%
Notes: Number of households reporting cases in children under 15 = 289Number of households reporting cases in children under 5 = 170
More than half of all acute illnesses occurred in children less than 15 years
More than one quarter of all acute illnesses occurred in children less than 5 years
a) Chronic IllnessesIf any member of the household was reported as suffering from a chronic disease, the medicinessurvey collected information about the disease.
i) Chronic Illnesses and Household SES
Figure 10 presents the prevalence of chronic illnesses per household by SES. A total of 261households reported at least one chronic illness within the household, but two households couldnot be categorized into self selected SES, and were therefore omitted from this analysis.Therefore, analyzed about one quarter (24%, 259/1066)28 of the households surveyed disclosed atleast one chronic illness within the household. Of the poorest households, 23% had at least onemember with a chronic illness, compared with 38% of the wealthiest households. Across all SESlevels, a small number of households had more than one chronic illness, with 4% of the pooresthouseholds having 2 chronic illnesses and one household having 4 chronic illnesses in the family.
28 Data was not obtained for 3 of the total 1,069 households
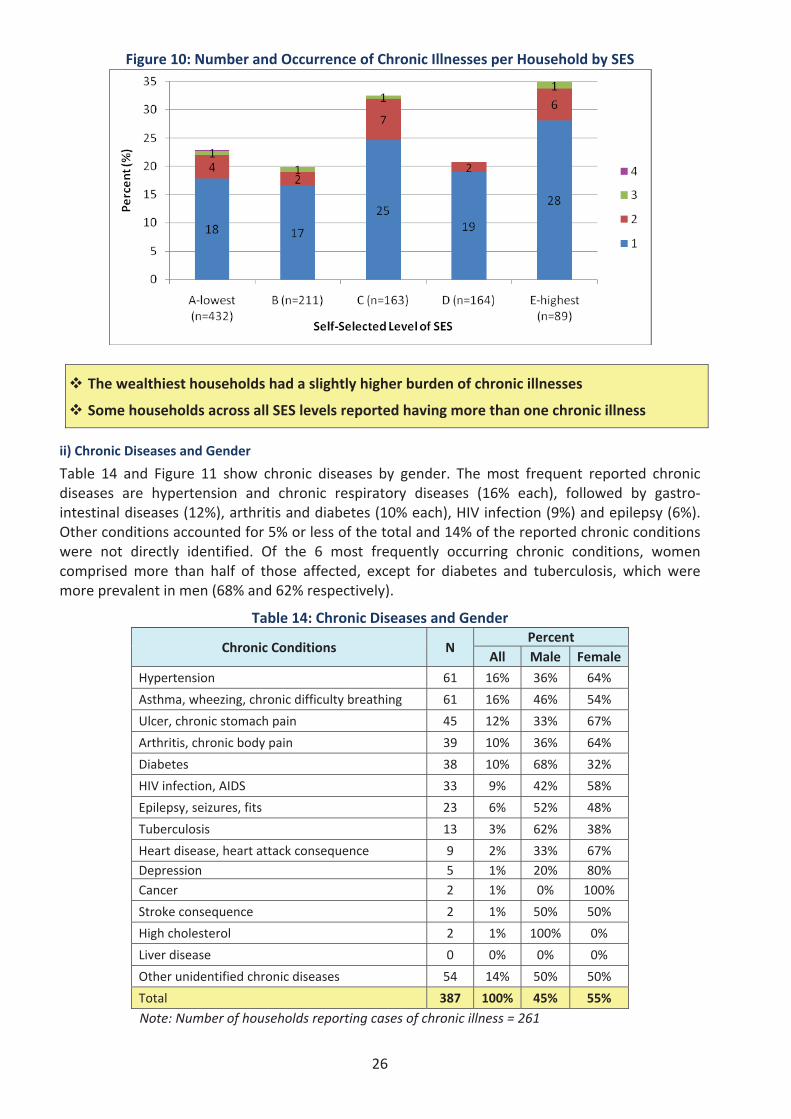
26
Figure 10: Number and Occurrence of Chronic Illnesses per Household by SES
The wealthiest households had a slightly higher burden of chronic illnesses
Some households across all SES levels reported having more than one chronic illness
ii) Chronic Diseases and Gender
Table 14 and Figure 11 show chronic diseases by gender. The most frequent reported chronicdiseases are hypertension and chronic respiratory diseases (16% each), followed by gastrointestinal diseases (12%), arthritis and diabetes (10% each), HIV infection (9%) and epilepsy (6%).Other conditions accounted for 5% or less of the total and 14% of the reported chronic conditionswere not directly identified. Of the 6 most frequently occurring chronic conditions, womencomprised more than half of those affected, except for diabetes and tuberculosis, which weremore prevalent in men (68% and 62% respectively).
Table 14: Chronic Diseases and Gender
Chronic Conditions NPercent
All Male FemaleHypertension 61 16% 36% 64%
Asthma, wheezing, chronic difficulty breathing 61 16% 46% 54%
Ulcer, chronic stomach pain 45 12% 33% 67%
Arthritis, chronic body pain 39 10% 36% 64%
Diabetes 38 10% 68% 32%
HIV infection, AIDS 33 9% 42% 58%
Epilepsy, seizures, fits 23 6% 52% 48%
Tuberculosis 13 3% 62% 38%
Heart disease, heart attack consequence 9 2% 33% 67%Depression 5 1% 20% 80%Cancer 2 1% 0% 100%
Stroke consequence 2 1% 50% 50%
High cholesterol 2 1% 100% 0%
Liver disease 0 0% 0% 0%
Other unidentified chronic diseases 54 14% 50% 50%
Total 387 100% 45% 55%
Note: Number of households reporting cases of chronic illness = 261
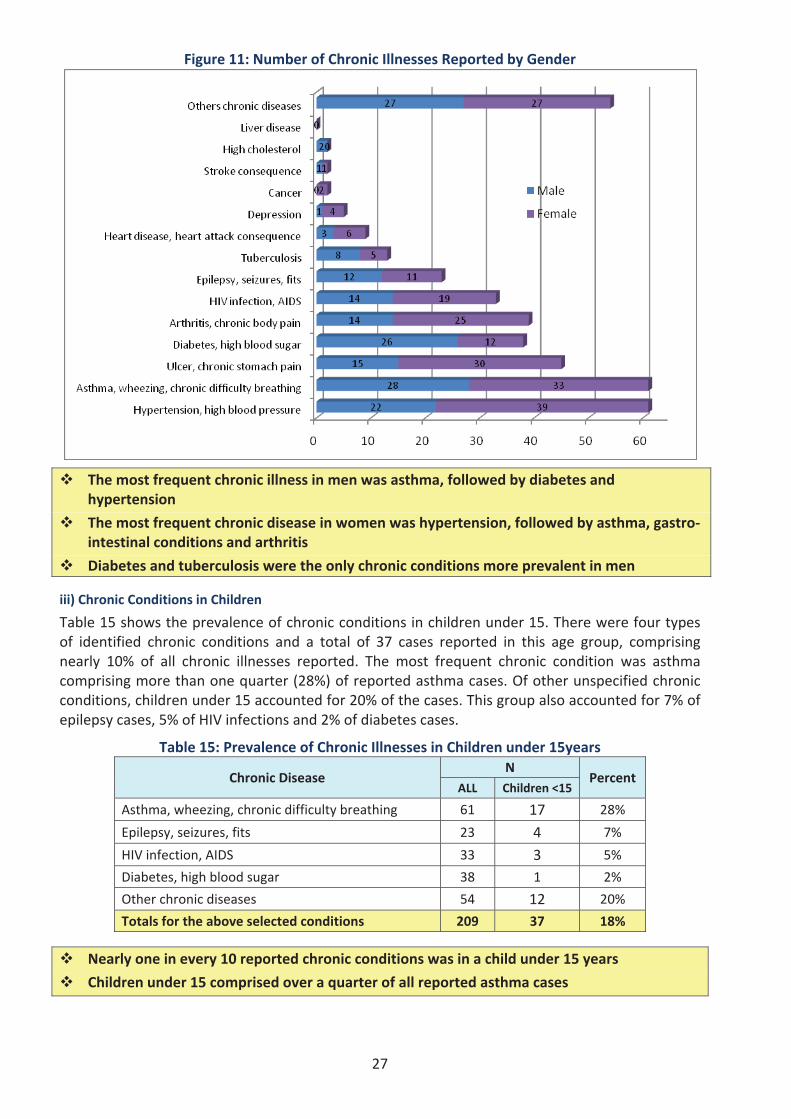
27
Figure 11: Number of Chronic Illnesses Reported by Gender
The most frequent chronic illness in men was asthma, followed by diabetes andhypertension
The most frequent chronic disease in women was hypertension, followed by asthma, gastrointestinal conditions and arthritis
Diabetes and tuberculosis were the only chronic conditions more prevalent in men
iii) Chronic Conditions in Children
Table 15 shows the prevalence of chronic conditions in children under 15. There were four typesof identified chronic conditions and a total of 37 cases reported in this age group, comprisingnearly 10% of all chronic illnesses reported. The most frequent chronic condition was asthmacomprising more than one quarter (28%) of reported asthma cases. Of other unspecified chronicconditions, children under 15 accounted for 20% of the cases. This group also accounted for 7% ofepilepsy cases, 5% of HIV infections and 2% of diabetes cases.
Table 15: Prevalence of Chronic Illnesses in Children under 15years
Chronic DiseaseN
PercentALL Children <15
Asthma, wheezing, chronic difficulty breathing 61 17 28%
Epilepsy, seizures, fits 23 4 7%
HIV infection, AIDS 33 3 5%
Diabetes, high blood sugar 38 1 2%
Other chronic diseases 54 12 20%
Totals for the above selected conditions 209 37 18%
Nearly one in every 10 reported chronic conditions was in a child under 15 years
Children under 15 comprised over a quarter of all reported asthma cases
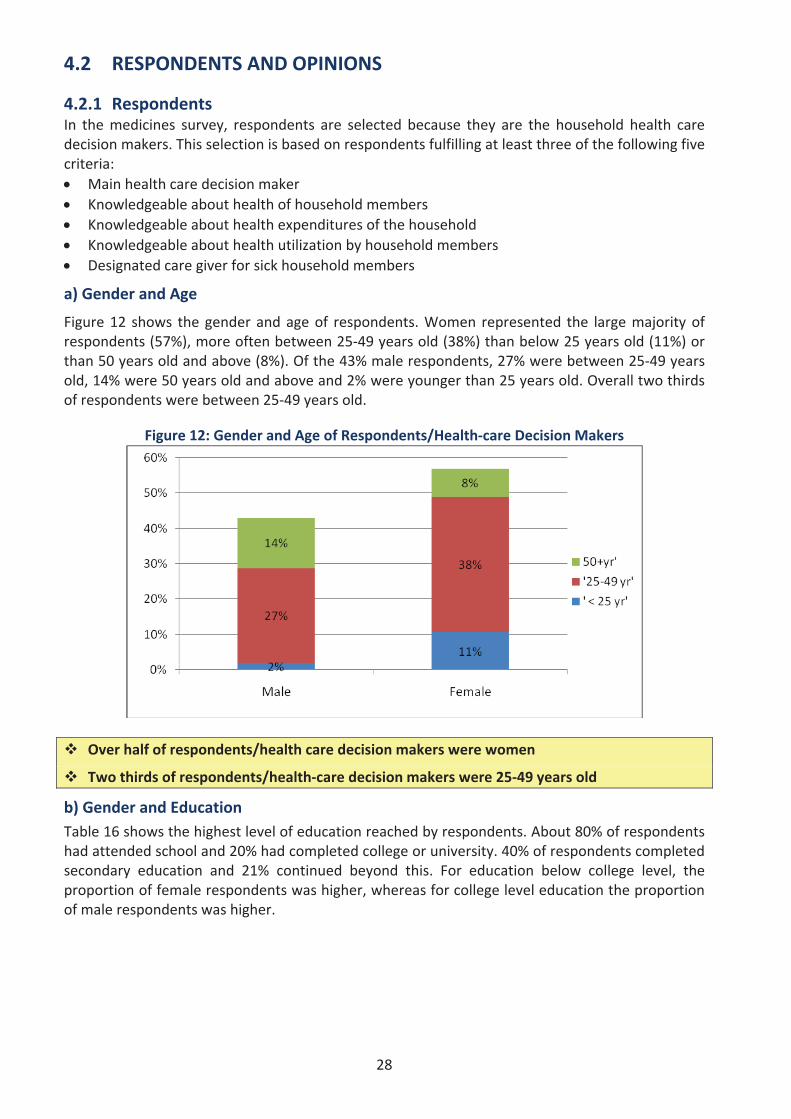
28
4.2 RESPONDENTS AND OPINIONS
4.2.1 RespondentsIn the medicines survey, respondents are selected because they are the household health caredecision makers. This selection is based on respondents fulfilling at least three of the following fivecriteria:
Main health care decision makerKnowledgeable about health of household membersKnowledgeable about health expenditures of the householdKnowledgeable about health utilization by household membersDesignated care giver for sick household members
a) Gender and Age
Figure 12 shows the gender and age of respondents. Women represented the large majority ofrespondents (57%), more often between 25 49 years old (38%) than below 25 years old (11%) orthan 50 years old and above (8%). Of the 43% male respondents, 27% were between 25 49 yearsold, 14% were 50 years old and above and 2% were younger than 25 years old. Overall two thirdsof respondents were between 25 49 years old.
Figure 12: Gender and Age of Respondents/Health care Decision Makers
Over half of respondents/health care decision makers were women
Two thirds of respondents/health care decision makers were 25 49 years old
b) Gender and EducationTable 16 shows the highest level of education reached by respondents. About 80% of respondentshad attended school and 20% had completed college or university. 40% of respondents completedsecondary education and 21% continued beyond this. For education below college level, theproportion of female respondents was higher, whereas for college level education the proportionof male respondents was higher.
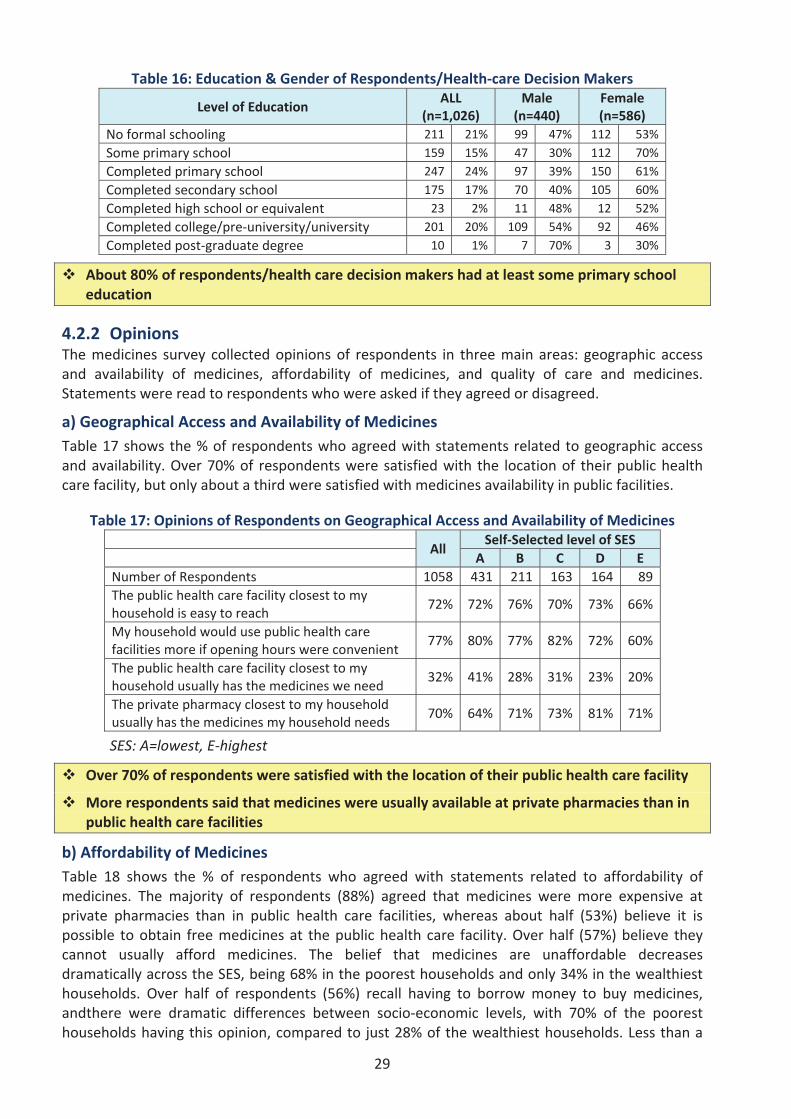
29
Table 16: Education & Gender of Respondents/Health care Decision Makers
Level of EducationALL
(n=1,026)Male
(n=440)Female(n=586)
No formal schooling 211 21% 99 47% 112 53%Some primary school 159 15% 47 30% 112 70%Completed primary school 247 24% 97 39% 150 61%Completed secondary school 175 17% 70 40% 105 60%Completed high school or equivalent 23 2% 11 48% 12 52%Completed college/pre university/university 201 20% 109 54% 92 46%Completed post graduate degree 10 1% 7 70% 3 30%
About 80% of respondents/health care decision makers had at least some primary schooleducation
4.2.2 OpinionsThe medicines survey collected opinions of respondents in three main areas: geographic accessand availability of medicines, affordability of medicines, and quality of care and medicines.Statements were read to respondents who were asked if they agreed or disagreed.
a) Geographical Access and Availability of MedicinesTable 17 shows the % of respondents who agreed with statements related to geographic accessand availability. Over 70% of respondents were satisfied with the location of their public healthcare facility, but only about a third were satisfied with medicines availability in public facilities.
Table 17: Opinions of Respondents on Geographical Access and Availability of Medicines
AllSelf Selected level of SES
A B C D ENumber of Respondents 1058 431 211 163 164 89The public health care facility closest to myhousehold is easy to reach
72% 72% 76% 70% 73% 66%
My household would use public health carefacilities more if opening hours were convenient
77% 80% 77% 82% 72% 60%
The public health care facility closest to myhousehold usually has the medicines we need
32% 41% 28% 31% 23% 20%
The private pharmacy closest to my householdusually has the medicines my household needs
70% 64% 71% 73% 81% 71%
SES: A=lowest, E highest
Over 70% of respondents were satisfied with the location of their public health care facility
More respondents said that medicines were usually available at private pharmacies than inpublic health care facilities
b) Affordability of MedicinesTable 18 shows the % of respondents who agreed with statements related to affordability ofmedicines. The majority of respondents (88%) agreed that medicines were more expensive atprivate pharmacies than in public health care facilities, whereas about half (53%) believe it ispossible to obtain free medicines at the public health care facility. Over half (57%) believe theycannot usually afford medicines. The belief that medicines are unaffordable decreasesdramatically across the SES, being 68% in the poorest households and only 34% in the wealthiesthouseholds. Over half of respondents (56%) recall having to borrow money to buy medicines,andthere were dramatic differences between socio economic levels, with 70% of the pooresthouseholds having this opinion, compared to just 28% of the wealthiest households. Less than a
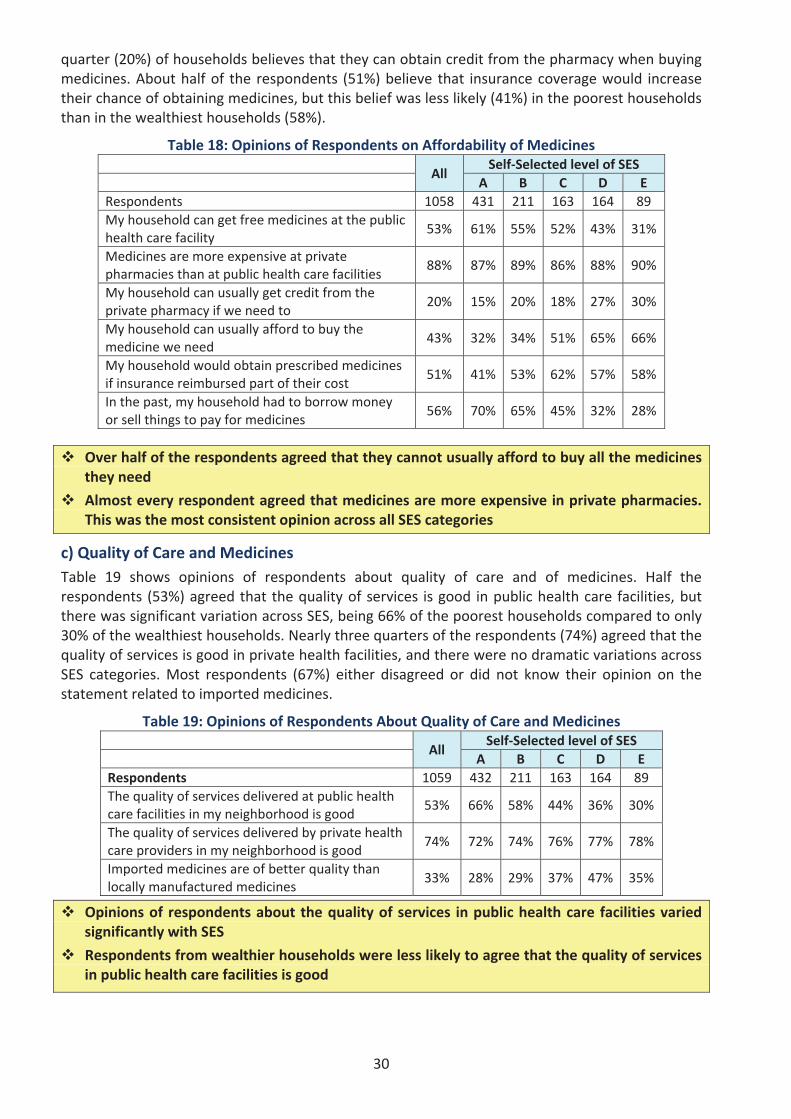
30
quarter (20%) of households believes that they can obtain credit from the pharmacy when buyingmedicines. About half of the respondents (51%) believe that insurance coverage would increasetheir chance of obtaining medicines, but this belief was less likely (41%) in the poorest householdsthan in the wealthiest households (58%).
Table 18: Opinions of Respondents on Affordability of Medicines
AllSelf Selected level of SES
A B C D ERespondents 1058 431 211 163 164 89My household can get free medicines at the publichealth care facility
53% 61% 55% 52% 43% 31%
Medicines are more expensive at privatepharmacies than at public health care facilities
88% 87% 89% 86% 88% 90%
My household can usually get credit from theprivate pharmacy if we need to
20% 15% 20% 18% 27% 30%
My household can usually afford to buy themedicine we need
43% 32% 34% 51% 65% 66%
My household would obtain prescribed medicinesif insurance reimbursed part of their cost
51% 41% 53% 62% 57% 58%
In the past, my household had to borrow moneyor sell things to pay for medicines
56% 70% 65% 45% 32% 28%
Over half of the respondents agreed that they cannot usually afford to buy all the medicinesthey need
Almost every respondent agreed that medicines are more expensive in private pharmacies.This was the most consistent opinion across all SES categories
c) Quality of Care and MedicinesTable 19 shows opinions of respondents about quality of care and of medicines. Half therespondents (53%) agreed that the quality of services is good in public health care facilities, butthere was significant variation across SES, being 66% of the poorest households compared to only30% of the wealthiest households. Nearly three quarters of the respondents (74%) agreed that thequality of services is good in private health facilities, and there were no dramatic variations acrossSES categories. Most respondents (67%) either disagreed or did not know their opinion on thestatement related to imported medicines.
Table 19: Opinions of Respondents About Quality of Care and Medicines
AllSelf Selected level of SES
A B C D ERespondents 1059 432 211 163 164 89The quality of services delivered at public healthcare facilities in my neighborhood is good
53% 66% 58% 44% 36% 30%
The quality of services delivered by private healthcare providers in my neighborhood is good
74% 72% 74% 76% 77% 78%
Imported medicines are of better quality thanlocally manufactured medicines
33% 28% 29% 37% 47% 35%
Opinions of respondents about the quality of services in public health care facilities variedsignificantly with SES
Respondents from wealthier households were less likely to agree that the quality of servicesin public health care facilities is good
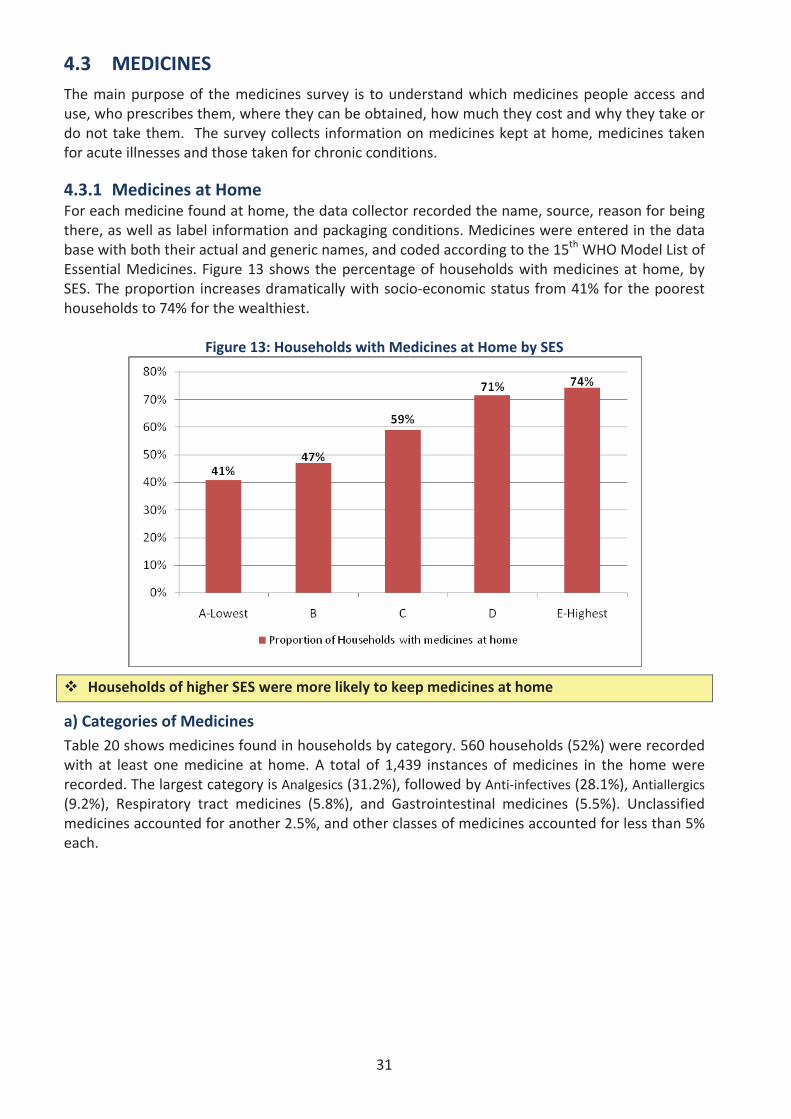
31
4.3 MEDICINESThe main purpose of the medicines survey is to understand which medicines people access anduse, who prescribes them, where they can be obtained, how much they cost and why they take ordo not take them. The survey collects information on medicines kept at home, medicines takenfor acute illnesses and those taken for chronic conditions.
4.3.1 Medicines at HomeFor each medicine found at home, the data collector recorded the name, source, reason for beingthere, as well as label information and packaging conditions. Medicines were entered in the database with both their actual and generic names, and coded according to the 15th WHO Model List ofEssential Medicines. Figure 13 shows the percentage of households with medicines at home, bySES. The proportion increases dramatically with socio economic status from 41% for the pooresthouseholds to 74% for the wealthiest.
Figure 13: Households with Medicines at Home by SES
Households of higher SES were more likely to keep medicines at home
a) Categories of MedicinesTable 20 shows medicines found in households by category. 560 households (52%) were recordedwith at least one medicine at home. A total of 1,439 instances of medicines in the home wererecorded. The largest category is Analgesics (31.2%), followed by Anti infectives (28.1%), Antiallergics(9.2%), Respiratory tract medicines (5.8%), and Gastrointestinal medicines (5.5%). Unclassifiedmedicines accounted for another 2.5%, and other classes of medicines accounted for less than 5%each.
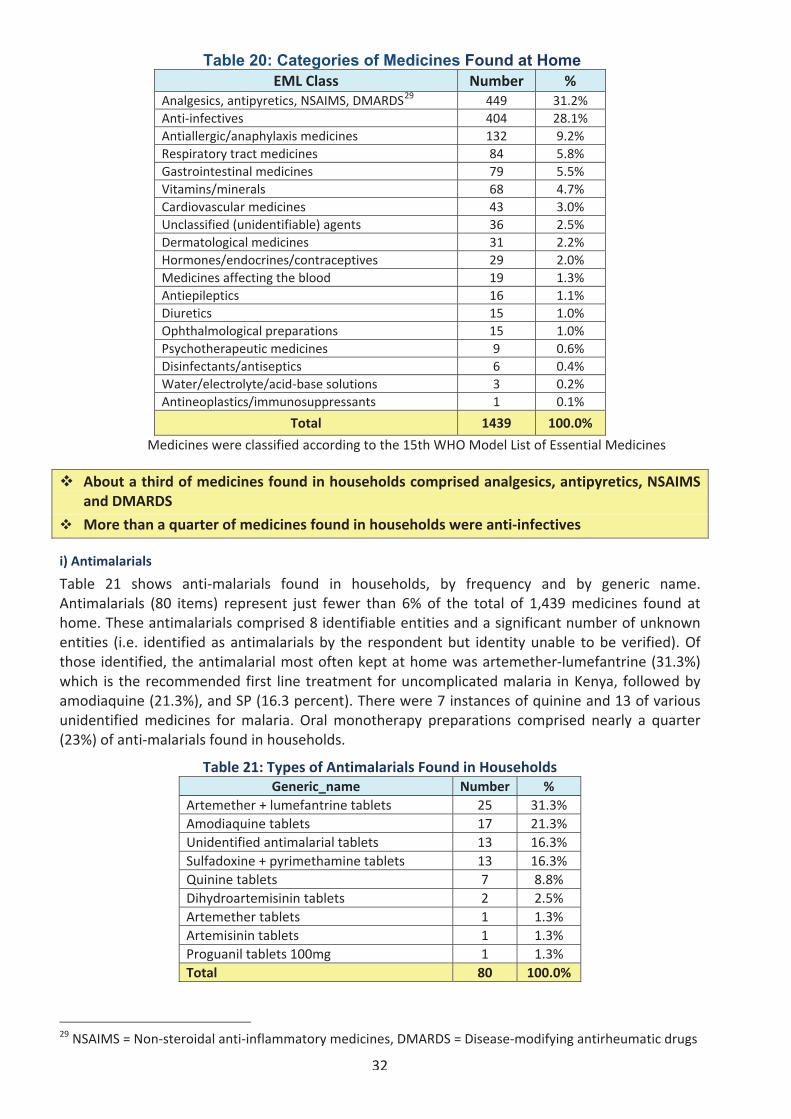
32
Table 20: Categories of Medicines Found at HomeEML Class Number %
Analgesics, antipyretics, NSAIMS, DMARDS29 449 31.2%Anti infectives 404 28.1%Antiallergic/anaphylaxis medicines 132 9.2%Respiratory tract medicines 84 5.8%Gastrointestinal medicines 79 5.5%Vitamins/minerals 68 4.7%Cardiovascular medicines 43 3.0%Unclassified (unidentifiable) agents 36 2.5%Dermatological medicines 31 2.2%Hormones/endocrines/contraceptives 29 2.0%Medicines affecting the blood 19 1.3%Antiepileptics 16 1.1%Diuretics 15 1.0%Ophthalmological preparations 15 1.0%Psychotherapeutic medicines 9 0.6%Disinfectants/antiseptics 6 0.4%Water/electrolyte/acid base solutions 3 0.2%Antineoplastics/immunosuppressants 1 0.1%
Total 1439 100.0%
Medicines were classified according to the 15th WHO Model List of Essential Medicines
About a third of medicines found in households comprised analgesics, antipyretics, NSAIMSand DMARDS
More than a quarter of medicines found in households were anti infectives
i) Antimalarials
Table 21 shows anti malarials found in households, by frequency and by generic name.Antimalarials (80 items) represent just fewer than 6% of the total of 1,439 medicines found athome. These antimalarials comprised 8 identifiable entities and a significant number of unknownentities (i.e. identified as antimalarials by the respondent but identity unable to be verified). Ofthose identified, the antimalarial most often kept at home was artemether lumefantrine (31.3%)which is the recommended first line treatment for uncomplicated malaria in Kenya, followed byamodiaquine (21.3%), and SP (16.3 percent). There were 7 instances of quinine and 13 of variousunidentified medicines for malaria. Oral monotherapy preparations comprised nearly a quarter(23%) of anti malarials found in households.
Table 21: Types of Antimalarials Found in HouseholdsGeneric_name Number %
Artemether + lumefantrine tablets 25 31.3%Amodiaquine tablets 17 21.3%Unidentified antimalarial tablets 13 16.3%Sulfadoxine + pyrimethamine tablets 13 16.3%Quinine tablets 7 8.8%Dihydroartemisinin tablets 2 2.5%Artemether tablets 1 1.3%Artemisinin tablets 1 1.3%Proguanil tablets 100mg 1 1.3%Total 80 100.0%
29 NSAIMS = Non steroidal anti inflammatory medicines, DMARDS = Disease modifying antirheumatic drugs
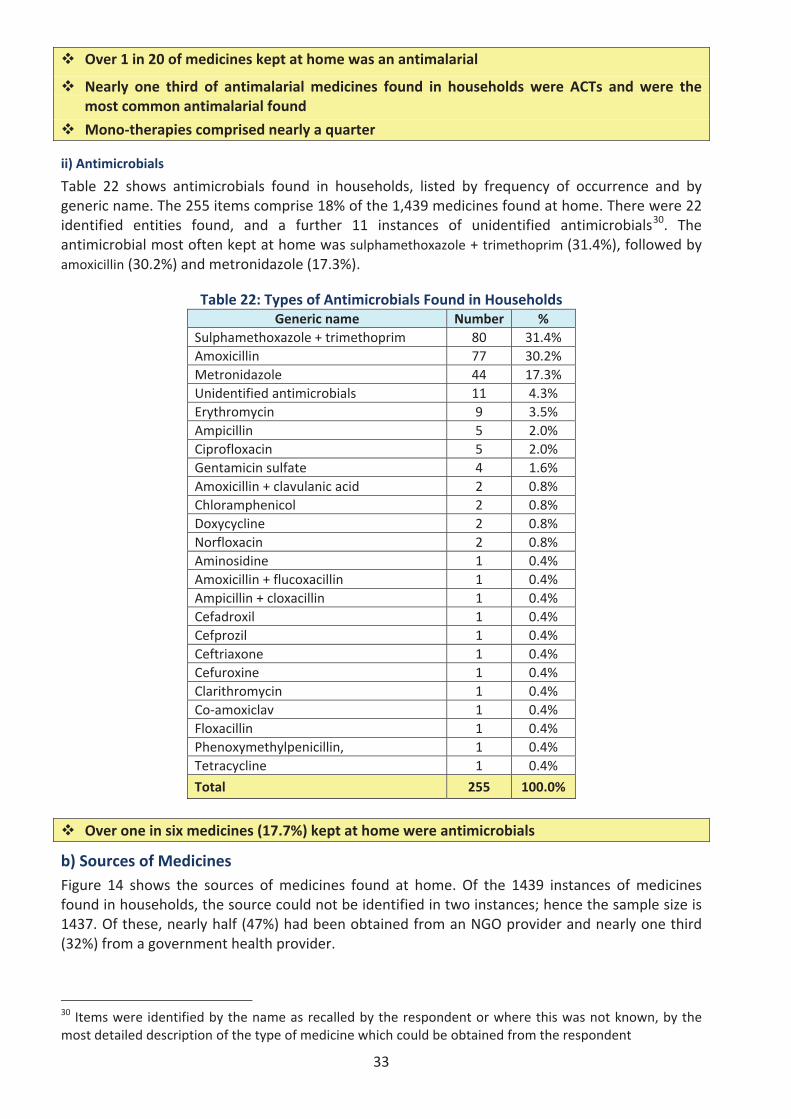
33
Over 1 in 20 of medicines kept at home was an antimalarial
Nearly one third of antimalarial medicines found in households were ACTs and were themost common antimalarial found
Mono therapies comprised nearly a quarter
ii) Antimicrobials
Table 22 shows antimicrobials found in households, listed by frequency of occurrence and bygeneric name. The 255 items comprise 18% of the 1,439 medicines found at home. There were 22identified entities found, and a further 11 instances of unidentified antimicrobials30. Theantimicrobial most often kept at home was sulphamethoxazole + trimethoprim (31.4%), followed byamoxicillin (30.2%) and metronidazole (17.3%).
Table 22: Types of Antimicrobials Found in HouseholdsGeneric name Number %
Sulphamethoxazole + trimethoprim 80 31.4%Amoxicillin 77 30.2%Metronidazole 44 17.3%Unidentified antimicrobials 11 4.3%Erythromycin 9 3.5%Ampicillin 5 2.0%Ciprofloxacin 5 2.0%Gentamicin sulfate 4 1.6%Amoxicillin + clavulanic acid 2 0.8%Chloramphenicol 2 0.8%Doxycycline 2 0.8%Norfloxacin 2 0.8%Aminosidine 1 0.4%Amoxicillin + flucoxacillin 1 0.4%Ampicillin + cloxacillin 1 0.4%Cefadroxil 1 0.4%Cefprozil 1 0.4%Ceftriaxone 1 0.4%Cefuroxine 1 0.4%Clarithromycin 1 0.4%Co amoxiclav 1 0.4%Floxacillin 1 0.4%Phenoxymethylpenicillin, 1 0.4%Tetracycline 1 0.4%
Total 255 100.0%
Over one in six medicines (17.7%) kept at home were antimicrobials
b) Sources of MedicinesFigure 14 shows the sources of medicines found at home. Of the 1439 instances of medicinesfound in households, the source could not be identified in two instances; hence the sample size is1437. Of these, nearly half (47%) had been obtained from an NGO provider and nearly one third(32%) from a government health provider.
30 Items were identified by the name as recalled by the respondent or where this was not known, by themost detailed description of the type of medicine which could be obtained from the respondent
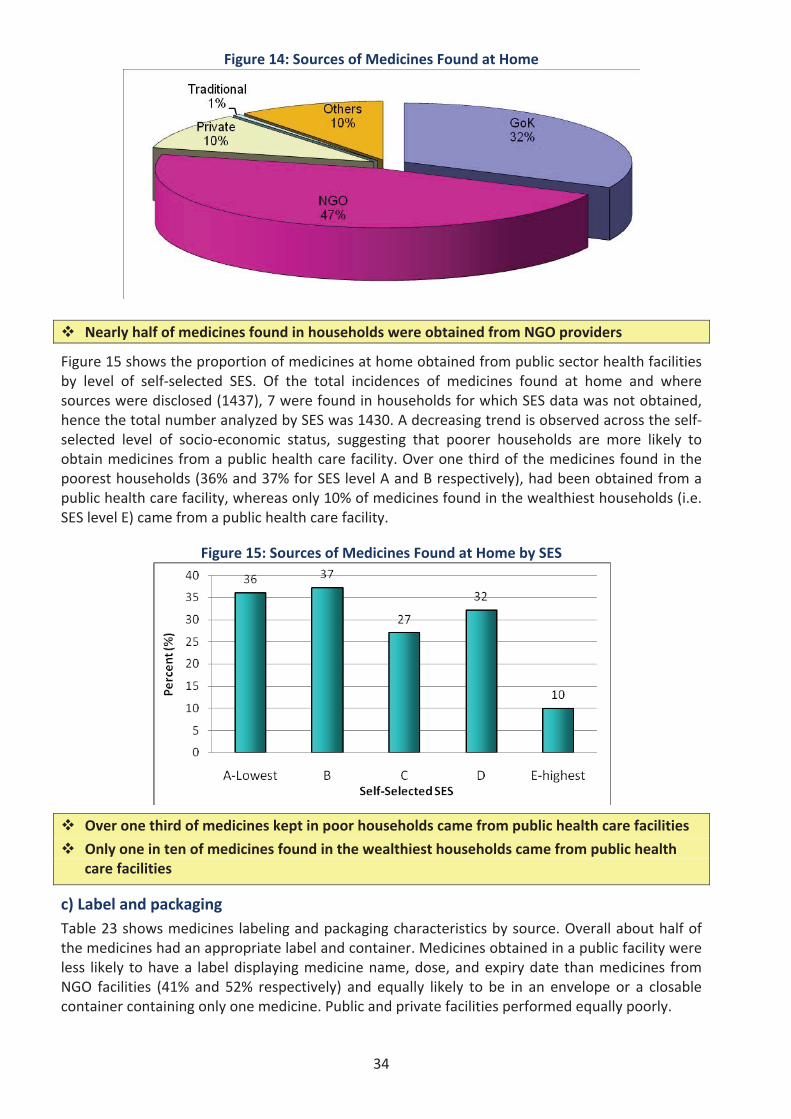
34
Figure 14: Sources of Medicines Found at Home
Nearly half of medicines found in households were obtained from NGO providers
Figure 15 shows the proportion of medicines at home obtained from public sector health facilitiesby level of self selected SES. Of the total incidences of medicines found at home and wheresources were disclosed (1437), 7 were found in households for which SES data was not obtained,hence the total number analyzed by SES was 1430. A decreasing trend is observed across the selfselected level of socio economic status, suggesting that poorer households are more likely toobtain medicines from a public health care facility. Over one third of the medicines found in thepoorest households (36% and 37% for SES level A and B respectively), had been obtained from apublic health care facility, whereas only 10% of medicines found in the wealthiest households (i.e.SES level E) came from a public health care facility.
Figure 15: Sources of Medicines Found at Home by SES
Over one third of medicines kept in poor households came from public health care facilities
Only one in ten of medicines found in the wealthiest households came from public healthcare facilities
c) Label and packagingTable 23 shows medicines labeling and packaging characteristics by source. Overall about half ofthe medicines had an appropriate label and container. Medicines obtained in a public facility wereless likely to have a label displaying medicine name, dose, and expiry date than medicines fromNGO facilities (41% and 52% respectively) and equally likely to be in an envelope or a closablecontainer containing only one medicine. Public and private facilities performed equally poorly.
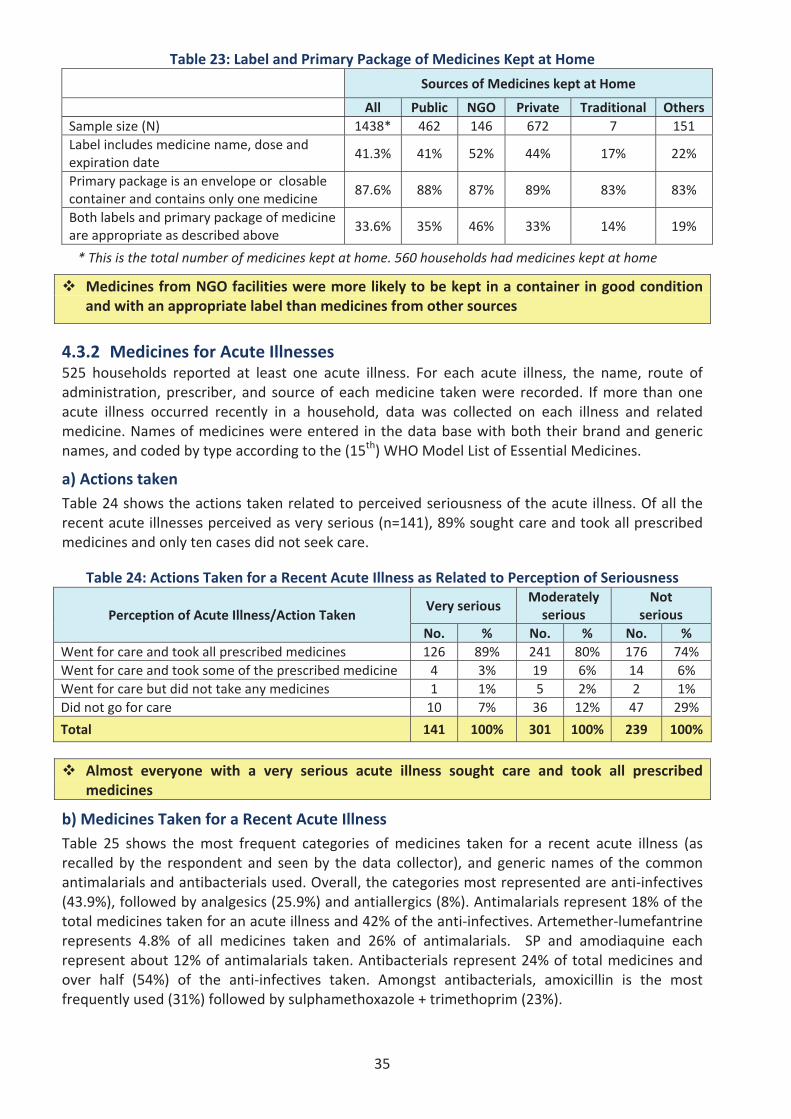
35
Table 23: Label and Primary Package of Medicines Kept at Home
Sources of Medicines kept at Home
All Public NGO Private Traditional OthersSample size (N) 1438* 462 146 672 7 151Label includes medicine name, dose andexpiration date
41.3% 41% 52% 44% 17% 22%
Primary package is an envelope or closablecontainer and contains only one medicine
87.6% 88% 87% 89% 83% 83%
Both labels and primary package of medicineare appropriate as described above
33.6% 35% 46% 33% 14% 19%
* This is the total number of medicines kept at home. 560 households had medicines kept at home
Medicines from NGO facilities were more likely to be kept in a container in good conditionand with an appropriate label than medicines from other sources
4.3.2 Medicines for Acute Illnesses525 households reported at least one acute illness. For each acute illness, the name, route ofadministration, prescriber, and source of each medicine taken were recorded. If more than oneacute illness occurred recently in a household, data was collected on each illness and relatedmedicine. Names of medicines were entered in the data base with both their brand and genericnames, and coded by type according to the (15th) WHOModel List of Essential Medicines.
a) Actions takenTable 24 shows the actions taken related to perceived seriousness of the acute illness. Of all therecent acute illnesses perceived as very serious (n=141), 89% sought care and took all prescribedmedicines and only ten cases did not seek care.
Table 24: Actions Taken for a Recent Acute Illness as Related to Perception of Seriousness
Perception of Acute Illness/Action TakenVery serious
Moderatelyserious
Notserious
No. % No. % No. %Went for care and took all prescribed medicines 126 89% 241 80% 176 74%Went for care and took some of the prescribed medicine 4 3% 19 6% 14 6%Went for care but did not take any medicines 1 1% 5 2% 2 1%Did not go for care 10 7% 36 12% 47 29%
Total 141 100% 301 100% 239 100%
Almost everyone with a very serious acute illness sought care and took all prescribedmedicines
b) Medicines Taken for a Recent Acute IllnessTable 25 shows the most frequent categories of medicines taken for a recent acute illness (asrecalled by the respondent and seen by the data collector), and generic names of the commonantimalarials and antibacterials used. Overall, the categories most represented are anti infectives(43.9%), followed by analgesics (25.9%) and antiallergics (8%). Antimalarials represent 18% of thetotal medicines taken for an acute illness and 42% of the anti infectives. Artemether lumefantrinerepresents 4.8% of all medicines taken and 26% of antimalarials. SP and amodiaquine eachrepresent about 12% of antimalarials taken. Antibacterials represent 24% of total medicines andover half (54%) of the anti infectives taken. Amongst antibacterials, amoxicillin is the mostfrequently used (31%) followed by sulphamethoxazole + trimethoprim (23%).
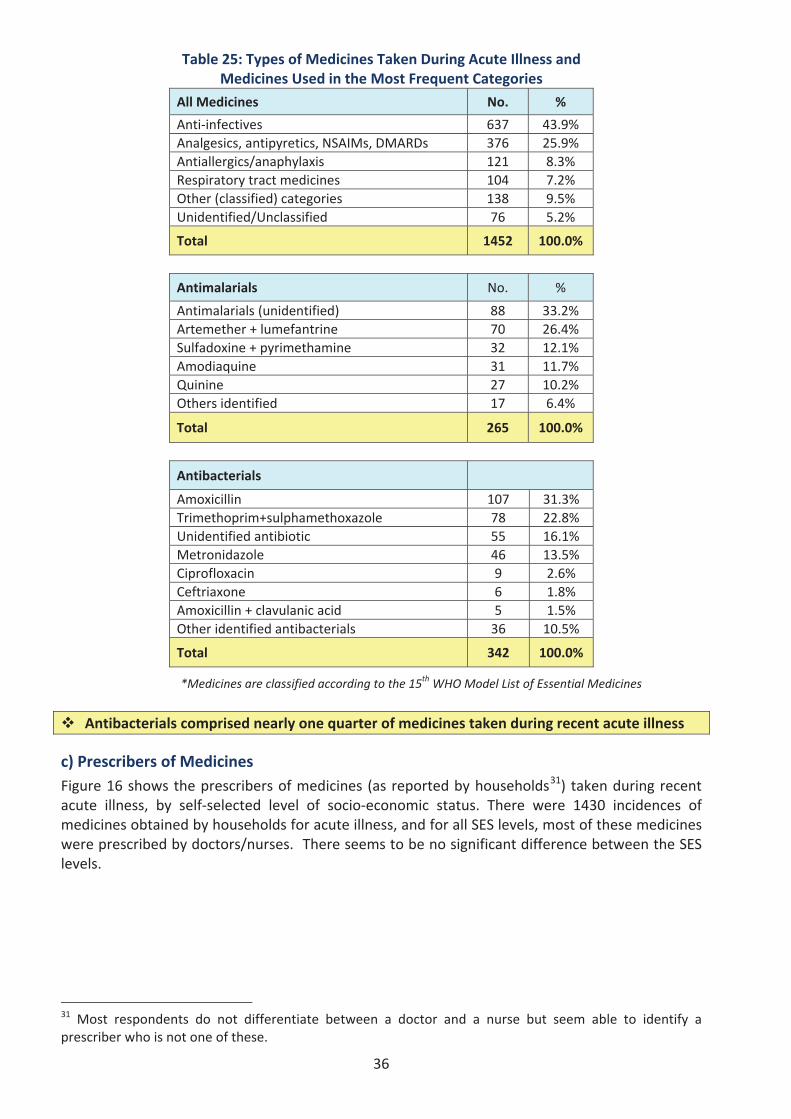
36
Table 25: Types of Medicines Taken During Acute Illness andMedicines Used in the Most Frequent Categories
All Medicines No. %
Anti infectives 637 43.9%Analgesics, antipyretics, NSAIMs, DMARDs 376 25.9%Antiallergics/anaphylaxis 121 8.3%Respiratory tract medicines 104 7.2%Other (classified) categories 138 9.5%Unidentified/Unclassified 76 5.2%
Total 1452 100.0%
Antimalarials No. %
Antimalarials (unidentified) 88 33.2%Artemether + lumefantrine 70 26.4%Sulfadoxine + pyrimethamine 32 12.1%Amodiaquine 31 11.7%Quinine 27 10.2%Others identified 17 6.4%
Total 265 100.0%
Antibacterials
Amoxicillin 107 31.3%Trimethoprim+sulphamethoxazole 78 22.8%Unidentified antibiotic 55 16.1%Metronidazole 46 13.5%Ciprofloxacin 9 2.6%Ceftriaxone 6 1.8%Amoxicillin + clavulanic acid 5 1.5%Other identified antibacterials 36 10.5%
Total 342 100.0%
*Medicines are classified according to the 15th WHO Model List of Essential Medicines
Antibacterials comprised nearly one quarter of medicines taken during recent acute illness
c) Prescribers of MedicinesFigure 16 shows the prescribers of medicines (as reported by households31) taken during recentacute illness, by self selected level of socio economic status. There were 1430 incidences ofmedicines obtained by households for acute illness, and for all SES levels, most of these medicineswere prescribed by doctors/nurses. There seems to be no significant difference between the SESlevels.
31 Most respondents do not differentiate between a doctor and a nurse but seem able to identify aprescriber who is not one of these.
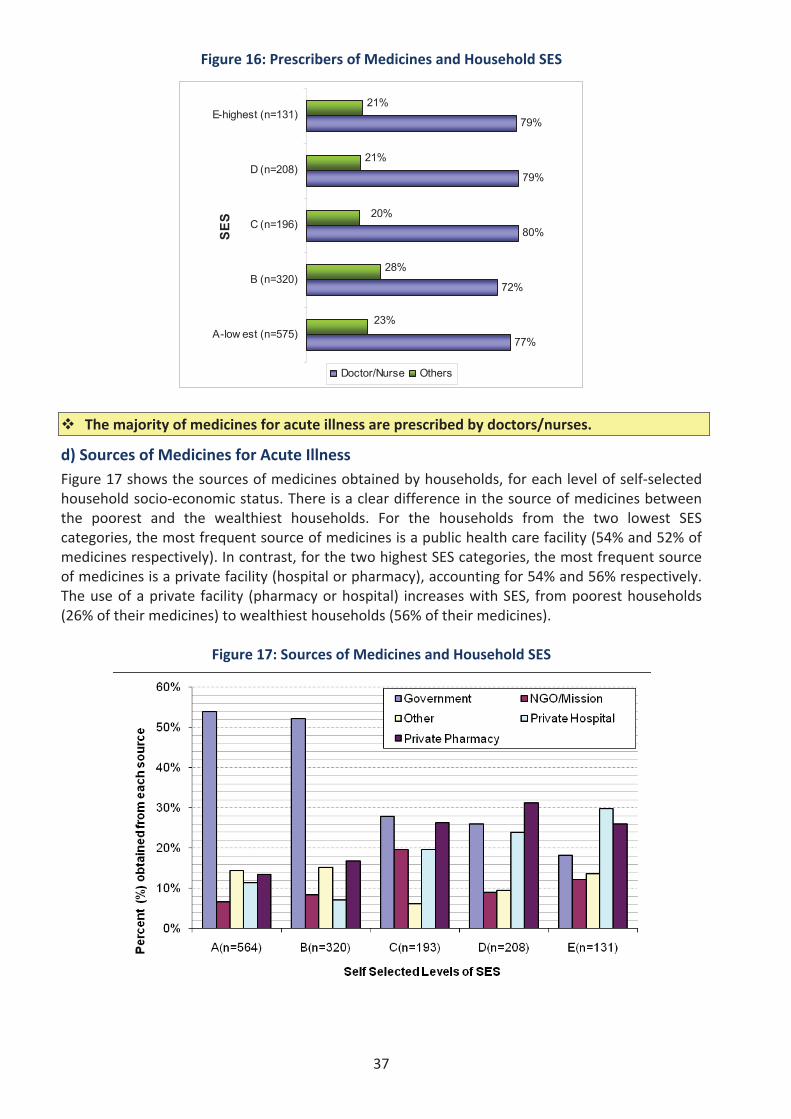
37
Figure 16: Prescribers of Medicines and Household SES
77%
72%
80%
79%
79%
23%
21%
21%
20%
28%
A-low est (n=575)
B (n=320)
C (n=196)
D (n=208)
E-highest (n=131)
SES
Doctor/Nurse Others
The majority of medicines for acute illness are prescribed by doctors/nurses.
d) Sources of Medicines for Acute IllnessFigure 17 shows the sources of medicines obtained by households, for each level of self selectedhousehold socio economic status. There is a clear difference in the source of medicines betweenthe poorest and the wealthiest households. For the households from the two lowest SEScategories, the most frequent source of medicines is a public health care facility (54% and 52% ofmedicines respectively). In contrast, for the two highest SES categories, the most frequent sourceof medicines is a private facility (hospital or pharmacy), accounting for 54% and 56% respectively.The use of a private facility (pharmacy or hospital) increases with SES, from poorest households(26% of their medicines) to wealthiest households (56% of their medicines).
Figure 17: Sources of Medicines and Household SES
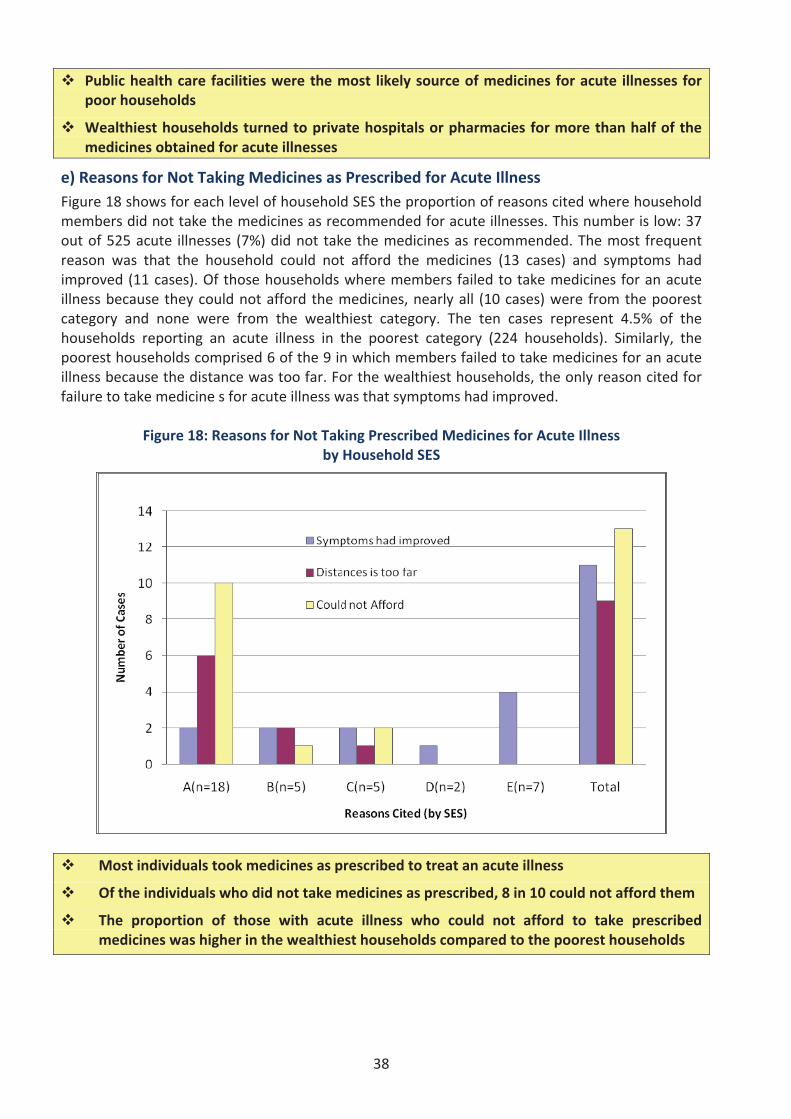
38
Public health care facilities were the most likely source of medicines for acute illnesses forpoor households
Wealthiest households turned to private hospitals or pharmacies for more than half of themedicines obtained for acute illnesses
e) Reasons for Not Taking Medicines as Prescribed for Acute IllnessFigure 18 shows for each level of household SES the proportion of reasons cited where householdmembers did not take the medicines as recommended for acute illnesses. This number is low: 37out of 525 acute illnesses (7%) did not take the medicines as recommended. The most frequentreason was that the household could not afford the medicines (13 cases) and symptoms hadimproved (11 cases). Of those households where members failed to take medicines for an acuteillness because they could not afford the medicines, nearly all (10 cases) were from the poorestcategory and none were from the wealthiest category. The ten cases represent 4.5% of thehouseholds reporting an acute illness in the poorest category (224 households). Similarly, thepoorest households comprised 6 of the 9 in which members failed to take medicines for an acuteillness because the distance was too far. For the wealthiest households, the only reason cited forfailure to take medicine s for acute illness was that symptoms had improved.
Figure 18: Reasons for Not Taking Prescribed Medicines for Acute Illnessby Household SES
Most individuals took medicines as prescribed to treat an acute illness
Of the individuals who did not take medicines as prescribed, 8 in 10 could not afford them
The proportion of those with acute illness who could not afford to take prescribedmedicines was higher in the wealthiest households compared to the poorest households
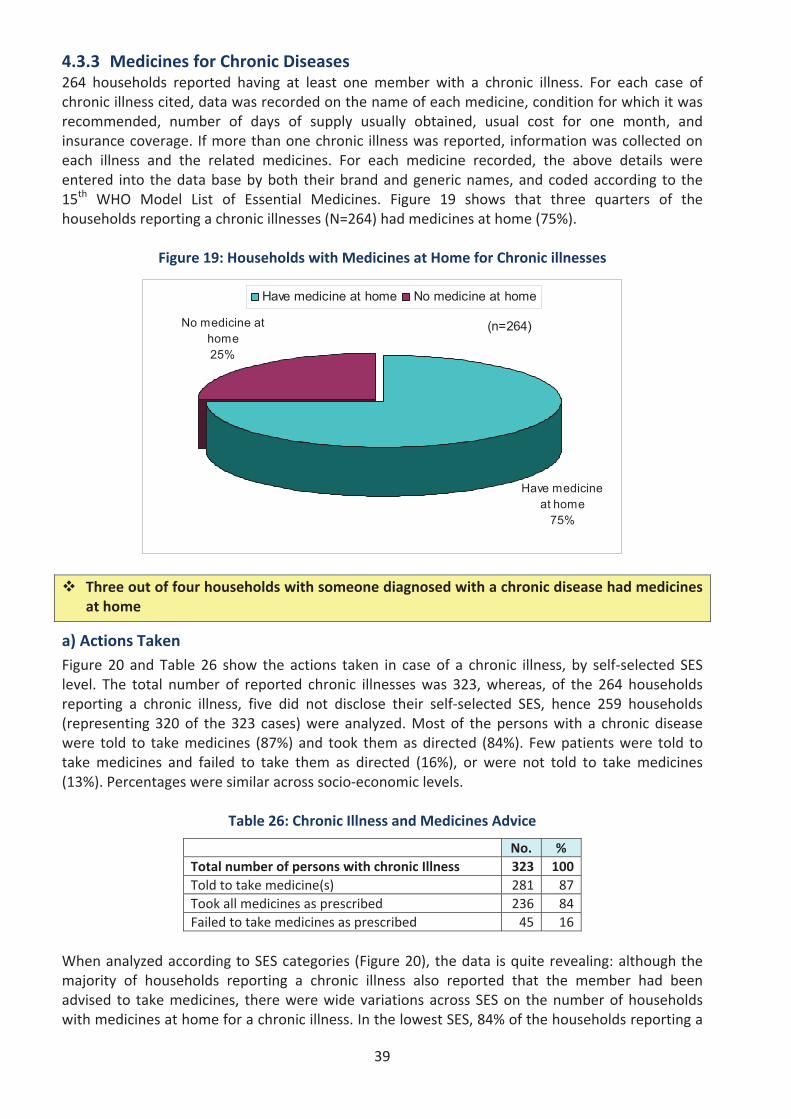
39
4.3.3 Medicines for Chronic Diseases264 households reported having at least one member with a chronic illness. For each case ofchronic illness cited, data was recorded on the name of each medicine, condition for which it wasrecommended, number of days of supply usually obtained, usual cost for one month, andinsurance coverage. If more than one chronic illness was reported, information was collected oneach illness and the related medicines. For each medicine recorded, the above details wereentered into the data base by both their brand and generic names, and coded according to the15th WHO Model List of Essential Medicines. Figure 19 shows that three quarters of thehouseholds reporting a chronic illnesses (N=264) had medicines at home (75%).
Figure 19: Households with Medicines at Home for Chronic illnesses
(n=264)No medicine at home25%
Have medicine at home
75%
Have medicine at home No medicine at home
Three out of four households with someone diagnosed with a chronic disease had medicinesat home
a) Actions TakenFigure 20 and Table 26 show the actions taken in case of a chronic illness, by self selected SESlevel. The total number of reported chronic illnesses was 323, whereas, of the 264 householdsreporting a chronic illness, five did not disclose their self selected SES, hence 259 households(representing 320 of the 323 cases) were analyzed. Most of the persons with a chronic diseasewere told to take medicines (87%) and took them as directed (84%). Few patients were told totake medicines and failed to take them as directed (16%), or were not told to take medicines(13%). Percentages were similar across socio economic levels.
Table 26: Chronic Illness and Medicines Advice
No. %Total number of persons with chronic Illness 323 100Told to take medicine(s) 281 87Took all medicines as prescribed 236 84Failed to take medicines as prescribed 45 16
When analyzed according to SES categories (Figure 20), the data is quite revealing: although themajority of households reporting a chronic illness also reported that the member had beenadvised to take medicines, there were wide variations across SES on the number of householdswith medicines at home for a chronic illness. In the lowest SES, 84% of the households reporting a
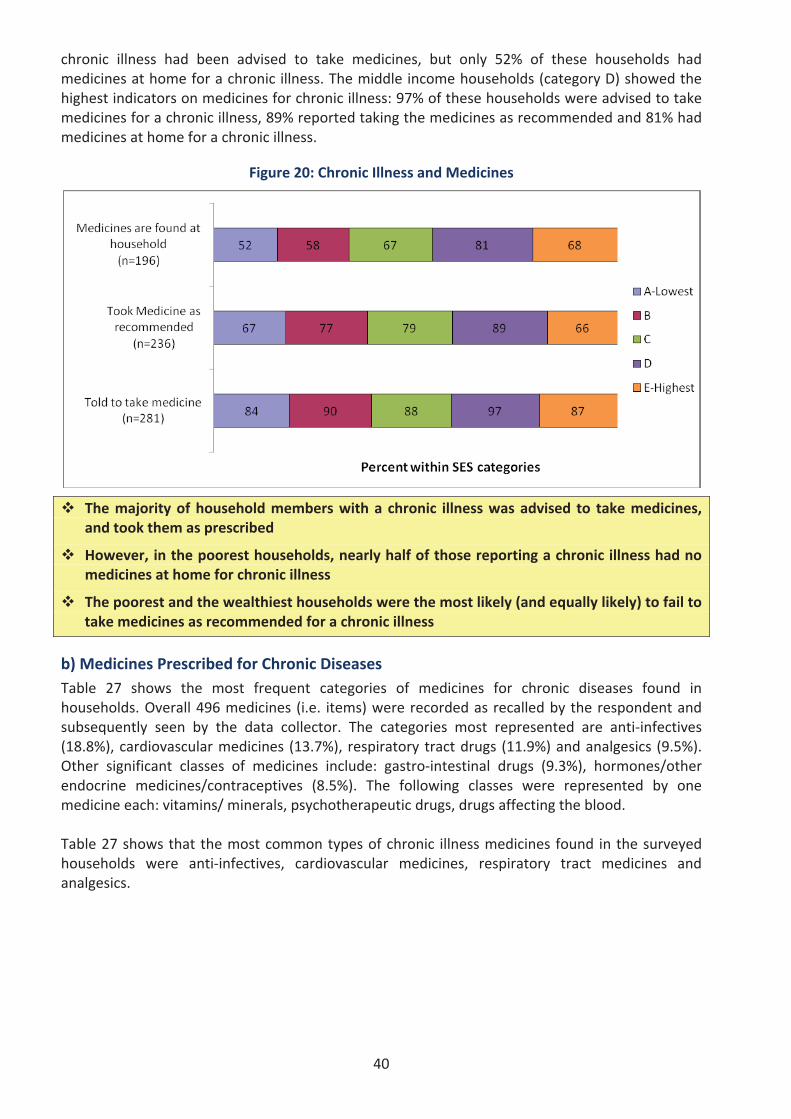
40
chronic illness had been advised to take medicines, but only 52% of these households hadmedicines at home for a chronic illness. The middle income households (category D) showed thehighest indicators on medicines for chronic illness: 97% of these households were advised to takemedicines for a chronic illness, 89% reported taking the medicines as recommended and 81% hadmedicines at home for a chronic illness.
Figure 20: Chronic Illness and Medicines
The majority of household members with a chronic illness was advised to take medicines,and took them as prescribed
However, in the poorest households, nearly half of those reporting a chronic illness had nomedicines at home for chronic illness
The poorest and the wealthiest households were the most likely (and equally likely) to fail totake medicines as recommended for a chronic illness
b) Medicines Prescribed for Chronic DiseasesTable 27 shows the most frequent categories of medicines for chronic diseases found inhouseholds. Overall 496 medicines (i.e. items) were recorded as recalled by the respondent andsubsequently seen by the data collector. The categories most represented are anti infectives(18.8%), cardiovascular medicines (13.7%), respiratory tract drugs (11.9%) and analgesics (9.5%).Other significant classes of medicines include: gastro intestinal drugs (9.3%), hormones/otherendocrine medicines/contraceptives (8.5%). The following classes were represented by onemedicine each: vitamins/ minerals, psychotherapeutic drugs, drugs affecting the blood.
Table 27 shows that the most common types of chronic illness medicines found in the surveyedhouseholds were anti infectives, cardiovascular medicines, respiratory tract medicines andanalgesics.
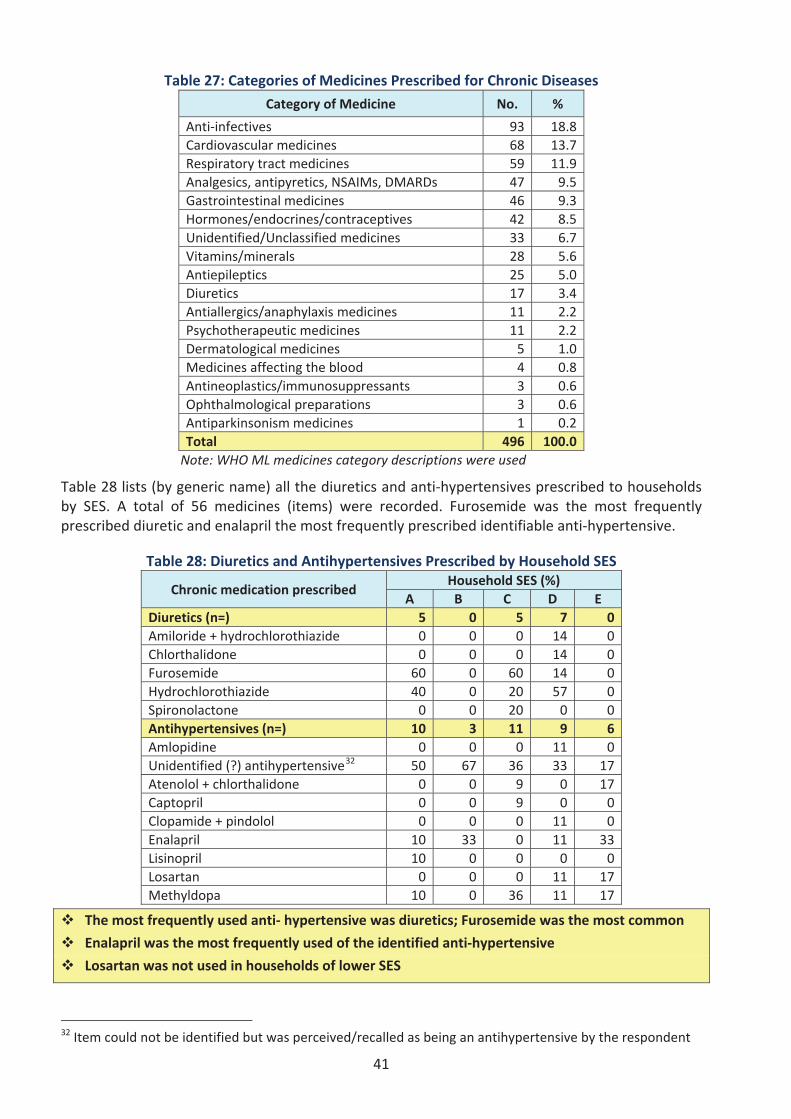
41
Table 27: Categories of Medicines Prescribed for Chronic Diseases
Category of Medicine No. %
Anti infectives 93 18.8Cardiovascular medicines 68 13.7Respiratory tract medicines 59 11.9Analgesics, antipyretics, NSAIMs, DMARDs 47 9.5Gastrointestinal medicines 46 9.3Hormones/endocrines/contraceptives 42 8.5Unidentified/Unclassified medicines 33 6.7Vitamins/minerals 28 5.6Antiepileptics 25 5.0Diuretics 17 3.4Antiallergics/anaphylaxis medicines 11 2.2Psychotherapeutic medicines 11 2.2Dermatological medicines 5 1.0Medicines affecting the blood 4 0.8Antineoplastics/immunosuppressants 3 0.6Ophthalmological preparations 3 0.6Antiparkinsonism medicines 1 0.2Total 496 100.0Note: WHO ML medicines category descriptions were used
Table 28 lists (by generic name) all the diuretics and anti hypertensives prescribed to householdsby SES. A total of 56 medicines (items) were recorded. Furosemide was the most frequentlyprescribed diuretic and enalapril the most frequently prescribed identifiable anti hypertensive.
Table 28: Diuretics and Antihypertensives Prescribed by Household SES
Chronic medication prescribedHousehold SES (%)
A B C D EDiuretics (n=) 5 0 5 7 0Amiloride + hydrochlorothiazide 0 0 0 14 0Chlorthalidone 0 0 0 14 0Furosemide 60 0 60 14 0Hydrochlorothiazide 40 0 20 57 0Spironolactone 0 0 20 0 0Antihypertensives (n=) 10 3 11 9 6Amlopidine 0 0 0 11 0Unidentified (?) antihypertensive32 50 67 36 33 17Atenolol + chlorthalidone 0 0 9 0 17Captopril 0 0 9 0 0Clopamide + pindolol 0 0 0 11 0Enalapril 10 33 0 11 33Lisinopril 10 0 0 0 0Losartan 0 0 0 11 17Methyldopa 10 0 36 11 17
The most frequently used anti hypertensive was diuretics; Furosemide was the most common
Enalapril was the most frequently used of the identified anti hypertensive
Losartan was not used in households of lower SES
32 Item could not be identified but was perceived/recalled as being an antihypertensive by the respondent
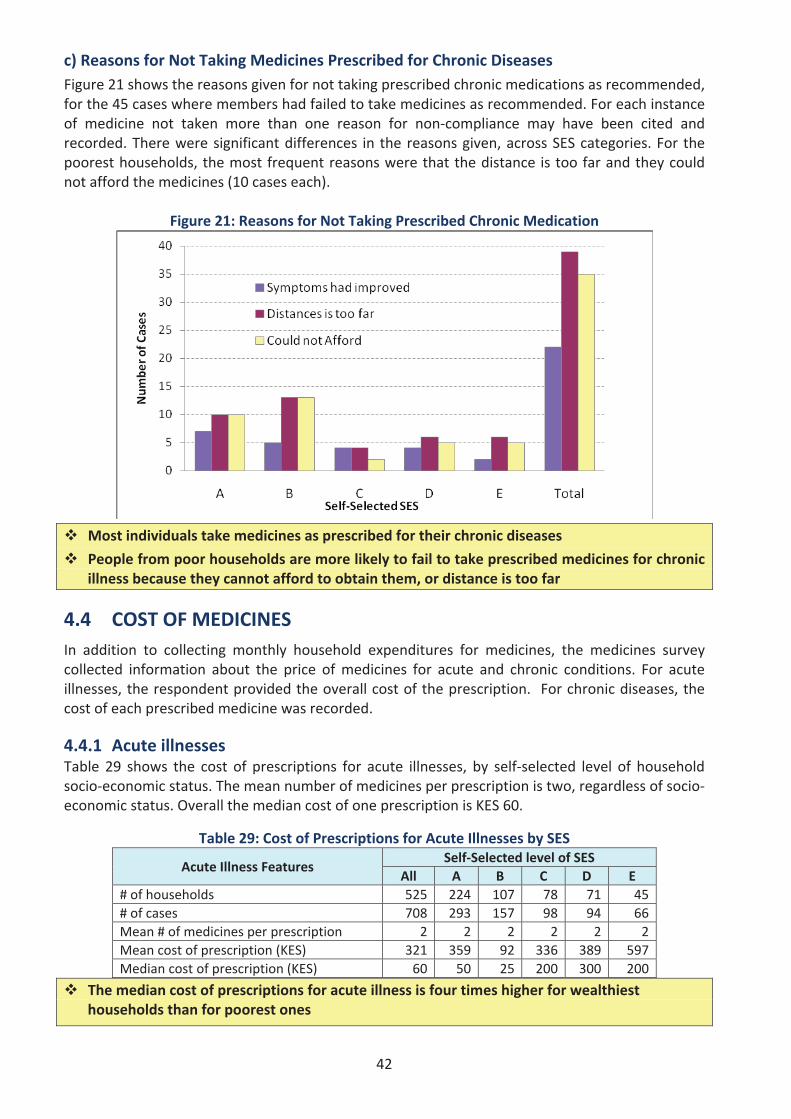
42
c) Reasons for Not Taking Medicines Prescribed for Chronic DiseasesFigure 21 shows the reasons given for not taking prescribed chronic medications as recommended,for the 45 cases where members had failed to take medicines as recommended. For each instanceof medicine not taken more than one reason for non compliance may have been cited andrecorded. There were significant differences in the reasons given, across SES categories. For thepoorest households, the most frequent reasons were that the distance is too far and they couldnot afford the medicines (10 cases each).
Figure 21: Reasons for Not Taking Prescribed Chronic Medication
Most individuals take medicines as prescribed for their chronic diseases
People from poor households are more likely to fail to take prescribed medicines for chronicillness because they cannot afford to obtain them, or distance is too far
4.4 COST OF MEDICINESIn addition to collecting monthly household expenditures for medicines, the medicines surveycollected information about the price of medicines for acute and chronic conditions. For acuteillnesses, the respondent provided the overall cost of the prescription. For chronic diseases, thecost of each prescribed medicine was recorded.
4.4.1 Acute illnessesTable 29 shows the cost of prescriptions for acute illnesses, by self selected level of householdsocio economic status. The mean number of medicines per prescription is two, regardless of socioeconomic status. Overall the median cost of one prescription is KES 60.
Table 29: Cost of Prescriptions for Acute Illnesses by SES
Acute Illness FeaturesSelf Selected level of SES
All A B C D E# of households 525 224 107 78 71 45# of cases 708 293 157 98 94 66Mean # of medicines per prescription 2 2 2 2 2 2Mean cost of prescription (KES) 321 359 92 336 389 597Median cost of prescription (KES) 60 50 25 200 300 200
The median cost of prescriptions for acute illness is four times higher for wealthiesthouseholds than for poorest ones
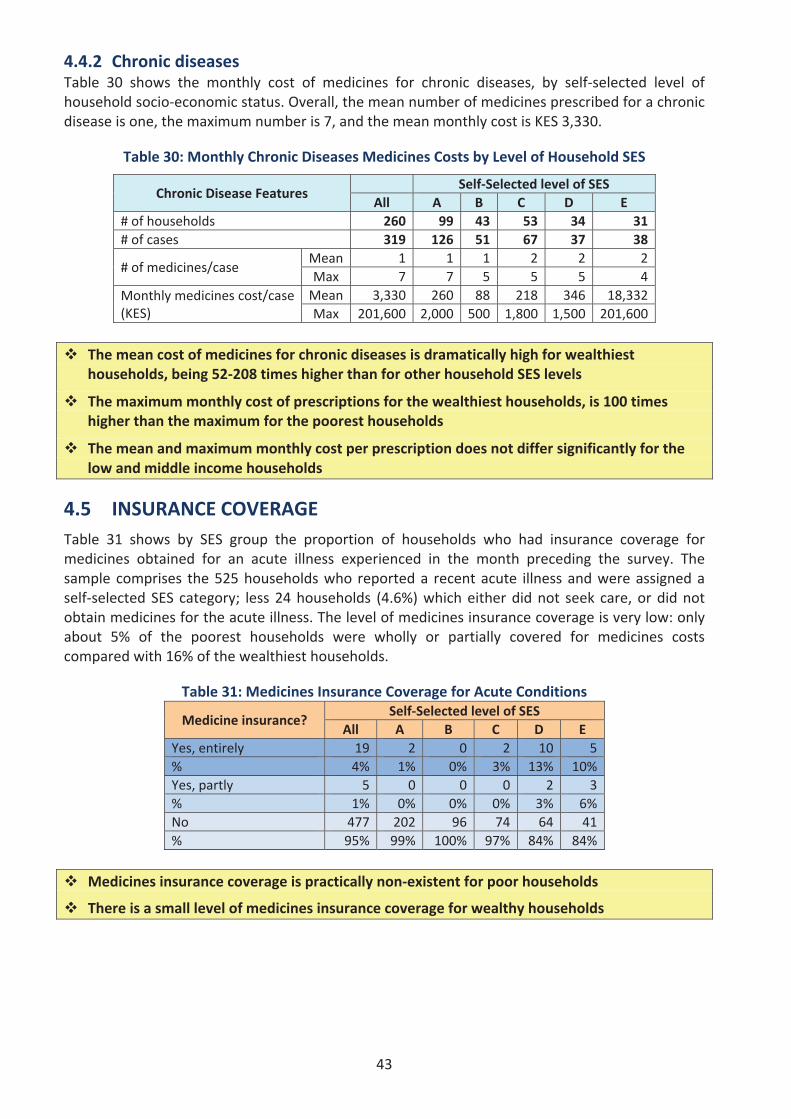
43
4.4.2 Chronic diseasesTable 30 shows the monthly cost of medicines for chronic diseases, by self selected level ofhousehold socio economic status. Overall, the mean number of medicines prescribed for a chronicdisease is one, the maximum number is 7, and the mean monthly cost is KES 3,330.
Table 30: Monthly Chronic Diseases Medicines Costs by Level of Household SES
Chronic Disease FeaturesSelf Selected level of SES
All A B C D E# of households 260 99 43 53 34 31# of cases 319 126 51 67 37 38
# of medicines/caseMean 1 1 1 2 2 2Max 7 7 5 5 5 4
Monthly medicines cost/case(KES)
Mean 3,330 260 88 218 346 18,332Max 201,600 2,000 500 1,800 1,500 201,600
The mean cost of medicines for chronic diseases is dramatically high for wealthiesthouseholds, being 52 208 times higher than for other household SES levels
The maximummonthly cost of prescriptions for the wealthiest households, is 100 timeshigher than the maximum for the poorest households
The mean and maximum monthly cost per prescription does not differ significantly for thelow and middle income households
4.5 INSURANCE COVERAGETable 31 shows by SES group the proportion of households who had insurance coverage formedicines obtained for an acute illness experienced in the month preceding the survey. Thesample comprises the 525 households who reported a recent acute illness and were assigned aself selected SES category; less 24 households (4.6%) which either did not seek care, or did notobtain medicines for the acute illness. The level of medicines insurance coverage is very low: onlyabout 5% of the poorest households were wholly or partially covered for medicines costscompared with 16% of the wealthiest households.
Table 31: Medicines Insurance Coverage for Acute Conditions
Medicine insurance?Self Selected level of SES
All A B C D EYes, entirely 19 2 0 2 10 5% 4% 1% 0% 3% 13% 10%Yes, partly 5 0 0 0 2 3% 1% 0% 0% 0% 3% 6%No 477 202 96 74 64 41% 95% 99% 100% 97% 84% 84%
Medicines insurance coverage is practically non existent for poor households
There is a small level of medicines insurance coverage for wealthy households
44
5. KEY FINDINGS AND DISCUSSION
Geographic Accessibility
a) The majority of households can access a health centre or dispensary within one hour. Overall,about 10% of households had to travel more that one hour to reach the closest public healthfacility.
b) Public facilities close to respondents’ households were largely perceived as being easilyaccessible, but not meeting households’ needs for medicines.
i. The majority of respondents (70%) were satisfied with the location of the public healthfacility closest to them, and this finding was consistent across SES levels.
ii. However, households were largely dissatisfied with the level of medicines availability inthese public facilities. Overall, just under one third (32%) of households perceived thepublic facility as having the medicines they needed, and this rate decreaseddramatically across SES levels, from 41% in the poorest households to 20% in thewealthiest households.
c) Poor households spend more time travelling to a public hospital. A higher proportion ofpoorest households (67%) had to travel more than one hour to reach the nearest publichospital, compared to 47% of the wealthiest households. Considering that hospitals offer amore comprehensive range of health services, this finding points to a significant burden for thepoor, who may fail to seek healthcare because of distance to a hospital.
d) Of the households reporting a morbidity (either a recent acute illness, or where a householdmember had a chronic illness), patients from the poorer households were more likely to fail totake their prescribed medicine because the distance was too far to health facility.
e) The most frequent source of medicines found in homes was NGO facilities (47% of medicines)followed by government facilities (32%). However, the source of medicines varied byhousehold SES. Of the poorest households with medicines at home, 36% were obtained frompublic facilities, compared to 10% for the wealthiest households.
Affordability
a) Medicines are a significant part of monthly household expenditure. For the pooresthouseholds, medicines comprised 95% of the median household health expenditure,compared to 50% of the wealthiest households.
b) Catastrophic expenditure related to medicines affected 2.8% of the poorest households,compared to none of the wealthiest households.
c) Of the households reporting a chronic illness, individuals from the poorest households weremore likely to fail to take prescribed medicines because they could not afford them.
d) Poorest households perceived themselves as least likely to afford to buy the medicines theyneed. Over two thirds (67%) of the poorest households perceived that they cannot usuallyafford medicines, compared to 34% of the wealthiest households.
e) Medicines insurance coverage was very low (5%) across all households, and virtually nonexistent in the poorest households. Only 1% of the poorest households had insurance cover formedicines for a recent acute illness, compared to 16% of the wealthiest households.
45
Morbidity, Medicines Access and Rational Usea) About half of the households had at least one member who had experienced a recent
acute illness. This proportion did not vary significantly across SES levels, suggesting thatacute illnesses are a recurring challenge in the population, with a similar burden acrosssocio economic status.
iii. Acute illnesses were more common in women. The most common reported symptomof an acute condition was fever, followed by cough, pain and diarrhoea. Around 20% ofacute illnesses were regarded as very serious but cough generally was perceived asbeing not very serious.
iv. In children the most common acute illnesses were ear/nose/throat conditions followedby fever/headache, aches and pains and gastro intestinal problems. Over half of allacute illnesses were in children under 15 years.
v. Almost all household members (89%) with a recent serious acute illness sought careand took all medicines as prescribed.
vi. Antibacterials comprised 43.9% of all medicines taken during a recent acute illness.These were followed by analgesics/antipyretics/non steroidal anti inflammatorymedicines (NSAIMs)/disease modifying anti rheumatic drugs (DMARDs) (28.1%).
b) The burden of chronic illnesses was reported to be slightly higher in the wealthiest households(38%), compared to the poorest households (23%); and higher in women (except diabetes andtuberculosis).
c) The proportion of medicines kept at home increased dramatically by household socioeconomic status, from 41% in the poorest households to 74% in the wealthiest households.
d) Nearly half (47%) of the medicines found in households had been obtained from an NGOfacility, and 32% from a public health facility.
i. Public facilities were the most common source of medicines in poorer households. Justover half (54%) of the medicines found in households of the two poorest wealthcategories had been obtained from public facilities (54% for SES category A and 52.2%for category B); but this proportion fell dramatically to 26% and 24% respectively in themiddle income households (SES level C and D respectively) and further to 18.3% in thewealthiest households.
ii. Over half (55.8%) of the medicines found in the wealthiest households had beenobtained from a private sector source – either a pharmacy (26%) or a hospital (29.8%).In comparison, the poorest households had obtained a combined 25% of medicines athome from private sources.
iii. Middle income households reported the highest proportion (19.7%) of medicinesobtained from NGO/mission facilities, compared to 12.2% of the wealthiest householdsand 6.7% of the poorest households.
e) The most common medicines found in households were analgesics/antipyretics and antiinfectives (including antimalarials).
f) Of households reporting a chronic illness, a higher proportion (45%) of the poorest householdsdid not have amedicine for chronic illness at home; compared to 32% of the wealthiest.
g) Label/Packaging of medicines kept at home was generally inadequate, whether obtained frompublic or private facilities and only slightly better in those from NGO sources. This may be areflection of poor quality pharmaceutical services across all sectors, as proper labelling andpackaging are fundamental requirements for the correct dispensing of medicines.
46
6. CONCLUSIONS
1. The poorest households appear to carry the highest health burden and greatest barrier toaccessing the medicines they need:
They have the least household resources in terms of income and assets to afford to dealwith health issues – including obtaining the medicines they require.They suffer the highest incidence of acute illnesses and high incidences of chronic diseases.They are most dependent on public health facilities where out patient treatment (includingmedicines) is provided largely for free, and are thus obliged to spend longer timestravelling to seek access to such free health services.Virtually all their household health expenditure is spent on medicines. As such, they areprone to catastrophic expenditures on medicines, and are most likely to fail to takeprescribed medicines because they cannot afford them.
2. Within most households women and children have the highest health burden. They generallysuffer from a higher incidence of both acute and chronic diseases with their related economicand domestic consequences. Amongst children, the under 5’s have the highest health burdenand therefore represent a particularly vulnerable group.
3. Public health facilities in particular were reported by households to have serious problemswith erratic and unreliable medicines availability, with frequent and sometimes prolongedshortages of essential medicines.
4. Medicines insurance coverage is minimal and thus there is inadequate protection forhouseholds against the sometimes prohibitive costs of medicines as a key component ofhealthcare. Therefore, in obtaining the medicines they need, patients may incur catastrophicexpenditures or simply forego treatment due to non affordability.
47
7. RECOMMENDATIONS
Arising from the findings and conclusions of the survey and within the context of the stated aimsand objectives of the Kenya Health Policy Framework (KHPF) and the Kenya NationalPharmaceutical Policy (KNPP) the following are the key recommendations aimed at enhancingaccess to Essential Medicines by households:
1. Institutionalise and integrate the regular Household Medicines Access Surveys into the healthsector M&E framework, to provide the perspective of households/consumers on access tomedicines. This would thereby guide sector players in the design of interventions andinvestments to improve access to medicines.
2. Enhance pharmaceutical services at the lower KEPH levels, through the elaboration andimplementation of appropriate norms and standards. This would also entail the deployment ofappropriate pharmaceutical skills at levels 1, 2 and 3, which are more utilized by the majorityof poor households.
3. Enhance support to and collaboration with non public healthcare services which are a majorsource of medicines to households. Within this, ensure compliance with established norms andstandards, in order to promote appropriate medicines use.
4. Expand medicines insurance coverage to reduce financial barriers to access. Initiatives andschemes aimed at expanding the outpatient medicines insurance benefit should target poorerhouseholds, women and children who bear the greatest burden to medicines access. Theyshould also have built in mechanisms to promote the appropriate use of medicines byhouseholds.
5. Improve and sustain high availability of Essential Medicines at health facilities, particularly atthe lower levels of KEPH where households access primary care.
6. Enhance the participation of households and communities in developing initiatives to improvemedicines use and access at the local level.
49
ANNEXES
48
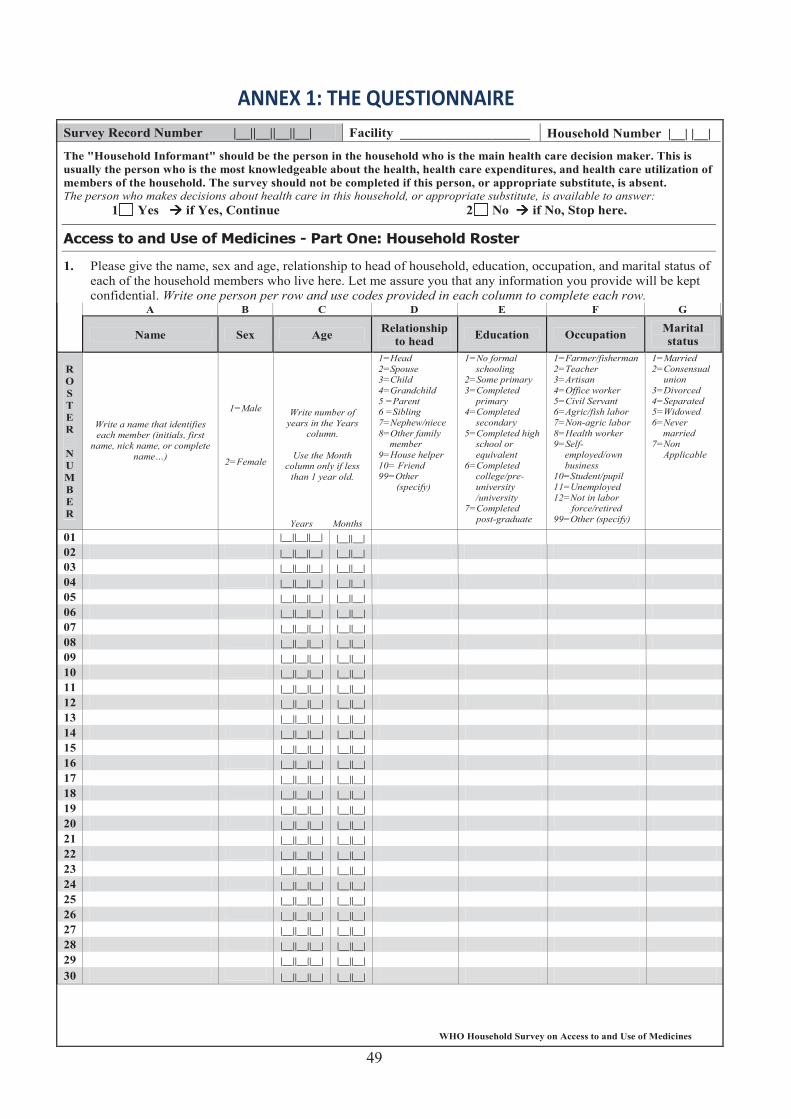
50
ANNEX 1: THE QUESTIONNAIRE
WHO Household Survey on Access to and Use of Medicines
Survey Record Number |__||__||__||__| Facility ___________________ Household Number |__| |__|
The "Household Informant" should be the person in the household who is the main health care decision maker. This is usually the person who is the most knowledgeable about the health, health care expenditures, and health care utilization of members of the household. The survey should not be completed if this person, or appropriate substitute, is absent. The person who makes decisions about health care in this household, or appropriate substitute, is available to answer:
1 Yes if Yes, Continue 2 No if No, Stop here.
1. Please give the name, sex and age, relationship to head of household, education, occupation, and marital status of each of the household members who live here. Let me assure you that any information you provide will be kept confidential. Write one person per row and use codes provided in each column to complete each row.
A B C D E F G
Name Sex Age Relationship to head Education Occupation Marital
status
R O S TER
N U M B ER
Write a name that identifies each member (initials, first
name, nick name, or complete name…)
1=Male
2=Female
Write number of years in the Years
column.
Use the Month column only if less
than 1 year old.
Years Months
1=Head 2=Spouse 3=Child 4=Grandchild 5 =Parent 6 =Sibling 7=Nephew/niece 8=Other family
member 9=House helper 10= Friend 99=Other
(specify)
1=No formal schooling
2=Some primary 3=Completed
primary 4=Completed
secondary 5=Completed high
school or equivalent
6=Completed college/pre-university /university
7=Completed post-graduate
1=Farmer/fisherman 2=Teacher 3=Artisan 4=Office worker 5=Civil Servant 6=Agric/fish labor 7=Non-agric labor 8=Health worker 9=Self-
employed/own business
10=Student/pupil 11=Unemployed 12=Not in labor
force/retired 99=Other (specify)
1=Married 2=Consensual
union 3=Divorced 4=Separated 5=Widowed 6=Never
married 7=Non
Applicable
01 |__||__||__| |__||__| 02 |__||__||__| |__||__|03 |__||__||__| |__||__| 04 |__||__||__| |__||__|05 |__||__||__| |__||__| 06 |__||__||__| |__||__|07 |__||__||__| |__||__| 08 |__||__||__| |__||__|09 |__||__||__| |__||__| 10 |__||__||__| |__||__|11 |__||__||__| |__||__| 12 |__||__||__| |__||__|13 |__||__||__| |__||__| 14 |__||__||__| |__||__|15 |__||__||__| |__||__| 16 |__||__||__| |__||__|17 |__||__||__| |__||__| 18 |__||__||__| |__||__|19 |__||__||__| |__||__| 20 |__||__||__| |__||__|21 |__||__||__| |__||__| 22 |__||__||__| |__||__|23 |__||__||__| |__||__| 24 |__||__||__| |__||__|25 |__||__||__| |__||__| 26 |__||__||__| |__||__|27 |__||__||__| |__||__| 28 |__||__||__| |__||__|29 |__||__||__| |__||__| 30 |__||__||__| |__||__|
49
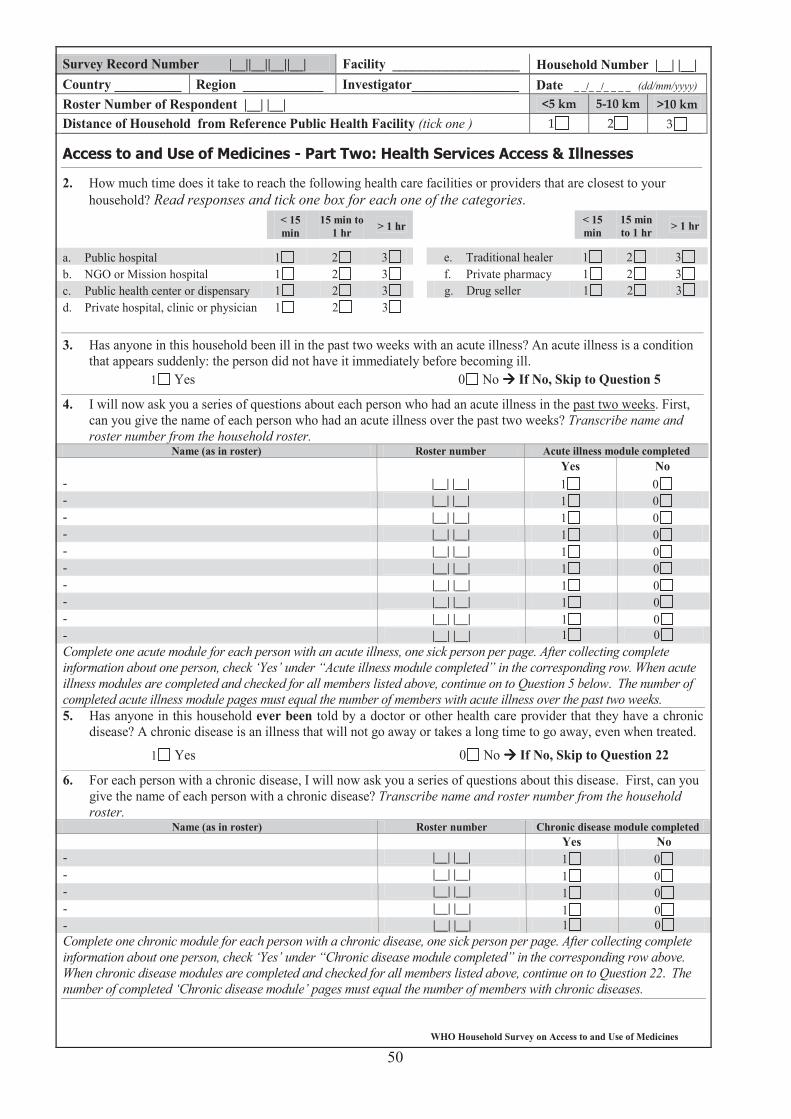
WHO Household Survey on Access to and Use of Medicines
Survey Record Number |__||__||__||__| Facility ___________________ Household Number |__| |__| Country __________ Region ____________ Investigator________________ Date _ _/_ _/_ _ _ _ (dd/mm/yyyy)
Roster Number of Respondent |__| |__| Distance of Household from Reference Public Health Facility (tick one )
2. How much time does it take to reach the following health care facilities or providers that are closest to your household? Read responses and tick one box for each one of the categories.
< 15 min
15 min to 1 hr > 1 hr < 15
min 15 min to 1 hr > 1 hr
a. Public hospital 1 2 3 e. Traditional healer 1 2 3b. NGO or Mission hospital 1 2 3 f. Private pharmacy 1 2 3c. Public health center or dispensary 1 2 3 g. Drug seller 1 2 3d. Private hospital, clinic or physician 1 2 3
3. Has anyone in this household been ill in the past two weeks with an acute illness? An acute illness is a condition that appears suddenly: the person did not have it immediately before becoming ill.
1 Yes 0 No If No, Skip to Question 5
4. I will now ask you a series of questions about each person who had an acute illness in the past two weeks. First, can you give the name of each person who had an acute illness over the past two weeks? Transcribe name and roster number from the household roster.
Name (as in roster) Roster number Acute illness module completed Yes No
- |__| |__| 1 0- |__| |__| 1 0- |__| |__| 1 0- |__| |__| 1 0- |__| |__| 1 0- |__| |__| 1 0- |__| |__| 1 0- |__| |__| 1 0- |__| |__| 1 0- |__| |__| 1 0Complete one acute module for each person with an acute illness, one sick person per page. After collecting complete information about one person, check ‘Yes’ under “Acute illness module completed” in the corresponding row. When acute illness modules are completed and checked for all members listed above, continue on to Question 5 below. The number of completed acute illness module pages must equal the number of members with acute illness over the past two weeks.5. Has anyone in this household ever been told by a doctor or other health care provider that they have a chronic
disease? A chronic disease is an illness that will not go away or takes a long time to go away, even when treated.
1 Yes 0 No If No, Skip to Question 22
6. For each person with a chronic disease, I will now ask you a series of questions about this disease. First, can you give the name of each person with a chronic disease? Transcribe name and roster number from the householdroster.
Name (as in roster) Roster number Chronic disease module completed Yes No
- |__| |__| 1 0- |__| |__| 1 0- |__| |__| 1 0- |__| |__| 1 0- |__| |__| 1 0Complete one chronic module for each person with a chronic disease, one sick person per page. After collecting complete information about one person, check ‘Yes’ under “Chronic disease module completed” in the corresponding row above. When chronic disease modules are completed and checked for all members listed above, continue on to Question 22. The number of completed ‘Chronic disease module’ pages must equal the number of members with chronic diseases.
50
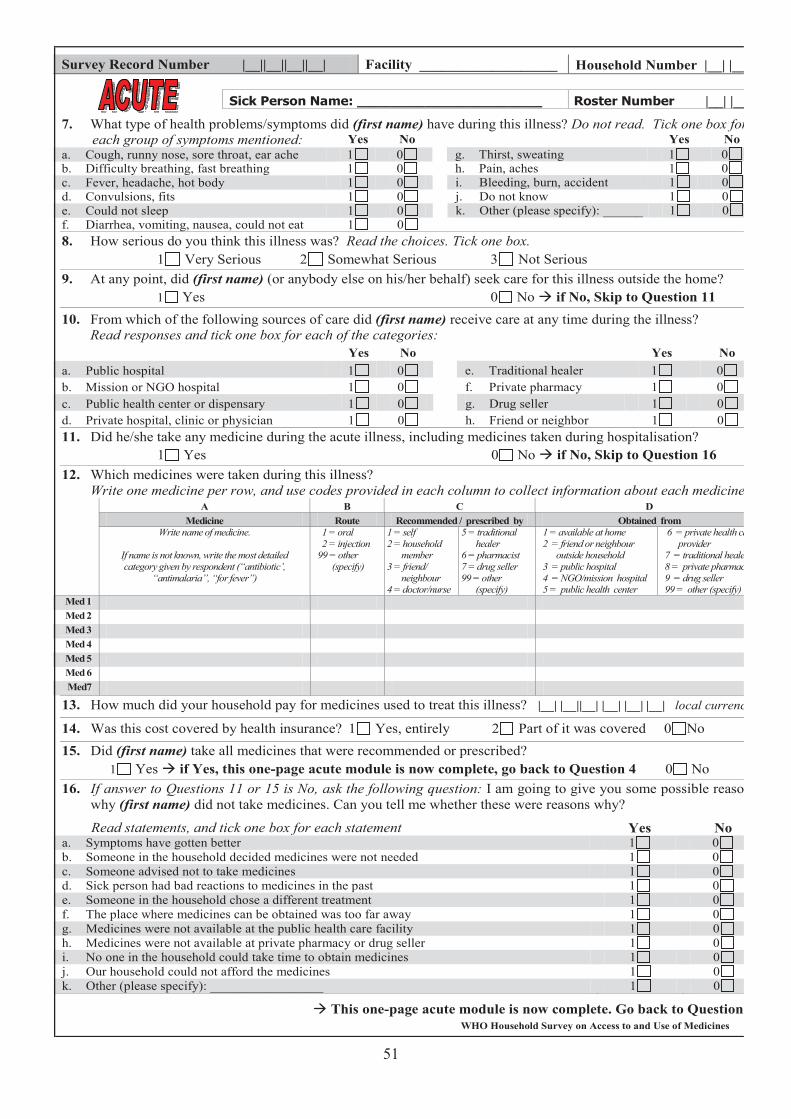
WHO Household Survey on Access to and Use of Medicines
Survey Record Number |__||__||__||__| Facility ___________________ Household Number |__| |__|
|__| |__|
7. What type of health problems/symptoms did (first name) have during this illness? Do not read. Tick one box for each group of symptoms mentioned: Yes No Yes No
a. Cough, runny nose, sore throat, ear ache 1 0 g. Thirst, sweating 1 0b. Difficulty breathing, fast breathing 1 0 h. Pain, aches 1 0c. Fever, headache, hot body 1 0 i. Bleeding, burn, accident 1 0d. Convulsions, fits 1 0 j. Do not know 1 0e. Could not sleep 1 0 k. Other (please specify): ______ 1 0f. Diarrhea, vomiting, nausea, could not eat 1 0 8. How serious do you think this illness was? Read the choices. Tick one box.
1 Very Serious 2 Somewhat Serious 3 Not Serious 9. At any point, did (first name) (or anybody else on his/her behalf) seek care for this illness outside the home?
1 Yes 0 No if No, Skip to Question 1110. From which of the following sources of care did (first name) receive care at any time during the illness?
Read responses and tick one box for each of the categories:Yes No Yes No
a. Public hospital 1 0 e. Traditional healer 1 0b. Mission or NGO hospital 1 0 f. Private pharmacy 1 0c. Public health center or dispensary 1 0 g. Drug seller 1 0d. Private hospital, clinic or physician 1 0 h. Friend or neighbor 1 011. Did he/she take any medicine during the acute illness, including medicines taken during hospitalisation?
1 Yes 0 No if No, Skip to Question 16 12. Which medicines were taken during this illness?
Write one medicine per row, and use codes provided in each column to collect information about each medicine. A B C D
Medicine Route Recommended / prescribed by Obtained from Write name of medicine.
If name is not known, write the most detailed category given by respondent (“antibiotic’,
“antimalaria”, “for fever”)
1 = oral 2 = injection 99 = other
(specify)
1 = self 2 = household
member 3 = friend/
neighbour 4 = doctor/nurse
5 = traditional healer
6 = pharmacist 7 = drug seller 99 = other
(specify)
1 = available at home 2 = friend or neighbour
outside household 3 = public hospital 4 = NGO/mission hospital 5 = public health center
6 = private health care provider
7 = traditional healer 8 = private pharmacy 9 = drug seller 99 = other (specify)
Med 1 Med 2 Med 3 Med 4 Med 5 Med 6 Med7
13. How much did your household pay for medicines used to treat this illness? |__| |__||__| |__| |__| |__| local currency
14. Was this cost covered by health insurance? 1 Yes, entirely 2 Part of it was covered 0 No 15. Did (first name) take all medicines that were recommended or prescribed?
1 Yes if Yes, this one-page acute module is now complete, go back to Question 4 0 No16. If answer to Questions 11 or 15 is No, ask the following question: I am going to give you some possible reasons
why (first name) did not take medicines. Can you tell me whether these were reasons why?
Read statements, and tick one box for each statement Yes No a. Symptoms have gotten better 1 0b. Someone in the household decided medicines were not needed 1 0c. Someone advised not to take medicines 1 0d. Sick person had bad reactions to medicines in the past 1 0e. Someone in the household chose a different treatment 1 0f. The place where medicines can be obtained was too far away 1 0g. Medicines were not available at the public health care facility 1 0h. Medicines were not available at private pharmacy or drug seller 1 0i. No one in the household could take time to obtain medicines 1 0j. Our household could not afford the medicines 1 0k. Other (please specify): _________________ 1 0
This one-page acute module is now complete. Go back to Question 4.
51

WHO Household Survey on Access to and Use of Medicines
Survey Record Number |__||__||__||__| Facility ___________________ Household Number |__| |__|
|__| |__|
7. What type of health problems/symptoms did (first name) have during this illness? Do not read. Tick one box for each group of symptoms mentioned: Yes No Yes No
a. Cough, runny nose, sore throat, ear ache 1 0 g. Thirst, sweating 1 0b. Difficulty breathing, fast breathing 1 0 h. Pain, aches 1 0c. Fever, headache, hot body 1 0 i. Bleeding, burn, accident 1 0d. Convulsions, fits 1 0 j. Do not know 1 0e. Could not sleep 1 0 k. Other (please specify): ______ 1 0f. Diarrhea, vomiting, nausea, could not eat 1 0 8. How serious do you think this illness was? Read the choices. Tick one box.
1 Very Serious 2 Somewhat Serious 3 Not Serious 9. At any point, did (first name) (or anybody else on his/her behalf) seek care for this illness outside the home?
1 Yes 0 No if No, Skip to Question 1110. From which of the following sources of care did (first name) receive care at any time during the illness?
Read responses and tick one box for each of the categories:Yes No Yes No
a. Public hospital 1 0 e. Traditional healer 1 0b. Mission or NGO hospital 1 0 f. Private pharmacy 1 0c. Public health center or dispensary 1 0 g. Drug seller 1 0d. Private hospital, clinic or physician 1 0 h. Friend or neighbor 1 011. Did he/she take any medicine during the acute illness, including medicines taken during hospitalisation?
1 Yes 0 No if No, Skip to Question 16 12. Which medicines were taken during this illness?
Write one medicine per row, and use codes provided in each column to collect information about each medicine. A B C D
Medicine Route Recommended / prescribed by Obtained from Write name of medicine.
If name is not known, write the most detailed category given by respondent (“antibiotic’,
“antimalaria”, “for fever”)
1 = oral 2 = injection 99 = other
(specify)
1 = self 2 = household
member 3 = friend/
neighbour 4 = doctor/nurse
5 = traditional healer
6 = pharmacist 7 = drug seller 99 = other
(specify)
1 = available at home 2 = friend or neighbour
outside household 3 = public hospital 4 = NGO/mission hospital 5 = public health center
6 = private health care provider
7 = traditional healer 8 = private pharmacy 9 = drug seller 99 = other (specify)
Med 1 Med 2 Med 3 Med 4 Med 5 Med 6 Med7
13. How much did your household pay for medicines used to treat this illness? |__| |__||__| |__| |__| |__| local currency
14. Was this cost covered by health insurance? 1 Yes, entirely 2 Part of it was covered 0 No 15. Did (first name) take all medicines that were recommended or prescribed?
1 Yes if Yes, this one-page acute module is now complete, go back to Question 4 0 No16. If answer to Questions 11 or 15 is No, ask the following question: I am going to give you some possible reasons
why (first name) did not take medicines. Can you tell me whether these were reasons why?
Read statements, and tick one box for each statement Yes No a. Symptoms have gotten better 1 0b. Someone in the household decided medicines were not needed 1 0c. Someone advised not to take medicines 1 0d. Sick person had bad reactions to medicines in the past 1 0e. Someone in the household chose a different treatment 1 0f. The place where medicines can be obtained was too far away 1 0g. Medicines were not available at the public health care facility 1 0h. Medicines were not available at private pharmacy or drug seller 1 0i. No one in the household could take time to obtain medicines 1 0j. Our household could not afford the medicines 1 0k. Other (please specify): _________________ 1 0
This one-page acute module is now complete. Go back to Question 4.
52
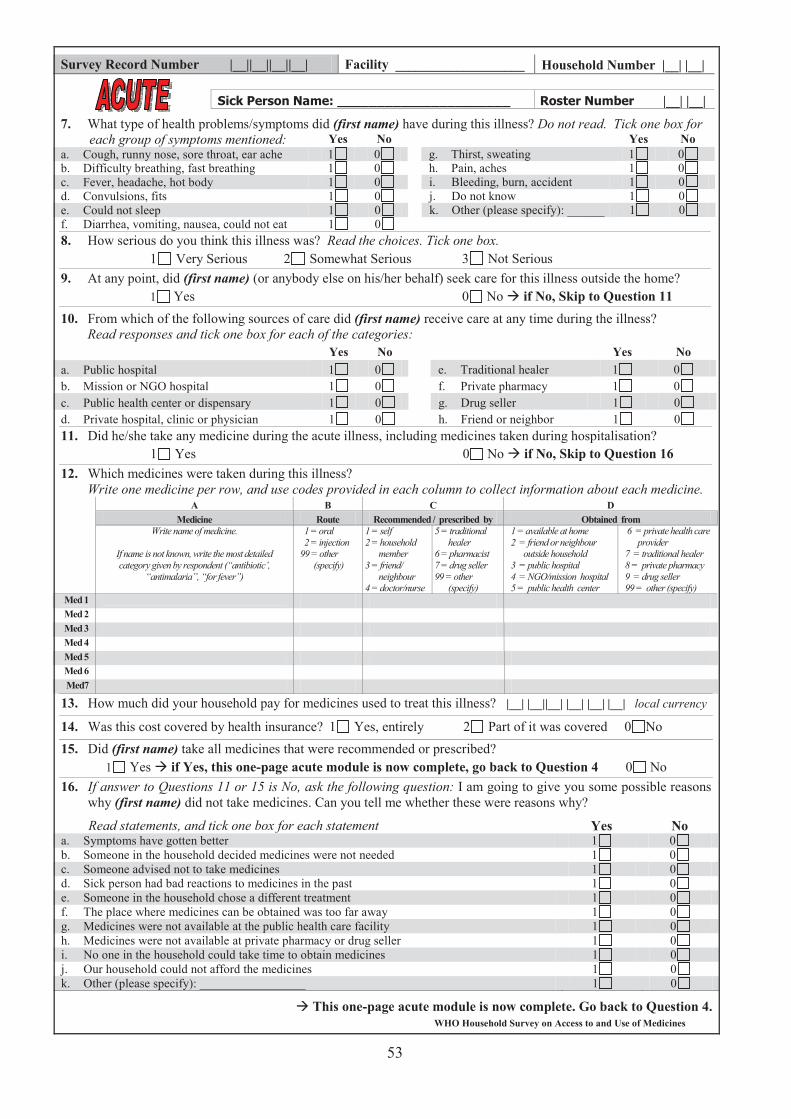
WHO Household Survey on Access to and Use of Medicines
Survey Record Number |__||__||__||__| Facility ___________________ Household Number |__| |__|
|__| |__|
7. What type of health problems/symptoms did (first name) have during this illness? Do not read. Tick one box for each group of symptoms mentioned: Yes No Yes No
a. Cough, runny nose, sore throat, ear ache 1 0 g. Thirst, sweating 1 0b. Difficulty breathing, fast breathing 1 0 h. Pain, aches 1 0c. Fever, headache, hot body 1 0 i. Bleeding, burn, accident 1 0d. Convulsions, fits 1 0 j. Do not know 1 0e. Could not sleep 1 0 k. Other (please specify): ______ 1 0f. Diarrhea, vomiting, nausea, could not eat 1 0 8. How serious do you think this illness was? Read the choices. Tick one box.
1 Very Serious 2 Somewhat Serious 3 Not Serious 9. At any point, did (first name) (or anybody else on his/her behalf) seek care for this illness outside the home?
1 Yes 0 No if No, Skip to Question 1110. From which of the following sources of care did (first name) receive care at any time during the illness?
Read responses and tick one box for each of the categories:Yes No Yes No
a. Public hospital 1 0 e. Traditional healer 1 0b. Mission or NGO hospital 1 0 f. Private pharmacy 1 0c. Public health center or dispensary 1 0 g. Drug seller 1 0d. Private hospital, clinic or physician 1 0 h. Friend or neighbor 1 011. Did he/she take any medicine during the acute illness, including medicines taken during hospitalisation?
1 Yes 0 No if No, Skip to Question 16 12. Which medicines were taken during this illness?
Write one medicine per row, and use codes provided in each column to collect information about each medicine. A B C D
Medicine Route Recommended / prescribed by Obtained from Write name of medicine.
If name is not known, write the most detailed category given by respondent (“antibiotic’,
“antimalaria”, “for fever”)
1 = oral 2 = injection 99 = other
(specify)
1 = self 2 = household
member 3 = friend/
neighbour 4 = doctor/nurse
5 = traditional healer
6 = pharmacist 7 = drug seller 99 = other
(specify)
1 = available at home 2 = friend or neighbour
outside household 3 = public hospital 4 = NGO/mission hospital 5 = public health center
6 = private health care provider
7 = traditional healer 8 = private pharmacy 9 = drug seller 99 = other (specify)
Med 1 Med 2 Med 3 Med 4 Med 5 Med 6 Med7
13. How much did your household pay for medicines used to treat this illness? |__| |__||__| |__| |__| |__| local currency
14. Was this cost covered by health insurance? 1 Yes, entirely 2 Part of it was covered 0 No 15. Did (first name) take all medicines that were recommended or prescribed?
1 Yes if Yes, this one-page acute module is now complete, go back to Question 4 0 No16. If answer to Questions 11 or 15 is No, ask the following question: I am going to give you some possible reasons
why (first name) did not take medicines. Can you tell me whether these were reasons why?
Read statements, and tick one box for each statement Yes No a. Symptoms have gotten better 1 0b. Someone in the household decided medicines were not needed 1 0c. Someone advised not to take medicines 1 0d. Sick person had bad reactions to medicines in the past 1 0e. Someone in the household chose a different treatment 1 0f. The place where medicines can be obtained was too far away 1 0g. Medicines were not available at the public health care facility 1 0h. Medicines were not available at private pharmacy or drug seller 1 0i. No one in the household could take time to obtain medicines 1 0j. Our household could not afford the medicines 1 0k. Other (please specify): _________________ 1 0
This one-page acute module is now complete. Go back to Question 4.
53

WHO Household Survey on Access to and Use of Medicines
Survey Record Number |__||__||__||__| Facility ___________________ Household Number |__| |__|
|__| |__|
7. What type of health problems/symptoms did (first name) have during this illness? Do not read. Tick one box for each group of symptoms mentioned: Yes No Yes No
a. Cough, runny nose, sore throat, ear ache 1 0 g. Thirst, sweating 1 0b. Difficulty breathing, fast breathing 1 0 h. Pain, aches 1 0c. Fever, headache, hot body 1 0 i. Bleeding, burn, accident 1 0d. Convulsions, fits 1 0 j. Do not know 1 0e. Could not sleep 1 0 k. Other (please specify): ______ 1 0f. Diarrhea, vomiting, nausea, could not eat 1 0 8. How serious do you think this illness was? Read the choices. Tick one box.
1 Very Serious 2 Somewhat Serious 3 Not Serious 9. At any point, did (first name) (or anybody else on his/her behalf) seek care for this illness outside the home?
1 Yes 0 No if No, Skip to Question 1110. From which of the following sources of care did (first name) receive care at any time during the illness?
Read responses and tick one box for each of the categories:Yes No Yes No
a. Public hospital 1 0 e. Traditional healer 1 0b. Mission or NGO hospital 1 0 f. Private pharmacy 1 0c. Public health center or dispensary 1 0 g. Drug seller 1 0d. Private hospital, clinic or physician 1 0 h. Friend or neighbor 1 011. Did he/she take any medicine during the acute illness, including medicines taken during hospitalisation?
1 Yes 0 No if No, Skip to Question 16 12. Which medicines were taken during this illness?
Write one medicine per row, and use codes provided in each column to collect information about each medicine. A B C D
Medicine Route Recommended / prescribed by Obtained from Write name of medicine.
If name is not known, write the most detailed category given by respondent (“antibiotic’,
“antimalaria”, “for fever”)
1 = oral 2 = injection 99 = other
(specify)
1 = self 2 = household
member 3 = friend/
neighbour 4 = doctor/nurse
5 = traditional healer
6 = pharmacist 7 = drug seller 99 = other
(specify)
1 = available at home 2 = friend or neighbour
outside household 3 = public hospital 4 = NGO/mission hospital 5 = public health center
6 = private health care provider
7 = traditional healer 8 = private pharmacy 9 = drug seller 99 = other (specify)
Med 1 Med 2 Med 3 Med 4 Med 5 Med 6 Med7
13. How much did your household pay for medicines used to treat this illness? |__| |__||__| |__| |__| |__| local currency
14. Was this cost covered by health insurance? 1 Yes, entirely 2 Part of it was covered 0 No 15. Did (first name) take all medicines that were recommended or prescribed?
1 Yes if Yes, this one-page acute module is now complete, go back to Question 4 0 No16. If answer to Questions 11 or 15 is No, ask the following question: I am going to give you some possible reasons
why (first name) did not take medicines. Can you tell me whether these were reasons why?
Read statements, and tick one box for each statement Yes No a. Symptoms have gotten better 1 0b. Someone in the household decided medicines were not needed 1 0c. Someone advised not to take medicines 1 0d. Sick person had bad reactions to medicines in the past 1 0e. Someone in the household chose a different treatment 1 0f. The place where medicines can be obtained was too far away 1 0g. Medicines were not available at the public health care facility 1 0h. Medicines were not available at private pharmacy or drug seller 1 0i. No one in the household could take time to obtain medicines 1 0j. Our household could not afford the medicines 1 0k. Other (please specify): _________________ 1 0
This one-page acute module is now complete. Go back to Question 4.
54
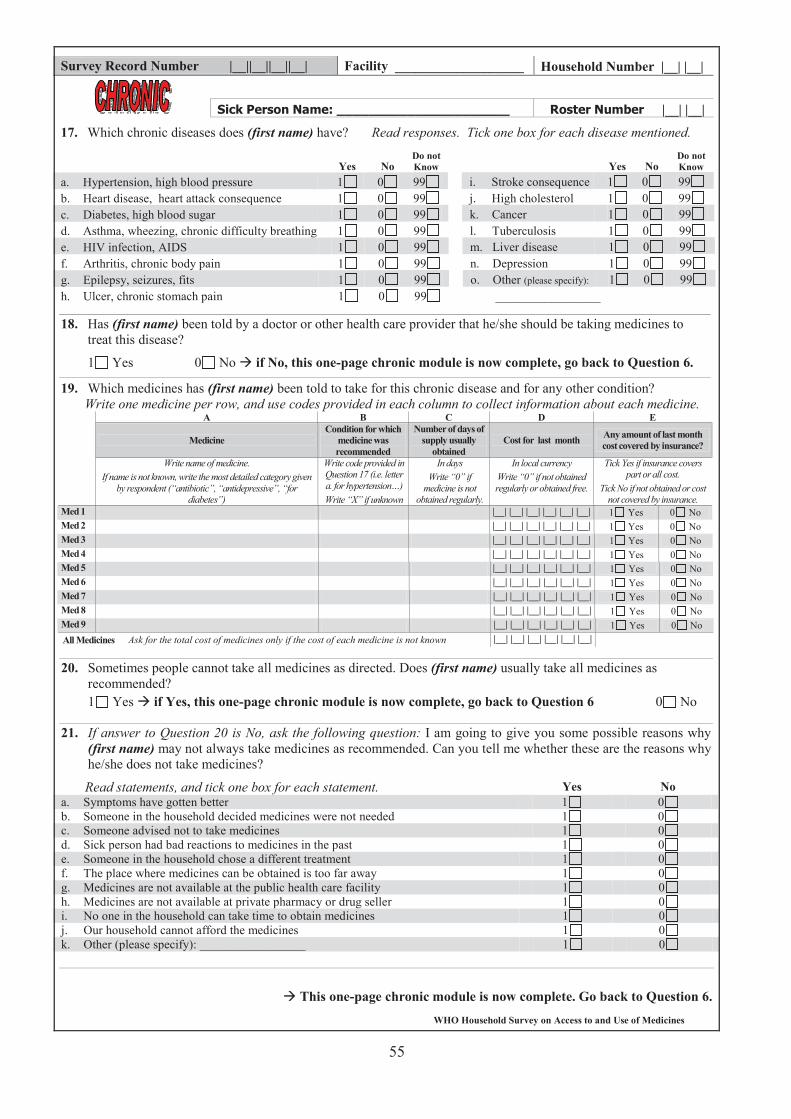
WHO Household Survey on Access to and Use of Medicines
Survey Record Number |__||__||__||__| Facility ___________________ Household Number |__| |__|
|__| |__|
17. Which chronic diseases does (first name) have? Read responses. Tick one box for each disease mentioned.
Yes No Do not Know Yes No
Do not Know
a. Hypertension, high blood pressure 1 0 99 i. Stroke consequence 1 0 99b. Heart disease, heart attack consequence 1 0 99 j. High cholesterol 1 0 99c. Diabetes, high blood sugar 1 0 99 k. Cancer 1 0 99d. Asthma, wheezing, chronic difficulty breathing 1 0 99 l. Tuberculosis 1 0 99e. HIV infection, AIDS 1 0 99 m. Liver disease 1 0 99f. Arthritis, chronic body pain 1 0 99 n. Depression 1 0 99g. Epilepsy, seizures, fits 1 0 99 o. Other (please specify): 1 0 99h. Ulcer, chronic stomach pain 1 0 99 _________________
18. Has (first name) been told by a doctor or other health care provider that he/she should be taking medicines to treat this disease?
1 Yes 0 No if No, this one-page chronic module is now complete, go back to Question 6.
19. Which medicines has (first name) been told to take for this chronic disease and for any other condition? Write one medicine per row, and use codes provided in each column to collect information about each medicine.
A B C D E
Medicine Condition for which
medicine was recommended
Number of days of supply usually
obtained Cost for last month Any amount of last month
cost covered by insurance?
Write name of medicine. If name is not known, write the most detailed category given
by respondent (“antibiotic”, “antidepressive”, “fordiabetes”)
Write code provided in Question 17 (i.e. letter a. for hypertension…) Write “X” if unknown
In days Write “0” if
medicine is not obtained regularly.
In local currency Write “0” if not obtained regularly or obtained free.
Tick Yes if insurance covers part or all cost.
Tick No if not obtained or cost not covered by insurance.
Med 1 |__| |__| |__| |__| |__| |__| 1 Yes 0 No Med 2 |__| |__| |__| |__| |__| |__| 1 Yes 0 No Med 3 |__| |__| |__| |__| |__| |__| 1 Yes 0 No Med 4 |__| |__| |__| |__| |__| |__| 1 Yes 0 No Med 5 |__| |__| |__| |__| |__| |__| 1 Yes 0 No Med 6 |__| |__| |__| |__| |__| |__| 1 Yes 0 No Med 7 |__| |__| |__| |__| |__| |__| 1 Yes 0 No Med 8 |__| |__| |__| |__| |__| |__| 1 Yes 0 No Med 9 |__| |__| |__| |__| |__| |__| 1 Yes 0 No All Medicines Ask for the total cost of medicines only if the cost of each medicine is not known |__| |__| |__| |__| |__| |__|
20. Sometimes people cannot take all medicines as directed. Does (first name) usually take all medicines as recommended? 1 Yes if Yes, this one-page chronic module is now complete, go back to Question 6 0 No
21. If answer to Question 20 is No, ask the following question: I am going to give you some possible reasons why (first name) may not always take medicines as recommended. Can you tell me whether these are the reasons why he/she does not take medicines?
Read statements, and tick one box for each statement. Yes No a. Symptoms have gotten better 1 0b. Someone in the household decided medicines were not needed 1 0c. Someone advised not to take medicines 1 0d. Sick person had bad reactions to medicines in the past 1 0e. Someone in the household chose a different treatment 1 0f. The place where medicines can be obtained is too far away 1 0g. Medicines are not available at the public health care facility 1 0h. Medicines are not available at private pharmacy or drug seller 1 0i. No one in the household can take time to obtain medicines 1 0j. Our household cannot afford the medicines 1 0k. Other (please specify): _________________ 1 0
This one-page chronic module is now complete. Go back to Question 6.
55
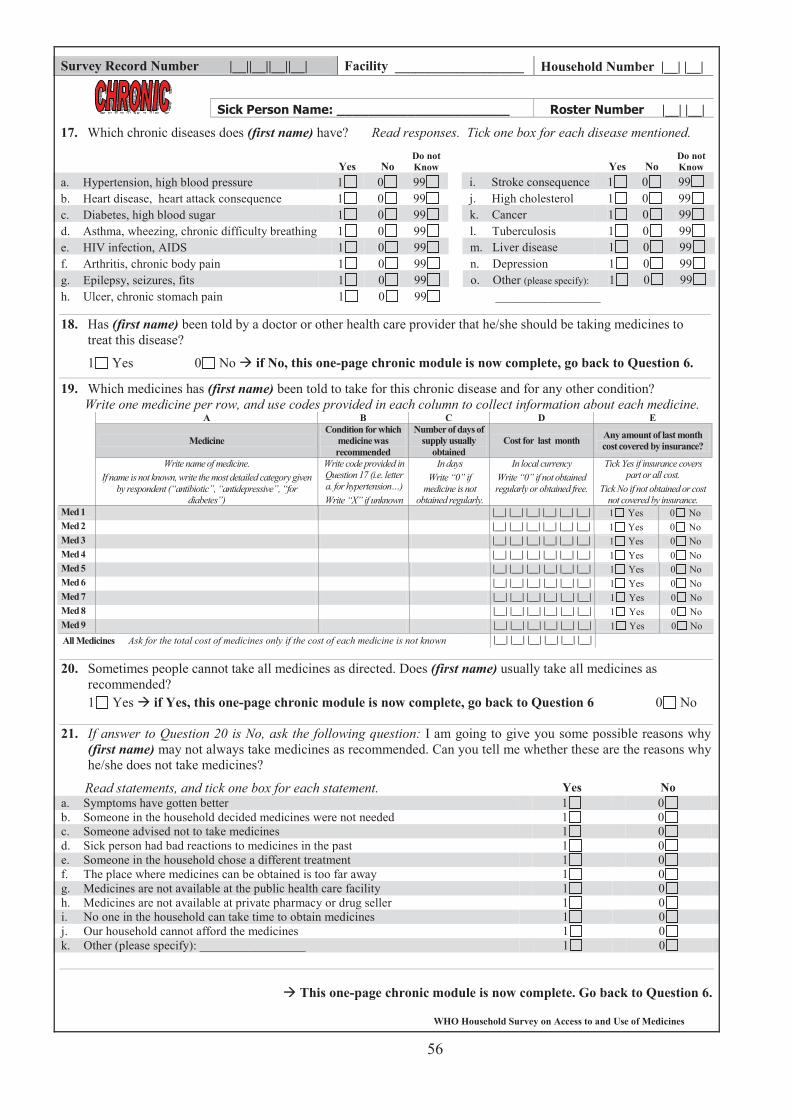
WHO Household Survey on Access to and Use of Medicines
Survey Record Number |__||__||__||__| Facility ___________________ Household Number |__| |__|
|__| |__|
17. Which chronic diseases does (first name) have? Read responses. Tick one box for each disease mentioned.
Yes No Do not Know Yes No
Do not Know
a. Hypertension, high blood pressure 1 0 99 i. Stroke consequence 1 0 99b. Heart disease, heart attack consequence 1 0 99 j. High cholesterol 1 0 99c. Diabetes, high blood sugar 1 0 99 k. Cancer 1 0 99d. Asthma, wheezing, chronic difficulty breathing 1 0 99 l. Tuberculosis 1 0 99e. HIV infection, AIDS 1 0 99 m. Liver disease 1 0 99f. Arthritis, chronic body pain 1 0 99 n. Depression 1 0 99g. Epilepsy, seizures, fits 1 0 99 o. Other (please specify): 1 0 99h. Ulcer, chronic stomach pain 1 0 99 _________________
18. Has (first name) been told by a doctor or other health care provider that he/she should be taking medicines to treat this disease?
1 Yes 0 No if No, this one-page chronic module is now complete, go back to Question 6.
19. Which medicines has (first name) been told to take for this chronic disease and for any other condition? Write one medicine per row, and use codes provided in each column to collect information about each medicine.
A B C D E
Medicine Condition for which
medicine was recommended
Number of days of supply usually
obtained Cost for last month Any amount of last month
cost covered by insurance?
Write name of medicine. If name is not known, write the most detailed category given
by respondent (“antibiotic”, “antidepressive”, “fordiabetes”)
Write code provided in Question 17 (i.e. letter a. for hypertension…) Write “X” if unknown
In days Write “0” if
medicine is not obtained regularly.
In local currency Write “0” if not obtained regularly or obtained free.
Tick Yes if insurance covers part or all cost.
Tick No if not obtained or cost not covered by insurance.
Med 1 |__| |__| |__| |__| |__| |__| 1 Yes 0 No Med 2 |__| |__| |__| |__| |__| |__| 1 Yes 0 No Med 3 |__| |__| |__| |__| |__| |__| 1 Yes 0 No Med 4 |__| |__| |__| |__| |__| |__| 1 Yes 0 No Med 5 |__| |__| |__| |__| |__| |__| 1 Yes 0 No Med 6 |__| |__| |__| |__| |__| |__| 1 Yes 0 No Med 7 |__| |__| |__| |__| |__| |__| 1 Yes 0 No Med 8 |__| |__| |__| |__| |__| |__| 1 Yes 0 No Med 9 |__| |__| |__| |__| |__| |__| 1 Yes 0 No All Medicines Ask for the total cost of medicines only if the cost of each medicine is not known |__| |__| |__| |__| |__| |__|
20. Sometimes people cannot take all medicines as directed. Does (first name) usually take all medicines as recommended? 1 Yes if Yes, this one-page chronic module is now complete, go back to Question 6 0 No
21. If answer to Question 20 is No, ask the following question: I am going to give you some possible reasons why (first name) may not always take medicines as recommended. Can you tell me whether these are the reasons why he/she does not take medicines?
Read statements, and tick one box for each statement. Yes No a. Symptoms have gotten better 1 0b. Someone in the household decided medicines were not needed 1 0c. Someone advised not to take medicines 1 0d. Sick person had bad reactions to medicines in the past 1 0e. Someone in the household chose a different treatment 1 0f. The place where medicines can be obtained is too far away 1 0g. Medicines are not available at the public health care facility 1 0h. Medicines are not available at private pharmacy or drug seller 1 0i. No one in the household can take time to obtain medicines 1 0j. Our household cannot afford the medicines 1 0k. Other (please specify): _________________ 1 0
This one-page chronic module is now complete. Go back to Question 6.
56
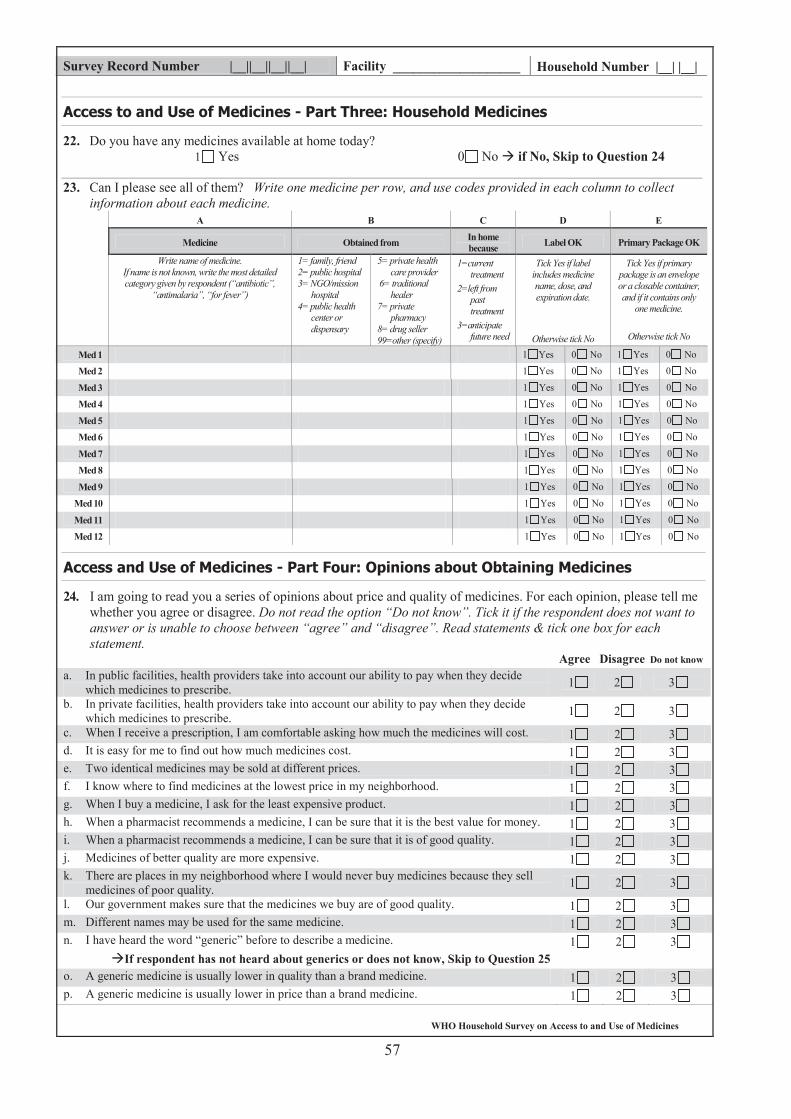
WHO Household Survey on Access to and Use of Medicines
Survey Record Number |__||__||__||__| Facility ___________________ Household Number |__| |__|
22. Do you have any medicines available at home today? 1 Yes 0 No if No, Skip to Question 24
23. Can I please see all of them? Write one medicine per row, and use codes provided in each column to collect information about each medicine.
A B C D E
Medicine Obtained from In home because Label OK Primary Package OK
Write name of medicine. If name is not known, write the most detailed category given by respondent (“antibiotic”,
“antimalaria”, “for fever”)
1= family, friend 2= public hospital 3= NGO/mission
hospital 4= public health
center or dispensary
5= private health care provider
6= traditional healer
7= private pharmacy
8= drug seller 99=other (specify)
1=current treatment
2=left from past treatment
3=anticipate future need
Tick Yes if label includes medicine name, dose, and expiration date.
Otherwise tick No
Tick Yes if primary package is an envelope or a closable container, and if it contains only
one medicine.
Otherwise tick No
Med 1 1 Yes 0 No 1 Yes 0 No
Med 2 1 Yes 0 No 1 Yes 0 No
Med 3 1 Yes 0 No 1 Yes 0 No
Med 4 1 Yes 0 No 1 Yes 0 No
Med 5 1 Yes 0 No 1 Yes 0 No
Med 6 1 Yes 0 No 1 Yes 0 No
Med 7 1 Yes 0 No 1 Yes 0 No
Med 8 1 Yes 0 No 1 Yes 0 No
Med 9 1 Yes 0 No 1 Yes 0 No
Med 10 1 Yes 0 No 1 Yes 0 No
Med 11 1 Yes 0 No 1 Yes 0 No
Med 12 1 Yes 0 No 1 Yes 0 No
24. I am going to read you a series of opinions about price and quality of medicines. For each opinion, please tell me whether you agree or disagree. Do not read the option “Do not know”. Tick it if the respondent does not want to answer or is unable to choose between “agree” and “disagree”. Read statements & tick one box for each statement.
Agree Disagree Do not know a. In public facilities, health providers take into account our ability to pay when they decide
which medicines to prescribe. 1 2 3
b. In private facilities, health providers take into account our ability to pay when they decide which medicines to prescribe. 1 2 3
c. When I receive a prescription, I am comfortable asking how much the medicines will cost. 1 2 3d. It is easy for me to find out how much medicines cost. 1 2 3e. Two identical medicines may be sold at different prices. 1 2 3f. I know where to find medicines at the lowest price in my neighborhood. 1 2 3g. When I buy a medicine, I ask for the least expensive product. 1 2 3h. When a pharmacist recommends a medicine, I can be sure that it is the best value for money. 1 2 3i. When a pharmacist recommends a medicine, I can be sure that it is of good quality. 1 2 3j. Medicines of better quality are more expensive. 1 2 3k. There are places in my neighborhood where I would never buy medicines because they sell
medicines of poor quality. 1 2 3
l. Our government makes sure that the medicines we buy are of good quality. 1 2 3m. Different names may be used for the same medicine. 1 2 3n. I have heard the word “generic” before to describe a medicine. 1 2 3
If respondent has not heard about generics or does not know, Skip to Question 25 o. A generic medicine is usually lower in quality than a brand medicine. 1 2 3p. A generic medicine is usually lower in price than a brand medicine. 1 2 3
57
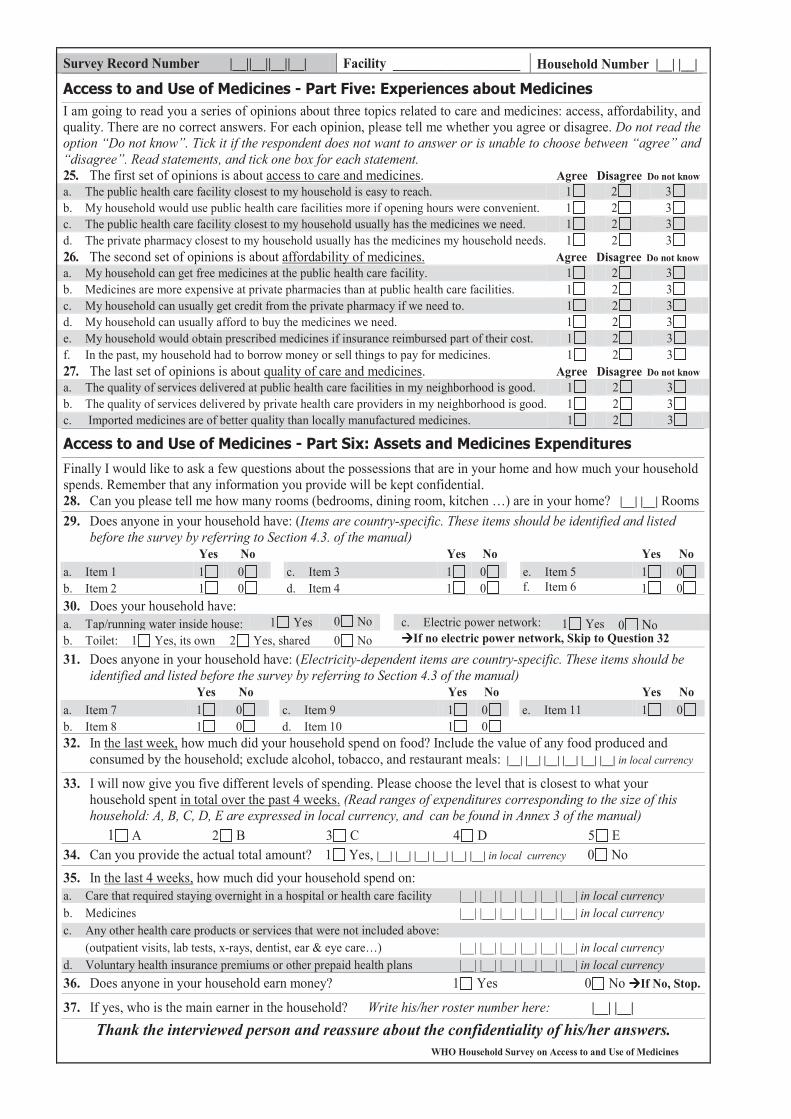
WHO Household Survey on Access to and Use of Medicines
Survey Record Number |__||__||__||__| Facility ___________________ Household Number |__| |__|
I am going to read you a series of opinions about three topics related to care and medicines: access, affordability, and quality. There are no correct answers. For each opinion, please tell me whether you agree or disagree. Do not read the option “Do not know”. Tick it if the respondent does not want to answer or is unable to choose between “agree” and “disagree”. Read statements, and tick one box for each statement. 25. The first set of opinions is about access to care and medicines. Agree Disagree Do not knowa. The public health care facility closest to my household is easy to reach. 1 2 3b. My household would use public health care facilities more if opening hours were convenient. 1 2 3c. The public health care facility closest to my household usually has the medicines we need. 1 2 3d. The private pharmacy closest to my household usually has the medicines my household needs. 1 2 326. The second set of opinions is about affordability of medicines. Agree Disagree Do not knowa. My household can get free medicines at the public health care facility. 1 2 3b. Medicines are more expensive at private pharmacies than at public health care facilities. 1 2 3c. My household can usually get credit from the private pharmacy if we need to. 1 2 3d. My household can usually afford to buy the medicines we need. 1 2 3e. My household would obtain prescribed medicines if insurance reimbursed part of their cost. 1 2 3f. In the past, my household had to borrow money or sell things to pay for medicines. 1 2 327. The last set of opinions is about quality of care and medicines. Agree Disagree Do not knowa. The quality of services delivered at public health care facilities in my neighborhood is good. 1 2 3b. The quality of services delivered by private health care providers in my neighborhood is good. 1 2 3c. Imported medicines are of better quality than locally manufactured medicines. 1 2 3
Finally I would like to ask a few questions about the possessions that are in your home and how much your household spends. Remember that any information you provide will be kept confidential. 28. Can you please tell me how many rooms (bedrooms, dining room, kitchen …) are in your home? |__| |__| Rooms 29. Does anyone in your household have: (Items are country-specific. These items should be identified and listed
before the survey by referring to Section 4.3. of the manual) Yes No Yes No Yes No a. Item 1 1 0 c. Item 3 1 0 e. Item 5 1 0b. Item 2 1 0 d. Item 4 1 0 f. Item 6 1 030. Does your household have: a. Tap/running water inside house: 1 Yes 0 No c. Electric power network: 1 Yes 0 Nob. Toilet: 1 Yes, its own 2 Yes, shared 0 No If no electric power network, Skip to Question 32
31. Does anyone in your household have: (Electricity-dependent items are country-specific. These items should be identified and listed before the survey by referring to Section 4.3 of the manual)
Yes No Yes No Yes No a. Item 7 1 0 c. Item 9 1 0 e. Item 11 1 0b. Item 8 1 0 d. Item 10 1 0 32. In the last week, how much did your household spend on food? Include the value of any food produced and
consumed by the household; exclude alcohol, tobacco, and restaurant meals: |__| |__| |__| |__| |__| |__| in local currency
33. I will now give you five different levels of spending. Please choose the level that is closest to what your household spent in total over the past 4 weeks. (Read ranges of expenditures corresponding to the size of this household: A, B, C, D, E are expressed in local currency, and can be found in Annex 3 of the manual)
1 A 2 B 3 C 4 D 5 E34. Can you provide the actual total amount? 1 Yes, |__| |__| |__| |__| |__| |__| in local currency 0 No35. In the last 4 weeks, how much did your household spend on: a. Care that required staying overnight in a hospital or health care facility |__| |__| |__| |__| |__| |__| in local currencyb. Medicines |__| |__| |__| |__| |__| |__| in local currencyc. Any other health care products or services that were not included above:
(outpatient visits, lab tests, x-rays, dentist, ear & eye care…) |__| |__| |__| |__| |__| |__| in local currencyd. Voluntary health insurance premiums or other prepaid health plans |__| |__| |__| |__| |__| |__| in local currency36. Does anyone in your household earn money? 1 Yes 0 No If No, Stop.
37. If yes, who is the main earner in the household? Write his/her roster number here: |__| |__|Thank the interviewed person and reassure about the confidentiality of his/her answers.
58
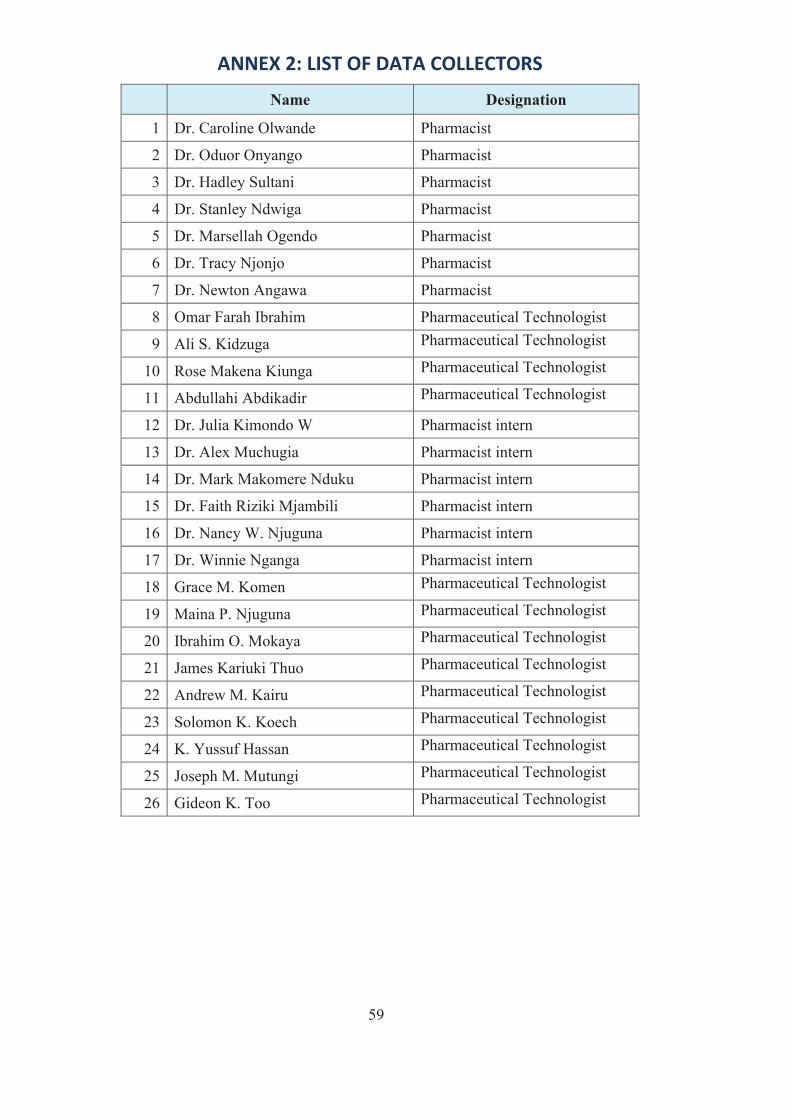
61
ANNEX 2: LIST OF DATA COLLECTORS
Name Designation
1 Dr. Caroline Olwande Pharmacist
2 Dr. Oduor Onyango Pharmacist
3 Dr. Hadley Sultani Pharmacist
4 Dr. Stanley Ndwiga Pharmacist
5 Dr. Marsellah Ogendo Pharmacist
6 Dr. Tracy Njonjo Pharmacist
7 Dr. Newton Angawa Pharmacist
8 Omar Farah Ibrahim Pharmaceutical Technologist
9 Ali S. Kidzuga Pharmaceutical Technologist
10 Rose Makena Kiunga Pharmaceutical Technologist
11 Abdullahi Abdikadir Pharmaceutical Technologist
12 Dr. Julia Kimondo W Pharmacist intern
13 Dr. Alex Muchugia Pharmacist intern
14 Dr. Mark Makomere Nduku Pharmacist intern
15 Dr. Faith Riziki Mjambili Pharmacist intern
16 Dr. Nancy W. Njuguna Pharmacist intern
17 Dr. Winnie Nganga Pharmacist intern
18 Grace M. Komen Pharmaceutical Technologist
19 Maina P. Njuguna Pharmaceutical Technologist
20 Ibrahim O. Mokaya Pharmaceutical Technologist
21 James Kariuki Thuo Pharmaceutical Technologist
22 Andrew M. Kairu Pharmaceutical Technologist
23 Solomon K. Koech Pharmaceutical Technologist
24 K. Yussuf Hassan Pharmaceutical Technologist
25 Joseph M. Mutungi Pharmaceutical Technologist
26 Gideon K. Too Pharmaceutical Technologist
59
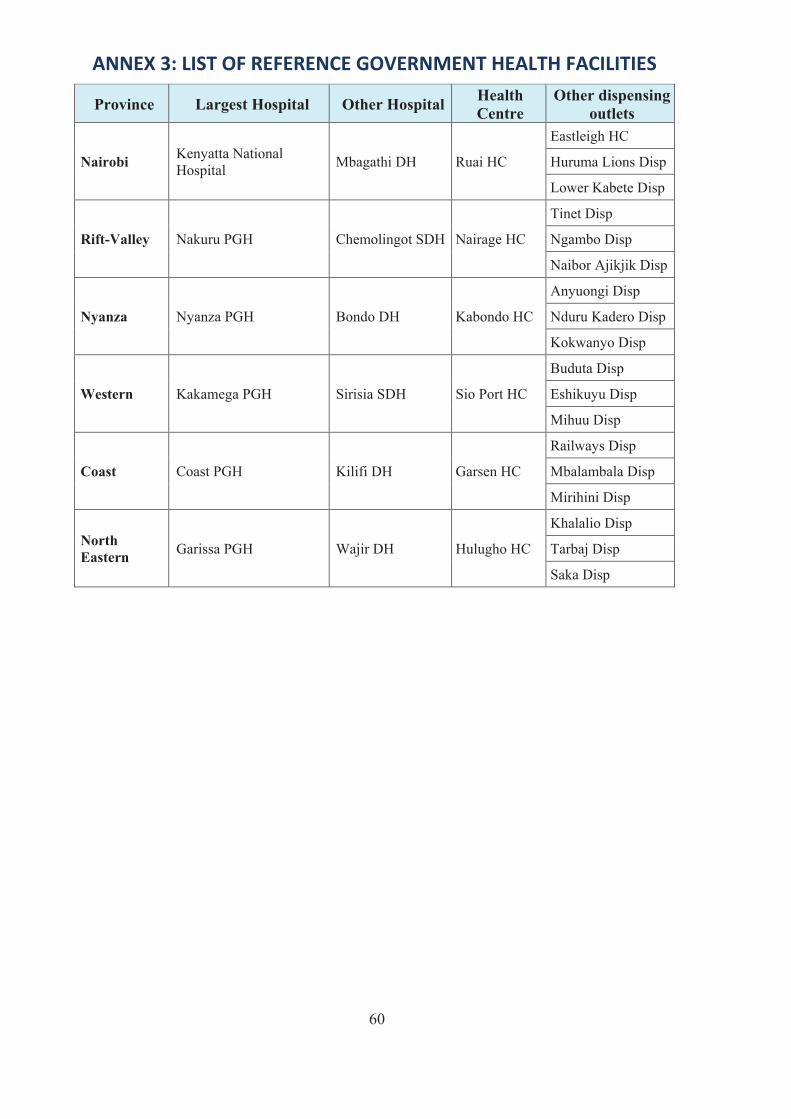
62
ANNEX 3: LIST OF REFERENCE GOVERNMENT HEALTH FACILITIES
Province Largest Hospital Other Hospital HealthCentre
Other dispensing outlets
Nairobi Kenyatta National Hospital Mbagathi DH Ruai HC
Eastleigh HC
Huruma Lions Disp
Lower Kabete Disp
Rift-Valley Nakuru PGH Chemolingot SDH Nairage HC
Tinet Disp
Ngambo Disp
Naibor Ajikjik Disp
Nyanza Nyanza PGH Bondo DH Kabondo HC
Anyuongi Disp
Nduru Kadero Disp
Kokwanyo Disp
Western Kakamega PGH Sirisia SDH Sio Port HC
Buduta Disp
Eshikuyu Disp
Mihuu Disp
Coast Coast PGH Kilifi DH Garsen HC
Railways Disp
Mbalambala Disp
Mirihini Disp
NorthEastern Garissa PGH Wajir DH Hulugho HC
Khalalio Disp
Tarbaj Disp
Saka Disp
60
63
REFERENCES1. Assessment of the pharmaceutical situation in Kenya: a baseline survey, Ministry of
Health/WHO/HAI, 2003
2. Kenya National Pharmaceutical Policy (KNPP), Ministry of Medical Services/Ministry of PublicHealth, 2010
3. WHO Household Survey to Measure Access to and Use of Medicines (Long Version) DraftManual for Data Collection and Data Entry, May 5, 2008
4. Kenya Demographic and Health Survey, 2008 09, Kenya National Bureau of Statistics
61
Ministry of MedicalServices
ofand
Ministry Public HealthSanitation