Embed Size (px)
Citation preview
i
Ministry of Labour and Human Welfare
United Nations Children’s Fund
Evaluation ReportOn the
Donkey for School Project in Eritrea
July 2009 – December 2010
Ghebremedhin Haile June 2011Business and Social Consultant Asmara Eritrea
ii
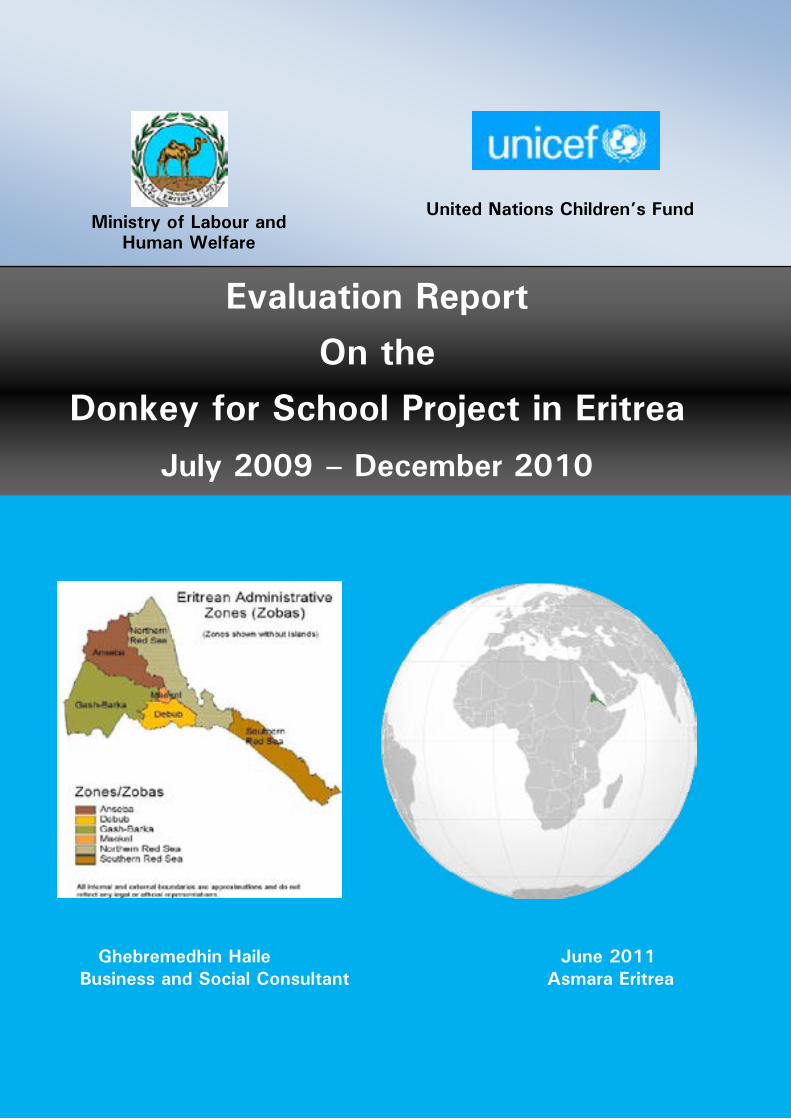
Evaluation Report on the Donkey for School Project in Eritrea (July 2009-December 2010)
A disabled child from Sub-zoba Mai Aini, ZobaDebub
Prepared for
The Ministry of Labour and Human WelfareGovernment of Eritrea
Supported by
United Nations Children’s Fund (UNICEF)
Prepared by
Ghebremedhin Haile, Business and Social Consultant
Citation: Haile, G. (2011). Evaluation Report on the Donkey for School Project in Eritrea (July 2009-December 2010), prepared for the Ministry of Labour and Human Welfare and UNICEF/Eritrea, Asmara.

iii
CONtENtS

iv
LiSt OF tABLES
v
LiSt OF FiGURES
vi
ABBREViAtiONS AND ACRONYMS
CBR Community Based Rehabilitation CBRW Community-Based Rehabilitation Workers CCA Common Country Assessment CDC Centers for Disease Control and Prevention CWD Children with Disabilities CSPro Census and Survey Processing softwareEDA Eritrean Demining Authority ERW Explosive Remnants of WarFGDs Focus Group Discussions FHHs Female-Headed Households HHs Households HMiS Health Management Information System iSS Injury Surveillance System Kiis Key Informants InterviewsMHHs Male-Headed Households MoE Ministry of EducationMoF Ministry of Finance Moi Ministry of InformationMoH Ministry of HealthMoLHW Ministry of Labour and Human WelfareMDG Millennium Development Goal NER Net Enrolment Ratio NRS Northern Red Sea ZobaOPD Organisation of Persons with Disability PSU Primary Sampling UnitPtA Parent-Teacher Association SPSS Statistical Package for the Social SciencesSRS Southern Red Sea ZobaSSU Secondary Sampling UnittoR Terms of Referencetot Training of Trainers UNDAF United Nations Development Assistance Framework UNiCEF United Nations Children’s FundWHO World Health Organization
vii
ACKNOWLEDGEMENtS
Several people have contributed to the successful completion of this evaluation. I am especially grateful to the management and staff of the Ministry of Labour and Human Welfare (MoLHW) particularly to Mr. Mehreteab Fessehaye, Director General of the Department of Social Welfare and Mr. TecleTesfay, Director of Child Affairs Division for their valuable technical inputs and administrative support. I am also thankful to Mr. Yonas Araya, staff of the Child Affairs Division of the MoLHW for facilitating the fieldwork.
Special thanks goto Ms. Gbemisola Akinboyo, UNICEF Child Protection Chief, Mr. Samuel Isaac, UNICEF Social Protection Officer and Mr. Estifanos Aradom, UNICEF Child Protection Specialist for their critical insights and excellent logistical support that was provided throughout the evaluation. I would also like to thank Ms. Roselyn Joseph, UNICEF Monitoring and Evaluation Specialist, and Ms. Yahoko Asai, Basic Education and Gender Equality Programme Officer for their useful contributions in reviewing the study methodology and survey instrument.
I am also indebted to the regional and sub-regional local heads of the MoLHW for facilitating the fieldwork in their respective areas, timely arrangements of meetings with various sections of the communities, availing themselves for interviews, and providing required secondary data and information. My gratitude also goes to other government officials at central, zoba, and sub-zoba levels as well as community leaders and members for sacrificing their time to participate in individual interviews and focus groups discussions.
Last but not least, I would like to thank the children living with disabilities and their families for travelling long distances to participate in the household survey.
* All photos in this report were taken by the Consultant.
viii
ExECUtiVE SUMMARY
The Donkey for School Projectis implemented by the Ministry of Labour and Human Welfare (MoLHW) in close collaboration with other government ministries as well as UNICEF/Eritrea. The Swiss Committee for UNICEF provided a financial grant of USD 775,960. The overall goal is to improve the social protection of children through improved access to basic social services, enhanced and increased income levels of an initial 870 vulnerable households through the following:
(i) 870 children will have access to schooling, targeting hard-to-reach girl children and those physically challenged with disabilities in 30 communities/kebabis; and
(ii) 870 vulnerable households will be reached with 870 donkeys, and household income levels will be increased by 15 percent.
The project’s implementation period is from July 2009 to December 2011. This evaluation was commissioned by MoLHW with support from UNICEF, and was conducted by an independent consultant. The objective of the evaluation is to assess project achievements, relevance, efficiency, effectiveness, impact and sustainability. The intended audience of the evaluation includes UNICEF, the Swiss Committee for UNICEF, MoLHW, Ministry of Health (MoH), Ministry of Education (MOE), Ministry of Information (MoI), local administration offices in the six regions, and Child Wellbeing Committees (CWCs).
The evaluation was conducted in a participatory manner involving a wide range of stakeholders using both quantitative and qualitative research instruments. A total of 283 sample respondents (32% of the total project beneficiaries) were covered by the quantitative survey in 28 sub-regions of the six regions. A structured questionnaire was developed and administered to interview household heads together with their supported children. The qualitative survey was conducted through key informant interviews and focus group discussions held at central, regional and sub-regional levels involving a total of 211 participants in all the six regions. A summary of the main findings, conclusions and key recommendations is presented as follows.
Overall, the project has succeeded in generating most of the expected results as planned and is on track to deliver the remaining results. By distributing 875 donkeys and accessories, it has slightly exceeded its initial plan of helping 870 vulnerable children. Moreover, the project has effectively addressed the children’s mobility problems with locally available resources - donkeys and accessories which are both appropriate and affordable.
As the beneficiaries have received support in 2009 and 2010, it would be premature to expect major socio-economic impacts being generated by the project at the time of the evaluation. However, by providing donkeys to vulnerable households, the project has reduced their domestic burden especially for those who live in the rural areas. The most significant educational impacts of the support include increased school enrolment, reduced dropouts, and improved attendance which in turn contributed to improved academic performance.
The children interviewed as key informants said that they were on average missing one or two school days per week prior to the project and this has tremendously declined after the support. Of the total children with disabilities, 84% indicated that they had not
ix
been absent from school in the past two weeks before the survey. Average travel time taken by children with a disability to reach school is reduced by almost one-half, from 65 minutes to 35 minutes, which allowed them to be in school on time and properly follow their lessons.
The survey further showed that the average mark1 of sampled beneficiary children increased from 67% before the support to 70%after the support. Although this improvement cannot be entirely attributed to the project, improved morale as a result of the support as well as their timely arrival at school due to reduced travel time appears to have made some positive impact on the children’s academic performance.
A very high percentage (92.5%) of the children supported by the project were attending school at the time of the survey, and this can be taken as a proxy indicator of the project’s impact in terms of motivating children with disability to continue their education as well as encouraging parents to send their children living with disability to school. Note that the main reasons given by children with disability for being dropouts are mobility problem and illness.
Moreover, the project eased the burdensome household chores for beneficiary households. Prior to the support, the majority of households were greatly dependent on human labour to collect water (55%) and firewood (60%), often from considerable distances from home. This shifted to donkey use to collect water (87%) and firewood (60.3%) following arrival of the donkeys. Since collecting water is primarily the responsibility of women and children (94%), these members of the beneficiary households were specific beneficiaries from the initiative.
The economic impact of the project was limited to a small amount of additional income earned from the sale of firewood and forest products, and renting the donkeys. Increases in income have been constrained mainly due to the short life span of the project (2 years) and limited income generating opportunities in the rural areas that can be exploited by employing a donkey.
Community awareness about the rights of children with disabilities to basic social services has improved, though this positive change cannot be entirely attributed to the project. As a result of increased awareness, the vast majority (81.6% male and 87.3% female) of the respondents confirmed that they give high value to education of children with disabilities. The perception of children with disabilities about the value that society gives to their education was also positive. Nine out of ten children with disabilities said that their families give high value to their education with no variation between male and female respondents. Most children with disability claimed to have received some kind of assistance mainly moral support from their classmates, teachers, school administration and Parent-Teacher Association (PTA).
To contribute towards national efforts of making the school environment more friendly and responsive to the needs of vulnerable children, the project financed training of 787 teachers to improve their knowledge and skills on how to help children with special needs. In addition, learning materials targeting vulnerable children are imported by the project and are expected to be distributed shortly to the beneficiary schools.
1 Average mark is the grand (overall) mean of the sum of the average marks obtained by the sampled children.
x
The project also enhanced the human and institutional capacity of the Ministry of Health in the area of Injury Surveillance System (ISS). The Ministry has successfully piloted the ISS in Zoba Maekel, and will soon be replicated in two other zobas, Debub and Gash Barka.
The participatory approach followed by the MoLHW and its partners in implementing the project using the existing government system rather than establishing a parallel structure resulted in improved project efficiency. By allowing communities to take part in project implementation and follow up, the project increased communities’ sense of ownership, which is an essential prerequisite for project sustainability. However, collaboration and co-ordination among project partners has been less effective. The co-ordination mechanism that was initially put in place to facilitate joint planning, supervision, monitoring and review did not work as planned. Mobility problems caused by shortage of transport facilities, increase in the cost of donkeys and accessories in some zobas, shortage of qualified staff on the part of government partners have affected project efficiency.
Based on the above findings, the following recommendations should be considered:
1. Avail additional resources to scale up the project so that an increasing number of children with disabilities could be assisted.
2. Put enough contingency in preparing budget proposals in future so that risks associated with increases in cost of donkeys and accessories could be easily mitigated.
3. Provide children with disabilities with school materials, school bags and crutches to solve their mobility problems and also boost their morale.
4. Ensure timely supply of good quality accessories by over seeing purchase of accessories at the head office level and developing detailed technical specifications.
5. Intensify community sensitisation and awareness raising activities about child rights in general and the rights of children living with disabilities in particular.
6. Ensure that Community Based Rehabilitation Workers (CBRWs) remain motivated by providing them with additional training and refresher courses.
7. Make school infrastructure friendly to children with disabilities, provide pre-service and continue in-service training to teachers on inclusive education. Expand provision of learning aids to schools to improve the learning environment for children with disability.
8. Strengthen co-ordination and collaboration among project partners especially in relation to joint planning, supervision, reviews, monitoring and evaluation.
1 OBJECTIVES OF THE EVALUATION
1
1 OBJECtiVES OF tHE EVALUAtiON1
2
1.1 CONtExt
1.1.1 OVERViEW OF ERitREA
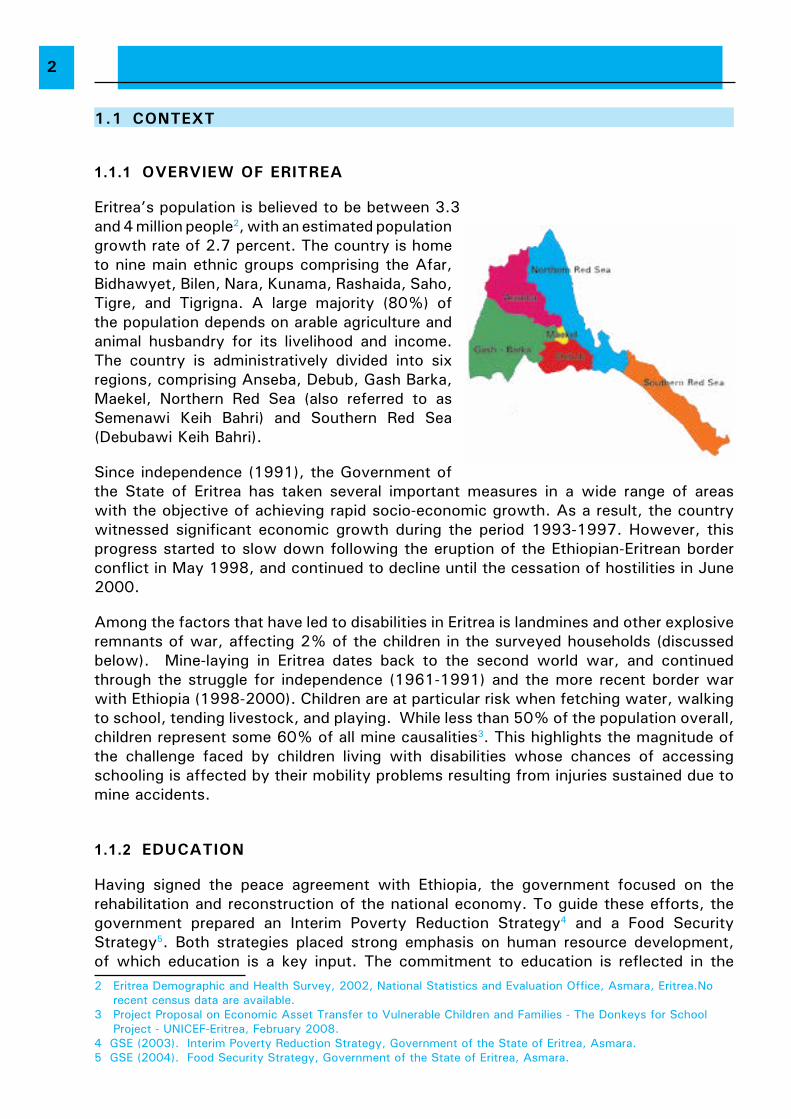
Eritrea’s population is believed to be between 3.3 and 4 million people2, with an estimated population growth rate of 2.7 percent. The country is home to nine main ethnic groups comprising the Afar, Bidhawyet, Bilen, Nara, Kunama, Rashaida, Saho, Tigre, and Tigrigna. A large majority (80%) of the population depends on arable agriculture and animal husbandry for its livelihood and income. The country is administratively divided into six regions, comprising Anseba, Debub, Gash Barka, Maekel, Northern Red Sea (also referred to as Semenawi Keih Bahri) and Southern Red Sea (Debubawi Keih Bahri).
Since independence (1991), the Government of the State of Eritrea has taken several important measures in a wide range of areas with the objective of achieving rapid socio-economic growth. As a result, the country witnessed significant economic growth during the period 1993-1997. However, this progress started to slow down following the eruption of the Ethiopian-Eritrean border conflict in May 1998, and continued to decline until the cessation of hostilities in June 2000.
Among the factors that have led to disabilities in Eritrea is landmines and other explosive remnants of war, affecting 2% of the children in the surveyed households (discussed below). Mine-laying in Eritrea dates back to the second world war, and continued through the struggle for independence (1961-1991) and the more recent border war with Ethiopia (1998-2000). Children are at particular risk when fetching water, walking to school, tending livestock, and playing. While less than 50% of the population overall, children represent some 60% of all mine causalities3. This highlights the magnitude of the challenge faced by children living with disabilities whose chances of accessing schooling is affected by their mobility problems resulting from injuries sustained due to mine accidents.
1.1.2 EDUCAtiON
Having signed the peace agreement with Ethiopia, the government focused on the rehabilitation and reconstruction of the national economy. To guide these efforts, the government prepared an Interim Poverty Reduction Strategy4 and a Food Security Strategy5. Both strategies placed strong emphasis on human resource development, of which education is a key input. The commitment to education is reflected in the 2 Eritrea Demographic and Health Survey, 2002, National Statistics and Evaluation Office, Asmara, Eritrea.No
recent census data are available. 3 Project Proposal on Economic Asset Transfer to Vulnerable Children and Families - The Donkeys for School
Project - UNICEF-Eritrea, February 2008.4 GSE (2003). Interim Poverty Reduction Strategy, Government of the State of Eritrea, Asmara. 5 GSE (2004). Food Security Strategy, Government of the State of Eritrea, Asmara.
3
considerable national resources devoted to the sector.
The continued commitment to education from independence in 1993 has meant that, despite many challenges, Eritrea is progressing well towards achieving its commitment to universal primary education (Millennium Development Goal (MDG) 2). The net primary school enrolment rate increased from 24.8% in 1991/92, just before independence, to 49.6% in 2009/106. Despite this progress, low school enrolment and under-achievement still remain as major challenges to education in Eritrea. There is wide disparity in school enrolment among the zobas. For example, the net enrolment rate for elementary level in 2009/10 ranged from as high as 63.4% for Zoba Debub to as low as 25.4% for Zoba Northern Red Sea. Gender inequity remains to be a challenge7. The Draft National Education Policy8, issued in 2003, recognizes the huge waste of resources caused by repetition and drop-out. For example, the repetition rate in 2009/10 was 13.2% in elementary schools and 12.5% in middle schools. This wastage seriously hampers the efforts to increase enrolments in general. The progression of girls is slow due to repetition, especially in middle and secondary levels9.
Among the factors that continue to contribute to enrolment and performance challenges include poverty, lack of access due to distance, shortages of learning materials, poorly qualified teachers and a poor learning environment. Teaching and learning materials are inadequate and most schools are poorly equipped. Facilities such as libraries, laboratories and resource centres are not available in most zoba. Most teachers lack the training to develop their own teaching aids. Recreational and sport facilities are also inadequate.
Access to education is relatively low for children with disabilities. A national survey conducted by the MoLHW in 2004 shows that there were 23,205 children with disabilities, the majority of whom lived in rural areas. Of these, only 3,500 (15%) were supported in school through the Community-Based Rehabilitation (CBR) Programme10.
The problems facing children with disabilities is especially problematic for girls, as cultural barriers (e.g. emphasis on domestic role of girls, early marriage, families’ preference to send boys to school or reluctance to send girls, etc.) also curtail their right to education. Low participation of girls in education is associated with the presence of strong traditional beliefs about a woman’s place in the society which is mainly defined in terms of domestic and reproductive roles. This attitude is more entrenched in the rural areas particularly in lowland areas, which are home to nomadic populations. Distance remains an important impediment for improving enrolment and retention rates. The challenge in relation to distance becomes more serious for children with physical disabilities who have to travel long distances in difficult terrain to reach school.
Negative perceptions towards persons with disabilities has historically affected their participation in education. Disability was, in the past, widely seen as a curse caused by supernatural power for committing sin and is often linked by people to witchcraft, superstition, evil eye, and other myths. This has historically tended to worsen the situation of those with disabilities, especially in rural areas. Consequently, persons with disabilities were some times discouraged by their families from venturing out of their home to go to school, work, socialise, and play. Fortunately, this situation has improved 6 Eritrea: Essential Education Indicators, 2009/2010, Ministry of Education (unpublished).7 Policy and Strategy on Inclusive Education in Eritrea, Ministry of Education, Asmara-Eritrea, December 2008.8 Ministry of Education (2003). Eritrea: Naitonal Education Policy, Ministry of Education, Asmara.9 Policy and Strategy on Inclusive Education in Eritrea, Ministry of Education, Asmara-Eritrea, December 2008.10 Ministry of Labour and Human Welfare (2008). Strategic Plan 2008-2012, MLHW, Asmara.
4
over time as a result of sensitisation activities and open discussions around disabilities, including through the Community Based Rehabilitation Programme.
1.2 PROJECt LOGiC
1.2.1 PROJECt GOAL
In December 2008 the Ministry of Education prepared the “Policy and Strategy on Inclusive Education in Eritrea”. This policy and strategy document identified certain groups including children with disabilities and girls in remote areas as being disproportionately excluded from educational opportunities in terms of access and appropriate responses to their needs. To give equal opportunity to children with physical disabilities and disadvantaged girls, it was found essential to provide affirmative action so that the right to education and basic social services is upheld by getting all children from home to school.
It is with this objective in mind that the MoLHW and UNICEF initiated the Donkeys for School Project. The aim is to promote the equal opportunity for access of children with disabilities, especially the disadvantaged girls, to education in many rural areas by addressing their mobility problems through the provision of donkeys and accessories. The goal of this project is to improve the social protection of children through access to basic social services, enhance and increase income levels of an initial 870 vulnerable households.
The project is funded by the Swiss Committee for UNICEF and the total programmable budget was US$ 775,960.06. It is implemented by the MoLHW in partnership with UNICEF, MoE, MoH, Ministry of Information (MoI), Eritrean Demining Authority (EDA) and Child-Well Being Committees. Project implementation period is from July 2009 to 31 December 2011 and all zobas were covered by the project.
1.2.2 PROJECt OBJECtiVE
The objective of the project is to provide:
1) 870 children have access to schools, especially hard to reach girl children and those physically challenged with disabilities in 30 communities/kebabis11.
2) 870 vulnerable households are provided with 870 donkeys, and household income levels are increased by 15 percent.
1.2.3 iNtENDED PROJECt RESULtS
The achievement of the project objectives depended on the attainment of the following results.
11 Kebabi is the lowest administrative unit and usually comprises 2-3 villages.
5
A. increased access to, and quality of education in schools through the following:
A.1. procurement and distribution of 870 donkeys and accessories
The project supported procurement and distribution of a total of 870 donkeys and accessories to 870 vulnerable children to be used as a means of transport to go to school. In addition, the donkeys are also meant to be an economic asset for poor families. The support is intended to protect children from the livelihood pressure of fetching water and firewood from long distances. It is also aimed at enhancing social status within the communities and serve as a source of income to vulnerable households.
A.2. training of school directors and teachers and supplying learning materials
The project supports training of school directors and teachers on inclusive education to increase the participation of children with disabilities and girls from the rural areas in schooling. In addition, as part of its contribution to improving quality of education in schools, the project aimed to supply specialised learning materials to schools to help children with disabilities develop their potential.
B. Community empowerment
Apart from the provision of donkeys, the project aimed at increasing awareness of the communities and duty bearers about the rights of children emphasising that children with disabilities have the same right to education as other children, and that schools and education systems must not discriminate against any child. Awareness-raising sessions involved addressing barriers which prevent children with disabilities and the girl child from accessing the same development opportunities as others.
Support was also provided for reviewing, updating, printing and disseminating the Community Based Rehabilitation Manual. Activities were also planned for reviewing, updating and printing the national disability policy and advocacy on the ratification of Convention on the Rights of Persons with Disabilities.
C. injury surveillance system and capacity development
The Ministry of Health developed an injury surveillance system (ISS) to serve as a basis for formulating injury prevention and control policies and strategies. The activities included adaptation of the surveillance system data collection tools, training of health staff, piloting the ISS in Zoba Maekel, and capacity development of the MoH through the provision of computers to facilitate data collection and analysis.
1.2.4. Monitoring and evaluation
The MoLHW is responsible for overall supervision and management of the project. The ministries of Education, Health and Information as well as the Child Well-being Committees at sub-regional level also collaborate with the MoLHW in implementing, following-up and monitoring the intervention. The UNICEF Child Protection Section providing technical guidance to conduct quality assurance and monitor the project. The Child Well-being Committees (CWBCs) and community leaders were also involved in prevention any abuse of the animals.
6
2 EVALUATION OBJECTIVES AND SCOPE
1 EVALUAtiON OBJECtiVES AND SCOPE2
7
2.1 OBJECtiVE
The Project was evaluated from December 2010 through March 2011 by an Eritrean consultant, Ghebremedhin Haile. As per the Terms of Reference (ToR), the overall objective of the evaluation was to assess the effectiveness of, and gaps associated with, the Donkey for School Project in terms of the following intended outcomes:
• improve access of children with disabilities to basic social services in general and schooling in particular;
• protect children from the livelihood pressure of fetching water and firewood; • enhance poor families’ social status within the communities; and • serve as another source of income to vulnerable households.
With the assessment, the evaluator was to make recommendations on how to overcome limitations and improve the programme.
2.2 EVALUAtiON qUEStiONS
Overall, the evaluation was expected to provide answers to the following basic questions regarding implementation of the Donkey for School Project:
• What is the status of project achievements against objectives and planned results compared to the baseline information during project design?
• How effective was the intervention process, operational arrangements, and coordination mechanisms, and project cost effectiveness, etc.
• What are the preliminary effects and immediate impacts of the project to the beneficiary disabled children, including disadvantaged female students and their families?
• What mechanisms have to be put in place to ensure sustainability of the project effects on target beneficiaries?
• What was the outcome of the project including the number of children supported (able to continue their education), especially hard to reach girls and physically disabled children, and 870 at-risk households in remote locations of rural Eritrea.
• How many communities were aware, sensitized and mobilized on the right of the child specifically the right of disabled child to schooling?
• What is the enrolment, retention and completion rates of the beneficiary children in schools and dropout rates from school due to far distances from home to school?
• What changes were generated by the project in the level of income and economic assets of vulnerable families and quality of life of children?
• Has the project reduced incidence of children engaged in household chores which prevented them from attending school?
The evaluation was also intended to assess project relevance, efficiency, impact and sustainability (ToR is attached as Annex 2).
8
2.3 REPORt StRUCtURE
The first part is the executive summary which provides overview of the evaluation objectives and methodology, and highlights of the main findings, conclusions and recommendations. Part two deals with the object of the evaluation which briefly describes project context and project logic while part three discusses the purpose, objectives and scope of the evaluation. Part four outlines the approach and methodology followed for undertaking the study, and part five presents the main findings of the evaluation including lessons learned. The final section comprises conclusions and recommendations.
9
3 EVALUATION METHODOLOGY
1 EVALUAtiON MEtHODOLOGY3
10
The evaluation methodology involved a combination of desk review and field study to collect both primary and secondary data. It was conducted in close consultation with the MoLHW and UNICEF. The evaluation methodology and survey instruments prepared by the consultant were reviewed by the MoLHW and UNICEF, and comments received were thereafter incorporated into the revised tools. The approach and methodology followed to carry out the evaluation is briefly described below.
3.1 DESK REViEW
A desk review was conducted to collect and analyse information from available documents related to the project (list of documents reviewed is attached as Annex 5). These documents were obtained from different organisations including MoLHW, MoH, MoE, local administration offices at regional and sub-regional levels, UNICEF, schools, etc.
3.2 FiELD StUDY
The field study involved both quantitative and qualitative approaches carried out by administering both structured and open-ended questionnaires.
3.2.1 qUALitAtiVE SURVEY
Qualitative data were collected to respond to the key evaluation questions by conducting individual key informant interviews and focus group discussions. These instruments were employed to help capture information related to project relevance, efficiency, effectiveness, impact and sustainability. These research instruments are briefly described as follows.
(a) Key informant interviews (Kiis)
Key informant interviews were conducted to gather data on various project-related issues including the following: participation and performance of beneficiaries in schools; sources of livelihood of households; knowledge, attitudes, and practices of community members on issues related to child rights and the rights of children with disabilities; the relative importance of the project in enhancing the livelihood base of the beneficiary families; and to identify problems encountered in project implementation. It also attempted to assess the project in terms of its approach, strategy, design, target group, targeting, implementation arrangements, community participation, roles and responsibilities of different stakeholders, etc. Key informants including MoLHW management and staff, UNICEF staff, local government officials at regional and sub-regional levels, and community members(MoLHWregional branch heads, regional social affairs department heads, sub-regional administrators, sub-regional social affairs unit heads, sub-regional education unit heads, Child Wellbeing Committee members, Community-Based Rehabilitation Workers (CBRW), teachers, school directors, and kebabi administrators). A total of 94 persons were interviewed as key informants.
11
(b) Focus group discussions
Focus group discussions were conducted to assess the views of different sections of the communities about project achievements and benefits, impacts, and their attitude towards those living with disabilities. The discussants include village administrators, school administrators, teachers, parent-teacher association (PTA) members, beneficiaries, National Union of Eritrean Women representatives, CBRWs, village development committees, community elders, etc. The focus group discussions involved a total of 117 participants, comprising both males and females. Discussion guides were prepared and administered in conducting focus group discussions.
3.2.2 qUANtitAtiVE SURVEY
Quantitative data were collected at household level by interviewing household heads and their children using structured questionnaires to capture project’s educational and livelihood impacts in terms of the indicators articulated in the project document. The sampling methodology adopted for the study is presented as follows.
(a) Sampling frame
The evaluation survey was conducted throughout the country where project implementation took place. The list of sub-regions and villages covered by the project with their number of beneficiaries served as the sample frame.
(b) Sample design
The sample design for the study was developed to provide a representative sample of households and to achieve high cost efficiency as well as operational convenience in collecting data to get reliable estimates on the evaluation objectives at national level. The evaluation adopted a two-stage cluster design. At the first stage, sub-regions were used as the primary sampling units (PSU), while at the second stage, beneficiaries were used as the secondary sampling units (SSU).
(c) Sample size
The sample was designed to get reliable estimate of the variable of interest of the study at the national level. There was no prior reliable estimate of the variable of interest in the project areas which can be used to determine the required sample size. Therefore, in order to get reliable estimate of the indicators for the evaluation survey, an overall sample size of 283 beneficiaries was selected (details of the sampling methodology is included as Annex 3).
With an intake of 5-15 beneficiaries from each sub-region, 28 sub-regions were selected from the total of 46 sub-regions (61% of the total number of sub-regions in Eritrea) covered by the “Donkey for School Project”. The 28 sub-regions are 6 from Anseba, 6 from Debub, 5 from Gash-Barka, 4 from Northern Red Sea, 4 from Maekel, and 3 from Southern Red Sea region.
12
(d) Sample selection (clusters and households)
As mentioned earlier, the sample for the survey was selected using a stratified two stage cluster sample design. In each region, clusters or sub-regions were selected at the first stage of sampling and beneficiaries at the second stage of sampling. Sub-region selection was systematically done based on the list of sub-regions with their number of beneficiaries. The list of selected villages for the study is provided in Annex 3.
In each selected sub-region, the secondary sampling units (beneficiaries) were selected using systematic random sampling from the list of beneficiaries in the selected sub-region which was provided by the MoLHW. The following procedure was used to select the sample of households for the survey.
1. The sub-region sample size is first allocated proportionally among the female and male beneficiaries.
2. Linear Systematic Random Sampling (LSRS) methodology was used to select the sample households from the list of the households available in each zoba.
3.3 DAtA COLLECtiON
A set of questionnaires were administered to collect both quantitative and qualitative data (Annex 4). Open-ended questionnaires were administered to gather qualitative data while a structured questionnaire was developed to collect quantitative data from household heads and their beneficiary children on the following:
1. Demographic information of household members (sex, marital status, occupation, educational status, disability status).
2. Educational attainment, dropout, and repetition of household members of school ages.
3. Educational performance of supported children.4. Household’s access to water and other basic social services.5. Knowledge, attitude, and practice (KAP) on issues related to rights of children in
general and rights of children with disability in particular.6. Livelihood (asset holdings and source of household income).7. Use and physical condition of the donkeys.
Fieldwork for the study was carried out over a period of three weeks (20 January to 12 February 2011). A total of 10 field staff consisting of 8 interviewers and 2 supervisors were recruited and trained for one day on how to administer the study instruments. The field staff was organised into two teams and each team covered three regions.
As the beneficiaries were scattered across 46 sub-regions and in over 170 villages, which was far greater than what was indicated in the ToR (30 communities), agreement was reached with the MoLHW to bring the sample respondents to one or two central locations within the selected sub-region.
The following activities were carried out as quality control measures.
a) Qualified field supervisors and data collectors who have sufficient experience in the area were recruited for the survey.
13
b) Well-organised and thorough orientation and training was given to the field staff by the consultant and programmer before going to the field.
c) Adequate lead time was given to the concerned staff of the MoLHW about the selected villages and beneficiaries to allow them make the necessary field arrangements on time so that the field survey would be completed as planned without compromising the data quality.
d) Intensive field supervision and editing of the completed questionnaires was made during data collection.
e) Local administration officials and other participants were informed about the objective of the evaluation and its implementation procedures. This was done to secure their willingness to participate in the survey as well as encourage them to freely air their views about the project.
3.4 DAtE ENtRY, PROCESSiNG AND ANALYSiS
The data entry process started with manual editing of the completed questionnaires. This was followed by data entry into computers using an entry programme that was developed using the CSPro version 4.0 (census and survey processing system) software package. All completed questionnaires were entered twice for verification purposes. As part of final data cleaning and editing processes, two distinct phases of data file data editing were implemented both during data entry and after data entry. During the data entry stage, editing of data involved looking at the structure of the data file, questionnaire skip patterns, and the range of valid values for each data field.
After data entry, consistency checks were made in order to verify the internal consistency of information collected throughout the questionnaire. The Statistical Package for the Social Sciences (SPSS 18) was used to analyse the quantitative data.
3.5 LiMitAtiONS OF tHE StUDY
The limitations of the study included the following:
(a) The auxiliary information on the sampling frame (the list of children) such as age, grade and sex were missing for some of the children. This affected the allocation of the sample of beneficiary children by age, sex and grade. It also resulted in a situation where age, grade and sex of some of the selected children were not known beforehand.
(b) The study covered household respondents found in over 170 villages which were scattered across 46 sub-regions of the six regions. As a result, survey respondents and focus group discussants and some key informants had to travel long distances to avail themselves for interviews in selected central locations. Even though this has greatly facilitated the field survey and resulted in its timely completion, it had required additional financial resources to pay per diems to survey respondents to cover transportation and food costs.
(c) Some respondents appear to have shown the tendency to understate their income levels probably due to fear of being left out from future support that may come from the Government or its development partners. Some also had difficult remembering
14
the amount of income earned from different sources due to their low educational levels and/or absence of records. This has an effect on the assessment of economic impact of the project.
(d) The absence of baseline data on important Project indicators affected the evaluation as there were no benchmarks against which survey results could be compared to assess project impacts.
However in the opinion of the consultant, these limitations do not affect the validity of the findings of the evaluation.
4 FINDINGS
15
1 FiNDiNGS4
16
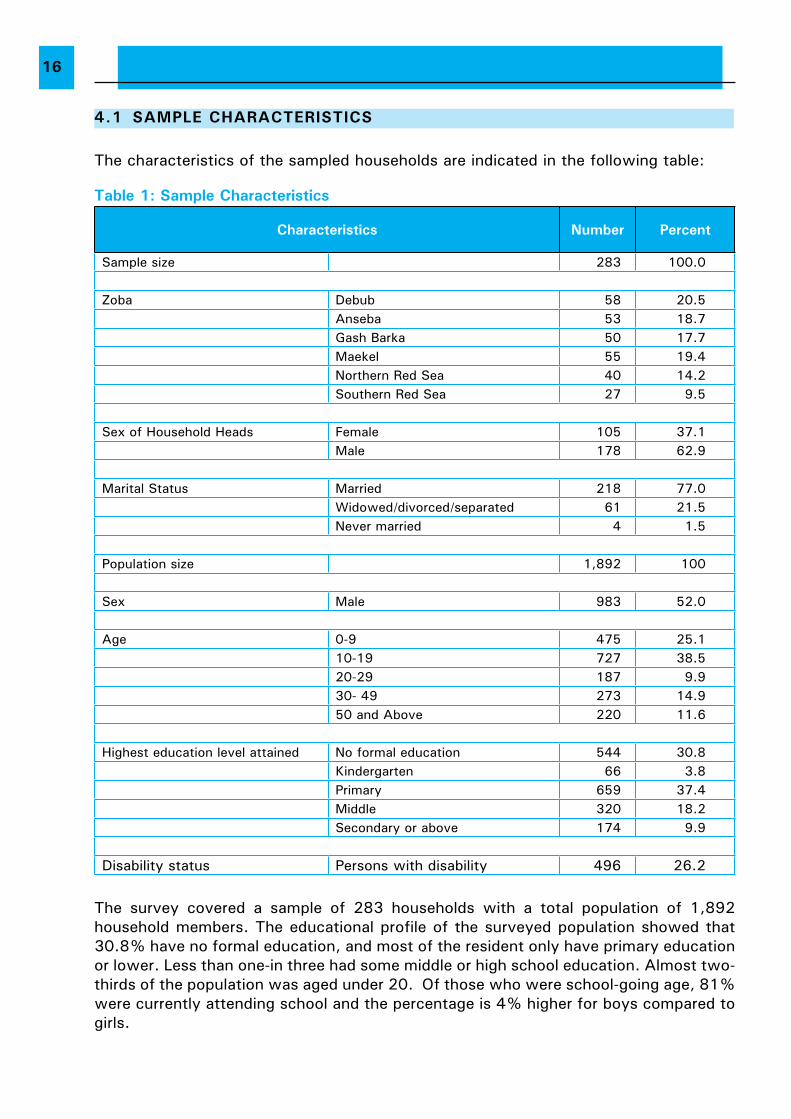
4.1 SAMPLE CHARACtERiStiCS
The characteristics of the sampled households are indicated in the following table:
table 1: Sample Characteristics
Characteristics Number Percent
Sample size 283 100.0
Zoba Debub 58 20.5Anseba 53 18.7Gash Barka 50 17.7Maekel 55 19.4Northern Red Sea 40 14.2Southern Red Sea 27 9.5
Sex of Household Heads Female 105 37.1Male 178 62.9
Marital Status Married 218 77.0Widowed/divorced/separated 61 21.5Never married 4 1.5
Population size 1,892 100
Sex Male 983 52.0
Age 0-9 475 25.110-19 727 38.520-29 187 9.930- 49 273 14.950 and Above 220 11.6
Highest education level attained No formal education 544 30.8Kindergarten 66 3.8Primary 659 37.4Middle 320 18.2Secondary or above 174 9.9
Disability status Persons with disability 496 26.2
The survey covered a sample of 283 households with a total population of 1,892 household members. The educational profile of the surveyed population showed that 30.8% have no formal education, and most of the resident only have primary education or lower. Less than one-in three had some middle or high school education. Almost two-thirds of the population was aged under 20. Of those who were school-going age, 81% were currently attending school and the percentage is 4% higher for boys compared to girls.
17
The distribution of household heads by marital status showed that three-quarters were married, 21.5% were widowed, divorced, or separated, and 1.5% were never married. Tigrinya ethnic group accounted for 47%, Tigre for 35.8% while the remaining seven ethnic groups represented 17.2% of the household heads.
Persons with disabilities accounted for 26.2% of the total surveyed population aged 5 and above, and was higher for males (31.7%) than females (20.2%). Of the total population, 18.9% have difficulties in walking or climbing steps or hills, 4.5% in seeing, 3.7% in hearing, 2.8% in remembering or concentrating, 6.5% in self-care (e.g. washing or dressing, feeding, going to the toilet, etc.), and 4% in communicating (e.g. understanding others or being understood by others) because of physical, mental or emotional health problems.
The common causes of disabilities among supported children are illness (42.1%), accident (12.5%), landmines(2%), other (3.6%), and the remaining were born with disability (39.8%).Of those who were not born with a disability, 66.1% were disabled before reaching the age of five, 20.9% between five and nine years of age, and the remaining 13% when they were ten years of age or above. This finding is in line with the results of the situation analysis study12 of the MoLHW which states that the major disability causing factor in Eritrea is disease which caused more than one-third disability (36.9%), followed by injury (12.5%), war (9%), falling (6.8%), accident (5.3%), stress/depression, etc. (1.95%) and not known (27.4%).
Female-headed households (FHHs) accounted for 37.1% of the total surveyed households. The household size of the sampled population ranges from 1 to 14. Mean household size is 6.7 and is higher for male-headed households (7.4) compared to FHHs (5.5), indicating that male-headed households (MHHs) are better resourced in terms of labour which is highly crucial for households engaged in agriculture.
Household access to basic socio-economic facilities is measured in terms of the distance travelled to reach the facility. Distance is determined based on the respondent’s estimation of the time he/she needs to reach the facility. Respondents who travel more than 30 minutes to reach primary, middle and secondary schools accounted for 24.2%, 57.1% and 78.8% respectively. Almost two-third of the households travel for more than 30 minutes to reach a health facility. Access to public transport is limited and about 45% of the respondents have to travel for more than 30 minutes to reach a place where they can secure public transport.
4.2 PROJECt StAtUS
Project progress to deliver planned results at the time of the evaluation was satisfactory. It has produced most of the planned outputs, and it is making progress towards achieving the remaining outputs. Project achievements were discussed against planned results which are: (i) improving access to, and quality of education; (ii) community empowerment; and (iii) injury surveillance system and capacity development.
12 Situational Analysis of Persons with Disability, Ministry of Labour and Human Welfare, 2009, Asmara, Eritrea.
18
4.2.1 iMPROViNG ACCESS tO, AND qUALitY OF, EDUCAtiON
This result was planned to be delivered through the implementation of the following interventions.
(a) Distribution of donkeys and accessories
By distributing 876 donkeys and accessories, the project has exceeded its initial plan of distributing 870 by a small margin. Of the total beneficiaries, females accounted for 35%. The selection process began with the identification of poor households whose disadvantaged children (girls and those living with disability) were attending school. Listing was conducted by CBRWs in the village. CBRWs submitted their lists to the Kebabi Committee for Persons with Disabilities to be reviewed based on the severity of mobility problems of the children and poverty status of the households. The Kebabi Committee for Persons with Disabilities is composed of the village administrator (chair), CBRWs, a representative from the National Union of Eritrean Women, and village development committee members. The Committee then forwards its list of eligible beneficiaries to the MoLHW sub-regional office for further screening, which is done together with the sub-regional Child Well-being Committee or sub-regional Committee for Persons with Disabilities. Once this process is completed, the list of beneficiaries is finalised and communicated to the MoLHW regional office and through it to the head office for final approval.
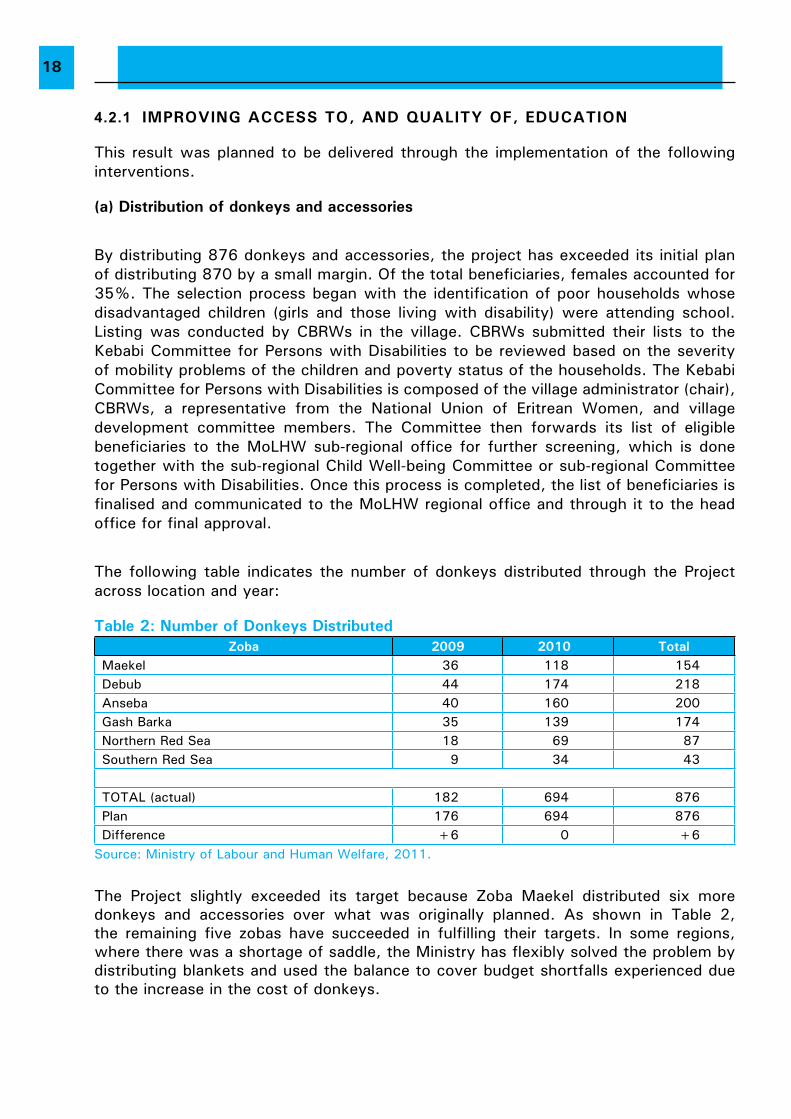
The following table indicates the number of donkeys distributed through the Project across location and year:
table 2: Number of Donkeys DistributedZoba 2009 2010 total
Maekel 36 118 154Debub 44 174 218Anseba 40 160 200Gash Barka 35 139 174Northern Red Sea 18 69 87Southern Red Sea 9 34 43
TOTAL (actual) 182 694 876Plan 176 694 876Difference +6 0 +6
Source: Ministry of Labour and Human Welfare, 2011.
The Project slightly exceeded its target because Zoba Maekel distributed six more donkeys and accessories over what was originally planned. As shown in Table 2, the remaining five zobas have succeeded in fulfilling their targets. In some regions, where there was a shortage of saddle, the Ministry has flexibly solved the problem by distributing blankets and used the balance to cover budget shortfalls experienced due to the increase in the cost of donkeys.
19
By solving mobility problems of the beneficiary children, the support has contributed to reduced dropouts and improved school attendance. Of the total population in surveyed households aged 4-29 years, a higher percentage (85.2%) of the children with disability are attending school compared to non-disabled (79.1%), indicating the role played by the project in motivating supported children to go to school as well as encouraging parents to send a disadvantaged child to school. It is important to note that parents were informed that they would be allowed to keep the donkey as long as the supported child was attending school, though no evidence was found to prove that support was withdrawn for families whose children have dropped out of school.
The distribution of donkeys and accessories was delayed in certain project areas due to the rise in the cost of donkeys and a shortage of skilled accessory suppliers. Key informants in certain areas felt that the time frame allocated for the procurement and distribution of donkeys and accessories, including the identification of children and families that needed support, was inadequate. They called for more time to be given in future so that they would be able to conduct an exhaustive study to ensure that no eligible child was left out.
(b) School Materials Support to MoE
Getting children with disabilities into the schooling system by helping to overcome some of their mobility problems is simply the starting point for improving their access to education. As per policy, it is important that this is followed by other interventions such as promoting inclusive education with the aim of addressing the special needs of children with disabilities to help them fully develop their potential. Inclusive education is concerned about those children, youth and adults who are not provided with their right to education; and developing such an education system that accommodates and responds to diversity of all learners13.
The Government has implemented several important measures to promote inclusive education policy and strategy, including training of school directors and teachers on inclusive education, sensitising community members and leaders on child rights in general and rights of children with disabilities in particular, and construction of Inclusive Education Resource Centres in 25 selected primary schools across all regions. Despite these efforts, challenges remain for children with disabilities. Infrastructure in schools, for example, is not yet friendly to those with physical disabilities. The survey found that close to two-third (65.6%) of children with disabilities said that the school facilities were not appropriate to their needs.
The policy on inclusive education highlights the need for collaboration and effective co-operation among all actors within and outside the education sector in order to ensure that the needs of currently disadvantaged groups are duly considered and that resources are put in place to address those needs. Accordingly, the Project has positively responded to this by supporting inclusive education training provided to787 teachers and directors from 100 schools in all regions. Teachers and directors interviewed during the field survey indicated that the training improved their knowledge and awareness about inclusive education, and they said that they have now better understanding on how to address the special needs of children with disabilities, though the existing school
13 Policy and Stragtegy on Inclusive Education in Eritrea, Ministry of Education, December 2008.
20
environment makes the application of what they have learned quite challenging.They also said that they still need additional support in the area of inclusive education training so that they would prepare themselves better to help children with special needs.
In addition to providing donkeys and accessories, the project supported the procurement of learning aids which are yet to be distributed to the Inclusive Education Resource Centres in selected schools. As part of improving the quality of education of vulnerable children, the Project targeted Abraha Bahta Blind School in Asmara for its support. Accordingly, Braille paper was purchased to be distributed to the school, but at the time of the evaluation this had yet to take place. Consequently, the effect of this support on the schooling of blind children is yet to be seen.
4.2.2 COMMUNitY EMPOWERMENt
One of the planned results of the Project was the empowerment of communities and duty bearers on child rights in general and the rights of children with disabilities in particular. Accordingly, a total of 1,560 community members including village administrators, community leaders, parents, teachers, directors, educational officers, and students were reached via Project outreach activities. This figure does not include the large number of people reached through the mass media (both broadcast and print media).
The messages mainly focused on child rights, the rights of children with disabilities and their participation in school, female genital mutilation, and the role of communities in project implementation. Outreach was conducted in all six regions in the form of workshops and meetings held at village, kebabi, sub-regional and regional levels. The MoLHW, the Child Well-being Committees, local administration officials and staff, and CBRWs conducted outreach activities. CBRWs mostly used village meetings as their main platform to sensitise their communities about child rights and the rights of the children with disabilities. Schools conduct sensitisation programmes at least twice a year specifically at the beginning and middle of the school year. According to key informants and focus group discussion participants, the most effective sources of information with respect to behavioural change were MoLHW staff and CBRWs. By virtue of their positions, school directors and teachers tended to command greater influence on the behaviour and attitudes of their students towards children with disabilities, and as a result have been instrumental in encouraging non-disabled children to extend their support to those who are disabled.
Although no baseline data exist with respect to the knowledge, attitudes and practices of community members, the qualitative survey indicated that sensitisation activities supported by the project resulted in improved community awareness on issues related to barriers and challenges faced by children with disabilities and disadvantaged girls to access education. During the field visits, focus group discussion participants repeatedly stressed that if disabled children were given access to education, they could be as productive as any other member of the society unless they have mental or intellectual disabilities. Many believed that the only thing these children needed was material support and moral encouragement. They further explained that, because of the particular situation of Eritrea, the society gives high value to persons with disabilities because of the sacrifice they made for the liberation of the country.
21
The overwhelming majority of the respondents involved in the qualitative survey thought that isolation of children with disabilities from the rest of the society was uncommon. They believed that it was only practiced by a small percentage of families, mainly those in the rural areas with low educational background. They further said that parents who used to hide their children with disabilities in the past are now openly talking about the situation of their child in village meetings. Convinced that education will prepare them for a better future most parents, especially those who are young, better educated from in urban areas, encouraged their physically-challenged children to go to school. Many believed that the extent of stigmatisation and isolation was on the decline, but called for intensifying outreach to ensure that these gains were not lost.
4.2.3 iNJURY SURVEiLLANCE SYStEM (iSS) AND CAPACitY DEVELOPMENt
The support provided to the MoH was aimed at the development of an injury surveillance system (ISS). This component was implemented by the Ministry of Health with support from UNICEF, the World Health Organization (WHO), the Eritrean Demining Authority (EDA) and other partners. The ISS was intended to gather information on the causes, intent, mechanism and effects of injuries in order to develop appropriate strategies for prevention and treatment.
Data on injuries were collected using a generic tool and guideline manual developed by the Centers for Disease Control and Prevention (CDC) in the United States. The monitoring forms were adapted to Eritrean circumstances before being administered to make them appropriate to the Eritrean context. This was followed by a five-day training of trainers (TOT) conducted for thirty staff members of MoH, WHO, EDA and health facility staff from Zoba Maekel. Those who participated in the TOT in turn trained 270 health workers.
Following the training, the ISS was piloted in Zoba Maekel and data collection was conducted for one year. Data collected were analysed with the support of a technical expert provided by WHO. Based on the outcome of the data analysis, the decision was made to expand the ISS in two other regions(Gash Barka and Debub) in 2011. These two regions were prioritised because of the presence of high numbers of landmines. This was confirmed by the Situational Analysis Report of the MoLHW which shows that the most landmine affected region was Debub, followed by Gash Barka, Anseba, Northern Red Sea, Maekel and Southern Red Sea regions14.
As part of the capacity development component of ISS, the Project provided fifteen computers to the MoH to facilitate data collection and analysis on injury. Supervision support was also provided to monitor data collection at participating health facilities in Zoba Maekel. As a result of this support, the MoH has strengthened its capacity and is now in a better position to establish an injury surveillance system at a national level, which is highly crucial for the development of evidence-based injury prevention and treatment strategies.
14 Situational Analysis Report on Persons with Disbaility, MoLHW, 2009.
22
4.3 PROJECt DESiGN StAtUS
The Donkey for School Project was designed within the framework of the Common Country Assessment and the 2007-2011 United Nations Development Assistance Framework15. Evaluation findings suggest that the Project was logically structured as it encompassed interventions that combined improved access of disabled children and girls to education with the provision of donkeys to lessen the burden of children and others at home. The project has placed the child at the centre of the Project, and attempted to address the physical and social barriers that prevented him/her from accessing education through integrated interventions. By providing direct support to help improve the economic status of households, and combining this with outreach activities aimed at improving attitudes, the Project helped overcome some of the challenges facing disabled children and their caregivers.
This was not done mainly due to lack of effective coordination mechanism at central and regional levels. The involvement of Child Wellbeing Committees in project implementation and monitoring has not been up to the desired level. Monitoring activities were also affected at regional and sub-regional levels mainly due to inadequate transport facilities.
The major weakness observed in project design was related to the absence of baseline data disaggregated by gender, age, and type of disability which has greatly affected monitoring and evaluation activities. Tracking progress is easier for activities, outputs and outcomes that are well supported with good baseline data and reasonable, well-established targets. The Project suffered from insufficient baseline data and this was assessed as the weakest spot of the project design. [Another important gap observed in project design was the absence of project assumptions and risks. It was important to have ensured that all major assumptions and risks associated with the Project were identified and properly defined from the outset so that project implementers would be aware of the potential risks and develop appropriate risk mitigating measures ahead of time. For example, had the project identified the risk associated with the rise in the cost of donkeys at the project formulation stage, a contingency budget could have been set aside to mitigate these effect.
4.4 RELEVANCE
The Project intended to address the mobility problems of disabled children and reduce their household burdens. The objectives of the Donkey for School Project were consistent with UNDAF objectives/outcomes and UNICEF Country Programme Action Plan (CPAP). The project supported
The government efforts aimed at meeting its international commitment namely achievement of MDG 2: Ensure that all boys and girls complete primary school. It is also well aligned to relevant policies and strategies of the MoE including the Inclusive Education Policy and Strategy which is, among others, aimed to improve access of vulnerable children to schooling. It is also aligned to the policy of the Government which makes education for children “a human right”, and states that all children are entitled to get equal educational opportunity irrespective of their ethnicity, language, sex, religion, disability, and status16. 15 Provide a reference for each16 Second and Third Consolidated Reports of the Convention on the Rights of the Child, Ministry of Labour and
23
Based on evaluation findings, including feedback from the children and families reached, the Project as a whole is evaluated as of high relevance to the beneficiaries because it addressed their immediate needs such as solving mobility problems of their children and reducing the burden of household activities. It helped children with disabilities, both boys and girls, to continue attending school.
A large majority of beneficiary households were among the poorest and most vulnerable segments of the population, with few capital assets and, as a result, reliant on their own labour for a variety of household responsibilities. By providing the donkey support, the project eased household burdens associated with of fetching water and firewood from long distances, transporting goods from and to the market, taking crops to flour mills, and transporting harvests on time.
Project relevance was especially evident in rural areas, where transport alternatives are limited, and domestic burdens high. Respondents to the qualitative survey felt that the donkeys worked for rural areas, but less so for urban areas, where bicycles and wheelchairs were felt to be more relevant.
4.5 EFFiCiENCY
Efficiency was measured through addressing outputs compared to inputs. The project is implemented by the MoLHW, with implementation support from the health and education ministries. The MoLHW has overall responsibility for project implementation, while the MoH was mainly engaged in the establishment of Injury Surveillance System (ISS), and the MoE was involved in activities related to training of school directors and teachers, and the supply of learning materials.
As implementing agencies, these government bodies were responsible for achieving expected results through effective process management. The Project is implemented through existing government structure at central, regional, sub-regional and kebabi levels rather than creating a parallel structure. This arrangement has given the Project access to government and community resources (human and physical). Findings from the evaluation suggest efficient Project management through these structures, with rapid implementation through these structures.
As already indicated, the Project has delivered most of the planned outputs. Total Project expenditure as of March 31, 2011 was US$643,253, or 83% of the total Project allocation of US$775,960. According to implementing actors, the balance budget of US$132,707 will be utilised to implement planned activities during the remaining period of the Project. As the remaining activities are similar to those already implemented, it is highly likely that they will be completed before the end of the Project. This however requires enhanced collaboration among project partners especially in the area of joint planning, implementation, supervision and monitoring.
Human Welfare, Asmara, December 2006.
24
The participatory approach followed by the MoLHW and its partners to implement the Project has resulted in improved project efficiency. By allowing communities to take part in project implementation and follow up, the project increased communities’ sense of ownership. CBRWs made an important contribution by serving as a crucial link between the project and beneficiary communities. They also served as a source of information for the MoLHW sub-regional staff who were unable to conduct regular visits to the villages due to transportation problems. They selected Project beneficiaries, procured the donkeys and accessories, and conducted follow-up visits.
It was implemented in a transparent manner which was proven by the very high level of direct involvement of the beneficiaries (94.1%) in the actual purchase of donkeys. Consequently, almost all households (90%) have expressed their satisfaction with the physical condition of the donkeys provided.
The project has addressed mobility problems of disabled children in an appropriate way using locally available resources-donkeys the and accessories that can be procured and maintained at an affordable cost.
The project resources were properly utilised following government procurement directives and regulations and no irregularities were observed. However, mobility problems faced by government implementing partners at all level have impacted negatively on Project efficiency.
The increase in the cost of donkeys and accessories and shortage of suppliers who manufacture accessories negatively affected Project implementation. This is partly a result of the two-year time gap that has elapsed between proposal writing (2007) and the beginning of actual implementation (2009). This at times required beneficiaries in certain localities to postpone procurement of donkeys until prices went down, settling for less productive donkeys, covering the difference between the budget and actual cost which was roughly 5 to 10% of the price of donkeys, etc.
Joint monitoring of Project activities at all levels (participating ministries, UNICEF, local administrations at all levels, and communities) has generally not been up to the desired level. Collaboration and co-ordination among partners in Project planning, implementation, supervision, monitoring and evaluation has been less effective. The co-ordination mechanism that was initially put in place to facilitate joint co-ordination, monitoring and review did not hold its regular meetings over the past two years. Transportation problems was commonly raised as the main hurdle for not regularly monitoring the Project as planned.
4.6 EFFECtiVENESS
Effectiveness focused on the extent to which the Project achieved its intended objectives. The project has effectively targeted vulnerable children who needed the support most. The type and severity of disability, poverty level and current school enrolment status of the children were the major criteria considered in selecting children for the support. An overwhelming majority (95%) of the respondents said that the process followed to identify beneficiaries was good and actually resulted in helping the neediest and no complaints were heard in this respect during the evaluation.
The project helped the most vulnerable children who come from extremely poor families
25
and most of them have to contend with severe disabilities and great physical, emotional, social and economic hardships. As one key informant has stated it: “Because of their disabilities and poverty, many of the children did not have the chance to attend school or had to drop out of school too early. Without education, it would almost be impossible for these children to ever get jobs, earn money, become independent of their families and lead dignified lives. Thus, we need to give utmost attention to these children, especially girls, so that they would have a good future.”
The Project has two purposes: (i) helping the children to go to school; and (ii) easing the burden of domestic activities for the households with children with disabilities. Almost all key informants agreed that the Project has produced positive effect on both fronts. As one key informant noted: “This project has, without doubt, helped in making the days of these children with disabilities easier than what it would have been without the help. It has eased their travel to school and made it less painful for them. It helped their families ease their domestic activities. And most importantly, it encouraged girls with disability from remote areas to continue their education. I hope the project will continue and include other vulnerable children who have not yet been supported.”
4.7 iMPACt
The impacts produced by the Project are discussed under two headings: 1) schooling impacts; and 2) livelihood impacts. Schooling impacts refer to impacts on enrolment, drop-out, academic performance, and school attendance. Livelihood impacts focus on changes in the socio-economic situation of beneficiary households as a result of the Project, assessed in terms of changes generated in household income, asset holdings, and burden of domestic activities for household members, especially children.
4.7.1 SCHOOLiNG iMPACtS
A. Enrolment
Although the official elementary school age is 7 to 11, children with disabilities are generally enrolled at a relatively older age compared to non-disabled. Of the supported children with disabilities, only 48% were enrolled in school within the official enrolment age range for ages 4-7, while 29.3% of them were enrolled when they were 8-9 years old and the remaining 22.7% started school when they were ten years old or above. The percentage of girls with disabilities who were enrolled within the age range of 4-7 is lower (44.9%) than that of boys with disabilities(49.4%). Delayed enrolment resulted in significant mismatch between the ages and grades of children with disability as 72% of them are currently doing lower grades as compared to their age.
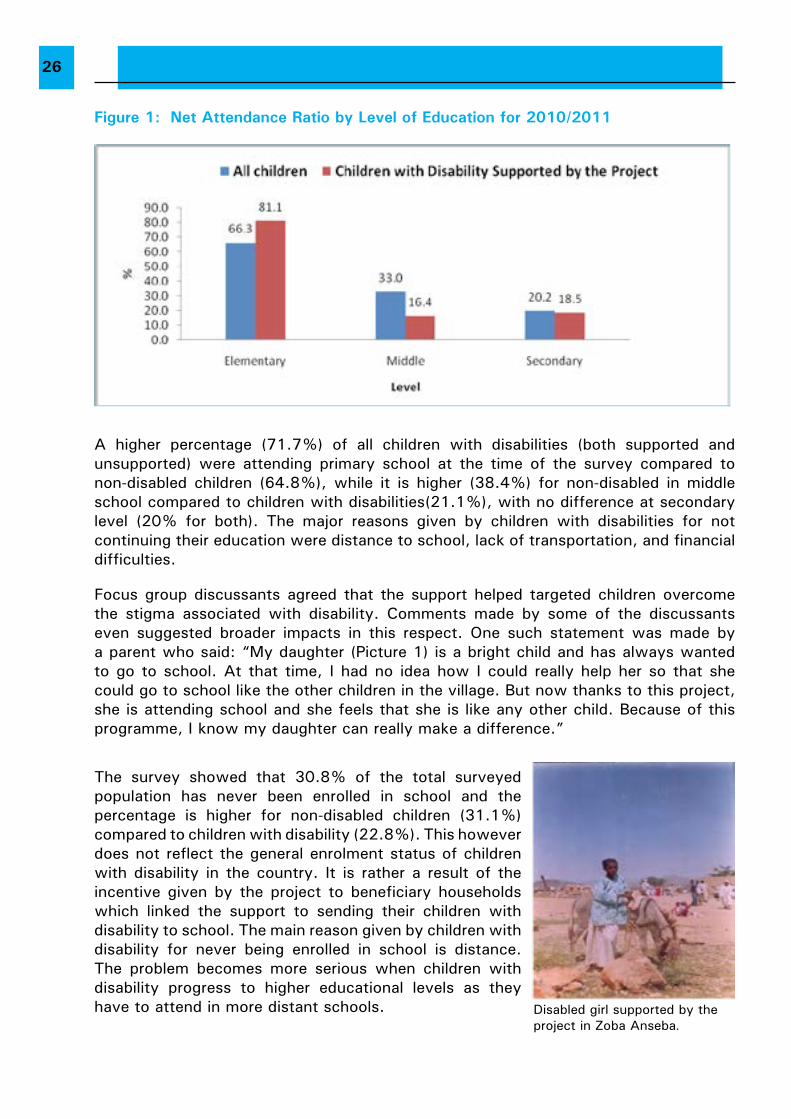
According to the study, net enrolment rates (NER) for all children (both disabled and non-disabled) in the surveyed population for primary, middle and secondary schools are 66.3%, 33.0% and 20.2% respectively (Fig 1). With the exception of middle school where NER for girls is 13% higher than boys, for the other two school levels NER for boys is about 8% higher than for girls. Figure 1 also shows that NER at primary level is higher for children with disabilities supported by the project (81.1%) compared to all non-supported children in the surveyed population (66.3%), while the reverse is true in middle and secondary schools. The higher NER for supported children at elementary level could be attributed to the project which gave an incentive to parents to send their children to school.
26
Figure 1: Net Attendance Ratio by Level of Education for 2010/2011
A higher percentage (71.7%) of all children with disabilities (both supported and unsupported) were attending primary school at the time of the survey compared to non-disabled children (64.8%), while it is higher (38.4%) for non-disabled in middle school compared to children with disabilities(21.1%), with no difference at secondary level (20% for both). The major reasons given by children with disabilities for not continuing their education were distance to school, lack of transportation, and financial difficulties.
Focus group discussants agreed that the support helped targeted children overcome the stigma associated with disability. Comments made by some of the discussants even suggested broader impacts in this respect. One such statement was made by a parent who said: “My daughter (Picture 1) is a bright child and has always wanted to go to school. At that time, I had no idea how I could really help her so that she could go to school like the other children in the village. But now thanks to this project, she is attending school and she feels that she is like any other child. Because of this programme, I know my daughter can really make a difference.”
The survey showed that 30.8% of the total surveyed population has never been enrolled in school and the percentage is higher for non-disabled children (31.1%) compared to children with disability (22.8%). This however does not reflect the general enrolment status of children with disability in the country. It is rather a result of the incentive given by the project to beneficiary households which linked the support to sending their children with disability to school. The main reason given by children with disability for never being enrolled in school is distance. The problem becomes more serious when children with disability progress to higher educational levels as they have to attend in more distant schools. Disabled girl supported by the
project in Zoba Anseba.
27
B. Drop-out
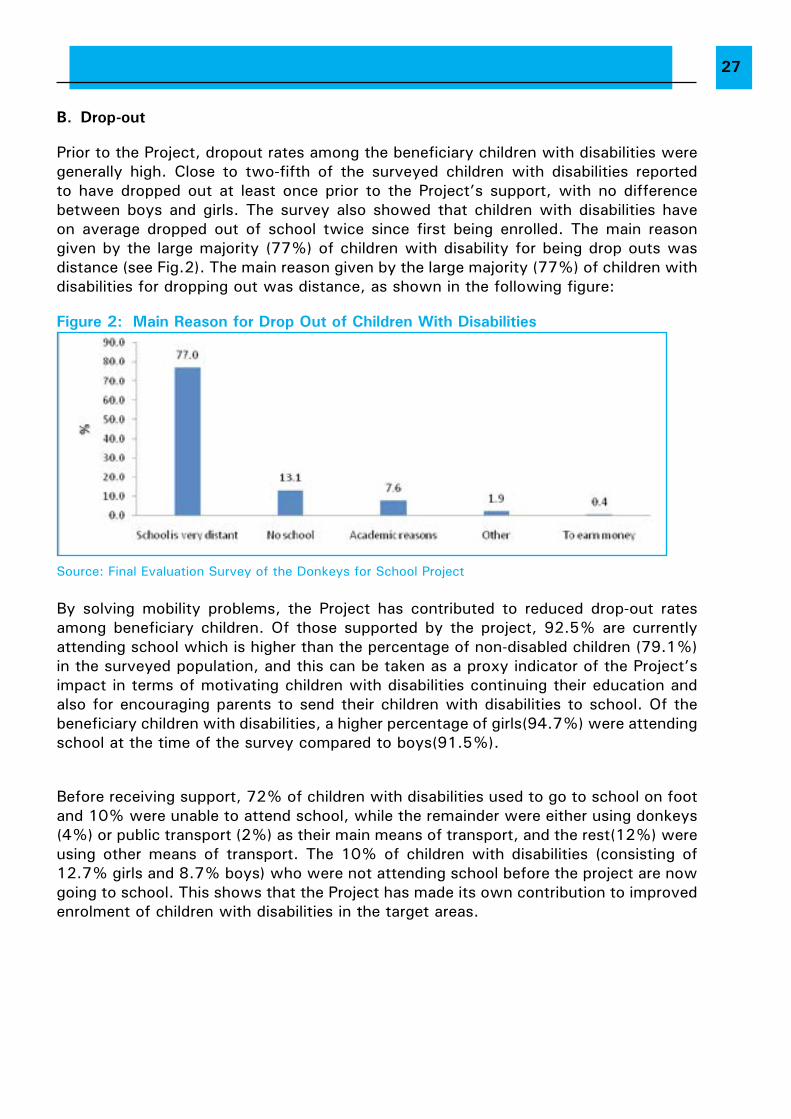
Prior to the Project, dropout rates among the beneficiary children with disabilities were generally high. Close to two-fifth of the surveyed children with disabilities reported to have dropped out at least once prior to the Project’s support, with no difference between boys and girls. The survey also showed that children with disabilities have on average dropped out of school twice since first being enrolled. The main reason given by the large majority (77%) of children with disability for being drop outs was distance (see Fig.2). The main reason given by the large majority (77%) of children with disabilities for dropping out was distance, as shown in the following figure:
Figure 2: Main Reason for Drop Out of Children With Disabilities
Source: Final Evaluation Survey of the Donkeys for School Project
By solving mobility problems, the Project has contributed to reduced drop-out rates among beneficiary children. Of those supported by the project, 92.5% are currently attending school which is higher than the percentage of non-disabled children (79.1%) in the surveyed population, and this can be taken as a proxy indicator of the Project’s impact in terms of motivating children with disabilities continuing their education and also for encouraging parents to send their children with disabilities to school. Of the beneficiary children with disabilities, a higher percentage of girls(94.7%) were attending school at the time of the survey compared to boys(91.5%).
Before receiving support, 72% of children with disabilities used to go to school on foot and 10% were unable to attend school, while the remainder were either using donkeys (4%) or public transport (2%) as their main means of transport, and the rest(12%) were using other means of transport. The 10% of children with disabilities (consisting of 12.7% girls and 8.7% boys) who were not attending school before the project are now going to school. This shows that the Project has made its own contribution to improved enrolment of children with disabilities in the target areas.
28
C. Academic Performance
Of the total surveyed households whose children were in school during the 2010/11 academic year, 14.2% were repeaters, with no major differences between disabled and non-disabled children, and no difference across boys and girls. Key informants from MoE sub-zoba offices said that children with disabilities how a greater sense of responsibility and dedication in schooling. Their main problem is distance which affects their academic performance due to absenteeism and tardiness. One of the aims of the project is to change this undesirable academic situation of children with disability by solving their mobility problems. It appears that the initiative has already started to make some positive contributions in this respect.
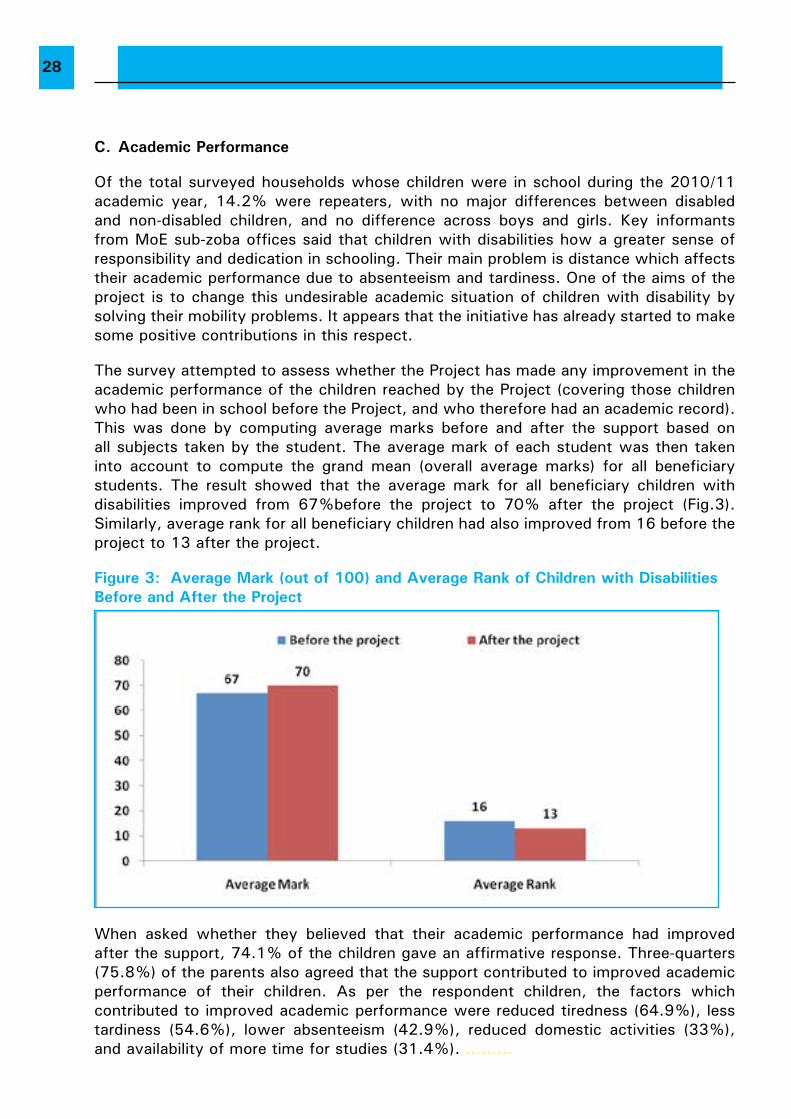
The survey attempted to assess whether the Project has made any improvement in the academic performance of the children reached by the Project (covering those children who had been in school before the Project, and who therefore had an academic record). This was done by computing average marks before and after the support based on all subjects taken by the student. The average mark of each student was then taken into account to compute the grand mean (overall average marks) for all beneficiary students. The result showed that the average mark for all beneficiary children with disabilities improved from 67%before the project to 70% after the project (Fig.3).Similarly, average rank for all beneficiary children had also improved from 16 before the project to 13 after the project.
Figure 3: Average Mark (out of 100) and Average Rank of Children with Disabilities Before and After the Project
When asked whether they believed that their academic performance had improved after the support, 74.1% of the children gave an affirmative response. Three-quarters (75.8%) of the parents also agreed that the support contributed to improved academic performance of their children. As per the respondent children, the factors which contributed to improved academic performance were reduced tiredness (64.9%), less tardiness (54.6%), lower absenteeism (42.9%), reduced domestic activities (33%), and availability of more time for studies (31.4%). ………
29
As indicated earlier, just under three-quarters(72%) of children with disabilities reached by the Project used to go to school on foot prior to the Project, indicating that they were spending considerable time and energy to go to school. The survey showed that 24.8%, 57.1%, and 79.1% of the children travel more than 30 minutes to reach primary, junior and secondary schools, respectively. For a person with a physical disability, these travel times may even be two- or three-fold depending on the terrain, climate and distance. The support reduced average travel time taken by children with disabilities to reach school by almost one-half (that is from 65 minutes to 35 minutes). This significant reduction in travel time contributed to improve deducational performance. It is nevertheless important to note that the support proved to be more useful in the rural areas where donkeys are greatly used by children with disability to go to school and access to other means of transport is limited.
D. Attendance
Children with disabilities who were interviewed as key informants said that they were, on average, missing one or two school days per week prior to the Project and that this has declined after the Project. The study revealed that 83.5% of children with disabilities (86.7% for girls and 82.1% for boys) had no absences from school in the two weeks before the survey. Nevertheless, absenteeism is still much higher for children with disabilities than non-disabled. Absenteeism is generally higher in primary school compared to middle and secondary school. The major reason given by children with disability for being absent from school was illness which is partly a result of their disability (60.7%) while for non-disabled children, it is mainly associated with helping family at home and in business (48.8%).
4.7.2 LiVELiHOOD iMPACtS
A. Economic impacts
Most beneficiaries received donkeys and accessories in 2010. Given the short duration of the Project, it would be premature to expect major socio-economic impacts at the time of the evaluation. However, there are some early indications of Project impacts, elaborated in this section. Where no evidence of Project impacts was found, this is also noted.
The evaluation attempted to assess economic impacts by determining the magnitude and direction of change in household asset holdings. Information obtained from the qualitative survey showed that the households supported by the Project are among the most disadvantaged segments of the population. This is confirmed by the findings of the quantitative survey which showed that most households do not own any livestock. For example, close to two-third of the households do not currently own any cattle or sheep/goat. Similarly, more than half (56.6%) of the households do not own any poultry. Livestock ownership situation of the supported families is very low which is a clear evidence of the project’s effectiveness in targeting the most vulnerable segment of the population.
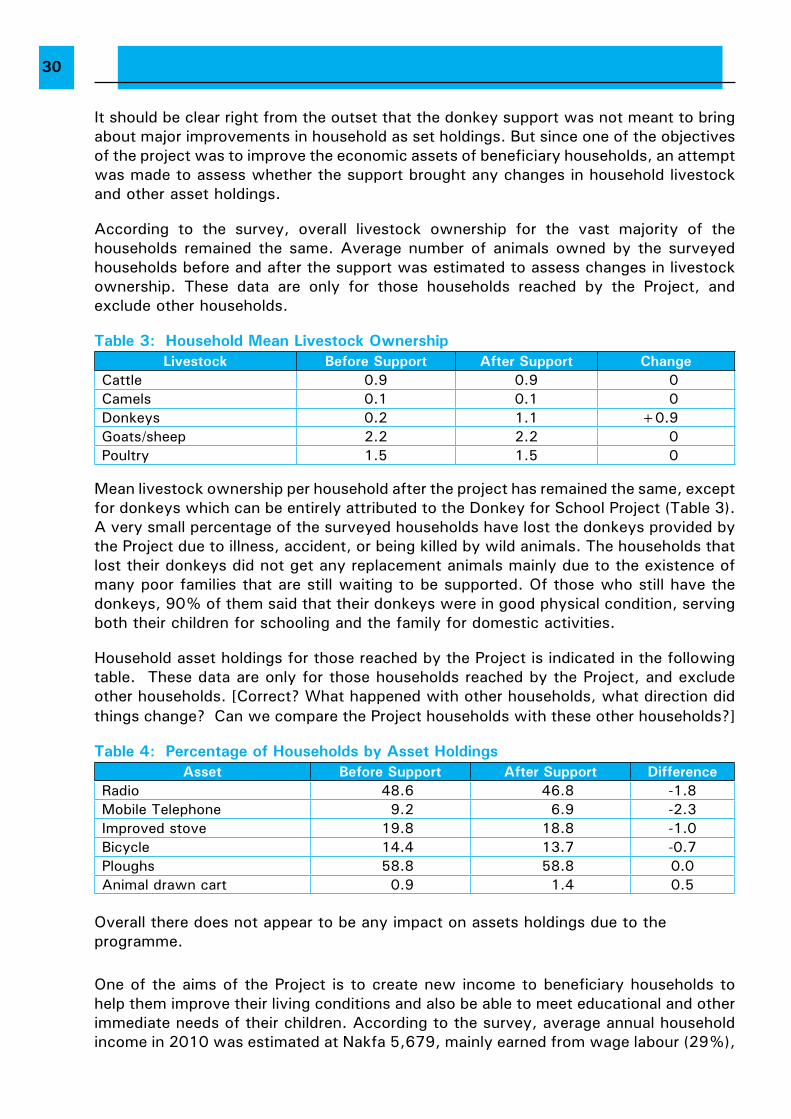
30
It should be clear right from the outset that the donkey support was not meant to bring about major improvements in household as set holdings. But since one of the objectives of the project was to improve the economic assets of beneficiary households, an attempt was made to assess whether the support brought any changes in household livestock and other asset holdings.
According to the survey, overall livestock ownership for the vast majority of the households remained the same. Average number of animals owned by the surveyed households before and after the support was estimated to assess changes in livestock ownership. These data are only for those households reached by the Project, and exclude other households.
table 3: Household Mean Livestock OwnershipLivestock Before Support After Support Change
Cattle 0.9 0.9 0Camels 0.1 0.1 0Donkeys 0.2 1.1 +0.9Goats/sheep 2.2 2.2 0Poultry 1.5 1.5 0
Mean livestock ownership per household after the project has remained the same, except for donkeys which can be entirely attributed to the Donkey for School Project (Table 3). A very small percentage of the surveyed households have lost the donkeys provided by the Project due to illness, accident, or being killed by wild animals. The households that lost their donkeys did not get any replacement animals mainly due to the existence of many poor families that are still waiting to be supported. Of those who still have the donkeys, 90% of them said that their donkeys were in good physical condition, serving both their children for schooling and the family for domestic activities.
Household asset holdings for those reached by the Project is indicated in the following table. These data are only for those households reached by the Project, and exclude other households. [Correct? What happened with other households, what direction did things change? Can we compare the Project households with these other households?]
table 4: Percentage of Households by Asset HoldingsAsset Before Support After Support Difference
Radio 48.6 46.8 -1.8Mobile Telephone 9.2 6.9 -2.3Improved stove 19.8 18.8 -1.0Bicycle 14.4 13.7 -0.7Ploughs 58.8 58.8 0.0Animal drawn cart 0.9 1.4 0.5
Overall there does not appear to be any impact on assets holdings due to the programme.
One of the aims of the Project is to create new income to beneficiary households to help them improve their living conditions and also be able to meet educational and other immediate needs of their children. According to the survey, average annual household income in 2010 was estimated at Nakfa 5,679, mainly earned from wage labour (29%),
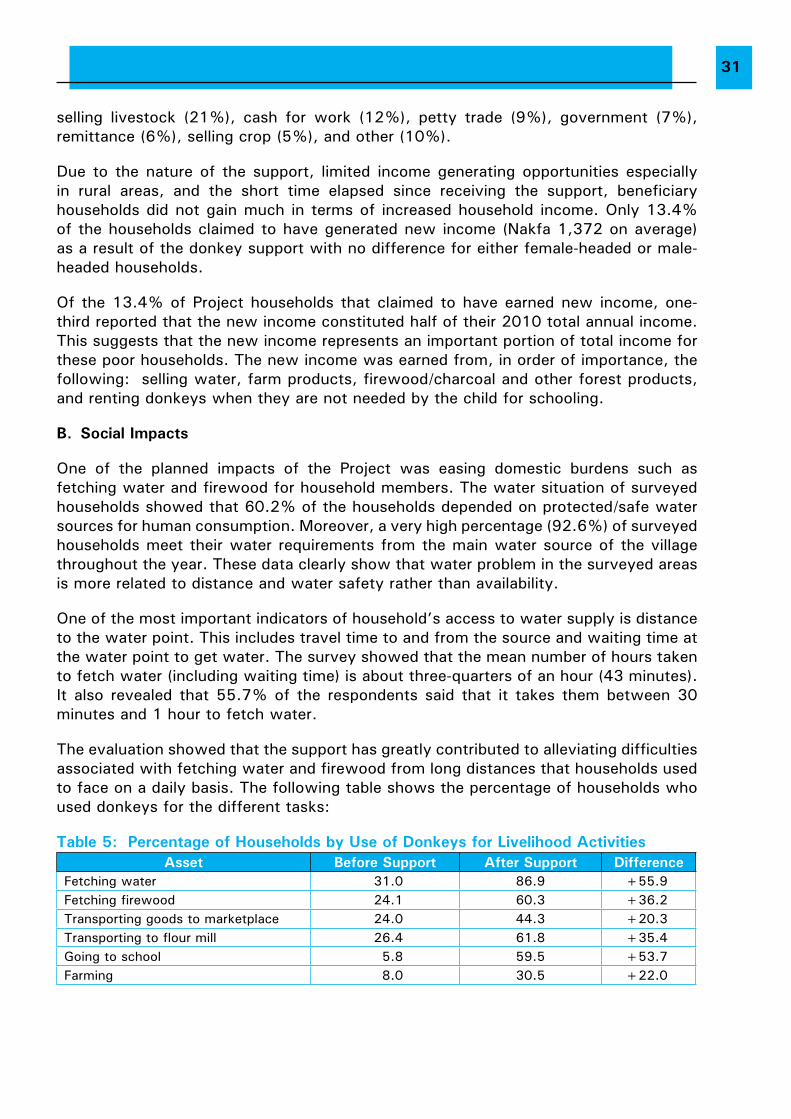
31
selling livestock (21%), cash for work (12%), petty trade (9%), government (7%), remittance (6%), selling crop (5%), and other (10%).
Due to the nature of the support, limited income generating opportunities especially in rural areas, and the short time elapsed since receiving the support, beneficiary households did not gain much in terms of increased household income. Only 13.4% of the households claimed to have generated new income (Nakfa 1,372 on average) as a result of the donkey support with no difference for either female-headed or male-headed households.
Of the 13.4% of Project households that claimed to have earned new income, one-third reported that the new income constituted half of their 2010 total annual income. This suggests that the new income represents an important portion of total income for these poor households. The new income was earned from, in order of importance, the following: selling water, farm products, firewood/charcoal and other forest products, and renting donkeys when they are not needed by the child for schooling.
B. Social impacts
One of the planned impacts of the Project was easing domestic burdens such as fetching water and firewood for household members. The water situation of surveyed households showed that 60.2% of the households depended on protected/safe water sources for human consumption. Moreover, a very high percentage (92.6%) of surveyed households meet their water requirements from the main water source of the village throughout the year. These data clearly show that water problem in the surveyed areas is more related to distance and water safety rather than availability.
One of the most important indicators of household’s access to water supply is distance to the water point. This includes travel time to and from the source and waiting time at the water point to get water. The survey showed that the mean number of hours taken to fetch water (including waiting time) is about three-quarters of an hour (43 minutes). It also revealed that 55.7% of the respondents said that it takes them between 30 minutes and 1 hour to fetch water.
The evaluation showed that the support has greatly contributed to alleviating difficulties associated with fetching water and firewood from long distances that households used to face on a daily basis. The following table shows the percentage of households who used donkeys for the different tasks:
table 5: Percentage of Households by Use of Donkeys for Livelihood ActivitiesAsset Before Support After Support Difference
Fetching water 31.0 86.9 +55.9Fetching firewood 24.1 60.3 +36.2Transporting goods to marketplace 24.0 44.3 +20.3Transporting to flour mill 26.4 61.8 +35.4Going to school 5.8 59.5 +53.7Farming 8.0 30.5 +22.0
32
Before the project, the percentage of households using donkeys to fetch water and firewood significantly increased to 86.9% and 60.3%, respectively compared to 31% and 24.1% before the project (Table 5). This shows that the support has greatly contributed to alleviating difficulties households used to face in carrying out their domestic activities.
A closer look at the data also shows that more of the burden of fetching water is shouldered by children consisting of girls (43.2%), boys (20.2%), both girls and boys (3.6%), while mothers and fathers accounted for 26.8% and 3.8% respectively and others are represented by 2.4%. As collecting water is primarily the responsibility of women and children (94%), the initiative has played a vital role in relieving women and children from this hard work. The majority of the survey respondents believed that the support has generated multiple benefits for households including reducing water fetching time (86.5%), solving firewood collecting problems (76.6%), increasing leisure time (88.8%), and allowing children to go to school (63.3%).
Regarding the Project benefits, one key informant from Gheleb has stated that: “Owning a donkey in this area is tantamount to owning a truck in cities. Thus, the provision of donkeys to families of children with disability is highly appreciated not only by beneficiary households but also by the entire community. In the past, beneficiaries were depending on others whenever they needed a donkey to carry out their livelihood activities which was quite humiliating for them. But now as a result of the support, they are not only relieved from borrowing a donkey from others but are also able to lend their own donkey to others and this has improved their social status in their respective communities.”
C. Community Empowerment
According to the key informants, community awareness about child rights and the rights of children with disabilities has significantly improved over time. They said that many parents in the past used to believe that children with disabilities would never earn a living or contribute to the upkeep of the family like non-disabled children. Sending them to school was therefore considered a waste of time and money. Still others believed that disabilities were a curse or punishment from God, and hence was a disgrace to the family. As a result, children with disabilities were often kept at home and generally isolated, and societal stigma was a problem. But with the introduction of the Community Based Rehabilitation (CBR) Programme in 1994, these beliefs have gradually been fading away and today families and communities are taking care of their children with disability. The CBR programme supported many activities including sensitisation and community awareness activities, and training of CBRWs, local supervisors, social workers, health staff, school directors, and persons with disabilities.
In addition, different government agencies carried out community sensitisation and awareness raising activities dealing with a wide range of issues, depending on their institutional mandates. In fact, this intervention is taken as a multi-sectoral activity and hence different institutions such as MoLHW, MoE, MoH, MoL, as well as the Organisation of Persons with Disability (OPD),are playing their part. According to the survey, the main source of information for communities on the rights of the child and rights of children with disabilities was mass media, followed by MoLHW and CBRWs, while the most effective sources were noted as the MoLHW and CBRWs. As a result
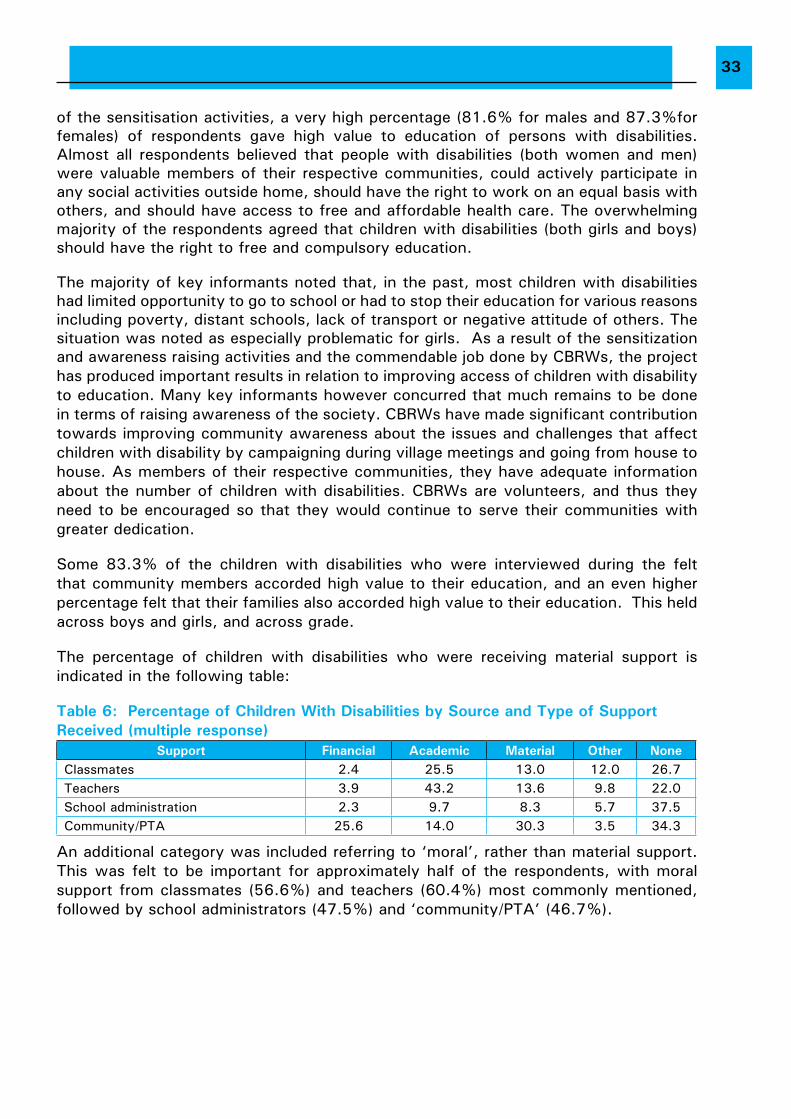
33
of the sensitisation activities, a very high percentage (81.6% for males and 87.3%for females) of respondents gave high value to education of persons with disabilities. Almost all respondents believed that people with disabilities (both women and men) were valuable members of their respective communities, could actively participate in any social activities outside home, should have the right to work on an equal basis with others, and should have access to free and affordable health care. The overwhelming majority of the respondents agreed that children with disabilities (both girls and boys) should have the right to free and compulsory education.
The majority of key informants noted that, in the past, most children with disabilities had limited opportunity to go to school or had to stop their education for various reasons including poverty, distant schools, lack of transport or negative attitude of others. The situation was noted as especially problematic for girls. As a result of the sensitization and awareness raising activities and the commendable job done by CBRWs, the project has produced important results in relation to improving access of children with disability to education. Many key informants however concurred that much remains to be done in terms of raising awareness of the society. CBRWs have made significant contribution towards improving community awareness about the issues and challenges that affect children with disability by campaigning during village meetings and going from house to house. As members of their respective communities, they have adequate information about the number of children with disabilities. CBRWs are volunteers, and thus they need to be encouraged so that they would continue to serve their communities with greater dedication.
Some 83.3% of the children with disabilities who were interviewed during the felt that community members accorded high value to their education, and an even higher percentage felt that their families also accorded high value to their education. This held across boys and girls, and across grade.
The percentage of children with disabilities who were receiving material support is indicated in the following table:
table 6: Percentage of Children With Disabilities by Source and type of Support Received (multiple response)
Support Financial Academic Material Other NoneClassmates 2.4 25.5 13.0 12.0 26.7Teachers 3.9 43.2 13.6 9.8 22.0School administration 2.3 9.7 8.3 5.7 37.5Community/PTA 25.6 14.0 30.3 3.5 34.3
An additional category was included referring to ‘moral’, rather than material support. This was felt to be important for approximately half of the respondents, with moral support from classmates (56.6%) and teachers (60.4%) most commonly mentioned, followed by school administrators (47.5%) and ‘community/PTA’ (46.7%).
34
4.8 SUStAiNABiLitY
One of the main factors which affects project sustainability is its responsiveness to the needs of targeted communities. This Project encouraged children with disabilities to go to school by addressing some of their critical educational and livelihood challenges. This was confirmed during the discussions held with various stakeholders, including beneficiaries, community leaders, local administration officials, and staff of implementing partners.
By embracing the Community-Based Rehabilitation approach, which is actively promoted by the Government, the Project has positioned itself to enjoy strong Government support, which is an essential prerequisite for enhancing its sustainability. The existing CBR Programme will be used to monitor academic progression of supported children and follow up changes in the livelihood situation of beneficiary households. This is expected to help ensure that the benefits generated by the Project would continue to be enjoyed by children with disabilities as well as beneficiary households well beyond the end of the Project. To strengthen this, training, sensitization and awareness raising activities at community level would help ensure their continuous involvement in monitoring and following up project impacts and giving timely feedback to concerned bodies. As part of this, it would be advisable to provide training and other material support to CBRWs and Child Wellbeing Committees so that they would continue to serve their respective communities.
An important sustainability issue that needs further consideration is the capacity of beneficiary households to maintain the donkeys provided by the project. This is not beyond the capacity of beneficiary households and, hence it is very likely that the support will be sustained. There are, however, a few households that have already lost their donkeys due to illness or predators.
With the help of the project, the MoH has piloted ISS in Zoba Maekel. The technical support provided during the pilot phase enhanced the capacity of the MoH in the area of ISS and this is expected to ensure its sustainability. Encouraged by the positive outcomes of the pilot phase, the MoH has already decided to expand it to two additional regions (Zoba Gash Barka and Zoba Debub) and this is expected to lead to the expansion of the ISS nationwide. Government’s commitment to the establishment of the ISS countrywide is an indication of the project’s high likelihood of being sustainable.The Government and its development partners, such as UNICEF and WHO, are expected to continue to allocate the requisite resources to expand and sustain the ISS.
35
4.9 LESSONS LEARNED
• The project has yielded an encouraging impact on the schooling of the supported children.
• However, as most of the donkey distribution (79%) was done in 2010, the time that has elapsed since the start of the project is not enough for significant impact to occur, especially economic.
• The absence of baseline data has made impact assessment more challenging as there were no benchmarks against which evaluation results could be compared to determine the magnitude of changes generated by the project.
• The use of donkeys as a means of transport by children with disabilities was more visible in the rural areas. Those who lived in urban areas preferred other means of transportation such as bicycle and wheelchair.
• Community awareness activities appear to be more effective in areas where education The involvement of CBRWs, village administrations and village elders has strengthened the Project. They have played an especially important role in identifying the neediest children and the most vulnerable households. As they have almost complete knowledge of their respective communities, it is practically difficult for families to hide a child with disability at home and keep him out of the educational system.
• Procurement of donkeys is done with the direct involvement of the beneficiary households, village administration and three eye witnesses. The process was carried out in a transparent manner with the responsibility of selecting a donkey being left to the beneficiary, and this was assessed as one of the merits of the project.
• Those who bought female donkeys appear to benefit more from the support due to the reproductive potential of the donkey, which has already happened for some families.
36
1 CONCLUSiON AND RECOMMENDAtiONS5
37
5 CONCLUSION AND RECOMMENDATIO5.1 CONCLUSiONS
The Project has achieved most of its expected results as intended at the time of the evaluation. The findings show that the “Donkey for School Project” initiative has brought about important changes in terms of the schooling of disabled children. It enabled children, both boys and girls, to attend school. It has addressed mobility problems of children in an appropriate way using local resources and that made the project highly relevant and responsive to the needs of beneficiaries.
The Project supported households to carry out their livelihood activities with ease and improved efficiency. Despite the short time that has elapsed since the start of the Project, the changes generated so far are quite encouraging and warrant the scaling up of the Project in order to bring about more far-reaching impacts. Despite the dearth of data regarding the number and geographical distribution of children with mobility problems in Eritrea, discussions held with key informants in different parts of the country indicated that the need for such kind of support is still significant.
There are also strong indications that the benefits generated by the Project will be sustained well beyond the end of the pilot scheme. This is because maintaining a donkey is generally within the means of the beneficiaries, and offers important over-time support. The beneficiaries appreciated the contribution made by the Project in terms of improving academic performance of children with disability and also in alleviating the burden of household chores. However, the economic impact produced by the Project has been limited mainly due to lack of income generating activities in the rural areas that can be carried out using a donkey. It would therefore be crucial to consider linking beneficiary households to the credit programme of the MoLHW so that they would be able to earn new income and improve their quality of life in a meaningful way.
Communities are sensitized and now have a better understanding of child rights issues in general and the rights of disabled children in particular. The support helped the disabled children overcome the stigma associated with disability and also improved attitude of targeted population through community sensitization and awareness raising activities.
The injury surveillance capacity of the MoH in relation to has improved. The learning aids and materials procured and inclusive education training provided are expected to contribute to improving access of disabled children to quality education.
Inter-sectoral co-ordination and collaboration among partners has not been as effective as possible. Joint planning, supervision and monitoring have generally been weak. Programme reporting, including financial reporting, has been irregular and lacked important information. Monitoring to assess whether donkeys were actually serving the intended purpose was less visible.
In summary, the Project has yielded important educational and livelihood impacts for beneficiary children and their families, but broader economic impacts are still lacking. At the output level, the Project has provided improved access for 875 children with disabilities, who were previously at high risk of dropping out or not going to school, an important achievement. All partners have expressed their satisfaction with the Project results. It would thus be important to develop strategies and mechanisms to expand and sustain the project.
38
5.2 RECOMMENDAtiONS
1. As there are still a large number of children with disabilities suffering from mobility problems in Eritrea, additional resources are needed to scale up the project so that an increasing number of children with disabilities could be assisted. The support offered to date has already resulted in increased expectations among many families of children with disabilities not yet reached by the Project. It is therefore important that the momentum created by the current Project is not lost and hence the need for scaling up the intervention. The number of children with disabilities in Eritrea is estimated at 23,205, of whom a sizeable share are out of school.
2. Prepare a situational analysis of children with disabilities, securing information about their location, type and severity of disability, age, education status, livelihood situation, etc. This will facilitate planning, implementation, monitoring and evaluation activities and help in setting clear, measurable and achievable milestones and targets for a new project.
3. The increase in cost of donkeys and accessories observed in some areas has affected Project implementation. For the roll-out, there is therefore a need to ensure that there are sufficient funds for contingencies.
4. As students in urban areas make little use of the donkeys to go to school, consider providing them with other means of transport such as bicycles and wheel chairs as it is done by other UNICEF projects. At the same time, focus on children with disabilities in rural areas for the donkey support.
5. Consider boosting the morale of children with disabilities by providing them with additional school materials.
6. To ensure the timely supply of quality accessories, head office should establish a more rigorous procurement process. This would include development of a roaster of suitable and competent suppliers who have the requisite capacity to deliver in accordance with the requirements of the Ministry. As there was noticeable difference in the quality of accessories supplied in different regions/sub-regions, it would be important in future to develop detailed technical specifications to guide procurement of accessories.
7. Invest in school infrastructure to make schools more friendly to children with disabilities. Continue training of teachers on inclusive education to upgrade their knowledge and skills on how to help children with disabilities. Consider provision of pre-service training to teachers on inclusive education before they graduate from Teachers Training. Expand provision of learning aids to schools to help them prepare better to assist children with special needs. Parallel with this, encourage local experts to develop appropriate learning aids that are more appropriate to the Eritrean context.
8. Intensify community sensitization and awareness-raising activities to enhance the knowledge, attitudes and practices of the society about child rights in general and the rights of children with disabilities in particular. Ensure that implementing partners and other organisations complement each other in carrying out community sensitization and awareness raising activities so that they would be able to do more with less
9. CBRWs are the extension arm of the MoLHW and have played significant role in project implementation and follow-up. Ensure that they remain motivated by providing them with additional training and refresher courses. In view of their demanding tasks,
39
consideration should be given to the recruitment of younger CBRWs with better education so that they can give better services to their respective communities, the MoLHW and its development partners such as UNICEF.
10. Strengthen the capacity of participating ministries and regions by providing them with appropriate training and office equipment.
11. Enhance monitoring activities at all levels so that implementation progress can be continually assessed. Conduct a needs assessment to identify capacity gaps and develop a plan of action on how to fill the gap.
12. Enhance co-ordination mechanisms among the partners, especially in relation to joint planning, supervision, reviews, monitoring and evaluation. Establish a steering committee/technical committee to guide coordination activities, information sharing, and resolve issues that affect implementation. Make sure that schools are included in implementation committees established at local levels. This will facilitate monitoring and follow up of academic performance and attendance of children with disability.
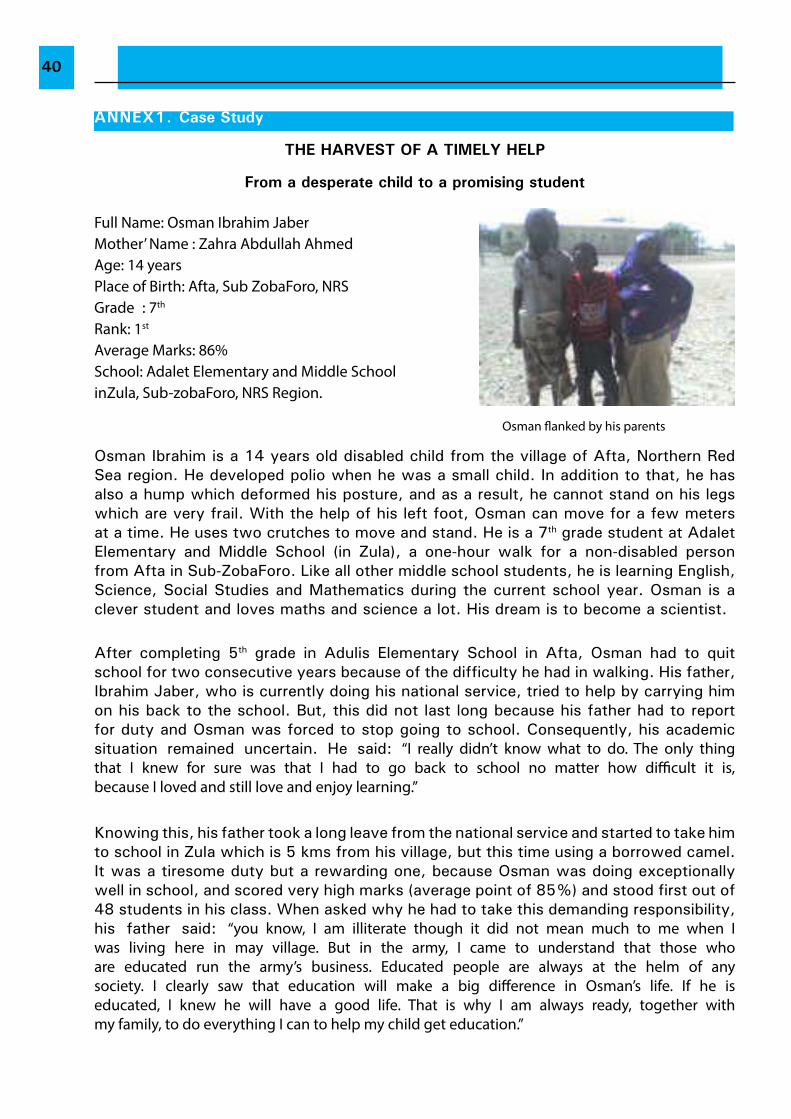
40
ANNEx1. Case Study
tHE HARVESt OF A tiMELY HELP
From a desperate child to a promising student
Full Name: Osman Ibrahim JaberMother’ Name : Zahra Abdullah AhmedAge: 14 yearsPlace of Birth: Afta, Sub ZobaForo, NRSGrade : 7th
Rank: 1st
Average Marks: 86% School: Adalet Elementary and Middle School inZula, Sub-zobaForo, NRS Region.
Osman flanked by his parents
Osman Ibrahim is a 14 years old disabled child from the village of Afta, Northern Red Sea region. He developed polio when he was a small child. In addition to that, he has also a hump which deformed his posture, and as a result, he cannot stand on his legs which are very frail. With the help of his left foot, Osman can move for a few meters at a time. He uses two crutches to move and stand. He is a 7th grade student at Adalet Elementary and Middle School (in Zula), a one-hour walk for a non-disabled person from Afta in Sub-ZobaForo. Like all other middle school students, he is learning English, Science, Social Studies and Mathematics during the current school year. Osman is a clever student and loves maths and science a lot. His dream is to become a scientist.
After completing 5th grade in Adulis Elementary School in Afta, Osman had to quit school for two consecutive years because of the difficulty he had in walking. His father, Ibrahim Jaber, who is currently doing his national service, tried to help by carrying him on his back to the school. But, this did not last long because his father had to report for duty and Osman was forced to stop going to school. Consequently, his academic situation remained uncertain. He said: “I really didn’t know what to do. The only thing that I knew for sure was that I had to go back to school no matter how difficult it is, because I loved and still love and enjoy learning.”
Knowing this, his father took a long leave from the national service and started to take him to school in Zula which is 5 kms from his village, but this time using a borrowed camel. It was a tiresome duty but a rewarding one, because Osman was doing exceptionally well in school, and scored very high marks (average point of 85%) and stood first out of 48 students in his class. When asked why he had to take this demanding responsibility, his father said: “you know, I am illiterate though it did not mean much to me when I was living here in may village. But in the army, I came to understand that those who are educated run the army’s business. Educated people are always at the helm of any society. I clearly saw that education will make a big difference in Osman’s life. If he is educated, I knew he will have a good life. That is why I am always ready, together with my family, to do everything I can to help my child get education.”
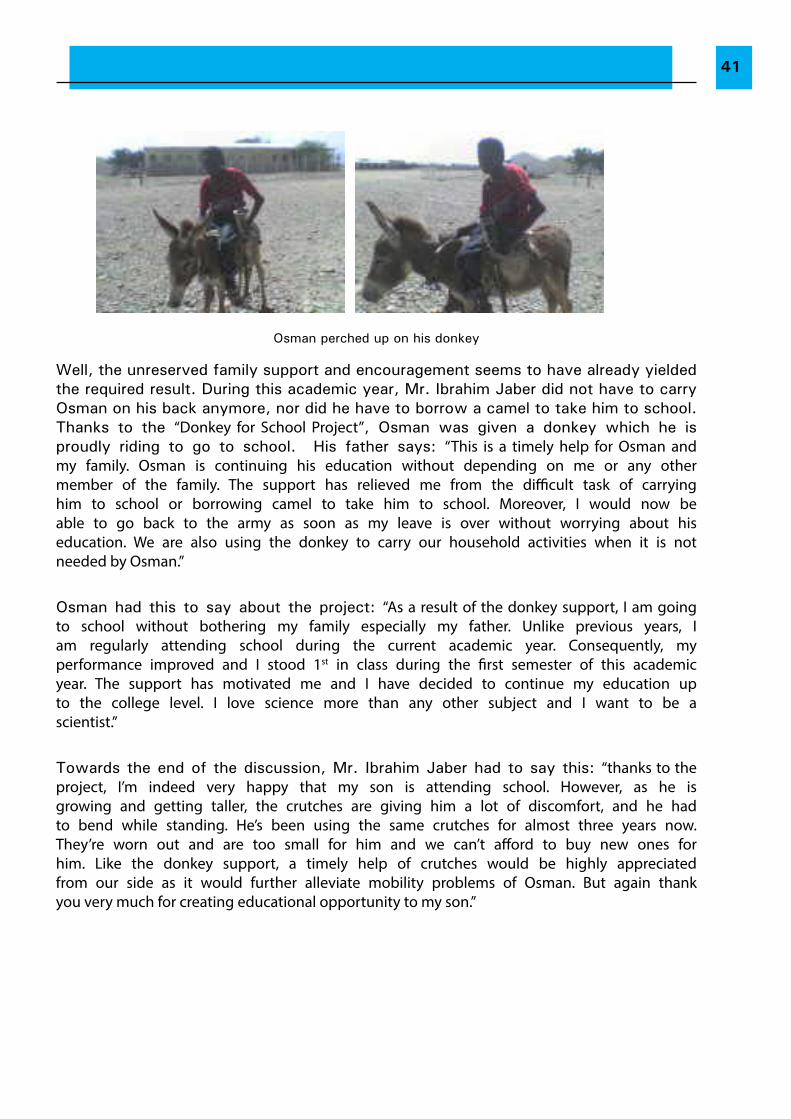
41
Osman perched up on his donkey
Well, the unreserved family support and encouragement seems to have already yielded the required result. During this academic year, Mr. Ibrahim Jaber did not have to carry Osman on his back anymore, nor did he have to borrow a camel to take him to school. Thanks to the “Donkey for School Project”, Osman was given a donkey which he is proudly riding to go to school. His father says: “This is a timely help for Osman and my family. Osman is continuing his education without depending on me or any other member of the family. The support has relieved me from the difficult task of carrying him to school or borrowing camel to take him to school. Moreover, I would now be able to go back to the army as soon as my leave is over without worrying about his education. We are also using the donkey to carry our household activities when it is not needed by Osman.”
Osman had this to say about the project: “As a result of the donkey support, I am going to school without bothering my family especially my father. Unlike previous years, I am regularly attending school during the current academic year. Consequently, my performance improved and I stood 1st in class during the first semester of this academic year. The support has motivated me and I have decided to continue my education up to the college level. I love science more than any other subject and I want to be a scientist.”
Towards the end of the discussion, Mr. Ibrahim Jaber had to say this: “thanks to the project, I’m indeed very happy that my son is attending school. However, as he is growing and getting taller, the crutches are giving him a lot of discomfort, and he had to bend while standing. He’s been using the same crutches for almost three years now. They’re worn out and are too small for him and we can’t afford to buy new ones for him. Like the donkey support, a timely help of crutches would be highly appreciated from our side as it would further alleviate mobility problems of Osman. But again thank you very much for creating educational opportunity to my son.”
OR A CORPORAtE CONtRACt (SSA)
42
ANNEx 2: terms of Reference
Position/title: Consultant for Evaluation of the Donkey for School Project. Position: Asmara, Eritrea Duration: Ten weeks Start Date: 08/11/2010 up to 27/01/2011Reporting: The Consultant will directly report to the Social Protection Officer
and the Director of Child Welfare Division.
BACKGROUND
In the Eritrean context, among the factors contributing to low school enrolment and under-achievement are poverty, lack of access, insufficient learning materials and cultural barriers and long distances from home to school, contributing to the girl child’s right to education being negatively affected. Children with disabilities are amongst the highly affected group by the factors mentioned above and their participation and enrolment to schooling is low compared to children without disabilities. The Situation Analysis on persons with disability report (2009) of the MLHW reveals disability contributes 19.3% for not attending school and difficulty of mobility contributes to 46% of school drop outs.
As an initiative to give equal opportunity to children with physical disabilities and disadvantaged girls, it was of the essence to provide affirmative action that the right to education and basic social services is upheld by getting all children from home to the door of the school. This equal opportunity to schools in many rural areas was planned to be achieved through concrete action as presented in the proposal “Donkeys for School” in partnership with community based rehabilitation Programmes (CBR) that is within the Ministry of Labour and Human Welfare.
The project seeks to improve the social protection of vulnerable and at-risk children to access basic social services through a targeted intervention by providing vulnerable households with 870 donkeys as an economic asset. The donkeys will be used by the children, especially girls and those with disabilities, as a means of transport to school as well as a material support to go into income generation for the household and to assist vulnerable families in improving their income base. It is expected that this intervention will contribute to promoting the rights of people with disability to equal educational opportunities encouraging inclusive education.
In line to the physical provision of donkeys, the main activities undertaken by this project will include awareness raising and sensitizing communities and duty bearers on the rights of children, enhancing the participation of 870 vulnerable children and families in project activities to access basic social services, service delivery and economic asset transfer to vulnerable families and children, project monitoring and supportive supervision.
JUStiFiCAtiON
As part of the 2010 AWP of the Social Protection Programme component, evaluating the “Donkey for School Project” is one of the priority activities. According to the situation
43
analysis of persons with disability report (MLHW, 2009), there are 105,000 persons living with Disabilities and about 20% are children. As part of the community based rehabilitation program to disabled persons, this project focuses, as a pilot intervention, to provide mobility opportunities by providing donkeys to 870 disabled children to enable them attend school and support their families improve their economic base.
The overall goal of this project is to improve the social protection of children through access to basic social services, enhance and increase income levels of an initial 500 vulnerable households through:
• 1000 children have access to schools, especially hard to reach girl children and those physically challenged with disabilities in 30 communities/kebabis;
• 870 vulnerable households are provided with 871 donkeys and household income levels increased by 15 per cent.
PROJECt StRAtEGiES AND ACtiVitiES
• Raising awareness, sensitizing and mobilizing communities and duty bearers on the rights of children
• Enhance the participation of children and their families• Incentive approach - targeting the hard-to-reach girls and the disabled to access
basic social services
KEY iNDiCAtORS tO BE CONSiDERED (NOt ExCLUSiVE)
1. Social indicatorsa. Parents who showed initiative to send girls to school and encouraged them
to stay in school;b. Parents who send more than one girl to school;c. Girls in disadvantaged and remote community areas needs special attention;d. Physically challenged and disabled girls and boys.
2. Economic indicatorsa. Families with poor economic status who may withdraw their girls from school
to help in household chores;b. Families who cannot meet the basic costs of sending their girls and disabled
children to school.3. Cultural, Environmental and Political Factors Impacting on the Project:
In the event that those vulnerable families that were selected to participate in the this project fail to measure up to the conditions of sending their children to school and access other basic social services such as health care, the CWBCs will consider to terminate its support by withdrawing the donkey and accessories that were provided and another beneficiary that fits the criteria will be selected.
ExPECtED AND PROPOSED RESULtS
Enrolment, retention and completion rates of children with disabilities in schools maintained and children do not drop out of school due to far distances from their homes to reach to school.
44
The household income level and economic assets of vulnerable families is increased and quality of life for disabled children improved.
The incidence of children engaged in household chores and prevented from attending school is significantly decreased and maintained in the selected communities.
Ratification of the Convention of Persons Living with DisabilitiesLevel of acceptance of families and communities for children living with
disabilities.
The target audience for this evaluation would be:
1) Primary Users: Children living with disabilities2) Secondary users: MOLHW, UNICEF and the Swiss Committee
EVALUAtiON OBJECtiVES AND KEY qUEStiONS
The overall objective of the evaluation is to assess effectiveness and gaps of the donkey for school programme in terms of children who are able to go back and retain schooling, economically assisted disadvantaged children, communities and person’s knowledge, attitude, and practices on issues related to children with disabilities and to make recommendations on strategies to close any identified gaps and improve the delivery of programme interventions.
It is recommended that a national consultant is contracted for the period to conduct the survey and come up with a complete report of the project.
In general the evaluation is expected to reflect some answers to the following basic questions regarding the donkey for school project implementation.
1. What is the status of achievements of the project against its objectives and planed results compared to the baseline information during project design?
2. The process of evaluation would address in assessing the process of the intervention, operational arrangements, coordination mechanisms, cost effectiveness and etc.
3. What are the preliminary effects and immediate impacts of the project to the beneficiary disabled children, including disadvantage female students and their families?
4. What mechanisms have to be put in place to ensure the sustainability of the project effects on target beneficiaries?
• To see the outcome of the donkey for school project including how many children were supported (able to continue schooling), especially hard to reach girls and physically disabled children, and 870 at-risk households in remote locations of rural Eritrea.
• To evaluate the number of communities who are aware, sensitized and mobilized on the right of the child specifically, the right of a disabled child to schooling.
• To assess if the enrolment, retention and completion rates of the beneficiary children in schools is maintained and children do not drop out of school due to far distances from their homes to reach to school.
• To see if the household income level and economic assets of vulnerable families is increased and quality of life for children improved by showing the direct attribution of economic asset.
45
• To assess if the incidence of children engaged in household chores and prevented from attending school is significantly decreased and maintained due to direct attribution of economic assets in the selected communities.
• Compile a comprehensive and detail report of the project with lessons learned and key recommendations for future interventions.
DUtiES AND RESPONSiBiLitiES
• The consultant prepares the methods of data collection and analysis, including information on the overall methodological design. The approach would be participatory and all Zobas should be represented.
• The Consultant is expected to hire data enumerators, data entry operators and a Programmer. This additional cost would be covered by UNICEF.
• The consultant will assess the number of children reached through this project. • The consultant is expected to assess independently the above mentioned
objectives and come up with recommendations and conclusion. • Compile a comprehensive and detail report of the project, with recommendations
for future similar program. • Submit hard copy and electronic copy of the evaluation methodology and
preliminary report to the Ministry of Labor and Human Welfare and UNICEF office on the agreed time
• Organize a consensus building workshop of the finding of the evaluation for final comments of all partners.
• Submit final report based with inputs incorporated from the consensus building workshop.
• The final report will be acceptable if compliant to the attached quality checklist for evaluation report.
SCOPE OF WORK
tASKS DURAtiONDevelop evaluation protocol (Evaluation methodology) and detailing work plan and agreed with MLHW and UNICEF. 1 Week.
Develop evaluation instrument for quantitative and qualitative data collection 1 Week.Primary and Secondary data collection 3 WeeksData entry, data cleaning and analysis 3 WeekPreliminary report of the evaluation 1 WeekPeer Review Workshop to present the main findings of the evaluation 1 DayFinal Report compilation and submission. 4 Days
DELiEVERABLES
1. Inception Report and evaluation protocol to be submitted within 2weeks from the signing of the contract
2. Preliminary findings report submitted within 8weeks from the commencement of the assignment
3. The final report due at the end of the 10weeks.
46
REqUiREMENtS
• Advanced university degree in Social Sciences or a related technical field. • Experience in conducting evaluations studies on community development and
social development issues. • Strong background in both quantitative and qualitative research methods • Good computer skills • Demonstrated ability to work in a multi-cultural environment• Good English writing skills and editing capacity• Ability to plan and maintain project schedules and meet required deadlines
RiSK AND ASSUMPtiONS
• Failure to accomplish the deliverables within the agreed deadline entails withholding of payment wholly or partially.
CONFiDENAtiALLitY AND COPYRiGHt
• All documents and reports and other such outputs and information submitted to MoLHW and UNICEF under the terms of this agreement shall not be disclosed to any third or other party by the Consultant.
• The Consultant shall not disclose or use the reports, documents or information to and for the benefit of any other party for purposes unrelated to the present agreement.
• All reports and other outputs prepared by the Consultant under this contract shall become the property of MoLHW and UNICEF to be used for its purposes, as it deems appropriate.
Exit AND PENALtY PROViSiON
• The consultant and UNICEF may agree to reschedule deadlines if unforeseen circumstances arise. In the event that such rescheduling has not been agreed in advance by exchange of letters, and submission of scheduled drafts should not occur within the deadlines indicated within these Terms of Reference and the implementation framework, a fine of two percent of the total value of the contract may be deducted. In the event the client (UNICEF) is unhappy with the work produced by the consultant, UNICEF may opt to terminate the contract on mutually agreeable terms. Likewise, if the Consultant is unhappy with new conditions given by its Client it may opt to withdraw on mutually agreeable terms.
CONDitiON OF CONtRACt – FEES AND PAYMENt SCHEDULE
• Based on the approved evaluation protocol, a detailed field expense would be jointly prepared between the consultant and UNICEF and released within a week of submission and approval.
• 30% payment upon submission of evaluation protocol and detailed work plan. • 40% will be paid upon submission of the preliminary report of the evaluation
47
• The final payment (30%) is paid upon the submission of the final report. The final report will be evaluated according to the attached UNEG Quality Checklist for Evaluation Reports.
• The consultant is not entitled to any remuneration other than the lamp sum agreed.
• The consultant will work from his private office.• Institute the relevant penalty applicable in the event of the consultant not
meeting the timeframe and quality of work, and
PREPARED AND APPROVED BY
Prepared by: Samuel Isaac through: Gbemisola Akinboyo Approved: Juan Carlos Espinolatitle: Social Protection Officer title: Chief, Child Protection title: Deputy Representative
48
ANNEx 3: Evaluation Methodology
The evaluation metholdogy involved a combination of desk review and field study to collect both primary and secondary data required to shed light on key evaluation questions. Since the desk review and qualitative survey are adequately covered in the main report, the methodology followed to undertake the quantitative survey will be described here.
The quantitative survey is aimed to provide reliable estimate of the objectively verifiable indicators related to the specific objectives of the project.
1. Sample design
The sample design for the study was developed to provide a representative sample of households and to achieve high cost efficiency as well as operational convenience in collecting data to get reliable estimates on the above stated objectives at national level.
The sample design adapted for this study is a two stage stratified design. At the first stage, sub-regions are used as the primary sampling units (PSU), while at the second stage, beneficiaries are used as the secondary sampling units (SSU).
2. Sample size
The sample is designed to get reliable estimate of the variable of interest of the study at the national level. There is no prior reliable estimate of the variable of interest in the project areas which can be used to determine the required sample size. Therefore, in order to get sample size that is adequate to provide reliable estimate of the variable under consideration at a reasonable level of precision, a prevalence of 50%(p) was used in the sample size determination.
Moreover, 5% margin of error (e), 95% confidence level (z=2.0), and a response rate of 90% was used in the sample size estimate.
The formulae used was, n= z2*p*(1-p)/e2
Where:n= the required sample size.p= expected prevalence of the variable of interest.e= expected margin of error of the estimate
z= parameter linked to the 95% confidence interval
The formulae yielded an initial overall sample size of 384 beneficiaries. n2=Sample size Adjusted for population size
Since the sampling fraction (n1/N=384/870=44.1% is greater than 0.05, there was a need to correct the initial sample size using the sample size correction factor formula:
n2=n1*(N/(N+n1)) and the size was adjusted to 266 households.
n3=Size adjusted to response rate (r=95%)
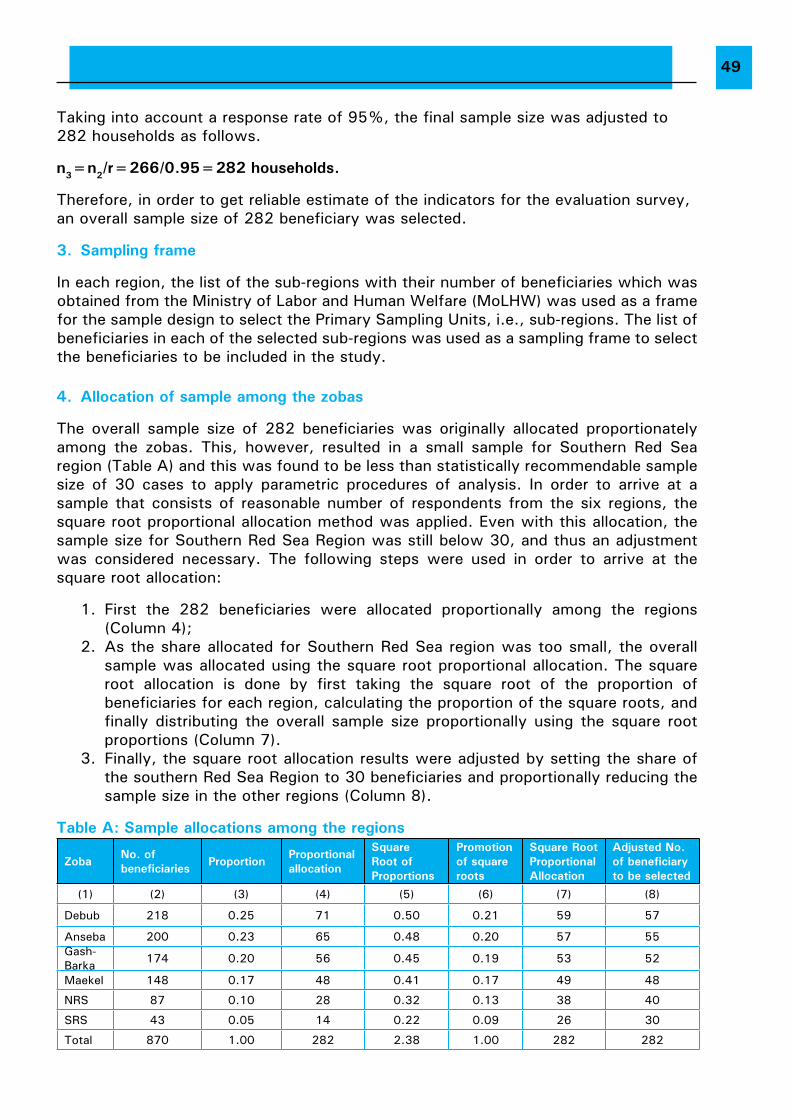
49
Taking into account a response rate of 95%, the final sample size was adjusted to 282 households as follows.
n3=n2/r=266/0.95=282 households.
Therefore, in order to get reliable estimate of the indicators for the evaluation survey, an overall sample size of 282 beneficiary was selected.
3. Sampling frame
In each region, the list of the sub-regions with their number of beneficiaries which was obtained from the Ministry of Labor and Human Welfare (MoLHW) was used as a frame for the sample design to select the Primary Sampling Units, i.e., sub-regions. The list of beneficiaries in each of the selected sub-regions was used as a sampling frame to select the beneficiaries to be included in the study.
4. Allocation of sample among the zobas
The overall sample size of 282 beneficiaries was originally allocated proportionately among the zobas. This, however, resulted in a small sample for Southern Red Sea region (Table A) and this was found to be less than statistically recommendable sample size of 30 cases to apply parametric procedures of analysis. In order to arrive at a sample that consists of reasonable number of respondents from the six regions, the square root proportional allocation method was applied. Even with this allocation, the sample size for Southern Red Sea Region was still below 30, and thus an adjustment was considered necessary. The following steps were used in order to arrive at the square root allocation:
1. First the 282 beneficiaries were allocated proportionally among the regions (Column 4);
2. As the share allocated for Southern Red Sea region was too small, the overall sample was allocated using the square root proportional allocation. The square root allocation is done by first taking the square root of the proportion of beneficiaries for each region, calculating the proportion of the square roots, and finally distributing the overall sample size proportionally using the square root proportions (Column 7).
3. Finally, the square root allocation results were adjusted by setting the share of the southern Red Sea Region to 30 beneficiaries and proportionally reducing the sample size in the other regions (Column 8).
table A: Sample allocations among the regions
Zoba No. of beneficiaries Proportion Proportional
allocation
Square Root of Proportions
Promotion of square roots
Square Root Proportional Allocation
Adjusted No. of beneficiary to be selected
(1) (2) (3) (4) (5) (6) (7) (8)
Debub 218 0.25 71 0.50 0.21 59 57
Anseba 200 0.23 65 0.48 0.20 57 55Gash-Barka 174 0.20 56 0.45 0.19 53 52
Maekel 148 0.17 48 0.41 0.17 49 48
NRS 87 0.10 28 0.32 0.13 38 40
SRS 43 0.05 14 0.22 0.09 26 30
Total 870 1.00 282 2.38 1.00 282 282
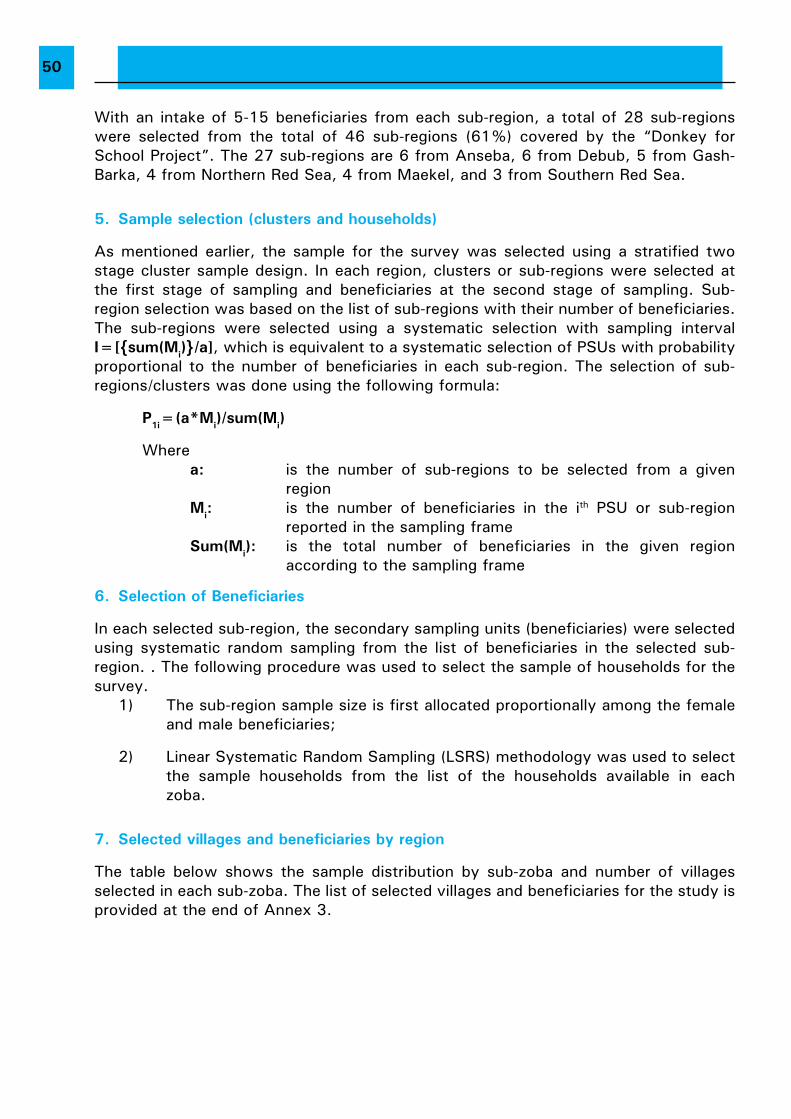
50
With an intake of 5-15 beneficiaries from each sub-region, a total of 28 sub-regions were selected from the total of 46 sub-regions (61%) covered by the “Donkey for School Project”. The 27 sub-regions are 6 from Anseba, 6 from Debub, 5 from Gash-Barka, 4 from Northern Red Sea, 4 from Maekel, and 3 from Southern Red Sea.
5. Sample selection (clusters and households)
As mentioned earlier, the sample for the survey was selected using a stratified two stage cluster sample design. In each region, clusters or sub-regions were selected at the first stage of sampling and beneficiaries at the second stage of sampling. Sub-region selection was based on the list of sub-regions with their number of beneficiaries. The sub-regions were selected using a systematic selection with sampling interval i=[{sum(Mi)}/a], which is equivalent to a systematic selection of PSUs with probability proportional to the number of beneficiaries in each sub-region. The selection of sub-regions/clusters was done using the following formula:
P1i=(a*Mi)/sum(Mi)
Wherea: is the number of sub-regions to be selected from a given
regionMi: is the number of beneficiaries in the ith PSU or sub-region
reported in the sampling frameSum(Mi): is the total number of beneficiaries in the given region
according to the sampling frame
6. Selection of Beneficiaries
In each selected sub-region, the secondary sampling units (beneficiaries) were selected using systematic random sampling from the list of beneficiaries in the selected sub-region. . The following procedure was used to select the sample of households for the survey.
1) The sub-region sample size is first allocated proportionally among the female and male beneficiaries;
2) Linear Systematic Random Sampling (LSRS) methodology was used to select the sample households from the list of the households available in each zoba.
7. Selected villages and beneficiaries by region
The table below shows the sample distribution by sub-zoba and number of villages selected in each sub-zoba. The list of selected villages and beneficiaries for the study is provided at the end of Annex 3.
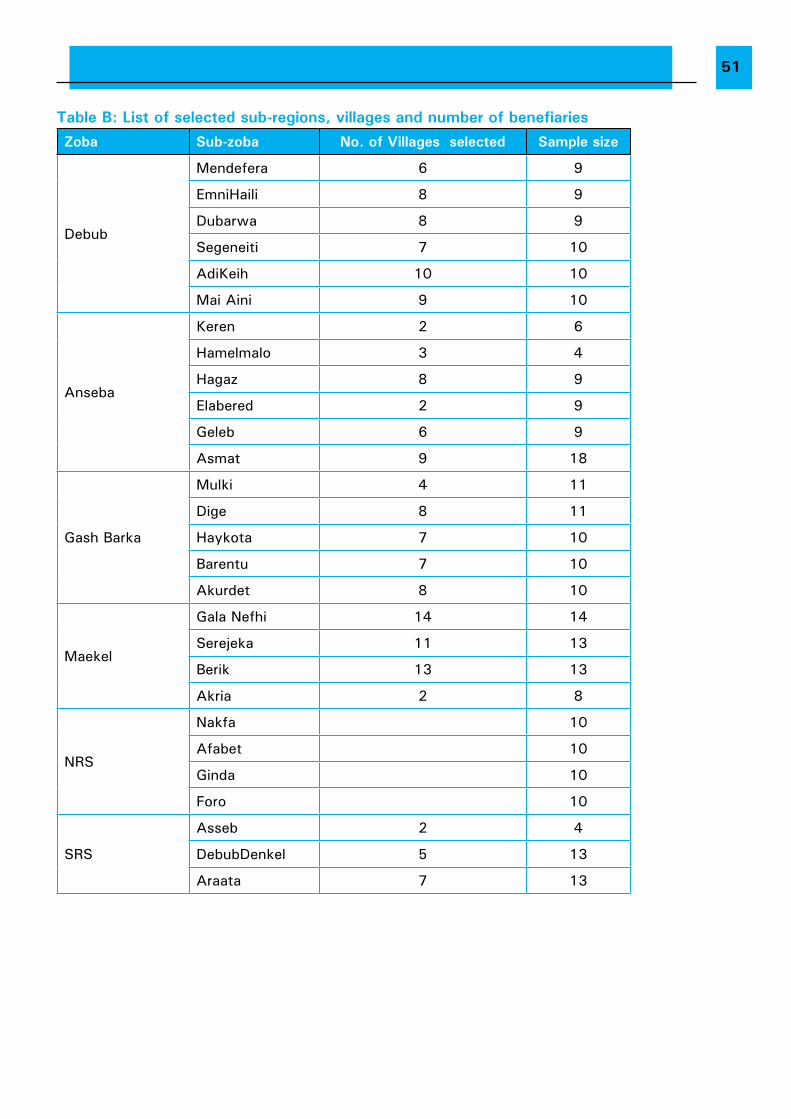
51
Table B: List of selected sub-regions, villages and number of benefiariesZoba Sub-zoba No. of Villages selected Sample size
Debub
Mendefera 6 9
EmniHaili 8 9
Dubarwa 8 9
Segeneiti 7 10
AdiKeih 10 10
Mai Aini 9 10
Anseba
Keren 2 6
Hamelmalo 3 4
Hagaz 8 9
Elabered 2 9
Geleb 6 9
Asmat 9 18
Gash Barka
Mulki 4 11
Dige 8 11
Haykota 7 10
Barentu 7 10
Akurdet 8 10
Maekel
Gala Nefhi 14 14
Serejeka 11 13
Berik 13 13
Akria 2 8
NRS
Nakfa 10
Afabet 10
Ginda 10
Foro 10
SRS
Asseb 2 4
DebubDenkel 5 13
Araata 7 13
52
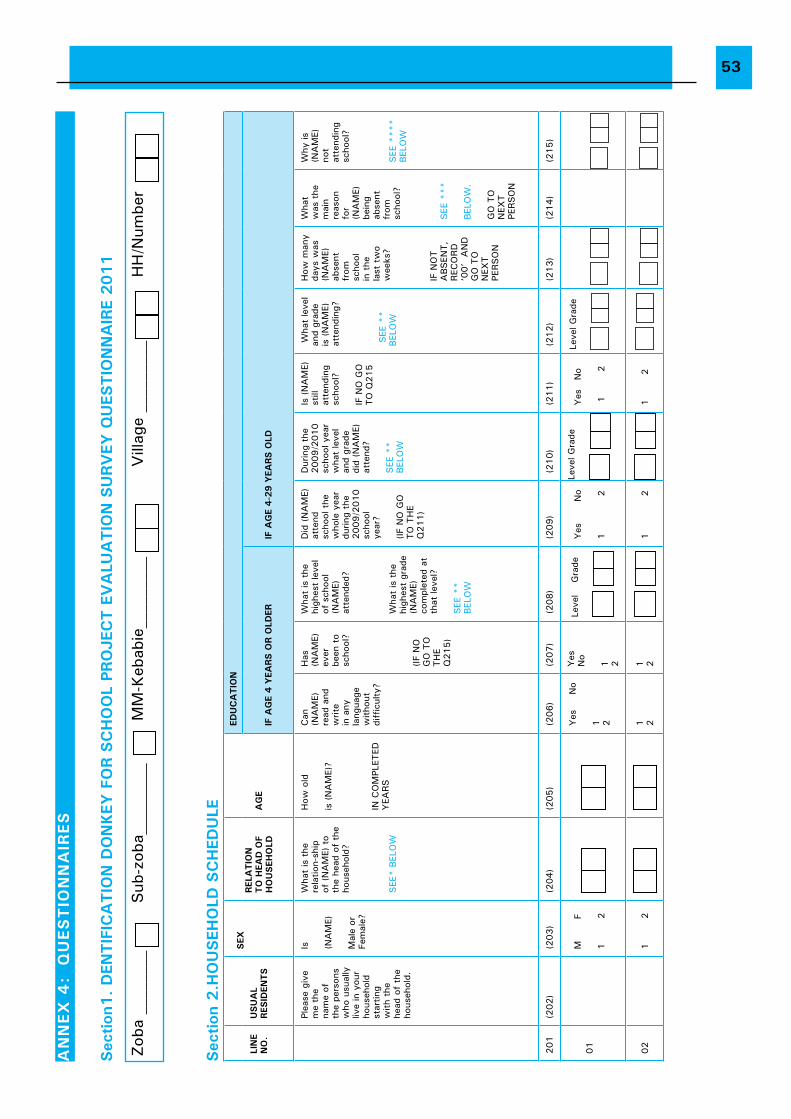
53A
NN
Ex
4:
qU
ES
tiO
NN
AiR
ES
Sec
tion1
. D
ENtiF
iCA
tiO
N D
ON
KEY
FO
R S
CH
OO
L PR
OJE
Ct E
VA
LUA
tiO
N S
URV
EY q
UES
tiO
NN
AiR
E 2011
Zob
a __
____
__ S
ub-z
oba_
____
____
MM
-Keb
abie
____
____
_
V
illag
e __
____
___
H
H/N
umbe
r
Sec
tion
2.H
OU
SEH
OLD
SC
HED
ULE
LiN
EN
O.
USU
AL
RES
iDEN
tS
SEx
REL
AtiO
N
tO
HEA
D O
F H
OU
SEH
OLD
AG
E
EDU
CA
tiO
N
iF A
GE
4 Y
EARS O
R O
LDER
iF A
GE
4-2
9 Y
EARS O
LD
Plea
se g
ive
me
the
nam
e of
th
e pe
rson
s w
ho u
sual
ly
live
in y
our
hous
ehol
d st
artin
g w
ith t
he
head
of
the
hous
ehol
d.
Is (NA
ME)
Mal
e or
Fe
mal
e?
Wha
t is
the
re
latio
n-sh
ip
of (
NA
ME)
to
the
head
of
the
hous
ehol
d?
SEE
* B
ELO
W
How
old
is (
NA
ME)
?
IN C
OM
PLET
ED
YEA
RS
Can
(N
AM
E)
read
and
w
rite
in a
ny
lang
uage
w
ithou
t di
fficu
lty?
Has
(N
AM
E)
ever
be
en t
o sc
hool
?
(IF N
O
GO
TO
TH
E
Q215)
Wha
t is
the
hi
ghes
t le
vel
of s
choo
l (N
AM
E)
atte
nded
?
Wha
t is
the
hi
ghes
t gr
ade
(NA
ME)
co
mpl
eted
at
that
leve
l?
SEE
**
BEL
OW
Did
(N
AM
E)
atte
nd
scho
ol t
he
who
le y
ear
durin
g th
e 2009/2
010
scho
ol
year
?
(IF N
O G
O
TO
TH
E
Q211)
Dur
ing
the
2009/2
010
scho
ol y
ear
wha
t le
vel
and
grad
e di
d (N
AM
E)
atte
nd?
SEE
**
BEL
OW
Is (N
AM
E)
still
at
tend
ing
scho
ol?
IF N
O G
O
TO
Q215
Wha
t le
vel
and
grad
e is
(N
AM
E)
atte
ndin
g?
SEE
**
BEL
OW
How
man
y da
ys w
as
(NA
ME)
ab
sent
fr
om
scho
ol
in t
he
last
tw
o w
eeks
?
IF N
OT
ABSEN
T,
REC
ORD
‘0
0’ A
ND
G
O T
O
NEx
T
PERSO
N
Wha
t w
as t
he
mai
n re
ason
fo
r (N
AM
E)
bein
g ab
sent
fr
om
scho
ol?
SEE
***
BEL
OW
.
GO
TO
N
ExT
PERSO
N
Why
is
(NA
ME)
no
t at
tend
ing
scho
ol?
SEE
****
BEL
OW
201
(202)
(203)
(204)
(205)
(206)
(207)
(208)
(209)
(210)
(211)
(212)
(213)
(214)
(215)
01
M
F
1
2
Yes
No
1
2
Yes
N
o
1
2
Leve
l
Gra
de
Yes
N
o
1
2
Leve
l Gra
de
Y
es N
o
1 2
Leve
l Gra
de
02
1
2
1
2
1
2
1
2
1 2
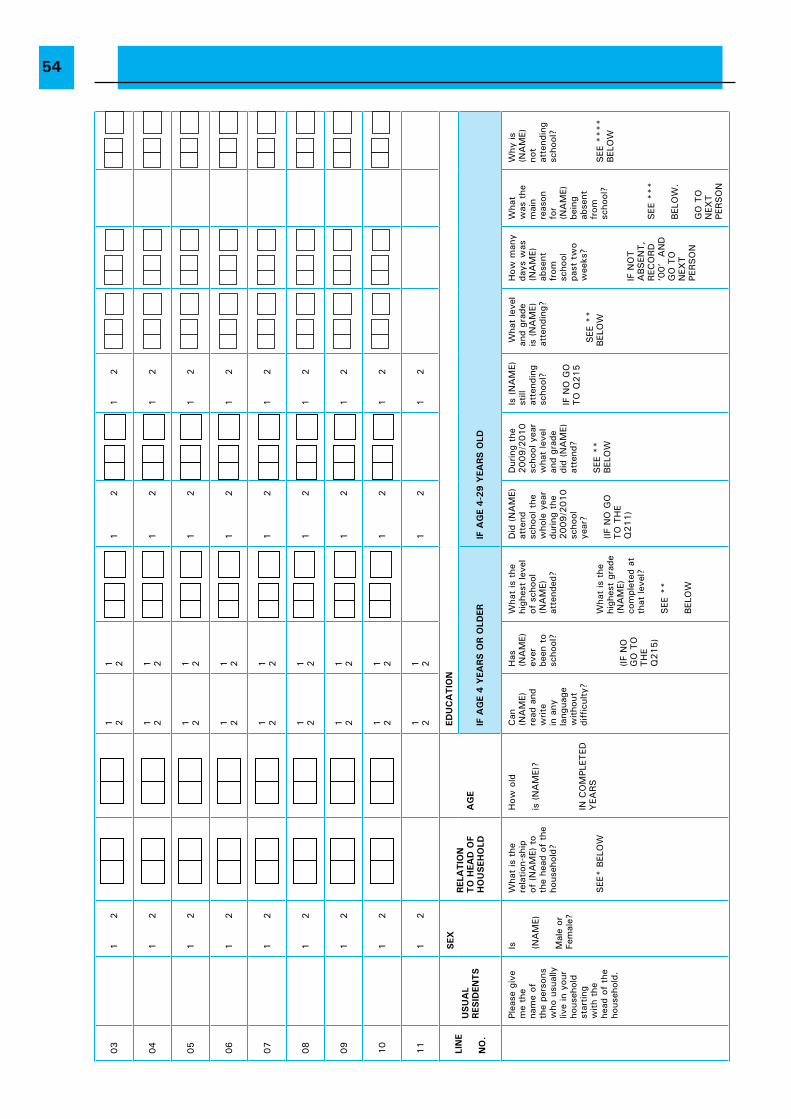
54
03
1
2
1
2
1
21
2
1 2
04
1
2
1
2
1
21
2
1 2
05
1
2
1
2
1
21
2
1 2
06
1
2
1
2
1
21
2
1 2
07
1
2
1
2
1
21
2
1 2
08
1
2
1
2
1
21
2
1 2
09
1
2
1
2
1
21
2
1 2
10
1
2
1
2
1
21
2
1 2
11
1
2
1
2
1
21
2
1 2
LiN
E
NO
.
USU
AL
RES
iDEN
tS
SEx
REL
AtiO
N
tO
HEA
D O
F H
OU
SEH
OLD
AG
E
EDU
CA
tiO
N
iF A
GE
4 Y
EARS O
R O
LDER
iF A
GE
4-2
9 Y
EARS O
LD
Plea
se g
ive
me
the
nam
e of
th
e pe
rson
s w
ho u
sual
ly
live
in y
our
hous
ehol
d st
artin
g w
ith t
he
head
of
the
hous
ehol
d.
Is (NA
ME)
Mal
e or
Fe
mal
e?
Wha
t is
the
re
latio
n-sh
ip
of (
NA
ME)
to
the
head
of
the
hous
ehol
d?
SEE
* B
ELO
W
How
old
is (
NA
ME)
?
IN C
OM
PLET
ED
YEA
RS
Can
(N
AM
E)
read
and
w
rite
in a
ny
lang
uage
w
ithou
t di
fficu
lty?
Has
(N
AM
E)
ever
be
en t
o sc
hool
?
(IF N
O
GO
TO
TH
E
Q215)
Wha
t is
the
hi
ghes
t le
vel
of s
choo
l (N
AM
E)
atte
nded
?
Wha
t is
the
hi
ghes
t gr
ade
(NA
ME)
co
mpl
eted
at
that
leve
l?
SEE
**
BEL
OW
Did
(N
AM
E)
atte
nd
scho
ol t
he
who
le y
ear
durin
g th
e 2009/2
010
scho
ol
year
?
(IF N
O G
O
TO
TH
E
Q211)
Dur
ing
the
2009/2
010
scho
ol y
ear
wha
t le
vel
and
grad
e di
d (N
AM
E)
atte
nd?
SEE
**
BEL
OW
Is (N
AM
E)
still
at
tend
ing
scho
ol?
IF N
O G
O
TO
Q215
Wha
t le
vel
and
grad
e is
(N
AM
E)
atte
ndin
g?
SEE
**
BEL
OW
How
man
y da
ys w
as
(NA
ME)
ab
sent
fr
om
scho
ol
past
tw
o w
eeks
?
IF N
OT
ABSEN
T,
REC
ORD
‘0
0’ A
ND
G
O T
O
NEx
T
PERSO
N
Wha
t w
as t
he
mai
n re
ason
fo
r (N
AM
E)
bein
g ab
sent
fr
om
scho
ol?
SEE
***
BEL
OW
.
GO
TO
N
ExT
PERSO
N
Why
is
(NA
ME)
no
t at
tend
ing
scho
ol?
SEE
****
BEL
OW

55201
(202)
(203)
(204)
(205)
(206)
(207)
(208)
(209)
(210)
(211)
(212)
(213)
(214)
(215)
09
M
F
1
2
Yes
No
1
2
Yes
N
o
1
2
Leve
l
Gra
de
Yes
N
o
1
2
Leve
l Gra
deY
es N
o
1 2
Leve
l Gra
de
10
1
2
1
2
1
21
2
1 2
11
1
2
1
2
1
21
2
1 2
LiN
E
NO
.
OC
CU
PAtiO
NC
OM
PLEt
E C
OLU
MN
S 2
17-2
22 F
OR A
LL H
H M
EMBER
S A
GED
5 O
R O
LDER
AG
E 10 A
ND
OV
ERD
iSA
BiL
itY
Wha
t w
as
(NA
ME)
’s m
ain
occu
patio
n du
ring
last
yea
r?
SEE
CO
DES
BEL
OW
Doe
s (N
AM
E) h
ave
diffi
culty
in s
eein
g?D
oes
(NA
ME)
ha
ve d
ifficu
lty in
he
arin
g?
Doe
s (N
AM
E)
have
diffi
culty
in
wal
king
or
clim
bing
ste
ps o
r hi
lls?
Doe
s (N
AM
E)
have
diffi
culty
in
rem
embe
ring
or
conc
entr
atin
g?
Doe
s (N
AM
E) h
ave
diffi
culty
in (
with
se
lf ca
re s
uch
as)
was
hing
all
over
or
dres
sing
, fe
edin
g,
toile
ting
etc.
?
Doe
s (N
AM
E)
have
diffi
culty
in
com
mun
icat
ing,
(f
or e
xam
ple
unde
r-st
andi
ng o
ther
s or
ot
hers
und
erst
andi
ng
him
/her
) be
caus
e of
a
phys
ical
, m
enta
l or
em
otio
nal h
ealth
C
ondi
tion?
(216)
(217)
(218)
(219)
(220)
(221)
(222)
DIS
ABIL
ITY
CO
DES
BEL
OW
01
1
2
3
4
8
1
2
3
4
8
1
2
3
4
8
1
2
3
4
8
1
2
3
4
8
1
2
3
4
8
02
1
2
3
4
8
1
2
3
4
8
1
2
3
4
8
1
2
3
4
8
1
2
3
4
8
1
2
3
4
8
03
1
2
3
4
8
1
2
3
4
8
1
2
3
4
8
1
2
3
4
8
1
2
3
4
8
1
2
3
4
8
04
1
2
3
4
8
1
2
3
4
8
1
2
3
4
8
1
2
3
4
8
1
2
3
4
8
1
2
3
4
8
05
1
2
3
4
8
1
2
3
4
8
1
2
3
4
8
1
2
3
4
8
1
2
3
4
8
1
2
3
4
8
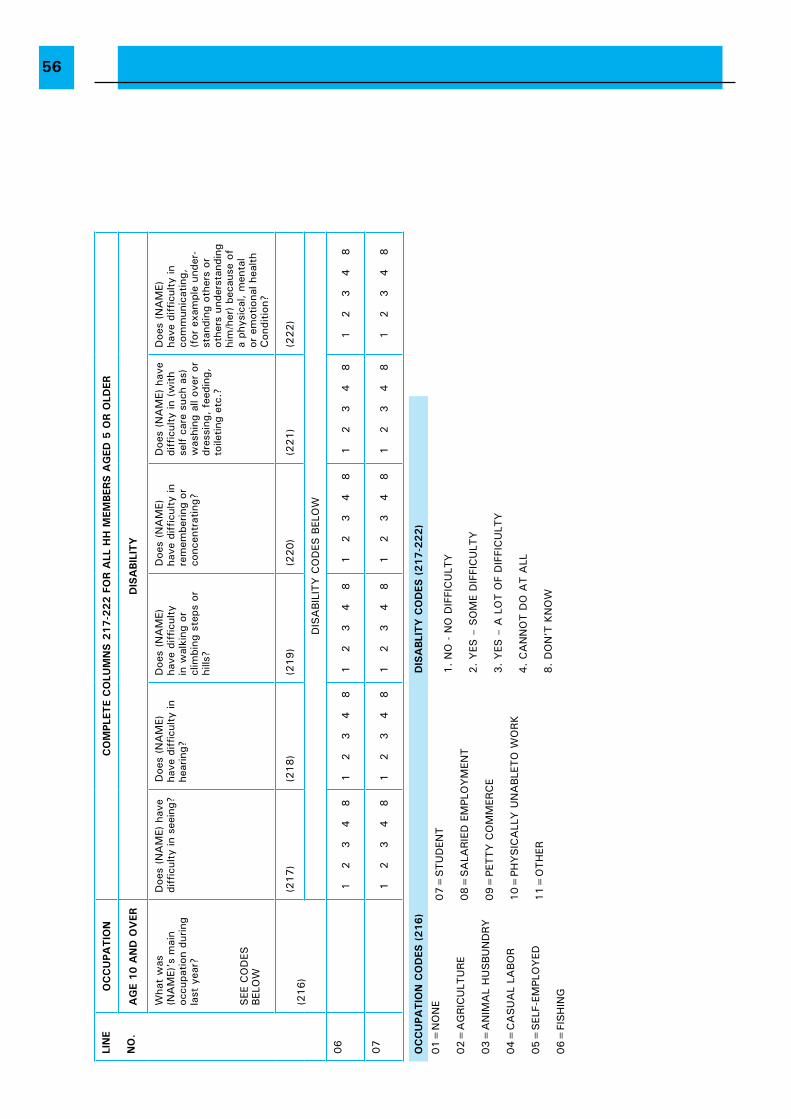
56
LiN
E
NO
.
OC
CU
PAtiO
NC
OM
PLEt
E C
OLU
MN
S 2
17-2
22 F
OR A
LL H
H M
EMBER
S A
GED
5 O
R O
LDER
AG
E 10 A
ND
OV
ERD
iSA
BiL
itY
Wha
t w
as
(NA
ME)
’s m
ain
occu
patio
n du
ring
last
yea
r?
SEE
CO
DES
BEL
OW
Doe
s (N
AM
E) h
ave
diffi
culty
in s
eein
g?D
oes
(NA
ME)
ha
ve d
ifficu
lty in
he
arin
g?
Doe
s (N
AM
E)
have
diffi
culty
in
wal
king
or
clim
bing
ste
ps o
r hi
lls?
Doe
s (N
AM
E)
have
diffi
culty
in
rem
embe
ring
or
conc
entr
atin
g?
Doe
s (N
AM
E) h
ave
diffi
culty
in (
with
se
lf ca
re s
uch
as)
was
hing
all
over
or
dres
sing
, fe
edin
g,
toile
ting
etc.
?
Doe
s (N
AM
E)
have
diffi
culty
in
com
mun
icat
ing,
(f
or e
xam
ple
unde
r-st
andi
ng o
ther
s or
ot
hers
und
erst
andi
ng
him
/her
) be
caus
e of
a
phys
ical
, m
enta
l or
em
otio
nal h
ealth
C
ondi
tion?
(216)
(217)
(218)
(219)
(220)
(221)
(222)
DIS
ABIL
ITY
CO
DES
BEL
OW
06
1
2
3
4
8
1
2
3
4
8
1
2
3
4
8
1
2
3
4
8
1
2
3
4
8
1
2
3
4
8
07
1
2
3
4
8
1
2
3
4
8
1
2
3
4
8
1
2
3
4
8
1
2
3
4
8
1
2
3
4
8
OC
CU
PAtiO
N C
OD
ES (
216)
DiS
ABLi
tY
CO
DES
(217-2
22)
01=
NO
NE
02=
AG
RIC
ULT
URE
03=
AN
IMA
L H
USBU
ND
Ry
04=
CA
SU
AL
LABO
R
05=
SEL
F-EM
PLO
yED
06=
FISH
ING
07=
STU
DEN
T
08=
SA
LARIE
D E
MPL
Oy
MEN
T
09=
PETTy
CO
MM
ERC
E
10=
PHy
SIC
ALL
y U
NA
BLE
TO
WO
Rk
11=
OTH
ER
1.
NO
- N
O D
IFFI
CU
LTY
2.
YES
– S
OM
E D
IFFI
CU
LTY
3.
YES
– A
LO
T O
F D
IFFI
CU
LTY
4.
CA
NN
OT D
O A
T A
LL
8.
DO
N’T
KN
OW
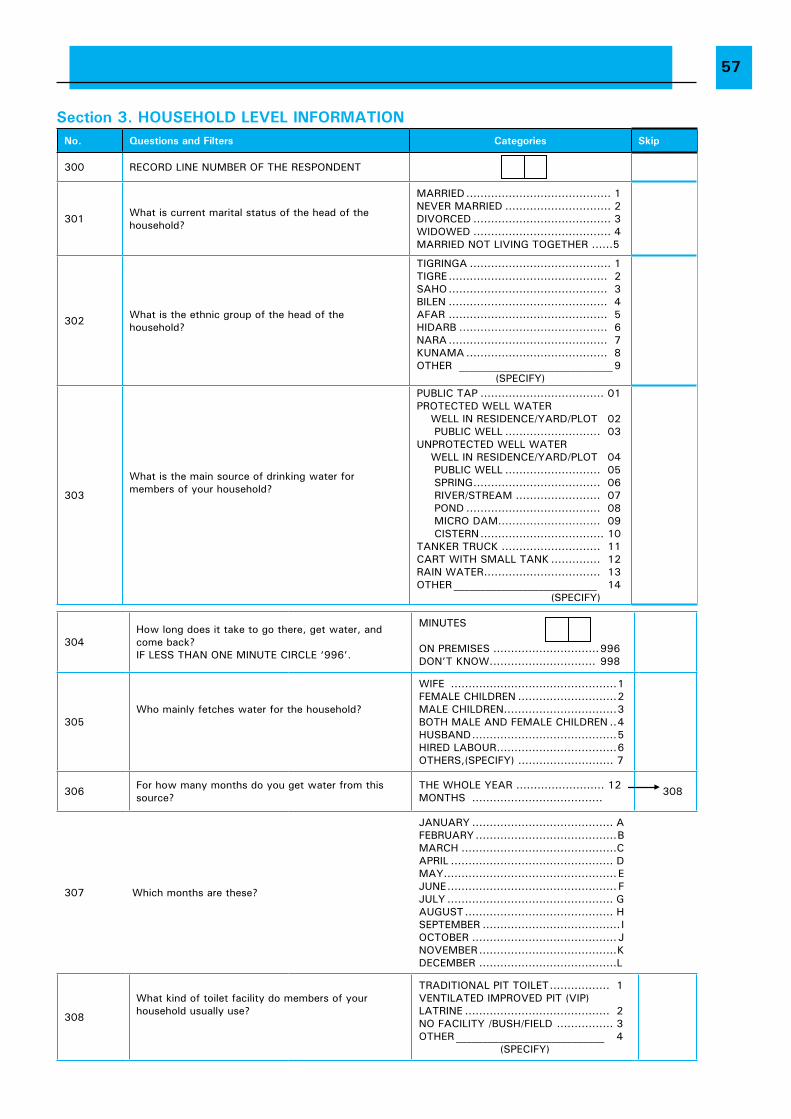
57
Section 3. HOUSEHOLD LEVEL iNFORMAtiONNo. questions and Filters Categories Skip
300 RECORD LINE NUMBER OF THE RESPONDENT
301 What is current marital status of the head of the household?
MARRIED ......................................... 1NEVER MARRIED .............................. 2DIVORCED ....................................... 3WIDOWED ....................................... 4MARRIED NOT LIVING TOGETHER ......5
302 What is the ethnic group of the head of the household?
TIGRINGA ........................................ 1TIGRE ............................................. 2SAHO ............................................. 3BILEN ............................................. 4AFAR ............................................. 5HIDARB .......................................... 6NARA ............................................. 7KUNAMA ........................................ 8OTHER _____________________________9
(SPECIFY)
303
What is the main source of drinking water for members of your household?
PUBLIC TAP ................................... 01PROTECTED WELL WATER WELL IN RESIDENCE/YARD/PLOT 02 PUBLIC WELL ........................... 03UNPROTECTED WELL WATER WELL IN RESIDENCE/YARD/PLOT 04 PUBLIC WELL ........................... 05 SPRING .................................... 06 RIVER/STREAM ........................ 07 POND ...................................... 08 MICRO DAM ............................. 09 CISTERN ................................... 10TANKER TRUCK ............................ 11CART WITH SMALL TANK .............. 12RAIN WATER ................................. 13OTHER ___________________________ 14 (SPECIFY)
304How long does it take to go there, get water, and come back? IF LESS THAN ONE MINUTE CIRCLE ‘996’.
MINUTES
ON PREMISES ..............................996DON’T KNOW. ............................. 998
305Who mainly fetches water for the household?
WIFE ...............................................1FEMALE CHILDREN ............................2MALE CHILDREN ................................3BOTH MALE AND FEMALE CHILDREN ..4HUSBAND .........................................5HIRED LABOUR ..................................6OTHERS,(SPECIFY) ........................... 7
306 For how many months do you get water from this source?
THE WHOLE YEAR ......................... 12MONTHS ..................................... 308
307 Which months are these?
JANUARY ........................................ AFEBRUARY ........................................BMARCH ............................................CAPRIL .............................................. DMAY .................................................EJUNE ................................................ FJULY ............................................... GAUGUST .......................................... HSEPTEMBER ....................................... IOCTOBER ......................................... JNOVEMBER .......................................KDECEMBER .......................................L
308
What kind of toilet facility do members of your household usually use?
TRADITIONAL PIT TOILET ................. 1VENTILATED IMPROVED PIT (VIP) LATRINE ......................................... 2NO FACILITY /BUSH/FIELD ................ 3OTHER ____________________________ 4
(SPECIFY)
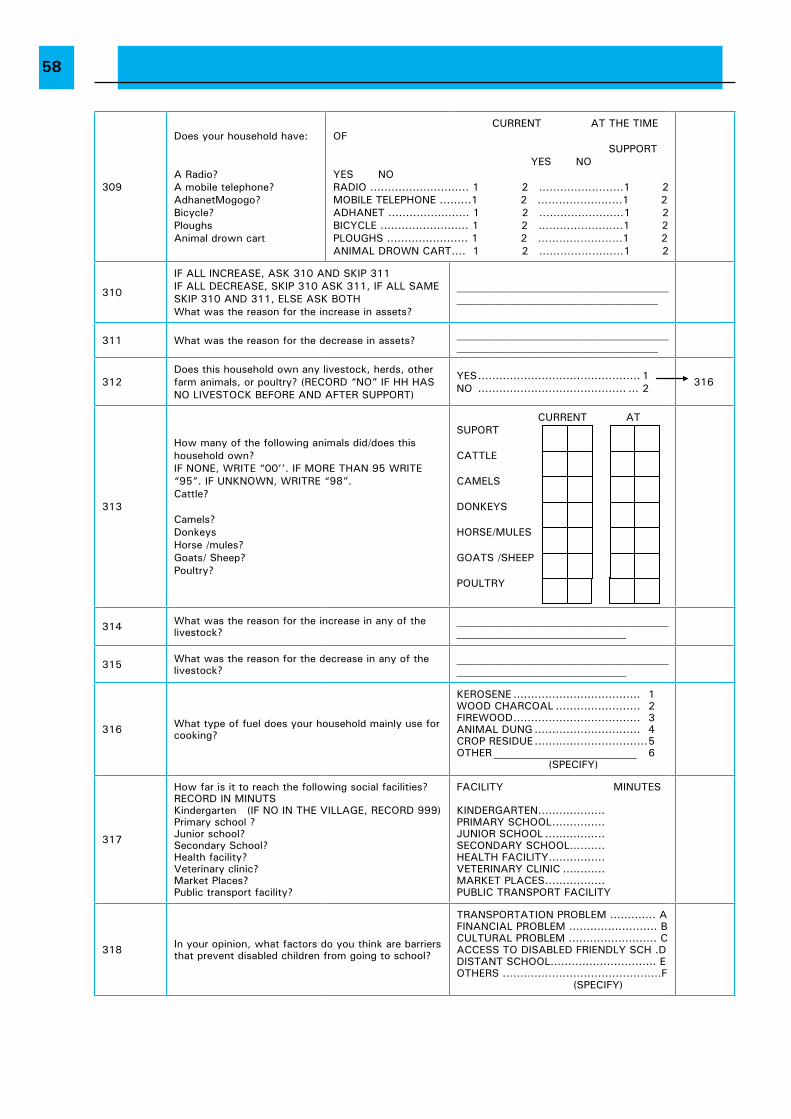
58
309
Does your household have:
A Radio?A mobile telephone?AdhanetMogogo?Bicycle?Ploughs Animal drown cart
CURRENT AT THE TIME OF SUPPORT YES NO YES NORADIO ............................ 1 2 ……………………1 2MOBILE TELEPHONE .........1 2 ……………………1 2ADHANET ....................... 1 2 ……………………1 2BICYCLE ......................... 1 2 ……………………1 2PLOUGHS ....................... 1 2 ……………………1 2ANIMAL DROWN CART.... 1 2 ……………………1 2
310
IF ALL INCREASE, ASK 310 AND SKIP 311IF ALL DECREASE, SKIP 310 ASK 311, IF ALL SAME SKIP 310 AND 311, ELSE ASK BOTHWhat was the reason for the increase in assets?
______________________________________________________________________________
311 What was the reason for the decrease in assets? ______________________________________________________________________________
312Does this household own any livestock, herds, other farm animals, or poultry? (RECORD “NO” IF HH HAS NO LIVESTOCK BEFORE AND AFTER SUPPORT)
YES .............................................. 1NO .......................................... ... 2 316
313
How many of the following animals did/does this household own?IF NONE, WRITE “00’’. IF MORE THAN 95 WRITE “95”. IF UNKNOWN, WRITRE “98”.Cattle?
Camels?Donkeys Horse /mules?Goats/ Sheep?Poultry?
CURRENT AT SUPORT
CATTLE
CAMELS
DONKEYS
HORSE/MULES
GOATS /SHEEP
POULTRY
314 What was the reason for the increase in any of the livestock?
________________________________________________________________________
315 What was the reason for the decrease in any of the livestock?
________________________________________________________________________
316 What type of fuel does your household mainly use for cooking?
KEROSENE .................................... 1WOOD CHARCOAL ........................ 2FIREWOOD .................................... 3ANIMAL DUNG .............................. 4CROP RESIDUE ................................5OTHER ___________________________ 6 (SPECIFY)
317
How far is it to reach the following social facilities? RECORD IN MINUTS Kindergarten (IF NO IN THE VILLAGE, RECORD 999) Primary school ?Junior school?Secondary School?Health facility?Veterinary clinic?Market Places?Public transport facility?
FACILITY MINUTES
KINDERGARTEN ................... PRIMARY SCHOOL ...............JUNIOR SCHOOL ................. SECONDARY SCHOOL .......... HEALTH FACILITY ................ VETERINARY CLINIC ............ MARKET PLACES ................. PUBLIC TRANSPORT FACILITY
318 In your opinion, what factors do you think are barriers that prevent disabled children from going to school?
TRANSPORTATION PROBLEM ............. AFINANCIAL PROBLEM ......................... BCULTURAL PROBLEM ......................... CACCESS TO DISABLED FRIENDLY SCH .DDISTANT SCHOOL.............................. EOTHERS .............................................F (SPECIFY)
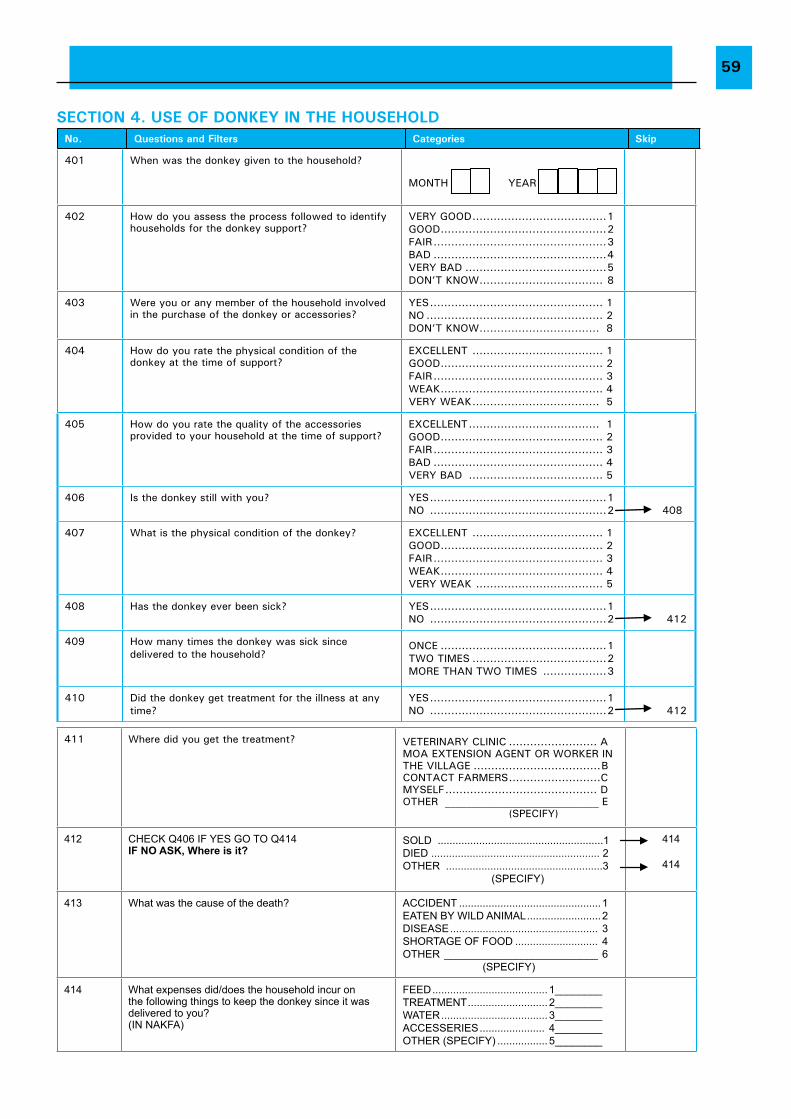
59
SECtiON 4. USE OF DONKEY iN tHE HOUSEHOLDNo. questions and Filters Categories Skip
401 When was the donkey given to the household?
MONTH YEAR
402 How do you assess the process followed to identify households for the donkey support?
VERY GOOD ......................................1GOOD ...............................................2FAIR .................................................3BAD .................................................4VERY BAD ........................................5DON’T KNOW ................................... 8
403 Were you or any member of the household involved in the purchase of the donkey or accessories?
YES ................................................. 1NO .................................................. 2DON’T KNOW .................................. 8
404 How do you rate the physical condition of the donkey at the time of support?
ExCELLENT ..................................... 1GOOD .............................................. 2FAIR ................................................ 3WEAK .............................................. 4VERY WEAK .................................... 5
405 How do you rate the quality of the accessories provided to your household at the time of support?
ExCELLENT ..................................... 1GOOD .............................................. 2FAIR ................................................ 3BAD ................................................ 4VERY BAD ...................................... 5
406 Is the donkey still with you? YES ..................................................1NO ..................................................2 408
407 What is the physical condition of the donkey? ExCELLENT ..................................... 1GOOD .............................................. 2FAIR ................................................ 3WEAK .............................................. 4VERY WEAK .................................... 5
408 Has the donkey ever been sick? YES ..................................................1NO ..................................................2 412
409 How many times the donkey was sick since delivered to the household?
ONCE ...............................................1TWO TIMES ......................................2MORE THAN TWO TIMES ..................3
410 Did the donkey get treatment for the illness at any time?
YES ..................................................1NO ..................................................2 412
411 Where did you get the treatment? VETERINARY CLINIC ......................... AMOA ExTENSION AGENT OR WORKER IN THE VILLAGE ....................................BCONTACT FARMERS ..........................CMYSELF ........................................... DOTHER _____________________________ E (SPECIFY)
412 CHECK Q406 IF YES GO TO Q414IF NO ASK, Where is it?
SOld ........................................................1dIEd ......................................................... 2OTHEr .....................................................3 (SpECIFY)
414 414
413 What was the cause of the death? ACCIdEnT ................................................1EATEn bY WIld AnImAl .........................2dISEASE .................................................. 3SHOrTAGE OF FOOd ............................ 4OTHEr __________________________ 6 (SpECIFY)
414 What expenses did/does the household incur on the following things to keep the donkey since it was delivered to you? (In nAKFA)
FEEd ....................................... 1________TrEATmEnT ........................... 2________WATEr .................................... 3________ACCESSErIES ...................... 4________OTHEr (SpECIFY) ................. 5________
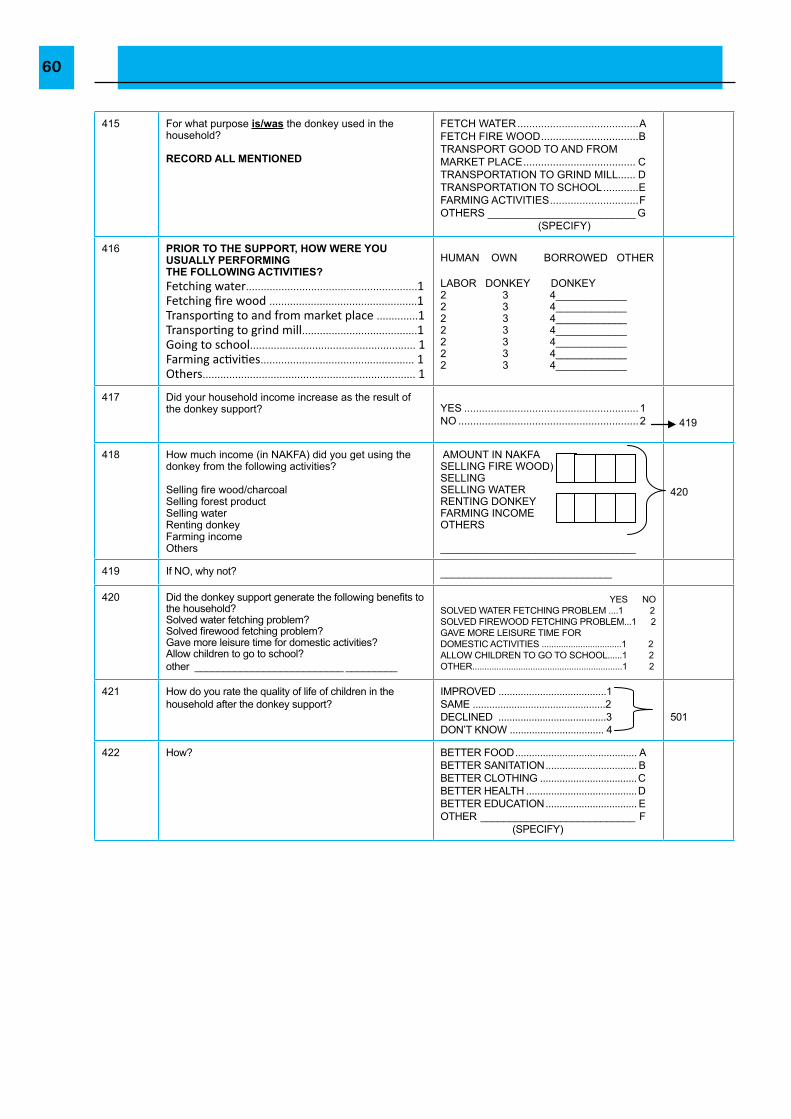
60
415 For what purpose is/was the donkey used in the household?
RecORd All meNtIONed
FETCH WATEr .........................................AFETCH FIrE WOOd .................................bTrAnSpOrT GOOd TO And FrOm mArKET plACE ...................................... CTrAnSpOrTATIOn TO GrInd mIll ...... dTrAnSpOrTATIOn TO SCHOOl ............EFArmInG ACTIvITIES ..............................FOTHErS _________________________ G (SpECIFY)
416 PRIOR tO the SuPPORt, hOW WeRe yOu uSuAlly PeRFORmINg the FOllOWINg ActIvItIeS? Fetching water..........................................................1 Fetching fire wood ..................................................1 Transporting to and from market place ..............1 Transporting to grind mill.......................................1 Going to school........................................................ 1 Farming activities.................................................... 1 Others........................................................................ 1
HUmAn OWn bOrrOWEd OTHEr lAbOr dOnKEY dOnKEY2 3 4____________2 3 4____________2 3 4____________2 3 4____________2 3 4____________2 3 4____________2 3 4____________
417 did your household income increase as the result of the donkey support? YES ...........................................................1
nO .............................................................2 419
418 How much income (in nAKFA) did you get using the donkey from the following activities?
Selling fire wood/charcoalSelling forest productSelling waterrenting donkeyFarming incomeOthers
AmOUnT In nAKFASEllInG FIrE WOOd) SEllInG SEllInG WATEr rEnTInG dOnKEY FArmInG InCOmE OTHErS
_________________________________
420
419 If nO, why not? _____________________________
420 Did the donkey support generate the following benefits to the household?Solved water fetching problem?Solved firewood fetching problem?Gave more leisure time for domestic activities?Allow children to go to school?other __________________________ _________
YES nOSOlvEd WATEr FETCHInG prOblEm ....1 2SOlvEd FIrEWOOd FETCHInG prOblEm...1 2 GAvE mOrE lEISUrE TImE FOr dOmESTIC ACTIvITIES .................................1 2AllOW CHIldrEn TO GO TO SCHOOl......1 2OTHEr..............................................................1 2
421 How do you rate the quality of life of children in the household after the donkey support?
ImprOvEd .......................................1SAmE ................................................2dEClInEd .......................................3dOn’T KnOW .................................. 4
501
422 How? bETTEr FOOd ............................................ AbETTEr SAnITATIOn ................................. bbETTEr ClOTHInG ...................................CbETTEr HEAlTH ........................................dbETTEr EdUCATIOn ................................. EOTHEr ___________________________ F (SpECIFY)
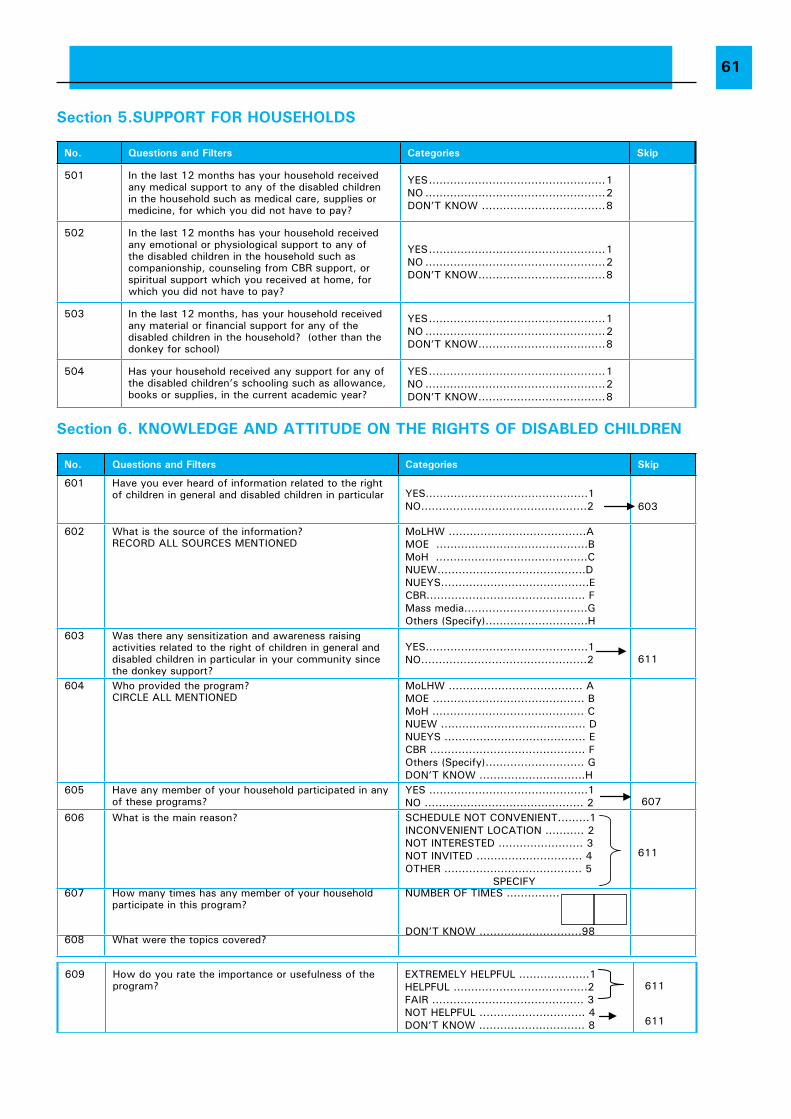
61
Section 5.SUPPORt FOR HOUSEHOLDS
No. questions and Filters Categories Skip
501 In the last 12 months has your household received any medical support to any of the disabled children in the household such as medical care, supplies or medicine, for which you did not have to pay?
YES ..................................................1NO ...................................................2DON’T KNOW ...................................8
502 In the last 12 months has your household received any emotional or physiological support to any of the disabled children in the household such as companionship, counseling from CBR support, or spiritual support which you received at home, for which you did not have to pay?
YES ..................................................1NO ...................................................2DON’T KNOW ....................................8
503 In the last 12 months, has your household received any material or financial support for any of the disabled children in the household? (other than the donkey for school)
YES ..................................................1NO ...................................................2DON’T KNOW ....................................8
504 Has your household received any support for any of the disabled children’s schooling such as allowance, books or supplies, in the current academic year?
YES ..................................................1NO ...................................................2DON’T KNOW ....................................8
Section 6. KNOWLEDGE AND AttitUDE ON tHE RiGHtS OF DiSABLED CHiLDREN
No. questions and Filters Categories Skip
601 Have you ever heard of information related to the right of children in general and disabled children in particular YES..............................................1
NO...............................................2 603
602 What is the source of the information?RECORD ALL SOURCES MENTIONED
MoLHW .......................................AMOE ...........................................BMoH ...........................................CNUEW..........................................DNUEYS..........................................ECBR............................................. FMass media...................................GOthers (Specify).............................H
603 Was there any sensitization and awareness raising activities related to the right of children in general and disabled children in particular in your community since the donkey support?
YES..............................................1NO...............................................2
611
604 Who provided the program?CIRCLE ALL MENTIONED
MoLHW ...................................... AMOE ........................................... BMoH ........................................... CNUEW ......................................... DNUEYS ........................................ ECBR ............................................ FOthers (Specify)............................ GDON’T KNOW ..............................H
605 Have any member of your household participated in any of these programs?
YES .............................................1NO ............................................. 2
607
606 What is the main reason? SCHEDULE NOT CONVENIENT.........1INCONVENIENT LOCATION ........... 2NOT INTERESTED ........................ 3NOT INVITED .............................. 4OTHER ....................................... 5
SPECIFY
611
607 How many times has any member of your household participate in this program?
NUMBER OF TIMES ...............
DON’T KNOW .............................98608 What were the topics covered?
609 How do you rate the importance or usefulness of the program?
ExTREMELY HELPFUL ....................1HELPFUL ......................................2FAIR ........................................... 3NOT HELPFUL .............................. 4DON’T KNOW .............................. 8
611
611
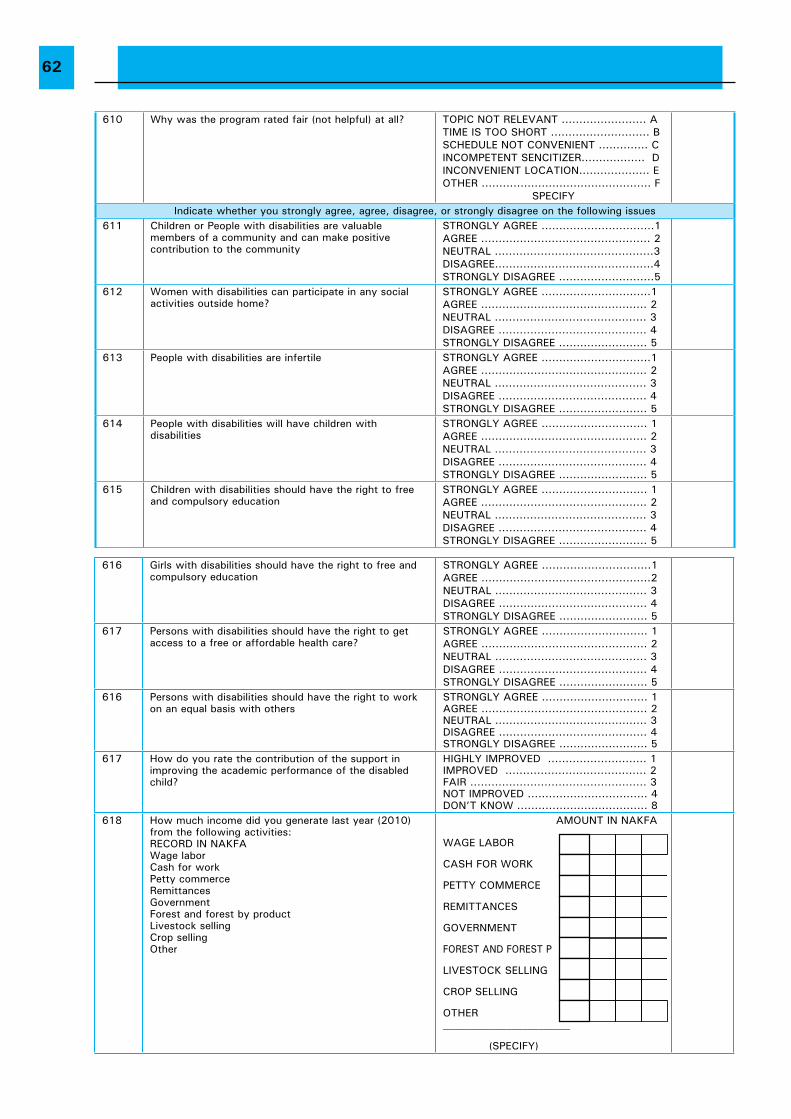
62
610 Why was the program rated fair (not helpful) at all? TOPIC NOT RELEVANT ........................ ATIME IS TOO SHORT ............................ BSCHEDULE NOT CONVENIENT .............. CINCOMPETENT SENCITIZER.................. DINCONVENIENT LOCATION.................... EOTHER ................................................ F
SPECIFYIndicate whether you strongly agree, agree, disagree, or strongly disagree on the following issues
611 Children or People with disabilities are valuable members of a community and can make positive contribution to the community
STRONGLY AGREE ................................1AGREE ................................................ 2NEUTRAL .............................................3DISAGREE.............................................4STRONGLY DISAGREE ...........................5
612 Women with disabilities can participate in any social activities outside home?
STRONGLY AGREE ...............................1AGREE ............................................... 2NEUTRAL ........................................... 3DISAGREE .......................................... 4STRONGLY DISAGREE ......................... 5
613 People with disabilities are infertile STRONGLY AGREE ...............................1AGREE ............................................... 2NEUTRAL ........................................... 3DISAGREE .......................................... 4STRONGLY DISAGREE ......................... 5
614 People with disabilities will have children with disabilities
STRONGLY AGREE .............................. 1AGREE ............................................... 2NEUTRAL ........................................... 3DISAGREE .......................................... 4STRONGLY DISAGREE ......................... 5
615 Children with disabilities should have the right to free and compulsory education
STRONGLY AGREE .............................. 1AGREE ............................................... 2NEUTRAL ........................................... 3DISAGREE .......................................... 4STRONGLY DISAGREE ......................... 5
616 Girls with disabilities should have the right to free and compulsory education
STRONGLY AGREE ...............................1AGREE ................................................2NEUTRAL ........................................... 3DISAGREE .......................................... 4STRONGLY DISAGREE ......................... 5
617 Persons with disabilities should have the right to get access to a free or affordable health care?
STRONGLY AGREE .............................. 1AGREE ............................................... 2NEUTRAL ........................................... 3DISAGREE .......................................... 4STRONGLY DISAGREE ......................... 5
616 Persons with disabilities should have the right to work on an equal basis with others
STRONGLY AGREE .............................. 1AGREE ............................................... 2NEUTRAL ........................................... 3DISAGREE .......................................... 4STRONGLY DISAGREE ......................... 5
617 How do you rate the contribution of the support in improving the academic performance of the disabled child?
HIGHLY IMPROVED ............................ 1IMPROVED ........................................ 2 FAIR .................................................. 3NOT IMPROVED .................................. 4DON’T KNOW ..................................... 8
618 How much income did you generate last year (2010) from the following activities: RECORD IN NAKFAWage laborCash for workPetty commerce Remittances GovernmentForest and forest by product Livestock sellingCrop sellingOther
AMOUNT IN NAKFA
WAGE LABOR
CASH FOR WORK
PETTY COMMERCE
REMITTANCES
GOVERNMENT
FOREST AND FOREST P
LIVESTOCK SELLING
CROP SELLING
OTHER ________________________
(SPECIFY)
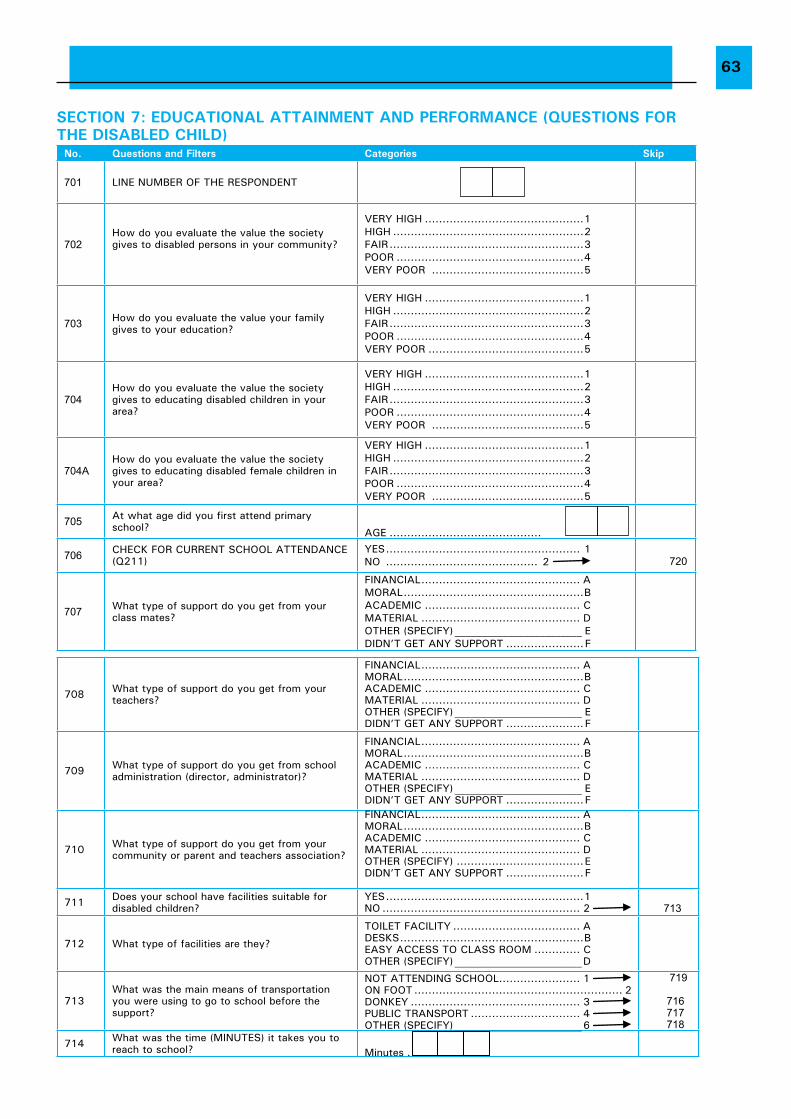
63
SECtiON 7: EDUCAtiONAL AttAiNMENt AND PERFORMANCE (qUEStiONS FOR tHE DiSABLED CHiLD)
No. questions and Filters Categories Skip
701 LINE NUMBER OF THE RESPONDENT
702How do you evaluate the value the society gives to disabled persons in your community?
VERY HIGH .............................................1HIGH ......................................................2FAIR .......................................................3POOR .....................................................4VERY POOR ...........................................5
703 How do you evaluate the value your family gives to your education?
VERY HIGH .............................................1HIGH ......................................................2FAIR .......................................................3POOR .....................................................4VERY POOR ............................................5
704How do you evaluate the value the society gives to educating disabled children in your area?
VERY HIGH .............................................1HIGH ......................................................2FAIR .......................................................3POOR .....................................................4VERY POOR ...........................................5
704AHow do you evaluate the value the society gives to educating disabled female children in your area?
VERY HIGH .............................................1HIGH ......................................................2FAIR .......................................................3POOR .....................................................4VERY POOR ...........................................5
705 At what age did you first attend primary school? AGE ...........................................
706 CHECK FOR CURRENT SCHOOL ATTENDANCE (Q211)
YES ....................................................... 1NO ........................................... 2 720
707 What type of support do you get from your class mates?
FINANCIAL ............................................. AMORAL ...................................................BACADEMIC ............................................ CMATERIAL ............................................. DOTHER (SPECIFY) ________________________ EDIDN’T GET ANY SUPPORT ......................F
708 What type of support do you get from your teachers?
FINANCIAL ............................................. AMORAL ...................................................BACADEMIC ............................................ CMATERIAL ............................................. DOTHER (SPECIFY) ________________________ EDIDN’T GET ANY SUPPORT ......................F
709 What type of support do you get from school administration (director, administrator)?
FINANCIAL ............................................. AMORAL ...................................................BACADEMIC ............................................ CMATERIAL ............................................. DOTHER (SPECIFY) ________________________ EDIDN’T GET ANY SUPPORT ......................F
710 What type of support do you get from your community or parent and teachers association?
FINANCIAL ............................................. AMORAL ...................................................BACADEMIC ............................................ CMATERIAL ............................................. DOTHER (SPECIFY) ....................................EDIDN’T GET ANY SUPPORT ......................F
711 Does your school have facilities suitable for disabled children?
YES ........................................................1NO ........................................................ 2 713
712 What type of facilities are they?
TOILET FACILITY .................................... ADESKS ....................................................BEASY ACCESS TO CLASS ROOM ............. COTHER (SPECIFY) ________________________D
713What was the main means of transportation you were using to go to school before the support?
NOT ATTENDING SCHOOL ....................... 1 ON FOOT ........................................................... 2DONKEY ................................................ 3 PUBLIC TRANSPORT ............................... 4 OTHER (SPECIFY) ________________________6
719
716 717 718
714 What was the time (MINUTES) it takes you to reach to school? Minutes .
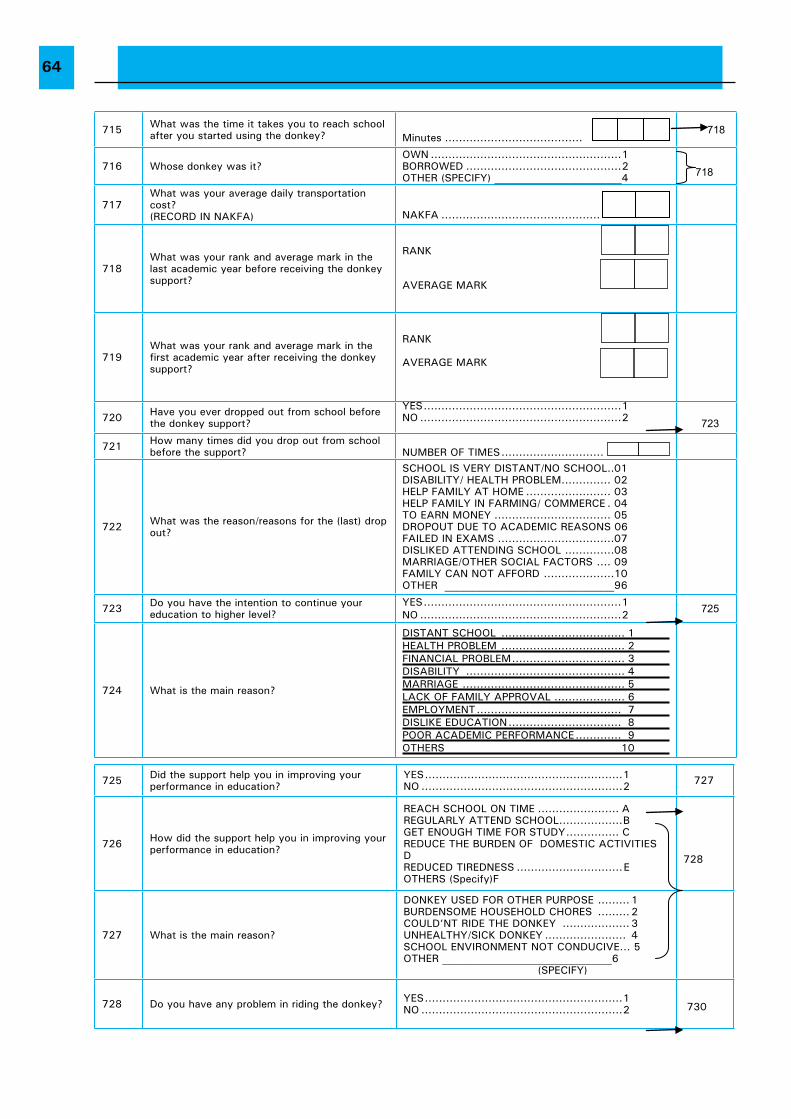
64
715 What was the time it takes you to reach school after you started using the donkey? Minutes .......................................
718
716 Whose donkey was it?OWN ......................................................1BORROWED ............................................2OTHER (SPECIFY) ________________________4 718
717What was your average daily transportation cost? (RECORD IN NAKFA) NAKFA .............................................
718What was your rank and average mark in the last academic year before receiving the donkey support?
RANK
AVERAGE MARK
719What was your rank and average mark in the first academic year after receiving the donkey support?
RANK
AVERAGE MARK
720 Have you ever dropped out from school before the donkey support?
YES ........................................................1NO .........................................................2 723
721 How many times did you drop out from school before the support? NUMBER OF TIMES .............................
722 What was the reason/reasons for the (last) drop out?
SCHOOL IS VERY DISTANT/NO SCHOOL ..01DISABILITY/ HEALTH PROBLEM .............. 02HELP FAMILY AT HOME ........................ 03HELP FAMILY IN FARMING/ COMMERCE . 04TO EARN MONEY ................................. 05DROPOUT DUE TO ACADEMIC REASONS 06FAILED IN ExAMS .................................07DISLIKED ATTENDING SCHOOL ..............08MARRIAGE/OTHER SOCIAL FACTORS .... 09FAMILY CAN NOT AFFORD ....................10OTHER ________________________________96
723 Do you have the intention to continue your education to higher level?
YES ........................................................1NO .........................................................2 725
724 What is the main reason?
DISTANT SCHOOL ................................... 1HEALTH PROBLEM ................................... 2FINANCIAL PROBLEM ................................ 3DISABILITY ............................................. 4MARRIAGE .............................................. 5LACK OF FAMILY APPROVAL .................... 6EMPLOYMENT ......................................... 7DISLIKE EDUCATION ................................ 8POOR ACADEMIC PERFORMANCE ............. 9OTHERS 10
725 Did the support help you in improving your performance in education?
YES ........................................................1NO .........................................................2 727
726 How did the support help you in improving your performance in education?
REACH SCHOOL ON TIME ....................... AREGULARLY ATTEND SCHOOL ..................BGET ENOUGH TIME FOR STUDY ............... CREDUCE THE BURDEN OF DOMESTIC ACTIVITIES DREDUCED TIREDNESS ..............................EOTHERS (Specify)F
728
727 What is the main reason?
DONKEY USED FOR OTHER PURPOSE ......... 1BURDENSOME HOUSEHOLD CHORES ......... 2COULD’NT RIDE THE DONKEY ................... 3UNHEALTHY/SICK DONKEY ....................... 4SCHOOL ENVIRONMENT NOT CONDUCIVE... 5OTHER ________________________________6 (SPECIFY)
728 Do you have any problem in riding the donkey? YES ........................................................1NO .........................................................2
730
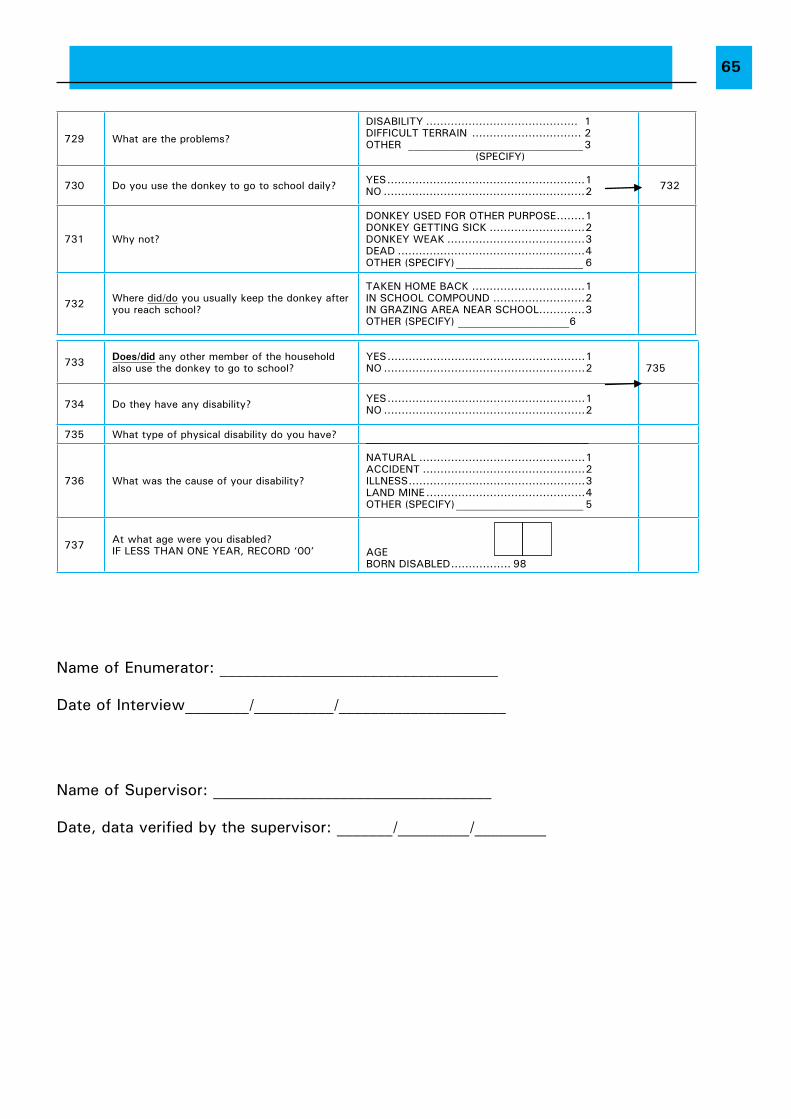
65
729 What are the problems?
DISABILITY ........................................... 1DIFFICULT TERRAIN ............................... 2OTHER _________________________________3 (SPECIFY)
730 Do you use the donkey to go to school daily? YES ........................................................1NO .........................................................2 732
731 Why not?
DONKEY USED FOR OTHER PURPOSE ........1DONKEY GETTING SICK ...........................2DONKEY WEAK .......................................3DEAD .....................................................4OTHER (SPECIFY) ________________________ 6
732 Where did/do you usually keep the donkey after you reach school?
TAKEN HOME BACK ................................1IN SCHOOL COMPOUND ..........................2IN GRAZING AREA NEAR SCHOOL .............3OTHER (SPECIFY) _____________________6
733 Does/did any other member of the household also use the donkey to go to school?
YES ........................................................1NO .........................................................2 735
734 Do they have any disability? YES ........................................................1NO .........................................................2
735 What type of physical disability do you have? ____________________________
736 What was the cause of your disability?
NATURAL ...............................................1ACCIDENT ..............................................2ILLNESS ..................................................3LAND MINE .............................................4OTHER (SPECIFY) ________________________ 5
737 At what age were you disabled?IF LESS THAN ONE YEAR, RECORD ‘00’ AGE
BORN DISABLED ................. 98
Name of Enumerator: ___________________________________
Date of Interview________/__________/_____________________
Name of Supervisor: ___________________________________
Date, data verified by the supervisor: _______/_________/_________
6
66
ANNEx 5: LiSt OF DOCUMENtS REViEWED
1. Eritrea: Basic Education Statistics 2007/08, Ministry of Education, December 2008.
2. Eritrea: Essential Education Indicators 2007/08, Ministry of Education, Asmara, Eritrea, December 2008.
3. Evaluation of the Pilot Injury Surveillance System in Zoba Maekel Based on the International Calssification of External Injuries Causes of Injuries (ICECI), the Injury Surveillance Guidelines, and the International Statistical Classification of Diseases and Related Health Problems, Tenth Revision, Eritrea 2010, UNICEf, MoH, CDC, and WHO.
4. Policy and Strategy on Inclusive Education in Eritrea, Ministry of Education, Asmara, Eritrea, December 2008.
5. Project Proposal on Economic Asset Transfer to Vulnerable Children and Families - The Donkeys for School Project, UNICEF-Eritrea, February 2008.
6. Progress Report on the Donkey for School Project in Eritrea: Swiss Committee for UNICEF, March 31, 2010, UNICEF Eritrea.
7. Situation Analysis of Persons with Disability, Ministry of Labour and Human Welfare, July 2009.
8. Second and Third Consolidated Reports of the Convention on the Rights of the Child, Ministry of Labour and Human Welfare, Asmara, December 2006.
9. Training manuals for disbaled people, World Health Organisation, Jeneva 1989.
10. Guidlenes for the Child Rights Committee, Ministry of Labour and Human Welfare, 30 August 2007.
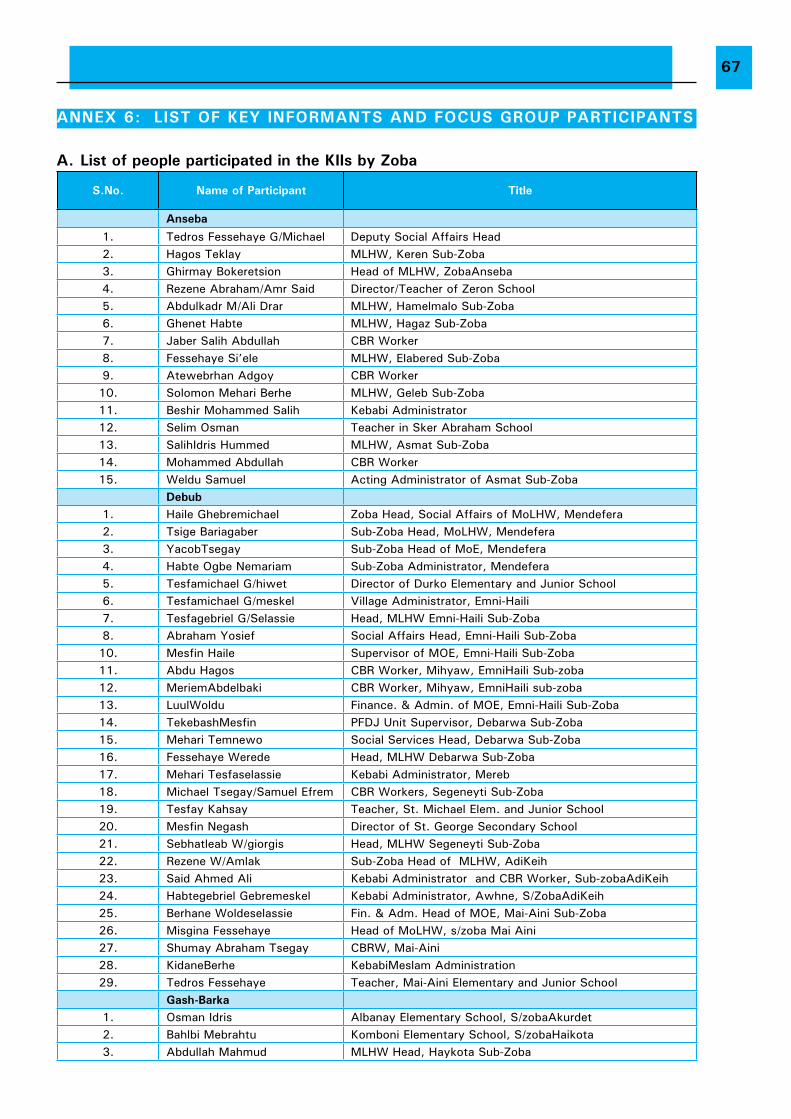
67
ANNEx 6: LiSt OF KEY iNFORMANtS AND FOCUS GROUP PARtiCiPANtS
A. List of people participated in the Kiis by Zoba
S.No. Name of Participant title
Anseba1. Tedros Fessehaye G/Michael Deputy Social Affairs Head2. Hagos Teklay MLHW, Keren Sub-Zoba3. Ghirmay Bokeretsion Head of MLHW, ZobaAnseba4. Rezene Abraham/Amr Said Director/Teacher of Zeron School5. Abdulkadr M/Ali Drar MLHW, Hamelmalo Sub-Zoba6. Ghenet Habte MLHW, Hagaz Sub-Zoba7. Jaber Salih Abdullah CBR Worker 8. Fessehaye Si’ele MLHW, Elabered Sub-Zoba9. Atewebrhan Adgoy CBR Worker10. Solomon Mehari Berhe MLHW, Geleb Sub-Zoba11. Beshir Mohammed Salih Kebabi Administrator12. Selim Osman Teacher in Sker Abraham School13. SalihIdris Hummed MLHW, Asmat Sub-Zoba14. Mohammed Abdullah CBR Worker15. Weldu Samuel Acting Administrator of Asmat Sub-Zoba
Debub1. Haile Ghebremichael Zoba Head, Social Affairs of MoLHW, Mendefera2. Tsige Bariagaber Sub-Zoba Head, MoLHW, Mendefera3. YacobTsegay Sub-Zoba Head of MoE, Mendefera4. Habte Ogbe Nemariam Sub-Zoba Administrator, Mendefera5. Tesfamichael G/hiwet Director of Durko Elementary and Junior School6. Tesfamichael G/meskel Village Administrator, Emni-Haili7. Tesfagebriel G/Selassie Head, MLHW Emni-Haili Sub-Zoba8. Abraham Yosief Social Affairs Head, Emni-Haili Sub-Zoba10. Mesfin Haile Supervisor of MOE, Emni-Haili Sub-Zoba11. Abdu Hagos CBR Worker, Mihyaw, EmniHaili Sub-zoba12. MeriemAbdelbaki CBR Worker, Mihyaw, EmniHaili sub-zoba13. LuulWoldu Finance. & Admin. of MOE, Emni-Haili Sub-Zoba14. TekebashMesfin PFDJ Unit Supervisor, Debarwa Sub-Zoba15. Mehari Temnewo Social Services Head, Debarwa Sub-Zoba16. Fessehaye Werede Head, MLHW Debarwa Sub-Zoba17. Mehari Tesfaselassie Kebabi Administrator, Mereb18. Michael Tsegay/Samuel Efrem CBR Workers, Segeneyti Sub-Zoba19. Tesfay Kahsay Teacher, St. Michael Elem. and Junior School20. Mesfin Negash Director of St. George Secondary School21. Sebhatleab W/giorgis Head, MLHW Segeneyti Sub-Zoba22. Rezene W/Amlak Sub-Zoba Head of MLHW, AdiKeih23. Said Ahmed Ali Kebabi Administrator and CBR Worker, Sub-zobaAdiKeih24. Habtegebriel Gebremeskel Kebabi Administrator, Awhne, S/ZobaAdiKeih25. Berhane Woldeselassie Fin. & Adm. Head of MOE, Mai-Aini Sub-Zoba26. Misgina Fessehaye Head of MoLHW, s/zoba Mai Aini27. Shumay Abraham Tsegay CBRW, Mai-Aini28. KidaneBerhe KebabiMeslam Administration29. Tedros Fessehaye Teacher, Mai-Aini Elementary and Junior School
Gash-Barka1. Osman Idris Albanay Elementary School, S/zobaAkurdet2. Bahlbi Mebrahtu Komboni Elementary School, S/zobaHaikota3. Abdullah Mahmud MLHW Head, Haykota Sub-Zoba
68
S.No. Name of Participant title
4. Tesfazghi Ogbazghi Social Affairs Head of Haykota Sub-Zoba5. Lali Merika Village Administrator, Susona, sub-zobaBarentu6. Hana Osman MLHW, Barentu Sub-Zoba7. Afadesh Samuel MoE Head, Barentu Sub-Zoba8. Ibrahim Mohammed Ali Social Affairs Head of Barentu Sub-Zoba9. Ashkela Abdullah Village Administrator, Kuluku, Sub-zoba Berentu10. Franco Kubaba Administrator of Barentu Sub-Zoba12. Abdullah Omer Karam Head of MoE, Akurdet Sub-Zoba13. Fatna Idris Social Affairs Head of Akurdet Sub-Zoba14. Suleiman Mohammed Ali Social Affairs Head of Dige Sub-Zoba15. Welid Mohammed MoE, Pedagogy Research Center Coordinator, s/zobaDige16. Mathewos Negassi MLHW Head, Sub-ZobaDige17. Idris Mohammed Adem Kebabi Administrator, Sub-zobaDige
Maekel1. Tesfayesus Zekarias Supervisor in MOE, s/zobaBerik2. kiflemariam G/meskel Admin. and Finance Head, 3. Aklilu Fessehaye Director, Sela’EDa’Ero Elem. and Junior School4. TesfalemBahta Teacher, Sela’EDa’Ero Elem. and Junior School5. AndeberhanTekeste CBR Worker, Qazen Village, S/zobaSerejaka6. Asmelash Weldegaber CBRW and Village Administrator, DeqiTsun’a7. Tesfamichael Zere CBR Worker, Geremi8. Zekarias Habte Kebabi Administrator, Geremi9. Michael Teklemariam CBR Worker, Hazega Village10. Zerezghi Yohannes Social Affairs Head, ZobaMaekel11. Mizan kifle CBR Worker, Berik Sub-Zoba12. Tewelde Ainalem Berhe Social Affairs Head, Berik Sub-Zoba13. Goitom Tekle Supervisor in MOE, Berik Sub-Zoba14. Berhane Kiros Social Worker, Asmara Branch Office15. Tesalem Yohannes Head, MLHW Serejeka Sub-Zoba16. Efrem Teklu Supervisor in MOE, AdiGuaedad17. Tsige Woldai Head, MLHW Gala Nefhi Sub-Zoba18. Yosief Teklay Head of MLHW, ZobaMaekel
Northern Red Sea1. Ibrahim Omer Hassen MLHW, Foro Sub-Zoba2. Ahmed Omer Head of MoE, Foro Sub-Zoba3. Russom Hzbay Zoba Social Affairs Deputy Head 4. Alganesh Desale CBR Worker, DongoloLa’Elay5. Hummed M/Mahmud Teacher in HdriSema’etat School6. Fatma Mohammed Social Affairs Head of Ghinda’e Sub-Zoba7. Mohammed Ali Mahmud MLHW of Ghinda’e Sub-Zoba8. Fatma Haji Omer MLHW of Afabet Sub-Zoba9. Osman AdemKhier Social Affairs Head of Afabet Sub-Zoba10. Mussa Adem Ahmedshiek Head of MoE, Afabet Sub-Zoba11. Mahmud Idris Ali CBR Worker 12. Mohammedali Ali Social Affairs Head of Nakfa Sub-Zoba13. Mahmud Mohammedsaid MLHW of Nakfa Sub-Zoba
Southern Red Sea1. Momina Doraa CBR Worker2. Hassen Ibrahim CBR Worker 3. Ismail Osman Zoba Social Affairs Head of MLHW 4. Ali Igahli Kebabi Hamerti Admininstrator
69
B. B. List of people participated in the FGD by Sub-ZobaS.No. Name of Participant title
ZOBA ANSEBA
Sub-zoba Keren
1. Letengus Abraha Social Affairs, Keren Sub-Zoba
2. Fikadu G/Hawariat Head of MoE, Keren Sub-Zoba
3. Jaber Idris Village Administrator
4. Goitom Debesai Director,Kiseri Elementary and Junior School
5. Musa Osman Mohammed Supervisor in MoE, Keren Sub-Zoba
6. Hagos Teklay Head of MLHHW, Keren Sub-Zoba
7. Ali Genbot Parent of a disabled child
Sub-zoba Hamelmalo
1. Sufuf Ali Hamed Parent of a disabled child
2. Osman Ibrahim Drar CBR Worker
3. Mohammednur Humed Village Administrator
4. Haj Idris Osman CBR Worker
5. Salih Mohammed Idris CBR Worker
6. Abo Ibrahim Jimi’e Village Administrator
7. Mahmud Idris Ali CBR Worker
8. Salih Mohammed Nur CBR Worker
9. Mohammed Adem Ismail CBR Worker
10. Abdu A/RahmanHassen CBR Worker
11. Ahmed Bekit Ibrahim CBR Worker
12. Teki’e Askale Mihretab Supervisor in MoE, Hamlmalo Sub-Zoba
13. Rezene Abraham Director, Zrom Elementary and Junior School
14. Amr Said Mohammed Teacher, Genfelom Elem. and Junior School
Sub-zoba Hagaz
1. Zerai Kahsay Zeregaber CBR Worker and Village Administrator
2. Yacob Araya G/Michael CBR Worker and Village Administrator
3. Suleiman Ismail Ali CBR Worker
4. Abdu SalehIdris Supervisor in MoE, Hagaz Sub-Zoba
5. Zienawi Estifanos Asfaha Deputy Social Services Affairs, Hagaz Sub-Zoba
6. Mohammed Ibrahim Khier Village Administrator
Sub-zoba Elabered
1. Atewebrhan Adgoy CBR Worker
2. Teklu Kafel Deputy Administrator of Sub-Zoba
3. Yonas Filipos CBR Worker
4. Uqbit Ghebru CBR Worker
5. Alibekit Osman CBR Worker
6. Arefa Fagr CBR Worker
7. Abdu Amar Kebabi Administrator
8. TekleKahsay Teacher in Awet Elementary and Junior School
9. Eyob Solomon Deputy Director of Awet School
10. Tulul Abdurahman Deputy Supervisor of MoE, Sub-Zoba
11. Kibra Ghilazghi CBR Worker
12. Nebyat Tekeste MLHW, Elabered Sub-Zoba
13. Abeba Petros Kebabi Administrator
14. Timketu Bayra’u CBR Worker
15. Desale Haile CBR Worker
70
S.No. Name of Participant title
Sub-zoba Geleb
1. Bekita Bi’emnet Ezuz CBR Worker
2. Asha Gebries M/Osman CBR Worker
3. Jim’a Tmariam Utman CBR Worker
4. Amna Musa Hamed CBR Worker
5. Bekita Mahmud Humed CBR Worker
6. Zere Ar’adom Ghide MLHW, Geleb Sub-Zoba
7. Mahmud M/Emran Teacher in HadasErtra Elementary School
8. Mohammed Ibrahim Kafel Kebabi Geleb Deputy Admininstrator
9. Shiek Ali Bi’ementEzuz Kebabi Geleb Administrator
Sub-zoba Asmat
1. Ibrahim M/Ali Adem Kebabi Administrator
2. Ali Jim’E Ali Deputy Kebabi Administrator
3. Ibrahim Jimi’eAdem Kebabi Administrator
4. Humed Mohammed Idris Kebabi Administrator
5. Yassin Mohammed Ali Kebabi Administrator
6. Hamed Mohammed Hmed Kebabi Administrator
7. Meriem Ismail CBR Worker
8. Khedija Mohammed Ali CBR Worker
9. Idris Omer CBR Worker
10. Mahmud Humed Teacher in Jani Elementary and Junior School
11. Idris Mohammed Omer Kebabi Administrator
ZOBA DEBUB
Sub-zoba Mendefera
1. Akberet Mihretab CBR Worker, Adi Hare
2. Tigsti Isayas Village Administrator, Adi Bari
3. Abeba Ghebreab CBRW and Village Administrator, AdiWegri
4. Mehari Hayelom Social Affairs, MLHW
5. Kessete Araya CBR Worker, Adi Bari
6. Yohannes Berhe CBR Worker and Social Affairs
7. Semere Andemichael CBR Worker, Adi Ada
ZOBA GASH BARKA
Sub-zoba Molki
1. Ghebriel Kahsay S/zoba Head of MoLHW, Sub-ZobaMolki
2. Ghenet Measho Staff of MLHW, Molki Sub-Zoba
3. Fessehaye Ogbamichael Head, Social Affairs, S/zobaMolki
4. Yirgalem Mehari S/zoba Head of MoE
5. Kidane Woldeselasie Sub-zoba Molki Admininsitrator
6. Zewengiel Berhane PFDJ Head, Sub-ZobaMolki
Sub-zoba Berik
1. Mussie Ghebrehiwet Director, AdiBidel, Awet Elementary School
2. Keshi Kessete Gebreigziabiher CBR Worker, AdiTeklay
3. kiflay Tesfay Kebabi Administrator, Tsa’edaEmba/Adi Musa
4. Michael Teklemariam CBR Worker, Hazega
5. Zewdi Teweldemedhin CBR Worker, AdiGebru
6. Tekea Debesay Village Administrator, AdiShmagle
7. Berhane Seyoum Village Administrator, AdiGebru
ZOBA MAEKEL
71
S.No. Name of Participant title
Sub-zoba Galanefhi
1. kiflom Abraham Kebabi Administrator, AdiHawesha
2. Fessehazion Keshi Ghebregiorgis CBR Worker
3. Tiblets Weldeyesus Kebabi Admnistrator, Tselot
4. Amanuel Seyoum Social Affairs, Sub-Zoba
5. Mohammed Said Hamed Kebabi Administrator, Guli’e
6. Yordanos Kibrom CBR Worker, Merhano
7. Tiblets Weldgerima CBR Worker, Abarda’e
8. Abraha Tsegay Kebabi Administrator, AdiTsena’E
9. Adem Hassen Kebabi Administrator, Arberebu’E
ZOBA NORtHERN RED SEA
Sub-zoba Nakfa
1. Mohammed Isa Mohammed Supervisor in MoE, Nakfa Sub-Zoba
2. Mohammedali AfaIdris Village Administrator
3. Jemi’eya Osman Mohammed Village Deputy Administrator
4. Chewai Omer Idris CBR Worker
5. Salih Hamed Mohammed CBR Worker
6. Mohammednur M/Ali CBR Worker
Sub-zoba Foro
1. Alem Hagos G/medhin CBR Worker
2. Omer Abrhum Tsa’eda Village Administrator/CBR Worker
3. Asha Humed M/Ali CBR Worker
4. Mahmud M/Ahmed Director, Adalet Elementary and Junior School
5. Ahmed Yassin Osman CBR Worker
6. Ibrahim Omer Hassen CBR Worker
7. Mohammed Ahmed Idris CBR Worker
8. Adem Dini Ibrahim Kebabi Administrator
9. Jaber Mohammed Jaber CBR Worker
10. Abdullah Yassin Osman Kebabi Administrator
Southern Red Sea
ZOBA SOUtHERN RED SEA
Sub-zoba Debub Denkel
1. Ali Mohammed Ahmed Deputy Kebabi Administrator
2. Ali Mohammed Ahmed Kebabi Administrator
3. Momina BuyiGedis CBR Worker
4. Fatma Abdullah Hamed CBR Worker
5. Hasna Ibrahim Mohammed CBR Worker
6. Issayas Tewlde Kahsay MLHW, Debub Denkel Sub-Zoba