Embed Size (px)
Citation preview

Ministry of Health
A MANUAL FOR STRENGTHENING HMIS DATA QUALITY
Self Monitoring Information Use Feedback Mechanism

2
UPHOLD is implemented by JSIResearch & Training Institute, Inc.,under Cooperative Agreement Number617-A-00-02-00012-00, in collaborationwith Education Development Center,Inc. (EDC), The Futures GroupInternational, The Malaria Consortium,The Manoff Group, Inc., and WorldEducation, Inc.
This report was made possible by thegenerous support of the American peoplethrough the United States Agency forInternational Development (USAID). Thecontents are the responsibility of UPHOLDand do not necessarily reflect the views ofUSAID or the United States Government

3
TABLE OF CONTENTS
INTRODUCTION 7
MODULE I: REVIEW OF HMIS PRINCIPLES, ASSUMPTIONS & BENEFITS 9
SESSION 1…………………………………………………………………………………………………… 9
MODULE II: IMPROVING HMIS DATA QUALITY 11
SESSION 2: ………………………………………………………………………………………...……….. 11 SESSION 3: SKILLS FOR CHECKING DATA QUALITY …………………………………………………….. 20 SESSION 4: SOLUTION DEVELOPMENT FOR IMPROVING DATA QUALITY ……………………………… 26
MODULE III: IMPROVING INFORMATION USE 28
SESSION 1: GOAL SETTING – A TOOL FOR IMPROVING DATA QUALITY ………………………………. 28 SESSION 2: SELF ASSESSMENT TO IMPROVE INFORMATION USE ………………………………………. 32 MODULE III SELF-ASSESSMENT USING HMIS DATA …………………………………………………. 32
MODULE IV: DISTRICT FEEDBACK REPORT 36
SESSION 1: FEEDBACK, STRENGTHS, AND WEAKNESSES ……………………………………………….. 36 SESSION 2: WHAT IS COMPARATIVE ANALYSIS? ………………………………………………………... 41 SESSION 3: WRITE A FEEDBACK REPORT YOURSELF …………………………………………………… 50 CONCLUDING SESSION …………………………………………………………………………………...51
MODULE V: TRANING MANUAL ON LQAS 52
HMIS 105: HEALTH UNIT MONTHLY REPORT 60
HAND-OUT–CODE SHEET 62

4
Training Schedule Day I Topic
Objectives
Activities
15 Minutes Inauguration Welcome address 1 Hour Introduction, expectations
Share participants’ positive experiences
15 Minutes Understand and compare existing HMIS information
Exercise for listing
Session I 1HR 45 Minutes
30 Minutes List benefits of HMIS Exercise for listing
Break Tea 1 HR Importance of data quality
List reasons for emphasizing data quality Define data quality in quantitative terms
Exercise for listing Discussion
45 Minutes Causes of gaps in data quality
List causes of gaps in data quality
Exercise on five why
Session II 2 HRS 30Minutes
45 Minutes Develop priority criteria for selecting causes
Exercise on priority selection criteria
45 Minutes Lunch
30 Minutes Solutions
Develop solutions for improving data quality
Exercise: Brainstorming on solutions for improving data quality
15 Minutes Develop priority criteria for selecting solution
Exercise on priority selection criteria
Session III 1HR 15 Minutes
30 Minutes Select solution Exercise 15 Minutes Break Tea
15 Minutes Check data quality exercise
Understand what is required for data quality check
Discuss: Explain LQAS table
30 Minutes Learn to use LQAS table for checking data quality
Session IV 2 HRS
45 Minutes Check data quality Exercise: 4:30–5:00 Share results, lesson learned

5
Day II Topic Objectives
Activities
30 Minutes
Overview of previous day’s activities, today’s schedule
30 Minutes Motivation for improving data quality
Learn to use goal setting as motivation activity Learn criteria for goal setting
Discuss: Importance of goal as motivating force Relate to participants’ experience Exercise: Develop goal
30 Minutes Technique for monitoring goal
Use LQAS for monitoring
Exercise:
Session I 1 HR 30 Minutes
1 HR
Develop action plan Exercise:
15 Minutes
Tea Break
15 Minutes Importance of self-assessment using HMIS data
Understand the value of taking responsibility Understand the utility of self-assessment
Discuss: Responsibility for coverage, disease surveillance, quality of care, data collection Exercise: Use a table and collect responses
Session II 2 HRS
15 Minutes Learn to use self-assessment for improving data quality, service coverage. quality
Exercise: Provide guideline for self-assessment by using various scenarios Presentation on using data for improving coverage
11:00-12:45
45 Minutes
Lunch
15 Minutes Feedback report
Identify strengths and weaknesses of the current feedback report
Discuss: Strengths and weakness of current feedback report
45 Minutes List the variables available in the monthly data file, including population data for use as denominator for calculating indicators
What data are available in monthly report file Material: Monthly data for three months Computer: EpiInfo software
Session III 1HR 15 Minutes
15 Minutes Learn to check data quality by finding errors in data entry
How to check data quality?
15 Minutes
Tea
1 HR Learn to develop indicators Exercise: Conversion of data into information, i.e., indicators How to check data quality?
Session IV 2 HRS
1 HR Learn to describe existing situation by using frequency tabulation
What indicators tell me? Exercise: Interpret and suggest for action Group feedback on results

6
Day III Topic Objectives
Activities
30 Minutes
Inauguration Overview of previous day’s activities, today’s schedule
Session I 1HR 30 Minutes
15 Minutes Learn comparative analysis Presentation
30 Minutes Exercise: Conduct comparative analysis
45 Minutes Interpretation Suggestions for actions
15 Minutes
Tea
30 Minutes Exercise: Group work to develop table, charts Write feedback report
Session II 2 HRS
1HR 30 Minutes
Learn to write feedback report Presentation by groups Feedback by groups (provide guide on how to deliver feedback on report)
45 Minutes
Concluding session Vote of thanks
Lunch

7
INTRODUCTION
This manual is based on the situation analysis conducted by the Ministry of Health in January 2004, with assistance from UPHOLD Project. The situation analysis, like previous studies, found major gaps in Health Management Information System (HMIS) performance, which were low data quality and use of information. This training manual aims at improving data quality and use of information at facility and district levels, by upgrading knowledge and skills related to HMIS tasks. However, this manual is based on the assumption that organizational members are thinking beings, who can make choices that can make differences for better situations. These assumptions are in turn translated into skills that make this manual unique and worthy, reinforcing the principle promoted in HMIS Procedure Manuals for facilities and districts. Rational and Added Value of This Training Manual HMIS performance (Data quality and information use) is conceptualized as function
of individual (knowledge, skills, and motivation) and contextual (Management commitment, culture of information, supervision, availability of resources etc.) factors. The participants will learn how to make changes at both levels.
The training is based on problem-solving process that will enable health workers to identify issues of concern and how to deal with them
The training improves motivation by high-lighting positive consequences of HMIS tasks as well as target setting. It is empowering by teaching advocacy skills
The training is geared towards learning performance improvement tools such as cause and effect analysis, control charts, facilitating problem solving etc.
The training emphasizes values such as taking initiative, responsibility, and being accountable that are essential for promoting a culture of information.
The training emphasizes self-regulation for continuous improvement. Target Group Facility In-charge and Staff District Managers and HMIS staff Learning Objectives By the end of the training, participants would be able to: Review HMIS principles and benefits Define data quality, measure data quality using Lot Quality Assurance Sampling
(LQAS); identify causes of gaps using the cause and effect diagram; feel empowered and conduct advocacy addressing gap in data quality; motivate by setting targets for data quality; and making changes in data quality using control charts and LQAS
Conduct Self-regulation for improving HMIS performance – data quality and use of information

8
Inauguration Session Purpose: The opening session of the training introduces the training and the overall and daily schedules; introduces the trainers and participants; and describe logistics. Time: 60 minutes
Preparation before the training: Overhead 1: Knowing each other Overhead 2: Purpose, skills statement Overhead 3: Overall and daily schedules Overhead 4: Logistics statement
Delivery: Introduction - Who’s who? Time: 15 minutes Purpose, skills statement Time: 15 minutes
Overall and daily schedules Time: 15 minutes Logistics statement Time: 5 minutes Speeches Time: 10 minutes
Step 1: Ask participants to introduce themselves. Step 2: Ask participants about their training expectations. Step 3: Ask participants to share one positive experience of HMIS tasks. Ask someone to write them on flipchart and post list on wall for future reference.
Objectives
Learn about the purpose of the training;
Participants themselves to each other, share experiences about related
topics;
Review overall and daily schedules for the training

9
MODULE I: REVIEW OF HMIS PRINCIPLES, ASSUMPTIONS & BENEFITS
Session 1: List, Categorize, and Compare Knowledge Related to Monthly Reporting Form Time: 30 minutes Materials: 3- x 5-inch sticky cards Markers Category cards on data available on monthly reporting form Step 1: Ask participants to write on one sticky card one item of information available
on the monthly reporting form. Encourage participants to write more than one item of information on an appropriate number of cards. Advise participants that the task should be completed in five minutes.
Step 2: Ask participants to post the cards on the wall or flip chart.
Step 3: After the cards are posted, put the category cards on the wall. Ask participants to group the information written on the sticky cards into the categories below. Advise participants that the task should be completed in five to 10 minutes.
1) Out-patient attendance 2) Laboratory tests, diseases 3) MCH and family planning activities 4) Essential drugs and contraceptives 5) Other outreach activities 6) Financial summary 7) Comments 8) List of staff members not receiving salary and/or allowance last
month 9) Monthly monitoring.
Objectives
By end of session, participants will be able to:
List the information available on the monthly reporting form and compare it with their own knowledge; and
Describe benefits of the information at different levels–personal, management, community, policy, advocacy, others.

10
Step 4: Compare categories with the lowest and highest number of responses and note whether some categories have no responses.
Step 5: Discuss with participants the reasons for low and high responses and their
implications.

11
MODULE II: IMPROVING HMIS DATA QUALITY
Session 2: Defining Data Quality Activity I: Defining Data Quality Time: 30 minutes Materials: Flip chart, markers Step 1: Ask participants what they understand by data quality and record their responses.
Check whether someone defined data quality in the following terms: Completeness Timeliness Relevance Accurate numbers Poor or good records about a thing, situation, or service.
Activity II: Importance of Data Quality Step 1: Ask participants, why timeliness is part of data quality?
Some responses could be: Data available when needed If the data is not provided on time for decision making then it is of no use
Step 2: Ask participants, what is the definition of timeliness in HMIS procedural manual
Objectives
By end of session, participants will be able to:
Define data quality quantitatively;
Identify causes of gaps in data quality, including their responsibility;
Develop solution(s) for closing gaps in data quality, including whatparticipants should do;
Measure data quality using LQAS tables
Develop plan to check gaps in data quality by using LQAS; and
Develop monitoring plan, chart, and display.

12
The forms are submitted according to the prescribed schedule
After discussing the participants’ responses conclude: Timeliness reflects that data is collected, transmitted and processed according to prescribed time and available for making timely decisions. Step 3: Ask participants, why completeness is part of data quality?
Some responses could be: If the required data is missing, then appropriate actions cannot be taken To monitor the all services provided To track what proportion of geographical areas and population is covered To provide resources needed to provide the services To monitor both public and private sector for getting a total picture of the health
system Step 4: Ask participants what is the definition of completeness in HMIS procedural manual
All the data elements in the columns of registers and database tables should be filled. In addition for HSD and district levels, completeness means all health units and Health Sub-districs respectively are reporting
After discussing the participants’ responses conclude:
If the registers are not filled properly then it will be difficult to count the record in them, leading to failure to fill the databases and reporting forms for the district.
Step 5: Ask participants, why relevance is part of data quality?
Some responses could be: Data collected should reflect government priorities Data collected should be in relation to the management information need of the organization Data collected should reflect what services are provided Data collected should reflect types of resources – human, capital, logistics etc.
Conclude that relevance of data means that data is appropriate for meeting an information need based on services or management functions. Step 6: Ask participants what is the definition of relevance in HMIS procedural manual (Refer to page 1 of the Health Unit Procedure Manual)

13
“To ensure relevance, the HMIS information and indicators were developed with consideration of the goals and objectives of the major health policies and programmes. At the same time, the management needs of the District have been explicitly included in the system” 1.
After discussing the participants’ responses conclude:
Information system is about monitoring the services provided and strengthening the management of health system. Thus, relevant data meeting these needs are essential and part of the definition of the data quality
Step 7: Ask participants, why accuracy is part of data quality? Some responses could be:
1. Accuracy reflect data is reliable 2. Accuracy indicates data is valid. 3. Data display reality and it measure what it intends to measure 4. Data show that data will be the same when measured on repeated times 5. Accuracy shows that there are no mistakes made in collecting data or mistakes made are within
a specified range. Explain Response three (3) explains what data validity is and thus is not different from response two (2). Response four (4) explains what data reliability is and thus is not different from response one (1). Step 8: Ask participants what is the definition of accuracy in HMIS procedural manual
The data is compiled in databases and reporting forms is accurate and reflect no inconsistency between what is in registers and what is in databases/reporting forms at facility level. Similarly, when data entered in the computers, there is no inconsistency between reporting forms and computer file
After discussing the participants’ responses conclude:
Data accuracy indicates whether mistakes are made while counting entries in the registers and transferring them to database and reporting forms. It could also occur when transferring data in reporting form(s) into district database.
Step 9: Ask participants to list reasons for emphasizing data accuracy and conclude that if the data is inaccurate then
Analysis will yield incorrect conclusion Errors that seems small at facility level can become very large when aggregated
at district or other levels
Step 10: Ask participants, how could timely and complete data still be of undesirable quality? Yes, if the data accuracy is low then data quality will be undesirable despite the data are submitted on time and all date elements are filled.
1 District /HSD Procedures Manual, (2004) Chapter Introduction; page 2; Vol. 3, HMIS, Ministry of Health, Uganda

14
Describing Standards of Data Quality
Now that consensus has been reached on criteria for defining data quality, we need to define our expectations, standard or targets of timeliness, completeness, and accuracy. These standards, target should be defined in such a way that they are measurable.
Step 11: Ask participants why it’s inappropriate to use such terms as “poor” or “good” to define quality, and then take a few minutes to discuss why it is not enough to define data quality as good or poor.
Some possible answers could be:
“Poor” and “good” lack specificity and could have different meanings for different people.
Need a reference point for agreement. Need to specify magnitude of the problem. No time period. No location. No opportunity for improvement.
Step 12: Discuss why we need to define the problem in quantitative terms.
Some possible answers could be: Helps to know magnitude/size of problem; Need to know how much could be changed, i.e., setting targets, testing
hypotheses of correlates of problem, testing intervention success. HMIS is based on quantitative data, other?
Step 13: Ask participants to define problem of data quality in quantitative terms.
Step 14: Conclude with the following definition examples: Standards at district level 90% of the facilities should submit the monthly reporting forms on time on monthly basis in district AA 90% of the facilities should submit monthly reporting forms where 80% of the data elements are filled in district AA 90% of the facilities should have 80% data accuracy in district AA Standards at facility level 90% of the monthly reporting forms were submitted on time in quarter 1 in facility A 90% of the data elements in monthly reporting forms were filled in facility A in each month 80% of the reported data is accurate in monthly report in Facility A in each month
Data accuracy reached 40 percent in facility ABC in July 2003, indicating a gap of 60 percent for achieving 100 percent accuracy in facility ABC.

15
Activity III: Causes of Gaps in Data Quality Time: 1hr 25 minutes Materials: Flip chart, markers Handout #1: Cause-and-Effect Diagram
Step 1: Describe Situational Analysis and audit report results.
Situation analysis showed: That 38 percent of facilities have both a register and a monthly report; That data accuracy reached only 30 percent; That 40 percent of participants were not able to calculate the percentage/rate of
accuracy while their confidence level exceeded 80 percent, indicating a gap between perception and actual performance;
That 40 percent of participants were able to plot data while their confidence level exceeded 80 percent, indicating a gap between perception and actual performance;
That 78 percent of facilities received at least one supervisory visit the last year; and
That 43 percent of facilities reported receiving district feedback. Step 2: Implementing a Causal-effect Analysis Re-emphasize that this training is about empowering staff to do better, empowering them to articulate what is required to improve your performance related to HMIS tasks. The causes could be related to personal improvement in knowledge and skills as well as working conditions and resources required to improve data quality and information use. Understanding causes of the problem is a step towards identifying opportunities for solving a problem. We want you to learn the skill to identify causes in a systemic way. The method for doing that is called cause and effect analysis. The identified problem is labeled as an effect and we want to know what causes that effect. We start with what are immediate causes of the problem. Then, we further explore causes of the causes. After identifying second level of causes, we repeat the same process till we reach a saturation point where we could not find any further causes. Other reason to stop is that we have identified sufficient causes which could help us in better understanding of the problem. The rule of thumb is that we should have five rounds of asking why that provides enough causes to understand the problem better and think about the solutions.
Let’s take an example of why injection use is 40%, while the target/standard is to keep it at 18% level. We ask question why injection use is high and get the answer that probable cause could be clients demand it, inadequate knowledge of the indications of injection and lastly, health providers have less
Objectives
By end of activity, participants will be able to:
Identify causes of gaps in data quality;
Learn to develop a cause-and-effect diagram; and
Differentiate between individual and contextualcauses.

16
motivation to reduce injection use. These are the immediate causes affecting health provider behavior of giving more injections than required. We want to know more why health providers have inadequate knowledge, why clients demand injection and why there is lack of motivation.
Exploring why clients demands it, we come to know that it is because of the clients’ beliefs in injection efficacy for cure or clients are unaware of the risk of contracting HIV. Why clients believe that injection is effective because health providers tell them so for justifying their use of injections. We stop here as we know the main reason of clients’ belief. Similarly, we end our exploration when we know the reason that lack of motivation is due to the incentive for earning more by giving injections. However, we still are unclear why clients are unaware of the injection use as risk factor for HIV.
Cause and Effect diagram: Injection use is 40%, while the target is 18%, indicating a gap of 22%
Clients demands it
Health providers do not know injection safety guidelines
Clients believe injection is better for cure
Clients are unaware that injection can cause harm such as HIV infection
Health providers lack motivation to reduce injection use
The district has not distributed guidelines
No education on risk of getting HIV through Inj
No funds at district to conduct education campaign
District did not receive the guidelines from the Ministry of Health (MoH)
Why
Why
Why
Why
MoH did not print enough copies for all districts
District Management did not think it was important activity for giving budget
District did not receive support from the MoH
Why
Health providers created myth that injection is better
Health providers (HP) have inadequate knowledge of indications of injection use
HP do not educate clients on risk of injection
Health providers earn more by giving injections

17
Exploring further we find the probable cause could be either there is no education campaign by the district health department or the health providers do not educate clients on risk of HIV infection through injection. The district health department did not conduct an education campaign because its management team did not consider it an important activity, and therefore did not allocate any funds for it. The district also did not receive any support to carry out education campaign because it received no support from the Ministry of Health. “We stopped going further when we reached that point when we could not find cause for action. For example, if health providers earn more money, or why did the district allocate no budget? Some responses could be
List of causes Identify causal relationship Location of causes Opportunities for interventions
Step 3: What do we learn from developing a cause & effect diagram? List of causes: We have developed a diagram which provides us with a comprehensive picture of what is causing what, and ultimately effecting the problem. Is it due to lack of knowledge and skills of staff? Is it because of materials like resources, equipment, forms, registers, etc., are not available? Is it because the responsibilities are not distributed properly? Is it because the process of carrying out a task is not clear? Identify causal relationship: It provides us information what are the direct or immediate causes and what are the indirect causes affecting the problem. What is the inter-relationship between direct and indirect causes? Location of the causes: The diagram is useful in locating where the cause lies. Is it at facility, district or national levels? Opportunities for intervention(s): Since we know the causes, their inter-relationship, and their locations, opportunities exit to develop where to intervene and what types of interventions would be feasible. Now we would like you to carry out the exercise and learn how to develop a cause and effect diagram for quality data.
Step 3: Exercise: Work in groups of five to brainstorm on causes of gaps in data quality (incompleteness, inaccuracy and un-timeliness) and develop a cause-and-effect diagram.
Instructions for developing cause-and-effect diagram:
1. Write the problem at the facility level at the top of the diagram.
2. Brainstorm to identify the immediate causes contributing to the problem and list them under the problem.
3. Consider causes and effects and what causes them and write them down.
4. Repeat the process three times in order to chart major causes of the problem and their effects and root cause(s).

18
Step 4: Ask why each effect exists. Ask “why” five times to identify the root cause for several causes. After five circles of asking “why,” we assume that we have enough causes to understand the problem fully and do not need to go further. Why? Why? Why? Why? Why?
Step 5: Ask participants to look at their hand-outs and diagrams. The cause-and-effect diagram helps identify immediate and distant causes of poor data quality. Other factors or causes influence the immediate cause(s). So the cause becomes an effect.
Step 6: Ask participants to share their cause-and-effect diagram for gaps in data quality. Activity IV: Criteria for Priority Setting for Causes Time: 30 minutes Materials: Flip chart, markers, handouts
Why
Why Why
Why Why
Why
WhyWhy
Why Why Why
Why
There is gap of 30% for achieving target of 60%
Objectives
By end of activity, participants will be able to:
Develop selection criteria for choosing causes tobe addressed; and
Apply criteria to select one or two cause(s) fordeveloping a solution for improving data quality

19
Step 1: (10 minutes) Ask participants to list criteria for setting priorities for choosing causes of the problem.
Possible criteria could be:
Impact of cause–level of impact might determine degree to which problem is resolved.
Immediacy of cause Individual versus contextual factors Confidence to address the cause Simple versus complex cause Easy versus difficult to address Urgency of cause Interest in addressing cause Other
Step 2: (5 minutes) Check whether participants mentioned causes related to their own
responsibilities.
Emphasize causes related to participants’ responsibilities at health facility. Explain that causes related to individuals’ responsibilities are important as they immediately affect the problem. Moreover, individuals may have the power to eliminate the causes.
Step 3: (15 minutes) Based on selection criteria, select two problems that relate to insufficient
skills in checking data quality and motivation to carry out HMIS tasks.

20
Module II: Improving HMIS Data Quality Session 3: Skills for Checking Data Quality
Activity I: Means of Checking Data Quality
Step 1: Discuss means of checking data quality.
Note that some ways of checking data quality include:
Observation of the service provider for correct diagnosis and documentation; Comparison of monthly report with registers; Comparison of generated data with other source of data; Data entry problems– numbers which are unusually high or low raise concern
and need to be checked Internal consistency–comparison of number of patients and medicine use; and Historical comparison.
Step 2: Inform participants that we will concentrate on developing skills for checking transfer of
data from registers to monthly reporting form.
This is where each one among us can easily identify
Step 3: Point out to participants that they are responsible for making sure that the transfer of data from register to monthly reporting form is accurate.
Who among the participants has ever signed on the summary forms for transfer to a higher office?
Objectives
By end of session, participants will be able to:
Describe means of checking data quality;
Check data quality; Use LQAS table for checking level of data accuracy
Objectives
By end of activity, participants will be able to:
Identify means of checking data quality;
Differentiate between census and sample;

21
Please note that you have tally sheets in your procedure manual for aggregating data from registers. We urge you to use them.
Step 4: Ask participants what is not provided for checking data accuracy.
Ask HMIS focal persons if they have ever witnessed the boss signing the forms? How long does it take?
What is not provided: How to know that mistakes were made in transferring data from
registers to the monthly reporting form; How many mistakes were made; and How much confidence we have that the assessment of mistakes is
correct.
Step 5: Ask participants how they might know that mistakes were made.
By comparing what is in the registers and what is in the monthly reporting form.
Step 6: Ask participants how they might know how many mistakes were made.
The simple answer is. . . . Check all data points to know how many mistakes are made (or other answer as appropriate). This is what is called census audit of all forms. It will also take care of question of level of confidence, as all data points are included. Note that the monthly reporting form has more than 200 data points. It will be time-consuming and inefficient to check all of them. What therefore is the next step? One possibility is to check a percentage of data points to draw conclusion about the whole.
Activity II: Using Lot Quality Assurance Sampling (LQAS) to Measure Data Quality Time: 30 minutes Materials: Hand-outs on LQAS table
Step 1: Describe characteristics of LQAS.
Based on random sampling;
Objectives
By end of activity, participants will be able to:
Use an LQAS table for checking the level of data quality.

22
Requires a small sample that is easy to collect at low cost; Provides information on whether a target is met; Provides an estimate with statistical precision or an error rate; Helps in setting target; and Helps in monitoring and assessing progress toward target or making comparison
over time.
Decision Rule–A number that provides the limit for making mistakes, allowing an assessment of whether a target is achieved.
Step 2: Ask participants to look at the LQAS table and discuss how it may be interpreted (see Hand-out #3).
Step 3: Ask participants to look at the table and describe what is in the extreme left column.
Answer:. It describes sample sizes for LQAS from 12 to 30.
Step 4: Ask participants to look at the table and describe what is in the top row of the table.
Answer: It describes the target ranges from 10 to 95 percent (data quality targets)
Step 5: Ask participants what the numbers between the top row and extreme left column stand for.
Answer: These numbers are decision rules.
For each sample size and target level, there is a decision rule. A decision rule tells you how many correct answers you need to reach a certain target based on a certain sample size. The numbers in the table are decision rules and provide information about where you stand regarding a specific target.
For example, if you decide that your data accuracy should be 70 percent and you use a sample size of 12, the decision rule is seven; that is, seven or more matches between registers and monthly report are needed to say that 70 percent of the data accuracy target is achieved or that only six mistakes occurred from 12 randomly selected data points.
However, if the sample size increases to 15 while the target of 70 percent remains unchanged, then decision rule would be nine, indicating. . . . Similarly, if the sample size is reduced to 12 while target increases to 80 percent, then the decision rule would be 8, indicating. . . . If the sample size increases to 15 while the target of 80 percent remains unchanged, then decision rule would be10, indicating. . . .
Now that you have learned how to determine the decision rule, let’s do an exercise on checking data quality.

23
Activity III: Checking Data Quality Time: 45 minutes Materials: Hand-outs on registers
Monthly report Data quality checklist Instructions for participants
Step 1: Conduct data quality check at facility level. We are checking how many mistakes are made during the transfer of data from registers to monthly reporting forms. Thus, you need various registers, a monthly reporting form, and a data quality checklist.
For this exercise, we have provided you with: Copies of outpatient, child, antenatal/postnatal, and family planning registers; A monthly reporting form; and A data quality checklist.
Step 2: Explain the data quality checklist (Hand-out #3).
Ask participants to look at the data quality checklist (Hand-out #3). It has four columns as follows:
The first column is for entering 12 randomly selected data items that may include total number of patients under age five, DPT III immunizations for birth to 11 months, number of women receiving condoms, and so forth.
The second column is for copying numbers from the monthly report for the selected data items.
The third column is for entering calculated numbers from the registers on selected items.
The fourth column is for checking whether the monthly report number matches the calculated number. If it matches, enter “yes”; if it does not match, enter “no.”
Look at the last row, which provides the total number of matches and mismatches. Step 3: Explain the monthly report form with numbers (Hand-out #4).
You submit report with some numbers and that is how it looks
Objectives
By end of activity, participants will be able to:
Check data quality.

24
Step 4: Explain registers (Hand-out 5).
Please look at the outpatient register to see how you enter information on patients. We have provided some numbers under the columns headed: Age; Sex (M/F); New attendance; Re-attendance; and New diagnosis–diarrhea, malaria, pneumonia, tuberculosis suspected, urinary tract infection. Please look at the child register to see how you enter information on children. We have provided some numbers under the columns headed: Sex (M/F); Age–please note that rather than providing date of birth, we have entered the age in months in order to eliminate the need for age calculations; DPT doses–1, 2, 3; and Receiving Vitamin A. Please look at the antenatal register to see how you enter information on the women visiting your clinic. We have provided some numbers under the columns headed: Age; and Tetanus doses–1, 2. Please look at the family planning register to see how you enter information on clients. We have provided some numbers under the columns headed: Age; New users; Re-attendance; Other oral; Condom; and IUD. Checking Data Quality Hand-out #6 Tasks Select randomly any 12 data points—with numbers-- from the monthly report form. Enter them into the first column of the data quality check. Copy the number from the monthly report form into the second column of the data quality checklist under the heading of monthly report. Calculate the total number of selected data items and enter that number into the third column of the data quality checklist, under the heading register. If the numbers are same in columns 2 and 3, enter “yes” in column 4, otherwise “no.” Calculate total matched and mismatched numbers and write under row of total. Total matched numbers are the accurate number.

25
Check on the LQAS table on a sample size of 12 and total correct answers. What level of accuracy was reached? Share with others the number of mistakes made and the level of accuracy based on the LQAS table.
26
Module II: Improving HMIS Data Quality Session 4: Solution Development for Improving Data Quality Activity I: Solution Development Time: 30 minutes Materials: Flip chart, markers, hand-outs
Step 1: Ask participants to work in five groups. Take 15 minutes to develop solutions for checking data quality and improving motivation, write them on flip chart, and present them to the group. Participants probably will not offer many solutions for improving skills for checking data quality, thus eliminating the need for further discussion. It is, however, useful to spend time developing [D32]solutions for improving motivation for data quality. Therefore, focus on individual motivation to improve data quality. Exercise: Brainstorm to develop solutions for improving knowledge, skills, and motivation. Encourage creativity and explain that it is important to develop ideas; there are no right and wrong ideas. Step 2: (10 minutes total, 2 minutes per group) Group Presentation. If participants have not presented goal setting as an option for motivation, explain that goal setting provides focus and motivates people to achieve their goals—whether those goals involve completing a degree, maintaining weight, keeping blood pressure in check, managing stress, flossing teeth every day, consistently using a condom with one’s partner, and so forth.
Objectives
By end of activity, participants will be able to:
Develop selection criteria for choosing solution(s), and
Apply criteria to select one or two solution(s) for implementing data quality improvement.

27
Activity II: Selection Criteria for Prioritizing Solutions Time: 15 minutes Material: Flip chart, markers Step 1: Ask participants to list selection criteria for choosing which solution to implement.
Possible criteria could be:
Importance; Interesting and different; Ability to implement the solution; and Resources available to implement the solution.
Activity III: Selecting Solution for Implementation—Applying Criteria Time: 30 minutes Materials: Hand-out #2 Hand-out #2: Instructions for exercise
1. Enter criteria in first column.
2. List solutions.
3. Ask participants to vote for every solution and criterion on a scale of 1 to 3.
4. Add the total in each cell.
5. Add the total for each column.
6. Select the solution with the highest score under the column. Criterion Solutions for Improving Motivation for Data Quality at Facility Level
Solution 1: Goal Setting
Solution 2:
Solution 3:
Solution 4:
Important Ability to implement solution
Resources available to implement solution
Total
Summarize: You have selected skills for checking data quality at the facility level and for motivating people to improve data quality. We will now work on those two problems.

28
MODULE III: IMPROVING INFORMATION USE
Session 1: Goal Setting – A Tool for Improving Data Quality Activity 1: Goal Setting as a Motivating Tool for Improving Data Quality Time: 15 minutes Materials: Flip chart, markers
Step 1: Introduce goal setting. Everyone has some ideals or a goal in life. An ideal is a reference point to judge whether you making progress in achieving your goal. It helps foster motivation for taking action or developing strategies to achieve a goal. It helps people focus their energies and resources. Achieving a goal improves confidence and is a prerequisite for setting and achieving other goals. Ask participants if they develop a goal for achieving something. Yes or no. Discuss with participants the reasons for not developing goals and write them on the flip chart. Provide counter arguments by asking those who said that goal setting is important. Emphasize the role of goal setting in the workplace. Take five minutes to discuss and create consensus on the importance of goals in the workplace and the importance of taking responsibility for achieving those goals. Summarize how goal setting is important for improving data quality by stressing that maintaining data quality is the individual’s responsibility. Thus, data quality as a goal is a prerequisite to maintaining it. Activity II: Criteria for Setting Goals Time: 15 minutes Material: Flip chart, markers
Objectives
By the end of activity, participants will be able to:
Use goal setting as motivation tool;
Learn criteria for setting goals;
Use LQAS for monitoring achievement of goals;
Develop monitoring chart by using LQAS; and
Prepare action plan for monitoring solution activities.

29
Step 1: Ask participants about the appropriate criteria for goal setting—not too high, not too low, but enough to motivate change and instill confidence to achieve change.
Step 2: Let’s set a goal for improving data quality. Data accuracy at my facility would improve
from 30 to 60 percent by the end of three months. As rule, use a 30 percent difference from baseline as a target or goal, as such change is easy to detect with a small sample such as LQAS.
Activity III: Monitoring Achievement toward Goal Time: 30 minutes Material: LQAS table, graph paper, pencil Step 1: How do you know that you are improving data quality from 30 to 60 percent in three months? Compare current data quality with target. Compare data quality from previous month. Exercise: Develop a monitoring chart that displays targets and a decision rule for achieving targets on an LQAS sample of 12 by the end of three months. Ask each participant to do the exercise on his or her own. Share the answer sheet (graph appears later) and ask participants to indicate whether their answer was correct. Collect the participants’ work and use it for evaluating how many participants did it correctly. Step 2: End the session by asking how frequently participants would like to conduct a quality check when they return to their workplace and why. Suggestion: Keep in mind that data quality is only 30 percent. The frequency of data checks should be monthly for three months following the training, bimonthly for four months, and then every three months thereafter. Provide appropriate guidelines. Module II Improving HMIS Data Quality Hand-out #7–Develop Monitoring Chart Write your name – Exercise: Develop a monitoring chart displaying targets and decision rules for achieving a target on an LQAS sample size of 12 by the end of three months. Ask each participant to do the exercise on his or her own. Instructions:
1. Divide target for each month.
2. Select a sample size of 12 to check data quality at facility level. 3. Use LQAS table to locate decision rule for attaining target for each month for a sample size of 12.

30
4. Plot the target and decision rule on the graph provided.
100 90 80 70 60 50 40 30 20 10 0
Module II Improving HMIS Data Quality Hand-out #7–Develop Monitoring Chart Answer sheet

31
Activity IV: Developing Action Plan for Achievement of Goal Time: 30 minutes Material: Action Plan Hand-out Ask participants to develop an action plan for achieving the goal for improving data quality. Hand-out #8 Instructions: 1. Use the following table for developing action plan. 2. Write in major activities to be carried out for implementing solutions. 3. Write in the date for completion of activities. 4. Indicate who will be responsible for carrying out each activity. 5. Enter results.
Major Activities
Date Completed
Responsible Person
Results Achieved: Yes/No
32
Module III: Improving Information Use Session 2: Self Assessment to Improve Information Use[H43]
Activity I: Explain Self-assessment Time: 30 minutes Materials: Flip chart, markers, hand-outs [D44] Step 1: (10 minutes) Discuss the following questions and write responses on the flip chart: What is my facility team responsible for in relation to health services? Responses could be utilization, coverage, quality, disease surveillance, data collection. Are the responsibilities considered criteria for your performance appraisal? Responses should be yes/no; should be or should not be. Discuss reasons. Does the monthly HMIS report tell you about your performance? Responses should be yes/no; discuss. What should be the reference standard for my facility team performance Responses could be against country, district, county, or self. Step 2: Explain the steps of self-assessment by citing an example. Ask participants to read the case study and to note some of the important concepts: She took the use of HMIS data as a serious responsibility. She felt accountable. In the absence of guidelines from the district office, she took it upon herself to do something. She showed initiative. She used problem-solving techniques to look at the cause, develop a solution, set a goal, develop an action plan, implement the plan, and monitor her progress for achieving the target. Thus, self-assessment is about knowing where you stand in relation to your given goal or target. Nobody has to tell you what you need to do. You take responsibility for the task given to you and carry it out diligently. You need to devise means to know that you are doing the job according to expectations, especially your own. Module III Self-Assessment Using HMIS Data Activity I: Explain Self-Assessment
Objectives
By end of session, participants will be able to:
Articulate their responsibility;
Set performance standards;
Conduct self-assessment; and
Develop and action plan.

33
Materi[D45]al: Hand-out #9 Dr. Sarah was recently transferred to Kumali Health Center. Looking at the HMIS monthly report, Dr. Sarah noticed that only 10 pregnant women had come to the health center for delivery in the last month. Using the population chart, she calculated that (total population 10,000 x 0.04 in the quarterly report) 400 women should be expected to be pregnant in any year. Accordingly, every month she should see (400/12=33.3) 33 pregnant women. However, only the aforementioned 10 pregnant women presented for delivery, indicating coverage of 30 percent. Dr. Sarah was not sure about whether her facility coverage was good or bad. She did not receive any guidance from the district office as to her coverage for pregnant women delivering at the facility. She did not know if she should be content with the number of women coming to the health center for deliveries or should make an attempt to improve the number. She also thought that women whose deliveries are assisted by an untrained attendant have a high risk of developing complications or dying. She felt a great sense of responsibility to motivate pregnant women to come to the clinic for delivery. She decided that she could not make 100 percent of pregnant women come to the clinic but recognized that doubling the number of pregnant women seemed an achievable goal. First, she defined the problem of pregnant women coming for deliveries as a gap of 30 percent from achieving coverage of 60 percent. Second, she tried to identify the reasons (causes) why more women were not coming to the clinic for delivery. She knew that the antenatal/postnatal register provided information about the residence of the women. She found that a majority of the women were coming from closer villages but discovered no evidence that distance was the only reason that women were not coming to the clinic for delivery. She decided to hold a meeting of staff and community leaders to identify more reasons. The staff thought that: Women are illiterate; Women do not understand the benefits of delivering at a health center; Mothers-in-law are opposed to health centers for delivery; The traditional practice of delivering at home ruled out clinic deliveries; and The cost of delivery at a health center was beyond the means of many women. Community leaders thought that: Staff are too proud and do not behave properly; Waiting time is long; Staff are absent or inadequate; and Medicines are not available. Dr. Sarah decided that she could not change everything. She urged her staff and community leaders to help her prioritize causes that they could address. Using criteria that first focus on the reasons within the facility and focus next on the community, the group decided to work with the clinic staff to improve their attitude toward clients. Second, the group decided that Dr. Sarah would conduct community awareness meeting with mothers and community leaders. She would collect IEC material from the district to use for community awareness. Dr. Sarah set a goal of receiving 20 pregnant women for delivery each month and using a monthly report to monitor whether she met her target. In addition, Dr. Sarah and her staff developed an action plan and distributed responsibilities to various staff members. After two months, Dr. Sarah noticed that 15 women delivered in her clinic. She was pleased that her efforts made a difference. She appreciated the staff’s efforts and congratulated community leaders for their assistance. She reviewed with staff and the community what was working and what needed to be changed. This is the success story of Dr. Sarah. We would like you to become an example for others as well.

34
Activity II: Self-Assessment–Doing It Yourself Time: 60 minutes Materials: Flip chart, markers Step 1: Divide participants into three groups (six participants in each group). Step 2: Distribute a problem scenario and ask the groups to solve the problem. The exercise takes one hour. The groups make 10-minute presentation and evaluate the presentations with an observation checklist. Clue: Use knowledge and skills learned in earlier sessions. Hand-out #10 Scenario 1: Dr. Mogambe received a feedback report from the district office that his immunization coverage for DPT3 was below the district average of 50 percent. He was asked to take action to improve immunization coverage within his target population. Please discuss what steps Dr. Mogambe needs to take for improving immunization coverage within his target population. Scenario 2: Ms. Flavia received the HMIS monthly report from her staff. She noticed that only 20 pregnant women came to the health center in the last month for antenatal check-ups. Using the population chart, she calculated that (total population 10,000 x 0.06 in quarterly report) 600 women should be expected to be pregnant in a year. Accordingly, she should expect to see (600/12=50) 50 pregnant women every month. However, she received only 20 pregnant women for delivery, indicating coverage of 40 percent. Please discuss what Ms. Flavia should do to improve her coverage to 60 percent in three months. Scenario 3: Dr. Moreen observed in her monthly report that 100 cases of malaria presented at the clinic last month. She thought that she had never before seen so many cases of malaria. She thought that she might be dealing with a typing error. She was not sure how many other mistakes were in the monthly report. By using an LQAS table, she conducted a data audit and found that her monthly data accuracy was below 50 percent. Please discuss what steps she should take to conduct data quality checks and how she could improve data quality to above 60 percent in one month. Activity III: Presentation by Groups and Feedback by Audience Time: 30 minutes Material: Hand-out Hand-out #11 Distribute the following checklist to participants for providing feedback to the presenters. What is the total score, and which steps were missed?

35
Did they: Yes No1. Define the problem quantitatively? 2. Discuss causes? 3. Prioritize causes for developing a solution? 4. Develop a solution(s)? 5. Prioritize solutions by using criteria? 6. Develop a goal/target for monitoring? 7. Describe use of HMIS data for monitoring? 8. Describe the use of LQAS for measuring progress? 9. Develop an action plan for implementation? 10. Describe use of HMIS data for monitoring? Total

36
Module IV: District Feedback Report Session 1: Feedback, Strengths, and Weaknesses
Activity 1: What Should Be in District Feedback Report? District and Facility Perspective Time: 30 minutes Material: Flip chart, markers, 3 x 5 sticky cards Inform participants that they should discuss all the information that they, as district focal persons, would like to include in the district feedback report. What would the facility in charge like to see in the feedback report? Divide participants into two groups: district group and facility group. Step 1: Ask participants in the district group to answer the following: What specific information does the district want to convey in a feedback report to facilities?
Objectives
By end of session participants will be able to:
Identify the strengths and weaknesses of the current feedback report;
Understand and use comparison as a means of motivation/ behavioral change;
List what variables are available in the monthly data file, including population data for use as denominator for calculating indicators;
Check data quality by finding errors in data entry;
Develop indicators;
Describe existing situation by using frequency tabulation;
Conduct comparative analysis among facilities and across time; and
Learn to write a feedback report.
Objectives
By end of session, participants will be able to:
List what should be in a feedback report;
Identify the strengths and weaknesses of the current feedback report; and
Understand and use comparison as a means of motivation/ behavioral change.

37
Ask participants in the facility group to answer the following: What specific information does the facility want to see in a feedback report? Ask both groups to write on a sticky card one topic that they think the feedback report should cover. Ask both groups to post their responses under the district and facility cards that the facilitator has posted on the wall. Give participants five minutes to write their responses. Some responses could be: Information tells me where my facility stands in comparison to other facilities with respect to various indicators (participants might provide details of indicators). Information tells me where my facility stands in comparison to district targets/standards. Information tells me whether my performance has improved over time. Information tells me that I need to improve my performance. Step 2: Ask participants what information is common in both groups and post it in a separate list. Discuss the importance of the information as criteria for a good feedback report. Discuss why it is not enough to talk only about timeliness and completeness. Step 3: Discuss differences in groups and conclude that it is important that both groups share their expectations with each other. Ask participants if they could agree on some information to be shifted to a common information group. Step 4: Emphasize social comparison as means for motivation/change. What could be its repercussions? How could they [D50]be resolved? Step 5: Ask participants how they can use the information as criteria for assessing the strengths and weaknesses of the existing feedback report.

38
Activity II: Strengths and Weaknesses of the District Feedback Report Time: 30 minutes Material: Flip chart Markers 3 x 5 sticky cards Inform participants that they will first identify strengths and weakness of the existing feedback report and then make comparisons with the criteria listed in the first activity. Step 1: Ask participants to write one strength and one weakness on a sticky card and post each card on the wall under the strengths and weaknesses cards. Step 2: Ask participants to group similar responses. Step 3: Ask participants if they can categorize groups of responses. Step 4: Ask participants to compare their own categories with the commonly agreed-upon information that is part of the feedback report as specified in an earlier activity. Step 5: Conclude that weaknesses need to be addressed. Lead to the next activity based on participants’ suggestions for improving the feedback report. Activity III: Suggestions for Improving District Feedback Report Time: 15 minutes Material: Step 1: Ask participants to list their suggestions for improving the feedback report, focusing on weaknesses and ideal standards. Step 2: Create consensus that the following should be part of the feedback report: Information on completeness and timeliness; Information on data quality and error rate; Information telling me where my facility stands in comparison to other facilities on various indicators (participants might provide details about indicators); Information telling me where my facility stands in comparison to TT2 than the other. It does not tell whether the facility reached its monthly target of TT2. It does not tell whether TT2 coverage increased from the previous month We will answer the first two questions and will tackle the other questions during comparative analysis. The frequency table of raw numbers could tell you something about data quality when numbers are not in accord with your expectations, such as TT2 given to 50,000 pregnant women and you know that there not 50,000 pregnant women in the district. This method depends on your knowledge and is thus subject to error.

39
Step 7: Ask participants what other objective ways we could check data quality.
After taking responses, conclude that the raw data should be converted into indicators.
Example: For converting raw numbers into an indicator, you have to create a new variable. You need the following:
The variable with a raw number-- for example, DOSE2; and The variable for the target group--for example, all pregnant women in a
specified geographic area, which is the target population for the health facilities. Usually, such a variable represents pregnant women in one year. Thus, for calculating pregnant women by month, the variable has to be divided by 12.
Note that many districts do not include a variable in their monthly data file on denominators such as:
Total pregnant women; Children under age one; Children under age two; Children under age five; and Women age 15 to 49.
Therefore, districts were unable to calculate indicators. We discussed that weakness earlier. We take this opportunity to suggest that you enter that variable into the data file for calculating indicators. District targets; Information telling me whether my performance has improved over time; and Information suggesting where my performance needs improvement.

40
Activity IV: Writing about Health Situation Using Tables Created Earlier Time: 30 minutes Material: Computer Step 1: Write two paragraphs discussing the following: Level of data quality for each indicator; and Coverage level of each indicator. Step 2: Before writing the report, summarize the information in a table. The following provides a model:
Table: Coverage of Selected Services by Facilities and Overall District Average Name of Facility
TT2CR DPT3 under 2 Malaria under Age Five
New User of Family Planning
Deliveries in Health Facility
Total for District

41
Module IV: District Feedback Report
Session 2: What is Comparative Analysis? Time: 90 minutes Material: Computer W/EPIINFO Data File, Code Sheet Commands for Accessing and Analyzing Data
Activity 1: What Is Comparative Analysis? Time: 30 minutes Materials: Flip chart, markers Step 1: Ask participants to note some of the benefits of comparison and list responses. Step 2: Can comparison be used as a motivation for improving HMIS practices? Step 3: Summarize participants’ responses and conclude by saying that we arrived at a consensus earlier indicating that the following information is essential for feedback: Information telling me where my facility stands in comparison to other facilities with respect to various indicators (participants might provide details on the indicators); Information telling me where my facility stands in comparison to district targets; Information telling me whether my performance has improved over time; and Information to improve my performance. Step 4: To have an objective and transparent comparison, we need to have criteria/standards against which a comparison should be made. Do we agree on that? What, therefore, should be the standards for comparing facilities and across time? Some responses could be: Standards set by central government; Standards set by district; Historical standards--using past performance as a standard; and Overall average or median--using overall average or median for the district as a standard. State if other standards do not exist, it is better to use overall average or median as the standard for comparison. Nonetheless, an overall average is weak because it could be affected by extremely high or extremely low values while the median is robust, as it is not affected by extremes, and divides the total into below and above 50 percent.
Objectives
By the end of session, participants will be able to:
Conduct comparative analysis among facilities;
Conduct comparative analysis across time; and
Provide feedback to improve performance.

42
Last evening, we prepared a table that provided information on different indicators and comparisons among facilities. What is the major weakness of those comparisons? We did not have a standard against which to compare our indicators. Activity 2: Where Do Facilities Stand in Comparison to the District Average? (comparing coverage among facilities) Time: 10 minutes Material: Hand-out Step 1: The cross table between facilities and a specific indicator provided us with an overall average for the district (all children immunized for DPT3 or all pregnant women delivering in health facilities divided by, respectively, all children under age two or all pregnant women in the district). We will use that overall average for comparing where each facility stands in comparison to all other facilities in the district. However, we need our data. We will carry out the same steps that we completed yesterday to access our data files and program files. Step 2: Run your program file. It will provide you with the same tables generated earlier. If you did not enter the district averages yesterday, use this opportunity to enter them. Step 3: Exercise: Enter the district average below each indicator and compare facilities that were below and above average. Circle those that were below average.

43
HAND-OUT Table: Facilities above Average on Selected Services by Facilities and Overall District Average
Name of Facility
TT2CRR (standard)
DPT3 under Age Two
Malaria under Age Five
New User of Family Planning
Deliveries in Health Facility
Total for District

44
Activity II: Where Do Facilities Stand in Comparison to District Standard? (comparing coverage among facilities) Time: 10 minutes Material: Computer w/EpiInfo Data file, code sheet Commands for accessing and analyzing data Step 1: If you want to use a standard set by the district or central government, then you could use that as a criterion for assessing facilities above and below that standard. Example: We will take the example of pregnant women who received TT2. Can you recall the name of that variable? Yes, the name of the variable was TT2CR. Now we want the variable to be divided into below and above the district average. We therefore must create a new variable to show how many facilities are above and below the average. Let’s say that the name of the new variable is TT2CRR. The variable should be able to divide facilities into two categories of above average and below average. Let’s give them a code as follows: Above district average=1 Below district average=2 To create categories of above and below average and assign codes to them, we must do the following: Click on If to bring up the screen as in If condition--fill it by selecting ATT2CR. Click on <= (which means equal or less than) and enter the district standard. Click on then. Click on assign. Click on available variable and select ATT2CR. Under = expression, enter 1. Click add to take you back to the assign screen. The screen under If condition will show ATT2CR<=70, and under THEN will show ATT2CR=1. Click on else. Click on assign. Select ATT2CR. Under =expression, enter 2 (it means that all other numbers above standard (70) will become 2). Click add. Under else, the screen will show ATT2CR=2. Click ok.

45
The program file will show the following command: Click Freq and select ATT2CR.
att2cr Frequency Percent Cum Percent
1 20 31.3% 31.3%
2 44 68.8% 100.0% Total 64 100.0% 100.0% It will display categories 1 and 2, numbers, and percentages. Category 2 will represent all those facilities above district standard and Category 1 those below the standard.

46
The frequency table does not specify facility names. For that, we have to cross tabulate between facility variable and the newly created variable of below and above standard (ATT2CR) as follows:
Click on table. Under exposure variable, select facility. Under outcome variable, select ATT2CR.
The table will look as follows:
Ask participants to name the facilities above and below district standard. Practice: Ask participants to do the same for other variables and to create a table.
HEALTH 1 2 TOTAL
BUGAYA Row % Col %
00.00.0
1100.0
2.3
1100.0
1.6
BUKAYA Row % Col %
00.00.0
3100.0
6.8
3100.0
4.7
BULIKA Row % Col %
00.00.0
1100.0
2.3
1100.0
1.6
BUSABAGA Row % Col %
1100.0
5.0
00.00.0
1100.0
1.6
BUVUMA Row % Col %
133.35.0
266.7
4.5
3100.0
4.7
BUWAGAJJO Row % Col %
2100.0
10.0
00.00.0
2100.0
3.1
CHRIST THE KING Row % Col %
00.00.0
1100.0
2.3
1100.0
1.6
DDAMBA Row % Col %
00.00.0
1100.0
2.3
1100.0
1.6
GOMA Row % Col %
150.05.0
150.0
2.3
2100.0
3.1
KASANA Row % Col %
00.00.0
3100.0
6.8
3100.0
4.7
KASAWO Row % Col %
150.05.0
150.0
2.3
2100.0
3.1
KATOOGO Row % Col %
1100.0
5.0
00.00.0
1100.0
1.6
KAVULE Row % Col %
1100.0
5.0
00.00.0
1100.0
1.6

47
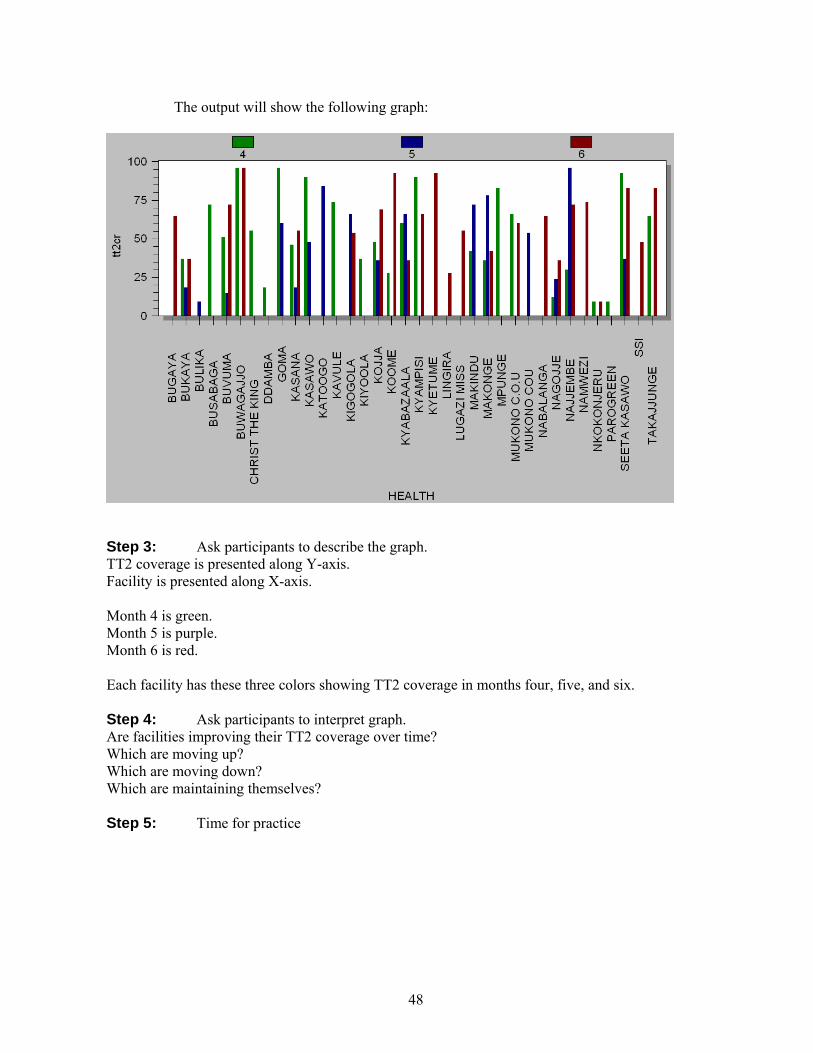
Activity III: Is Facility Coverage Improving over Time (comparing coverage over time)? Time: Materials: Step 1: Now that we know where facilities stand in comparison to the district standard and each other, we would like to know whether facilities have improved their performance over time. This means we need data from earlier months. For this exercise, we have presented data from three months. Now we have to select data for months five and six. The command remains the same as for month four: Select month=5. Select month=6. Step 2: We develop a graph showing whether facilities’ TT2 coverage improved over time by graphing health facilities and each month. Click on graph. Select type of graph–bar. Select under X-axis health (for facility). Select under Y-axis count. Select under weight variable tt2cr. Select under series month. Click ok. The command under program file will read as follows: Graph health*month graph type=”bar” weight var=tt2cr
48
The output will show the following graph:
Step 3: Ask participants to describe the graph. TT2 coverage is presented along Y-axis. Facility is presented along X-axis. Month 4 is green. Month 5 is purple. Month 6 is red. Each facility has these three colors showing TT2 coverage in months four, five, and six. Step 4: Ask participants to interpret graph. Are facilities improving their TT2 coverage over time? Which are moving up? Which are moving down? Which are maintaining themselves? Step 5: Time for practice

49
Activity IV: Practice for Comparing Performance over Time Hand-out Instructions: You already created variables for DPT3, malaria under age five, new family user, and pregnant women delivered at facilities. Follow the steps for creating a graph between facilities and month (as learned earlier). 2. Develop a graph for other variables over months. 4. Print the result. Exercise 1: Create graph between DPT3 indicator and facilities by month. List facilities. Which are moving up? Which are moving down? Which are maintaining themselves? Exercise 2: Create graph for incidence of new cases of malaria under age five for malaria indicator and facilities by month. List facilities. Which are moving up? Which are moving down? Which are maintaining themselves? Exercise 3: Create a graph for new users of family planning indicator and facilities by month. List facilities. Which are moving up? Which are moving down? Which are maintaining themselves? Exercise 4: Create a graph for pregnant women delivered in health facilities indicator and facilities by month. List facilities. Which are moving up? Which are moving down? Which are maintaining themselves?
50
MODULE IV: WRITE A FEEDBACK REPORT YOURSELF
Time: 120 minutes Material:
Activity 1: Explain What Should Be in Feedback Report Time: 15 minutes Material: Step 1: There are different ways of writing a feedback report. First, a standardized format facilitates understanding and meeting users’ expectations. Second, the purpose of feedback is to support people, improve motivation, and provide guidelines for action. The feedback should be transparent and based on objective criteria so that people are aware of what is expected of them. The feedback should emphasize performance/action. However, before commenting on performance, you should identify strengths and communicate appreciation for efforts to improve performance. Thus, we present a sample format for writing a feedback report. Step 2: Introduction–Describes what follows in the report and outlines district’s perspective on HMIS. Step 3: Present findings– Performance for the month per selected indicators by facilities. The selected indicators could be: Completeness Timeliness Error rate Selected indicators--at least one from Utilization rate; HIV/AIDS; Maternal service; Contraception; and Child services. Step 4: Performance for the month per selected indicators by facilities over previous months Step 5: Demonstrate appreciation of facilities that performed well Step 6: Provide guidelines for action What do facilities below average on certain indicators need to do? What do facilities below on average on all indicators need to do?
Objectives
By end of session, participants will be able to:
Write a feedback report.

51
Activity II: Write Feedback Report Time: 60 minutes Material: Based on the format provided, please write the feedback report. Activity 3: Presentations by Groups Time: 30 minutes Material: Overhead projector, transparencies Concluding Session
Objectives
Vote of thanks;
Remarks by participants;
Remarks by facilitators; and
Concluding remarks by chair.

52
Hand-out No.4 With Thanks to- The Authors of Training Manual on LQAS
MODULE V: TRANING MANUAL ON LQAS
LQAS Table: Decision Rules for Sample Sizes of 12-30 and Coverage Targets/Average of 10%-95%
Average Coverage (Baselines) / Annual Coverage Target (Monitoring and Evaluation) Sample Size* 10% 15% 20% 25% 30% 35% 40% 45% 50% 55% 60% 65% 70% 75% 80% 85% 90% 95%
12 N/A N/A 1 1 2 2 3 4 5 5 6 7 7 8 8 9 10 11 13 N/A N/A 1 1 2 3 3 4 5 6 6 7 8 8 9 10 11 11 14 N/A N/A 1 1 2 3 4 4 5 6 7 8 8 9 10 11 11 12 15 N/A N/A 1 2 2 3 4 5 6 6 7 8 9 10 10 11 12 13 16 N/A N/A 1 2 2 3 4 5 6 7 8 9 9 10 11 12 13 14 17 N/A N/A 1 2 2 3 4 5 6 7 8 9 10 11 12 13 14 15 18 N/A N/A 1 2 2 3 5 6 7 8 9 10 11 11 12 13 14 16 19 N/A N/A 1 2 3 4 5 6 7 8 9 10 11 12 13 14 15 16 20 N/A N/A 1 2 3 4 5 6 7 8 9 11 12 13 14 15 16 17 21 N/A N/A 1 2 3 4 5 6 8 9 10 11 12 13 14 16 17 18 22 N/A N/A 1 2 3 4 5 7 8 9 10 12 13 14 15 16 18 19 23 N/A N/A 1 2 3 4 6 7 8 10 11 12 13 14 16 17 18 20 24 N/A N/A 1 2 3 4 6 7 9 10 11 13 14 15 16 18 19 21 25 N/A 1 2 2 4 5 6 8 9 10 12 13 14 16 17 18 20 21 26 N/A 1 2 3 4 5 6 8 9 11 12 14 15 16 18 19 21 22 27 N/A 1 2 3 4 5 7 8 10 11 13 14 15 17 18 20 21 23 28 N/A 1 2 3 4 5 7 8 10 12 13 15 16 18 19 21 22 24 29 N/A 1 2 3 4 5 7 9 10 12 13 15 17 18 20 21 23 25
30 N/A 1 2 3 4 5 7 9 11 12 14 16 17 19 20 22 24 26
N/A: Not Applicable, meaning LQAS cannot be used in this assessment because the coverage is either too low or too high to assess an SA. This table assumes the lower threshold of 30 percentage points below the upper one. : Shaded cells indicate where alpha or beta errors are � 10%. : Hashed cells indicate where alpha or beta errors are � 15%.

53
Hand-out #6 HMSI 031: OUTPATIENT REGISTER HEADINGS AND COLUMN WIDTHS: LEFT-HAND SIDE USER
NUM. NAME OF PATIENT
RESIDENCE AGE SEX M/F
WEIGHT
TICK CLASSIFCATION
Village Parish New Attendance
Case
Re- Attendance
New Diagnosis
DRUG/TREATMENT
Ref. in Num
Ref out Num
1 4m M Y Diarrhea P
2 1 F Y Diarrhea P
3 25 M Y UTI
4 35 F Y TB
5 3 F Y Malaria
6 12 F Y Malaria
7 4 M Y Pneumonia
8 60 M Y TB/ Diarrhea P
9 45 F Y TB/ Diarrhea P
10 3 M Y Diarrhea P
11 2 M Y Diarrhea P
12 1 F Y Pneumonia
13 4 F Y Pneumonia
14 6 F Y Malaria 15 17 F Y TB 16 22 F Y Diarrhea
P
17 18 M Y TB
18 3 F Y Pneumonia
19 4 M Y Malaria 20 3m M Y Malaria 21 5m M Y Pneumon
ia
22 6m F Y Diarrhea P
23 19 F Y UTI 24 2 F Y Pneumon
ia Y
25 21 F Y Diarrhea P
Y

54
Hand-out #6 HMSI 073: CHILD REGISTER HEADINGS AND COLUMN WIDTHS: LEFT-HAND SIDE (1) (2) (3) (4) (5) (6) (7) (8) CHILD NO. NAME VILLAGE
AND PARISH
SEX DATE OF BIRTH
DATE BCG
DATES POLIO DATES DPT
Child (mother’s name):
1 2 3
2 cm 5 cm 4 cm 1 cm 2 cm 2 cm .5 .5 .5 .5 .5 .5 .5
1 M 1 Y
2 F 3 Y
3 F 6 Y
4 M 8 Y
5 M 2 Y
6 F 1 Y
7 F 3 Y
8 F 7 Y
9 M 8 Y
10 F 4 Y
11 F 1 Y
12 M 6 Y
13 M 6 Y
14 F 5 Y
15 M 5 Y
Right-Hand Side (9) (10) (11) (12)
DATE AND WEIGHT AT MEASLES VACCINATION
VITAMIN A ADMINISTRATION DATES
REMARKS
DATE OF VACCINATION
WEIGHT BELOW
BOTTOM LINE (2 SD)
WEIGHT ABOVE
BOTTOM LINE (2SD)
6–11 Months
12–17 Months
18–23 Months
2 cm 2 cm 2 cm 2 cm 2 cm 9 cm
1
2
3 Y
4 Y
5
6
7
8 Y
9 Y
10
11
12 Y
13 Y
14
15

55
Hand-out No.6 HMIS 071: ANTENATAL/POSTNATAL REGISTER HEADINGS AND COLUMN WIDTHS: LEFT-HAND SIDE CLIENT NO.
NAME OF CLIENT
VILLAGE AND PARISH
AGE PARA LNMP EDD TETANUS DOSES S-P IRON FOLIC ACID
1 2 3 4 5 1 2 1 2 1 2 1 18 Y 2 22 Y 3 25 Y 4 18 Y 5 30 Y 6 32 Y 7 28 Y 8 22 Y 9 23 Y 10 25 Y 11 12 13 14 15 16 17 18 19 20
HMIS Form 074 : FAMILY PLANNING REGISTER--HEADINGS AND COLUMN WIDTHS (1) (2) (3) (4) (5) (6) (7) (8) (9) (10) (11) (12) (13) (14) (15) (16) (17) (18)
CLIENT INFORMATION AMOUNT OF CONTRACEPTIVE DISPENSED
SE
RIA
L
NU
MC
LIE
NT
N
UM
NE
W U
SER
RE
-AT
T
AG
E
Lof
emin
al
Ove
rett
e
Mic
rogy
non
Oth
er O
ral
Con
dom
Foa
m T
able
s
IUD
Inje
ctab
le
Oth
er
Nat
ural
RH
C
ouns
elin
g
Oth
er S
ervi
ce
Rea
sons
For
R
ef
1 Y 35 Y 2 Y 29 Y 3 Y 25 Y 4 Y 20 Y 5 Y 30 Y 6 Y 26 Y 7 Y 27 Y 8 Y 32 Y 9 Y 30 Y 10 Y 28 Y 11 Y 29 Y 12 Y 32 Y 13 Y 20 Y 14 Y 30 Y 15 Y 18 Y 16 17 18 19 20

56
Hand-out # 5 HMIS 105 HEALTH UNIT MONTHLY REPORT Page 1 Health Unit ______________________________ Level ____________ Code _______________ District _____________________ HSD _________________ Month _____________, 20 ____ 1. OPD ATTENDANCE & LABORATORY TESTS TOTALS FOR THE MONTH OUTPATIENT ATTENDANCE Category 0–
4years 5 and Over
New attendance Re-attendance Total attendance 17 10 Referral to unit (all ages) Referrals from unit (all ages)
2. OUTPATIENT DIAGNOSES Diagnosis 0–4
Years 5 and Over
Notifiable Diseases 01 Acute Flaccid Paralysis 02 Cholera 03 Diarrhoea-Dysentery 04 Guinea Worm 05 Measles 06 Meningitis 07 Neonatal Tetanus 08 Plague 09 Rabies 10 Viral Haemorrhagic Fever 11 Yellow Fever Noncommunicable Diseases 33 Anemia 34 Dental Diseases and Conditions
35 Diabetes Mellitus 36 Gastrointestinal Diseases 37 Hypertension 38 Mental Illnesses 39 Epilepsy
40 Other Cardiovascular Diseases
41 Severe Malnutrition (W/A <3 SD)
42 Severe Malnutrition (kwash.,) 43 Trauma--Domestic Violence 44 Trauma–Other Intentional 45Trauma–Road Traffic Accidents
46 Trauma–Other Nonintentional
Maternal and Perinatal Diseases 47 Abortions 48 Other Complications of Pregnancy
49 Perinatal Conditions
LABORATORY TESTS Category Number
of Tests Number Positive
Malaria blood smear TB sputum HIV serology Syphilis screening Pap smear
Diagnosis 0–4
Years 5 and Over
Other Infectious/Communicable Diseases 12 AIDS 13 Diarrhoea–Not bloody 14 Diarrhoea–Persistent 5 4 15 Ear infection 16 Eye infection 17 Genital infection--Urethral discharge
18 Genital infection–Vaginal discharge
19 Genital infection–Ulcerative 20 Intestinal worms 21 Leprosy 22 Malaria 6 1 23 No pneumonia--cold or cough 24 Onchocerciasis 25 Pneumonia 10 6 26 Skin diseases 27 Tuberculosis (suspected) 0 7 28 Tuberculosis (confirmed) 29 Typhoid fever 30 Urinary tract infections (not sexually transmitted)
0 4

57
31 Others (nonspecific)
32 All other diseases (specify) Total
HMIS 105: HEALTH UNIT MONTHLY REPORT - Page 2 3. MCH AND FP ACTIVITIES ANTENANTAL/POSTNATAL CLINIC Category Number
New ANC attendance ANC re-attendance Referrals from unit First dose with S-P (IPT 1) Second dose with S-P (IPT2) Postnatal visits Vitamin supplementation (postnatal)
MATERNITY Category Number
Referrals to unit Deliveries in unit Live births in unit Still births in unit Newborn deaths Maternal deaths Deliveries with TBA
TETANUS IMMUNISATION Category Number
Pregnant women TT Vaccine Dose 1 4 Dose 2 4 Dose 3 Dose 4 Dose 5
Total Doses 2–5 Nonpregnant women TT Vaccine Number
Dose 1 Dose 2 Dose 3 Dose 4 Dose 5
Total Doses 2– 5
CHILD IMMUNISATIONS Category Under
1 1–4 Years
BCG Polio 0 Polio 1 Polio 2 Polio 3 DPT 1 5 DPT 2 5 DPT 3 8 Measles

58
CHILD HEALTH Category Number
Vitamin A supplementation under 2 years
5
Collected at measles immunization Weight below bottom line (<2SD) Total weighed
FAMILY PLANNING USERS Category New Users Revisits
Oral: Lo-Femenal Oral: Microgynon Oral: Ovrette Oral: Others 8 Condoms 4 Foam tablets IUDs (Copper T) 3 Injectable Natural Others Total 7 8
CONTRACEPTIVES DISPENSED Category Number
Dispensed at Unit
Number Dispensed by CBDA
Oral: Lo-Femenal Oral: Microgynon Oral: Ovrette Oral: Others Condoms Foam tablets IUDs (Copper T) Injectable Total
FROM THE OPERATING THEATER Category Number
Female sterilization (tubal ligation) Male sterilization (vasectomy) Norplant new users Norplant revisits Norplant removals
Page 3 4. ESSENTIAL DRUGS, VACCINES,
AND CONTRACEPTIVES
Tick if the drug, vaccine, or contraceptive was out of stock at the health facility at any time during the previous month. Out of stock means that item was not available anywhere in your health unit.
Item Number
Chloroquine tabs Cotrimozazole tabs ORS sachets Measles vaccine Fansidar Depo-Provera
5. OUTRACH ACTIVITIES Category Number Outreach activities planned for the month
Outreach activities conducted in the month
6. FINANCIAL SUMMARY Income Categories Amount
1 2 3 4 5 6 7 8 Debt recovery 9 Total income
Income Categories Amount
19 Balance of the month 20 Previous month overall balance 21 Overall balance Cash balance Bank balance
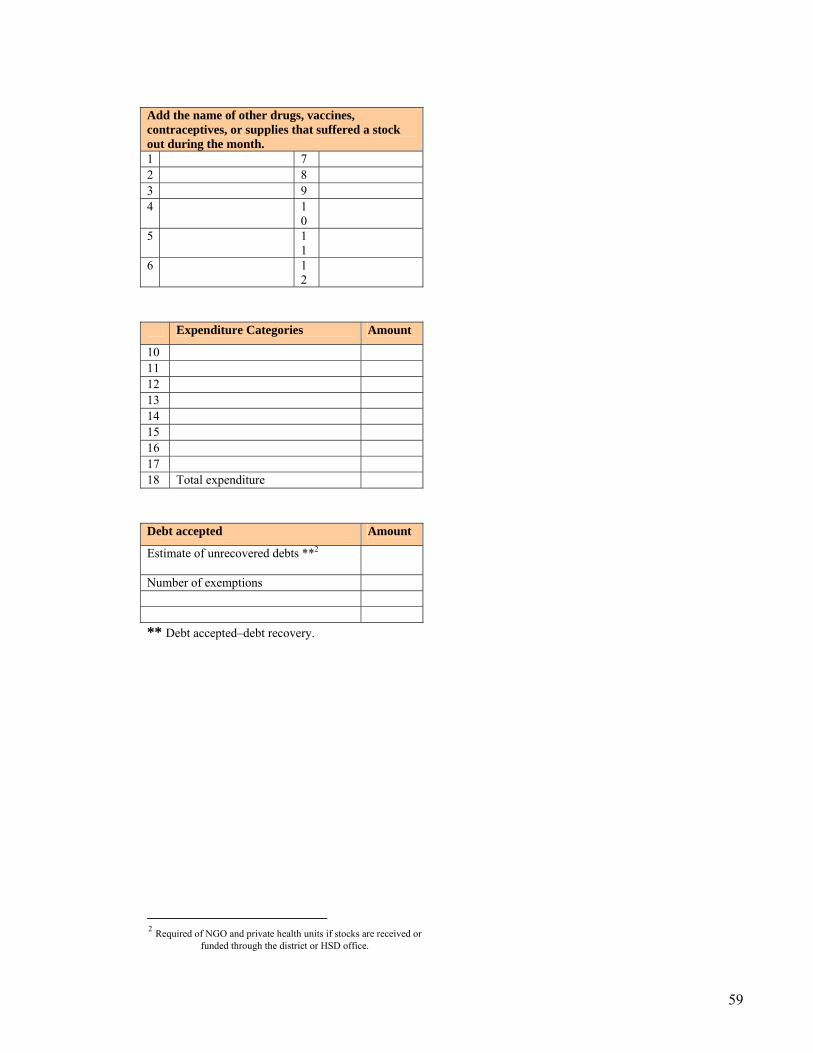
59
Add the name of other drugs, vaccines, contraceptives, or supplies that suffered a stock out during the month. 1 7 2 8 3 9 4 1
0
5 11
6 12
Expenditure Categories Amount
10 11 12 13 14 15 16 17 18 Total expenditure
Debt accepted Amount
Estimate of unrecovered debts **2
Number of exemptions
** Debt accepted–debt recovery.
2 Required of NGO and private health units if stocks are received or
funded through the district or HSD office.

60
HMIS 105: HEALTH UNIT MONTHLY REPORT PAGE 4
7. Comments Item Last Month Planned This Month Date of senior staff meeting Date(s) of meeting of Health Unit Management Committee
Parish name(s) and date(s) of Village Health Committee meeting attended by representative of health unit
Date(s) of LC III or LC V committee meeting attended by a representative of health unit
Date of support supervision visits of District Health Team
8. List of staff members not receiving salary and/or allowances last month. 9. MONTHLY MONITORING
Remember to plot cumulative graphs for the indicators listed below. Graphs are found in the Health Unit Database. Copies should be displayed in the health unit.
Category Is graph on target? (tick)
Is graph on target? (tick)
BCG vaccination <1 FP new acceptors DPT 3 vaccination <1 OPD total new cases Measles vaccination < 1 New malaria cases (channel
graph)
New antenatal attendance New diarrhea cases (channel graph)
Deliveries in health unit
Use these graphs to document your answers to the questions asked in the Quarterly Report. Date of Report: __________________ Title __________________ Signature __________ In-charge Name: _________________ Title __________________ Signature __________ Witness Name: __________________ Title __________________ Signature __________ (for Financial Section)
…(HSD use below this line) ….
Date Received
Received by 7th of next month Yes No
Checked by (signature) Date processed

61
Hand-out #4 Table: Checking Data Quality Sheet, Sample Size 12, Target --------; Decision Rule ------- Monthly Report
Form Cases in Registers Same
Yes No 1 2 3 4 5 6 7 8 9 10 11 12 Total Has achieved target?

62
HAND-OUT–CODE SHEET
Formn float %8.0f HMIS Form 105 Identification Number health str38 %38s Name of Health Unit level float %8.0f Level of Health Unit POPU Catchment population for the facility Popuu1 Population under 1 year Popuu5 Population under 5 years Wo15to49 Women age 15 to 49 years Pregwom Number of pregnant women code float %8.0f Health Unit Code typeheal float %8.0f TYPEHEALTH district str20 %20s District hsd float %8.0f Health Sub District Number hsdn str24 %24s Health Sub District Name date str12 %12s Date: Month Reported year float %8.0f Year Identification month float %8.0f Month identification code quarter float %8.0f Quarter na0to4t float %8.0f New attendances 0-4 years na5upt float %8.0f New attendances 5 years and over re0to4t float %8.0f Re-attendances 0-4 years re5upt float %8.0f Re-attendances 5 years and over ta0to4t float %8.0f Total attendances 0-4 years ta5upt float %8.0f Total attendances 5 years and over reftou float %8.0f Referals to unit (all ages) refrmu float %8.0f Referrals from unit (all ages) mbstd float %8.0f Malaria blood smear: Number of tests done mbsnpo float %8.0f Malaria blood smear: Number positive tbtd float %8.0f TB sputum: Number of tests done tbnpo float %8.0f TB sputum: Number positive hivtd float %8.0f HIV serology: Number of tests done hivnpo float %8.0f HIV serology: Number positive sytd float %8.0f Syphilis screening: Number of tests done synpo float %8.0f Syphilis screening: Number positive paptd float %8.0f Pap smear: Number of tests done papnpo float %8.0f Pap smear: Number positive afp0t4 float %8.0f Acute Flaccid Paralysis 0-4 years afp5up float %8.0f Acute Flaccid Paralysis 5 years and over cho0t4 float %8.0f Cholera 0-4 years cho5up float %8.0f Cholera 5 years and over dys0t4 float %8.0f Diarrhoea Dysentery 0-4 years dys5up float %8.0f Diarrhoea Dysentery 5 years and over gw0t4 float %8.0f Guinea Worm 0-4 years gw5up float %8.0f Guinea Worm 5 years and over mea0t4 float %8.0f Measles 0-4 years mea5up float %8.0f Measles 5 years and over men0t4 float %8.0f Meningitis 0-4 years men5up float %8.0f Meningitis 5 years and over ntt0t4 float %8.0f Neonatal tetanus 0-4 years ntt5up float %8.0f Neonatal tetanus 5 years and over pl0t4 float %8.0f Plague: 0-4 years pl5up float %8.0f Plague: 5 years and over rab0t4 float %8.0f Animal bites: Rabies 0-4 years rab5up float %8.0f Animal bites: Rabies 5 years and over vhf0t4 float %8.0f Viral Haemorrhagic Fever: 0-4 years vhf5up float %8.0f Viral Haemorrhagic Fever: 5 years and over yf0t4 float %8.0f Yellow Fever: 0- 4 years

63
yf5up float %8.0f Yellow Fever: 5 years and over ana0t4 float %8.0f Noncommunicable Diseases: Anaemia 0-4 years ana5up float %8.0f Noncommunicable Diseases: Anaemia 5 years and over ddc0t4 float %8.0f Noncommunicable Diseases: Dental diseases and conditions 0-4 years ddc5up float %8.0f Noncommunicable Diseases: Dental diseases 5 years and over dm0t4 float %8.0f Noncommunicable Diseases: Diabetes Mellitus 0-4 years dm5up float %8.0f Noncommunicable Diseases: Diabetes Mellitus 5 years and over gi0t4 float %8.0f Noncommunicable Diseases: Gastrointestinal diseases 0-4 years gi5up float %8.0f Noncommunicable Diseases: Gastrointestinal diseases 5 years and over hyp0t4 float %8.0f Noncommunicable Diseases: Hypertension 0-4 years hyp5up float %8.0f Noncommunicable Diseases: Hypertension 5 years and over mi0t4 float %8.0f Noncommunicable Diseases: Mental illness 0-4 years mi5up float %8.0f Noncommunicable Diseases: Mental illness 5 years and over epil0t4 float %8.0f Noncommunicable Diseases: Epilepsy 0-4 years epil5up float %8.0f Noncommunicable Diseases: Epilepsy 5 years and over cvd0t4 float %8.0f Noncommunicable Diseases: Other cardiovascular diseases 0-4 years cvd5up float %8.0f Noncommunicable Diseases: Other Cardiovascular diseases 5+ years smw0t4 float %8.0f Noncommunicable Diseases: Sev.malnutrition (WA <3 SD) 0-4 years smw5up float %8.0f Noncommunicable Diseases: Sev.malnutrition (WA <3 SD) 5 years and over smk0t4 float %8.0f Noncommunicable Diseases: Sev.malnutrition Kwash’kor/ marasmus 0-4 yrs smk5up float %8.0f Noncommunicable Diseases: Sev.malnutrition Kwash’kor/marasmus 5+ yrs tdv0t4 float %8.0f Noncommunicable Diseases: Trauma—Domestic violence 0-4 years tdv5up float %8.0f Noncommunicable Diseases: Trauma—Domestic violence 5+ years toi0t4 float %8.0f Noncommunicable Diseases: Trauma—Other intentional 0-4 years toi5up float %8.0f Noncommunicable Diseases: Trauma—Other intentional 5+ years rta0t4 float %8.0f Noncommunicable Diseases: Trauma--Road traffic accidents 0-4 years rta5up float %8.0f Noncommunicable Diseases: Trauma--Road traffic accidents 5+ years tai0t4 float %8.0f Noncommunicable Diseases: Trauma--Other nonintentional 0-4 years tai5up float %8.0f Noncommunicable Diseases: Trauma—Other intentional 5 years and over abortion float %8.0f Maternal and Perinatal Diseases: Abortions comppreg float %8.0f Maternal and Perinatal Diseases: Other Complications of Pregnancy perco float %8.0f Maternal and Perinatal Diseases: Perinatal Conditions aid0t4 float %8.0f AIDS: 0 to 4 years aid5up float %8.0f AIDS: 5 years and over dnb0t4 float %8.0f Diarrhoea--Not bloody: 0-4 years dnb5up float %8.0f Diarrhoea--Not bloody: 5 years and over dpo0t4 float %8.0f Diarrhoea--Persistent: 0-4 years dpo5up float %8.0f Diarrhoea--Persistent: 5 years and over ei0t4 float %8.0f Ear Infection: 0-4 years ei5up float %8.0f Ear Infection: 5 years and over ey0t4 float %8.0f Eye Infection: 0-4 years ey5up float %8.0f Eye Infection: 5 years and over gud0t4 float %8.0f Genital Infection—Urethral discharge 0-4 years gud5up float %8.0f Genital Infection—Urethral discharge 5 years and over gvd0t4 float %8.0f Genital Infection—Vaginal discharge 0-4 years gvd5up float %8.0f Genital Infection—Vaginal discharge 5 years and over giu0t4 float %8.0f Genital Infection—Ulcerative 0-4 years giu5up float %8.0f Genital Infection--Ulcerative 5 years and over iw0t4 float %8.0f Intestinal worms: 0-4 years iw5up float %8.0f Intestinal worms: 5 years and over lep0t4 float %8.0f Leprosy: 0-4 years lep5up float %8.0f Leprosy: 5 years and over mal0t4 float %8.0f Malaria: 0-4 years mal5up float %8.0f Malaria: 5 years and over pcc0t4 float %8.0f No pneumonia--cold or cough: 0-4 years pcc5up float %8.0f No pneumonia--cold or cough: 5 years and over onc0t4 float %8.0f Onchocerciasis: 0-4 years onc5up float %8.0f Onchocerciasis: 5 years and over pne0t4 float %8.0f Pneumonia: 0-4 years pne5up float %8.0f Pneumonia: 5 years and over

64
sk0t4 float %8.0f Skin diseases: 0-4 years sk5up float %8.0f Skin diseases: 5 years and over goto2 float %8.0f Go to part2 of 2 (part2of2.rec) tbc0to4 float %8.0f Tuberculosis (suspected or confirmed): 0-4 years tbc5upt float %8.0f Tuberculosis (suspected or confirmed): 5 years and over tbcc0to4 float %8.0f Communicable diseases tuberculosis confirmed: 0-4 yrs tbcc5up float %8.0f Communicable diseases tuberculosis confirmed: 5+ years typ0to4 float %8.0f Typhoid fever: 0-4 years typ5upt float %8.0f Typhoid fever: 5 years and over uti0to4 float %8.0f Urinary Tract Infection (not sexually transmitted): 0–4 years uti5upt float %8.0f Urinary Tract Infection (not sexually transmitted): 5+ years oti0to4 float %8.0f Other (nonspecified): 0-4 years oti5upt float %8.0f Other (nonspecified): 5 years and over tot0to4 float %8.0f TOTAL Outpatient diagnoses 0-4 years tot5upt float %8.0f TOTAL: Outpatient diagnoses 5 years and over other1 str36 %36s Other1 diseases: Specify o1d0to4 float %8.0f Number: Other1 diseases (specify) 0-4 years o1d5upt float %8.0f Number: Other diseases (specify) 5 years and over other2 str44 %44s Other2 diseases: Specify o2d0to4 float %8.0f Number: Other2 diseases (specify): 0-4 years o2d5upt float %8.0f Number: Other2 diseases (specify): 5 years and over other3 str48 %48s Other3 diseases: Specify o3d0to4 float %8.0f Number: Other3 diseases (specify): 0-4 years o3d5upt float %8.0f Number: Other3 diseases specify): 5 years and over other4sp str46 %46s Other4 diseases: Specify o4d0to4 float %8.0f Number: Other4 diseases (specify): 0-4 years o4d5upt float %8.0f Number: Other4 diseases (specify): 5 years and over newanc float %8.0f New antenatal attendances ancre float %8.0f Antenatal re-attendances refromu float %8.0f Referrals from unit firtfa float %8.0f First treatment with Fansidar(IPT1) sectfa float %8.0f Second treatment with Fansidar (IPT2) postvis float %8.0f Postnatal visits vitap float %8.0f Vitamin A supplementation (postnatal) vita2 float %8.0f Vitamin A supplementation less than 2 years webo float %8.0f Weight below bottom line (less than 2 SD) totalwe float %8.0f Total weighed: Child health adm float %8.0f MATERNITY: Admissions ref float %8.0f MATERNITY: Referral to unit delunit float %8.0f MATERNITY: Deliveries in unit lbirth float %8.0f MATERNITY: Live births in unit sbirth float %8.0f MATERNITY: Still births in unit ndeaths float %8.0f MATERNITY: Newborn deaths matdeath float %8.0f MATERNITY: Maternal deaths deltba float %8.0f MATERNITY: Deliveries with TBAs lofne float %8.0f FAMILY PLANNING USERS: Oral: Lofeminal new users lofrev float %8.0f FAMILY PLANNING USERS: Oral: Lofeminal revisits micronew float %8.0f FAMILY PLANNING USERS: Oral: Microgynon new users microrev float %8.0f FAMILY PLANNING USERS: Oral: Microgynon revisits ovnew float %8.0f FAMILY PLANNING USERS: Oral: Ovrette new users ovrev float %8.0f FAMILY PLANNING USERS: Oral: Ovrette revisits othnew float %8.0f FAMILY PLANNING USERS: Oral: Others new users othrev float %8.0f FAMILY PLANNING USERS: Oral: Others revisits condnew float %8.0f FAMILY PLANNING USERS: Condoms new users condrev float %8.0f FAMILY PLANNING USERS: Condoms revisits foamnew float %8.0f FAMILY PLANNING USERS: Foam tablets new users foamrev float %8.0f FAMILY PLANNING USERS: Foam tablets revisits iudnew float %8.0f FAMILY PLANNING USERS: IUDs (Copper T) new users iudrev float %8.0f FAMILY PLANNING USERS: IUDs (Copper T) revisits injnew float %8.0f FAMILY PLANNING USERS: Injectable new users

65
injrev float %8.0f FAMILY PLANNING USERS: Injectable revisits natnew float %8.0f FAMILY PLANNING USERS: Natural new users natrev float %8.0f FAMILY PLANNING USERS: Natural revisits othnew01 float %8.0f FAMILY PLANNING USERS: Others new users othrev01 float %8.0f FAMILY PLANNING USERS: Others revisits totnew float %8.0f FAMILY PLANNING USERS: Total new users totrev float %8.0f FAMILY PLANNING USERS: Total revisits dose1 float %8.0f TETANUS IMMUNISATION: Pregnant women: Dose 1 dose2 float %8.0f TETANUS IMMUNISATION: Pregnant women: Dose 2 dose3 float %8.0f TETANUS IMMUNISATION: Pregnant women: Dose 3 dose4 float %8.0f TETANUS IMMUNISATION: Pregnant women: Dose 4 dose5 float %8.0f TETANUS IMMUNISATION: Pregnant women: Dose 5 tot2to5 float %8.0f TETANUS IMMUNISATION: Pregnant women: Total Doses 2-5 nonprett float %8.0f TETANUS IMMUNISATION: Nonpregnant women: All doses nondose1 float %8.0f TETANUS IMMUNISATION: Nonpregnant: Dose 1 nondose2 float %8.0f TETANUS IMMUNISATION: Nonpregnant Dose 2 nondose3 float %8.0f TETANUS IMMUNISATION: Nonpregnant: Dose 3 nondose4 float %8.0f TETANUS IMMUNISATION: Nonpregnant Dose 4 nondose5 float %8.0f TETANUS IMMUNISATION: Nonpregnant: Dose 5 nonpreg2 float %8.0f TETANUS IMMUNISATION: Nonpregnant: doses 2-5 lofunit float %8.0f CONTRACEPTIVES DISPENSED: Oral Lo-feminal dispensed at unit lofcbda float %8.0f CONTRACEPTIVES DISPENSED: Oral Lo-feminal dispensed by CBDA micunit float %8.0f CONTRACEPTIVES DISPENSED: Oral Microgynon dispensed at unit miccbda float %8.0f CONTRACEPTIVES DISPENSED: Oral Microgynon dispensed by CBDA ovunit float %8.0f CONTRACEPTIVES DISPENSED: Oral Ovrette dispensed at unit ovcbda float %8.0f CONTRACEPTIVES DISPENSED: Oral Ovrettel dispensed by CBDA condunit float %8.0f CONTRACEPTIVES DISPENSED: Condoms dispensed at unit condcbda float %8.0f CONTRACEPTIVES DISPENSED: Condoms dispensed by CBDA foamunit float %8.0f CONTRACEPTIVES DISPENSED: Foam tablets dispensed at unit foamcbda float %8.0f CONTRACEPTIVES DISPENSED: Foam tablets dispensed by CBDA iudunit float %8.0f CONTRACEPTIVES DISPENSED: IUDs (Copper T) dispensed at unit iudcbda float %8.0f CONTRACEPTIVES DISPENSED: IUDs (Copper T) dispensed by CBDA injunit float %8.0f CONTRACEPTIVES DISPENSED: Injectable dispensed at unit injcbda float %8.0f CONTRACEPTIVES DISPENSED: Injectable dispensed by CBDA bcgless1 float %8.0f CHILD IMMUNISATIONS: BCG under 1 year bcg1to4 float %8.0f CHILD IMMUNISATIONS: BCG 1-4 years polio0 float %8.0f CHILD IMMUNISATIONS: Polio 0 piless1 float %8.0f CHILD IMMUNISATIONS: Polio 1 (under 1 year) pi1to4 float %8.0f CHILD IMMUNISATIONS: Polio 1 (1-4 years) piiless1 float %8.0f CHILD IMMUNISATIONS: Polio 2 (under 1 year) pii1to4 float %8.0f CHILD IMMUNISATIONS: Polio 2 (1-4 years) piiiles1 float %8.0f CHILD IMMUNISATIONS: Polio 3 (under 1 year) piiito4 float %8.0f CHILD IMMUNISATIONS: Polio 3 (1-4 years) dptiles1 float %8.0f CHILD IMMUNISATIONS: DPT 1-HepB+Hib1( under 1 year) dptito4 float %8.0f CHILD IMMUNISATIONS: DPT 1-HepB+Hib1(1-4 years) dptiile1 float %8.0f CHILD IMMUNISATIONS: DPT 2- HepB + Hib1(under 1 year) dptii1t4 float %8.0f CHILD IMMUNISATIONS: DPT 2 - HepB + Hib1(1-4 years) dpt3les1 float %8.0f CHILD IMMUNISATIONS: DPT 3-HepB + Hib1(under 1 year) dpt3ito4 float %8.0f CHILD IMMUNISATIONS: DPT 3 -HepB + Hib1(1-4 years) mealess1 float %8.0f CHILD IMMUNISATIONS: Measles (under 1 year) mea1to4 float %8.0f CHILD IMMUNISATIONS: Measles (1-4 years) femster float %8.0f FROM THE OPERATING THEATER: Female sterilisation (tubal ligation)
malester float %8.0f FROM THE OPERATING THEATER: Male sterilisation (vasectomy) nornew float %8.0f FROM THE OPERATING THEATER: Norplant new users norrev float %8.0f FROM THE OPERATING THEATER: Norplant revisits norrem float %8.0f FROM THE OPERATING THEATER: Norplant removals chlo str2 %2s ESSENTIAL DRUGS, VACCINES. & CONTRACEPTIVES: Chloroquine cotrim str2 %2s ESSENTIAL DRUGS, VACCINES, & CONTRACEPTIVES: Cotrimoxazole tabs ors str2 %2s ESSENTIAL DRUGS, VACCINES, & CONTRACEPTIVES: ORS sachets meavac str2 %2s ESSENTIAL DRUGS, VACCINES, & CONTRACEPTIVES: Measles vaccines

66
fansidar str2 %2s ESSENTIAL DRUGS, VACCINES, & CONTRACEPTIVES: Fansidar depo str2 %2s ESSENTIAL DRUGS, VACCINES, & CONTRACEPTIVES: Depo-Provera drug1 str46 %46s Drug1 drug2 str46 %46s Drug2 drug3 str46 %46s Drug3 drug4 str46 %46s Drug4 drug5 str46 %46s Drug5 drug6 str46 %46s Drug6 drug7 str46 %46s Drug7 drug8 str46 %46s Drug8 drug9 str46 %46s Drug9 drug10 str46 %46s Drug10 drug11 str46 %46s Drug11 drug12 str46 %46s Drug12 outplan float %8.0f OUTREACH ACTIVITIES: Planned outcond float %8.0f OUTREACH ACTIVITIES:Conducted income1 float %8.0f FINANCIAL SUMMARY: Income 1 income2 float %8.0f FINANCIAL SUMMARY: Income 2 income3 float %8.0f FINANCIAL SUMMARY: Income 3 income4 float %8.0f FINANCIAL SUMMARY: Income 4 income5 float %8.0f FINANCIAL SUMMARY: Income 5 income6 float %8.0f FINANCIAL SUMMARY: Income 6 income7 float %8.0f FINANCIAL SUMMARY: Income 7 debtrec float %8.0f FINANCIAL SUMMARY: Debt recovery totalinc float %8.0f FINANCIAL SUMMARY: Total income expcat10 float %8.0f FINANCIAL SUMMARY: Expenditure 10 expcat11 float %8.0f FINANCIAL SUMMARY: Expenditure 11 expcat12 float %8.0f FINANCIAL SUMMARY: Expenditure 12 expcat13 float %8.0f FINANCIAL SUMMARY: Expenditure 13 expcat14 float %8.0f FINANCIAL SUMMARY: Expenditure 14 expcat15 float %8.0f FINANCIAL SUMMARY: Expenditure 15 expcat16 float %8.0f FINANCIAL SUMMARY: Expenditure 16 expcat17 float %8.0f FINANCIAL SUMMARY: Expenditure 17 totexp float %8.0f FINANCIAL SUMMARY: Total expenditure balmonth float %8.0f FINANCIAL SUMMARY: Balance of the month prevbal float %8.0f FINANCIAL SUMMARY: Previous month overall balance allbal float %8.0f FINANCIAL SUMMARY: Overall balance cashbal float %8.0f FINANCIAL SUMMARY: Cash balance bankbal float %8.0f FINANCIAL SUMMARY: Bank balance debtacc float %8.0f FINANCIAL SUMMARY: Debt accepted unrecdeb float %8.0f FINANCIAL SUMMARY: Estimate of unrecovered debts nexempt float %8.0f FINANCIAL SUMMARY: Number of exemptions comment1 str50 %50s COMMENT1 comment2 str50 %50s COMMENT2 comment3 str50 %50s COMMENT3 comment4 str50 %50s COMMENT4 bcgvacle str2 %2s MONTHLY MONITORING: BCG vaccination under 1 fpnew str2 %2s MONTHLY MONITORING: Family planning: New acceptors dpt3le1 str2 %2s MONTHLY MONITORING: DPT3 vaccination under 1 opdtotn str2 %2s MONTHLY MONITORING: OPD total new cases meale1 str2 %2s MONTHLY MONITORING: Measles vaccination under 1 newmal str2 %2s MONTHLY MONITORING: New malaria cases newant str2 %2s MONTHLY MONITORING: New antenatal attendances newdia str2 %2s MONTHLY MONITORING: New diarrhoea cases delhunit str2 %2s MONTHLY MONITORING: Deliveries in health units daterep str12 %12s Date of report incharge str22 %22s In-charge name title str28 %28s Title of in-charge witname str20 %20s Witness name title01 str28 %28s


![HMIS [Health Management Information Systems]: Linking Payers and Providers December 2009 Dennis J. Streveler](https://img.pdfslide.us/doc/110x75/56649ecf5503460f94bdc47c/hmis-health-management-information-systems-linking-payers-and-providers.jpg)