Embed Size (px)
Citation preview

Ministry of Finance Department of Economic Affairs
Economic Division 4(3)/Ec. Dn. /2012
MONTHLY ECONOMIC REPORT
MAY 2013 HIGHLIGHTS
The overall growth of GDP at factor cost at constant prices is estimated at 5.0 per cent in
2012-13 (provisional estimates) as compared to the growth of 6.2 per cent during 2011-12
(First Revised Estimates).
Food grains (rice and wheat) stocks held by FCI and State agencies were 77.46 million tonnes as on May 1, 2013.
Overall growth in the Index of Industrial Production (IIP) was 2.3 per cent during April 2013 as compared to (-) 1.3 per cent in April 2012. During April- March 2012-13, IIP growth was 1.1 per cent as compared to 2.9 per cent in April- March 2011-12.
Eight core Infrastructure industries registered 2.3 per cent growth in April 2013 as compared to growth of 5.7 per cent in April 2012. During April- March 2012-13, these sectors grew by 3.2 per cent as compared to 5.0 per cent during April-March 2011-12.
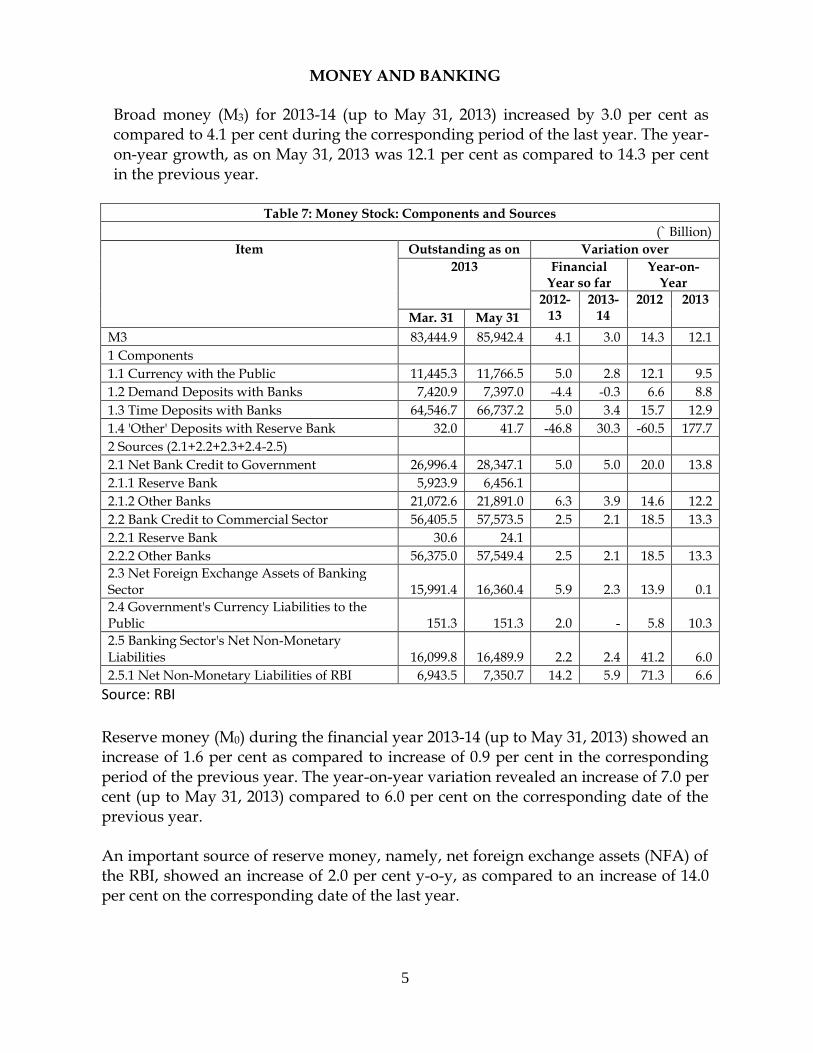
Broad money (M3) for 2013-14 (up to May 31, 2013) increased by 3.0 per cent as compared to 4.1 per cent during the corresponding period of the last year. The year-on-year growth, as on May 31, 2013 was 12.1 per cent as compared to 14.3 per cent in the previous year.
In US Dollar terms, exports decreased by 1.1 per cent while imports increased by 7.0 per cent
during May 2013 over May 2012.
Foreign Currency Assets stood at US$ 259.6 billion in end-May 2013 as compared to US$
253.9 billion at end-May 2012.
The Rupee depreciated against US dollar, Pound sterling and Euro and appreciated against
Japanese yen in the month of May 2013 over April 2013.
The WPI inflation for all commodities for the month of May 2013 has declined to 4.70 per
cent from 4.89 per cent in the previous month.
Gross tax revenue for the financial year 2012-13 (provisional actuals) was ` 1,036,719 crore,
recorded a growth of 16.6 per cent over 2011-12.
Tax revenue (net to Centre) at ` 741,062 crore during 2012-13 (provisional) registered a
growth of 17.7 per cent.
As a proportion of budget estimate, fiscal deficit and revenue deficit during April–March
2012-13 (provisional) was 95.4 per cent and 103.7 per cent respectively.
(RANGEET GHOSH) Assistant Adviser

2
ECONOMIC GROWTH As per the Provisional Estimates of the Central Statistics Office (CSO), the growth in Gross Domestic Product (GDP) at factor cost at constant (2004-05 prices) is estimated at 5.0 per cent in 2012-13 with agriculture, industry and services registering growth rates of 1.9 per cent, 2.1 per cent and 7.1 per cent respectively. As per the First Revised Estimates, the growth in GDP at factor cost at constant (2004-05) prices is estimated at 6.2 per cent in 2011-12. At disaggregated level, this (First Revised 2011-12) comprises growth of 3.6 per cent in agriculture and allied activities, 3.5 per cent in industry and 8.2 per cent in services. The growth in GDP is placed at 4.8 per cent in the fourth quarter of 2012-13.
Table 1: Growth of GDP at factor cost by economic activity (at 2004-05 prices)
Sector Growth
Percentage Share in GDP
2010-11 2011-12
1R 2012-
13(PE)
2010-11 2011-12
1R 2012-
13(PE)
1 Agriculture, forestry & fishing
7.9 3.6 1.9
14.5 14.1 13.7
2 Industry 9.2 3.5 2.1
28.2 27.5 26.7
a Mining & quarrying 4.9 -0.6 -0.6
2.2 2.1 2.0
b Manufacturing 9.7 2.7 1.0
16.2 15.7 15.1
c Electricity, gas & water supply
5.2 6.5 4.2
1.9 1.9 1.9
d Construction 10.2 5.6 4.3
7.9 7.9 7.8
3 Services 9.8 8.2 7.1
57.3 58.4 59.6
a Trade, hotels, transport & communication
12.3
7.0 6.4
27.3 27.5 27.8
b Financing , insurance, real estate & business services
10.1
11.7 8.6
17.2 18.1 18.7
c Community, social & personal services
4.3
6.0 6.6
12.8 12.8 13.0
4 GDP at factor cost 9.3 6.2 5.0
100.0 100.0 100.0
1R: 1st Revised Estimates; PE: Provisional Estimates. Source: CSO
Table 2 : Quarterly Growth Estimate of GDP (Year-on-year in per cent)
Sector
2011-12 2012-13
Q1 Q2 Q3 Q4 Q1 Q2 Q3 Q4
1 Agriculture, forestry & fishing 5.4 3.2 4.1 2.0 2.9 1.7 1.8 1.4
2 Industry 5.7 3.8 2.6 2.1 1.8 1.3 2.5 2.7
a Mining & quarrying -0.4 -5.3 -2.6 5.2 0.4 1.7 -0.7 -3.1
b Manufacturing 7.4 3.1 0.7 0.1 -1.0 0.1 2.5 2.6
c Electricity, gas & water supply 6.6 8.4 7.7 3.5 6.2 3.2 4.5 2.8
d Construction 3.8 6.5 6.9 5.1 7.0 3.1 2.9 4.4
3 Services 8.9 8.5 8.3 7.3 7.7 7.6 6.7 6.6
a Trade, hotels, transport & communication 9.5 7.0 6.9 5.1 6.1 6.8 6.4 6.2
b Financing , insurance, real estate & business services 11.6 12.3 11.4 11.3 9.3 8.3 7.8 9.1
c Community, social & personal services 3.5 6.5 6.8 6.8 8.9 8.4 5.6 4.0
4 GDP at factor cost 7.5 6.5 6.0 5.1 5.4 5.2 4.7 4.8
Source: CSO.

3
AGRICULTURE
Rainfall: With respect to rainfall situation in India, the year is categorized into four seasons: winter season (January-February); pre monsoon (March-May); south west monsoon (June-September) and post monsoon (October-December). South west monsoon accounts for more than 75 per cent of annual rainfall. The actual rainfall received during the Monsoon season 2013, as on 12.6.2013 has been 56.6 mm as against the normal at 45.8 mm. All India production of food grains : As per the 3rd advance estimates released by Ministry of Agriculture on 3.5.2013, production of food grains during 2012-13 is estimated at 255.36 million tonnes compared to 259.32 million tonnes (Final advance estimates) in 2011-12.
Procurement: Procurement of rice as on 1st April, 2013 was 29.31 million tonnes of Kharif Marketing Season as against 28.98 million tonnes procured last year in the corresponding period respectively. This represents an increase of 1.14 per cent. Wheat procurement during Rabi Marketing Season 2013-14 is 0.57 million tonnes as compared to 0.78 million tonnes during the corresponding period last year.
Off-take: Off-take of rice during the month of March, 2013 was 30.42 lakh tonnes. This comprises 19.42 lakh tonnes under TPDS and 11.00 lakh tonnes under other schemes during February 2013. In respect of wheat, the total off take was 34.21 lakh tonnes comprising of 13.09 lakh tonnes under TPDS and 21.12 lakh tonnes under other schemes. Stocks: Stocks of food-grains (rice and wheat) held by FCI as on May 1, 2013 were 77.46 million tonnes, which is higher by 8.91 per cent over the level of 71.12 million tonnes as on May 1, 2012.
P = Provisional
Table 3 : Procurement in Million Tonnes
2010-11 2011-12 2012-13 2013-14
Rice 34.20 35.04 30.94* -
Wheat 22.51 28.34 38.15 21.64*
Total 56.71 63.38 69.09 21.64
* Position as on 3.5.2013
Table 4: Off-take and stocks of food grains (Million Tonnes)
Off-take Stocks
2010-11 2011-12 2012-13 (P) May 1, 2012
May 1, 2013
Rice 29.76 32.10 32.54 32.92 34.73
Wheat 21.92 22.98 23.27 38.20 42.73
Total 51.68 55.08 55.81 71.12 77.46
4
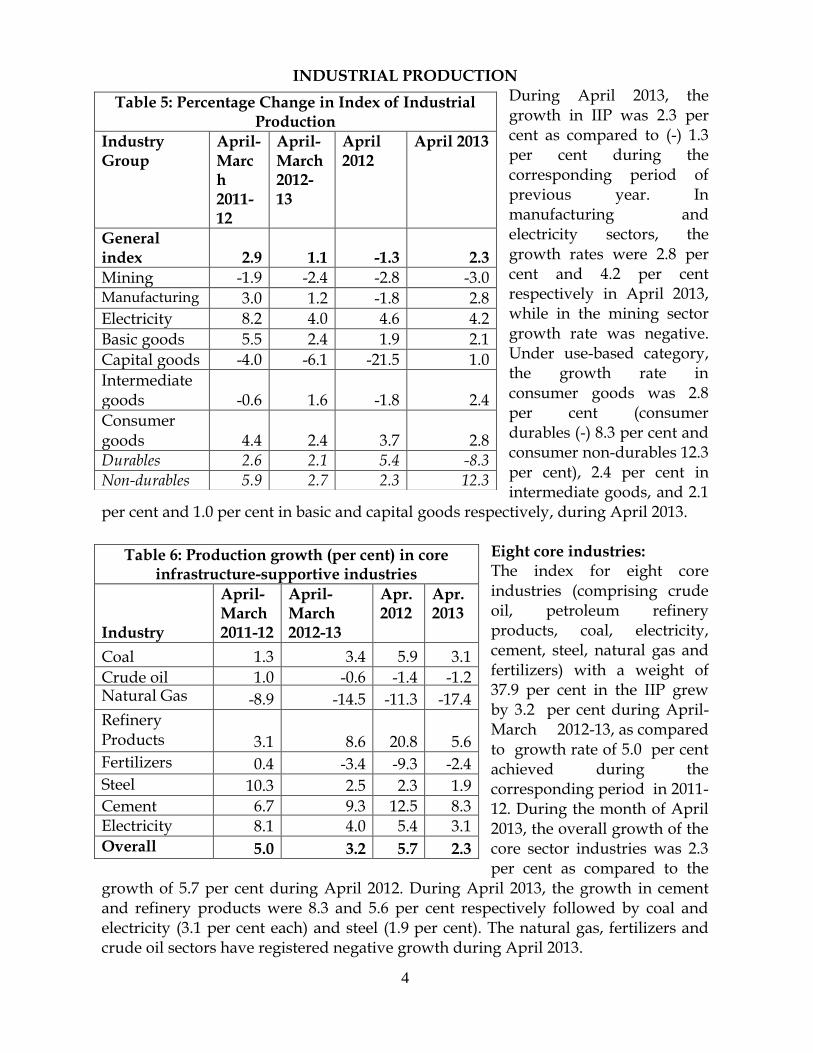
INDUSTRIAL PRODUCTION During April 2013, the growth in IIP was 2.3 per cent as compared to (-) 1.3 per cent during the corresponding period of previous year. In manufacturing and electricity sectors, the growth rates were 2.8 per cent and 4.2 per cent respectively in April 2013, while in the mining sector growth rate was negative. Under use-based category, the growth rate in consumer goods was 2.8 per cent (consumer durables (-) 8.3 per cent and consumer non-durables 12.3 per cent), 2.4 per cent in intermediate goods, and 2.1
per cent and 1.0 per cent in basic and capital goods respectively, during April 2013.
Eight core industries: The index for eight core industries (comprising crude oil, petroleum refinery products, coal, electricity, cement, steel, natural gas and fertilizers) with a weight of 37.9 per cent in the IIP grew by 3.2 per cent during April-March 2012-13, as compared to growth rate of 5.0 per cent achieved during the corresponding period in 2011-12. During the month of April 2013, the overall growth of the core sector industries was 2.3 per cent as compared to the
growth of 5.7 per cent during April 2012. During April 2013, the growth in cement and refinery products were 8.3 and 5.6 per cent respectively followed by coal and electricity (3.1 per cent each) and steel (1.9 per cent). The natural gas, fertilizers and crude oil sectors have registered negative growth during April 2013.
Table 5: Percentage Change in Index of Industrial Production
Industry Group
April-March 2011-12
April-March 2012-13
April 2012
April 2013
General index 2.9 1.1 -1.3 2.3
Mining -1.9 -2.4 -2.8 -3.0 Manufacturing 3.0 1.2 -1.8 2.8
Electricity 8.2 4.0 4.6 4.2
Basic goods 5.5 2.4 1.9 2.1
Capital goods -4.0 -6.1 -21.5 1.0
Intermediate goods -0.6 1.6 -1.8 2.4
Consumer goods 4.4 2.4 3.7 2.8 Durables 2.6 2.1 5.4 -8.3 Non-durables 5.9 2.7 2.3 12.3
Table 6: Production growth (per cent) in core infrastructure-supportive industries
Industry
April-March 2011-12
April-March 2012-13
Apr. 2012
Apr. 2013
Coal 1.3 3.4 5.9 3.1
Crude oil 1.0 -0.6 -1.4 -1.2 Natural Gas -8.9 -14.5 -11.3 -17.4
Refinery Products 3.1 8.6 20.8 5.6
Fertilizers 0.4 -3.4 -9.3 -2.4
Steel 10.3 2.5 2.3 1.9
Cement 6.7 9.3 12.5 8.3 Electricity 8.1 4.0 5.4 3.1 Overall growth
5.0 3.2 5.7 2.3
5
MONEY AND BANKING
Broad money (M3) for 2013-14 (up to May 31, 2013) increased by 3.0 per cent as compared to 4.1 per cent during the corresponding period of the last year. The year-on-year growth, as on May 31, 2013 was 12.1 per cent as compared to 14.3 per cent in the previous year.
Table 7: Money Stock: Components and Sources
(` Billion)
Item Outstanding as on Variation over
2013 Financial Year so far
Year-on-Year
2012-13
2013-14
2012 2013
Mar. 31 May 31
M3 83,444.9 85,942.4 4.1 3.0 14.3 12.1
1 Components
1.1 Currency with the Public 11,445.3 11,766.5 5.0 2.8 12.1 9.5
1.2 Demand Deposits with Banks 7,420.9 7,397.0 -4.4 -0.3 6.6 8.8
1.3 Time Deposits with Banks 64,546.7 66,737.2 5.0 3.4 15.7 12.9
1.4 'Other' Deposits with Reserve Bank 32.0 41.7 -46.8 30.3 -60.5 177.7
2 Sources (2.1+2.2+2.3+2.4-2.5)
2.1 Net Bank Credit to Government 26,996.4 28,347.1 5.0 5.0 20.0 13.8
2.1.1 Reserve Bank 5,923.9 6,456.1
2.1.2 Other Banks 21,072.6 21,891.0 6.3 3.9 14.6 12.2
2.2 Bank Credit to Commercial Sector 56,405.5 57,573.5 2.5 2.1 18.5 13.3
2.2.1 Reserve Bank 30.6 24.1
2.2.2 Other Banks 56,375.0 57,549.4 2.5 2.1 18.5 13.3
2.3 Net Foreign Exchange Assets of Banking Sector 15,991.4 16,360.4 5.9 2.3 13.9 0.1
2.4 Government's Currency Liabilities to the Public 151.3 151.3 2.0 - 5.8 10.3
2.5 Banking Sector's Net Non-Monetary Liabilities 16,099.8 16,489.9 2.2 2.4 41.2 6.0
2.5.1 Net Non-Monetary Liabilities of RBI 6,943.5 7,350.7 14.2 5.9 71.3 6.6
Source: RBI
Reserve money (M0) during the financial year 2013-14 (up to May 31, 2013) showed an increase of 1.6 per cent as compared to increase of 0.9 per cent in the corresponding period of the previous year. The year-on-year variation revealed an increase of 7.0 per cent (up to May 31, 2013) compared to 6.0 per cent on the corresponding date of the previous year. An important source of reserve money, namely, net foreign exchange assets (NFA) of the RBI, showed an increase of 2.0 per cent y-o-y, as compared to an increase of 14.0 per cent on the corresponding date of the last year.

6
Scheduled Commercial Banks (SCBs): business in India During the current financial year 2013-14 (up to May 31, 2013), Bank credit registered increase of 2.3 per cent, as compared to a deterioration of 0.9 per cent during the corresponding period last year. The y-o-y variation revealed an increase of 15.4 per cent as compared to 17.8 per cent during the same period in the previous year. Non-Food credit during this period increased by 1.9 per cent as compared to a deterioration of 1.6 per cent during the corresponding period of last year. The y-o-y variation revealed an increase of 15.5 per cent as compared to 17.2 per cent during the same period in the previous year. The aggregate deposits with Scheduled Commercial Banks (SCBs) increased by 3.2 per cent (up to May 31, 2013), as compared to a deterioration of 0.6 per cent recorded during the corresponding period last year. The y-o-y variation revealed an increase of 14.5 per cent as compared to 14.3 per cent in the previous year.
Table 8: Scheduled Commercial Banks - Business in India
Items
Percentage Variation
2013-14 Financial year so far Year-on-year
Outstanding as on ( Rs. billion) 2012-13 2013-14 2012 2013
March 29, 2013
May 31, 2013
Bank Credit 52604.6 53792.4 -0.9 2.3 17.8 15.4
Non-Food credit 51640.4 52612.0 -1.6 1.9 17.2 15.5
Aggregate deposits 67504.5 69665.3 -0.6 3.2 14.3 14.5
Investments in Government. And other approved securities 20061.0 20869.9 3.9 4.0 14.0 15.0
Source: RBI

7
Interest rates (per cent per annum) As on May 31, 2013, Bank Rate was 8.25 per cent as compared to 9.00 percent on the corresponding date of last year. Call money rates (weighted average) was 7.22 per cent as compared with 8.10 per cent on the corresponding date of last year.
EXTERNAL SECTOR
Foreign trade: Exports decreased by 1.1 per cent and imports increased by 7.0 per
cent, in US dollar terms during May 2013 over May 2012. Over the same period, oil
and non-oil imports increased by 3.0 per cent and 9.1 per cent respectively.
Table 10 : Exports and imports (in US$ million)
Item
2011-12 (Apr-Mar)
2012-13 (Apr-Mar)
2013-14 (April &
May)
May
% Change in May 2013 2012 2013
Exports 305964 300274 48670 24780 24506 -1.1
Imports 489319 491945 86601 41733 44649 7.0
Oil imports 154968 169396 29107 14578 15022 3.0
Non-Oil imports 334352 322549 57494 27155 29627 9.1
Trade balance -183356 -191671 -37931 -16954 -20144 18.8
Source: Provisional data as per the Press Note of the Ministry of Commerce and Industry
Table 9 : Policy Rates/Interest Rates
(per cent per annum)
Item / Week Ended 2012 2013
June 1 May 31
Cash Reserve Ratio (per cent)(1) 4.75 4.00
Bank Rate 9.00 8.25
Repo Rate 8.00 7.25
Reverse Repo Rate 7.00 6.25
Prime Lending Rate(2) 9.75 / 10.50 9.70 / 10.25
Deposit Rate(3) 8.00 / 9.25 7.50 / 9.00
Call Money Rate (Weighted Average)(4)
8.10 7.22
(1) Cash Reserve Ratio relates to Scheduled Commercial Banks (excluding Regional Rural Banks). (2) Prime Lending Rate relates to five major Banks. (3) Deposit Rate relates to major Banks for term deposits of more than one year maturity. (4) Data cover 90-95 per cent of total transactions reported by participants. Source: RBI

8
Table 11: Foreign Currency Assets
Amount Variation
` crore US$
million ` crore US$ million
At the end of
(over last year) March, 2008 1196023 299230 359426 107306 March, 2009 1231340 241676 35317 -57554 March, 2010 1150778 254935 -80562 13259 March, 2011 1225999 274580 75221 19645 March, 2012 1333954 260742 107955 -13838 March, 2013 1418339 260775 84385 33 2013-14
(over last month) April 2013 1433397 264372 15058 3597 May 2013 1466378 259555 32981 -4817
Source: RBI.
Exchange rate: The rupee depreciated by 1.2 per cent against US dollar, 1.1 per cent
against Pound sterling and 0.9 per cent against Euro and appreciated by 2.2 per cent
against Japanese yen in the month of May 2013 over April 2013.
Table 12 : Rupee per unit of foreign currency*
US dollar Pound sterling Japanese yen Euro
March, 2009 51.2287 72.9041 0.5251 66.9207
March, 2010 45.4965 68.4360 0.5018 61.7653
March 2011 44.9684 72.7070 0.5498 62.9660
March, 2012 50.3213 79.6549 0.6103 66.4807
March 2013** 54.4046 82.0190 0.5744 70.5951
2013-14
April 2013 54.3757 83.2005 0.5571 70.7652
May 2013 55.0108 84.1087 0.5451 71.3803
* FEDAI Indicative Market Rates (on monthly average basis).
** Data from March, 2013 onwards are based on RBI’s reference rate.

9
External assistance and debt service payments: Gross external assistance during April-May
2013 stands at ` 3142.5 crore as compared to ` 3289.2 crore during the corresponding period
of the previous year. Net disbursement stood at ` 1693.2 crore during April-May 2013 as
compared to `1899 crore during April-May 2012 while net transfers were `1284.3 crore
during April-May 2013 as compared to `1469.1 crore during April-May 2012.
Table 13: External Assistance and Debt Service Payments
(Rs. In Crore)
MAY 2013
During the Financial year 2013-2014 up to May,
2013
MAY 2012
During the Financial year
2012-2013 up to May, 2012
External Assistance (Government Account)
1) Gross Disbursement 1,283.17 2,742.94 1,075.65 1,733.50
2) Repayments 925.44 1,449.32 887.02 1,300.46
3) Interest Payments 147.57 408.90 155.92 405.00
4) Net Disbursement (1-2) 357.73 1,293.62 188.63 433.04
5) Net Transfers (4-3) 210.16 884.72 32.71 28.04
External Assistance (Non-Government Account)
1) Gross Disbursement 8.12 91.94 547.94 1,472.26
2) Repayments 0.00 0.00 88.02 89.84
3) Interest Payments 0.00 0.00 18.73 24.83
4) Net Disbursement (1-2) 8.12 91.94 459.92 1,382.42
5) Net Transfers (4-3) 8.12 91.94 441.19 1,357.59
Government Grants
1) Gross Disbursement 277.85 307.64 4.49 73.21
2) Repayments 0.00 0.00 0.00 0.00
3) Interest Payments 0.00 0.00 0.00 0.00
4) Net Disbursement (1-2) 277.85 307.64 4.49 73.21
5) Net Transfers (4-3) 277.85 307.64 4.49 73.21
Non Government Grants
1) Gross Disbursement 0.00 0.00 0.00 10.26
2) Repayments 0.00 0.00 0.00 0.00
3) Interest Payments 0.00 0.00 0.00 0.00
4) Net Disbursement (1-2) 0.00 0.00 0.00 10.26
5) Net Transfers (4-3) 0.00 0.00 0.00 10.26
Grand Total
1) Gross Disbursements 1,569.14 3,142.52 1,628.08 3,289.23
2) Repayments 925.44 1,449.32 975.04 1,390.30
3) Interest Payments 147.57 408.90 174.65 429.83
4) Net Disbursement (1-2) 643.70 1,693.20 653.04 1,898.93
5) Net Transfers (4-3) 496.13 1,284.30 478.39 1,469.10

10
INFLATION
Wholesale Price Index (WPI 2004-05=100): The headline WPI inflation has declined to three year low of 4.70 per cent in May 2013 as against 4.89 per cent in the previous month. Inflation has declined for fuel (Petrol, LPG and Kerosene) and manufactured products (sugar, metals, chemicals and non-metallic mineral products). Inflation for primary articles (wt. 20.12%) has increased to 6.65 per cent in May 2013 from 5.75 per cent in the previous month mainly on account of rice, fruits & vegetables, milk and fish marine. Inflation, however, has declined in respect of wheat, gram, arhar, moong, masur, eggs, fish inland, poultry chicken, tea and coffee. Food inflation increased to 7.64 per cent from 6.27 per cent in the last month. Non food manufacturing inflation (core as defined by RBI) has continued to remain moderated and stood at 2.43 per cent as against 2.77 per cent in the previous month. The average WPI inflation rate for last 12 months (June 2012 to May 2013) was 6.89 per cent as compared to 8.58 per cent during corresponding period in 2012-13.WPI inflation rates for major groups are indicated in Table 14 below.
Table 14: Current Price Situation based on Monthly WPI in May 2013
(Base: 2004-05=100)
Major groups Weight
(%)
Cumulative change (%)
Since March
Inflation (%) Inflation (%)
(Average of 12 months)
2013-14 2012-13 2013-14 2012-13 2013-14 2012-13
ALL COMMODITIES 100.00 0.88 1.80 4.70 7.55 6.89 8.58
PRIMARY ARTICLES 20.12 2.78 3.46 6.65 10.31 9.15 9.18
Food articles 14.34 4.20 4.57 8.25 10.63 9.28 7.56
FUEL AND POWER 14.91 0.21 0.62 7.32 11.53 9.71 13.78
MANUFACTURED PDT. 64.97 0.27 1.40 3.11 5.24 5.07 6.93
Inflation based on Consumer Price Indices (CPIs): The all India CPI inflation (combined) has declined to 9.31 per cent in May 2013 from 9.39 per cent in April 2013 mainly on account of moderation in pulses, oils & fats, fruits, meat & fish and sugar. Inflation based on CPI-IW declined to 10.24 per cent in April 2013 from 11.44 per cent in March 2013. CPI-IW food inflation in April 2013 also declined to 12.39 per cent from 13.21 per cent in the last month. Inflation for CPI-AL and CPI-RL was 12.32 per cent and 12.15 per cent respectively in April 2013 as against 12.64 per cent and 12.62 per cent in March 2013.
Table 15: Year-on-Year inflation based on WPI and CPIs (per cent)
WPI CPI-IW CPI-AL CPI-RL CPI(NS)
Base :-> 2004-05 2001 1986-87 1986-87 2010
May-12 7.55 10.16 7.77 8.11 10.36
Jun-12 7.58 10.05 8.03 8.54 9.93
Jul-12 7.52 9.84 8.61 8.94 9.86
Aug-12 8.01 10.31 9.18 9.34 10.03
Sep-12 8.07 9.14 9.43 9.93 9.73
Oct-12 7.32 9.60 9.85 9.84 9.75
Nov-12 7.24 9.55 10.31 10.47 9.90
Dec-12 7.31 11.17 11.33 11.31 10.56
Jan-13 7.31 11.62 12.30 12.28 10.79
Feb-13 7.28 12.06 12.72 12.52 10.91
Mar-13 5.65 11.44 12.64 12.62 10.39
Apr-13 4.89 10.24 12.32 12.15 9.39
May- 13 4.70 - - - 9.31
Note: WPI inflation for Apr & May 2013, CPI (New Series) inflation for May 2013 is provisional.

11
Table 16: World Commodity Price Data
Annual averages Monthly averages
Commodity Unit Jan-Dec Jan- Dec Jan- May Mar Apr May 2011 2012 2013 2013 2013 2013
Coal, Australia $/mt 121.5 96.4 90.8 91.0 87.8 87.5
Crude oil, average $/bbl 104.0 105.1 102.7 102.5 98.9 99.4
Natural gas, US $/mmbtu 5.1 2.8 3.7 3.8 4.2 4.0
Cocoa ¢/kg 298.0 239.2 225.3 215.3 229.4 234.3
Coffee, Robusta ¢/kg 240.8 226.7 225.2 234.3 224.2 218.6
Tea, auctions avg. ¢/kg 292.1 289.8 293.9 289.6 288.9 296.7
Coconut oil $/mt 1730 1111 826 820 793 826
Groundnut oil $/mt 1988 2425 1954 1924 1899 1867
Palm oil $/mt 1125.0 999.3 849.8 854.0 842.0 849.0
Palm kernel oil $/mt 1648 1110 826 833 828 827
Soybean meal $/mt 398.0 524.1 523.8 520.0 484.0 542.0
Soybean oil $/mt 1299 1226 1130 1116 1095 1074
Soybeans $/mt 541.0 591.4 538.0 511.0 495.0 496.0
Maize $/mt 291.7 298.4 298.1 309.0 279.9 295.5
Rice, Thailand, 5% $/mt 543.0 562.9 557.3 559.0 557.0 543.5
Wheat, US, HRW $/mt 316.3 313.2 318.4 309.7 308.3 319.7
Bananas, US $/mt 968.0 984.0 920.2 937.0 902.5 909.4
Oranges $/mt 891 868 831 907 869 758
Fishmeal $/mt 1537 1558 1854 1803 1847 1817
Meat, chicken ¢/kg 192.6 207.9 223.7 223.7 226.1 229.5
Meat, beef ¢/kg 404.2 414.2 425.5 422.7 426.2 419.8
Sugar, world ¢/kg 57.3 47.5 40.2 40.8 39.3 38.9
Plywood ¢/sheets 607.5 610.3 574.8 575.6 558.6 540.7
Cotton A Index ¢/kg 332.9 196.7 200.5 208.2 203.4 204.3
Rubber, TSR20 ¢/kg 451.9 315.6 278.0 280.0 249.9 251.3
DAP $/mt 618.9 539.8 493.6 507.5 508.3 485.1
Urea $/mt 421.0 405.4 379.2 385.0 361.5 344.4
Copper $/mt 8828 7962 7648 7646 7234 7249
Lead ¢/kg 240.1 206.5 218.6 216.9 202.7 203.3
Tin ¢/kg 2605 2113 2290 2330 2166 2078
Nickel $/mt 22910 17548 16502 16725 15673 14948
Zinc ¢/kg 219.4 195.0 195.5 192.6 185.6 183.2
Gold $/toz 1569 1670 1559 1593 1488 1414
Silver ¢/toz 3522 3114 2771 2879 2536 2304
Iron ore $/dmt 167.8 128.5 141.4 139.9 137.4 124.4
Source: World Bank – The Pink Sheet

12
Public Finance As a proportion of budget estimate, fiscal deficit and revenue deficit during April–March 2012-13 (provisional) was 95.4 per cent and 103.7 per cent respectively. Table 17: Trends in Central Government Finances during April-March 2012-13 (Rs. Crore)
Items
2011-12
2012-13
Variations
Prov. over
RE 2012-13
Provisional
2012-13
as percent of
RE
per cent
change
2012-13 (P)
over 2011-12
Actuals BE RE Provisional Absolute
actual
(1) (3) (4) (5) (6) (7) (8) (9)
1. Revenue Receipts (2+3) 751158 935685 871828 878804 6976 100.8 17.0
Gross tax revenue* 888898 1077612 1038037 1036719 -1318 99.9 16.6
2.Tax (net to Centre) 629486 771071 742115 741062 -1053 99.9 17.7
3.Non-Tax Revenue 121672 164614 129713 137742 8029 106.2 13.2
4. Non-Debt Capital
Receipts(5+6) 36938 41650 38073 40728 2655 107.0 10.3
5. Recovery of loans 18850 11650 14073 14838 765 105.4 -21.3
6. Disinvestment Proceeds 18088 30000 24000 25890 1890 107.9 43.1
7. Total Non-Debt Receipt
(1+4) 788096 977335 909901 919532 9631 101.1 16.7
Memo items
Corporation Tax 322816 373227 358874 356326 -2548 99.3 10.4
Income Tax 164525 189866 199930 196844 -3086 98.5 19.6
Union Excise Duty 144901 193729 171315 175873 4558 102.7 21.4
Customs 149328 186694 164853 165818 965 100.6 11.0
Service Tax 97509 124000 132697 132518 -179 99.9 35.9
Total (Memo Items) 879079 1067516 1027669 1027379 -290 100.0 16.9
Devolution to States 255414 301921 291547 291547 0 100.0 14.1
8. Non-Plan Expenditure
(a+b) 891990 969900 1001638 995139 -6499 99.4 11.6
(a) On Revenue Account 812049 865596 919699 912899 -6800 99.3 12.4
of which:
(1) Interest Payments 273150 319759 316674 311996 -4678 98.5 14.2
(2) Major Subsidies 211335 179554 247854 247957 103 100.0 17.3
(3) Pensions 61166 63183 63836 70166 6330 109.9 14.7
(b) On Capital Account 79941 104304 81939 82240 301 100.4 2.9
9. Plan Expenditure (a+b) 412375 521025 429187 414283 -14904 96.5 0.5
(a) Revenue Account 333736 420513 343373 329364 -14009 95.9 -1.3
(b) Capital Account 78639 100512 85814 84919 -895 99.0 8.0
10. Total Expenditure (8+9) 1304365 1490925 1430825 1409422 -21403 98.5 8.1
11. Revenue Expenditure
(8a+9a) 1145785 1286109 1263072 1242263 -20809 98.4 8.4
12. Grants for Capita Assets 132582 164672 124275 115704 -8571 93.1 -12.7
13. Capital Expenditure
(8b+9b) 158580 204816 167753 167159 -594 99.6 5.4
14. Revenue Deficit (11-1) 394627 350424 391244 363459 -27785 92.9 -7.9
15. Effective Revenue
Deficit (14-12) 262045 185752 266969 247755 -19214 92.8 -5.5
16. Fiscal Deficit (7-10) 516269 513590 520924 489890 -31034 94.0 -5.1
17. Primary Deficit (14-
8(a)(1)) 243119 193831 204250 177894 -26356 87.1 -26.8
Source: Controller General of Accounts. * Gross Tax Revenue is prior to devolution to the States.