Embed Size (px)
Citation preview
1
Ministry of Energy, Mines and Petroleum Resources
DETERMINING GAS CONTENT FROM MUD GAS LOGS
Examples From Northeastern British Columbia
DETERMINING GAS CONTENT FROM MUD GAS LOGS
Examples From Northeastern British Columbia
Warren Walsh, PGeoMinistry of Energy, Minesand Petroleum Resources
Warren Walsh, PGeoMinistry of Energy, Minesand Petroleum Resources
Bill Donovan, PEDonovan Brothers IncorporatedAutomated Mudlogging Systems
Bill Donovan, PEDonovan Brothers IncorporatedAutomated Mudlogging Systems
2
Purpose� Calibrate mud log to indicate total gas
content� cc/g (scf/tonne)
� Continuous �log based� gas content data
� Compare to desorption work from core/cuttings
� Regional evaluations
� Calibrate mud log to indicate total gas content
� cc/g (scf/tonne)
� Continuous �log based� gas content data
� Compare to desorption work from core/cuttings
� Regional evaluations
3
Mud Logging � Gas Detection
� Mud logging records lots of information about rocks/fluid/drilling activities
� Gas detection (gas log)� record of natural gas in circulated drilling fluid
(mud)� Reported as total gas (gas units) and Rate
Of Penetration (ROP) (T/L)
� Mud logging records lots of information about rocks/fluid/drilling activities
� Gas detection (gas log)� record of natural gas in circulated drilling fluid
(mud)� Reported as total gas (gas units) and Rate
Of Penetration (ROP) (T/L)
ROP is T/L is inverse velocity
4
� Direct measure of hydrocarbons
� Measured at surface (STP)
� Gas is insoluble in water and drilling mud
� Note: measured not by volume or depth drilled but relative to time
� Direct measure of hydrocarbons
� Measured at surface (STP)
� Gas is insoluble in water and drilling mud
� Note: measured not by volume or depth drilled but relative to time
Mud Logging � Gas Detection
5
Gas Log Measurement
� Calibrate the gas log� while drilling � used measured calcium carbide
lags� or
� post drilling � estimate expected gas released from reservoir zones
� Calibrate the gas log� while drilling � used measured calcium carbide
lags� or
� post drilling � estimate expected gas released from reservoir zones
� Gas log measurement � direct linear relationship with
volume of gas released
� Gas log measurement � direct linear relationship with
volume of gas released
6
Assumptions
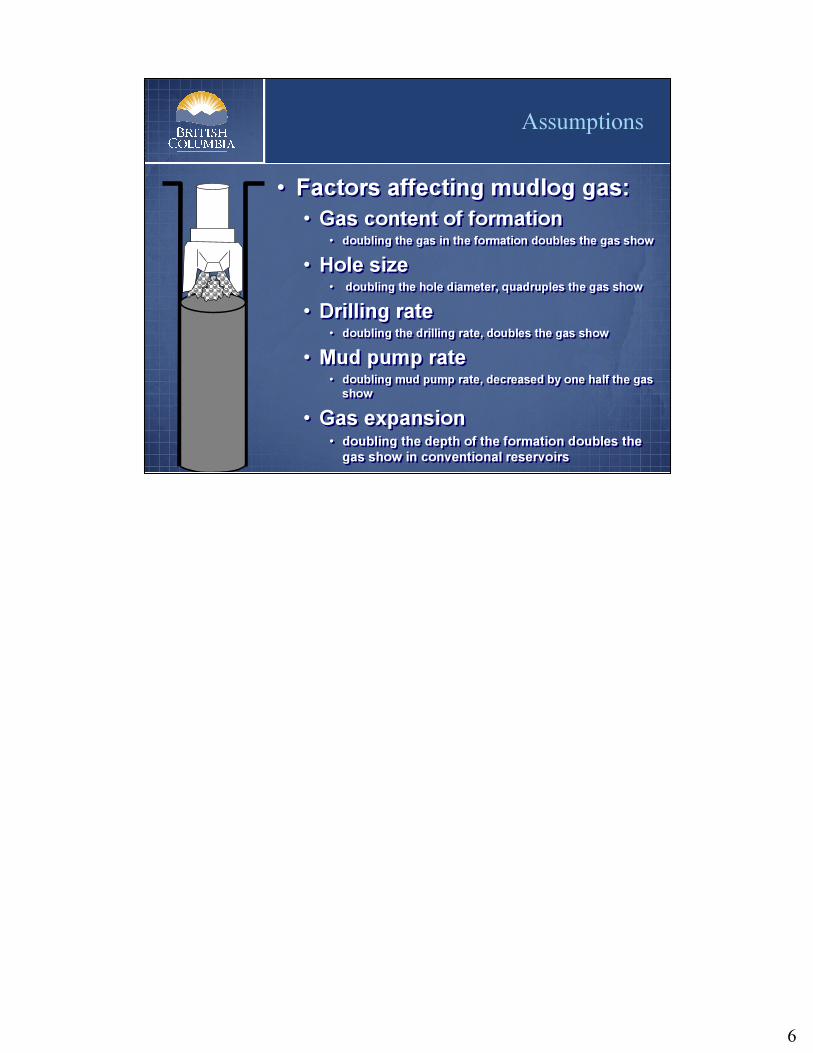
� Factors affecting mudlog gas:� Gas content of formation
� doubling the gas in the formation doubles the gas show� Hole size
� doubling the hole diameter, quadruples the gas show� Drilling rate
� doubling the drilling rate, doubles the gas show� Mud pump rate
� doubling mud pump rate, decreased by one half the gas show
� Gas expansion� doubling the depth of the formation doubles the
gas show in conventional reservoirs
7
Assumptions
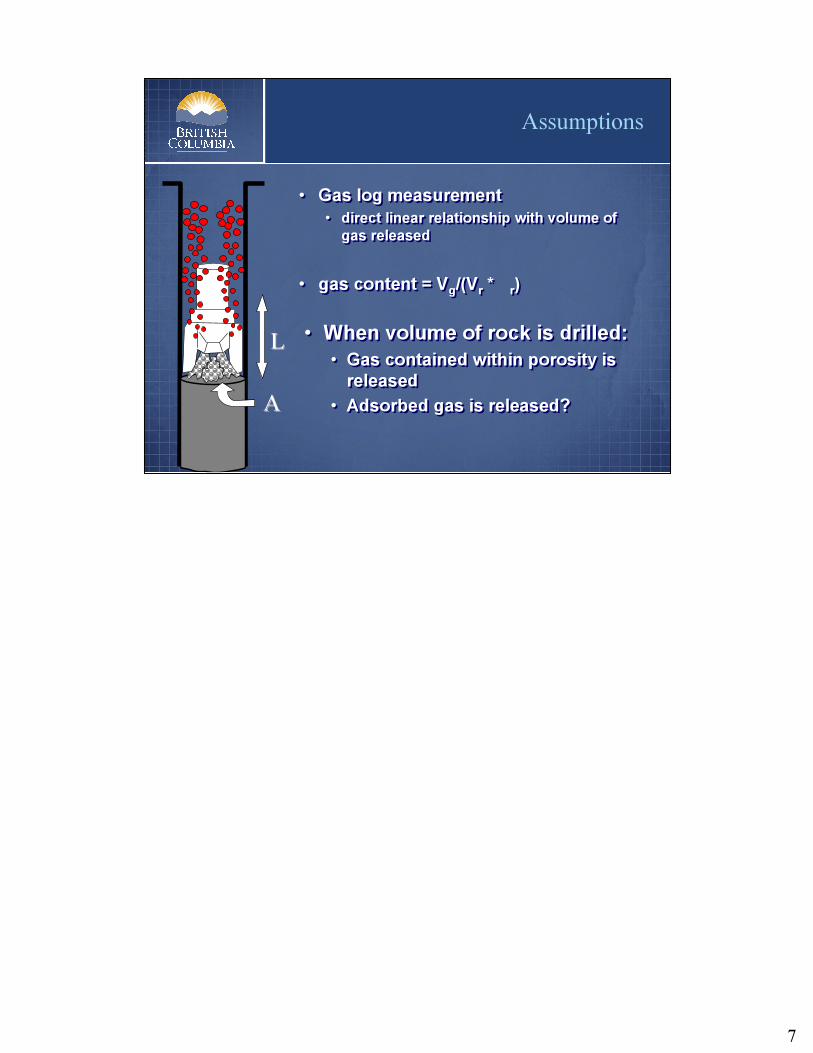
� When volume of rock is drilled:� Gas contained within porosity is
released� Adsorbed gas is released?
� When volume of rock is drilled:� Gas contained within porosity is
released� Adsorbed gas is released?
� Gas log measurement � direct linear relationship with volume of
gas released
� gas content = Vg/(Vr * r)
� Gas log measurement � direct linear relationship with volume of
gas released
� gas content = Vg/(Vr * r)
LL
AA
8
Assumptions
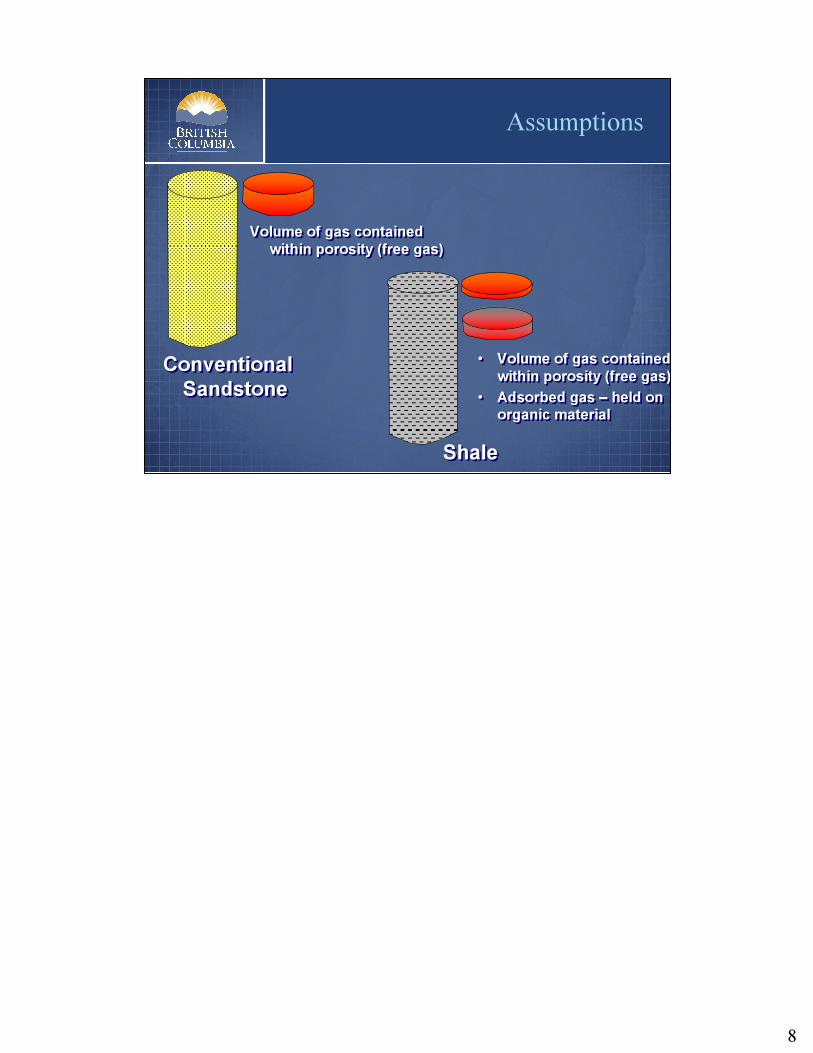
� Volume of gas contained within porosity (free gas)
� Adsorbed gas � held on organic material
� Volume of gas contained within porosity (free gas)
� Adsorbed gas � held on organic material
Volume of gas contained within porosity (free gas)
Volume of gas contained within porosity (free gas)
Conventional Sandstone
Conventional Sandstone
Shale Shale
9
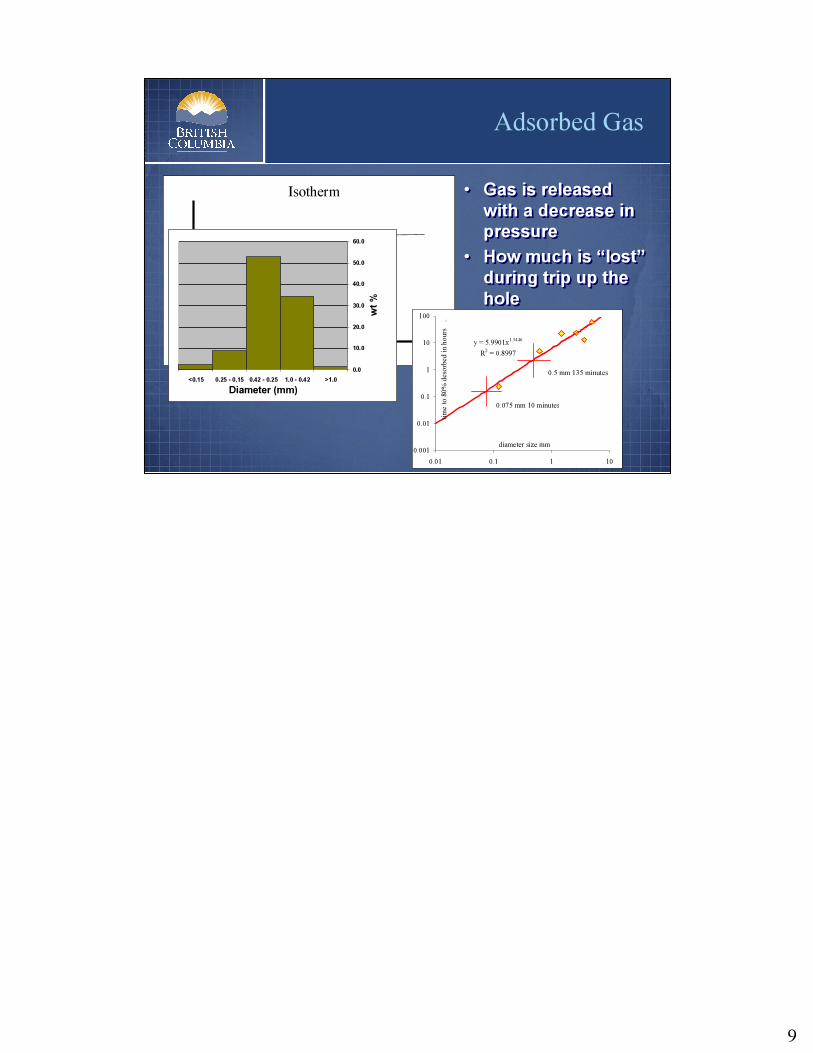
Adsorbed Gas
Pressure (depth)
Gas V
olume
Isotherm
0.0
10.0
20.0
30.0
40.0
50.0
60.0
>1.01.0 - 0.420.42 - 0.250.25 - 0.15<0.15Diameter (mm)
wt %
y = 5.9901x1.3446
R2 = 0.8997
0.001
0.01
0.1
1
10
100
0.01 0.1 1 10diameter size mm
time t
o 80%
desor
bed i
n hou
rs ..
0.5 mm 135 minutes
0.075 mm 10 minutes
� Gas is released with a decrease in pressure
� How much is �lost�during trip up the hole
� Gas is released with a decrease in pressure
� How much is �lost�during trip up the hole
10
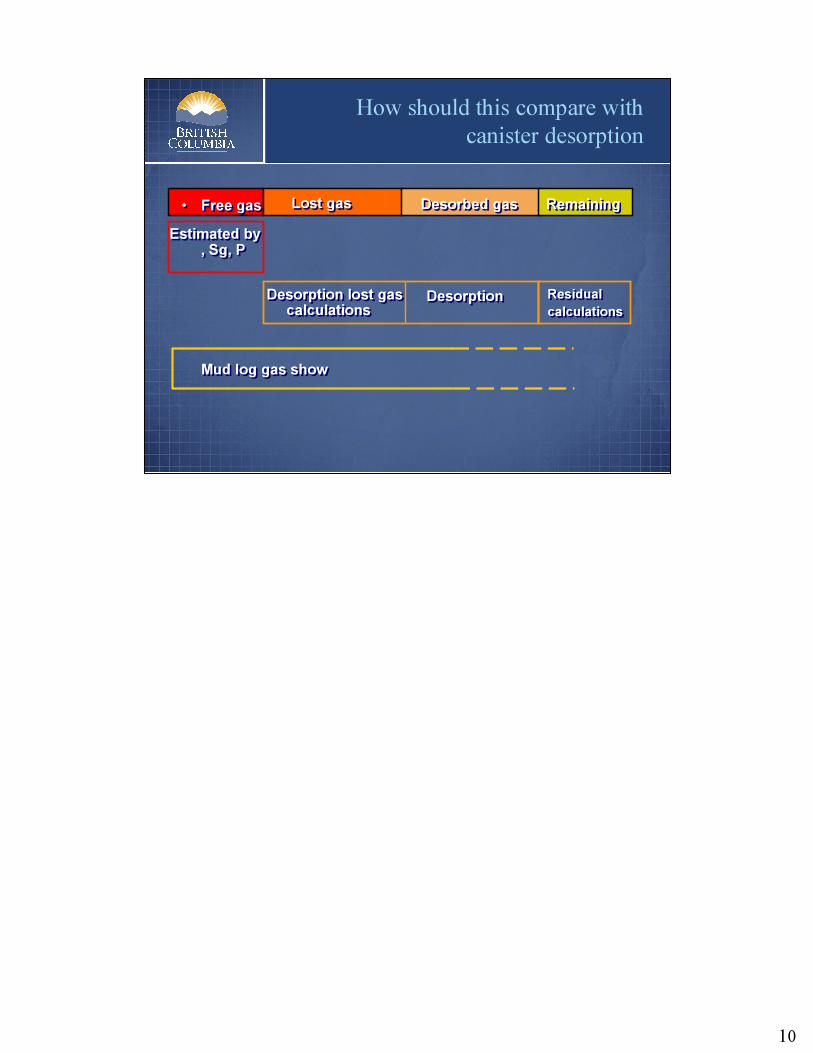
How should this compare with canister desorption
� Free gas� Free gas Lost gasLost gas Desorbed gasDesorbed gas RemainingRemaining
Desorption lost gas calculations
Desorption lost gas calculations Desorption Desorption
Estimated by , Sg, P
Estimated by , Sg, P
Mud log gas showMud log gas show
ResidualcalculationsResidualcalculations
11
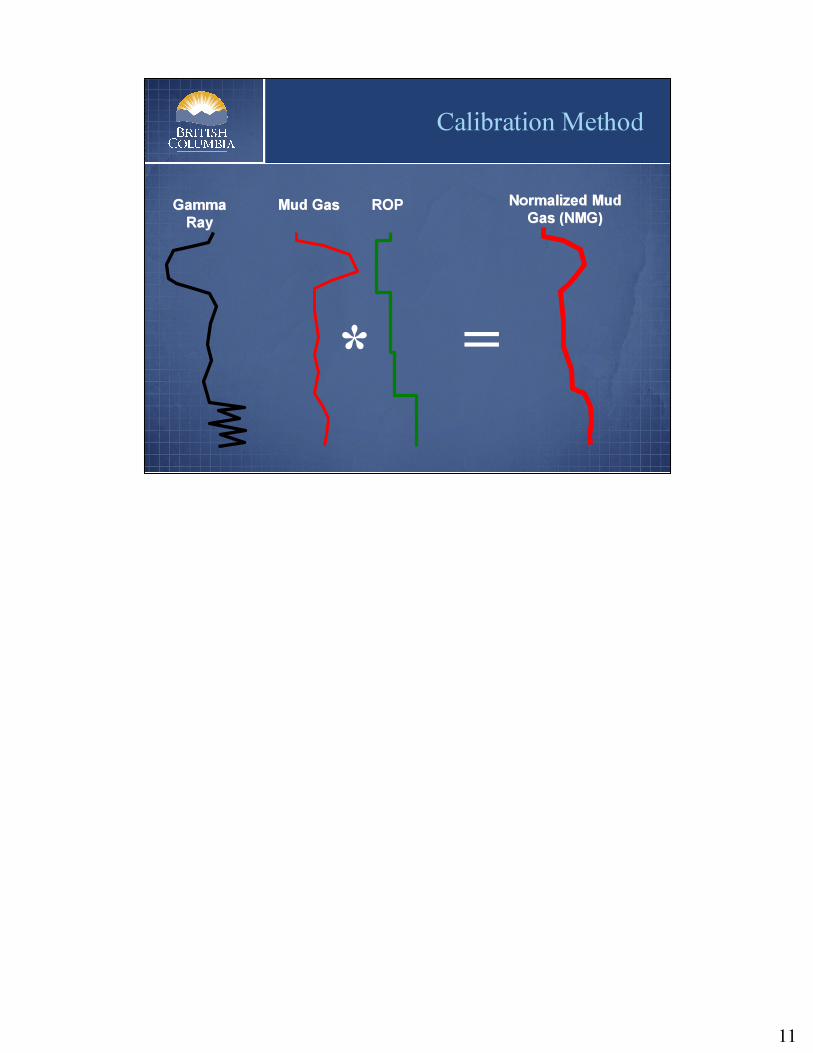
* =
Calibration Method
Mud GasMud Gas ROPROP Normalized Mud Normalized Mud Gas (NMG)Gas (NMG)Gamma Gamma
RayRay
12
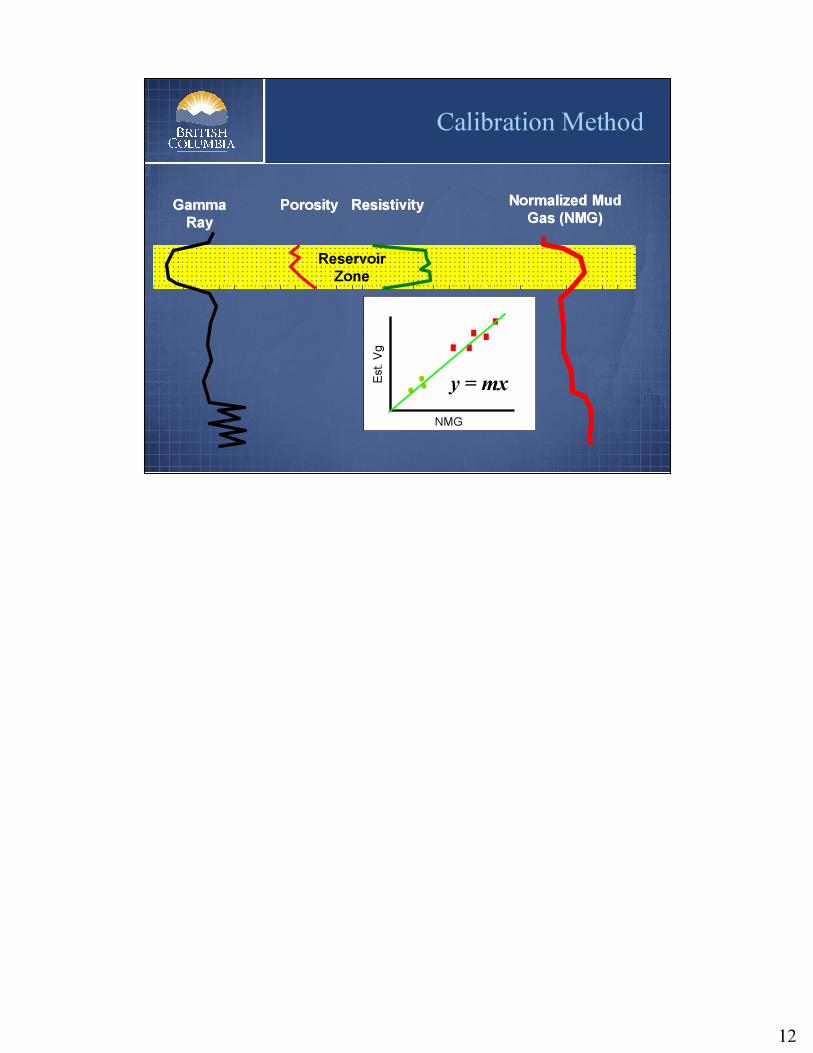
Calibration Method
PorosityPorosity ResistivityResistivity Normalized Mud Normalized Mud Gas (NMG)Gas (NMG)
Reservoir Zone
NMG
Est. V
gy = mx
Gamma Gamma RayRay
13
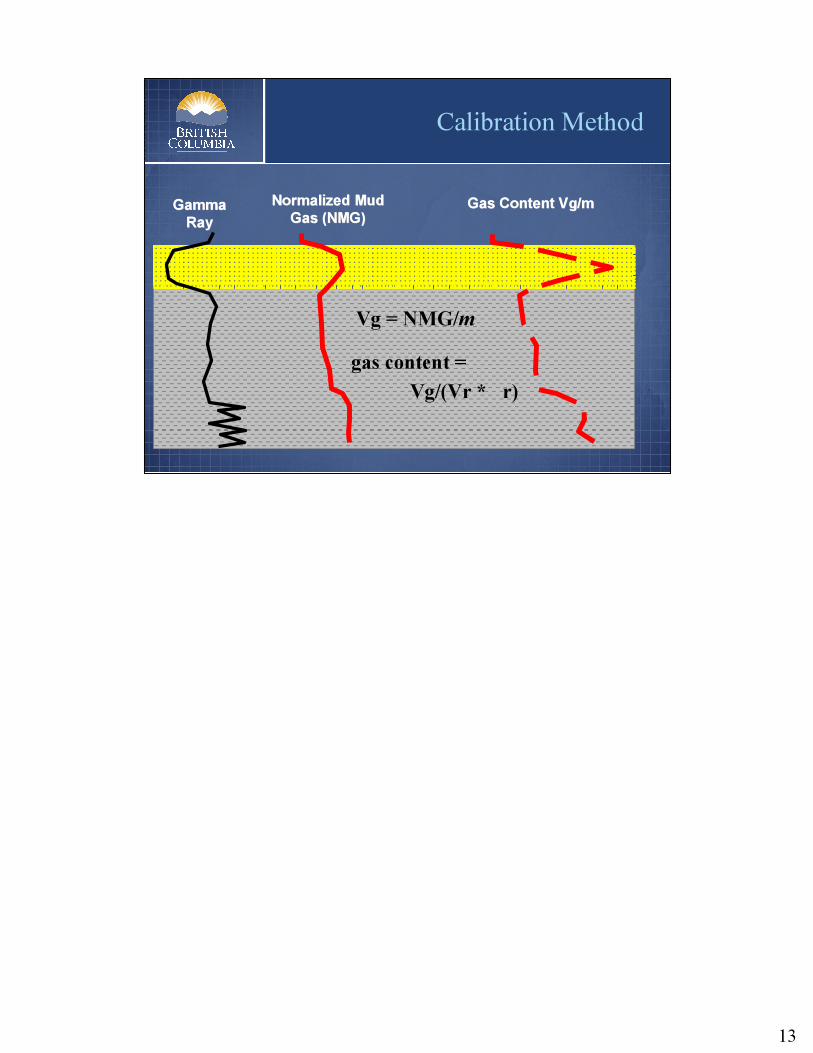
Calibration Method
Gamma Gamma RayRay
Normalized Mud Normalized Mud Gas (NMG)Gas (NMG)
gas content =Vg/(Vr * r)
Vg = NMG/m
Gas Content Vg/mGas Content Vg/m
14
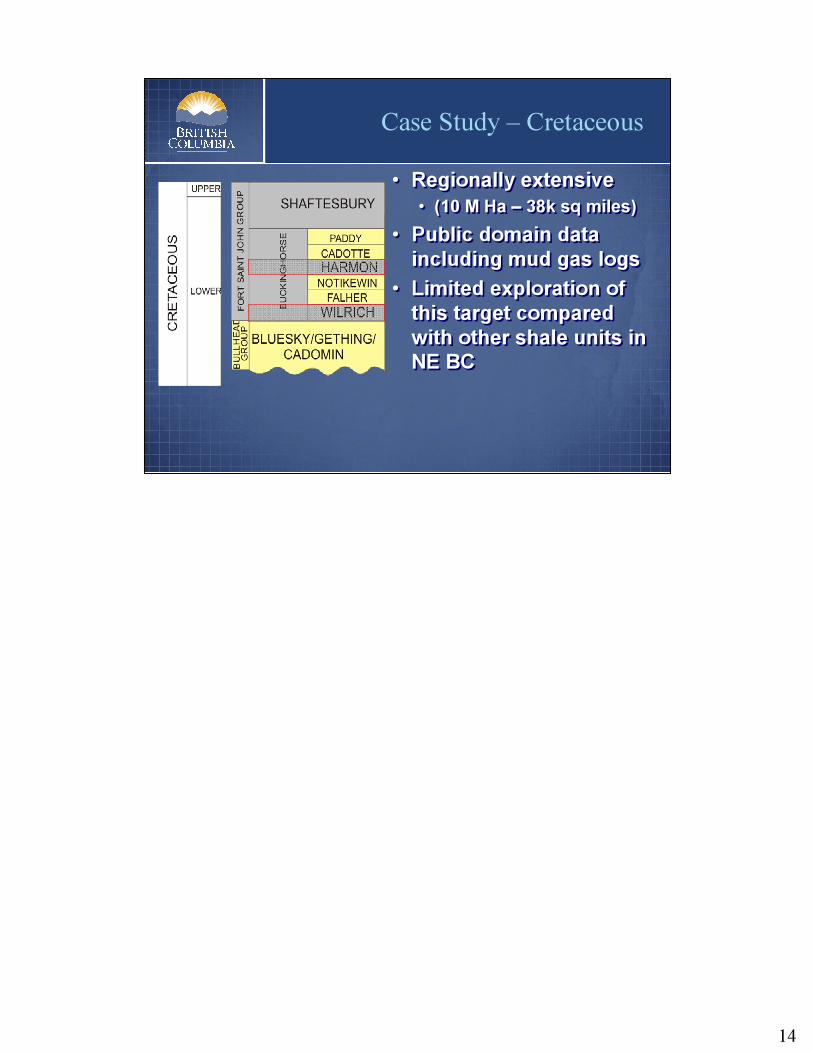
� Regionally extensive� (10 M Ha � 38k sq miles)
� Public domain data including mud gas logs
� Limited exploration of this target compared with other shale units in NE BC
� Regionally extensive� (10 M Ha � 38k sq miles)
� Public domain data including mud gas logs
� Limited exploration of this target compared with other shale units in NE BC
Case Study � Cretaceous
15
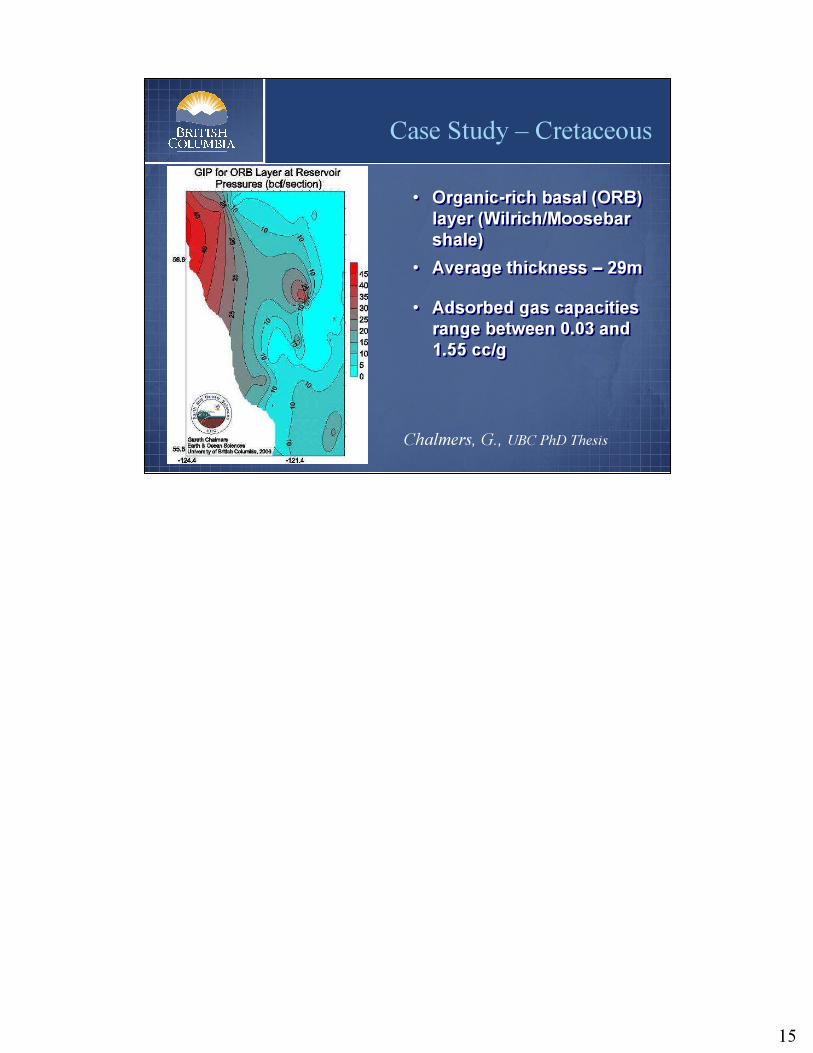
� Organic-rich basal (ORB) layer (Wilrich/Moosebarshale)
� Average thickness � 29m � Adsorbed gas capacities
range between 0.03 and 1.55 cc/g
� Organic-rich basal (ORB) layer (Wilrich/Moosebarshale)
� Average thickness � 29m � Adsorbed gas capacities
range between 0.03 and 1.55 cc/g
Chalmers, G., UBC PhD Thesis
Case Study � Cretaceous
16
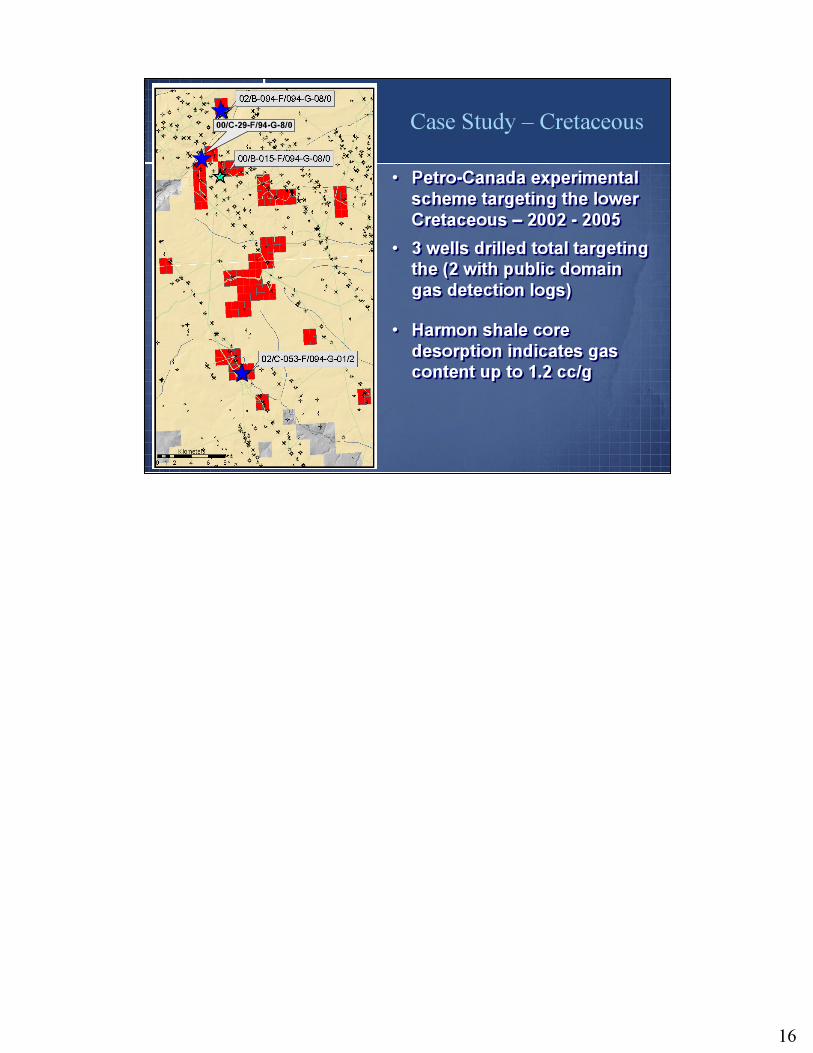
� Petro-Canada experimental scheme targeting the lower Cretaceous � 2002 - 2005
� 3 wells drilled total targeting the (2 with public domain gas detection logs)
� Harmon shale core desorption indicates gas content up to 1.2 cc/g
� Petro-Canada experimental scheme targeting the lower Cretaceous � 2002 - 2005
� 3 wells drilled total targeting the (2 with public domain gas detection logs)
� Harmon shale core desorption indicates gas content up to 1.2 cc/g
Case Study � Cretaceous 00/C-29-F/94-G-8/0
17
0100020003000400050006000700080009000
10000400600
8001000
12001400
Depth
Gas (units)
1 10 100
ROP (min/m)
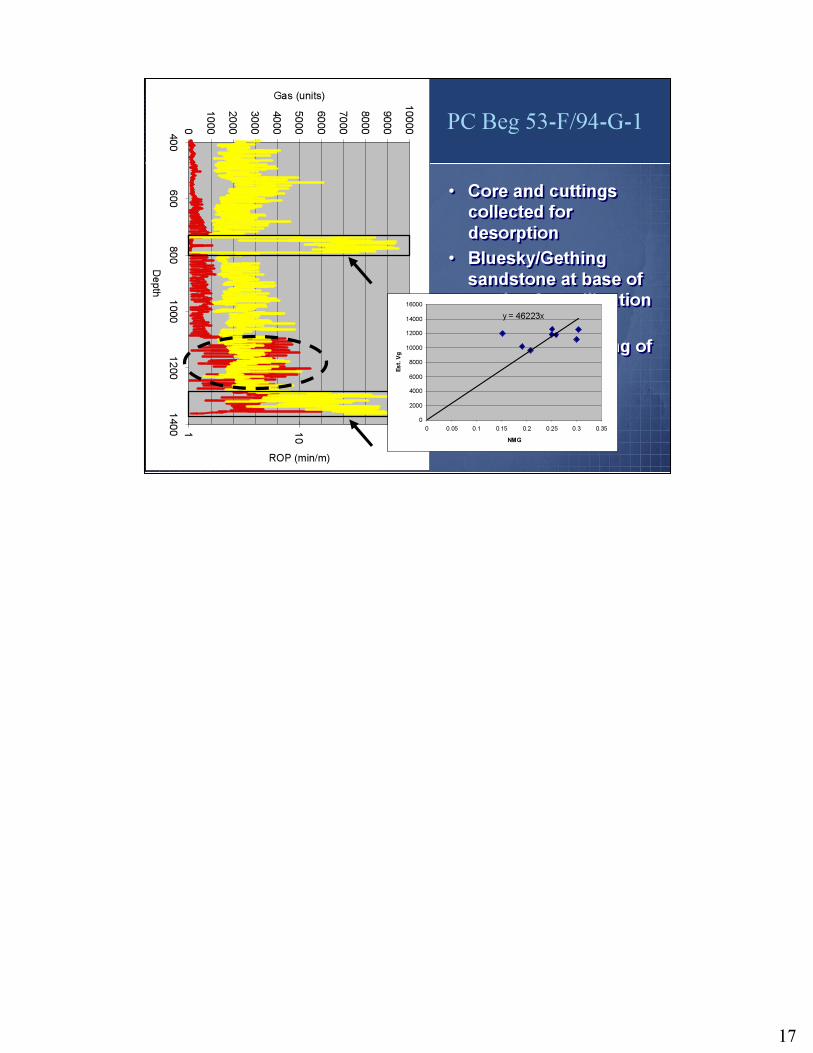
� Core and cuttings collected for desorption
� Bluesky/Gethingsandstone at base of section for calibration
� Errors in digitizing/recording of mud gas log??
� Core and cuttings collected for desorption
� Bluesky/Gethingsandstone at base of section for calibration
� Errors in digitizing/recording of mud gas log??
y = 46223x
02000
40006000
800010000
1200014000
16000
0 0.05 0.1 0.15 0.2 0.25 0.3 0.35NMG
Est. V
g
PC Beg 53-F/94-G-1
18
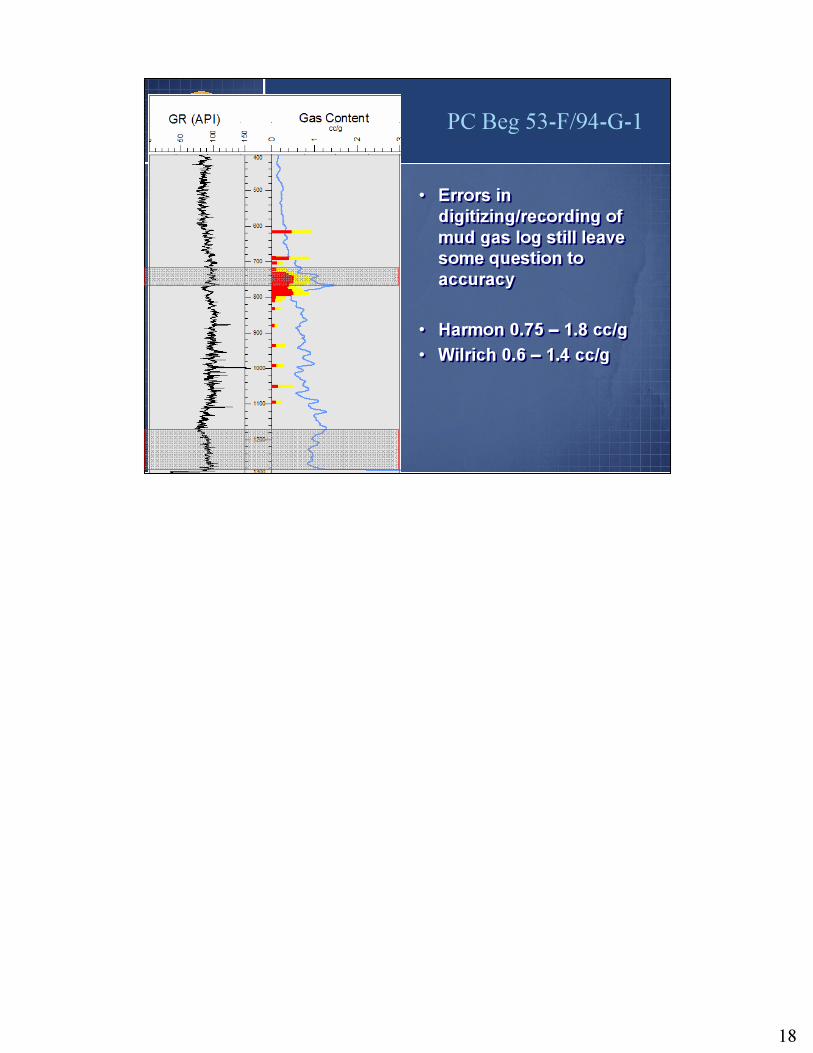
PC Beg 53-F/94-G-1
� Errors in digitizing/recording of mud gas log still leave some question to accuracy
� Harmon 0.75 � 1.8 cc/g� Wilrich 0.6 � 1.4 cc/g
� Errors in digitizing/recording of mud gas log still leave some question to accuracy
� Harmon 0.75 � 1.8 cc/g� Wilrich 0.6 � 1.4 cc/g
19
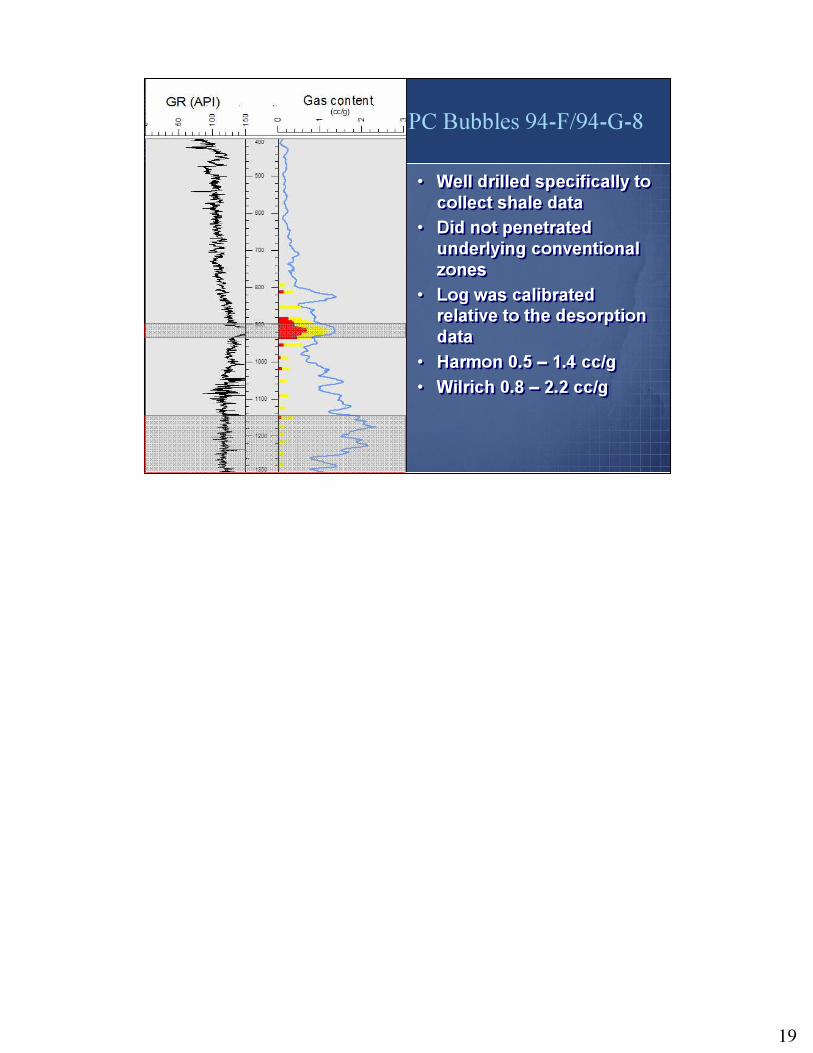
PC Bubbles 94-F/94-G-8
� Well drilled specifically to collect shale data
� Did not penetrated underlying conventional zones
� Log was calibrated relative to the desorption data
� Harmon 0.5 � 1.4 cc/g� Wilrich 0.8 � 2.2 cc/g
� Well drilled specifically to collect shale data
� Did not penetrated underlying conventional zones
� Log was calibrated relative to the desorption data
� Harmon 0.5 � 1.4 cc/g� Wilrich 0.8 � 2.2 cc/g
20
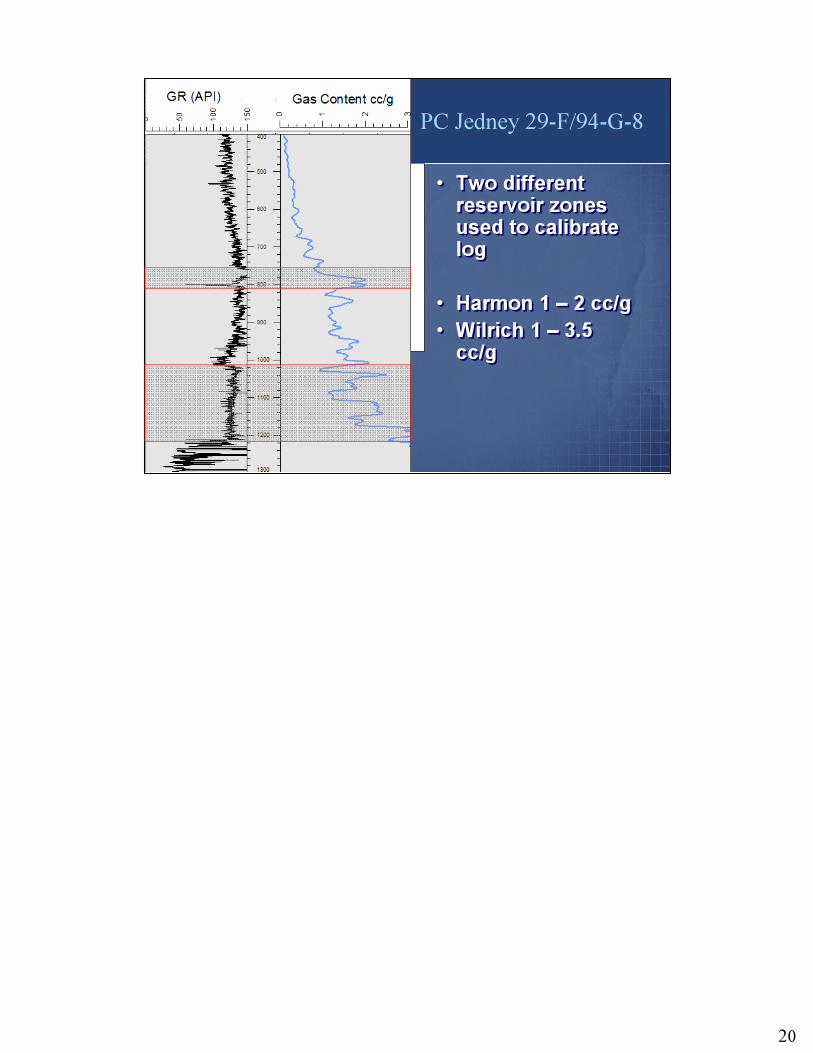
PC Jedney 29-F/94-G-8
� Two different reservoir zones used to calibrate log
� Harmon 1 � 2 cc/g� Wilrich 1 � 3.5
cc/g
� Two different reservoir zones used to calibrate log
� Harmon 1 � 2 cc/g� Wilrich 1 � 3.5
cc/g
y = 142793x
y = 120603x
0
5000
10000
15000
20000
0 0.02 0.04 0.06 0.08 0.1 0.12 0.14NMG
Est. V
g
Halfway Zone Calibration
Cretaceous zone
21
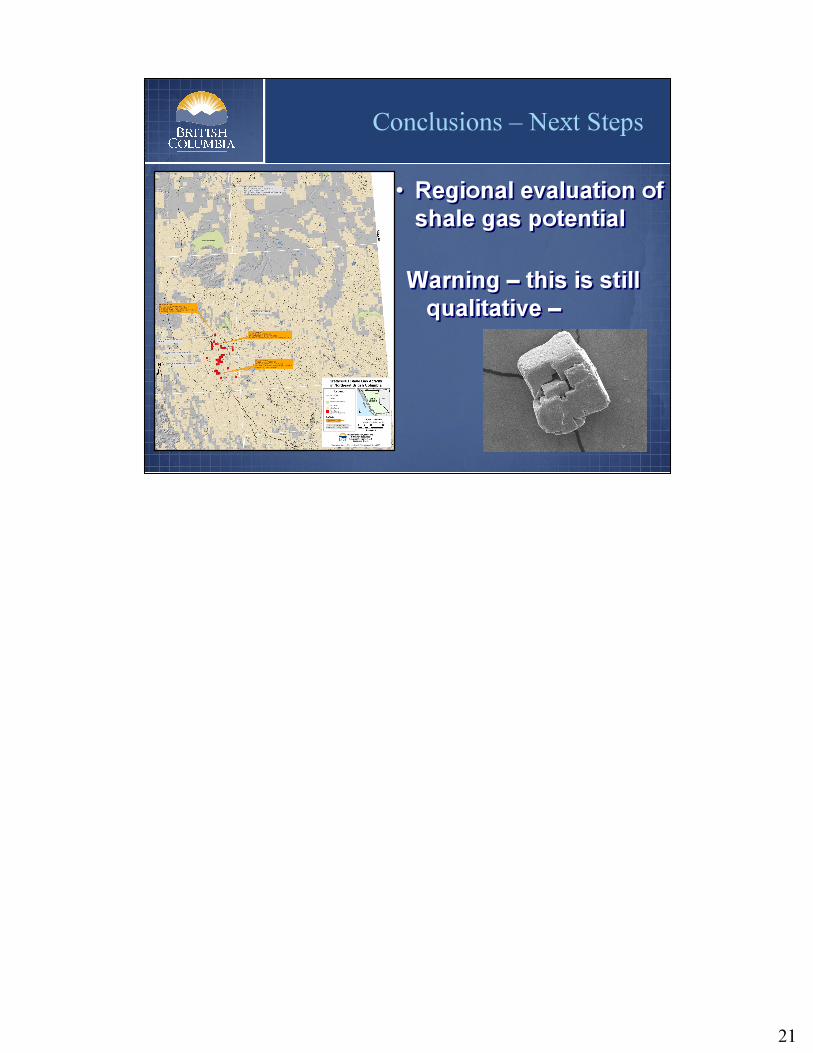
Conclusions � Next Steps
� Regional evaluation of shale gas potential
� Regional evaluation of shale gas potential
Warning � this is still qualitative �
Warning � this is still qualitative �
22
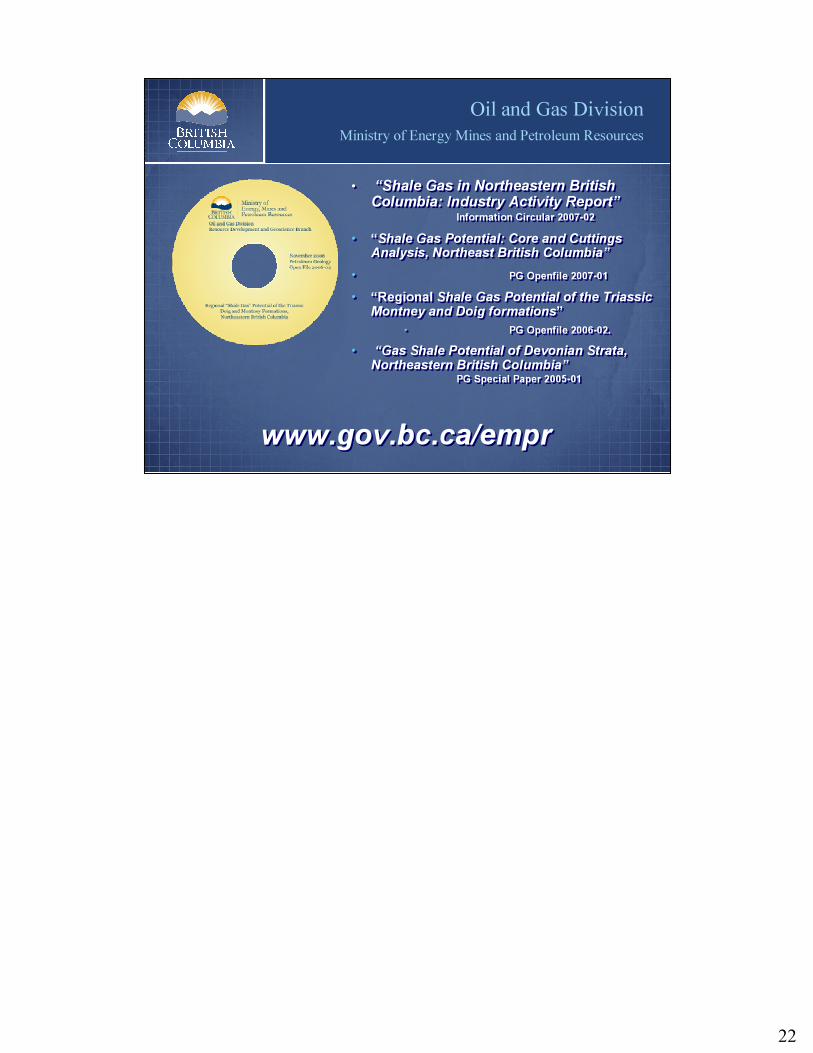
Oil and Gas Division Ministry of Energy Mines and Petroleum Resources
� �Shale Gas in Northeastern British Columbia: Industry Activity Report�
Information Circular 2007-02� �Shale Gas Potential: Core and Cuttings
Analysis, Northeast British Columbia�� PG Openfile 2007-01� �Regional Shale Gas Potential of the Triassic
Montney and Doig formations�� PG Openfile 2006-02.
� �Gas Shale Potential of Devonian Strata, Northeastern British Columbia�
PG Special Paper 2005-01
www.gov.bc.ca/emprwww.gov.bc.ca/empr