Embed Size (px)
Citation preview

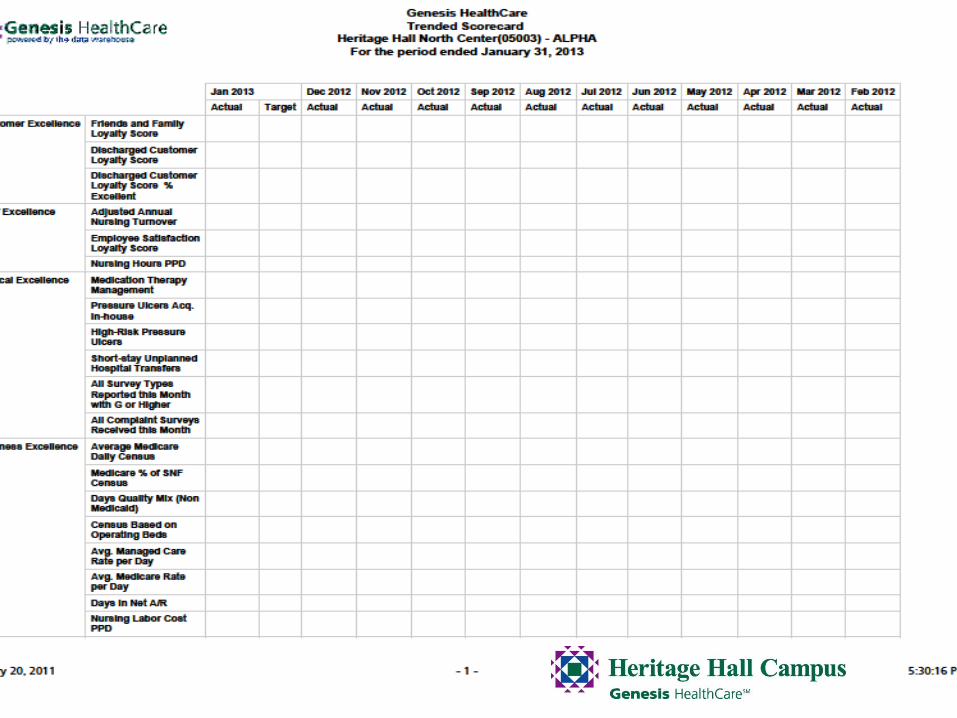
Mining the Data
Ira M. Schoenberger, FACHCASenior Administrator2011 AHCA/NCAL Quality Symposium Friday February 18, 2011
AgendaUnderstand the concept of Data Mining
• Discuss how information can be converted into knowledge about historical patterns and future trends• Learn how the process can be used to increase quality in your organization
..
Data Mining Is
• A hot buzzword for a class of techniques that find patterns in data
• A user-centric, interactive process which leverages analysis technologies and computing power
• A group of techniques that find relationships that have not previously been discovered
• Not reliant on an existing database• A relatively easy task that requires
knowledge of the business problem/subject matter expertise
Data mining is not• Brute-force crunching of bulk
data • “Blind” application of algorithms• Going to find relationships where
none exist• Presenting data in different ways• A database intensive task• A difficult to understand
technology requiring an advanced degree in computer science
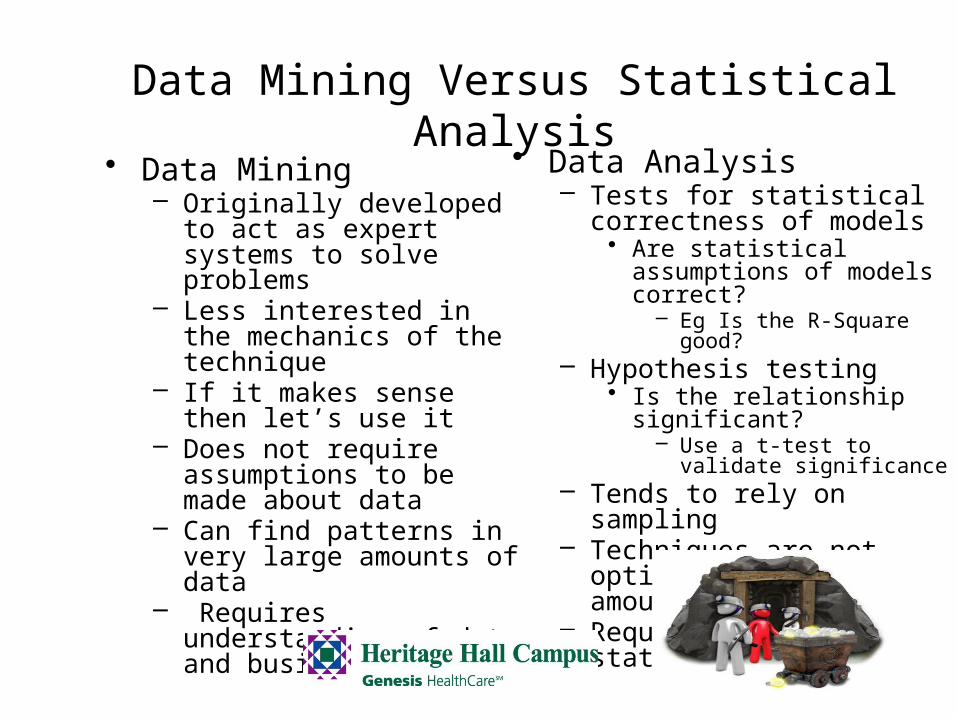
Data Mining Versus Statistical Analysis
• Data Analysis– Tests for statistical
correctness of models• Are statistical assumptions of
models correct?– Eg Is the R-Square good?
– Hypothesis testing• Is the relationship significant?
– Use a t-test to validate significance
– Tends to rely on sampling– Techniques are not optimised
for large amounts of data– Requires strong statistical
skills
• Data Mining– Originally developed to act
as expert systems to solve problems
– Less interested in the mechanics of the technique
– If it makes sense then let’s use it
– Does not require assumptions to be made about data
– Can find patterns in very large amounts of data
– Requires understanding of data and business problem
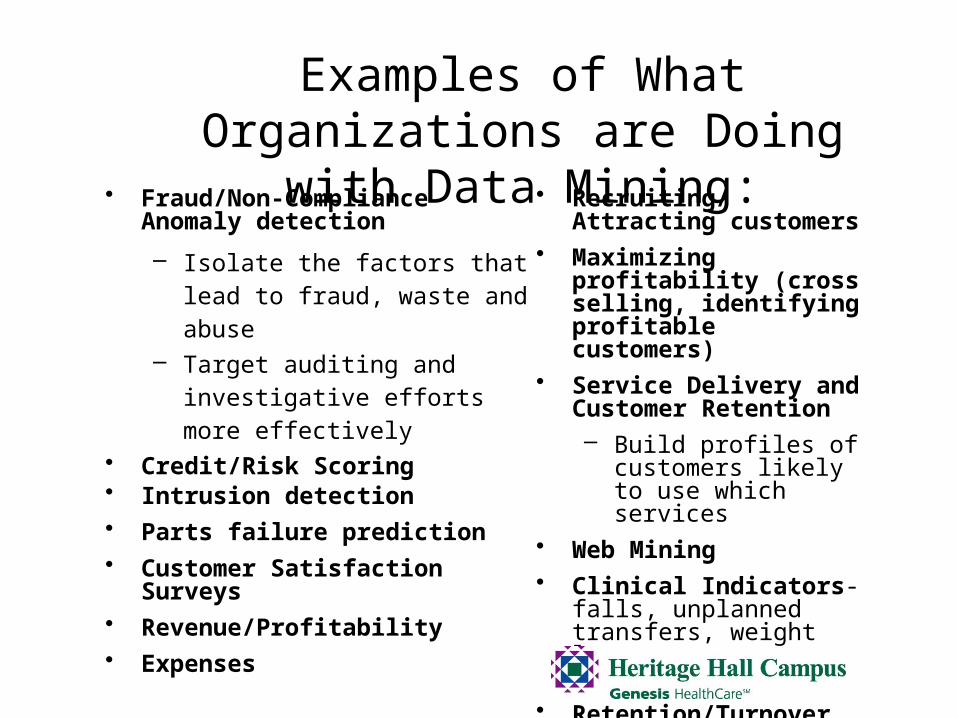
Examples of What Organizations are Doing with Data Mining:
• Fraud/Non-Compliance Anomaly detection
– Isolate the factors that lead to fraud, waste and abuse
– Target auditing and investigative efforts more effectively
• Credit/Risk Scoring• Intrusion detection • Parts failure prediction • Customer Satisfaction Surveys• Revenue/Profitability• Expenses
• Recruiting/Attracting customers
• Maximizing profitability (cross selling, identifying profitable customers)
• Service Delivery and Customer Retention – Build profiles of
customers likely to use which services
• Web Mining• Clinical Indicators-falls,
unplanned transfers, weight loss, pressure ulcers etc.
• Retention/Turnover
What data mining has done for...
HSBC need to cross-sell more
effectively by identifying profiles
that would be interested in higher
yielding investments and...• Reduced direct mail costs by 30% while garnering 95% of the campaign’s revenue.
What data mining has done for...
analyzed suspects’ cell phone usage to focus investigations.
The US Drug Enforcement Agency needed to be more effective in their drug “busts” and

What data mining has done for…
Scheduled its workforce to provide faster, more accurate
answers to questions.
The US Internal Revenue Service needed to improve customer service and...
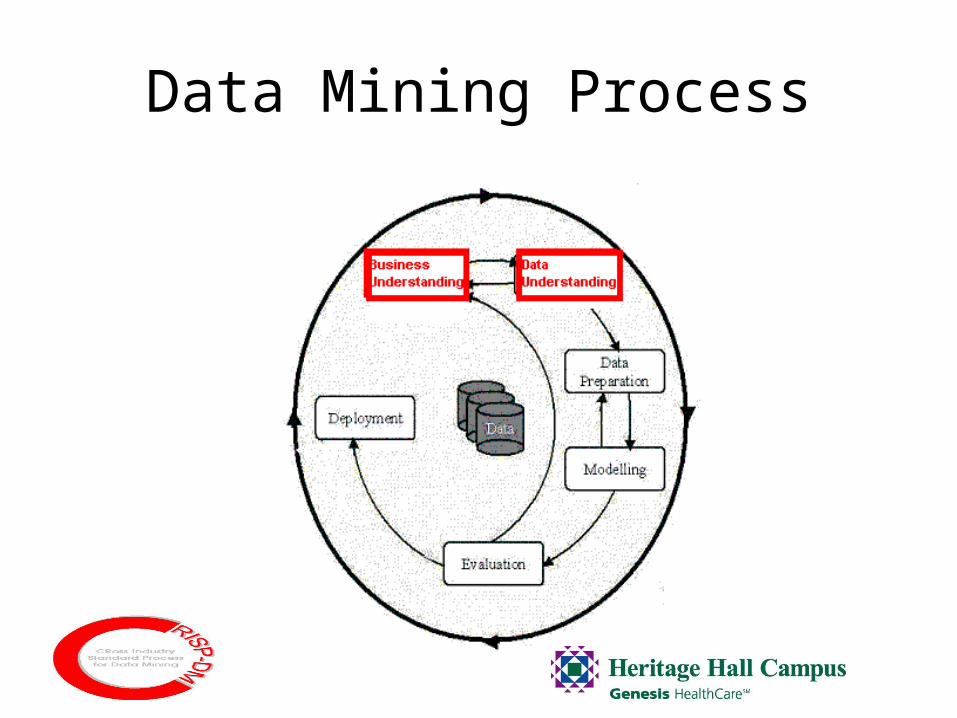
Data Mining Process
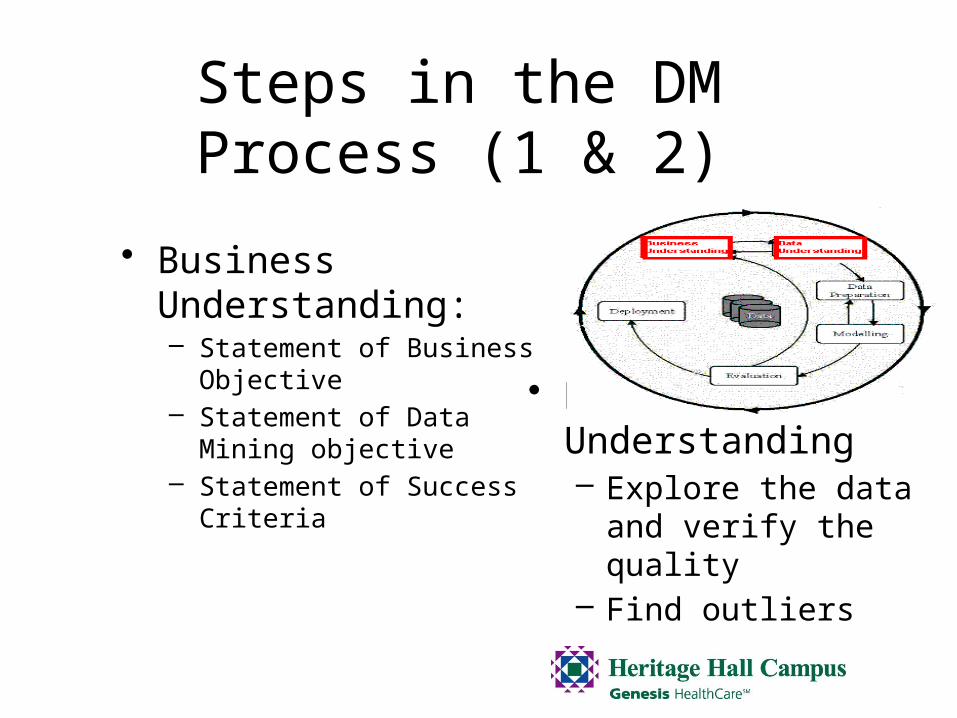
Steps in the DM Process (1 & 2)
• Business Understanding:– Statement of Business
Objective– Statement of Data Mining
objective– Statement of Success
Criteria
• Data Understanding– Explore the data and
verify the quality– Find outliers
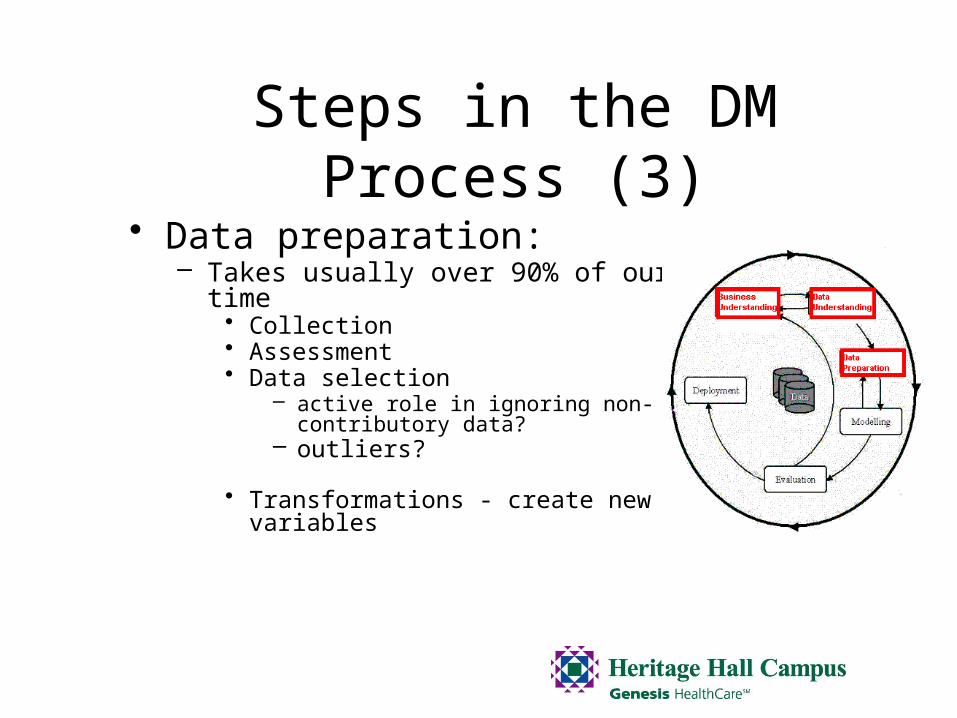
Steps in the DM Process (3)
• Data preparation:– Takes usually over 90% of our time
• Collection• Assessment• Data selection
– active role in ignoring non-contributory data?– outliers?
• Transformations - create new variables
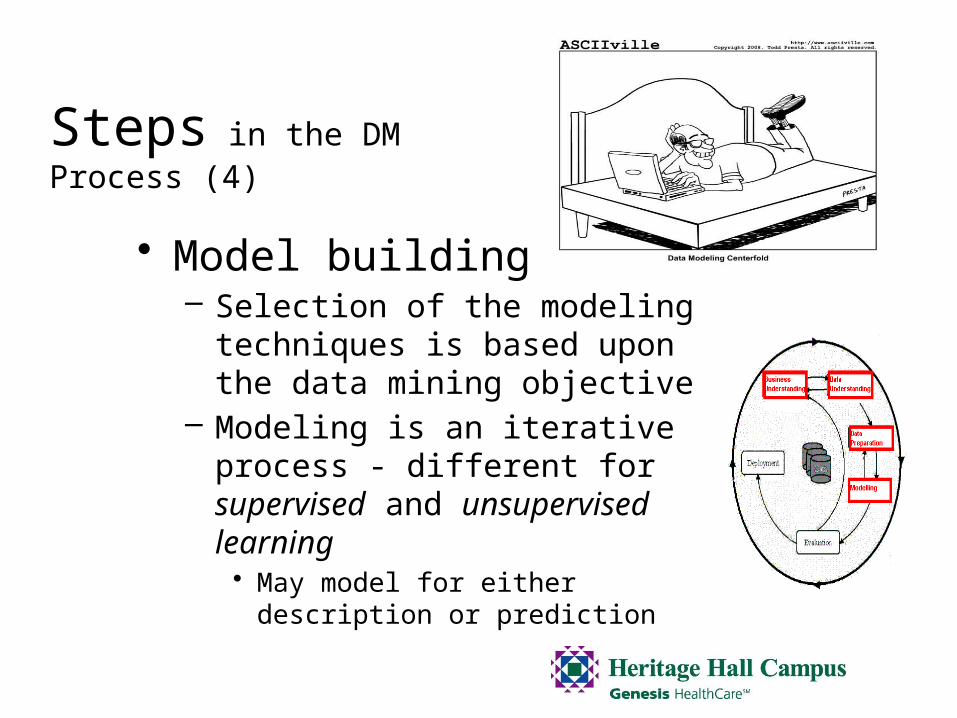
Steps in the DM Process (4)
• Model building– Selection of the modeling
techniques is based upon the data mining objective
– Modeling is an iterative process - different for supervised and unsupervised learning• May model for either description or
prediction
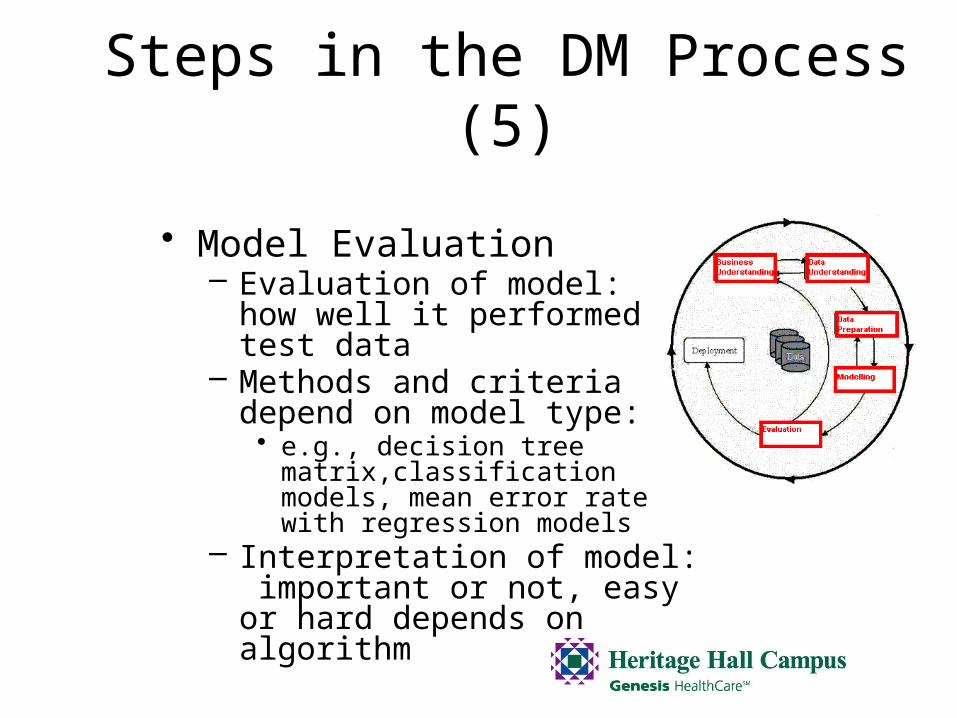
Steps in the DM Process (5)
• Model Evaluation– Evaluation of model: how well it
performed on test data– Methods and criteria depend on
model type:• e.g., decision tree matrix,classification
models, mean error rate with regression models
– Interpretation of model: important or not, easy or hard depends on algorithm
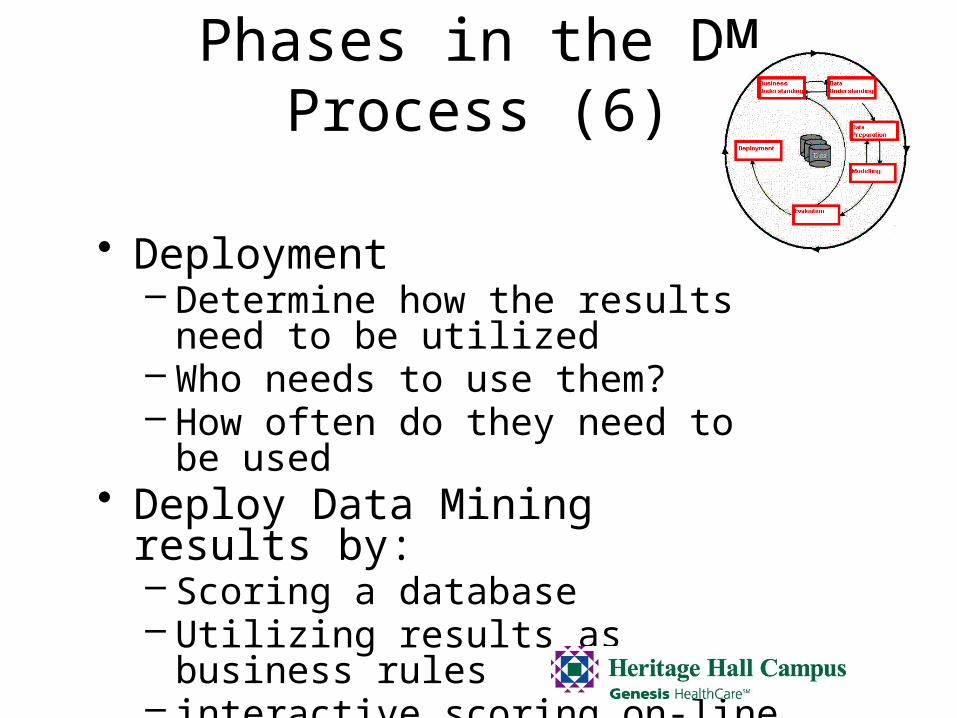
Phases in the DM Process (6)
• Deployment– Determine how the results need to
be utilized– Who needs to use them?– How often do they need to be used
• Deploy Data Mining results by:– Scoring a database– Utilizing results as business rules– interactive scoring on-line
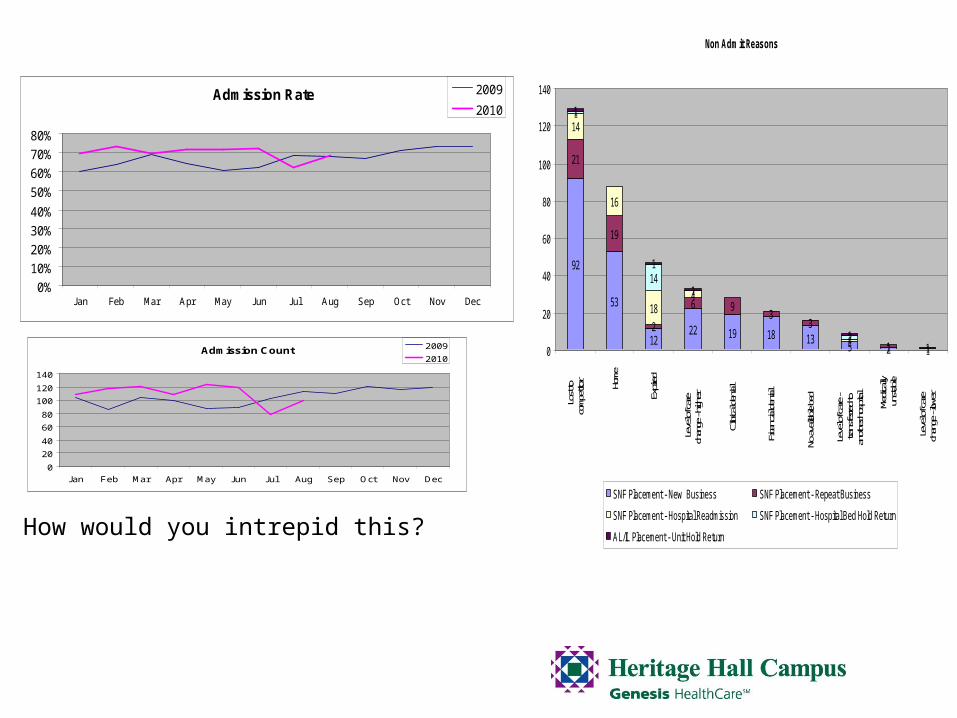
Admission Rate
0%
10%
20%
30%
40%
50%
60%
70%
80%
Jan Feb Mar Apr May Jun Jul Aug Sep Oct Nov Dec
2009
2010
Admission Count
0
20
40
60
80
100
120
140
Jan Feb Mar Apr May Jun Jul Aug Sep Oct Nov Dec
2009
2010
Non Admit Reasons
92
53
1222 19 18 13
5 2 1
21
19
2
6 93
3
1 1
14
16
184
1
1
14
2
1
1
1
10
20
40
60
80
100
120
140
Lost
toco
mpeti
tor Home
Expir
ed
Leve
l of c
arech
ange
- high
er
Clinic
al de
nial
Finan
cial d
enial
No av
ailable
bed
Leve
l of c
are -
trans
ferred
toan
other
hosp
ital
Medic
allyun
stable
Leve
l of c
arech
ange
- low
er
SNF Placement - New Business SNF Placement - Repeat Business
SNF Placement - Hospital Readmission SNF Placement - Hospital Bed Hold Return
AL/IL Placement - Unit Hold ReturnHow would you intrepid this?
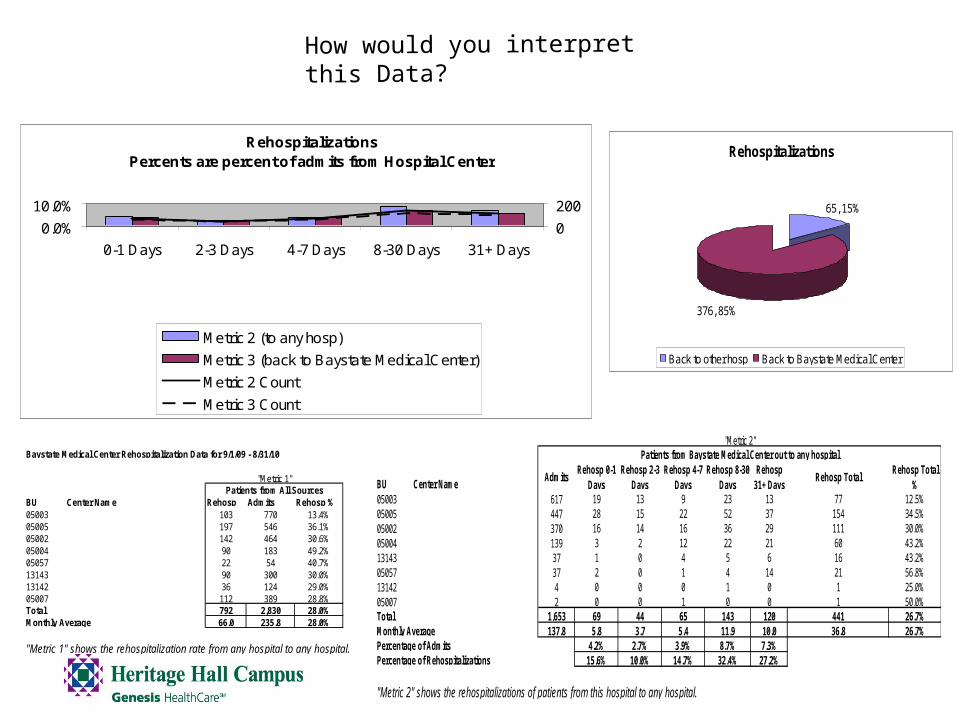
RehospitalizationsPercents are percent of admits from Hospital Center
0.0%
10.0%
0-1 Days 2-3 Days 4-7 Days 8-30 Days 31+ Days
0
200
Metric 2 (to any hosp)
Metric 3 (back to Baystate Medical Center)
Metric 2 Count
Metric 3 Count
Rehospitalizations
65, 15%
376, 85%
Back to other hosp Back to Baystate Medical Center
Baystate Medical Center Rehospitalization Data for 9/1/09 - 8/31/10
BU Center Name Rehosp Admits Rehosp %05003 103 770 13.4%05005 197 546 36.1%05002 142 464 30.6%05004 90 183 49.2%05057 22 54 40.7%13143 90 300 30.0%13142 36 124 29.0%05007 112 389 28.8%Total 792 2,830 28.0%Monthly Average 66.0 235.8 28.0%
"Metric 1" shows the rehospitalization rate from any hospital to any hospital.
Patients from All Sources"Metric 1" BU Center Name
AdmitsRehosp 0-1
DaysRehosp 2-3
DaysRehosp 4-7
DaysRehosp 8-30
DaysRehosp
31+ DaysRehosp Total
Rehosp Total %
05003 617 19 13 9 23 13 77 12.5%05005 447 28 15 22 52 37 154 34.5%05002 370 16 14 16 36 29 111 30.0%05004 139 3 2 12 22 21 60 43.2%13143 37 1 0 4 5 6 16 43.2%05057 37 2 0 1 4 14 21 56.8%13142 4 0 0 0 1 0 1 25.0%05007 2 0 0 1 0 0 1 50.0%Total 1,653 69 44 65 143 120 441 26.7%Monthly Average 137.8 5.8 3.7 5.4 11.9 10.0 36.8 26.7%Percentage of Admits 4.2% 2.7% 3.9% 8.7% 7.3%Percentage of Rehospitalizations 15.6% 10.0% 14.7% 32.4% 27.2%
"Metric 2" shows the rehospitalizations of patients from this hospital to any hospital.
Patients from Baystate Medical Center out to any hospital"Metric 2"
How would you interpret this Data?
BU Center Name AdmitsRehosp 0-1
DaysRehosp 2-3
DaysRehosp 4-7
DaysRehosp 8-30
DaysRehosp
31+ Days Rehosp Total% of Rehosps Back to same
% of Admits Back to same
% of Rehosps
Back to same in 30 Days
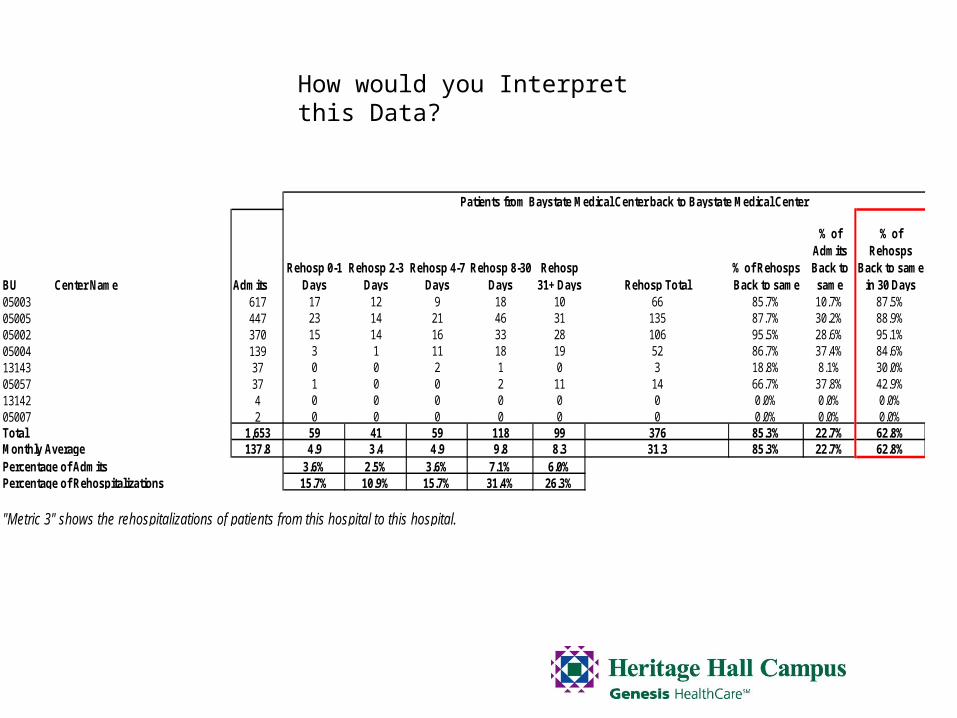
05003 617 17 12 9 18 10 66 85.7% 10.7% 87.5%05005 447 23 14 21 46 31 135 87.7% 30.2% 88.9%05002 370 15 14 16 33 28 106 95.5% 28.6% 95.1%05004 139 3 1 11 18 19 52 86.7% 37.4% 84.6%13143 37 0 0 2 1 0 3 18.8% 8.1% 30.0%05057 37 1 0 0 2 11 14 66.7% 37.8% 42.9%13142 4 0 0 0 0 0 0 0.0% 0.0% 0.0%05007 2 0 0 0 0 0 0 0.0% 0.0% 0.0%Total 1,653 59 41 59 118 99 376 85.3% 22.7% 62.8%Monthly Average 137.8 4.9 3.4 4.9 9.8 8.3 31.3 85.3% 22.7% 62.8%Percentage of Admits 3.6% 2.5% 3.6% 7.1% 6.0%Percentage of Rehospitalizations 15.7% 10.9% 15.7% 31.4% 26.3%
"Metric 3" shows the rehospitalizations of patients from this hospital to this hospital.
Patients from Baystate Medical Center back to Baystate Medical Center
How would you Interpret this Data?
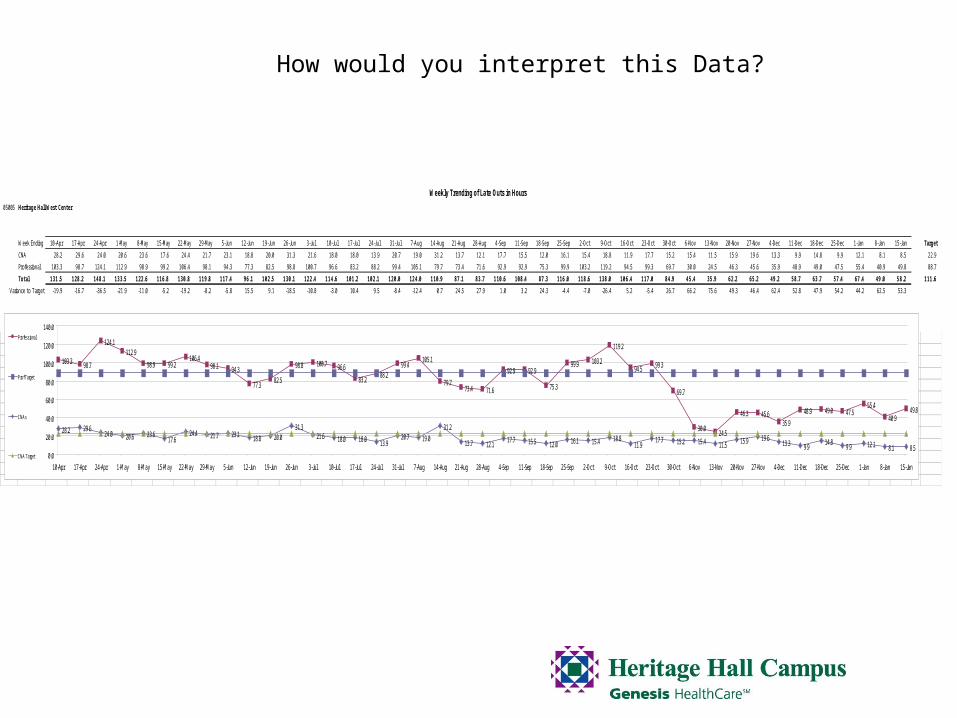
05005 Heritage Hall West Center
22.9 22.9 22.9 22.9 22.9 22.9 22.9 22.9 22.9 22.9 22.9 22.9 22.9 22.9 22.9 22.9 22.9 22.9 22.9 22.9 22.9 22.9 22.9 22.9 22.9 22.9 22.9 22.9 22.9 22.9 22.9 22.9 22.9 22.9 22.9 22.9 22.9 22.9 22.9 22.9 22.9
88.7 88.7 88.7 88.7 88.7 88.7 88.7 88.7 88.7 88.7 88.7 88.7 88.7 88.7 88.7 88.7 88.7 88.7 88.7 88.7 88.7 88.7 88.7 88.7 88.7 88.7 88.7 88.7 88.7 88.7 88.7 88.7 88.7 88.7 88.7 88.7 88.7 88.7 88.7 88.7 88.7
Week Ending 10-Apr 17-Apr 24-Apr 1-May 8-May 15-May 22-May 29-May 5-Jun 12-Jun 19-Jun 26-Jun 3-Jul 10-Jul 17-Jul 24-Jul 31-Jul 7-Aug 14-Aug 21-Aug 28-Aug 4-Sep 11-Sep 18-Sep 25-Sep 2-Oct 9-Oct 16-Oct 23-Oct 30-Oct 6-Nov 13-Nov 20-Nov 27-Nov 4-Dec 11-Dec 18-Dec 25-Dec 1-Jan 8-Jan 15-Jan Target
CNA 28.2 29.6 24.0 20.6 23.6 17.6 24.4 21.7 23.1 18.8 20.0 31.3 21.6 18.0 18.0 13.9 20.7 19.0 31.2 13.7 12.1 17.7 15.5 12.0 16.1 15.4 18.8 11.9 17.7 15.2 15.4 11.5 15.9 19.6 13.3 9.9 14.8 9.9 12.1 8.1 8.5 22.9
Professional 103.3 98.7 124.1 112.9 98.9 99.2 106.4 98.1 94.3 77.3 82.5 98.8 100.7 96.6 83.2 88.2 99.4 105.1 79.7 73.4 71.6 92.9 92.9 75.3 99.9 103.2 119.2 94.5 99.3 69.7 30.0 24.5 46.3 45.6 35.9 48.9 49.0 47.5 55.4 40.9 49.8 88.7
Total 131.5 128.2 148.1 133.5 122.6 116.8 130.8 119.8 117.4 96.1 102.5 130.1 122.4 114.6 101.2 102.1 120.0 124.0 110.9 87.1 83.7 110.6 108.4 87.3 116.0 118.6 138.0 106.4 117.0 84.9 45.4 35.9 62.2 65.2 49.2 58.7 63.7 57.4 67.4 49.0 58.2 111.6
Variance to Target -19.9 -16.7 -36.5 -21.9 -11.0 -5.2 -19.2 -8.2 -5.8 15.5 9.1 -18.5 -10.8 -3.0 10.4 9.5 -8.4 -12.4 0.7 24.5 27.9 1.0 3.2 24.3 -4.4 -7.0 -26.4 5.2 -5.4 26.7 66.2 75.6 49.3 46.4 62.4 52.8 47.9 54.2 44.2 62.5 53.3
Weekly Trending of Late Outs in Hours
103.3 98.7
124.1112.9
98.9 99.2106.4
98.1 94.3
77.382.5
98.8 100.7 96.6
83.288.2
99.4105.1
79.773.4 71.6
92.9 92.9
75.3
99.9 103.2
119.2
94.5 99.3
69.7
30.024.5
46.3 45.635.9
48.9 49.0 47.555.4
40.949.8
28.2 29.624.0 20.6 23.6
17.624.4 21.7 23.1 18.8 20.0
31.321.6 18.0 18.0 13.9
20.7 19.031.2
13.7 12.117.7 15.5 12.0 16.1 15.4 18.8
11.917.7 15.2 15.4 11.5 15.9 19.6
13.3 9.914.8
9.9 12.1 8.1 8.50.0
20.0
40.0
60.0
80.0
100.0
120.0
140.0
10-Apr 17-Apr 24-Apr 1-May 8-May 15-May 22-May 29-May 5-Jun 12-Jun 19-Jun 26-Jun 3-Jul 10-Jul 17-Jul 24-Jul 31-Jul 7-Aug 14-Aug 21-Aug 28-Aug 4-Sep 11-Sep 18-Sep 25-Sep 2-Oct 9-Oct 16-Oct 23-Oct 30-Oct 6-Nov 13-Nov 20-Nov 27-Nov 4-Dec 11-Dec 18-Dec 25-Dec 1-Jan 8-Jan 15-Jan
Professional
Prof Target
CNAs
CNA Target
How would you interpret this Data?
Final Comments• Data Mining can be utilized in any healthcare
organization that needs to find patterns or relationships in their data.
• By using Data Mining you can have a reasonable level of assurance that your efforts will render useful, repeatable, and valid results.