Embed Size (px)
Citation preview
MINING MICROARRAY DATA FOR BIOLOGICALLY IMPORTANT GENESETS
A THESIS SUBMITTED TOTHE GRADUATE SCHOOL OF
OFMIDDLE EAST TECHNICAL UNIVERSITY
BY
GULBERAL KIRCICEGI YOKSUL KORKMAZ
IN PARTIAL FULFILLMENT OF THE REQUIREMENTSFOR
THE DEGREE OF PHILOSOPHY OF DOCTORATEIN
COMPUTER ENGINEERING
MARCH 2012
Approval of the thesis:
MINING MICROARRAY DATA FOR BIOLOGICALLY IMPORTANT
GENE SETS
submitted by GULBERAL KIRCICEGI YOKSUL KORKMAZ in partial ful-fillment of the requirements for the degree ofPhilosophy of Doctorate in Computer Engineering Department, MiddleEast Technical University by,
Prof. Dr. Canan OzgenDean, Graduate School of Natural and Applied Sciences
Prof. Dr. Adnan YazıcıHead of Department, Computer Engineering
Prof. Dr. Mehmet Volkan AtalaySupervisor, Computer Engineering Department
Examining Committee Members:
Prof. Dr. Mehmet Volkan AtalayComputer Engineering Dept., METU
Prof. Dr. Gerhard Wilhelm WeberInstitude of Applied Mathematics, METU
Prof. Dr. Ferda Nur AlpaslanComputer Engineering Dept., METU
Assoc. Prof. Dr. Tolga CanComputer Engineering Dept., METU
Assoc. Prof. Dr. Isık YulugMolecular Biology and Genetics Dept., Bilkent University
Date:

I hereby declare that all information in this document has been obtainedand presented in accordance with academic rules and ethical conduct. Ialso declare that, as required by these rules and conduct, I have fully citedand referenced all material and results that are not original to this work.
Name, Last Name: GULBERAL KIRCICEGI YOKSUL KORKMAZ
Signature :
iii
ABSTRACT
MINING MICROARRAY DATA FOR BIOLOGICALLY IMPORTANT GENESETS
Korkmaz, Gulberal Kırcicegi Yoksul
Ph.D., Department of Computer Engineering
Supervisor : Prof. Dr. Mehmet Volkan Atalay
March 2012, 166 pages
Microarray technology enables researchers to measure the expression levels of thou-
sands of genes simultaneously to understand relationships between genes, extract
pathways, and in general understand a diverse amount of biological processes such
as diseases and cell cycles. While microarrays provide the great opportunity of reveal-
ing information about biological processes, it is a challenging task to mine the huge
amount of information contained in the microarray datasets. Generally, since an accu-
rate model for the data is missing, first a clustering algorithm is applied and then the
resulting clusters are examined manually to find genes that are related with the bio-
logical process under inspection. We need automated methods for this analysis which
can be used to eliminate unrelated genes from data and mine for biologically impor-
tant genes. Here, we introduce a general methodology which makes use of traditional
clustering algorithms and involves integration of the two main sources of biological
information, Gene Ontology and interaction networks, with microarray data for elimi-
nating unrelated information and find a clustering result containing only genes related
with a given biological process. We applied our methodology successfully on a number
of different cases and on different organisms. We assessed the results with Gene Set
iv

Enrichment Analysis method and showed that our final clusters are highly enriched.
We also analyzed the results manually and found that most of the genes that are in
the final clusters are actually related with the biological process under inspection.
Keywords: microarray analysis, Gene Ontology, interaction networks, clustering
v
OZ
BIYOLOJIK ONEM TASIYAN GEN LISTELERININ BULUNMASI ICINMIKRODIZI VERI MADENCILIGI
Korkmaz, Gulberal Kırcicegi Yoksul
Doktora, Bilgisayar Muhendisligi Bolumu
Tez Yoneticisi : Prof. Dr. Mehmet Volkan Atalay
Mart 2012, 166 sayfa
Mikrodizi teknolojisi arastırmacıların aynı anda bircok gen ifade seviyesini olcerek
genler arasındaki iliskileri anlamalarını, yolakları bulmalarını ve genel olarak hastalık-
lar, hucre dongusu gibi bircok biyolojik olayı anlayabilmelerini saglamaktadır. Aynı
anda buyuk sayılarda deneyin yapılmasına olanak saglamakla birlikte, bu buyuk mik-
tarda mikrodizi verisini arastırmak ilgi cekici bir konudur. Veri hakkında onceden
fazla bilginin olmaması nedeni ile genellikle once veriye bir bolumleme algoritması
uygulandıktan sonra bulunan bolumler konu ile ilgili onemli genleri bulmak amacı ile
arastırmacılarca incelenir. Bu incelemeyi kolaylastırmak icin gereksiz genleri eleyerek
biyolojik olarak onemli genleri bulacak otomatik metotlar gereklidir. Bu tezde mevcut
bolumleme algoritmalarını kullanan, Gen Ontolojisi ve etkilesim agları olmak uzere
iki ana biyolojik bilgi kaynagını birlestirerek mikrodizi verisindeki gereksiz bilgileri
eleyen ve cıktı olarak sadece deneyle ilgili genleri iceren bir bolumleme veren genel
bir metodoloji sunulmaktadır. Sunulan metodoloji bircok farklı veri uzerinde denen-
mis ve umut verici sonuclar elde edilmistir. Sonuclar Gen Seti Zenginlestirme Metodu
(GSEA) ile karsılastırılmıs ve metodoloji ile bulunan bolumlerin yuksek zenginlestirme
skorlarına sahip oldugu gorulmustur. Sonuclar uzerinde yapılan detaylı incelemelerde
vi

de bolumleme sonucunda bulunan genlerin buyuk cogunlugunun deney konusu olan
biyolojik surec ile iliskili oldugu tespit edilmistir.
Anahtar Kelimeler: bolumleme, mikrodizi, gen ontolojisi, etkilesim agları
vii

To my dearest daughters Ece and Eda
viii
ACKNOWLEDGMENTS
I am heartily thankful to my supervisor, Volkan Atalay, for being so supportive whose
encouragement and guidance made this thesis possible. I owe my deepest gratitude
to my thesis committee members, Gerhard Wilhelm Weber and Tolga Can for their
valuable comments and suggestions. I am grateful to Rengul Cetin Atalay, for her
guidance in understanding and interpreting the biological meaning of results. I sin-
cerely thank to the jury members, Ferda Nur Alpaslan and Isık Yulug for their helpful
comments and advices.
I am indebted to members of my department and Central Bank of Turkey. It was a
pleasure to share doctoral studies with wonderful people, especially Zerrin Isık, Ayse
Gul Yaman and Sinan Sarac. It is a pleasure to thank to my colleagues at Central
Bank of Turkey, especially Serpil Memis and Perit Bezek for encouraging me and
listening my problems about thesis work even when they don’t understand a word of
it.
Last but not least, special thanks to my family for their patience and for believing
and supporting me so unconditionally.
ix
TABLE OF CONTENTS
ABSTRACT . . . . . . . . . . . . . . . . . . . . . . . . . . . . . . . . . . . . . iv
OZ . . . . . . . . . . . . . . . . . . . . . . . . . . . . . . . . . . . . . . . . . . . vi
DEDICATON . . . . . . . . . . . . . . . . . . . . . . . . . . . . . . . . . . . . . viii
ACKNOWLEDGMENTS . . . . . . . . . . . . . . . . . . . . . . . . . . . . . . ix
TABLE OF CONTENTS . . . . . . . . . . . . . . . . . . . . . . . . . . . . . . x
LIST OF TABLES . . . . . . . . . . . . . . . . . . . . . . . . . . . . . . . . . . xiv
LIST OF FIGURES . . . . . . . . . . . . . . . . . . . . . . . . . . . . . . . . . xvi
CHAPTERS
1 INTRODUCTION . . . . . . . . . . . . . . . . . . . . . . . . . . . . . 1
1.1 Motivation . . . . . . . . . . . . . . . . . . . . . . . . . . . . . 1
1.2 Problem Definition . . . . . . . . . . . . . . . . . . . . . . . . 1
1.3 Contributions . . . . . . . . . . . . . . . . . . . . . . . . . . . 2
1.4 Organization of the Thesis . . . . . . . . . . . . . . . . . . . . 3
2 BACKGROUND INFORMATION . . . . . . . . . . . . . . . . . . . . 4
2.1 Clustering Microarray Data . . . . . . . . . . . . . . . . . . . 4
2.1.1 FLAME: Fuzzy Clustering by Local Approximationof Membership . . . . . . . . . . . . . . . . . . . . . 5
2.1.1.1 Extraction of Local Structure Informationand CSO Identification . . . . . . . . . . 6
2.1.1.2 Local Approximation of Fuzzy Membership 6
2.1.1.3 Cluster Construction . . . . . . . . . . . . 7
2.1.2 GQL-Cluster: Graphical Query Language . . . . . . 7
2.1.3 NNN: Nearest Neighbor Networks . . . . . . . . . . . 7
2.1.4 STEM: Short Time Series Expression Miner . . . . . 8
x
2.1.4.1 Selecting Model Profiles . . . . . . . . . . 8
2.1.4.2 Identifying Significant Model Profiles . . 9
2.1.4.3 Grouping Significant Profiles . . . . . . . 9
2.1.5 TAC: Temporal Abstraction Clustering . . . . . . . . 9
2.1.5.1 Temporal Abstraction Detection and TimeSeries Representation . . . . . . . . . . . 10
2.1.5.2 Temporal Abstraction Clustering . . . . . 10
2.2 Combination of Multiple Clustering Algorithms . . . . . . . . 11
2.3 Interpretation of Clustering Results . . . . . . . . . . . . . . . 13
2.4 Comparison of Partition Similarity . . . . . . . . . . . . . . . 14
2.5 Integration of Biological Information Resources . . . . . . . . 15
3 INTERACTION BASED HOMOGENEITY . . . . . . . . . . . . . . . 17
3.1 Homogeneity . . . . . . . . . . . . . . . . . . . . . . . . . . . . 17
3.2 Interaction Network . . . . . . . . . . . . . . . . . . . . . . . . 18
3.3 Interaction Based Homogeneity . . . . . . . . . . . . . . . . . 19
3.3.1 Relationship with Other Network-Based Measures . . 19
3.4 Comparison . . . . . . . . . . . . . . . . . . . . . . . . . . . . 20
3.4.1 Gene Ontology (GO) . . . . . . . . . . . . . . . . . . 22
3.4.2 Homogeneity Based on GO Based Resnik’s Similarity 22
3.4.3 Homogeneity Based on GO Based Wang’s Similarity 23
3.4.4 David Gene Functional Classification . . . . . . . . . 24
3.4.5 KEGG Based DomainSignatures Method . . . . . . . 24
3.4.6 Comparison on Lists of Highly Interacting Genes . . 25
3.4.7 Comparison on Lists That Are Similar According toGene Ontology . . . . . . . . . . . . . . . . . . . . . 26
3.4.8 Gene Set Enrichment Analysis of p53 Dataset Rankedby Interaction Based Homogeneity . . . . . . . . . . 30
3.5 Results and Discussion on IBH . . . . . . . . . . . . . . . . . . 34
4 CLUSTER-ELIMINATE-COMBINE METHOD . . . . . . . . . . . . 36
4.1 Details of CEC Method . . . . . . . . . . . . . . . . . . . . . . 40
4.1.1 Interaction Subnetwork . . . . . . . . . . . . . . . . . 40
xi
4.1.2 Interaction Based Homogeneity . . . . . . . . . . . . 40
4.1.3 Calculating Gene Weights . . . . . . . . . . . . . . . 40
4.1.4 Cleaning the Clusters . . . . . . . . . . . . . . . . . . 40
4.1.5 Cluster Combination . . . . . . . . . . . . . . . . . . 41
4.2 Dataset . . . . . . . . . . . . . . . . . . . . . . . . . . . . . . . 41
4.3 Results of Cluster-Eliminate-Combine on GDS36 Dataset . . . 41
4.4 Contributions of Each Component of the Method . . . . . . . 44
4.4.1 Elimination of Unrelated Clusters Before ClusteringCombination . . . . . . . . . . . . . . . . . . . . . . . 46
4.4.1.1 Results of Elimination of Unrelated Clus-ters Before Clustering Combination . . . 49
4.4.2 Create Interaction Subnetworks Using Gene Ontology 50
4.4.2.1 Results of Creating Interaction SubnetworksUsing Gene Ontology . . . . . . . . . . . 54
4.4.3 Contribution of Using Interaction Networks . . . . . 55
4.5 Summary . . . . . . . . . . . . . . . . . . . . . . . . . . . . . . 57
5 RESULTS AND DISCUSSIONS . . . . . . . . . . . . . . . . . . . . . 61
5.1 Different Algorithms on Time-Series Microarray Data . . . . . 61
5.1.1 Description . . . . . . . . . . . . . . . . . . . . . . . 61
5.1.2 Datasets . . . . . . . . . . . . . . . . . . . . . . . . . 62
5.1.3 Results on Yeast Sporulation Dataset . . . . . . . . . 63
5.1.4 Results on Yeast Heat Shock GDS1711 Dataset . . . 65
5.2 Combining Different Microarray Experiments . . . . . . . . . . 67
5.2.1 Description . . . . . . . . . . . . . . . . . . . . . . . 67
5.2.2 Datasets . . . . . . . . . . . . . . . . . . . . . . . . . 68
5.2.3 Results . . . . . . . . . . . . . . . . . . . . . . . . . . 69
5.3 Evaluation of CEC With the Gene Set Enrichment AnalysisMethod . . . . . . . . . . . . . . . . . . . . . . . . . . . . . . . 71
5.3.1 Description . . . . . . . . . . . . . . . . . . . . . . . 71
5.3.2 Datasets . . . . . . . . . . . . . . . . . . . . . . . . . 72
5.3.3 Results on Male vs. Female Lymphoblastoid CellsDataset . . . . . . . . . . . . . . . . . . . . . . . . . 72
xii
5.3.4 Results on p53 Status in Cancer Cell Lines Dataset . 73
5.3.5 Stability and Complexity Analysis . . . . . . . . . . 73
5.3.6 Results on Yeast Sporulation Dataset with STRINGInteraction Database . . . . . . . . . . . . . . . . . . 76
6 CONCLUSION . . . . . . . . . . . . . . . . . . . . . . . . . . . . . . . 80
REFERENCES . . . . . . . . . . . . . . . . . . . . . . . . . . . . . . . . . . . . 84
A ibh SOFTWARE PACKAGE . . . . . . . . . . . . . . . . . . . . . . . 93
A.0.7 Loading the Package . . . . . . . . . . . . . . . . . . 94
A.0.8 Interaction Based Homogeneity to Evaluate Gene Lists 94
A.0.9 Interaction Based Homogeneity to Evaluate Cluster-ing Results . . . . . . . . . . . . . . . . . . . . . . . . 95
A.0.10 Creating and Using Proprietary Interaction Lists . . 96
B DETAILED RESULTS ON ELIMINATION OF UNRELATED CLUS-TERS BEFORE CLUSTERING COMBINATION . . . . . . . . . . . 97
C DETAILED RESULTS ON CREATING INTERACTION SUBNET-WORKS USING GENE ONTOLOGY . . . . . . . . . . . . . . . . . . 115
D DETAILED RESULTS OF APPLYING CLUSTER-ELIMINATE-COMBINEMETHOD TO GDS36 YEAST HEAT SHOCK DATASET . . . . . . 121
E DETAILED RESULTS OF APPLYING CLUSTER-ELIMINATE-COMBINEMETHOD TO GDS36 YEAST HEAT SHOCK DATASET WITH AFULLY CONNECTED INTERACTION NETWORK . . . . . . . . . 126
F DETAILED RESULTS OF APPLYING CLUSTER-ELIMINATE-COMBINEMETHOD TO YEAST SPORULATION DATASET . . . . . . . . . . 135
G DETAILED RESULTS OF APPLYING CLUSTER-ELIMINATE-COMBINEMETHOD TO YEAST SPORULATION DATASET WITH STRINGDATABASE . . . . . . . . . . . . . . . . . . . . . . . . . . . . . . . . . 146
H DETAILED RESULTS OF APPLYING CLUSTER-ELIMINATE-COMBINEMETHOD TO GDS1711 YEAST HEAT SHOCK DATABASE . . . . 155
I DETAILED RESULTS OF APPLYING CLUSTER-ELIMINATE-COMBINEMETHOD TO COMBINATION OF HETEROGENEOUS DATASETSPROBLEM . . . . . . . . . . . . . . . . . . . . . . . . . . . . . . . . . 163
xiii
LIST OF TABLES
TABLES
Table 3.1 Adjacency matrix of the graph in Figure 3.1. . . . . . . . . . . . . . 19
Table 3.2 Number of non-IEA annotations for the selected organisms. . . . . . 21
Table 3.3 Number of interactions in interaction databases for the selected or-
ganism. . . . . . . . . . . . . . . . . . . . . . . . . . . . . . . . . . . . . . . 21
Table 4.1 Number of clusters found in each partition for GDS36 dataset. . . . 42
Table 4.2 Rand Statistics Between Partitions on GDS36 Dataset. . . . . . . . 44
Table 4.3 Average Rand Statistics Between Input Partitions and Between Input
Partitions and CEC on GDS36 Dataset. . . . . . . . . . . . . . . . . . . . 44
Table 4.4 Jaccard Coefficient Between Partitions on GDS36 Dataset. . . . . . 45
Table 4.5 Average Jaccard Coefficient Between Input Partitions and Between
Input Partitions and CEC on GDS36 Dataset. . . . . . . . . . . . . . . . . 45
Table 4.6 Folkes and Mallows Index Between Partitions on GDS36 Dataset. . 46
Table 4.7 Average Folkes and Mallows Index Between Input Partitions and
Between Input Partitions and CEC on GDS36 Dataset. . . . . . . . . . . . 46
Table 5.1 Number of clusters found in each partition for yeast sporulation dataset. 63
Table 5.2 Number of clusters found in each partition for GD1711 dataset. . . . 65
Table 5.3 Rand Statistics among partitions with different threshold t values. . 74
Table 5.4 Jaccard Coefficient among partitions with different threshold t values. 75
Table 5.5 Folkes and Mallows Coefficient among partitions with different thresh-
old t values. . . . . . . . . . . . . . . . . . . . . . . . . . . . . . . . . . . . 75
xiv
Table B.1 Analysis of the GDS36-heat shock time course dataset with elimina-
tion of unrelated clusters before clustering combination . . . . . . . . . . . 97
Table C.1 Analysis of the GDS36-heat shock time course dataset with creating
interaction subnetworks using Gene Ontology. . . . . . . . . . . . . . . . . 115
Table D.1 Number of clusters found in each partition for GDS36Dataset. . . . 121
Table D.2 Analysis of the GDS36-heat shock from 29°C to 33°C time course
dataset with CEC method. . . . . . . . . . . . . . . . . . . . . . . . . . . . 121
Table E.1 Analysis of the GDS36-heat shock time course dataset with CEC
method and a fully connected interaction network. . . . . . . . . . . . . . 126
Table F.1 Number of clusters found in each partition for yeast sporulation dataset.135
Table F.2 Analysis of the Sporulation time course dataset with CEC method. . 135
Table G.1 Analysis of the Sporulation dataset with CEC method and STRING
interaction database . . . . . . . . . . . . . . . . . . . . . . . . . . . . . . . 146
Table H.1 Analysis of the GD1711-heat shock time course dataset with CEC
method . . . . . . . . . . . . . . . . . . . . . . . . . . . . . . . . . . . . . . 155
Table I.1 Result of applying CEC method to 7 different heat shock time-series
datasets. . . . . . . . . . . . . . . . . . . . . . . . . . . . . . . . . . . . . . 163
xv
LIST OF FIGURES
FIGURES
Figure 2.1 Outline of the clustering ensembles method. . . . . . . . . . . . . . 13
Figure 3.1 The graph representation of a very small sub-network of yeast. . . 18
Figure 3.2 Comparison of GO based Resnik’s Homogeneity and Interaction
Based Homogeneity on gene lists of highly interacting genes for 3 differ-
ent organisms. . . . . . . . . . . . . . . . . . . . . . . . . . . . . . . . . . . 27
Figure 3.3 Comparison of GO based Wang’s Homogeneity and Interaction Based
Homogeneity on gene lists of highly interacting genes for 3 different organisms. 28
Figure 3.4 Comparison of DAVID Functional Classification Enrichment Score
and Interaction Based Homogeneity on gene lists of highly interacting genes
for 3 different organisms. . . . . . . . . . . . . . . . . . . . . . . . . . . . . 29
Figure 3.5 Comparison of domainSignatures and Interaction Based Homogene-
ity on gene lists of highly interacting human genes. . . . . . . . . . . . . . 30
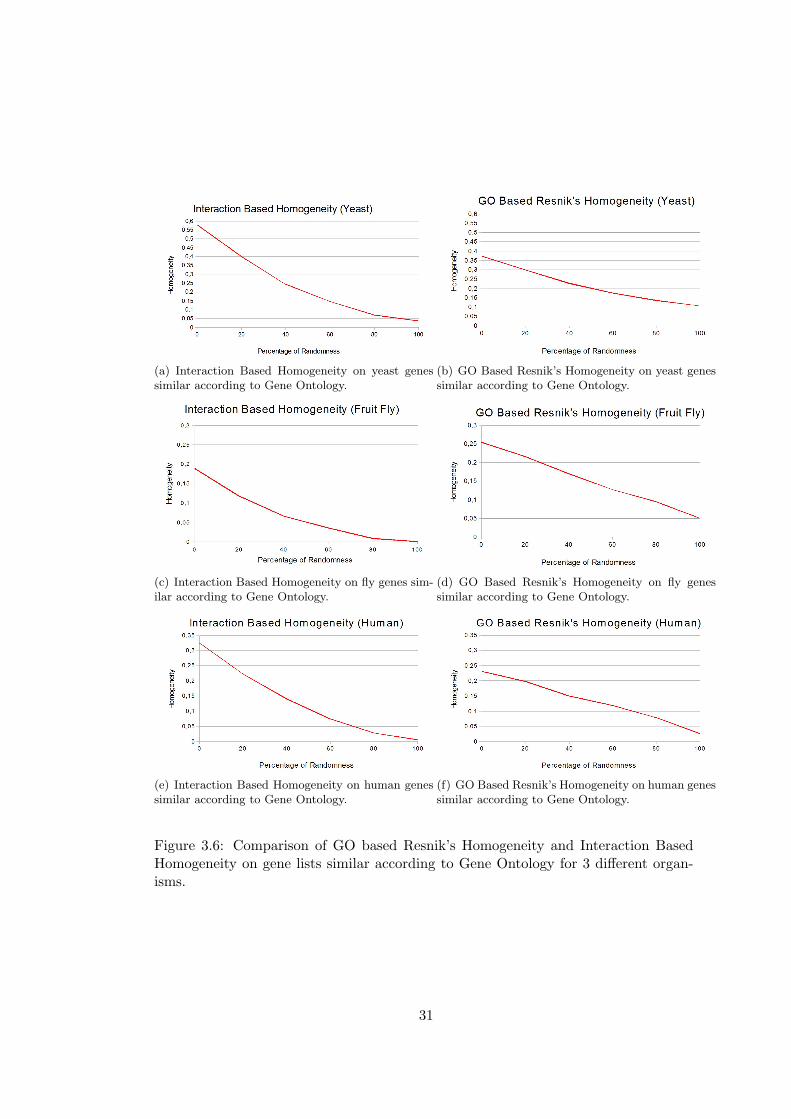
Figure 3.6 Comparison of GO based Resnik’s Homogeneity and Interaction
Based Homogeneity on gene lists similar according to Gene Ontology for
3 different organisms. . . . . . . . . . . . . . . . . . . . . . . . . . . . . . . 31
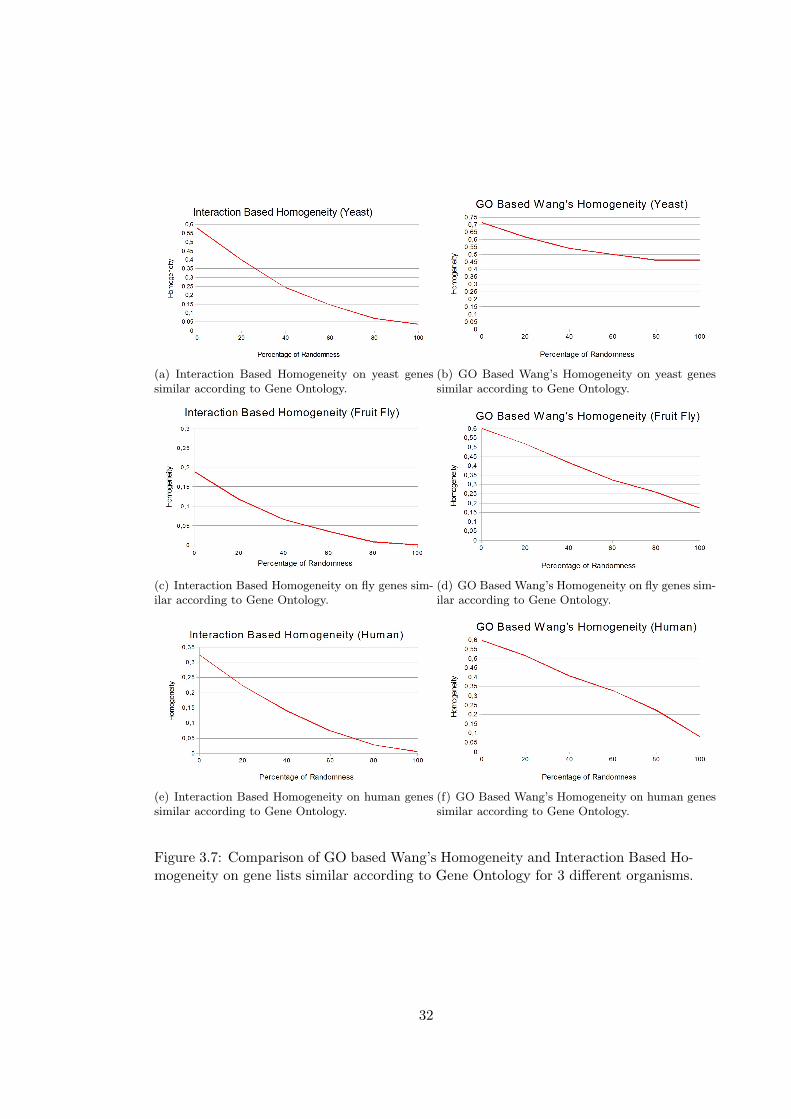
Figure 3.7 Comparison of GO based Wang’s Homogeneity and Interaction Based
Homogeneity on gene lists similar according to Gene Ontology for 3 different
organisms. . . . . . . . . . . . . . . . . . . . . . . . . . . . . . . . . . . . . 32
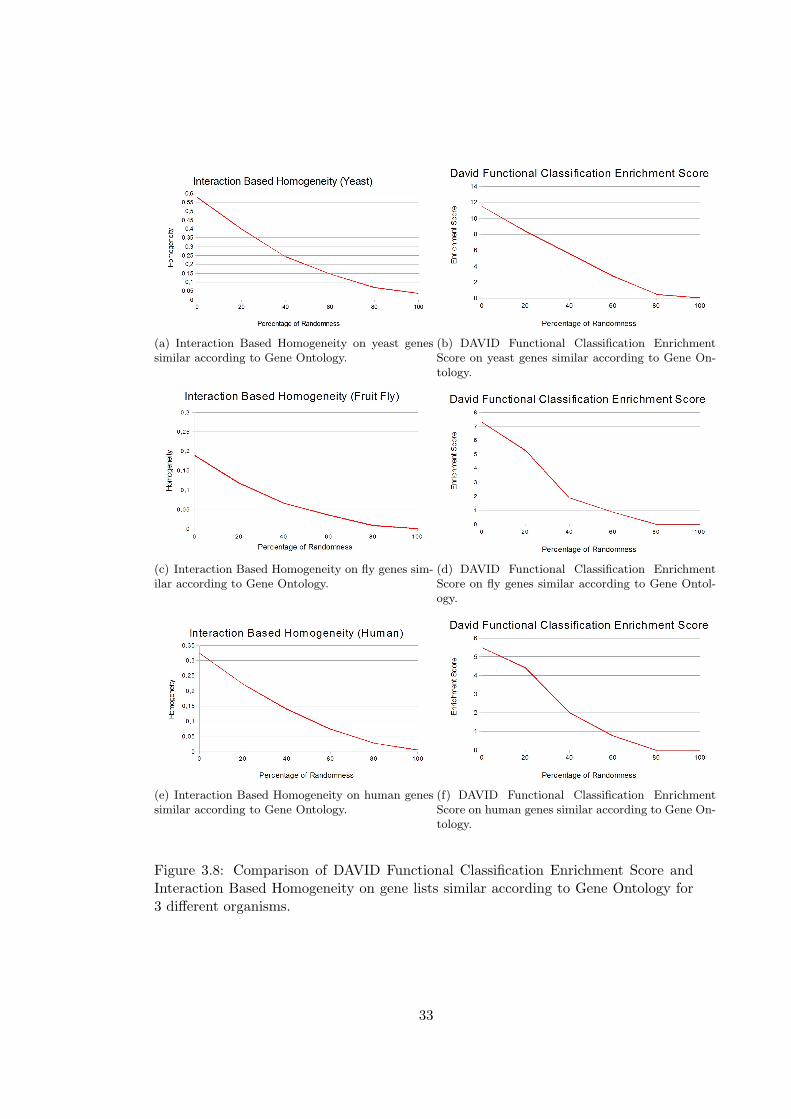
Figure 3.8 Comparison of DAVID Functional Classification Enrichment Score
and Interaction Based Homogeneity on gene lists similar according to Gene
Ontology for 3 different organisms. . . . . . . . . . . . . . . . . . . . . . . 33
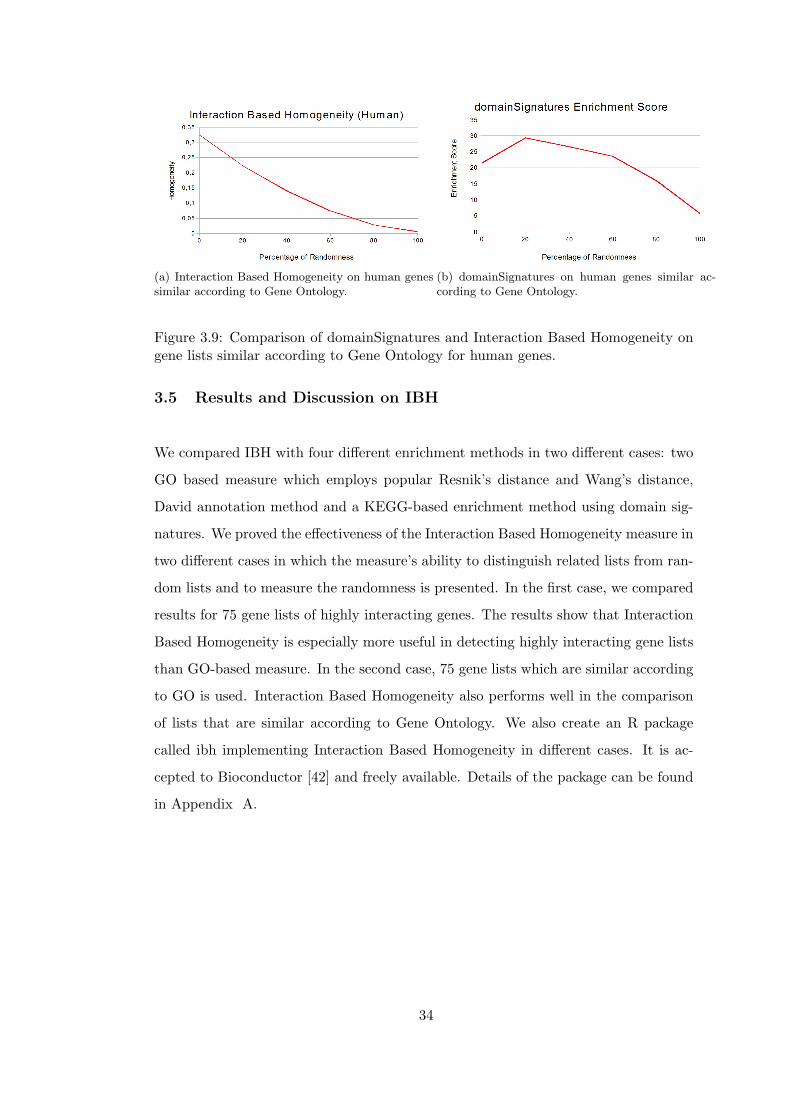
Figure 3.9 Comparison of domainSignatures and Interaction Based Homogene-
ity on gene lists similar according to Gene Ontology for human genes. . . . 34
xvi
Figure 3.10 Results of GSEA analysis of p53 dataset which is ranked by Inter-
action Based Homogeneity. . . . . . . . . . . . . . . . . . . . . . . . . . . . 35
Figure 4.1 Outline of the CEC method. . . . . . . . . . . . . . . . . . . . . . . 39
Figure 4.2 CEC on yeast heat shock GDS36 dataset. . . . . . . . . . . . . . . 42
Figure 4.3 Elimination of unrelated clusters before clustering combination. . . 48
Figure 4.4 Elimination of unrelated clusters before clustering combination on
yeast heat shock GDS36 dataset. . . . . . . . . . . . . . . . . . . . . . . . 49
Figure 4.5 Outline of creating interaction subnetworks using Gene Ontology. . 53
Figure 4.6 Results of creating interaction subnetworks using Gene Ontology on
yeast heat shock GDS36 dataset. . . . . . . . . . . . . . . . . . . . . . . . 54
Figure 4.7 CEC on yeast heat shock GDS36 dataset–with a fully connected
interaction network. . . . . . . . . . . . . . . . . . . . . . . . . . . . . . . . 56
Figure 4.8 Contribution of the components of CEC method on GDS36 heat
shock dataset. . . . . . . . . . . . . . . . . . . . . . . . . . . . . . . . . . . 59
Figure 4.9 Significance of using a real interaction network. . . . . . . . . . . . 60
Figure 5.1 Outline of the application of CEC method to time-series microarray
data. . . . . . . . . . . . . . . . . . . . . . . . . . . . . . . . . . . . . . . . 62
Figure 5.2 CEC on yeast sporulation dataset. . . . . . . . . . . . . . . . . . . 64
Figure 5.3 CEC on yeast heat shock GDS1711 dataset. . . . . . . . . . . . . . 66
Figure 5.4 Outline of the application of CEC method to combination of hetero-
geneous datasets, 7 different heat shock microarray datasets in this example. 68
Figure 5.5 CEC on application of CEC method to combination of heterogeneous
datasets, 7 different heat shock microarray datasets in this example. . . . . 70
Figure 5.6 GSEA enrichment plot of enriched clusters found in CEC analysis
of Male vs. Female Lymphoblastoid Cells Dataset with t=0.01. . . . . . . 73
Figure 5.7 GSEA enrichment plot of enriched clusters found in CEC analysis
of Male vs. Female Lymphoblastoid Cells Dataset with t=0.001. . . . . . . 74
Figure 5.8 GSEA enrichment plot of enriched clusters found in CEC analysis
of p53 Status in Cancer Cell Lines Dataset with t=0.01. . . . . . . . . . . 75
xvii

Figure 5.9 CEC on yeast sporulation dataset with STRING interaction database. 77
Figure 5.10 Summarized results of the analysis of sporulation dataset with two
different interaction databases. . . . . . . . . . . . . . . . . . . . . . . . . . 79
xviii
CHAPTER 1
INTRODUCTION
1.1 Motivation
There are thousands of genes in the genome of an organism. At a given instant of
time, only a small percentage of them are expressed. Thanks to the microarray tech-
nology, the expression levels of thousands of genes can be measured simultaneously.
Microarray technology enables researchers to study the expressions of entire genomes
under different conditions. Microarray experiments are used to understand relation-
ships among genes, extract pathways, and in general to understand a diverse amount
of biological processes. While microarrays provide great opportunity of revealing in-
formation about biological processes, it is a challenging task to mine the the massive
quantity of microarray datasets to identify important aspects of biological processes.
The methods to analyze microarray data should address the curse of dimensionality
problem raised by the tens of thousands of genes and small sample sizes, i.e. small sizes
of experimental conditions or time points compared to the number of measurements.
1.2 Problem Definition
A widely used technique in mining microarray data is to apply clustering since an
accurate model for the data is missing. There are dozens of clustering algorithms
available in the literature, each of which is better under certain conditions. Generally,
clustering algorithms all result with different number of clusters and cluster contents
differ greatly as can be seen from the results presented in Chapter 5. To solve these
stability problems, ensembles of clusters approach may be considered. However, even
1
when the perfect clustering that fits to the data is achieved, the interpretation of
the clustering still remains as a problem to solve. For the interpretation of results,
biologists apply enrichment methods to select important clusters and then manually
analyze the genes in the selected clusters. In the analysis, they make use of the
information contained in databases such as Gene Ontology, pathway databases and
biological networks. Among tens of thousands of genes, at most hundreds of them are
related with the biological process under inspection. We need automated methods to
mine for that hundreds of biologically important genes.
Another problem to be solved in mining microarray data is the combination of het-
erogeneous datasets. There are experiments made at different times and conditions
about the same process, with different number of samples and genes involved. We need
methodologies to find the genes that play a common role among these experiments
about the same biological process performed at different times and conditions.
The problem definition is to find biologically important genes in an experiment or
locate the common characteristics between heterogeneous datasets without facing the
curse of dimensionality problem. We should make use of the previous knowledge about
genes contained in the biological information resources. Gene Ontology is an important
resource containing information about genes and it is widely used. Gene interaction
network is yet another important source of information that enriches the knowledge
about genes and gene lists. Furthermore, the number of known gene interactions is
constantly growing thanks to the recent developments in research. Therefore, it is
valuable to combine these two important sources of information in the analysis.
1.3 Contributions
In this thesis, we provide a general methodology which involves integration of Gene
Ontology, interaction networks and microarray data to eliminate unrelated informa-
tion from microarray data and find a clustering result containing only genes which
are related with the biological process under inspection. The methodology is also
applicable to the problem of combination of heterogeneous datasets.
The contributions of this thesis are as follows:
2
• We describe and assess Interaction Based Homogeneity , a measure to eval-
uate the relationship of a gene list with respect to an interaction network. To
the best of our knowledge, this is the first study to use interaction networks in
the calculation of homogeneity of gene lists.
• We propose a gene weight measure calculated from Interaction Based Ho-
mogeneity values of the clusters that a gene belongs to and use it to clean up
clusters.
• We propose a novel and robust methodology called Cluster-Eliminate-Combine
(CEC) integrating Gene Ontology and interaction networks for mining microar-
ray data.
• We show that instead of using whole interaction networks, taking their subset
using Gene Ontology terms dramatically improves the performance of the anal-
ysis.
• We show that the CEC methodology is applicable for different cases such as
combining multiple clustering algorithms for the analysis of the same microar-
ray data and for combining heterogeneous microarray experiments to find their
common characteristics.
1.4 Organization of the Thesis
A brief introduction is already given in this chapter. Background and literature in-
formation about microarray data analysis, clustering ensembles, gene ontology, inter-
action networks, enrichment methods and data integration is presented in Chapter 2.
Interaction Based Homogeneity is presented in Chapter 3. Cluster-Eliminate-Combine
methodology is outlined in Chapter 4 along with the results proving the necessity of
each component of the methodology. Chapter 5 contains detailed results and discus-
sions of applying the CEC methodology to a diverse set of datasets and cases. The
thesis ends with Chapter 6 which contains conclusions and future work.
3
CHAPTER 2
BACKGROUND INFORMATION
One of the biggest challenges in bioinformatics research is to infer networks which rep-
resents relations among genes. Usually, high throughput experiments such as microar-
ray experiments are applied to gather information for network construction. Generally,
a two-step approach has been taken in order to interpret the results of the microarray
experiments to infer relationships. First, a clustering algorithm is applied onto the
data. The clustering results are then interpreted to extract relationships [1, 2, 3]. In
the first section of this chapter, clustering algorithms for microarray data is summa-
rized. In the second section, a survey on clustering combination methods is given. The
third section describes methods for the interpretation of clustering results. The next
section summarizes partition similarity metrics used in our study. The last section
contains a survey on methods integrating different biological information sources.
2.1 Clustering Microarray Data
For clustering microarray data, general clustering methods such as k -means and hi-
erarchical clustering [4, 5, 6, 7] are widely used. In addition to general algorithms,
there are algorithms designed specifically for the analysis of microarray data. Fu
and Medico proposed the Fuzzy Clustering by Local Approximation of Membership
(FLAME) method which is based on a fuzzy clustering algorithm which makes use
of neighborhood information. The implementation of the algorithm can be found in
Gene Expression Data Analysis Studio (GEDAS) [2]. Huttenhower et al. proposed
Nearest Neighbor Networks (NNN) clustering algorithm which uses neighborhood in-
formation to construct an interaction graph and searches for mutual cliques in this
4
graph to find clusters [8].
A popular and recent method is biclustering which clusters simultaneously genes and
samples or experimental conditions [9]. A survey on biclustering algorithms is provided
by Tanay et al. [10]. Prelic´ et al. provides a comparison of biclustering methods for
gene expression data [11].
A specific type of microarray experiments is called time-series microarray experiments
at which the expression of genes are measured at different time points. There are algo-
rithms designed specifically for time series microarray data. Schliep et al. proposes a
mixture model with Hidden Markov Models for analyzing time series data [12]. They
apply partially supervised learning of mixtures through a modification of Expectation
Maximization algorithm. Ernst et al. proposed Short Time Series Expression Miner
method which first finds model profiles from the data and then uses them to find clus-
ters [3]. The method is implemented in Short Time Series Expression Miner (STEM)
tool. Sacchi et al. proposed Temporal Abstraction method for clustering short time
series data [13]. The method is a generalization of the template-based clustering.
The implementation of the algorithm can be found in TimeClust application [14].
Bin and Russo [15] filter genes and apply dimensionality reduction to the data before
clustering.
In this work, we use five different clustering methods: FLAME, GQL, NNN, STEM
and TAC. The details of these methods are given in the following subsections.
2.1.1 FLAME: Fuzzy Clustering by Local Approximation of Membership
Fu and Medico proposed the FLAME method which is a fuzzy clustering algorithm
based on neighborhood information for the analysis of DNA microarray data. The
implementation of the algorithm can be found in Gene Expression Data Analysis
Studio (GEDAS) [2]. The method has three steps. In the first step, the object
density of each gene (object) is calculated by using the distance between its k nearest
neighbors. By using these densities, Cluster Supporting Objects and outliers are
defined. In the next step, each object is assigned to a fuzzy membership vector in an
iterative process which makes use of the object densities and the Cluster Supporting
5
Objects. In the final step, clusters are constructed by using the fuzzy membership
vectors. In the following three subsections, the details of each step is given.
2.1.1.1 Extraction of Local Structure Information and CSO Identification
In this step, the similarities between each pair of objects are calculated and the k -
nearest neighbors are identified for each object. The density of each gene is calculated
as one over the average distance of the gene to its k nearest neighbors. Cluster
Supporting Objects are identified as the genes with higher densities than all of its
neighbors. Similarly, outliers are then identified as genes with lower densities than its
neighbors. In addition, a density threshold is also applied to locate the outliers. The
density threshold is calculated by using the mean and variance of the densities.
2.1.1.2 Local Approximation of Fuzzy Membership
In this step, each gene x is associated with a fuzzy membership vector p(x) such that
p(x) = (p1(x), p2(x), ..., pM(x)) where,
pi(x) denotes the membership of gene x to cluster i,
0 ≤ pi(x) ≤ 1;∑M
i=1 pi(x) = 1, and
M is the number of clusters defined as the number of Cluster Supporting Objects plus
one (for outliers).
For the calculation of the membership vector, the weights defining how much each
neighbor contributes to the approximation is calculated by
wxy =s(x, y)∑
z∈KNN(x) s(x, z),
where s(x, y) is the similarity between x and y.
The membership vector is then calculated in an iterative process of local approxima-
tion:
pt+1(x) =∑
y∈KNN(x) wxy pt(y),
6
p0i (x) = 1, p0
j(x) = 0, j , i, 1 ≤ j ≤ M for Cluster Supporting Objects representing
cluster i,
p0M(x) = 1, p0
j(x) = 0, 1 ≤ j < M for outliers and,
p0i (x) = 1
M , for every other gene.
2.1.1.3 Cluster Construction
In this step, membership vectors are used to construct clusters. One object can be
assigned to multiple clusters if it has a high membership score for more than one
cluster. Also, some objects are not assigned to any clusters if they don’t have a high
membership score for any of the clusters. These objects are also labeled as outliers.
2.1.2 GQL-Cluster: Graphical Query Language
Schliep et al. proposed a mixture model for analyzing time series data with Hidden
Markov Models [12]. They apply partially supervised learning of mixtures through
a modification of Expectation Maximization algorithm. The method has four main
parts. The first part is a class of Hidden Markov models. They applied a linear chain
HMM topology with the addition of possibility of transition from the last to the first
state for cyclic behavior. In the models, states do not have a specific semantic. The
second part is for selection of an initial collection of models. The authors proposed
three methods for choosing a starting point for mixture estimation. The first method
is expert selection by using a graphical tool. The second method is to use randomized
models. The third method is to learn initial models. The third part is for estimating
a finite mixture. The last part is to infer groups from the mixture.
2.1.3 NNN: Nearest Neighbor Networks
Huttenhower et al. proposed Nearest Neighbor Networks (NNN) clustering algorithm
which makes use of small cliques of mutual nearest neighbors in an interaction network
to find clusters [8]. The input of NNN is a set of m genes, a similarity measure s(x, y),
and a neighborhood size k. For each gene gi, N(gi) which represents the set of k nearest
7
neighbors of gi according to the similarity matrix s is calculated. An undirected graph
is constructed such that the vertices are the genes and there is an edge between gene
gi and gene g j if g j is in N(gi) and gi is in N(g j), i.e. the two genes are mutual nearest
neighbors. Then, all cliques of size g are identified, overlapping cliques are merged to
produce preliminary networks representing potential clusters. Subsequently, clusters
which has cut vertices are divided into two clusters and the cut vertices are included
in both of the clusters. Here, cut vertices represents genes connecting clusters which
shares no other interactions.
2.1.4 STEM: Short Time Series Expression Miner
Ernst et al. proposed a method designed specifically for short time series microarray
data [3]. The method is implemented in Short Time Series Expression Miner (STEM)
tool. The method has three main steps. In the first step, the model profiles are
selected. In the next step, genes are assigned to a model profiles and the significant
profiles are located. And in the final step, the significant profiles are grouped to find
final clusters. In the following subsections, details of these steps are given.
2.1.4.1 Selecting Model Profiles
In this step, first, model profiles are generated by using a user-defined parameter c
which controls the amount of change a gene can exhibit between successive time points.
For n time points, a profile is a vector of size n − 1, and each entry in the vector has
a value between −c and c. As an example, if c=2, a gene can go up either one or two
units (1 and 2), stay the same (0), or go down one or two units (-1 and -2). For n time
points, (2c + 1)(n−1) profiles are generated. If P represents the set of profiles, the set
R of model profiles is constructed such that the minimum distance between any two
profiles in R is maximized. The algorithm starts with R = p1 where p1 = −1,−1, ...,−1.
Then, in each iteration the profile r which satisfies:
r = maxp∈P\R
minq∈R
d(p, q)
is added to R. This process is repeated m times where m is the user-defined number
of model profiles.
8
2.1.4.2 Identifying Significant Model Profiles
In this step, each gene g is assigned to a model profile with the smallest distance.
After this assignment, the significant model profiles which deviates significantly from
the null hypothesis are identified by using a permutation based test. Each gene has n!
permutations. Each possible permutation is assigned to its closest model profile. Let
s ji be the number of genes assigned to model profile i in permutation j. The expected
number of genes for model profile i is calculated by
Ei =
∑j s j
i
n!
If the number of genes assigned to model profile i is greater than the expected value,
it is selected as a significant model profile.
2.1.4.3 Grouping Significant Profiles
The last step is to determine and group similar significant profiles. For this reason, a
graph G = (V, E) is constructed in which the nodes V are the significant model profiles
and there is an edge between two nodes if the distance between two profiles are smaller
than a threshold. Cliques in this graph represents the profiles that should be grouped.
In order to locate cliques, a greedy algorithm which grows a cluster Ci around each
significant model profile pi is applied. The algorithm starts with Ci = pi. Then, at
each step, a profile p j which is connected to every node in Ci is selected and added to
Ci. After obtaining clusters for each significant profile, the largest cluster is selected
and removed from the graph. The process is repeated until every profile is assigned
to a cluster.
2.1.5 TAC: Temporal Abstraction Clustering
Sacchi et al. proposed Temporal Abstraction method for clustering short time series
data [13]. Temporal Abstraction Clustering is a generalization of the template-based
clustering. The implementation of the algorithm can be found in TimeClust applica-
tion [14]. The algorithm has two steps. In the first step, qualitative representation of
the time series is inferred from the data. In the next step, the qualitative represen-
9
tation is used to cluster data. In the following subsections, details of these steps are
given.
2.1.5.1 Temporal Abstraction Detection and Time Series Representation
Time series are represented with a qualitative label consisting of trend temporal ab-
stractions which are inferred from the expression profiles by applying piecewise linear
approximations. There are three types of trends: increasing, decreasing and steady.
For each expression profile, a set of dominant points which are time points at which
is the start of the significant change of the trend starts are determined. Given two
time points ti and t j, the arc length S i j is defined as the sum of the lengths of all the
segments joining pairs of consecutive points between ti and t j. The chord length Ci j is
the length of the segment joining ti and t j. Then, the point t j−1 is a dominant point
if
√S 2
i j−C2i j
2 > T , where T is a predefined threshold, in other words if the slope change
that occur between ti and t j is higher than a threshold. After finding dominant points,
each interval between two dominant points is labeled with a trend according to the
slope between them. Then, a three level representation of the qualitative pattern is
created. The first level, named L1 is the immediate output of the temporal abstrac-
tion detection phase. The next level, L2 is created by combining consecutive interval
labels of the same type into same label. The last level L3 is obtained by removing all
elements of type steady from the temporal abstractions.
2.1.5.2 Temporal Abstraction Clustering
The clustering step starts with the first gene and build initial sets of clusters for each
level of representation. Then, for each gene, the temporal abstraction pattern of the
gene and each cluster is compared. If the temporal abstraction pattern of the gene
is matched with a cluster, the gene is assigned to the cluster. If there is no match, a
new cluster is created and the gene is assigned to the newly created cluster.
10
2.2 Combination of Multiple Clustering Algorithms
There are a dozen of different clustering algorithms, each of which is suitable for a
different model or cluster shape. Since in most of the cases, the shape of the cluster is
not known in advance, combination of clusterings is widely applied to obtain a stable
and robust clustering solution [16, 2, 17, 18]. This approach is also called clustering
ensembles or consensus clustering. The approach is summarized in Figure 2.1. The
partitions, i.e. different clustering solutions, can be obtained in several ways such as
applying the same algorithm with different parameters, using different distance metrics
or applying different clustering algorithms to the data. Topchy et al. showed that
with the increasing number of partitions, the clustering ensembles method approaches
to a true clustering solution [19, 17].
Fred and Jain [20, 21] introduced the idea of evidence accumulation which creates
a new similarity matrix from the initial partitions by a voting mechanism and then
perform hierarchical clustering based on the new similarity matrix. The evidence
accumulation clustering method makes no assumptions on the number of clusters in
each partition. Assuming that patterns belonging to natural clusters are more likely
to co-exist in the same cluster than in different partitions, they propose a new measure
based on voting mechanism to combine partitions. They create a new nxn similarity
matrix C called co-association matrix from N partitions of n patterns as:
C(i, j) =ni j
N,
where ni j is the number of co-occurrences of pattern pair (i, j) in N partitions.
Clustering ensembles method is also applied to different bioinformatics problems. Hu
and Yoo applied the ensembles method to gene expression data analysis [22]. They
first create a distance matrix based on clustering solutions, then apply a graph based
clustering algorithm to obtain a consensus clustering. Yu et al. applied a graph
based consensus clustering algorithm for class discovery from microarray data [23].
Chakrabarti and Panchenko applied clustering ensembles method to the problem of
finding determining sites for functional specification or diversification in protein fami-
lies by combining three best performing methods [24]. Glaab et al. created a web based
11

tool which provides ensemble and consensus methods for microarray analysis [25].
12
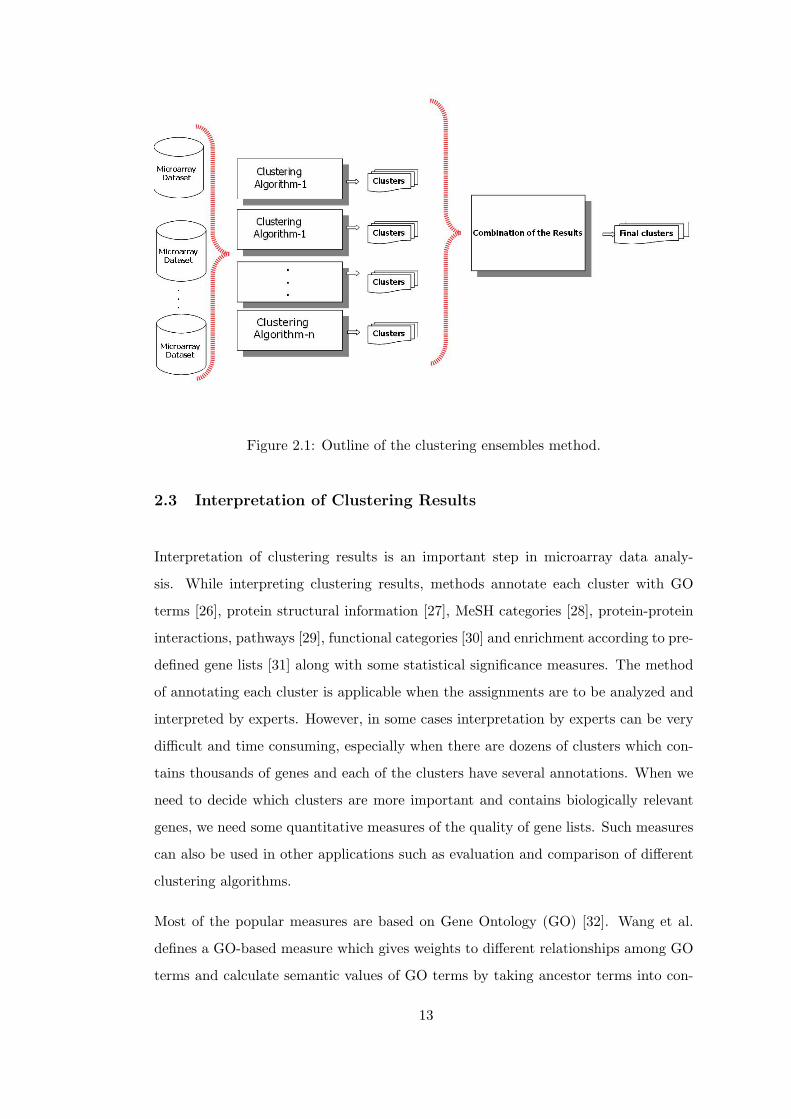
Figure 2.1: Outline of the clustering ensembles method.
2.3 Interpretation of Clustering Results
Interpretation of clustering results is an important step in microarray data analy-
sis. While interpreting clustering results, methods annotate each cluster with GO
terms [26], protein structural information [27], MeSH categories [28], protein-protein
interactions, pathways [29], functional categories [30] and enrichment according to pre-
defined gene lists [31] along with some statistical significance measures. The method
of annotating each cluster is applicable when the assignments are to be analyzed and
interpreted by experts. However, in some cases interpretation by experts can be very
difficult and time consuming, especially when there are dozens of clusters which con-
tains thousands of genes and each of the clusters have several annotations. When we
need to decide which clusters are more important and contains biologically relevant
genes, we need some quantitative measures of the quality of gene lists. Such measures
can also be used in other applications such as evaluation and comparison of different
clustering algorithms.
Most of the popular measures are based on Gene Ontology (GO) [32]. Wang et al.
defines a GO-based measure which gives weights to different relationships among GO
terms and calculate semantic values of GO terms by taking ancestor terms into con-
13
sideration [33]. The semantic values of terms are then used to calculate the similarity
between GO terms. Datta and Datta propose two performance measures called Biolog-
ical Homogeneity Index and Biological Stability Index for cluster evaluation in terms of
the algorithm’s capability to produce biologically meaningful clusters using a reference
set of functional classes [34]. Resnik’s similarity is defined to calculate the semantic
similarity based on the information content. It is applied to GO terms first by Lord et
al. [35]. Resnik’s similarity is widely used in GO-based evaluation [36, 37, 38, 39, 40].
GOSemSim package [41] which is available through Bioconductor [42], contains im-
plementations of various GO-based measures including Resnik’s similarity.
Interaction network is another important source of information. There is a growing
number of known interactions with the contribution of recent work [43, 44, 45]. Pattin
and Moore provide a good review on the importance of interaction networks in genetic
research and state that knowledge on interaction networks complements the knowledge
on genome and the use of these two sources of information together can provide an
in-depth understanding of biological phenomena such as diseases [46]. As stated by
Marco and Marin, Gene Ontology and interaction networks are mostly correlated;
however, there are cases in which these two show significant differences [47].
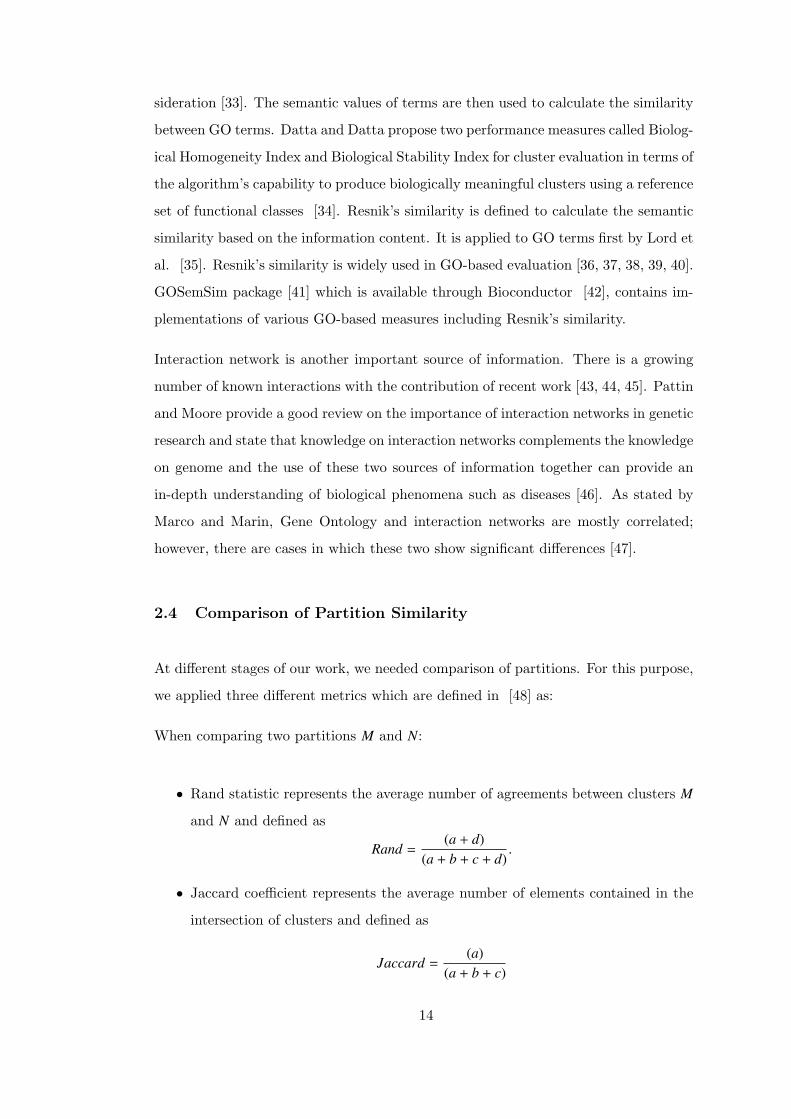
2.4 Comparison of Partition Similarity
At different stages of our work, we needed comparison of partitions. For this purpose,
we applied three different metrics which are defined in [48] as:
When comparing two partitions M and N:
• Rand statistic represents the average number of agreements between clusters M
and N and defined as
Rand =(a + d)
(a + b + c + d).
• Jaccard coefficient represents the average number of elements contained in the
intersection of clusters and defined as
Jaccard =(a)
(a + b + c)
14
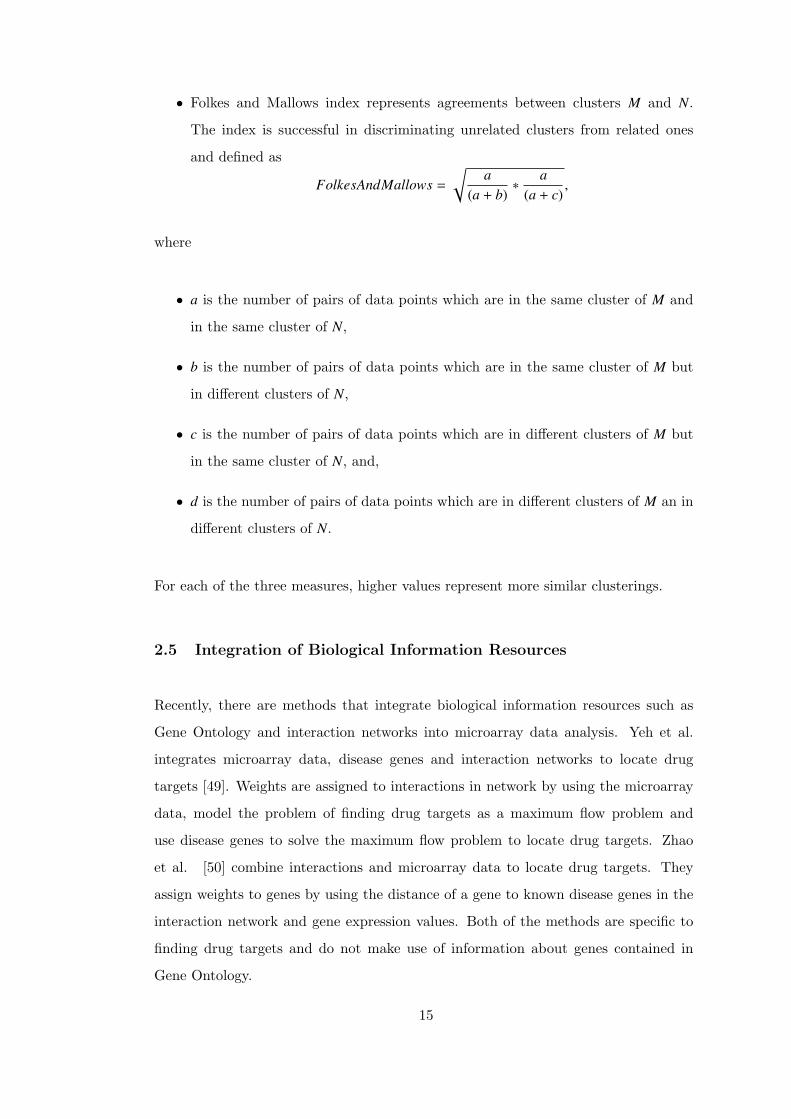
• Folkes and Mallows index represents agreements between clusters M and N.
The index is successful in discriminating unrelated clusters from related ones
and defined as
FolkesAndMallows =√
a(a + b)
∗a
(a + c),
where
• a is the number of pairs of data points which are in the same cluster of M and
in the same cluster of N,
• b is the number of pairs of data points which are in the same cluster of M but
in different clusters of N,
• c is the number of pairs of data points which are in different clusters of M but
in the same cluster of N, and,
• d is the number of pairs of data points which are in different clusters of M an in
different clusters of N.
For each of the three measures, higher values represent more similar clusterings.
2.5 Integration of Biological Information Resources
Recently, there are methods that integrate biological information resources such as
Gene Ontology and interaction networks into microarray data analysis. Yeh et al.
integrates microarray data, disease genes and interaction networks to locate drug
targets [49]. Weights are assigned to interactions in network by using the microarray
data, model the problem of finding drug targets as a maximum flow problem and
use disease genes to solve the maximum flow problem to locate drug targets. Zhao
et al. [50] combine interactions and microarray data to locate drug targets. They
assign weights to genes by using the distance of a gene to known disease genes in the
interaction network and gene expression values. Both of the methods are specific to
finding drug targets and do not make use of information about genes contained in
Gene Ontology.
15
Lee et al. [51] incorporate microarray and interaction data to construct a subnet-
work of abnormally expressed genes in postmortem brain samples of schizophrenia,
bipolar disorder, and major depression patients. After constructing the subnetwork,
they analyzed abnormally expressed genes by using topological features of the subnet-
work and with several enrichment tools. The study does not provide an automated
methodology to incorporate microarrays and interaction networks, however, it clearly
shows the significance of incorporating microarrays and interaction networks.
Smoot et al. [52] incorporate Gene Ontology and interaction networks to visualize
the subnetworks that are enriched by the input GO terms. Although it provides users
to visually analyze the subnetwork to locate candidate genes, they do not make use
of microarray data in their study.
From these examples, we can clearly say that the integration of biological information
sources enables us to reveal previously unknown biological infomation. We need meth-
ods such as the Cluster-Eliminate-Combine that we propose in our study to automate
this integration and analysis.
16
CHAPTER 3
INTERACTION BASED HOMOGENEITY
The number of known interactions is growing significantly thanks to the current re-
search. In order to incorporate the interaction information source in the analysis of
microarrays, we should apply measures based on interaction networks. In this chapter,
we describe Interaction Based Homogeneity (IBH) which is a measure to evaluate the
relation of the gene lists with respect to a known interaction network.
3.1 Homogeneity
Homogeneity is widely used to evaluate similarity of gene lists, especially in the eval-
uation of clustering results [53, 54, 55, 1, 34]. Assume that we have a gene list
L = {g1, g2, ..., gn} of size n. By using the similarity measure S (gi, g j) of two genes
gi and g j, the homogeneity of list L is defined as follows:
Homogeneity(L) =
∑ni=1∑n
j=1 S (gi, g j)
n2 .
.
Here, homogeneity is defined as the average of the similarities between each element in
the list. Homogeneity ranges from 0 to 1; 0 meaning that genes in list are not similar
and 1 meaning that all genes in list are similar.
17
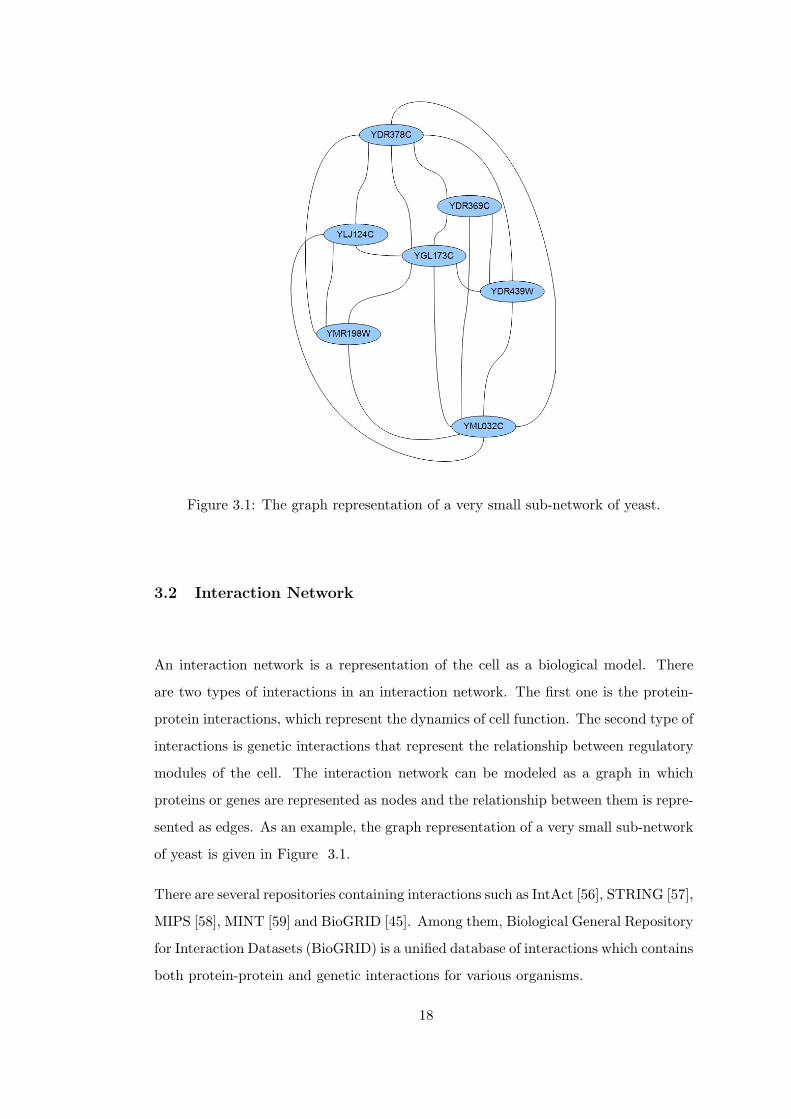
Figure 3.1: The graph representation of a very small sub-network of yeast.
3.2 Interaction Network
An interaction network is a representation of the cell as a biological model. There
are two types of interactions in an interaction network. The first one is the protein-
protein interactions, which represent the dynamics of cell function. The second type of
interactions is genetic interactions that represent the relationship between regulatory
modules of the cell. The interaction network can be modeled as a graph in which
proteins or genes are represented as nodes and the relationship between them is repre-
sented as edges. As an example, the graph representation of a very small sub-network
of yeast is given in Figure 3.1.
There are several repositories containing interactions such as IntAct [56], STRING [57],
MIPS [58], MINT [59] and BioGRID [45]. Among them, Biological General Repository
for Interaction Datasets (BioGRID) is a unified database of interactions which contains
both protein-protein and genetic interactions for various organisms.
18

Table 3.1: Adjacency matrix of the graph in Figure 3.1.
YDR378C YDR369C YDR439W YLJ124C YGL173C YML032C YMR198WYDR378C 0 1 1 1 1 1 1YDR369C 1 0 1 0 1 1 0YDR439W 1 1 0 0 1 1 0YLJ124C 1 0 0 0 1 1 1YGL173C 1 1 1 1 0 1 1YML032C 1 1 1 1 1 0 1YMR198W 1 0 0 1 1 1 0
3.3 Interaction Based Homogeneity
Given a gene list L of n genes and a network E, we first form an adjacency matrix
A whose rows and columns are genes in L where Ai j = 1 if genes i and j have an
interaction in the E and Ai j = 0 otherwise. Interaction Based Homogeneity for a gene
list L = {g1, g2, ..., gn} with respect to a network E is then calculated as follows:
IBHE(L) =
∑ni=1∑n
j=1 Ai j
n2 .
.
As an example, the adjacency matrix for the sub-network in Figure 3.1 is given in
Table 3.1. IBH for the gene list
Lexample = {YDR369C,YDR378C,YDR439W,Y JL124C,YGL173C,Y ML032C,Y MR198W}
is
IBH(Lexample) = 0.694.
3.3.1 Relationship with Other Network-Based Measures
There are a numerous number of measures based on interaction network. The degree
of a gene g on an interaction network E of n nodes that has the adjacency matrix A is
defined as:
DE(g) =n∑
i=1
Agi.
19
The interaction based homogeneity is equal to the normalized average degree of genes
in a gene list L on the interaction network E:
IBHE(L) =∑n
i=1 DE(L(i))n2 .
There is also a popular measure called clustering coefficient that is defined as the
normalized number of edges (interactions) between the neighbors of a node. In other
words, the clustering coefficient of a gene g given an interaction network represents the
number of interactions between genes interacting with g. The clustering coefficient of
a gene g given an interaction network E of n nodes that has the adjacency matrix A
is defined as:CE(g) =
∑ni=1∑n
j=1 AgiAg jAi j
kg ∗ (kg − 1),
where kg is the number of genes interacting with gene g and calculated as:
kg =
n∑i=1
Agi.
Both of the IBH and clustering coefficient measure the connectedness of the interac-
tion network. When the interaction network is fully connected, the interaction based
homogeneity and clustering coefficient are equal.
3.4 Comparison
To evaluate the performance of Interaction Based Homogeneity, we compared it with
four different enrichment methods. First two methods are GO-based homogeneities
calculated by two different popular similarity measures: Resnik’s similarity and Wang’s
similarity. The third one is DAVID (Database for Annotation, Visualization and In-
tegrated Discovery) Gene Functional Classification method which uses an integrated
biological knowledge base to extract biological meaning from gene lists [60, 61]. The
last method is a KEGG-based domainSignatures enrichment method proposed by
Hahne et al. [62].
For GO-based enrichment, we downloaded a recent snapshot of GO database [32].
We eliminated ’IEA’ annotations which means that the annotation is inferred from
electronic annotation. The number of non-IEA annotations for each of the selected
20
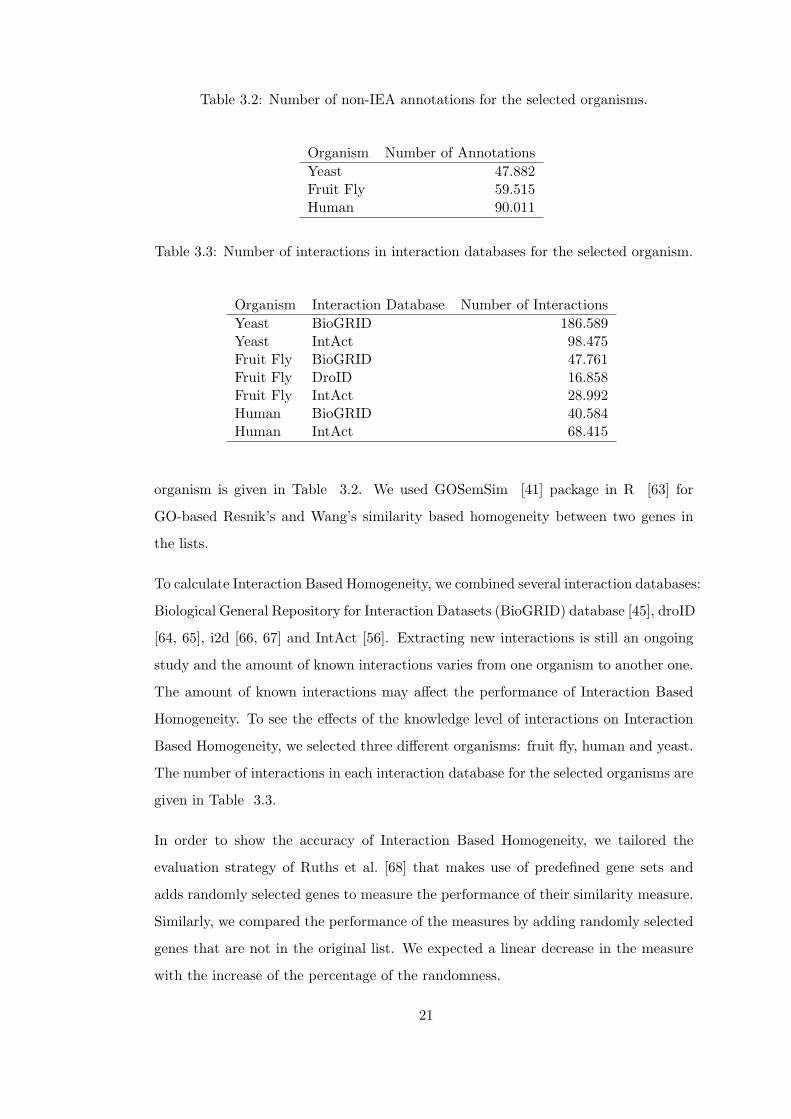
Table 3.2: Number of non-IEA annotations for the selected organisms.
Organism Number of AnnotationsYeast 47.882Fruit Fly 59.515Human 90.011
Table 3.3: Number of interactions in interaction databases for the selected organism.
Organism Interaction Database Number of InteractionsYeast BioGRID 186.589Yeast IntAct 98.475Fruit Fly BioGRID 47.761Fruit Fly DroID 16.858Fruit Fly IntAct 28.992Human BioGRID 40.584Human IntAct 68.415
organism is given in Table 3.2. We used GOSemSim [41] package in R [63] for
GO-based Resnik’s and Wang’s similarity based homogeneity between two genes in
the lists.
To calculate Interaction Based Homogeneity, we combined several interaction databases:
Biological General Repository for Interaction Datasets (BioGRID) database [45], droID
[64, 65], i2d [66, 67] and IntAct [56]. Extracting new interactions is still an ongoing
study and the amount of known interactions varies from one organism to another one.
The amount of known interactions may affect the performance of Interaction Based
Homogeneity. To see the effects of the knowledge level of interactions on Interaction
Based Homogeneity, we selected three different organisms: fruit fly, human and yeast.
The number of interactions in each interaction database for the selected organisms are
given in Table 3.3.
In order to show the accuracy of Interaction Based Homogeneity, we tailored the
evaluation strategy of Ruths et al. [68] that makes use of predefined gene sets and
adds randomly selected genes to measure the performance of their similarity measure.
Similarly, we compared the performance of the measures by adding randomly selected
genes that are not in the original list. We expected a linear decrease in the measure
with the increase of the percentage of the randomness.
21
In the last section of the comparison, we ranked a microarray data with Interaction
Based Homogeneity and apply Gene Set Enrichment Analysis to the ranked list.
3.4.1 Gene Ontology (GO)
Gene Ontology is a database of hierarchical annotations of genes, gene products and
sequences and it is organized as three non-overlapping ontologies. Molecular Function
(MF) ontology describes activities at the molecular level while Biological Process (BP)
ontology describes biological goals. The last ontology is the Cellular Component (CC)
ontology describing locations of genes and gene products. There are evidence codes for
each of the annotation that describes the method by which the annotation is extracted.
3.4.2 Homogeneity Based on GO Based Resnik’s Similarity
Resnik defined semantic similarity between terms by using the concept of information
content [69]; less frequent terms are accepted as more informative GO terms. For each
GO term t, the frequency of the term f requency(t) can be calculated as follows:
f requency(t) = annotations(t) +∑
c∈children(t)
f requency(c),
where annotations(t) is the number of gene products annotated by t and children(t) is
the set of child terms of t.
The information content is the probability p(t) of the term t which is calculated as
follows:
p(t) =f requency(t)
f requency(root).
Resnik’s semantic similarity between two terms t1 and t2 is then defined as given below.
S Resnik(t1, t2) = maxt∈A(t1,t2)(− log p(t)),
where A(t1, t2) is the set of common ancestors of t1 and t2.
22

The similarity between two genes g1 and g2 is defined as the maximum Resnik’s
similarity between terms annotated by g1 and g2:
S maxResnik(g1, g2) = maxS Resnik(t1 ,t2) , t1 ∈ T (g1), t2 ∈ T (g2),
where T (gi) is the set of terms annotated by gi.
Finally, GO Based Resnik’s Homogeneity (GBRH) for a gene list L = {g1, g2, ..., gn} of
size n is defined as follows:
GBRH(L) =
∑ni=1∑n
j=1 S maxResnik(gi, g j)
n2 .
3.4.3 Homogeneity Based on GO Based Wang’s Similarity
Wang et al. defined the semantic similarity between GO terms [33]. A GO term A
can be represented as a directed acyclic graph GA = {A,TA, EA} where TA = A⋃
P(A),
P(A) is the set of ancestors of A in GA, and EA are the edges connecting the terms in
GA. There are two types of edges: “is a” edge and “part of” edge. For any term t ∈ TA,
S A(t) is defined as follows:
S A(A) = 1
SA(t) = max{we ∗ S A(t′)|t′ ∈ C(t)i f (t , A)},
where C(t) is the set of children of term t, we is the semantic contribution factor for
edge e, 0 < we < 1, which depends on the type of the edge. The semantic value of GO
term A, S V(A) is defined as follows:
S V(A) =∑t∈TA
S A(t).
and the semantic similarity between GO terms A and B, S GO(A, B) is defined as follows:
23
S Wang(A, B) =
∑t∈TA
⋃TB
S A(t) + S B(t)
S V(A) + S V(B).
The similarity between two genes g1 and g2 is defined as the maximum Wang’s simi-
larity between terms annotated by g1 and g2.
S maxWang(g1, g2) = maxS Wang(t1 ,t2) , t1 ∈ T (g1), t2 ∈ T (g2),
where T (gi) is the set of terms annotated by gi.
Finally, GO Based Wang Homogeneity (GBWH) for a gene list L = {g1, g2, ..., gn} of
size n is defined as follows:
GBWH(L) =
∑ni=1∑n
j=1 S maxWang(gi, g j)
n2 .
3.4.4 David Gene Functional Classification
David Functional Classification Tool uses 14 functional annotation sources to create
similarity matrix between genes. Genes are clustered using this matrix by a heuristic
fuzzy partition algorithm to group genes into functionally related clusters. For the
comparison, we take the highest Enrichment Score of the found clusters.
3.4.5 KEGG Based DomainSignatures Method
Hahne et al. [62] proposed a method to assign lists of genes to previously described
functional gene collections or pathways by comparing InterPro domain signatures of
the candidate gene lists with domain signatures of gene sets derived from KEGG path-
ways. For the comparison, we take the maximum similarity in the pathway similarity
matrix.
24
3.4.6 Comparison on Lists of Highly Interacting Genes
We created a 25 gene lists for each of the three organisms so that the lists contain
highly interacting genes.
We first calculated the degree of each gene in the interaction network. Then, the first
25 genes with the highest degrees were selected as prototype genes. The lists were
created from the prototype genes by adding genes interacting with prototype gene to
the list.
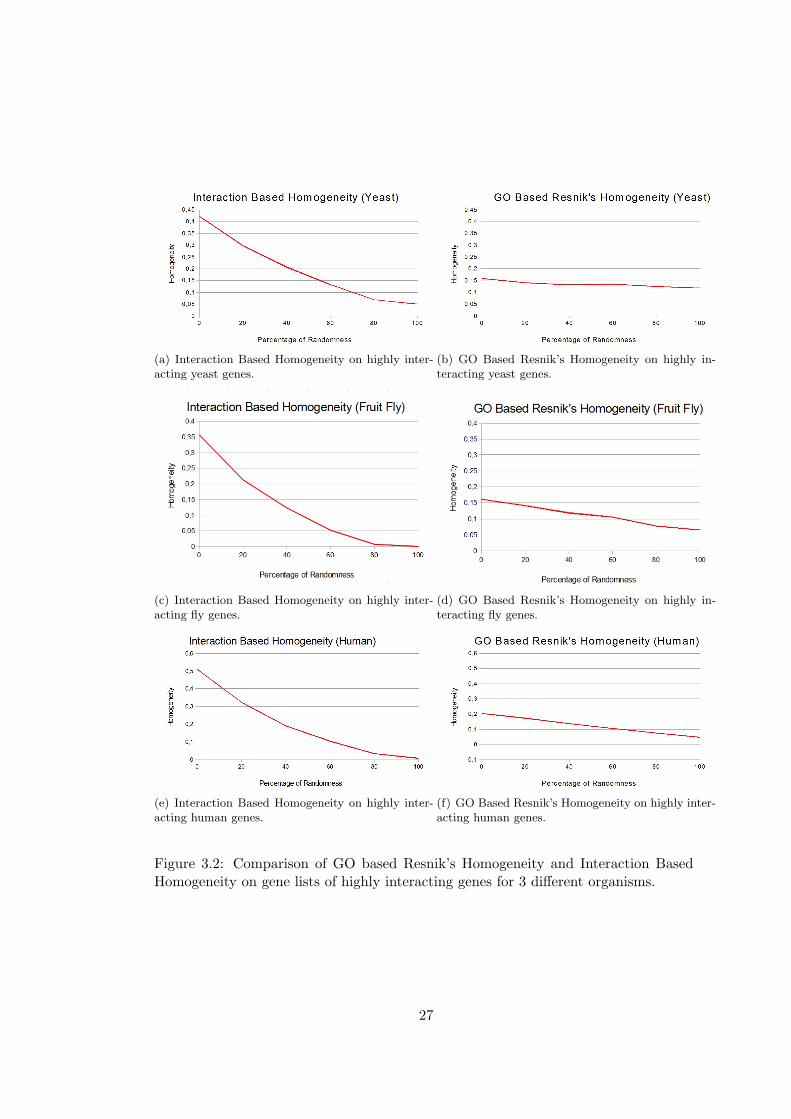
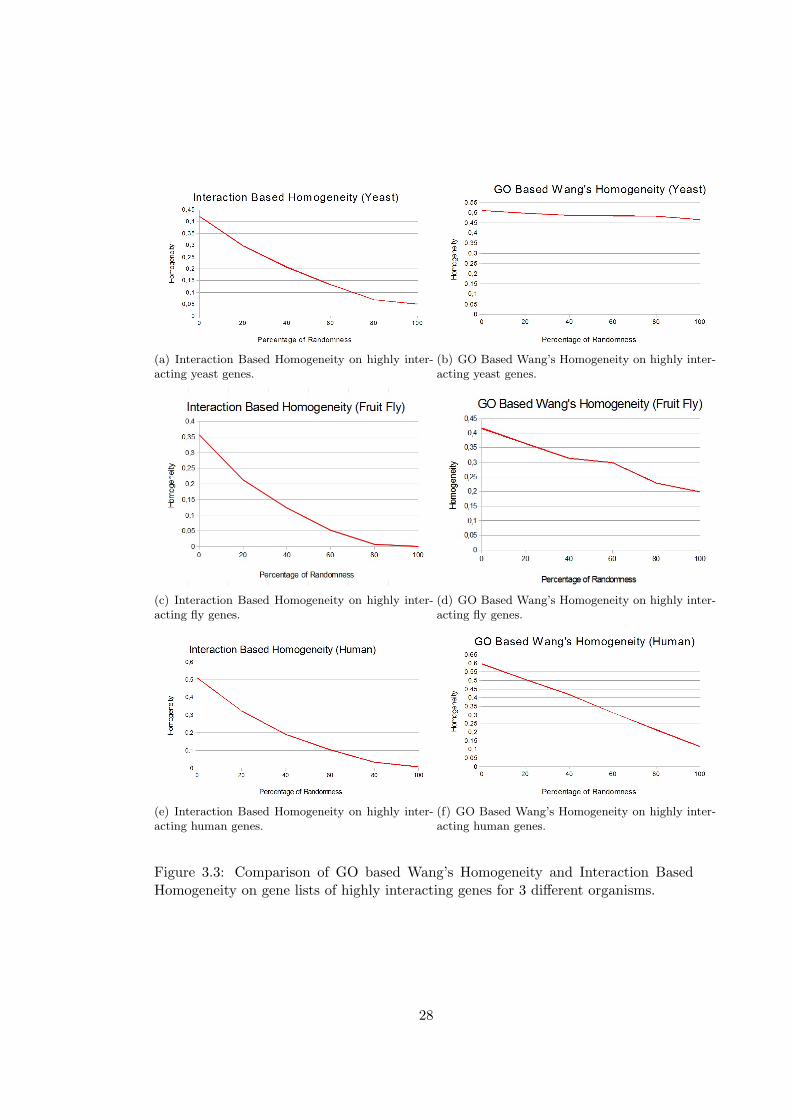
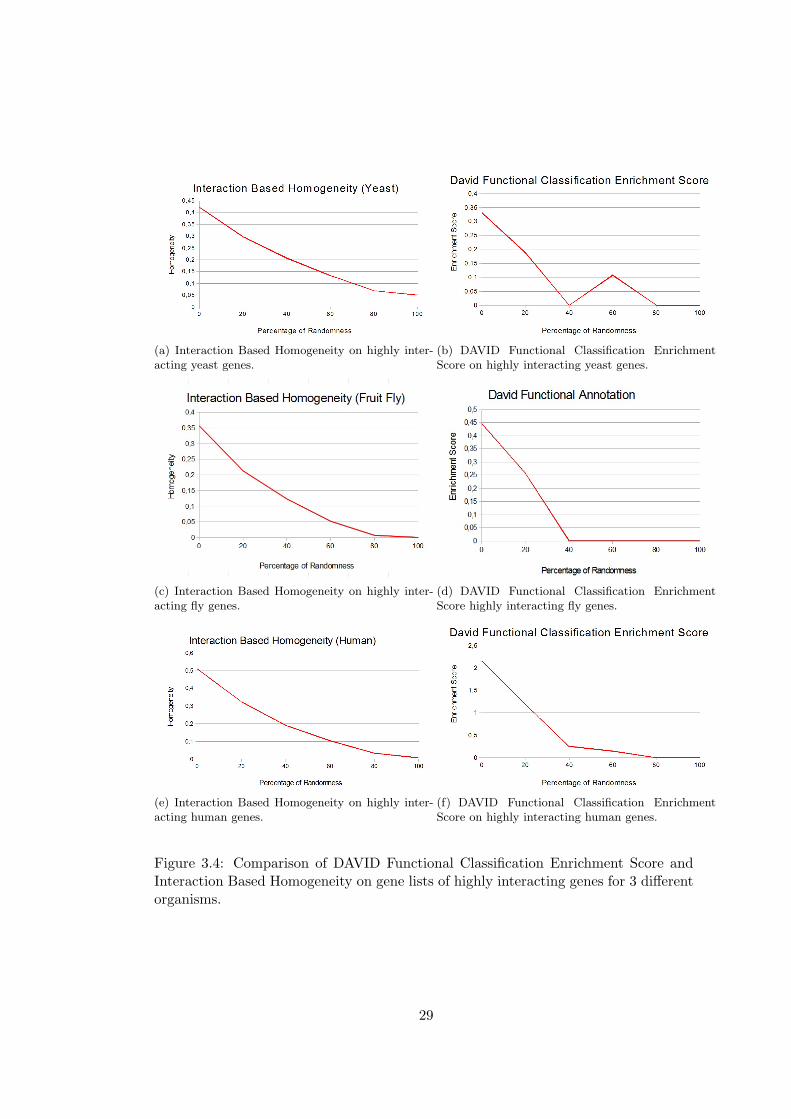
The results of the comparison of Interaction Based Homogeneity on lists of highly inter-
acting genes with GO Based Resnik’s Homogeneity, GO Based Wang’s Homogeneity,
David Gene Functional Classification and domainSignatures are given in Figure 3.2,
Figure 3.3, Figure 3.4 and Figure 3.5 respectively.
In the comparisons with David Gene Functional Classification, over 25 gene lists, 23 of
them have 0 enrichment score in yeast, only two of the lists have non zero enrichment
score. For fruit fly 3 gene lists and for human 9 gene lists have non zero enrichment
scores.
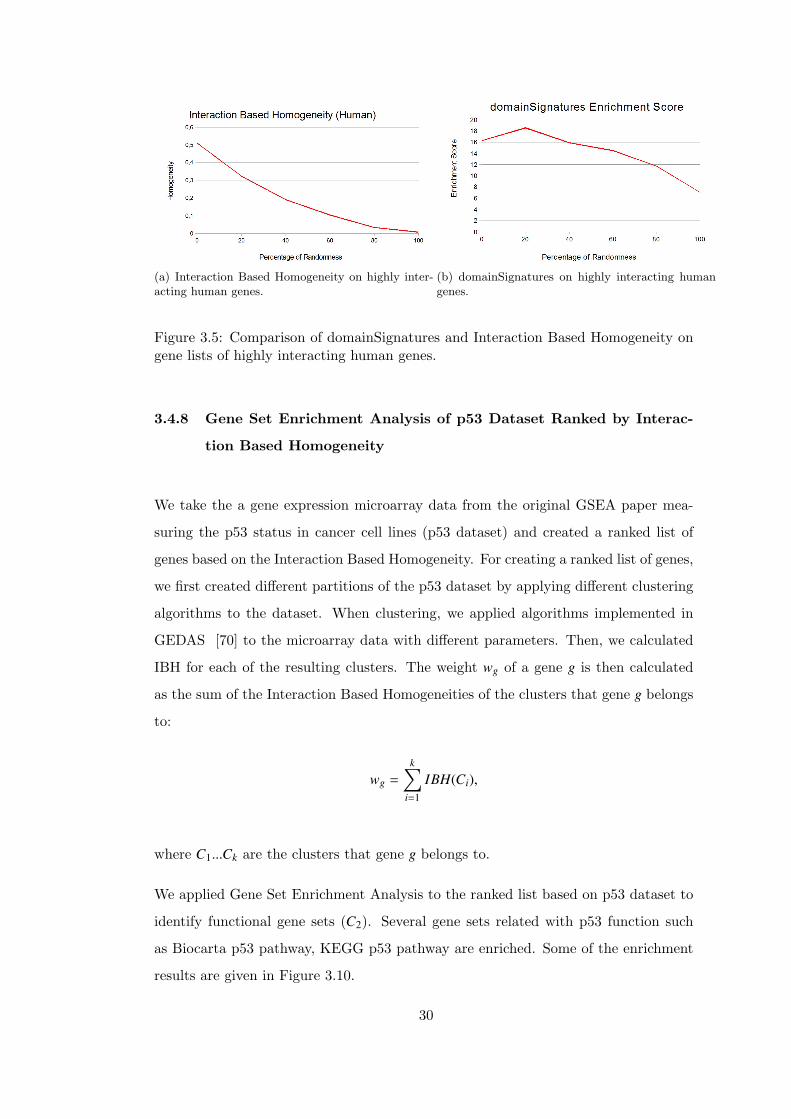
Similar results are found in the comparison of domainSignatures, all of the gene lists
have zero similarity scores in the case of yeast and fruit fly, for this reason only results
for human are given in the figure. In the human gene lists, 3 lists have zero enrichment
scores.
We can observe from the results that Interaction Based Homogeneity describes the
gene lists better than GO-based measures especially when the number of known inter-
actions is high. With the increased level of randomness, there is only a slight decrease
in GO-based measures which indicates that genes in the lists are not evaluated as sim-
ilar and that totally random lists also has non-zero homogeneity values.Similar results
can be observed in the David and domainSignature comparisons, and in these cases
we can not find any enrichment for most of the highly interacting gene lists. There is
an unexpected increase in David’s enrichment score for yeast gene lists with 40% to
60% randomness. And for fruit fly, it gives zero enrichment for all of the gene lists
that have more than 40% randomness. In domainSignature method, an unexpected
25
increase in similarity is observed for gene lists with 20% randomness. On the other
hand, Interaction Based Homogeneity starts with higher values of homogeneity and
homogeneity goes to nearly zero with the increased randomness.
3.4.7 Comparison on Lists That Are Similar According to Gene Ontology
We created gene lists in which GO-based measures would perform well. We created
25 gene lists for each of the organism by following the strategy of Ruth et al. [68].
We first chose 25 prototype genes for each organism which have highest number of
GO annotations. The lists were then created by adding genes that shared more than
7 GO terms with the lists of prototype genes. Finally, we have gene lists which had
different number of total GO terms but all of the genes in the list shared at least 7
GO terms with the prototype gene. The results of the evaluation of Interaction Based
Homogeneity on lists containing similar genes according to Gene Ontology with GO
Based Resnik’s Homogeneity, GO Based Wang’s Homogeneity, David Gene Functional
Classification and domainSignatures are given in Figure 3.6, Figure 3.7, Figure 3.8 and
Figure 3.9 respectively.
In the comparison of David Gene Functional Classification enrichment scores with
IBH on lists similar according to GO, we see that 4 lists have zero enrichment scores
for yeast and 5 for human. In this case, for yeast there are no gene lists that have
zero enrichment scores. The domainSignatures method yields zero similarity score for
8 gene lists.
As expected, GO Based Homogeneity measures performs better in this case than in the
case of highly interacting genes. Interaction Based Homogeneity performs well in this
case, too. More interestingly, Interaction Based Homogeneity performs better than GO
Based Resnik’s and Wang’s Homogeneities in gene lists of yeast, an organism for which
lots of interactions are known. This surprising result indicates that the performance
of Interaction Based Homogeneity will increase in parallel with the number of known
interactions. David Gene Functional Classification gives better results for gene lists
similar according to GO, however it cannot discriminate gene lists with 80% and 100%
randomness in yeast and fruit fly. In domainSignature method, an unexpected increase
in similarity is observed for gene lists with 20% randomness.
26
(a) Interaction Based Homogeneity on highly inter-acting yeast genes.
(b) GO Based Resnik’s Homogeneity on highly in-teracting yeast genes.
(c) Interaction Based Homogeneity on highly inter-acting fly genes.
(d) GO Based Resnik’s Homogeneity on highly in-teracting fly genes.
(e) Interaction Based Homogeneity on highly inter-acting human genes.
(f) GO Based Resnik’s Homogeneity on highly inter-acting human genes.
Figure 3.2: Comparison of GO based Resnik’s Homogeneity and Interaction BasedHomogeneity on gene lists of highly interacting genes for 3 different organisms.
27
(a) Interaction Based Homogeneity on highly inter-acting yeast genes.
(b) GO Based Wang’s Homogeneity on highly inter-acting yeast genes.
(c) Interaction Based Homogeneity on highly inter-acting fly genes.
(d) GO Based Wang’s Homogeneity on highly inter-acting fly genes.
(e) Interaction Based Homogeneity on highly inter-acting human genes.
(f) GO Based Wang’s Homogeneity on highly inter-acting human genes.
Figure 3.3: Comparison of GO based Wang’s Homogeneity and Interaction BasedHomogeneity on gene lists of highly interacting genes for 3 different organisms.
28
(a) Interaction Based Homogeneity on highly inter-acting yeast genes.
(b) DAVID Functional Classification EnrichmentScore on highly interacting yeast genes.
(c) Interaction Based Homogeneity on highly inter-acting fly genes.
(d) DAVID Functional Classification EnrichmentScore highly interacting fly genes.
(e) Interaction Based Homogeneity on highly inter-acting human genes.
(f) DAVID Functional Classification EnrichmentScore on highly interacting human genes.
Figure 3.4: Comparison of DAVID Functional Classification Enrichment Score andInteraction Based Homogeneity on gene lists of highly interacting genes for 3 differentorganisms.
29
(a) Interaction Based Homogeneity on highly inter-acting human genes.
(b) domainSignatures on highly interacting humangenes.
Figure 3.5: Comparison of domainSignatures and Interaction Based Homogeneity ongene lists of highly interacting human genes.
3.4.8 Gene Set Enrichment Analysis of p53 Dataset Ranked by Interac-
tion Based Homogeneity
We take the a gene expression microarray data from the original GSEA paper mea-
suring the p53 status in cancer cell lines (p53 dataset) and created a ranked list of
genes based on the Interaction Based Homogeneity. For creating a ranked list of genes,
we first created different partitions of the p53 dataset by applying different clustering
algorithms to the dataset. When clustering, we applied algorithms implemented in
GEDAS [70] to the microarray data with different parameters. Then, we calculated
IBH for each of the resulting clusters. The weight wg of a gene g is then calculated
as the sum of the Interaction Based Homogeneities of the clusters that gene g belongs
to:
wg =
k∑i=1
IBH(Ci),
where C1...Ck are the clusters that gene g belongs to.
We applied Gene Set Enrichment Analysis to the ranked list based on p53 dataset to
identify functional gene sets (C2). Several gene sets related with p53 function such
as Biocarta p53 pathway, KEGG p53 pathway are enriched. Some of the enrichment
results are given in Figure 3.10.
30
(a) Interaction Based Homogeneity on yeast genessimilar according to Gene Ontology.
(b) GO Based Resnik’s Homogeneity on yeast genessimilar according to Gene Ontology.
(c) Interaction Based Homogeneity on fly genes sim-ilar according to Gene Ontology.
(d) GO Based Resnik’s Homogeneity on fly genessimilar according to Gene Ontology.
(e) Interaction Based Homogeneity on human genessimilar according to Gene Ontology.
(f) GO Based Resnik’s Homogeneity on human genessimilar according to Gene Ontology.
Figure 3.6: Comparison of GO based Resnik’s Homogeneity and Interaction BasedHomogeneity on gene lists similar according to Gene Ontology for 3 different organ-isms.
31
(a) Interaction Based Homogeneity on yeast genessimilar according to Gene Ontology.
(b) GO Based Wang’s Homogeneity on yeast genessimilar according to Gene Ontology.
(c) Interaction Based Homogeneity on fly genes sim-ilar according to Gene Ontology.
(d) GO Based Wang’s Homogeneity on fly genes sim-ilar according to Gene Ontology.
(e) Interaction Based Homogeneity on human genessimilar according to Gene Ontology.
(f) GO Based Wang’s Homogeneity on human genessimilar according to Gene Ontology.
Figure 3.7: Comparison of GO based Wang’s Homogeneity and Interaction Based Ho-mogeneity on gene lists similar according to Gene Ontology for 3 different organisms.
32
(a) Interaction Based Homogeneity on yeast genessimilar according to Gene Ontology.
(b) DAVID Functional Classification EnrichmentScore on yeast genes similar according to Gene On-tology.
(c) Interaction Based Homogeneity on fly genes sim-ilar according to Gene Ontology.
(d) DAVID Functional Classification EnrichmentScore on fly genes similar according to Gene Ontol-ogy.
(e) Interaction Based Homogeneity on human genessimilar according to Gene Ontology.
(f) DAVID Functional Classification EnrichmentScore on human genes similar according to Gene On-tology.
Figure 3.8: Comparison of DAVID Functional Classification Enrichment Score andInteraction Based Homogeneity on gene lists similar according to Gene Ontology for3 different organisms.
33
(a) Interaction Based Homogeneity on human genessimilar according to Gene Ontology.
(b) domainSignatures on human genes similar ac-cording to Gene Ontology.
Figure 3.9: Comparison of domainSignatures and Interaction Based Homogeneity ongene lists similar according to Gene Ontology for human genes.
3.5 Results and Discussion on IBH
We compared IBH with four different enrichment methods in two different cases: two
GO based measure which employs popular Resnik’s distance and Wang’s distance,
David annotation method and a KEGG-based enrichment method using domain sig-
natures. We proved the effectiveness of the Interaction Based Homogeneity measure in
two different cases in which the measure’s ability to distinguish related lists from ran-
dom lists and to measure the randomness is presented. In the first case, we compared
results for 75 gene lists of highly interacting genes. The results show that Interaction
Based Homogeneity is especially more useful in detecting highly interacting gene lists
than GO-based measure. In the second case, 75 gene lists which are similar according
to GO is used. Interaction Based Homogeneity also performs well in the comparison
of lists that are similar according to Gene Ontology. We also create an R package
called ibh implementing Interaction Based Homogeneity in different cases. It is ac-
cepted to Bioconductor [42] and freely available. Details of the package can be found
in Appendix A.
34
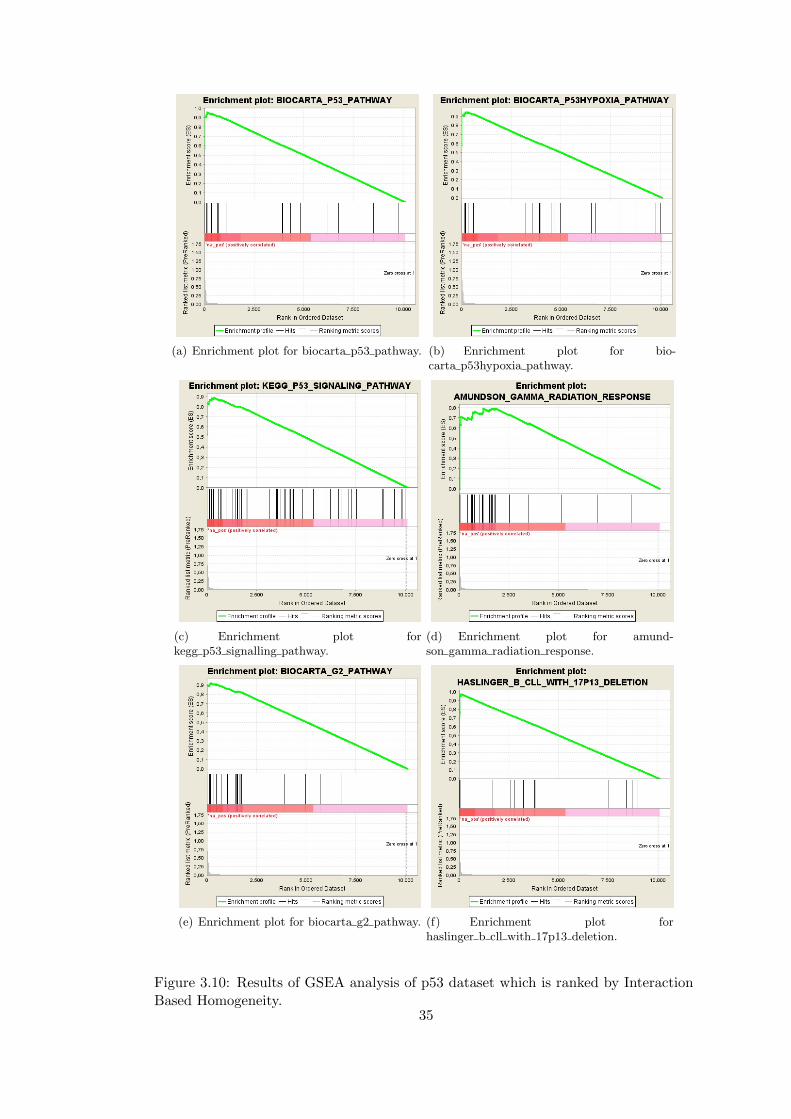
(a) Enrichment plot for biocarta p53 pathway. (b) Enrichment plot for bio-carta p53hypoxia pathway.
(c) Enrichment plot forkegg p53 signalling pathway.
(d) Enrichment plot for amund-son gamma radiation response.
(e) Enrichment plot for biocarta g2 pathway. (f) Enrichment plot forhaslinger b cll with 17p13 deletion.
Figure 3.10: Results of GSEA analysis of p53 dataset which is ranked by InteractionBased Homogeneity.
35
CHAPTER 4
CLUSTER-ELIMINATE-COMBINE METHOD
In this chapter, we describe Cluster-Eliminate-Combine (CEC) method that take as
input an interaction network, a list of GO terms representing the functional class of
the genes that are of the interest and a set of partitions of microarray data and give
as output a clustering result containing only genes that are related with the biolog-
ical process under inspection. CEC method is mainly based on clustering ensembles
method described in Section 2.2. Several improvements are made to the clustering
ensembles method as indicated below.
1. Instead of using every cluster in combination, a subset of clusters are selected
according to the relevance with the biological process of the experiment. The
relevance is measured by Interaction Based Homogeneity described in Chapter
3. Gene Ontology terms related with the experiment are provided to the method
as input to describe the biological process under inspection.
2. The selected clusters are cleaned up by applying a gene weight measure which
is calculated for each gene by using clusters and Interaction Based homogeneity.
3. The clustering ensembles method is finally applied to the selected and cleaned
clusters.
The outline and the algorithm of the proposed method is given in Figure 4.1 and
Algorithm 1 respectively. First, a subnetwork of the interaction network is constructed
by using the GO terms provided as input. The constructed interaction subnetwork
represents the relations that are more likely to be related according to the functional
36
class that are of the current interest. Second, Interaction Based Homogeneity of each
cluster is calculated by using this subnetwork. Third, for each gene, a gene weight is
calculated. The gene weight represents the importance of the gene according to the
experiments and the interaction subnetwork. As the next step, the genes that have
high weights are selected and the others are eliminated from the clusters. As the final
step, the remaining clusters are combined to achieve the final relationship information.
37
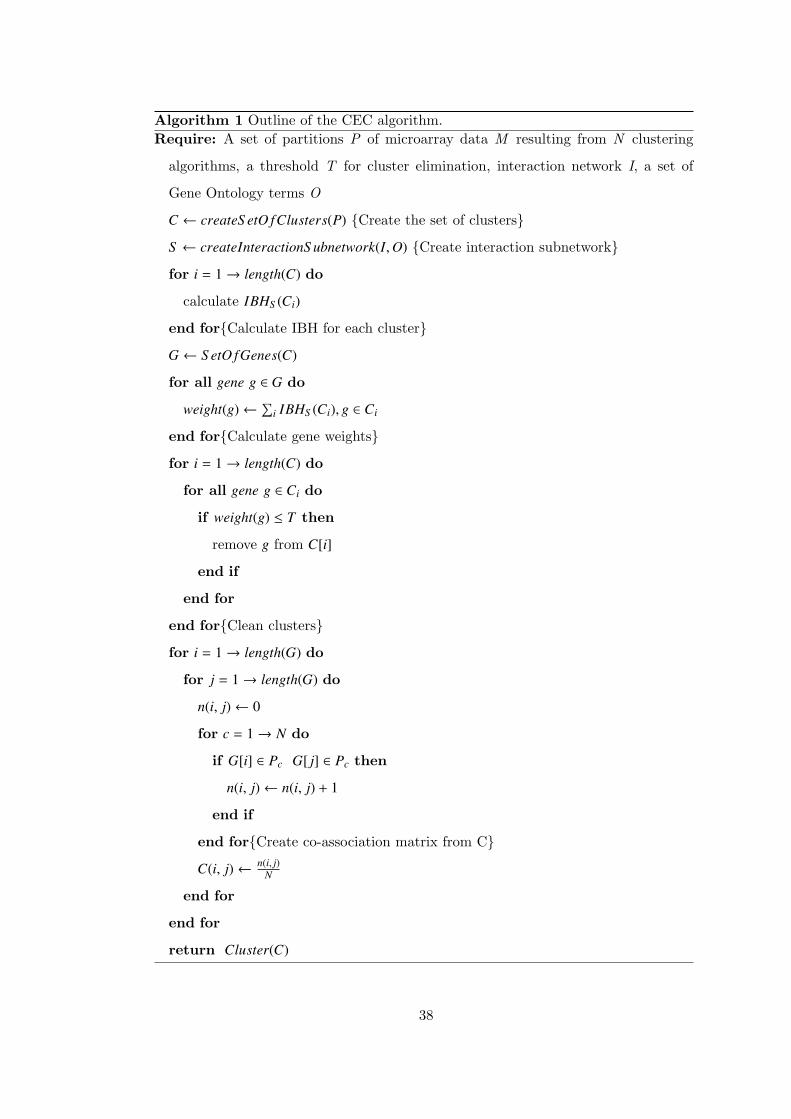
Algorithm 1 Outline of the CEC algorithm.Require: A set of partitions P of microarray data M resulting from N clustering
algorithms, a threshold T for cluster elimination, interaction network I, a set of
Gene Ontology terms O
C ← createS etO fClusters(P) {Create the set of clusters}
S ← createInteractionS ubnetwork(I,O) {Create interaction subnetwork}
for i = 1→ length(C) do
calculate IBHS (Ci)
end for{Calculate IBH for each cluster}
G ← S etO fGenes(C)
for all gene g ∈ G do
weight(g)←∑
i IBHS (Ci), g ∈ Ci
end for{Calculate gene weights}
for i = 1→ length(C) do
for all gene g ∈ Ci do
if weight(g) ≤ T then
remove g from C[i]
end if
end for
end for{Clean clusters}
for i = 1→ length(G) do
for j = 1→ length(G) do
n(i, j)← 0
for c = 1→ N do
if G[i] ∈ Pc G[ j] ∈ Pc then
n(i, j)← n(i, j) + 1
end if
end for{Create co-association matrix from C}
C(i, j)← n(i, j)N
end for
end for
return Cluster(C)
38
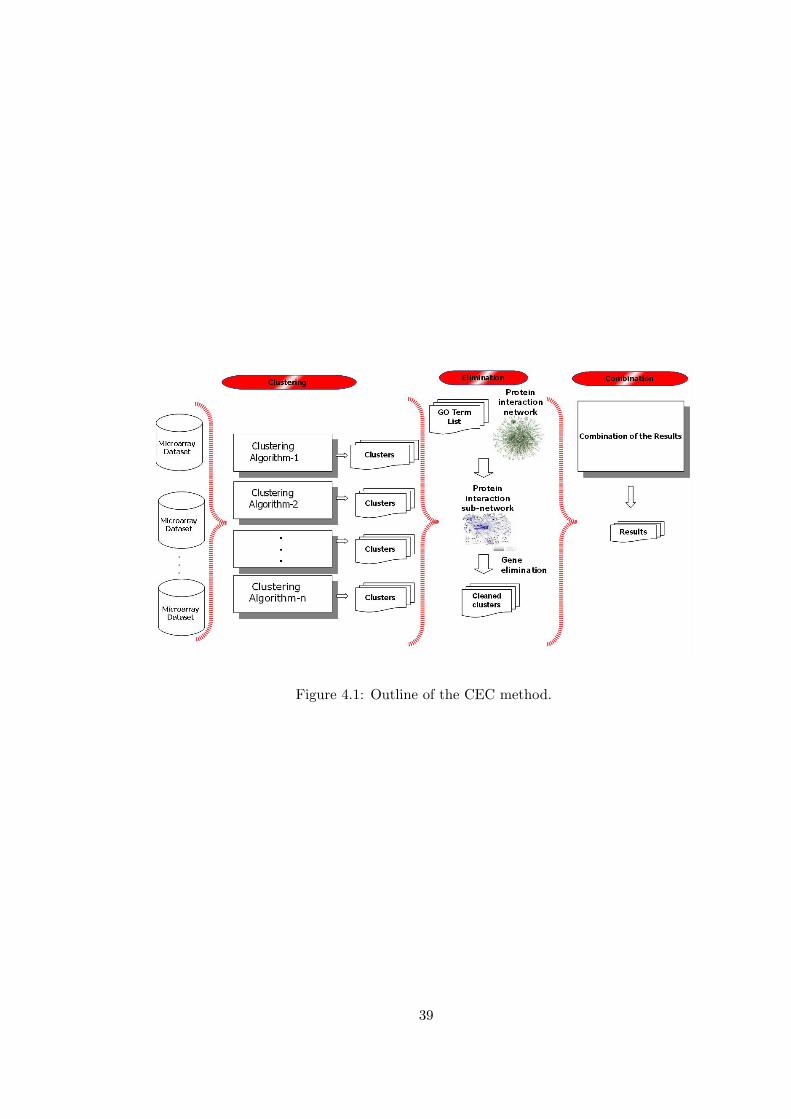
Figure 4.1: Outline of the CEC method.
39

4.1 Details of CEC Method
In the following sections, each step of the methodology are described in detail.
4.1.1 Interaction Subnetwork
An interaction network can be represented as a graph whose edges are genes. There is
an edge in the graph between nodes X and Y only if there is an interaction between
gene X and Y. Given an interaction network N and a set of GO terms G, an interaction
subnetwork S is created by eliminated edges (X, Y) such that both X and Y are not
annotated by GO terms contained in G.
4.1.2 Interaction Based Homogeneity
Interaction Based Homogeneity is described in detail in Chapter 3. Given a gene list
of n genes, we first form an adjacency matrix A whose rows and columns are genes in
the list where Ai j = 1 if genes i and j have an interaction in the network and Ai j = 0
otherwise. The Interaction Based Homogeneity for a gene list L = {g1, g2, ..., gn} of size
n is then calculated as
IBH(L) =
∑ni=1∑n
j=1 Ai j
n2 .
4.1.3 Calculating Gene Weights
The weight W(g) of a gene g is defined as the sum of weights of clusters that g belongs
to: W(g) =∑n
i=1∑
g∈Ci IBH(Ci)
4.1.4 Cleaning the Clusters
Before clustering combination, the clusters are cleaned by removing unnecessary genes
from the clusters. Genes that have weight smaller than a given threshold T are as-
sumed to be unrelated. That is, for each cluster Ci, a new cluster C′i is constructed
40

such that C′i = {g|g ∈ Ci and W(g) > T }.
4.1.5 Cluster Combination
The result of each method is used as a partition and the evidence accumulation method
is applied, the co-association value is calculated as the new similarity matrix. Evidence
accumulation method and co-association value are described in Section 2.2. Then,
a model based algorithm is used to cluster the genes with the new similarity matrix
to obtain the combined clusters. For the model based clustering, we used mclust
package [71].
4.2 Dataset
Gasch et al. [72] use DNA microarrays to measure changes in transcript levels over time
for almost every yeast gene and the dataset contains 5457 genes. The GDS36 dataset
that is provided in their study is a yeast heat shock dataset in which measurements
are taken at 5, 15, 30 and 90 minutes on a heat shock from 29°C to 33°C. There are 4
samples in the dataset. The log ratio values of the measurements are used. We used
the whole dataset as is in all of the analyses without performing a preprocessing step
for selecting differentially expressed genes.
4.3 Results of Cluster-Eliminate-Combine on GDS36 Dataset
For analyzing GDS36 dataset, in the clustering step, the dataset is clustered by five
algorithms to obtain different partitions. The algorithms used are CAGED, GEDAS,
NNN, STEM and TAC. The algorithms are described in detail in Section 2.1. Number
of clusters found in each partition is given in Table D. As can be seen from the table,
the number of clusters found varies from 1 to 50 and each partition contains different
numbers of genes ranging from 5 to 5457.
Then, we run the elimination step of the algorithm. Genes annotated with GO term
Response to Heat (GO:0009408) is selected as the gene list. There are 192 genes
annotated by this GO term with experimental evidence codes. The subnetwork of
41
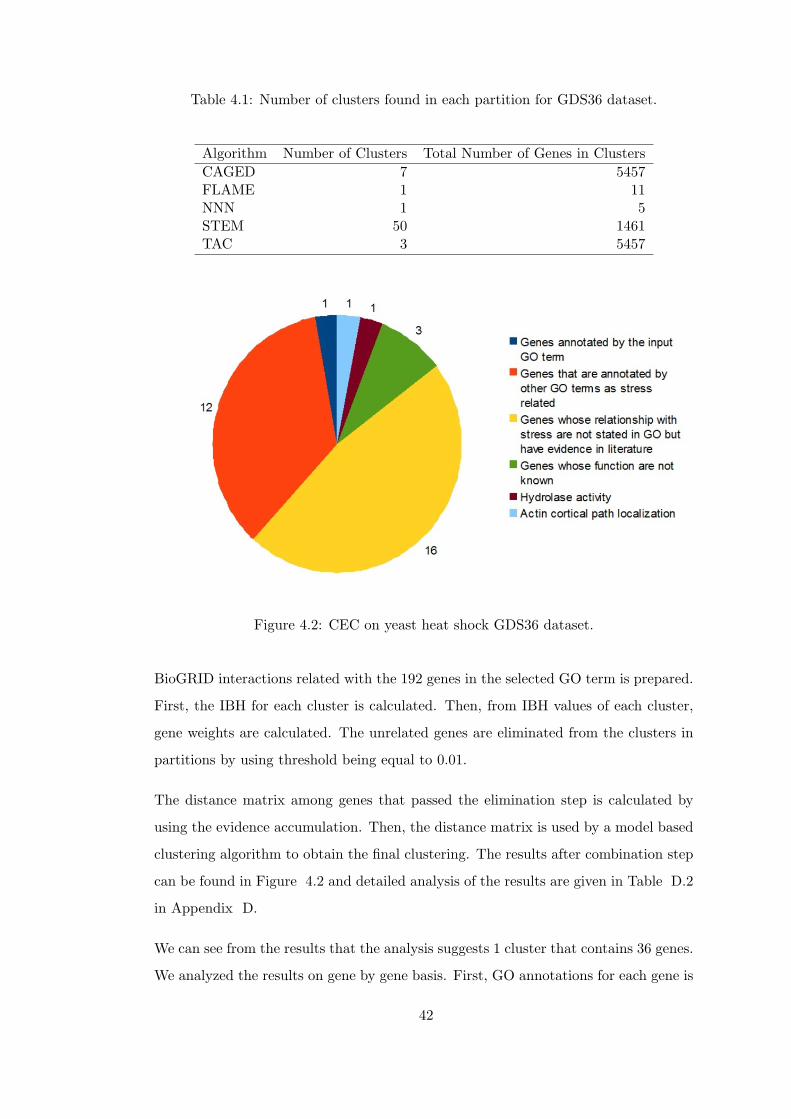
Table 4.1: Number of clusters found in each partition for GDS36 dataset.
Algorithm Number of Clusters Total Number of Genes in ClustersCAGED 7 5457FLAME 1 11NNN 1 5STEM 50 1461TAC 3 5457
Figure 4.2: CEC on yeast heat shock GDS36 dataset.
BioGRID interactions related with the 192 genes in the selected GO term is prepared.
First, the IBH for each cluster is calculated. Then, from IBH values of each cluster,
gene weights are calculated. The unrelated genes are eliminated from the clusters in
partitions by using threshold being equal to 0.01.
The distance matrix among genes that passed the elimination step is calculated by
using the evidence accumulation. Then, the distance matrix is used by a model based
clustering algorithm to obtain the final clustering. The results after combination step
can be found in Figure 4.2 and detailed analysis of the results are given in Table D.2
in Appendix D.
We can see from the results that the analysis suggests 1 cluster that contains 36 genes.
We analyzed the results on gene by gene basis. First, GO annotations for each gene is
42
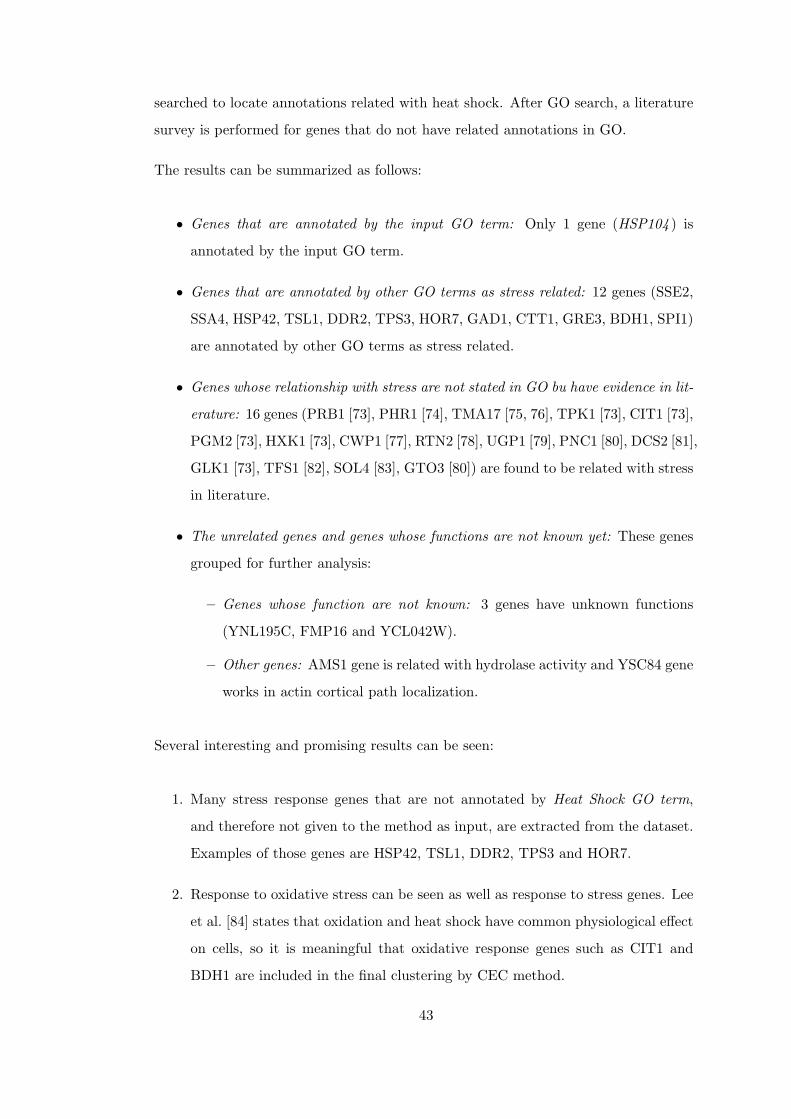
searched to locate annotations related with heat shock. After GO search, a literature
survey is performed for genes that do not have related annotations in GO.
The results can be summarized as follows:
• Genes that are annotated by the input GO term: Only 1 gene (HSP104 ) is
annotated by the input GO term.
• Genes that are annotated by other GO terms as stress related: 12 genes (SSE2,
SSA4, HSP42, TSL1, DDR2, TPS3, HOR7, GAD1, CTT1, GRE3, BDH1, SPI1)
are annotated by other GO terms as stress related.
• Genes whose relationship with stress are not stated in GO bu have evidence in lit-
erature: 16 genes (PRB1 [73], PHR1 [74], TMA17 [75, 76], TPK1 [73], CIT1 [73],
PGM2 [73], HXK1 [73], CWP1 [77], RTN2 [78], UGP1 [79], PNC1 [80], DCS2 [81],
GLK1 [73], TFS1 [82], SOL4 [83], GTO3 [80]) are found to be related with stress
in literature.
• The unrelated genes and genes whose functions are not known yet: These genes
grouped for further analysis:
– Genes whose function are not known: 3 genes have unknown functions
(YNL195C, FMP16 and YCL042W).
– Other genes: AMS1 gene is related with hydrolase activity and YSC84 gene
works in actin cortical path localization.
Several interesting and promising results can be seen:
1. Many stress response genes that are not annotated by Heat Shock GO term,
and therefore not given to the method as input, are extracted from the dataset.
Examples of those genes are HSP42, TSL1, DDR2, TPS3 and HOR7.
2. Response to oxidative stress can be seen as well as response to stress genes. Lee
et al. [84] states that oxidation and heat shock have common physiological effect
on cells, so it is meaningful that oxidative response genes such as CIT1 and
BDH1 are included in the final clustering by CEC method.
43
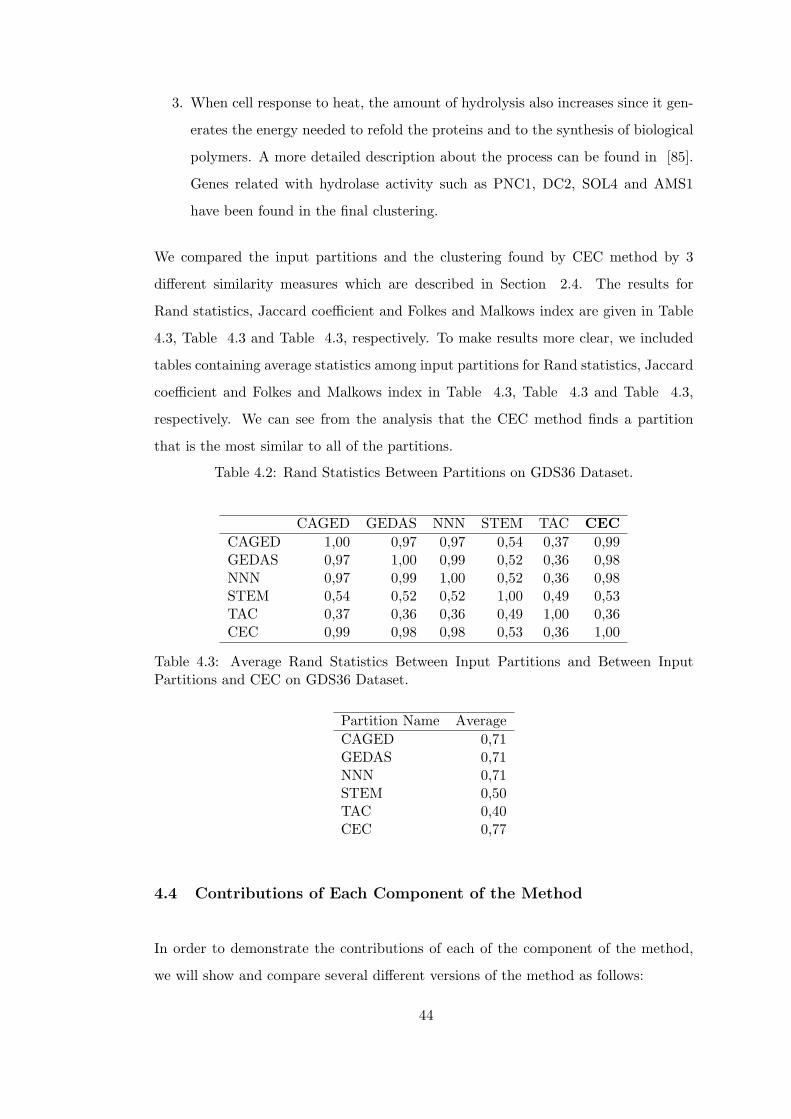
3. When cell response to heat, the amount of hydrolysis also increases since it gen-
erates the energy needed to refold the proteins and to the synthesis of biological
polymers. A more detailed description about the process can be found in [85].
Genes related with hydrolase activity such as PNC1, DC2, SOL4 and AMS1
have been found in the final clustering.
We compared the input partitions and the clustering found by CEC method by 3
different similarity measures which are described in Section 2.4. The results for
Rand statistics, Jaccard coefficient and Folkes and Malkows index are given in Table
4.3, Table 4.3 and Table 4.3, respectively. To make results more clear, we included
tables containing average statistics among input partitions for Rand statistics, Jaccard
coefficient and Folkes and Malkows index in Table 4.3, Table 4.3 and Table 4.3,
respectively. We can see from the analysis that the CEC method finds a partition
that is the most similar to all of the partitions.
Table 4.2: Rand Statistics Between Partitions on GDS36 Dataset.
CAGED GEDAS NNN STEM TAC CECCAGED 1,00 0,97 0,97 0,54 0,37 0,99GEDAS 0,97 1,00 0,99 0,52 0,36 0,98NNN 0,97 0,99 1,00 0,52 0,36 0,98STEM 0,54 0,52 0,52 1,00 0,49 0,53TAC 0,37 0,36 0,36 0,49 1,00 0,36CEC 0,99 0,98 0,98 0,53 0,36 1,00
Table 4.3: Average Rand Statistics Between Input Partitions and Between InputPartitions and CEC on GDS36 Dataset.
Partition Name AverageCAGED 0,71GEDAS 0,71NNN 0,71STEM 0,50TAC 0,40CEC 0,77
4.4 Contributions of Each Component of the Method
In order to demonstrate the contributions of each of the component of the method,
we will show and compare several different versions of the method as follows:
44
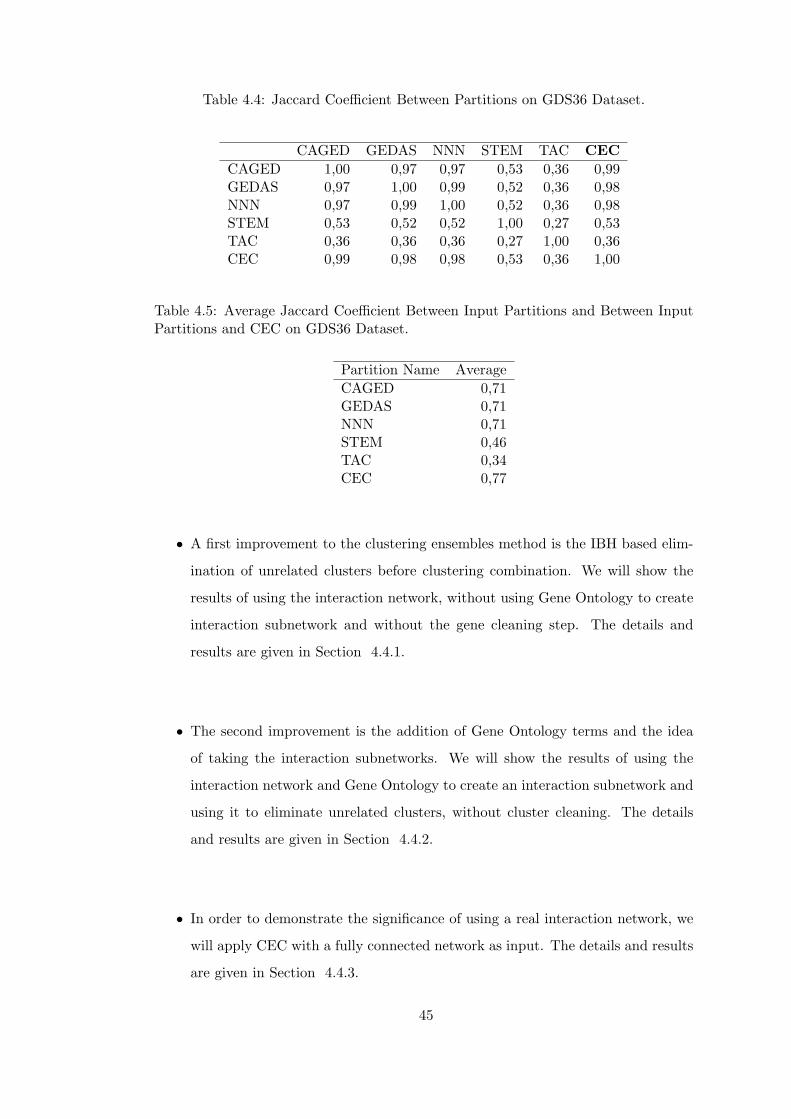
Table 4.4: Jaccard Coefficient Between Partitions on GDS36 Dataset.
CAGED GEDAS NNN STEM TAC CECCAGED 1,00 0,97 0,97 0,53 0,36 0,99GEDAS 0,97 1,00 0,99 0,52 0,36 0,98NNN 0,97 0,99 1,00 0,52 0,36 0,98STEM 0,53 0,52 0,52 1,00 0,27 0,53TAC 0,36 0,36 0,36 0,27 1,00 0,36CEC 0,99 0,98 0,98 0,53 0,36 1,00
Table 4.5: Average Jaccard Coefficient Between Input Partitions and Between InputPartitions and CEC on GDS36 Dataset.
Partition Name AverageCAGED 0,71GEDAS 0,71NNN 0,71STEM 0,46TAC 0,34CEC 0,77
• A first improvement to the clustering ensembles method is the IBH based elim-
ination of unrelated clusters before clustering combination. We will show the
results of using the interaction network, without using Gene Ontology to create
interaction subnetwork and without the gene cleaning step. The details and
results are given in Section 4.4.1.
• The second improvement is the addition of Gene Ontology terms and the idea
of taking the interaction subnetworks. We will show the results of using the
interaction network and Gene Ontology to create an interaction subnetwork and
using it to eliminate unrelated clusters, without cluster cleaning. The details
and results are given in Section 4.4.2.
• In order to demonstrate the significance of using a real interaction network, we
will apply CEC with a fully connected network as input. The details and results
are given in Section 4.4.3.
45
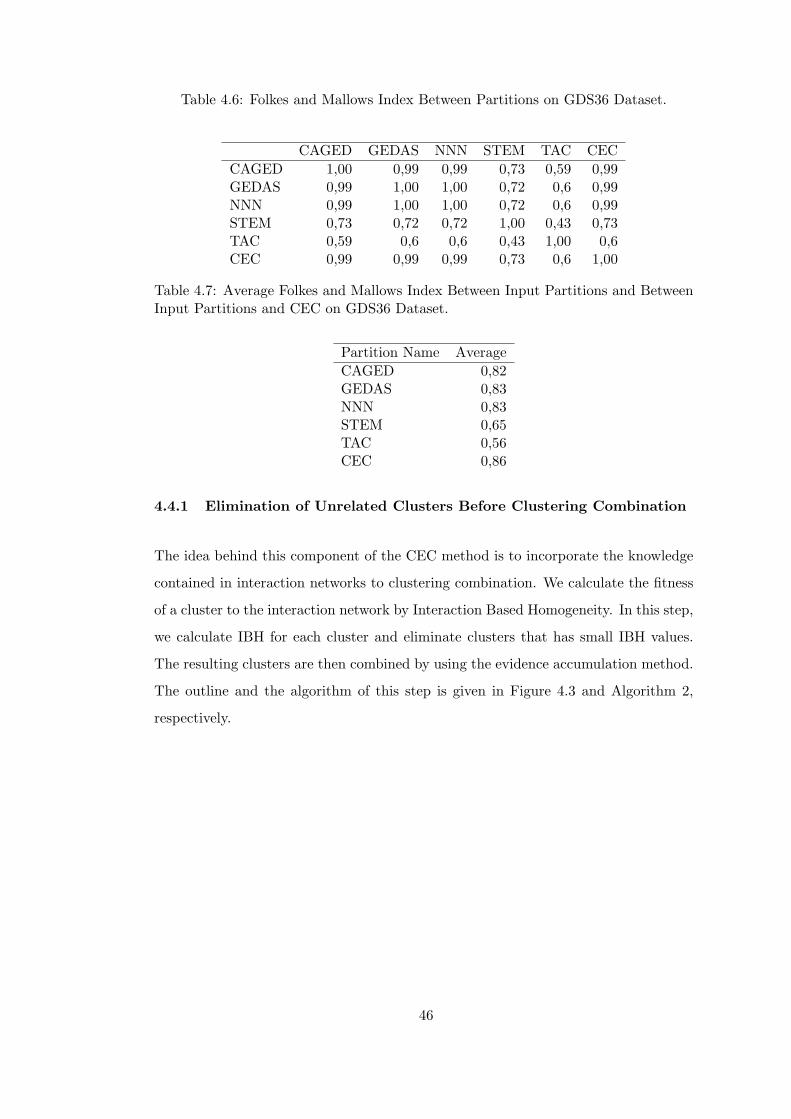
Table 4.6: Folkes and Mallows Index Between Partitions on GDS36 Dataset.
CAGED GEDAS NNN STEM TAC CECCAGED 1,00 0,99 0,99 0,73 0,59 0,99GEDAS 0,99 1,00 1,00 0,72 0,6 0,99NNN 0,99 1,00 1,00 0,72 0,6 0,99STEM 0,73 0,72 0,72 1,00 0,43 0,73TAC 0,59 0,6 0,6 0,43 1,00 0,6CEC 0,99 0,99 0,99 0,73 0,6 1,00
Table 4.7: Average Folkes and Mallows Index Between Input Partitions and BetweenInput Partitions and CEC on GDS36 Dataset.
Partition Name AverageCAGED 0,82GEDAS 0,83NNN 0,83STEM 0,65TAC 0,56CEC 0,86
4.4.1 Elimination of Unrelated Clusters Before Clustering Combination
The idea behind this component of the CEC method is to incorporate the knowledge
contained in interaction networks to clustering combination. We calculate the fitness
of a cluster to the interaction network by Interaction Based Homogeneity. In this step,
we calculate IBH for each cluster and eliminate clusters that has small IBH values.
The resulting clusters are then combined by using the evidence accumulation method.
The outline and the algorithm of this step is given in Figure 4.3 and Algorithm 2,
respectively.
46

Algorithm 2 Algorithm for elimination of unrelated clusters before clustering com-
bination.Require: A set of partitions P of microarray data M resulting from N clustering
algorithms, a threshold T for cluster elimination, interaction network I
{Create the set of clusters}
C ← createS etO fClusters(P)
{Calculate Interaction Based Homogeneity for each Cluster}
for i = 1→ length(C) do
if IBHI(Ci) < T then
remove Ci from C
end if
end for
G ← S etO fGenes(C)
for i = 1→ length(G) do
for j = 1→ length(G) do
n(i, j)← 0
for c = 1→ N do
if G[i] ∈ Pc G[ j] ∈ Pc then
n(i, j)← n(i, j) + 1
end if
end for{Create co-association matrix from C}
C(i, j)← n(i, j)N
end for
end for
R← Cluster(C)
return R
47
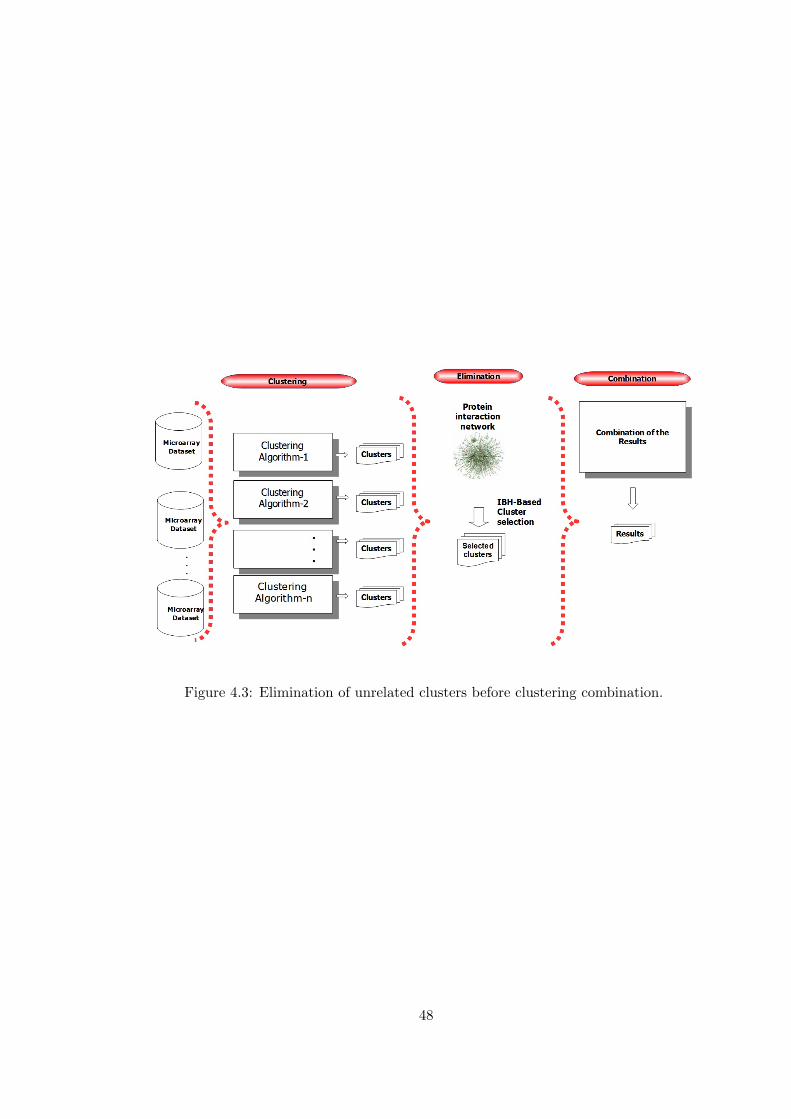
Figure 4.3: Elimination of unrelated clusters before clustering combination.
48
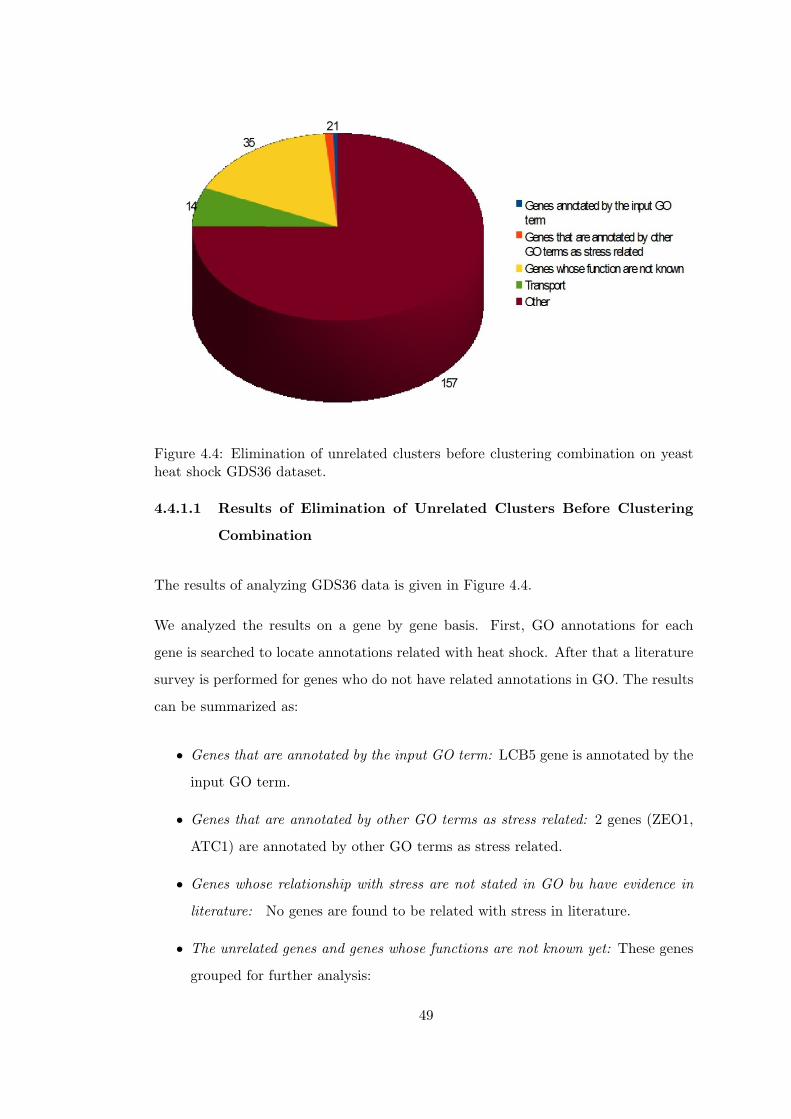
Figure 4.4: Elimination of unrelated clusters before clustering combination on yeastheat shock GDS36 dataset.
4.4.1.1 Results of Elimination of Unrelated Clusters Before Clustering
Combination
The results of analyzing GDS36 data is given in Figure 4.4.
We analyzed the results on a gene by gene basis. First, GO annotations for each
gene is searched to locate annotations related with heat shock. After that a literature
survey is performed for genes who do not have related annotations in GO. The results
can be summarized as:
• Genes that are annotated by the input GO term: LCB5 gene is annotated by the
input GO term.
• Genes that are annotated by other GO terms as stress related: 2 genes (ZEO1,
ATC1) are annotated by other GO terms as stress related.
• Genes whose relationship with stress are not stated in GO bu have evidence in
literature: No genes are found to be related with stress in literature.
• The unrelated genes and genes whose functions are not known yet: These genes
grouped for further analysis:
49
– Other genes that may be related with stress: 14 genes are transport related:
HXT5, AVT6, GOT1, SAM1, PPM2, SAM2, YMC2, YJR129C,YNL022C,
YGR283C, AIR1, PHO84, ARE1, TRM44, TRM5, FRE1, YBR141C, FRE7
and HXT3. It is known that the expression levels of transport-related genes
decreases under stress [73]. The role of these genes should be further in-
vestigated to make sure of their relevance with stress conditions, especially
the heat shock. Other genes in this group are PTH2 and YHR113W which
are responsible from hydrolase activity.
– Genes whose function are not known: 35 genes have unknown functions.
– Other genes: 157 genes have no evidence for relevance with heat shock.
When we examine genes in this category, we see that they are mostly tran-
scription, processing and binding related genes.
Since there are lots of known interactions on transcription and binding related genes,
the results are dominated by them. This situation may be the result of the fact that
some biological phenomena may involve more interactions than another. In order to
prevent these interactions to dominate the results, we should include some functional
information about the experiment.
4.4.2 Create Interaction Subnetworks Using Gene Ontology
The problem in the method described in previous section is the lack of functional
information related with the experiment. The Gene Ontology is an excellent resource
from which the functional classes of genes can be obtained. The idea introduced in
this section is to take as input Gene Ontology terms related with the experiment and
incorporate knowledge contained in these Gene Ontology terms into the analysis. The
Gene Ontology terms are used to create an interaction subnetwork from the whole
network of the organism. The subnetwork contains the interactions of genes related
with the functional classes. As an example, when analyzing sporulation dataset, Gene
Ontology terms related with sporulation are given as input, the interaction subnetwork
are than created by selecting interactions among genes annotated by the input Gene
Ontology term. Then, we calculate IBH for each cluster by using the subnetwork and
eliminate clusters that has small IBH values. The resulting clusters are than combined
50

by using the evidence accumulation method. The outline and the algorithm of this
step is given in Figure 4.5 and Algorithm 3, respectively.
51
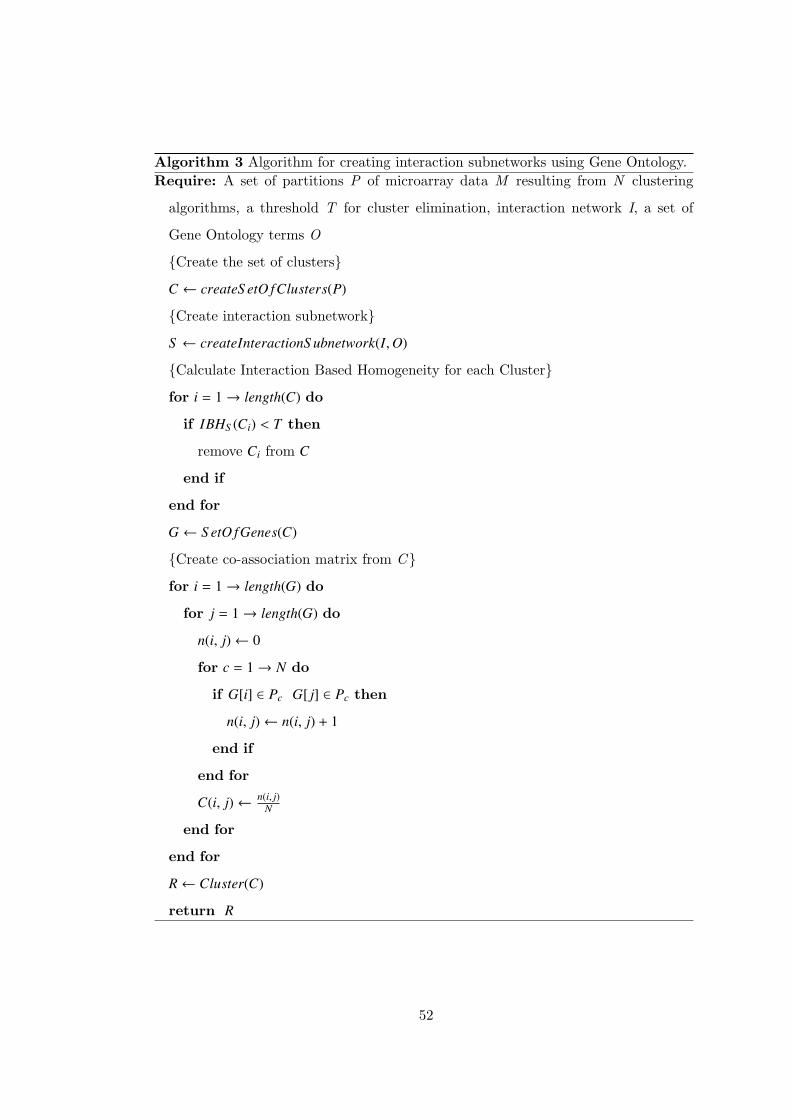
Algorithm 3 Algorithm for creating interaction subnetworks using Gene Ontology.Require: A set of partitions P of microarray data M resulting from N clustering
algorithms, a threshold T for cluster elimination, interaction network I, a set of
Gene Ontology terms O
{Create the set of clusters}
C ← createS etO fClusters(P)
{Create interaction subnetwork}
S ← createInteractionS ubnetwork(I,O)
{Calculate Interaction Based Homogeneity for each Cluster}
for i = 1→ length(C) do
if IBHS (Ci) < T then
remove Ci from C
end if
end for
G ← S etO fGenes(C)
{Create co-association matrix from C}
for i = 1→ length(G) do
for j = 1→ length(G) do
n(i, j)← 0
for c = 1→ N do
if G[i] ∈ Pc G[ j] ∈ Pc then
n(i, j)← n(i, j) + 1
end if
end for
C(i, j)← n(i, j)N
end for
end for
R← Cluster(C)
return R
52
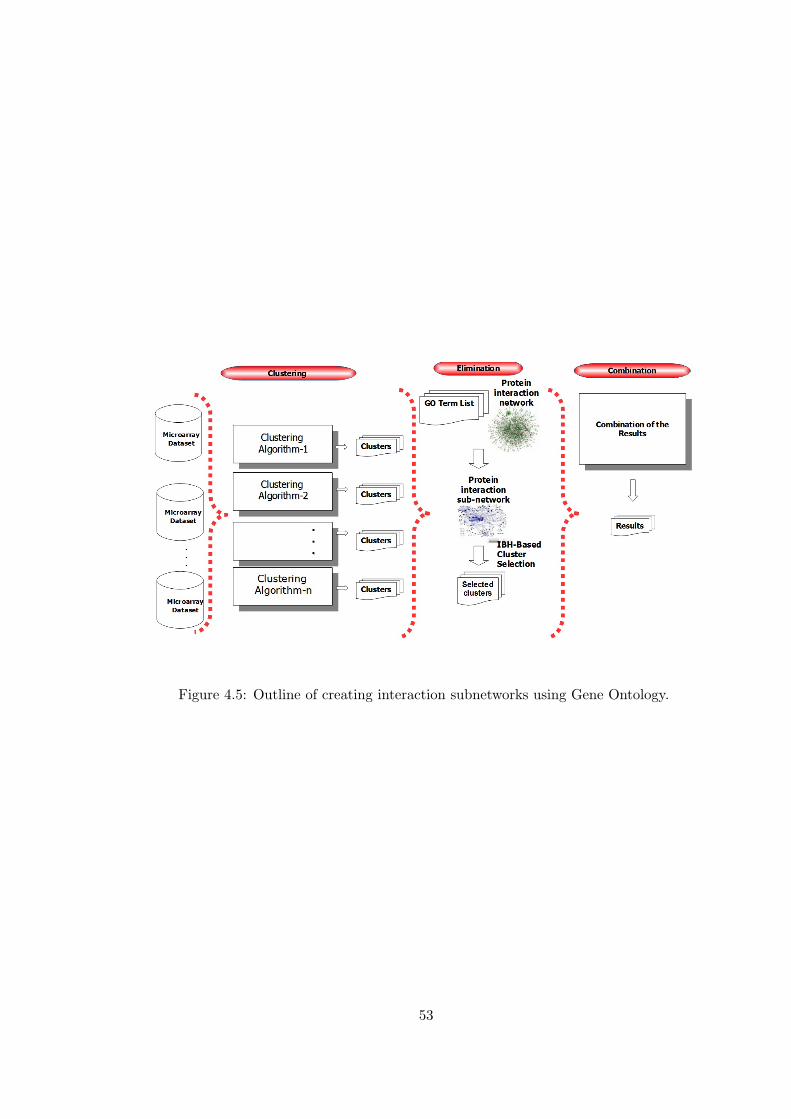
Figure 4.5: Outline of creating interaction subnetworks using Gene Ontology.
53
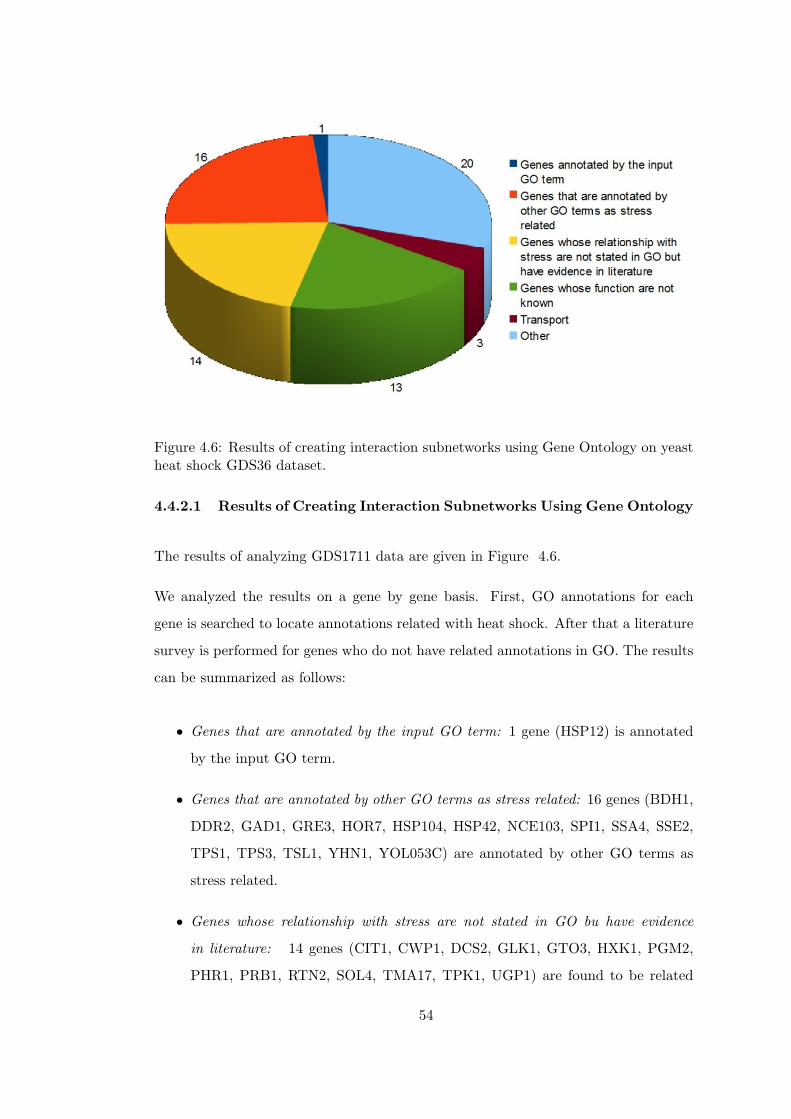
Figure 4.6: Results of creating interaction subnetworks using Gene Ontology on yeastheat shock GDS36 dataset.
4.4.2.1 Results of Creating Interaction Subnetworks Using Gene Ontology
The results of analyzing GDS1711 data are given in Figure 4.6.
We analyzed the results on a gene by gene basis. First, GO annotations for each
gene is searched to locate annotations related with heat shock. After that a literature
survey is performed for genes who do not have related annotations in GO. The results
can be summarized as follows:
• Genes that are annotated by the input GO term: 1 gene (HSP12) is annotated
by the input GO term.
• Genes that are annotated by other GO terms as stress related: 16 genes (BDH1,
DDR2, GAD1, GRE3, HOR7, HSP104, HSP42, NCE103, SPI1, SSA4, SSE2,
TPS1, TPS3, TSL1, YHN1, YOL053C) are annotated by other GO terms as
stress related.
• Genes whose relationship with stress are not stated in GO bu have evidence
in literature: 14 genes (CIT1, CWP1, DCS2, GLK1, GTO3, HXK1, PGM2,
PHR1, PRB1, RTN2, SOL4, TMA17, TPK1, UGP1) are found to be related
54
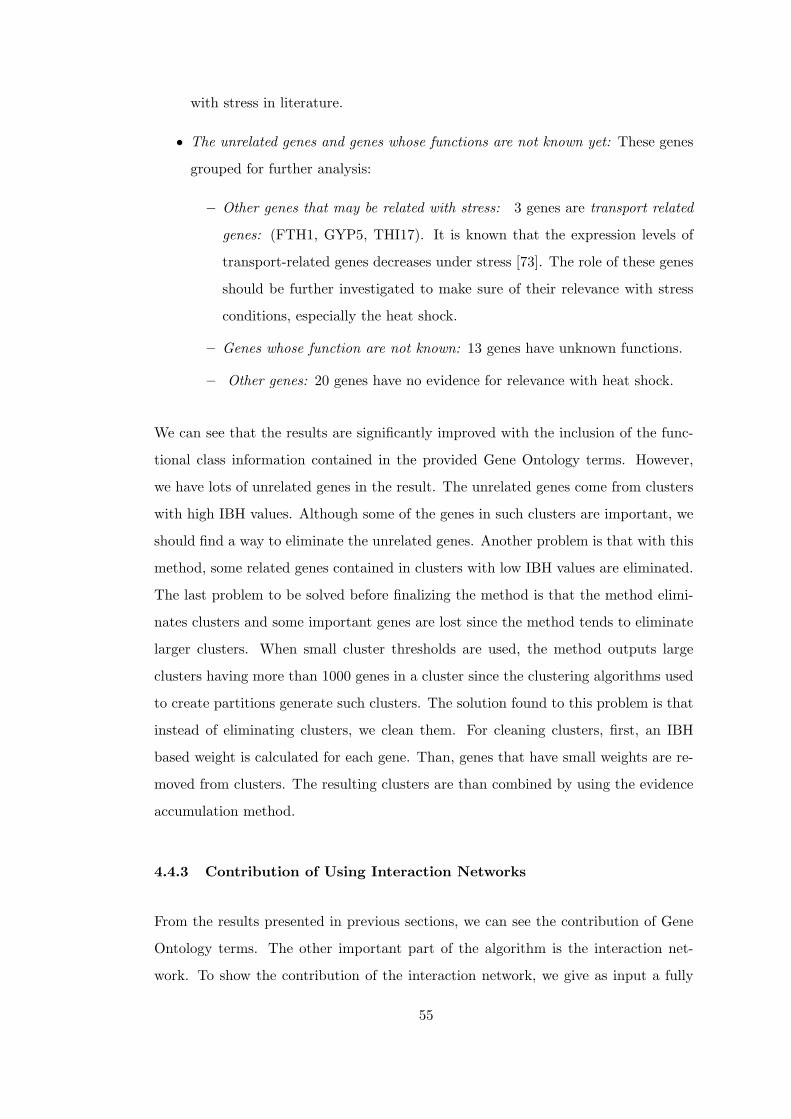
with stress in literature.
• The unrelated genes and genes whose functions are not known yet: These genes
grouped for further analysis:
– Other genes that may be related with stress: 3 genes are transport related
genes: (FTH1, GYP5, THI17). It is known that the expression levels of
transport-related genes decreases under stress [73]. The role of these genes
should be further investigated to make sure of their relevance with stress
conditions, especially the heat shock.
– Genes whose function are not known: 13 genes have unknown functions.
– Other genes: 20 genes have no evidence for relevance with heat shock.
We can see that the results are significantly improved with the inclusion of the func-
tional class information contained in the provided Gene Ontology terms. However,
we have lots of unrelated genes in the result. The unrelated genes come from clusters
with high IBH values. Although some of the genes in such clusters are important, we
should find a way to eliminate the unrelated genes. Another problem is that with this
method, some related genes contained in clusters with low IBH values are eliminated.
The last problem to be solved before finalizing the method is that the method elimi-
nates clusters and some important genes are lost since the method tends to eliminate
larger clusters. When small cluster thresholds are used, the method outputs large
clusters having more than 1000 genes in a cluster since the clustering algorithms used
to create partitions generate such clusters. The solution found to this problem is that
instead of eliminating clusters, we clean them. For cleaning clusters, first, an IBH
based weight is calculated for each gene. Than, genes that have small weights are re-
moved from clusters. The resulting clusters are than combined by using the evidence
accumulation method.
4.4.3 Contribution of Using Interaction Networks
From the results presented in previous sections, we can see the contribution of Gene
Ontology terms. The other important part of the algorithm is the interaction net-
work. To show the contribution of the interaction network, we give as input a fully
55
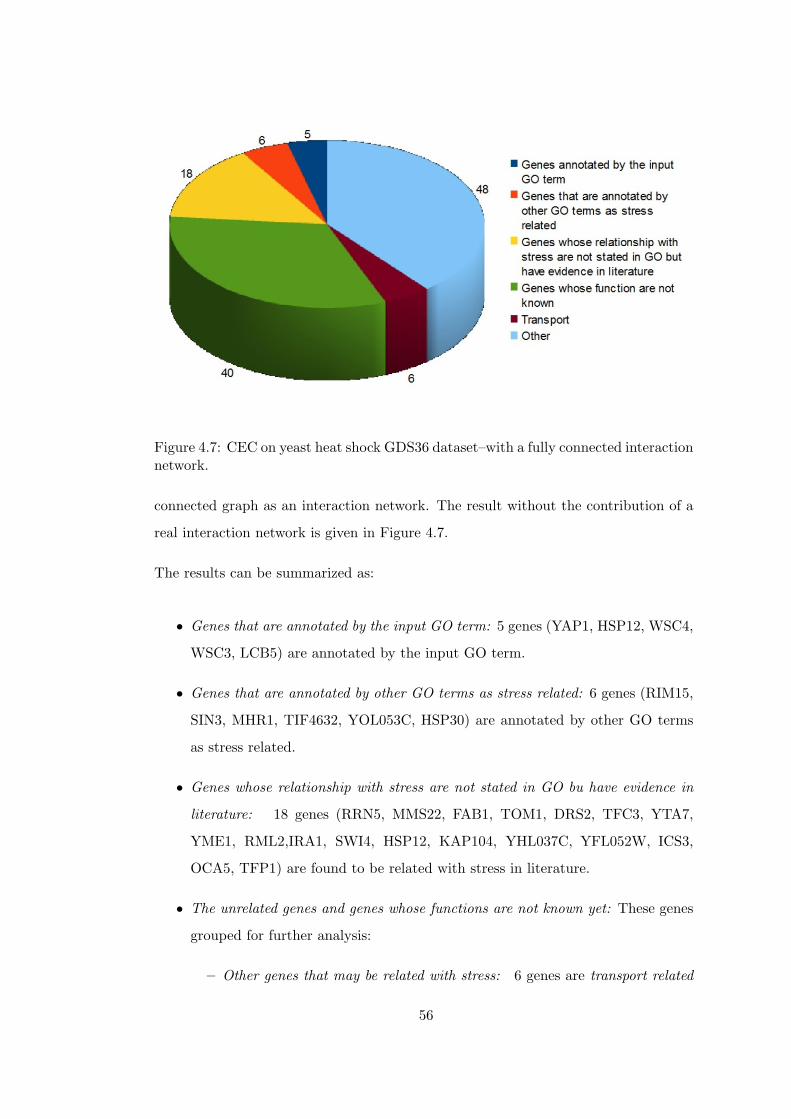
Figure 4.7: CEC on yeast heat shock GDS36 dataset–with a fully connected interactionnetwork.
connected graph as an interaction network. The result without the contribution of a
real interaction network is given in Figure 4.7.
The results can be summarized as:
• Genes that are annotated by the input GO term: 5 genes (YAP1, HSP12, WSC4,
WSC3, LCB5) are annotated by the input GO term.
• Genes that are annotated by other GO terms as stress related: 6 genes (RIM15,
SIN3, MHR1, TIF4632, YOL053C, HSP30) are annotated by other GO terms
as stress related.
• Genes whose relationship with stress are not stated in GO bu have evidence in
literature: 18 genes (RRN5, MMS22, FAB1, TOM1, DRS2, TFC3, YTA7,
YME1, RML2,IRA1, SWI4, HSP12, KAP104, YHL037C, YFL052W, ICS3,
OCA5, TFP1) are found to be related with stress in literature.
• The unrelated genes and genes whose functions are not known yet: These genes
grouped for further analysis:
– Other genes that may be related with stress: 6 genes are transport related
56
genes: LRO1, YHR009C, DAN1, QDR2, COX5A, FRE7. It is known that
the expression levels of transport-related genes decreases under stress [73].
The role of these genes should be further investigated to make sure of their
relevance with stress conditions, especially the heat shock.
– Genes whose function are not known: 40 genes have unknown functions.
– Other genes: 48 genes have no evidence for relevance with heat shock.
We can see from the results that although the number of genes that are annotated
by the input GO term is increased from 1 to 5, the number of unrelated genes is also
increased significantly, proving the necessity of using a real interaction network.
4.5 Summary
In this chapter, we described the Cluster-Eliminate-Combine method and demon-
strate the significance of its components. A summary of the results can be found in
Figure 4.8:
• The results of applying whole interaction network to select clusters with high
IBH are given in Figure 4.8-(a). We can see that the results are dominated with
transcription and binding related genes since there are a lot of known interactions
for them and we do not use any functional class information.
• The results of using the functional class information contained in Gene Ontol-
ogy by creating a subnetwork of the interaction network by a GO term which
represents the biological process related with the microarray dataset are shown
in Figure 4.8-(b). We can see from the results that the number of related genes
are increased, however there are lots of unrelated genes in the result.
• In the final CEC method, a subnetwork of the interaction network is taken by
a GO term which represents the biological process related with the microarray
dataset, in this case heat shock. Then clusters are cleaned by gene weight. After
cleaning the resulting clusters are combined. The results are shown in Figure
4.8-(a). The results show the step-by-step contributions made by each of the
components of CEC method.
57

Finally, in order to show the significance of the interaction network, CEC is applied
to the same dataset with a fully connected interaction network. The results are shown
in Figure 4.9. This results proves the significance of using a real interaction network.
58
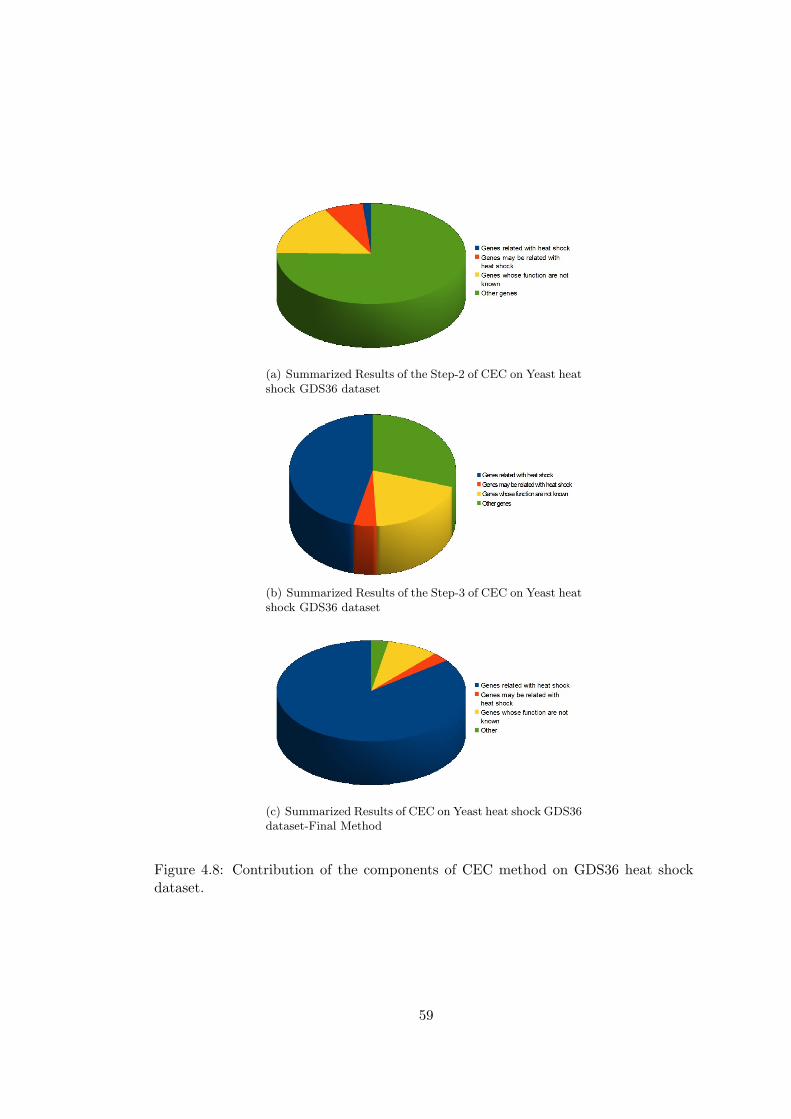
(a) Summarized Results of the Step-2 of CEC on Yeast heatshock GDS36 dataset
(b) Summarized Results of the Step-3 of CEC on Yeast heatshock GDS36 dataset
(c) Summarized Results of CEC on Yeast heat shock GDS36dataset-Final Method
Figure 4.8: Contribution of the components of CEC method on GDS36 heat shockdataset.
59
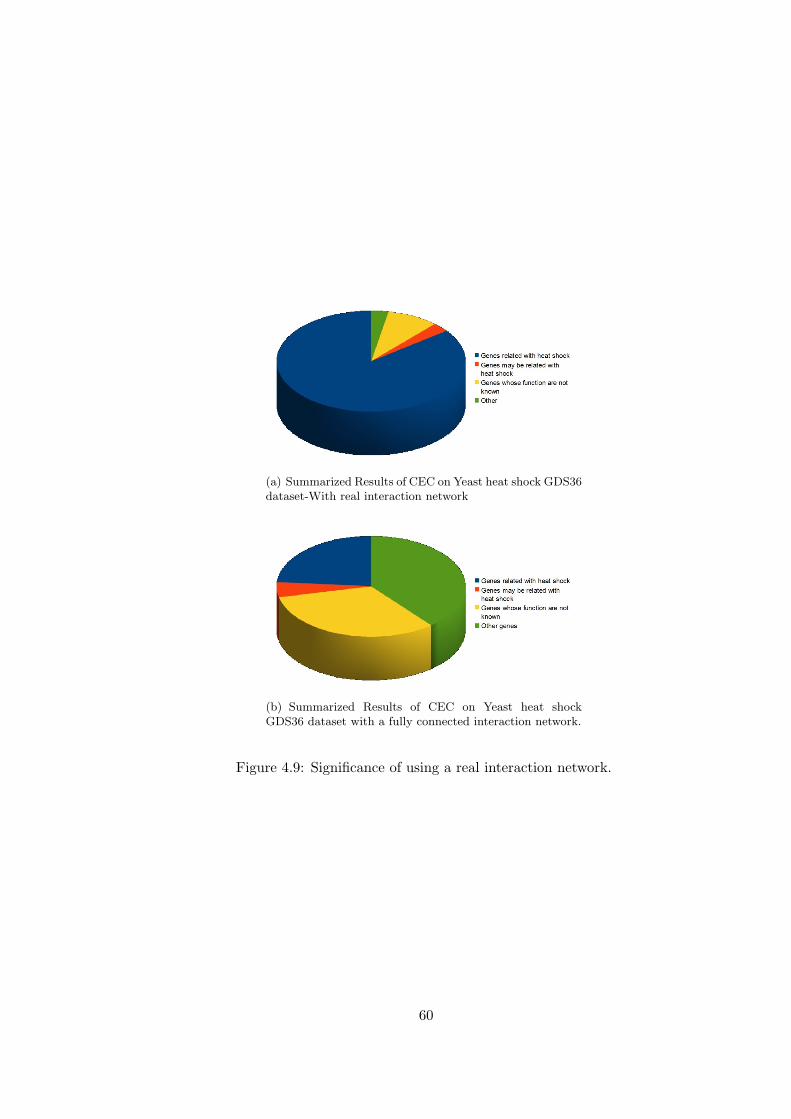
(a) Summarized Results of CEC on Yeast heat shock GDS36dataset-With real interaction network
(b) Summarized Results of CEC on Yeast heat shockGDS36 dataset with a fully connected interaction network.
Figure 4.9: Significance of using a real interaction network.
60
CHAPTER 5
RESULTS AND DISCUSSIONS
In this chapter, we show the results of applying the CEC method in different cases.
Interactions are taken from BioGRID interaction repository [45]. While taking genes
annotated by related Gene Ontology terms, only experimental Evidence Codes (EXP:
Inferred from Experiment , IDA: Inferred from Direct Assay, IPI: Inferred from Phys-
ical Interaction , IMP: Inferred from Mutant Phenotype, IGI: Inferred from Genetic
Interaction , IEP: Inferred from Expression Pattern) are taken into consideration. For
the GO searches in the first two subsections, AMIGO tool is used [86]. In Section 5.1,
two time-series datasets are analyzed by CEC. As mentioned in previous section, CEC
can be applied to the problem of combining heterogeneous datasets. In Section 5.2,
an example application of CEC to the combination of 7 different heat shock datasets
is presented. Finally, in Section 5.3, CEC is analyzed with GSEA [87] on two example
datasets.
5.1 Different Algorithms on Time-Series Microarray Data
5.1.1 Description
In time series experiments, the expression levels of genes are measured at different
time points. There are algorithms designed specifically to cluster time series gene
expression data. In this section, we applied 5 different clustering algorithms to a
time series dataset and apply CEC method to the clustering results. The experiment
is outlined in Figure 5.1. We selected two different time series datasets which are
described in the first subsection for the analysis. The results of analyzing the datasets
61
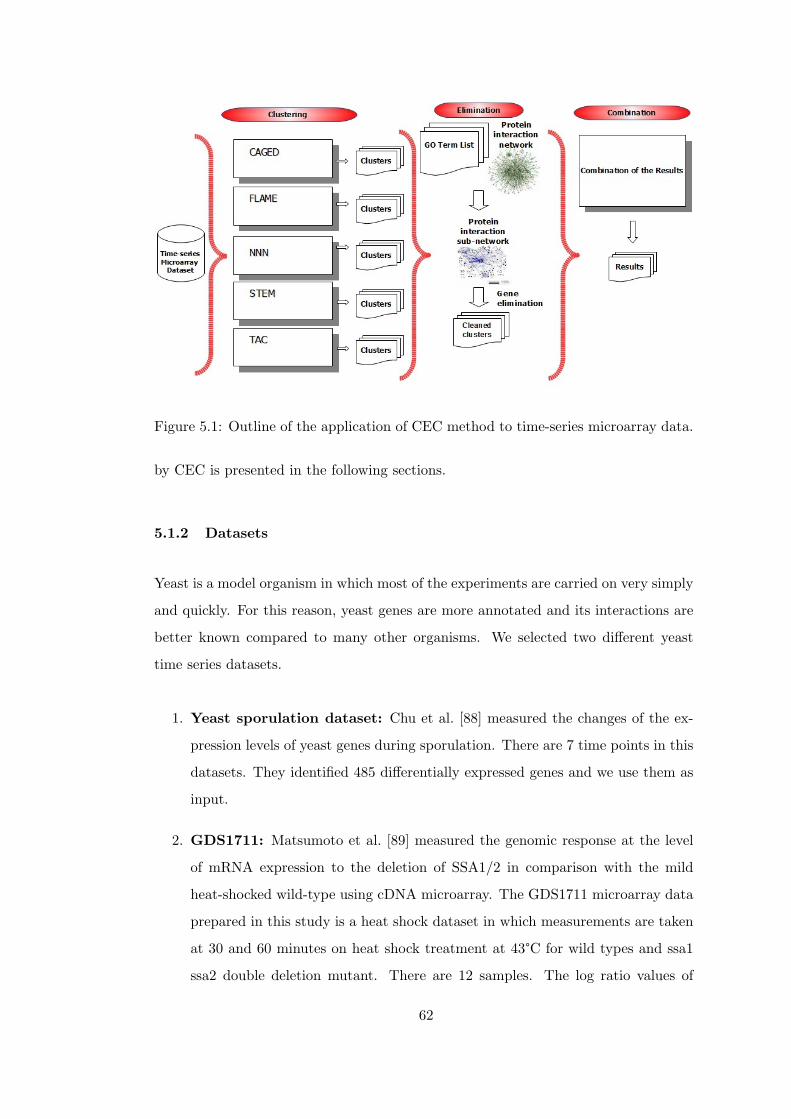
Figure 5.1: Outline of the application of CEC method to time-series microarray data.
by CEC is presented in the following sections.
5.1.2 Datasets
Yeast is a model organism in which most of the experiments are carried on very simply
and quickly. For this reason, yeast genes are more annotated and its interactions are
better known compared to many other organisms. We selected two different yeast
time series datasets.
1. Yeast sporulation dataset: Chu et al. [88] measured the changes of the ex-
pression levels of yeast genes during sporulation. There are 7 time points in this
datasets. They identified 485 differentially expressed genes and we use them as
input.
2. GDS1711: Matsumoto et al. [89] measured the genomic response at the level
of mRNA expression to the deletion of SSA1/2 in comparison with the mild
heat-shocked wild-type using cDNA microarray. The GDS1711 microarray data
prepared in this study is a heat shock dataset in which measurements are taken
at 30 and 60 minutes on heat shock treatment at 43°C for wild types and ssa1
ssa2 double deletion mutant. There are 12 samples. The log ratio values of
62
the measurements are used. The dataset contains 6020 genes. We used the
whole dataset in all of the analyses without performing a preprocessing step for
selecting differentially expressed genes.
5.1.3 Results on Yeast Sporulation Dataset
For analyzing Yeast sporulation dataset, in the clustering step, the dataset is clustered
by five algorithms to obtain different partitions. Number of clusters found in each
partition is given in Table F. As can be seen from the table, the number of clusters
found varies from 5 to 18.
Table 5.1: Number of clusters found in each partition for yeast sporulation dataset.
Algorithm Number of ClustersCAGED 6FLAME 13GQL 5NNN 18STEM 8TAC 7
We apply subsequently the elimination step of the algorithm. Genes annotated with
GO term Sporulation (GO:0043934) is selected as the gene list. The subnetwork of
BioGRID interactions related with the genes in the selected GO term is prepared.
First, the IBH for each cluster is calculated. Then, from IBH values of each cluster,
gene weights are calculated. The unrelated genes are eliminated from the clusters in
partitions by using threshold as 0.01.
The distance matrix between genes that passed the elimination step is calculated by
using the evidence accumulation. Then, the distance matrix is used by a model based
clustering algorithm to obtain the final clustering. The results after combination step
can be found in Figure 5.2 and detailed analysis of the results are given in Table F.2
in Appendix F.
We can see from the results that the analysis suggests 7 clusters. When we examine
the clusters, we can see that Cluster-1 contains mostly genes related with meiosis,
Cluster-6 contains stress response genes, Cluster-7 contains transport related genes.
63
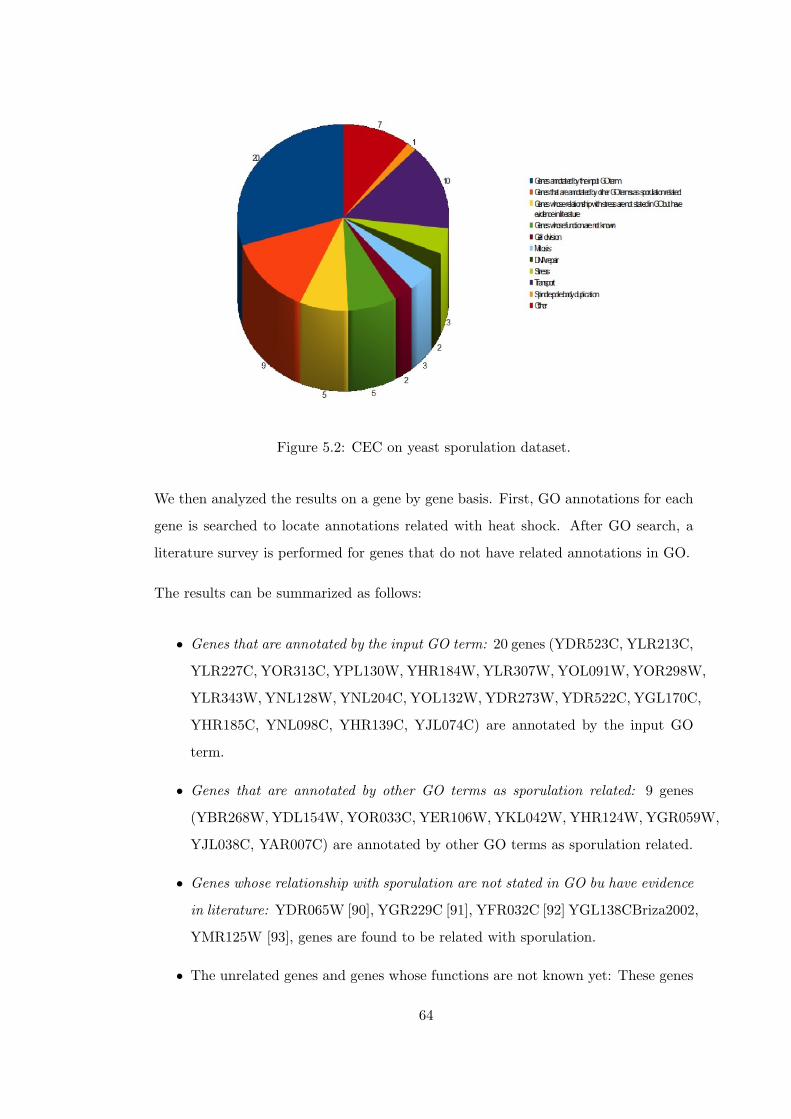
Figure 5.2: CEC on yeast sporulation dataset.
We then analyzed the results on a gene by gene basis. First, GO annotations for each
gene is searched to locate annotations related with heat shock. After GO search, a
literature survey is performed for genes that do not have related annotations in GO.
The results can be summarized as follows:
• Genes that are annotated by the input GO term: 20 genes (YDR523C, YLR213C,
YLR227C, YOR313C, YPL130W, YHR184W, YLR307W, YOL091W, YOR298W,
YLR343W, YNL128W, YNL204C, YOL132W, YDR273W, YDR522C, YGL170C,
YHR185C, YNL098C, YHR139C, YJL074C) are annotated by the input GO
term.
• Genes that are annotated by other GO terms as sporulation related: 9 genes
(YBR268W, YDL154W, YOR033C, YER106W, YKL042W, YHR124W, YGR059W,
YJL038C, YAR007C) are annotated by other GO terms as sporulation related.
• Genes whose relationship with sporulation are not stated in GO bu have evidence
in literature: YDR065W [90], YGR229C [91], YFR032C [92] YGL138CBriza2002,
YMR125W [93], genes are found to be related with sporulation.
• The unrelated genes and genes whose functions are not known yet: These genes
64
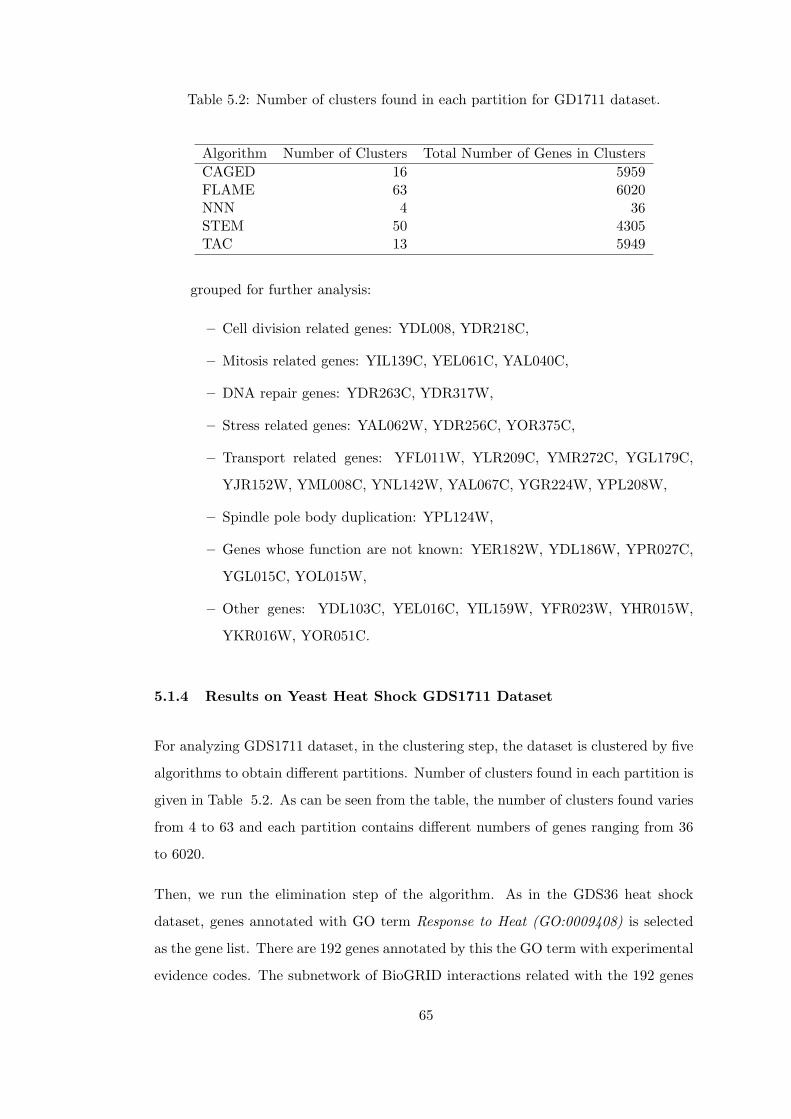
Table 5.2: Number of clusters found in each partition for GD1711 dataset.
Algorithm Number of Clusters Total Number of Genes in ClustersCAGED 16 5959FLAME 63 6020NNN 4 36STEM 50 4305TAC 13 5949
grouped for further analysis:
– Cell division related genes: YDL008, YDR218C,
– Mitosis related genes: YIL139C, YEL061C, YAL040C,
– DNA repair genes: YDR263C, YDR317W,
– Stress related genes: YAL062W, YDR256C, YOR375C,
– Transport related genes: YFL011W, YLR209C, YMR272C, YGL179C,
YJR152W, YML008C, YNL142W, YAL067C, YGR224W, YPL208W,
– Spindle pole body duplication: YPL124W,
– Genes whose function are not known: YER182W, YDL186W, YPR027C,
YGL015C, YOL015W,
– Other genes: YDL103C, YEL016C, YIL159W, YFR023W, YHR015W,
YKR016W, YOR051C.
5.1.4 Results on Yeast Heat Shock GDS1711 Dataset
For analyzing GDS1711 dataset, in the clustering step, the dataset is clustered by five
algorithms to obtain different partitions. Number of clusters found in each partition is
given in Table 5.2. As can be seen from the table, the number of clusters found varies
from 4 to 63 and each partition contains different numbers of genes ranging from 36
to 6020.
Then, we run the elimination step of the algorithm. As in the GDS36 heat shock
dataset, genes annotated with GO term Response to Heat (GO:0009408) is selected
as the gene list. There are 192 genes annotated by this the GO term with experimental
evidence codes. The subnetwork of BioGRID interactions related with the 192 genes
65
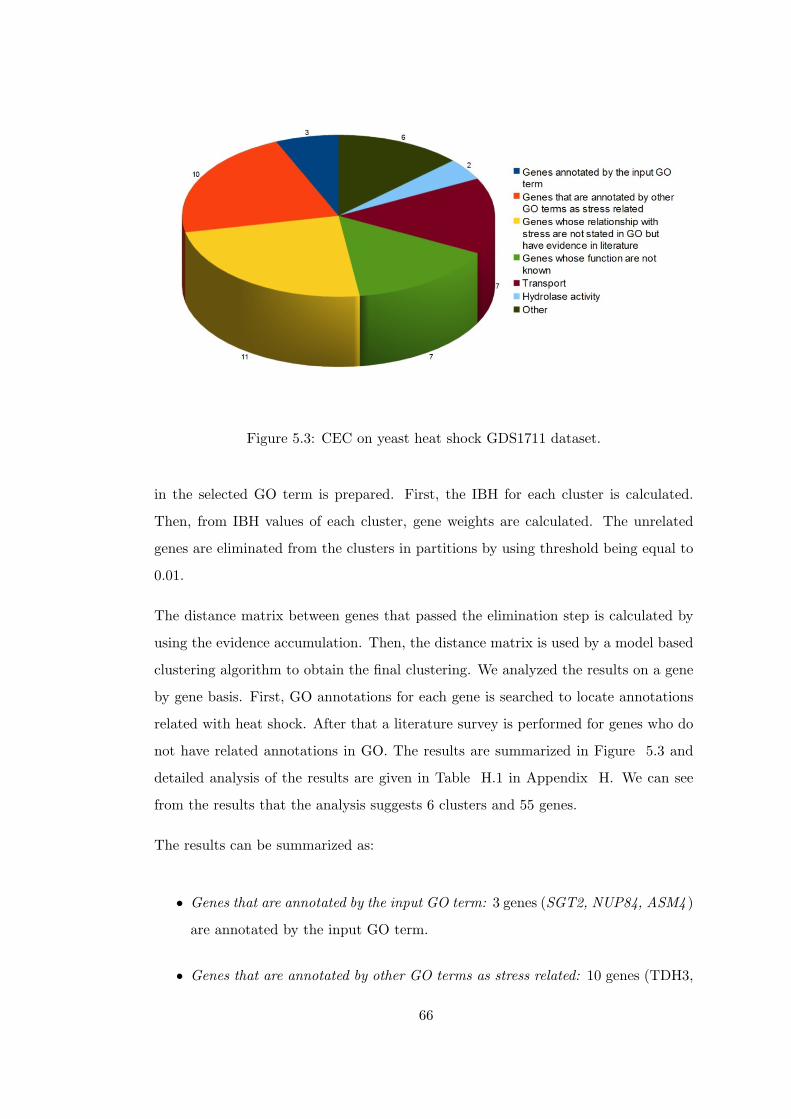
Figure 5.3: CEC on yeast heat shock GDS1711 dataset.
in the selected GO term is prepared. First, the IBH for each cluster is calculated.
Then, from IBH values of each cluster, gene weights are calculated. The unrelated
genes are eliminated from the clusters in partitions by using threshold being equal to
0.01.
The distance matrix between genes that passed the elimination step is calculated by
using the evidence accumulation. Then, the distance matrix is used by a model based
clustering algorithm to obtain the final clustering. We analyzed the results on a gene
by gene basis. First, GO annotations for each gene is searched to locate annotations
related with heat shock. After that a literature survey is performed for genes who do
not have related annotations in GO. The results are summarized in Figure 5.3 and
detailed analysis of the results are given in Table H.1 in Appendix H. We can see
from the results that the analysis suggests 6 clusters and 55 genes.
The results can be summarized as:
• Genes that are annotated by the input GO term: 3 genes (SGT2, NUP84, ASM4 )
are annotated by the input GO term.
• Genes that are annotated by other GO terms as stress related: 10 genes (TDH3,
66
MRK1, HSC82, MSN4, SSE1, STI1, ACT1, LRE1, YOR356W, MET22) are
annotated by other GO terms as stress related.
• Genes whose relationship with stress are not stated in GO bu have evidence
in literature: 11 genes (YOR356W [94], PRE7 [94], YGR207C [95], AIM2 [94],
NSE5 [94], TOK1 [96], TPM1 [94], VPS53 [94], NGL1 [97], BPT1 [98], ESC2 [94])
are found to be related with stress in literature.
• The unrelated genes and genes whose functions are not known yet: These genes
grouped for further analysis:
– Other genes that may be related with heat shock: Among these genes, most
of them are transport related genes: PFA5, AVT2, YGL114W, YPL236C,
ATF2, DSL1 and EST1. It is known that the expression levels of transport-
related genes decreases under stress [73]. The role of these genes should be
further investigated to make sure of their relevance with stress conditions,
especially the heat shock.
– Genes whose function are not known: 7 genes (YOR352W, YFR032C,
YIR043C, AIM38, AIM43, DLT1, GTT3) have unknown functions.
– Other genes: There are 8 genes that have no evidence for relevance
with heat shock. PTH2 and YHR113W which are responsible from hy-
drolase activity, YBL036C for pyridoxal phosphate binding, YNR048W for
phospholipid-translocating ATPase activity, UBA for protein ubiquitina-
tion, EDC3 for cytoplasmic mRNA processing body assembly, AEP1 for
regulation of translation and GTB1 polysaccharide biosynthetic process.
5.2 Combining Different Microarray Experiments
5.2.1 Description
In heat shock response of the cell, several groups of genes are expressed in order to
adapt the cell to the new environment. Mainly, carbohydrate metabolism, fatty acid
metabolism, respiration, oxidative stress defense autophagy and vacuolar function,
protein folding and degradation, cytoskeletal reorganization and signaling genes are
67
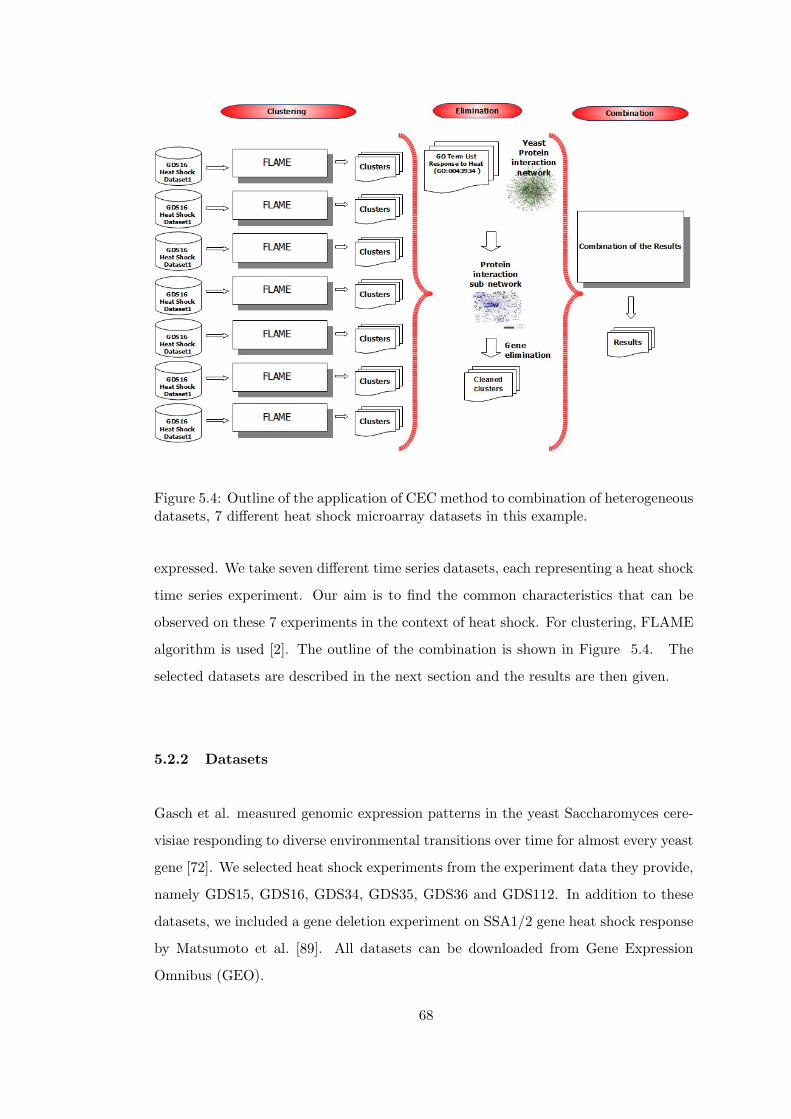
Figure 5.4: Outline of the application of CEC method to combination of heterogeneousdatasets, 7 different heat shock microarray datasets in this example.
expressed. We take seven different time series datasets, each representing a heat shock
time series experiment. Our aim is to find the common characteristics that can be
observed on these 7 experiments in the context of heat shock. For clustering, FLAME
algorithm is used [2]. The outline of the combination is shown in Figure 5.4. The
selected datasets are described in the next section and the results are then given.
5.2.2 Datasets
Gasch et al. measured genomic expression patterns in the yeast Saccharomyces cere-
visiae responding to diverse environmental transitions over time for almost every yeast
gene [72]. We selected heat shock experiments from the experiment data they provide,
namely GDS15, GDS16, GDS34, GDS35, GDS36 and GDS112. In addition to these
datasets, we included a gene deletion experiment on SSA1/2 gene heat shock response
by Matsumoto et al. [89]. All datasets can be downloaded from Gene Expression
Omnibus (GEO).
68
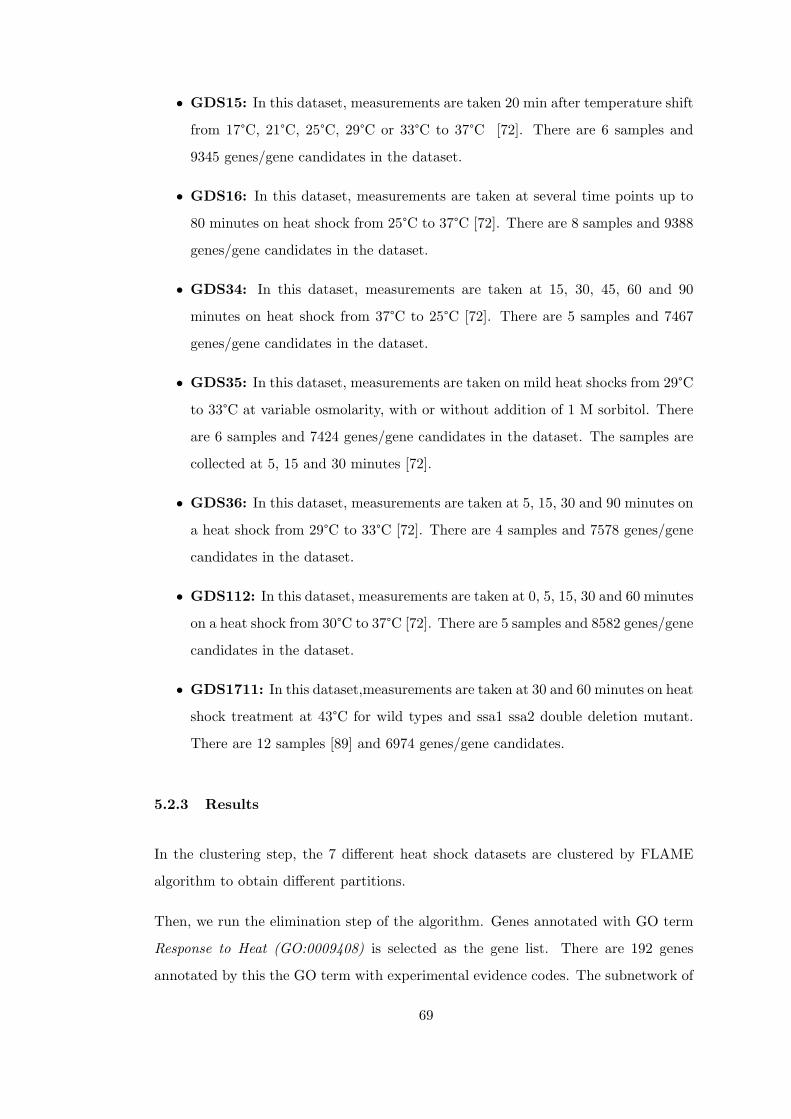
• GDS15: In this dataset, measurements are taken 20 min after temperature shift
from 17°C, 21°C, 25°C, 29°C or 33°C to 37°C [72]. There are 6 samples and
9345 genes/gene candidates in the dataset.
• GDS16: In this dataset, measurements are taken at several time points up to
80 minutes on heat shock from 25°C to 37°C [72]. There are 8 samples and 9388
genes/gene candidates in the dataset.
• GDS34: In this dataset, measurements are taken at 15, 30, 45, 60 and 90
minutes on heat shock from 37°C to 25°C [72]. There are 5 samples and 7467
genes/gene candidates in the dataset.
• GDS35: In this dataset, measurements are taken on mild heat shocks from 29°C
to 33°C at variable osmolarity, with or without addition of 1 M sorbitol. There
are 6 samples and 7424 genes/gene candidates in the dataset. The samples are
collected at 5, 15 and 30 minutes [72].
• GDS36: In this dataset, measurements are taken at 5, 15, 30 and 90 minutes on
a heat shock from 29°C to 33°C [72]. There are 4 samples and 7578 genes/gene
candidates in the dataset.
• GDS112: In this dataset, measurements are taken at 0, 5, 15, 30 and 60 minutes
on a heat shock from 30°C to 37°C [72]. There are 5 samples and 8582 genes/gene
candidates in the dataset.
• GDS1711: In this dataset,measurements are taken at 30 and 60 minutes on heat
shock treatment at 43°C for wild types and ssa1 ssa2 double deletion mutant.
There are 12 samples [89] and 6974 genes/gene candidates.
5.2.3 Results
In the clustering step, the 7 different heat shock datasets are clustered by FLAME
algorithm to obtain different partitions.
Then, we run the elimination step of the algorithm. Genes annotated with GO term
Response to Heat (GO:0009408) is selected as the gene list. There are 192 genes
annotated by this the GO term with experimental evidence codes. The subnetwork of
69
Figure 5.5: CEC on application of CEC method to combination of heterogeneousdatasets, 7 different heat shock microarray datasets in this example.
BioGRID interactions related with the 192 genes in the selected GO term is prepared.
First, the IBH for each cluster is calculated. Then, from IBH values of each cluster,
gene weights are calculated. The unrelated genes are eliminated from the clusters in
partitions by using threshold being equal to 0.01.
The distance matrix between genes that passed the elimination step is calculated by
using the evidence accumulation. Then, the distance matrix is used by a model based
clustering algorithm to obtain the final clustering. The results after combination step
can be found in Figure 5.5.
We examined the results on gene basis and the results are given in Table I.1. Most
of the genes resulting from the CEC analysis are related to heat shock experiments.
In addition to genes that are annotated with the input GO term Heat shock response,
genes that have functions related with heat shock response are found. Some of the
genes are not annotated in GO with heat shock or stress related terms. However,
when we look at the literature, we found some genes are actually related with heat
shock response.
To summarize,
70
• Genes that are annotated by the input GO term: Genes STE20, ASM4, HSP104,
NUP100, NUP84, SGT2 and MDJ1 are annotated by the GO term Response to
heat are given as output of CEC analysis.
• Genes that are annotated by other GO terms as stress related: DAN1, LRE1
and PSR2 are annotated as stress related genes in GO.
• Genes whose relationship with stress are not stated in GO bu have evidence in
literature: ARP4 [99], DOG2 [100], AIM45 [95], BPT1 [98], PFK26 [73] and
TOK1 [96] genes are found to be related with stress response.
• The unrelated genes and genes whose functions are not known yet: Among
these genes, most of them are transport related genes: APL1, ATF2, GGA1,
SSH4, THI72, VTI1, YCK3, YPL236C and YGL14W. It is known that the
expression levels of transport-related genes decreases under stress [73]. The role
of these genes should be further investigated to make sure of their relevance
with stress conditions, especially the heat shock. Other genes in this group are
HOS3 and SGA1 which are responsible from hydrolase activity, CFT2 for mRNA
cleavage and MOT2 for protein polyubiquitination. The last subgroup of genes
are those whose function are not yet known: YHL005C, YJR141W, YLR177W
and YLR345W.
5.3 Evaluation of CEC With the Gene Set Enrichment Analysis
Method
5.3.1 Description
In order to assess the success of the method, we checked the GSEA enrichment scores
of the analysis results. To make the comparisons more accurate, we selected two
datasets from the original GSEA study. We first clustered the datasets with different
algorithms such as FLAME, k -means and fuzzy c-means with different parameters
and then applied the CEC method. The dataset is described in the first subsection.
The results of analyzing the datasets by CEC is presented in the following sections.
71
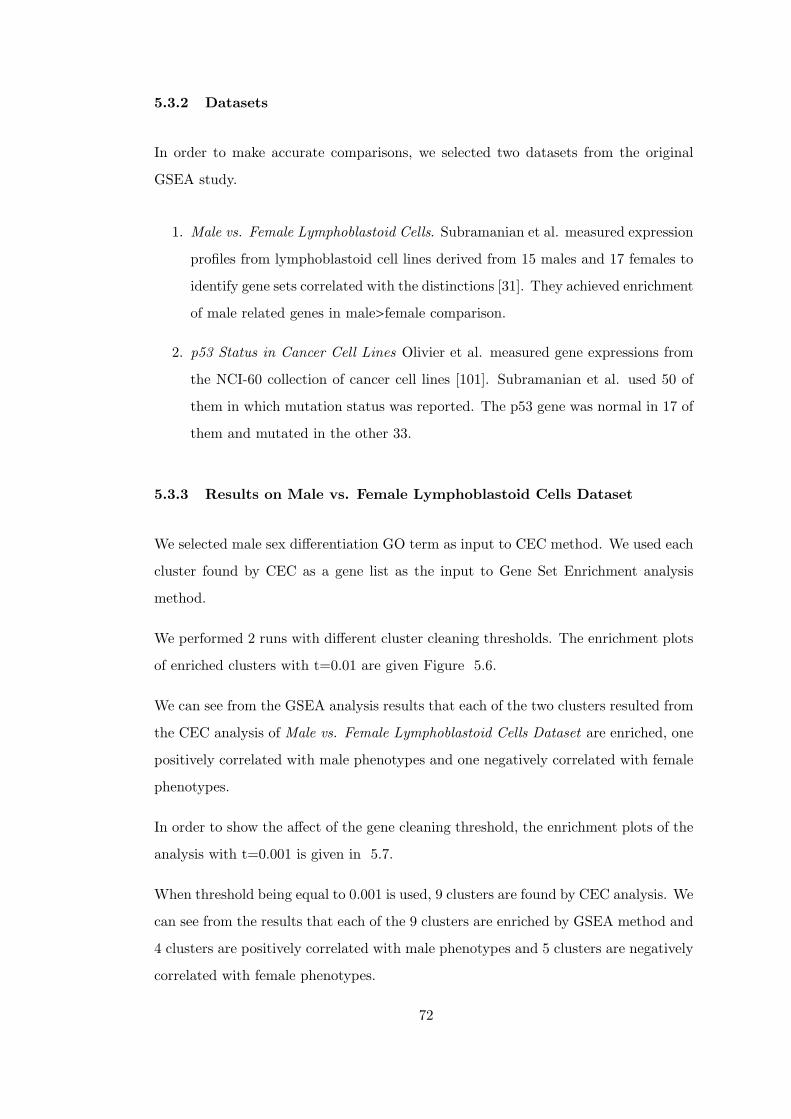
5.3.2 Datasets
In order to make accurate comparisons, we selected two datasets from the original
GSEA study.
1. Male vs. Female Lymphoblastoid Cells. Subramanian et al. measured expression
profiles from lymphoblastoid cell lines derived from 15 males and 17 females to
identify gene sets correlated with the distinctions [31]. They achieved enrichment
of male related genes in male>female comparison.
2. p53 Status in Cancer Cell Lines Olivier et al. measured gene expressions from
the NCI-60 collection of cancer cell lines [101]. Subramanian et al. used 50 of
them in which mutation status was reported. The p53 gene was normal in 17 of
them and mutated in the other 33.
5.3.3 Results on Male vs. Female Lymphoblastoid Cells Dataset
We selected male sex differentiation GO term as input to CEC method. We used each
cluster found by CEC as a gene list as the input to Gene Set Enrichment analysis
method.
We performed 2 runs with different cluster cleaning thresholds. The enrichment plots
of enriched clusters with t=0.01 are given Figure 5.6.
We can see from the GSEA analysis results that each of the two clusters resulted from
the CEC analysis of Male vs. Female Lymphoblastoid Cells Dataset are enriched, one
positively correlated with male phenotypes and one negatively correlated with female
phenotypes.
In order to show the affect of the gene cleaning threshold, the enrichment plots of the
analysis with t=0.001 is given in 5.7.
When threshold being equal to 0.001 is used, 9 clusters are found by CEC analysis. We
can see from the results that each of the 9 clusters are enriched by GSEA method and
4 clusters are positively correlated with male phenotypes and 5 clusters are negatively
correlated with female phenotypes.
72
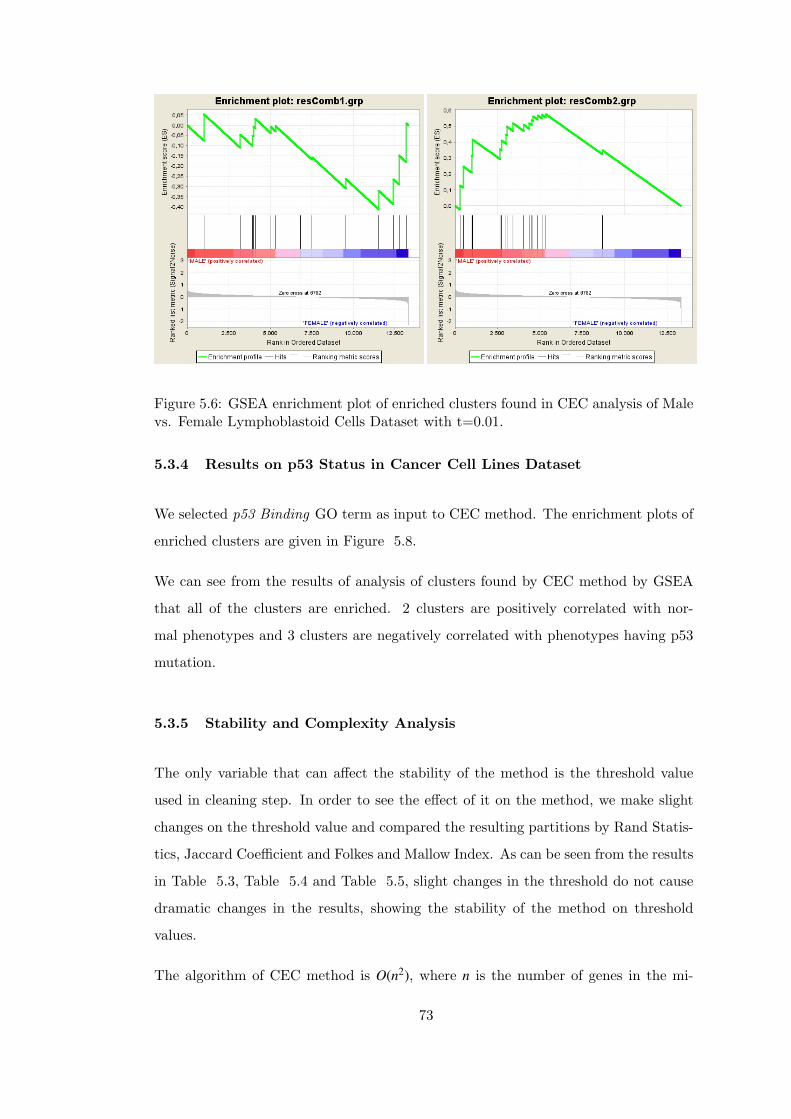
Figure 5.6: GSEA enrichment plot of enriched clusters found in CEC analysis of Malevs. Female Lymphoblastoid Cells Dataset with t=0.01.
5.3.4 Results on p53 Status in Cancer Cell Lines Dataset
We selected p53 Binding GO term as input to CEC method. The enrichment plots of
enriched clusters are given in Figure 5.8.
We can see from the results of analysis of clusters found by CEC method by GSEA
that all of the clusters are enriched. 2 clusters are positively correlated with nor-
mal phenotypes and 3 clusters are negatively correlated with phenotypes having p53
mutation.
5.3.5 Stability and Complexity Analysis
The only variable that can affect the stability of the method is the threshold value
used in cleaning step. In order to see the effect of it on the method, we make slight
changes on the threshold value and compared the resulting partitions by Rand Statis-
tics, Jaccard Coefficient and Folkes and Mallow Index. As can be seen from the results
in Table 5.3, Table 5.4 and Table 5.5, slight changes in the threshold do not cause
dramatic changes in the results, showing the stability of the method on threshold
values.
The algorithm of CEC method is O(n2), where n is the number of genes in the mi-
73
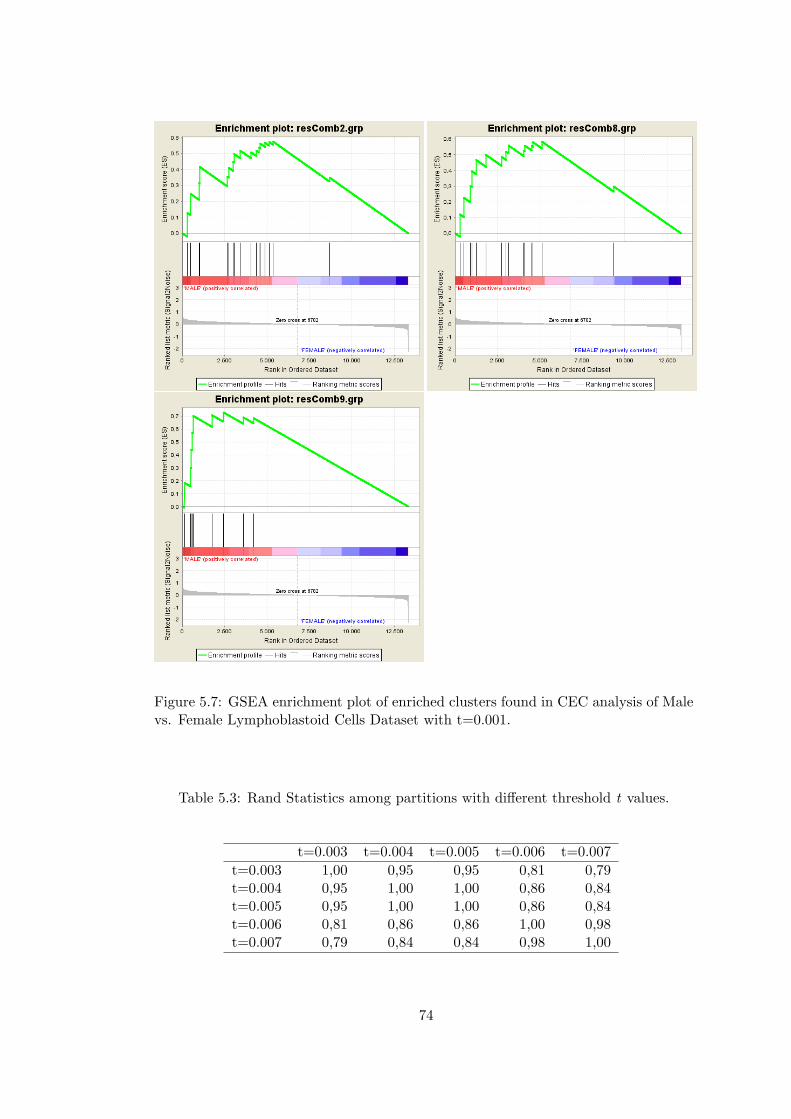
Figure 5.7: GSEA enrichment plot of enriched clusters found in CEC analysis of Malevs. Female Lymphoblastoid Cells Dataset with t=0.001.
Table 5.3: Rand Statistics among partitions with different threshold t values.
t=0.003 t=0.004 t=0.005 t=0.006 t=0.007t=0.003 1,00 0,95 0,95 0,81 0,79t=0.004 0,95 1,00 1,00 0,86 0,84t=0.005 0,95 1,00 1,00 0,86 0,84t=0.006 0,81 0,86 0,86 1,00 0,98t=0.007 0,79 0,84 0,84 0,98 1,00
74
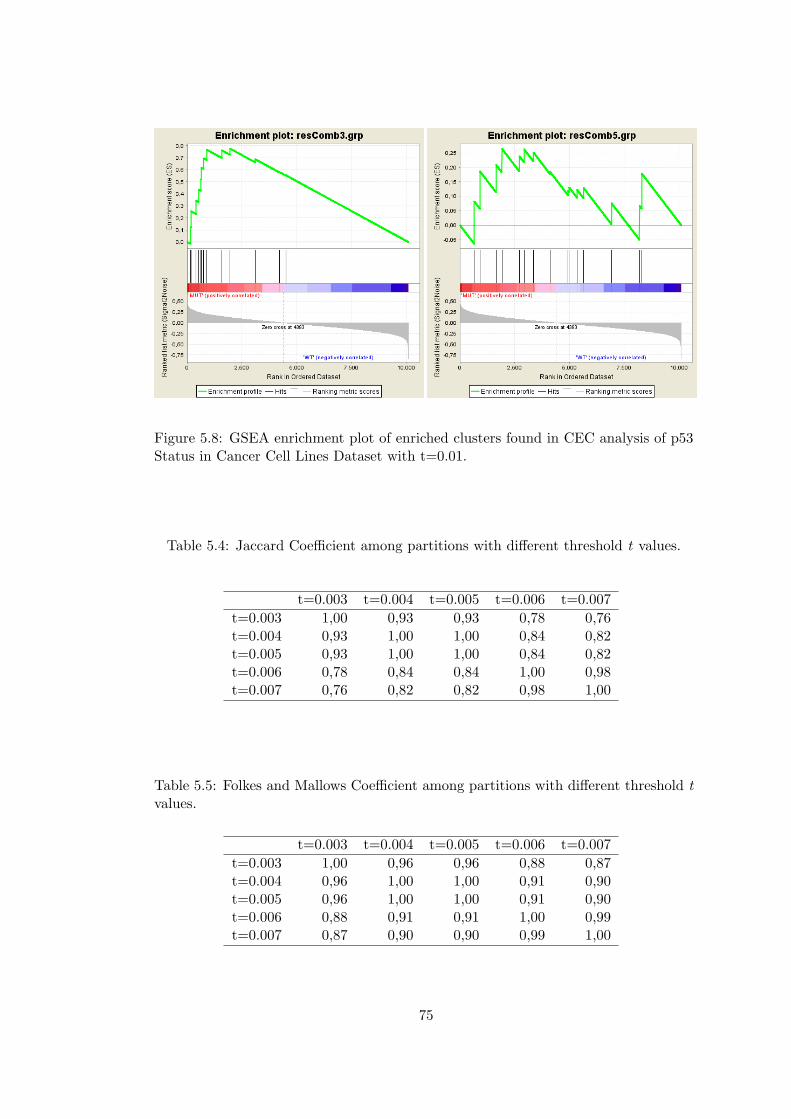
Figure 5.8: GSEA enrichment plot of enriched clusters found in CEC analysis of p53Status in Cancer Cell Lines Dataset with t=0.01.
Table 5.4: Jaccard Coefficient among partitions with different threshold t values.
t=0.003 t=0.004 t=0.005 t=0.006 t=0.007t=0.003 1,00 0,93 0,93 0,78 0,76t=0.004 0,93 1,00 1,00 0,84 0,82t=0.005 0,93 1,00 1,00 0,84 0,82t=0.006 0,78 0,84 0,84 1,00 0,98t=0.007 0,76 0,82 0,82 0,98 1,00
Table 5.5: Folkes and Mallows Coefficient among partitions with different threshold tvalues.
t=0.003 t=0.004 t=0.005 t=0.006 t=0.007t=0.003 1,00 0,96 0,96 0,88 0,87t=0.004 0,96 1,00 1,00 0,91 0,90t=0.005 0,96 1,00 1,00 0,91 0,90t=0.006 0,88 0,91 0,91 1,00 0,99t=0.007 0,87 0,90 0,90 0,99 1,00
75
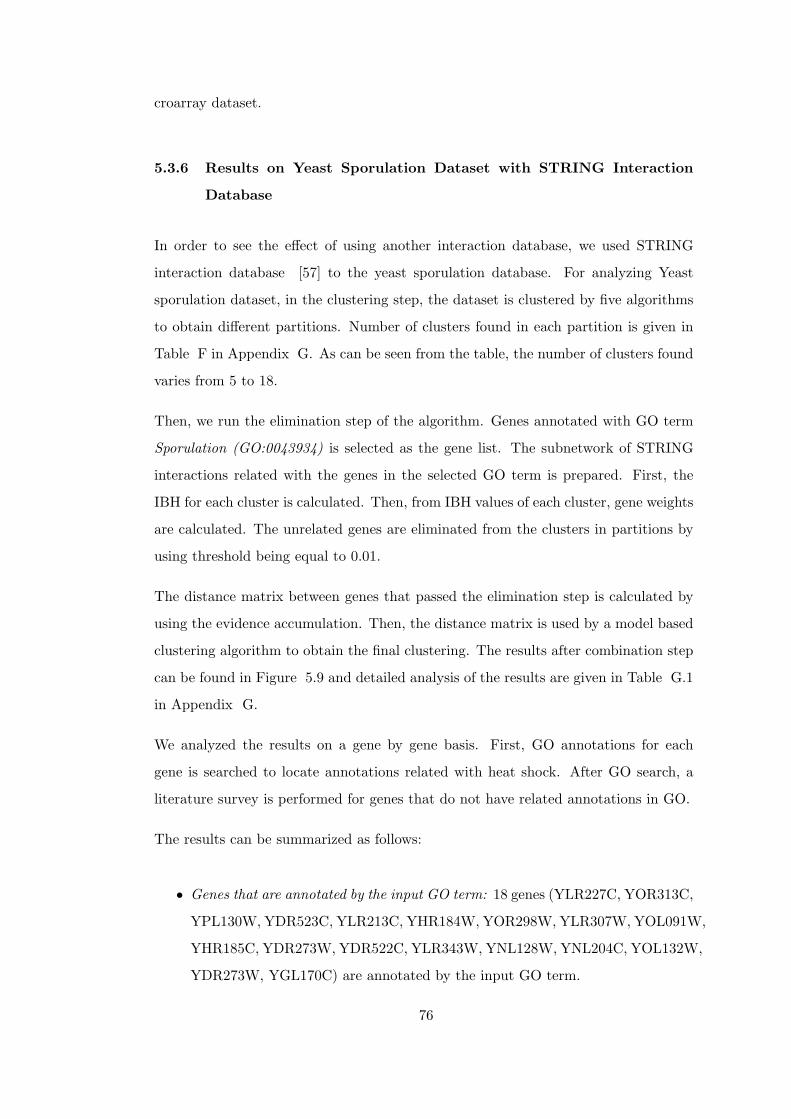
croarray dataset.
5.3.6 Results on Yeast Sporulation Dataset with STRING Interaction
Database
In order to see the effect of using another interaction database, we used STRING
interaction database [57] to the yeast sporulation database. For analyzing Yeast
sporulation dataset, in the clustering step, the dataset is clustered by five algorithms
to obtain different partitions. Number of clusters found in each partition is given in
Table F in Appendix G. As can be seen from the table, the number of clusters found
varies from 5 to 18.
Then, we run the elimination step of the algorithm. Genes annotated with GO term
Sporulation (GO:0043934) is selected as the gene list. The subnetwork of STRING
interactions related with the genes in the selected GO term is prepared. First, the
IBH for each cluster is calculated. Then, from IBH values of each cluster, gene weights
are calculated. The unrelated genes are eliminated from the clusters in partitions by
using threshold being equal to 0.01.
The distance matrix between genes that passed the elimination step is calculated by
using the evidence accumulation. Then, the distance matrix is used by a model based
clustering algorithm to obtain the final clustering. The results after combination step
can be found in Figure 5.9 and detailed analysis of the results are given in Table G.1
in Appendix G.
We analyzed the results on a gene by gene basis. First, GO annotations for each
gene is searched to locate annotations related with heat shock. After GO search, a
literature survey is performed for genes that do not have related annotations in GO.
The results can be summarized as follows:
• Genes that are annotated by the input GO term: 18 genes (YLR227C, YOR313C,
YPL130W, YDR523C, YLR213C, YHR184W, YOR298W, YLR307W, YOL091W,
YHR185C, YDR273W, YDR522C, YLR343W, YNL128W, YNL204C, YOL132W,
YDR273W, YGL170C) are annotated by the input GO term.
76
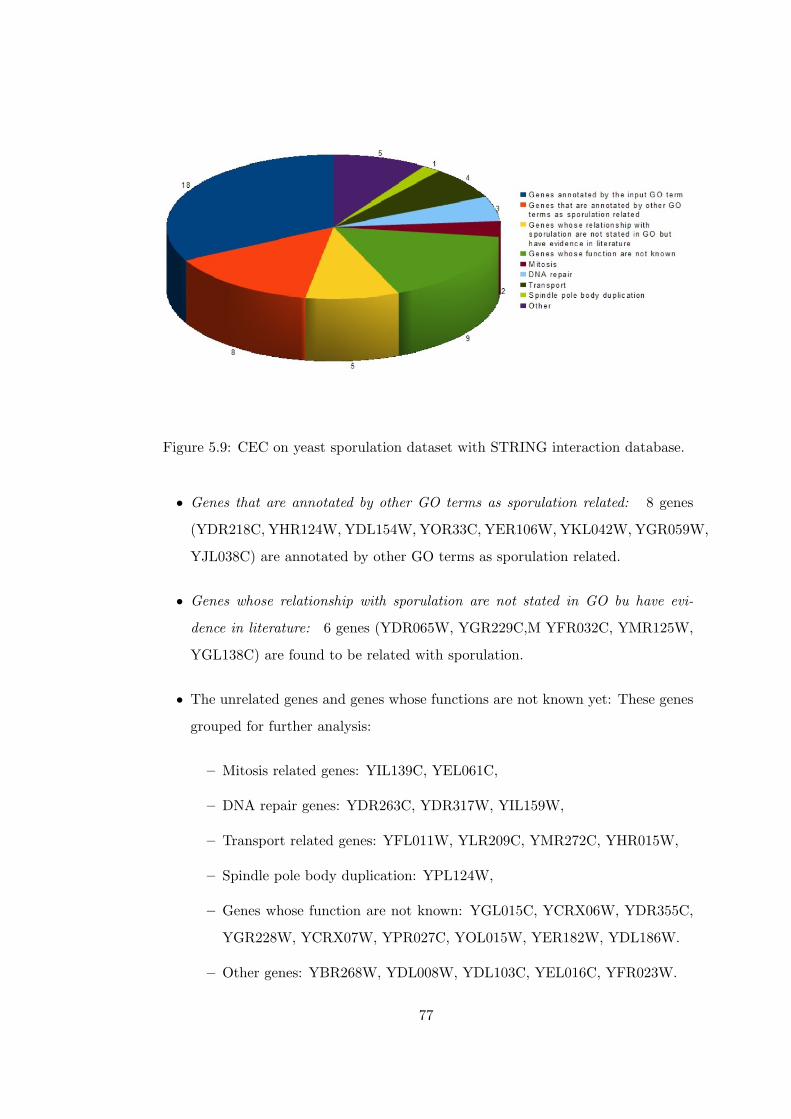
Figure 5.9: CEC on yeast sporulation dataset with STRING interaction database.
• Genes that are annotated by other GO terms as sporulation related: 8 genes
(YDR218C, YHR124W, YDL154W, YOR33C, YER106W, YKL042W, YGR059W,
YJL038C) are annotated by other GO terms as sporulation related.
• Genes whose relationship with sporulation are not stated in GO bu have evi-
dence in literature: 6 genes (YDR065W, YGR229C,M YFR032C, YMR125W,
YGL138C) are found to be related with sporulation.
• The unrelated genes and genes whose functions are not known yet: These genes
grouped for further analysis:
– Mitosis related genes: YIL139C, YEL061C,
– DNA repair genes: YDR263C, YDR317W, YIL159W,
– Transport related genes: YFL011W, YLR209C, YMR272C, YHR015W,
– Spindle pole body duplication: YPL124W,
– Genes whose function are not known: YGL015C, YCRX06W, YDR355C,
YGR228W, YCRX07W, YPR027C, YOL015W, YER182W, YDL186W.
– Other genes: YBR268W, YDL008W, YDL103C, YEL016C, YFR023W.
77

The summarized results of the application of CEC method on yeast sporulation
datasets with two different interaction databases, BioGRID and STRING are given
in 5.10. As can be seen from the results, the results of CEC method does not change
significantly with the change of interaction database used.
78
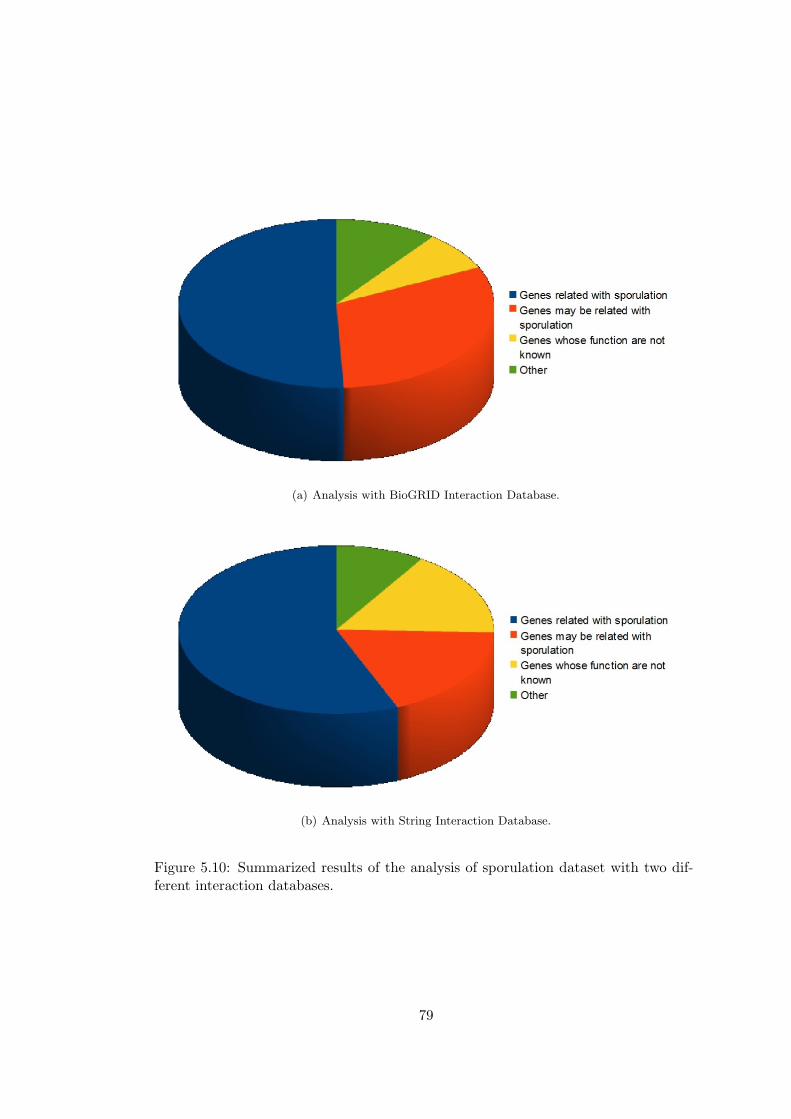
(a) Analysis with BioGRID Interaction Database.
(b) Analysis with String Interaction Database.
Figure 5.10: Summarized results of the analysis of sporulation dataset with two dif-ferent interaction databases.
79
CHAPTER 6
CONCLUSION
Microarrays are used to understand relationships between genes, extract pathways,
and in general to understand biological processes. With microarray technology, the
expression levels of the entire genome can be measured simultaneously. While mi-
croarrays provide a great opportunity, mining microarray data is a challenging task.
Methods to analyze microarray data should address the curse of dimensionality prob-
lem raised by the tens of thousands of genes versus small sample sizes. In order to
solve the curse of dimensionality problem and find genes related with the biological
process under inspection, methods should incorporate biological sources and use them
in the analysis.
In this study, we describe Cluster-Eliminate-Combine method which involves integra-
tion of two important biological resources, Gene Ontology (GO) [32] and interaction
networks in the analysis microarray data for eliminating unrelated genes from mi-
croarray data and allows us to find a clustering result containing only genes which are
related with the biological process under inspection.
CEC method depends heavily on Interaction Based Homogeneity (IBH) that we de-
scribe in Chapter 3. Interaction Based Homogeneity measure is the first study to use
interaction networks in the calculation of homogeneity, to the best of our knowledge.
In order to demonstrate the effectiveness of IBH, we compared it with different sim-
ilar popular measures. We applied two GO-based homogeneity measures, one using
Resnik’s similarity [69, 35] and the other using Wang’s similarity [33]. We applied
a KEGG-based enrichment score which is based on domainSignatures method [62].
Finally, we compared IBH with the popular DAVID tool’s enrichment scores with
80
IBH [60, 61]. We performed our experiments on two cases. In the first case, lists
of highly interacting genes were used and in the second case lists that are similar
according to Gene Ontology were used. We showed that IBH is very successful in dis-
tinguishing related lists from random lists and measuring randomness in both cases.
Gene Set Enrichment Analysis (GSEA) [31] is a popular method in the analysis of
microarray data. We applied IBH to create a ranked list from a microarray data, p53
dataset, and used GSEA method to locate enriched gene lists according to the ranked
list. Gene lists related with the biological process under inspection were enriched by
GSEA method, which proves the quality of the ranked list created by IBH.
We implemented an R [63] package called ibh containing several methods to calculate
IBH. The package is accepted to be included in Bioconductor which provides tools for
the analysis and comprehension of high-throughput genomic data and has an active
user community. ibh package is freely available through Bioconductor [42].
After demonstrating the effectiveness of Interaction Based Homogeneity, we presented
details of CEC method in Chapter 4. In CEC method, first, several partitions from
microarray data are made by applying different clustering algorithms to the data
or using different parameters on the same algorithm. An interaction subnetwork is
created by using the whole interaction network of the genome and the Gene Ontology
terms provided by the user presenting the biological process under inspection. Each
cluster contained in the partitions are evaluated by IBH and a gene weight is calculated
for each gene in the microarray data by using IBH values of the clusters that the gene
belongs to. The clusters are then cleaned up by gene weights and a threshold. Finally,
the cleaned clusters are combined by the cluster ensembles method using evidence
accumulation strategy [20, 21].
We selected an example dataset, GDS36 yeast heat shock dataset, and showed the
significance of each component of the method individually on this dataset. We pre-
sented results without contributon of Gene Ontology terms, without providing a real
interaction network and without the cluster cleaning. The addition of each component
have significant effects on the results as shown in Chapter 4.
Detailed results of CEC are given in Chapter 5. We presented results on another
81
yeast heat shock dataset, GDS1711 and on a popular yeast sporulation dataset. We
analyzed two microarray datasets contained in the original GSEA study, gender and
p53 datasets, by CEC method and applied GSEA on the resulting clusters. We showed
that the resulting clusters are also enriched by the GSEA method.
Another challenge in mining microarray data is to combine heterogeneous datasets
which contains different number of genes and different samples and measurement con-
ditions. CEC method can also address combination of heterogeneous datasets. We
provided an example application on the combination of seven heat shock datasets,
showing that CEC method reveals the genes that play a common role among seven
experiments.
The results given in Chapter 5 proves that application of CEC method reveals pre-
viously unknown biological information. As an example, in heat shock experiment
analysis the resulting clustering reveals the heat shock relevance of genes that plays
role in oxidative stress genes, hydrolase genes and general stress genes, although the
input GO term provided to the algorithm does not contain information about them.
The results of the analyses of CEC method are also supported by recent research as
can be seen from the manual analysis of CEC results.
In all of the above experiments we used BIOGRID [45] interaction database as the
information resource of the interaction network. To show that the method is not very
dependent on the BIOGRID database, we used another popular interaction database,
STRING [57], which contains known and predicted interactions. The results of CEC
by using STRING database are similar to the previous results.
Several improvements can be made to the CEC method. The current work on in-
teraction networks has a focus on weighted interaction networks [102, 103, 104].
Certain interaction networks such as STRING [57] provides scores for interactions.
CEC method can be extended to make use of such weighted interaction networks and
interaction scores. When the weighted interaction networks become more publicly
available, Interaction Based Homogeneity measure and gene weight calculation may
be adapted to use weighted interaction networks.
Interaction Based Homogeneity gives good results on protein complexes since is based
82
on pairwise interactions, but it does not perform well on signaling cascades. Another
improvement on the method can be on increasing the performance of Interaction Based
Homogeneity measure on signaling cascades. Interaction Based Homogeneity can be
changed to take transitive interactions into consideration to solve this problem and
increase its performance on signaling cascades.
Since the clustering part of the CEC method does not involve any special steps,
the method can be generalized to analyze other omics data such as proteomics or
metabolomics. The data can be clustered with different algorithms or parameters,
and then the elements in the clusters can be eliminated and combined in the same
way as analyzing microarray data.
83
REFERENCES
[1] R. S. Savage, K. Heller, Y. Xu, Z. Ghahramani, W. M. Truman, M. Grant,K. J. Denby, and D. L. Wild, “R/bhc: fast bayesian hierarchical clustering formicroarray data.,” BMC bioinformatics, vol. 10, pp. 242+, August 2009.
[2] L. Fu and E. Medico, “Flame, a novel fuzzy clustering method for the analysisof dna microarray data,” BMC Bioinformatics, vol. 8, pp. 3+, 2007.
[3] J. Ernst, G. J. Nau, and Z. Bar-Joseph, “Clustering short time series gene ex-pression data,” Bioinformatics, vol. 21, no. 1, pp. 159–168, 2005.
[4] H. Hussain, K. Benkrid, H. Seker, and A. Erdogan, “Fpga implementation ofk-means algorithm for bioinformatics application: An accelerated approach toclustering microarray data,” in Adaptive Hardware and Systems (AHS), pp. 248–255, IEEE, 2011.
[5] Budhayash Gautam, Pramod Katara, Satendra Singh, and Rohit Farmer,“Drug target identification using gene expression microarray data of toxoplasmagondii,” International Journal of Biometrics and Bioinformatics (IJBB), vol. 4,no. 3, pp. 248–255, 2010.
[6] H.-H. Ko, K.-J. Tseng, L.-M. Wei, and M.-H. Tsai, “Possible disease-link geneticpathways constructed by hierarchical clustering and conditional probabilitiesof ovarian carcinoma microarray data,” in Intelligent Information Hiding andMultimedia Signal Processing (IIH-MSP), pp. 1–4, IEEE, 2010.
[7] Emma J Cooke, Richard S Savage, Paul DW Kirk, Robert Darkins, and DavidL Wild, “Bayesian hierarchical clustering for microarray time series data withreplicates and outlier measurements,” BMC Bioinformatics, vol. 12, no. 399,2011.
[8] C. Huttenhower, A. Flamholz, J. Landis, S. Sahi, C. Myers, K. Olszewski, M. Hi-bbs, N. Siemers, O. Troyanskaya, and H. Coller, “Nearest Neighbor Networks:clustering expression data based on gene neighborhoods,” BMC Bioinformatics,vol. 8, no. 1, pp. 250+, 2007.
[9] P. C. Saez, R. P. Marqui, F. Tirado, J. Carazo, and A. P. Montano, “Biclusteringof gene expression data by non-smooth non-negative matrix factorization,”BMCBioinformatics, vol. 7, no. 1, pp. 78+, 2006.
[10] A. Tanay, R. Sharan, and R. Shamir, “Biclustering Algorithms: A Survey,” inIn Handbook of Computational Molecular Biology Edited by: Aluru S. Chapman& Hall/CRC Computer and Information Science Series, 2005.
84
[11] A. Prelic, S. Bleuler, P. Zimmermann, A. Wille, P. Buhlmann, W. Gruissem,L. Hennig, L. Thiele, and E. Zitzler, “A systematic comparison and evalua-tion of biclustering methods for gene expression data,” Bioinformatics, vol. 22,pp. 1122–1129, May 2006.
[12] A. Schliep, I. G. Costa, C. Steinhoff, and A. Schonhuth, “Analyzing gene ex-pression time-courses,” IEEE/ACM Trans. Comput. Biol. Bioinformatics, vol. 2,pp. 179–193, July 2005.
[13] L. Sacchi, R. Bellazzi, C. Larizza, P. Magni, T. Curk, U. Petrovic, and B. Zupan,“TA-clustering: Cluster analysis of gene expression profiles through TemporalAbstractions,” International Journal of Medical Informatics, vol. 74, pp. 505–517, Aug. 2005.
[14] P. Magni, F. Ferrazzi, L. Sacchi, and R. Bellazzi, “TimeClust: a clustering toolfor gene expression time series,”Bioinformatics, vol. 24, pp. 430–432, Feb. 2008.
[15] R. D. Bin and D. Risso, “The STRING database in 2011: functional interac-tion networks of proteins, globally integrated and scored,”BMC Bioinformatics,vol. 12, no. 49, 2011.
[16] A. Strehl and J. Ghosh, “Cluster Ensembles – A Knowledge Reuse Frameworkfor Combining Partitionings,” in Proceedings of AAAI 2002, Edmonton, Canada,pp. 93–98, AAAI, July 2002.
[17] A. Topchy, A. K. Jain, and W. Punch, “Clustering ensembles: models of con-sensus and weak partitions,” Pattern Analysis and Machine Intelligence, IEEETransactions on, vol. 27, pp. 1866–1881, Oct. 2005.
[18] R. Singh, J. Xu, and B. Berger, “Pairwise Global Alignment of Protein Inter-action Networks by Matching Neighborhood Topology,” Research in Computa-tional Molecular Biology, pp. 16–31, 2007.
[19] A. P. Topchy, M. H. C. Law, A. K. Jain, and A. L. Fred, “Analysis of consensuspartition in cluster ensemble,” in Data Mining, 2004. ICDM 2004. Proceedings.Fourth IEEE International Conference on, pp. 225–232, 2004.
[20] A. L. N. Fred and A. K. Jain, “Data Clustering Using Evidence Accumulation,”Pattern Recognition, International Conference on, vol. 4, pp. 40276+, 2002.
[21] A. L. N. Fred and A. K. Jain, “Combining Multiple Clusterings Using EvidenceAccumulation,” IEEE Transactions on Pattern Analysis and Machine Intelli-gence, vol. 27, pp. 835–850, June 2005.
[22] X. Hu and I. Yoo, “Ecluster ensemble and its applications in gene expres-sion analysis.,” in Second Asia-Pacific Bioinformatics Conference (APBC2004),pp. 297–302, 2004.
[23] Z. Yu, H.-S. Wong, and H. Wang, “Graph-based consensus clustering for classdiscovery from gene expression data,” Bioinformatics, vol. 23, pp. 2888–2896,Nov. 2007.
[24] S. Chakrabarti and A. Panchenko, “Ensemble approach to predict specificity de-terminants: benchmarking and validation,” BMC Bioinformatics, vol. 10, no. 1,pp. 207+, 2009.
85
[25] E. Glaab, J. M. Garibaldi, and N. Krasnogor, “ArrayMining: a modular web-application for microarray analysis combining ensemble and consensus methodswith cross-study normalization.,” BMC bioinformatics, vol. 10, no. 1, pp. 358+,2009.
[26] F. Al-Shahrour, P. Minguez, J. M. Vaquerizas, L. Conde, and J. Dopazo, “Ba-belomics: a systems biology perspective in the functional annotation of genome-scale experiments.,”Nucleic Acids Res, vol. 34, no. Web Server issue, pp. W472–6, 2006.
[27] M. Paszkowski-Rogacz, M. Slabicki, M. T. Pisabarro, and F. Buchholz, “Phe-nofam - gene set enrichment analysis through protein structural information.,”BMC bioinformatics, vol. 11, pp. 254+, May 2010.
[28] S. D. Jani, G. L. Argraves, J. L. Barth, and W. S. Argraves, “Genemesh: aweb-based microarray analysis tool for relating differentially expressed genes tomesh terms.,” BMC bioinformatics, vol. 11, pp. 166+, April 2010.
[29] A. Lachmann and A. Ma’ayan, “List2networks: Integrated analysis ofgene/protein lists,” BMC Bioinformatics, vol. 11, pp. 87+, 2010.
[30] R. Maglietta, A. Piepoli, D. Catalano, F. Licciulli, M. Carella, S. Liuni,G. Pesole, F. Perri, and N. Ancona, “Statistical assessment of functional cate-gories of genes deregulated in pathological conditions by using microarray data.,”Bioinformatics (Oxford, England), vol. 23, pp. 2063–2072, August 2007.
[31] A. Subramanian, P. Tamayo, V. Mootha, S. Mukherjee, B. Ebert, M. Gillette,A. Paulovich, S. Pomeroy, T. Golub, E. Lander, and J. Mesirov, “Gene setenrichment analysis: a knowledge-based approach for interpreting genome-wideexpression profiles.,” Proc Natl Acad Sci U S A, vol. 102, no. 43, pp. 15545–50,2005.
[32] M. Ashburner, C. A. Ball, J. A. Blake, D. Botstein, H. Butler, J. M. Cherry, A. P.Davis, K. Dolinski, S. S. Dwight, J. T. Eppig, M. A. Harris, D. P. Hill, L. Issel-Tarver, A. Kasarskis, S. Lewis, J. C. Matese, J. E. Richardson, M. Ringwald,G. M. Rubin, and G. Sherlock,“Gene ontology: tool for the unification of biology.the gene ontology consortium.,” Nature genetics, vol. 25, pp. 25–29, May 2000.
[33] J. Wang, Z. Du, R. Payattakool, P. Yu, and C. Chen, “A new method to measurethe semantic similarity of go terms.,” Bioinformatics, vol. 23, no. 10, pp. 1274–1281, 2007.
[34] S. Datta and S. Datta, “Methods for evaluating clustering algorithms for geneexpression data using a reference set of functional classes,”BMC Bioinformatics,vol. 7, p. 397, 2006.
[35] P. W. Lord, R. D. Stevens, A. Brass, and C. A. Goble, “Investigating semanticsimilarity measures across the gene ontology: the relationship between sequenceand annotation,” Bioinformatics, vol. 19, pp. 1275–1283, July 2003.
[36] J. Wang, X. Zhou, J. Zhu, C. Zhou, and Z. Guo, “Revealing and avoiding biasin semantic similarity scores for protein pairs,” BMC Bioinformatics, vol. 11,no. 1, pp. 290+, 2010.
86
[37] M. Brameier and C. Wiuf, “Co-clustering and visualization of gene expressiondata and gene ontology terms for saccharomyces cerevisiae using self-organizingmaps.,” J Biomed Inform, vol. 40, no. 2, pp. 160–173, 2006.
[38] B. Sheehan, A. Quigley, B. Gaudin, and S. Dobson, “A relation based measure ofsemantic similarity for gene ontology annotations,” BMC Bioinformatics, vol. 9,no. 1, pp. 468+, 2008.
[39] A. Schlicker, F. S. Domingues, J. Rahnenfuhrer, and T. Lengauer, “A new mea-sure for functional similarity of gene products based on gene ontology,” BMCBioinformatics, vol. 7, pp. 302+, 2006.
[40] H. Frohlich, N. Speer, A. Poustka, and T. Beissbarth, “Gosim - an r-packagefor computation of information theoretic go similarities between terms and geneproducts,” BMC Bioinformatics, vol. 8, pp. 166+, 2007.
[41] G. Yu, F. Li, Y. Qin, X. Bo, Y. Wu, and S. Wang, “Gosemsim: an r packagefor measuring semantic similarity among go terms and gene products.,” Bioin-formatics (Oxford, England), vol. 26, pp. 976–978, April 2010.
[42] R. C. Gentleman, V. J. Carey, D. M. Bates, B. Bolstad, M. Dettling, S. Du-doit, B. Ellis, L. Gautier, Y. Ge, J. Gentry, K. Hornik, T. Hothorn, W. Huber,S. Iacus, R. Irizarry, F. Leisch, C. Li, M. Maechler, A. J. Rossini, G. Sawitzki,C. Smith, G. Smyth, L. Tierney, J. Y. Yang, and J. Zhang, “Bioconductor: opensoftware development for computational biology and bioinformatics.,” Genomebiology, vol. 5, no. 10, pp. R80+, 2004.
[43] R. Karthik, “Construction and analysis of protein protein interaction networks,”Automated Experimentation, vol. 2, no. 1, pp. 2+, 2010.
[44] P. Bork, L. J. Jensen, C. von Mering, A. K. Ramani, I. Lee, and E. M. Mar-cotte”, “Protein interaction networks from yeast to human,” Current Opinion inStructural Biology, vol. 14, no. 3, pp. 292–9, 2004.
[45] C. Stark, B. J. Breitkreutz, T. Reguly, L. Boucher, A. Breitkreutz, and M. Ty-ers, “Biogrid: a general repository for interaction datasets.,” Nucleic Acids Res,vol. 34, January 2006.
[46] K. A. Pattin and J. H. Moore, “Large-scale temporal gene expression mappingof central nervous system development,” Expert Review of Proteomics, vol. 6,no. 6, pp. 647–659, 2009.
[47] A. Marco and I. Marin, “Interactome and gene ontology provide congruent yetsubtly different views of a eukaryotic cell,” BMC Systems Biology, vol. 3, no. 1,pp. 69+, 2009.
[48] G. Gan, C. Ma, and J. Wu, Data Clustering: Theory, Algorithms, and Applica-tions (ASA-SIAM Series on Statistics and Applied Probability). SIAM, 2007.
[49] S.-H. Yeh, H.-Y. Yeh, and V.-W. Soo, “A network flow approach to predictdrug targets from microarray data, disease genes and interactome network -case study on prostate cancer,” Journal of Clinical Bioinformatics, vol. 2, no. 1,2012.
87
[50] J. Zhao, T.-H. Yang, Y. Huang, and P. Holme, “Ranking candidate disease genesfrom gene expression and protein interaction: A katz-centrality based approach,”Plos one, vol. 6, no. 9, 2011.
[51] S.-A. Lee, T. T.-H. Tsao, K.-C. Yang, H. Lin, Y.-L. Kuo, C.-H. Hsu, W.-K. Lee,K.-C. Huang, and C.-Y. Kao, “Construction and analysis of the protein-proteininteraction networks for schizophrenia, bipolar disorder, and major depression,”BMC Bioinformatics, vol. 12, no. 13, 2011.
[52] M. Smoot, K. Ono, T. Ideker, and S. Maere, “Pingo: a cytoscape plugin to findcandidate genes in biological networks,”Bioinformatics, vol. 27, no. 7, pp. 1030–1031, 2011.
[53] I. Priness, O. Maimon, and I. Ben-Gal, “Evaluation of gene-expression clusteringvia mutual information distance measure.,” BMC Bioinformatics, vol. 8, no. 1,p. 111, 2007.
[54] T. T. Nguyen, R. R. Almon, D. C. DuBois, W. J. Jusko, and I. P. Androulakis,“Importance of replication in analyzing time-series gene expression data: Cor-ticosteroid dynamics and circadian patterns in rat liver,” BMC Bioinformatics,vol. 11, no. 1, pp. 279+, 2010.
[55] R. Shamir, A. Maron-Katz, A. Tanay, C. Linhart, I. Steinfeld, R. Sharan,Y. Shiloh, and R. Elkon, “Expander–an integrative program suite for microarraydata analysis.,” BMC Bioinformatics, vol. 6, 2005.
[56] B. Aranda, P. Achuthan, Y. Alam-Faruque, I. Armean, A. Bridge, C. Derow,M. Feuermann, A. T. Ghanbarian, S. Kerrien, J. Khadake, J. Kerssemakers,C. Leroy, M. Menden, M. Michaut, L. Montecchi-Palazzi, S. N. Neuhauser,S. Orchard, V. Perreau, B. Roechert, K. van Eijk, and H. Hermjakob, “TheIntAct molecular interaction database in 2010,” Nucleic Acids Research, vol. 38,pp. D525–D531, Oct. 2009.
[57] D. Szklarczyk, A. Franceschini, M. Kuhn, M. Simonovic, A. Roth, P. Minguez,T. Doerks, M. Stark, J. Muller, P. Bork, L. J. Jensen, and C. von Mering, “TheSTRING database in 2011: functional interaction networks of proteins, globallyintegrated and scored,”Nucleic Acids Research, vol. 39, no. 1, pp. 561–568, 2011.
[58] P. Pagel, S. Kovac, M. Oesterheld, B. Brauner, I. Dunger-Kaltenbach, G. Frish-man, C. Montrone, P. Mark, V. Stumpflen, H.-W. W. Mewes, A. Ruepp, andD. Frishman, “The MIPS mammalian protein-protein interaction database.,”Bioinformatics (Oxford, England), vol. 21, pp. 832–834, Mar. 2005.
[59] A. Ceol, A. Chatr Aryamontri, L. Licata, D. Peluso, L. Briganti, L. Perfetto,L. Castagnoli, and G. Cesareni, “MINT, the molecular interaction database:2009 update,” Nucleic Acids Research, vol. 38, pp. D532–D539, Jan. 2010.
[60] D. W. Huang, B. T. Sherman, and R. A. Lempicki, “Bioinformatics enrichmenttools: paths toward the comprehensive functional analysis of large gene lists,”Nucleic Acids Research, vol. 37, pp. 1–13, Jan. 2009.
[61] D. W. Huang, B. T. Sherman, and R. A. Lempicki, “Systematic and integra-tive analysis of large gene lists using DAVID bioinformatics resources,” Nat.Protocols, vol. 4, no. 1, pp. 44–57, 2008.
88
[62] F. Hahne, A. Mehrle, D. Arlt, A. Poustka, S. Wiemann, and T. Beissbarth,“Extending pathways based on gene lists using InterPro domain signatures,”BMC Bioinformatics, vol. 9, pp. 3+, Jan. 2008.
[63] R. Ihaka and R. Gentleman, “R: A language for data analysis and graphics,”Journal of Computational and Graphical Statistics, vol. 5, no. 3, pp. 299–314,1996.
[64] J. Yu, S. Pacifico, G. Liu, and R. Finley, “DroID: the Drosophila InteractionsDatabase, a comprehensive resource for annotated gene and protein interac-tions,” BMC Genomics, vol. 9, pp. 461+, Oct. 2008.
[65] T. Murali, S. Pacifico, J. Yu, S. Guest, G. G. Roberts, and R. L. Finley, “DroID2011: a comprehensive, integrated resource for protein, transcription factor,RNA and gene interactions for Drosophila,” Nucleic Acids Research, vol. 39,pp. D736–D743, Jan. 2011.
[66] K. R. Brown and I. Jurisica, “Unequal evolutionary conservation of humanprotein interactions in interologous networks.,” Genome Biology, vol. 8, no. 5,p. R95, 2007.
[67] K. R. Brown and I. Jurisica, “Online predicted human interaction database.,”Bioinformatics (Oxford, England), vol. 21, pp. 2076–2082, May 2005.
[68] T. Ruths, D. Ruths, and L. Nakhleh, “Gs2: an efficiently computable measureof go-based similarity of gene sets.,” Bioinformatics (Oxford, England), vol. 25,pp. 1178–1184, May 2009.
[69] P. Resnik, “Using information content to evaluate semantic similarity in a tax-onomy,” in IJCAI, pp. 448–453, 1995.
[70] T. V. Prasad, R. P. Babu, and S. I. Ahson,“Gedas - gene expression data analysissuite,” Bioinformation, vol. 1, no. 3, pp. 83–85, 2006.
[71] C. Fraley and A. Raftery, “mclust package@ONLINE,” 2012.
[72] A. P. Gasch, P. T. Spellman, C. M. Kao, O. Carmel-Harel, M. B. Eisen, G. Storz,D. Botstein, and P. O. Brown, “Genomic expression programs in the response ofyeast cells to environmental changes.,” Mol Biol Cell, vol. 11, no. 12, pp. 4241–4257, 2000.
[73] A. Gasch, “The environmental stress response: a common yeast response toenvironmental stresses. in yeast stress responses,” Topics in Current Genetics,vol. 1, no. 2, pp. 11–70, 2002.
[74] J. Rand and C. Grant, “The thioredoxin system protects ribosomes againststress-induced aggregation.,” Mol Biol Cell, vol. 17, no. 1, pp. 387–401, 2006.
[75] Legras, J.L., Erny, C., Jeune C. L., M. Lollier, Y. Adolphe, and C. Demuyter,“Activation of two different resistance mechanisms in saccharomyces cerevisiaeupon exposure to octanoic and decanoic acids,” APPLIED AND ENVIRON-MENTAL MICROBIOLOGY, vol. 76, no. 22, p. 75267535, 2010.
89
[76] X. Liu, X. Zhang, C. Wang, L. Liu, M. Lei, and X. Bao, “Genetic and compara-tive transcriptome analysis of bromodomain factor 1 in the salt stress responseof saccharomyces cerevisiae,” Curr Microbiol, vol. 54, no. 4, pp. 325–330, 2007.
[77] C. Bermejo, R. Garcıa, A. Straede, J. M. Rodrıguez-Pena, C. Nombela, J. J.Heinisch, and J. Arroyo, “Characterization of sensor-specific stress response bytranscriptional profiling of wsc1 and mid2 deletion strains and chimeric sensorsin saccharomyces cerevisiae,” OMICS, vol. 14, no. 6, pp. 679–688, 2010.
[78] K. Sakaki, K. Tashiro, S. Kuhara, and K. Mihara, “Response of genes asso-ciated with mitochondrial function to mild heat stress in yeast saccharomycescerevisiae,” J Biochem, vol. 134, no. 3, pp. 373–384, 2003.
[79] M. Taylor, M. Tuffin, S. Burton, K. Eley, and D. Cowan, “Microbial responsesto solvent and alcohol stress,” Biotechnol J, vol. 3, no. 11, pp. 1388–1397, 2008.
[80] A. A. Petti, C. A. Crutchfield, J. D. Rabinowitz, and D. Botsteina, “Survivalof starving yeast is correlated with oxidative stress response and nonrespiratorymitochondrial function,” Proc Natl Acad Sci, vol. 108, no. 34, pp. –, 2011.
[81] N. Malys and J. McCarthy, “Dcs2, a novel stress-induced modulator of m7gpppxpyrophosphatase activity that locates to p bodies,” J Mol Biol, vol. 363, no. 2,pp. 370–382, 2006.
[82] C. R and B. A, “The stress-induced tfs1p requires natb-mediated acetylation toinhibit carboxypeptidase y and to regulate the protein kinase a pathway,” J BiolChem, vol. 279, no. 37, pp. 38532–38543, 2004.
[83] N. Zhang, J. Wu, and S. G. Oliver, “Gis1 is required for transcriptional repro-gramming of carbon metabolism and the stress response during transition intostationary phase in yeast,” Microbiology, vol. 155, no. 5, pp. 1690–1690, 2009.
[84] P. Lee, B. Bochner, and A. BN, “Appppa, heat-shock stress, and cell oxidation,”Proc Natl Acad Sci, vol. 80, no. 24, pp. 7496–7500, 1983.
[85] B. Alberts, A. Johnson, J. Lewis, M. Raff, K. Roberts, and P. Walter, Molecularbiology of the cell. Garland Science, 5 ed., 2007.
[86] S. Carbon, A. Ireland, C. J. Mungall, S. Shu, B. Marshall, S. Lewis, AmiGOHub, and Web Presence Working Group, “AmiGO: online access to ontologyand annotation data.,” Bioinformatics (Oxford, England), vol. 25, pp. 288–289,Jan. 2009.
[87] A. Subramanian, P. Tamayo, V. K. Mootha, S. Mukherjee, B. L. Ebert, M. A.Gillette, A. Paulovich, S. L. Pomeroy, T. R. Golub, E. S. Lander, and J. P.Mesirov, “Gene set enrichment analysis: A knowledge-based approach for inter-preting genome-wide expression profiles,” Proceedings of the National Academyof Sciences of the United States of America, vol. 102, pp. 15545–15550, Oct.2005.
[88] S. Chu, J. DeRisi, M. Eisen, J. Mulholland, D. Botstein, P. O. Brown, andI. Herskowitz, “The transcriptional program of sporulation in budding yeast.,”Science, vol. 282, no. 5389, pp. 699–705, 1998.
90
[89] R. Matsumoto, K. Akama, R. Rakwal, and H. Iwahashi, “The stress responseagainst denatured proteins in the deletion of cytosolic chaperones ssa1/2 is dif-ferent from heat-shock response in saccharomyces cerevisiae,” BMC Genomics,vol. 6, no. 141, pp. –, 2005.
[90] K. Rabitsch, A. Toth, M. Galova, A. Schleiffer, G. Schaffner, E. Aigner, C. Rupp,A. Penkner, A. Moreno-Borchart, M. Primig, R. Esposito, F. Klein, M. Knop,and K. Nasmyth, “A screen for genes required for meiosis and spore formationbased on whole-genome expression,” Curr Biol, vol. 11, no. 3, pp. 1001–1009,2001.
[91] S. Ivakhno and A. Kornelyuk, “Bioinformatic analysis of changes in expressionlevel of tyrosyl-trna synthetase during sporulation process in saccharomyces cere-visiae,” Mikrobiol Z, vol. 67, no. 5, pp. 37–49, 2005.
[92] R. D. Hontz, R. O. Niederer, J. M. Johnson, and J. S. Smith, “Genetic identi-fication of factors that modulate ribosomal dna transcription in saccharomycescerevisiae,” Genetics, vol. 182, no. 1, pp. 105–119, 2009.
[93] A. M. Deutschbauer, R. M. Williams, A. M. Chu, and R. W. Davis, “Parallelphenotypic analysis of sporulation and postgermination growth in saccharomycescerevisiae,” Proc Natl Acad Sci, vol. 99, no. 24, pp. 15530–15535, 2002.
[94] S. Project, “Saccharomyces genome database,” Sept. 2011.
[95] J. Lopes, M. J. Pinto, A. Rodrigues, F. Vasconcelos, and R. Oliveira, “Thesaccharomyces cerevisiae genes, aim45, ygr207c/cir1 and yor356w/cir2, are in-volved in cellular redox state under stress conditions,” Open Microbiol, vol. 4,no. -, pp. 75–82, 2010.
[96] M. Proft and K. Struhl, “Map kinase-mediated stress relief that precedes andregulates the timing of transcriptional induction,” Cell, vol. 118, no. 3, pp. 351–361, 2004.
[97] V. K. Vyas, C. D. Berkey, T. Miyao, and M. Carlson, “Repressors Nrg1 andNrg2 Regulate a Set of Stress-Responsive Genes in Saccharomyces cerevisiae,”Eukaryotic Cell, vol. 4, no. 11, pp. 1882–1891, 2005.
[98] S. Bradamante, A. Villa, S. Versari, L. Barenghi, I. Orlandi, and M. Vai, “Ox-idative stress and alterations in actin cytoskeleton trigger glutathione efflux insaccharomyces cerevisiae,” Biochim Biophys Acta, vol. 1803, no. 12, pp. 1376–1385, 2010.
[99] E. Klopf, L. Paskova, C. Sole, G. Mas, A. Petryshyn, F. Posasm, U. Winters-berger, G. Ammerer, and C. Schuller, “Cooperation between the ino80 complexand histone chaperones determines adaptation of stress gene transcription in theyeast saccharomyces cerevisiae,” Molecular and Cellular Biology, vol. 29, no. 18,pp. 4994–5007, 2009.
[100] Y. Tsujimoto, S. Izawa, and Y. Inoue, “Cooperative regulation of dog2, encoding2-deoxyglucose-6-phosphate phosphatase, by snf1 kinase and the high-osmolarityglycerol-mitogen-activated protein kinase cascade in stress responses of saccha-romyces cerevisiae,” J Bacteriol, vol. 182, no. 18, pp. 5121–5126, 2000.
91
[101] M. Olivier, R. Eeles, M. Hollstein, and C. C. . H. Khan, M. A. Harris, “The iarctp53 database: new online mutation analysis and recommendations to users,”Hum. Mutat., vol. 19, no. -, pp. 607–614, 2002.
[102] A. Patil, K. Nakai, and H. Nakamura,“HitPredict: a database of quality assessedproteinprotein interactions in nine species,” Nucleic Acids Research, vol. 39,pp. D744–D749, Jan. 2011.
[103] L. Hu, T. Huang, X. Shi, W.-C. Lu, Y.-D. Cai, and K.-C. Chou, “PredictingFunctions of Proteins in Mouse Based on Weighted Protein-Protein InteractionNetwork and Protein Hybrid Properties,” PLoS ONE, vol. 6, pp. e14556+, Jan.2011.
[104] G. Kritikos, C. Moschopoulos, M. Vazirgiannis, and S. Kossida, “Noise reductionin protein-protein interaction graphs by the implementation of a novel weightingscheme,” BMC Bioinformatics, vol. 12, no. 239, 2011.
[105] P. T. Spellman, G. Sherlock, M. Q. Zhang, V. R. Iyer, K. Anders, M. B. Eisen,P. O. Brown, D. Botstein, and B. Futcher, “Comprehensive identification ofcell cycle-regulated genes of the yeast saccharomyces cerevisiae by microarrayhybridization.,” Mol Biol Cell, vol. 9, no. 12, pp. 3273–3297, 1998.
[106] S. Ben-Aroya, C. Coombes, T. Kwok, K. O’Donnell, J. Boeke, and P. Hieter,“Toward a comprehensive temperature-sensitive mutant repository of the essen-tial genes of saccharomyces cerevisiae,” Mol Cell, vol. 30, no. 2, pp. 248–258,2008.
[107] H. Sinha, L. David, R. Pascon, S. Clauder-Munster, S. Krishnakumar,M. Nguyen, G. Shi, J. Dean, R. Davis, P. Oefner, J. McCusker, and L. Stein-metz, “Sequential elimination of major-effect contributors identifies additionalquantitative trait loci conditioning high-temperature growth in yeast,”Genetics,vol. 180, no. 3, pp. 1661–1670, 2008.
[108] C. Auesukaree, A. Damnernsawad, M. Kruatrachue, P. Pokethitiyook,C. Boonchird, Y. Kaneko, and S. Harashima, “Genome-wide identification ofgenes involved in tolerance to various environmental stresses in saccharomycescerevisiae,” J Appl Genet, vol. 50, no. 3, pp. 301–310, 2009.
[109] B. Akache, K. Wu, and B. Turcotte, “Phenotypic analysis of genes encodingyeast zinc cluster proteins,” Nucleic Acids Res., vol. 10, no. 29, pp. 2181–90,2001.
[110] Briza, P., Bogengruber, E., Thur, A., Rutzler, M., Munsterkotter, M., Dawes,IW., and Breitenbach, M., “Systematic analysis of sporulation phenotypes in624 non-lethal homozygous deletion strains of saccharomyces cerevisiae,” Yeast,vol. 19, no. 5, pp. 403–422, 2002.
92
Appendix A
ibh SOFTWARE PACKAGE
ibh software package contains methods to calculate Interaction Based Homogeneity
(IBH), a measure to evaluate the relationship of gene lists with respect to an interaction
network. ibh package is developed in R and it is freely available through Bioconductor.
In ibh package, researchers may make use of predefined interaction networks as well
as their own interaction networks. In addition to using gene lists as input, methods
in the package enable the user to directly employ the clustering results as input for
the evaluation with IBH.
ibh software package is implemented in R and it is submitted to Bioconductor. ibh
package contains easy to use functions. We also created an experimental data pack-
age called simpIntLists. simpIntLists package contains interaction networks which are
generated from the latest version of BioGRID interactions. simpIntLists is used by
functions of ibh package in which predefined interactions are used. simpIntLists con-
tains interactions for seven organisms: Arabidopsis thaliana, Caenerhabditis elegans,
Drosophila melanogaster, Homo sapiens, Mus musculus, Saccharomyces cerevisae, and
Schizosaccharomyces pombe. Unique identifiers, official names or Entrez identifiers
can be used as identifiers for each organism. When using the predefined interactions,
the user should provide the name of the organism and type of the identifier.
ibh and simpIntLists packages require R programming language and they can be
installed by entering the following commands from R command line.
> source("http://Bioconductor.org/biocLite.R")
> biocLite("ibh")
> biocLite("simpIntLists")
93
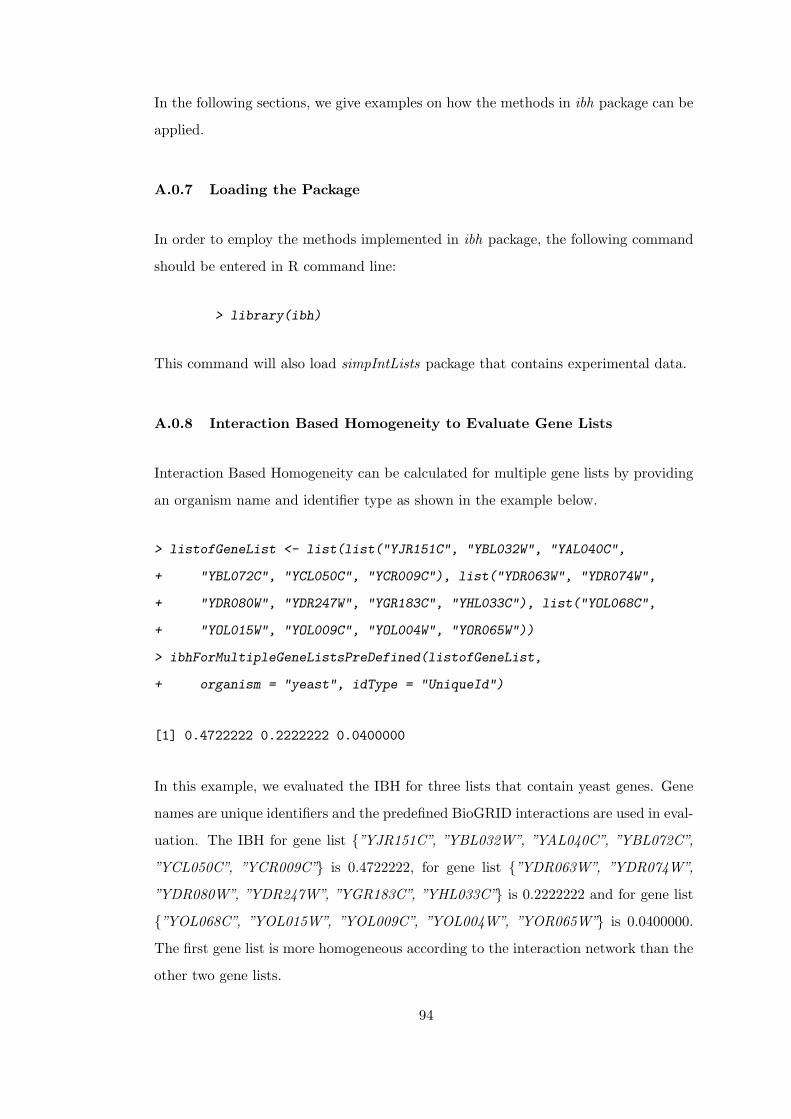
In the following sections, we give examples on how the methods in ibh package can be
applied.
A.0.7 Loading the Package
In order to employ the methods implemented in ibh package, the following command
should be entered in R command line:
> library(ibh)
This command will also load simpIntLists package that contains experimental data.
A.0.8 Interaction Based Homogeneity to Evaluate Gene Lists
Interaction Based Homogeneity can be calculated for multiple gene lists by providing
an organism name and identifier type as shown in the example below.
> listofGeneList <- list(list("YJR151C", "YBL032W", "YAL040C",
+ "YBL072C", "YCL050C", "YCR009C"), list("YDR063W", "YDR074W",
+ "YDR080W", "YDR247W", "YGR183C", "YHL033C"), list("YOL068C",
+ "YOL015W", "YOL009C", "YOL004W", "YOR065W"))
> ibhForMultipleGeneListsPreDefined(listofGeneList,
+ organism = "yeast", idType = "UniqueId")
[1] 0.4722222 0.2222222 0.0400000
In this example, we evaluated the IBH for three lists that contain yeast genes. Gene
names are unique identifiers and the predefined BioGRID interactions are used in eval-
uation. The IBH for gene list {”YJR151C”, ”YBL032W”, ”YAL040C”, ”YBL072C”,
”YCL050C”, ”YCR009C”} is 0.4722222, for gene list {”YDR063W”, ”YDR074W”,
”YDR080W”, ”YDR247W”, ”YGR183C”, ”YHL033C”} is 0.2222222 and for gene list
{”YOL068C”, ”YOL015W”, ”YOL009C”, ”YOL004W”, ”YOR065W”} is 0.0400000.
The first gene list is more homogeneous according to the interaction network than the
other two gene lists.
94
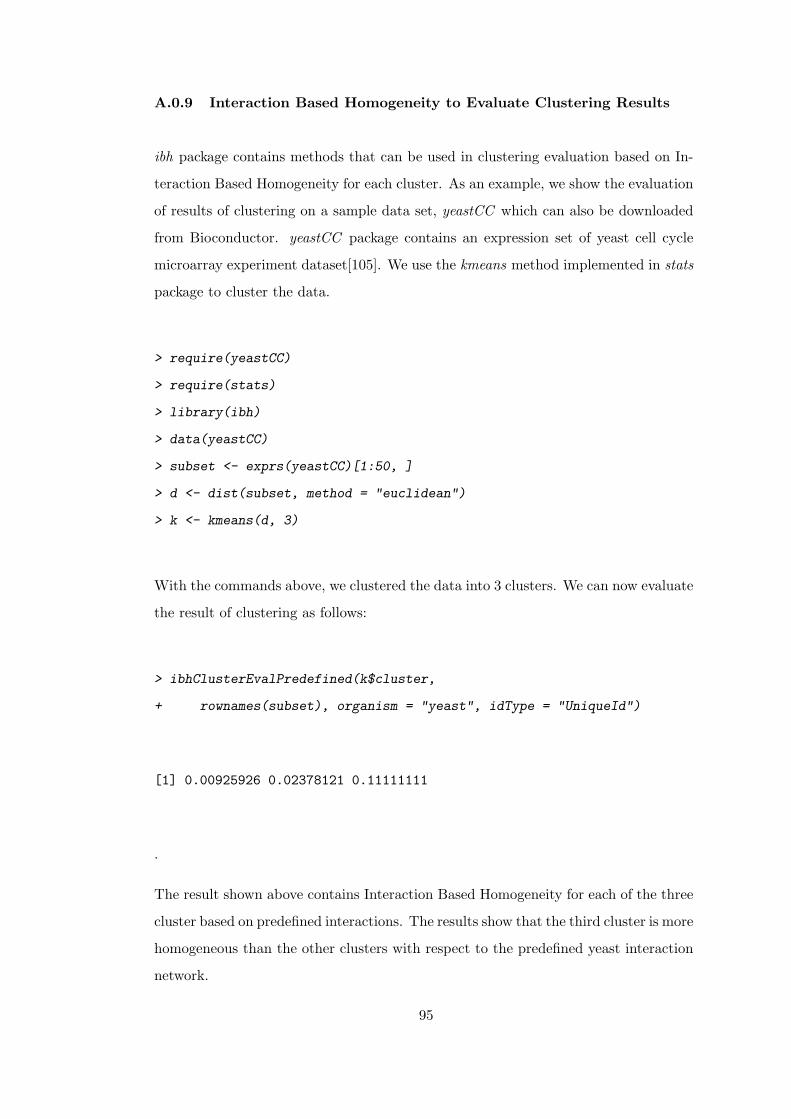
A.0.9 Interaction Based Homogeneity to Evaluate Clustering Results
ibh package contains methods that can be used in clustering evaluation based on In-
teraction Based Homogeneity for each cluster. As an example, we show the evaluation
of results of clustering on a sample data set, yeastCC which can also be downloaded
from Bioconductor. yeastCC package contains an expression set of yeast cell cycle
microarray experiment dataset[105]. We use the kmeans method implemented in stats
package to cluster the data.
> require(yeastCC)
> require(stats)
> library(ibh)
> data(yeastCC)
> subset <- exprs(yeastCC)[1:50, ]
> d <- dist(subset, method = "euclidean")
> k <- kmeans(d, 3)
With the commands above, we clustered the data into 3 clusters. We can now evaluate
the result of clustering as follows:
> ibhClusterEvalPredefined(k$cluster,
+ rownames(subset), organism = "yeast", idType = "UniqueId")
[1] 0.00925926 0.02378121 0.11111111
.
The result shown above contains Interaction Based Homogeneity for each of the three
cluster based on predefined interactions. The results show that the third cluster is more
homogeneous than the other clusters with respect to the predefined yeast interaction
network.
95
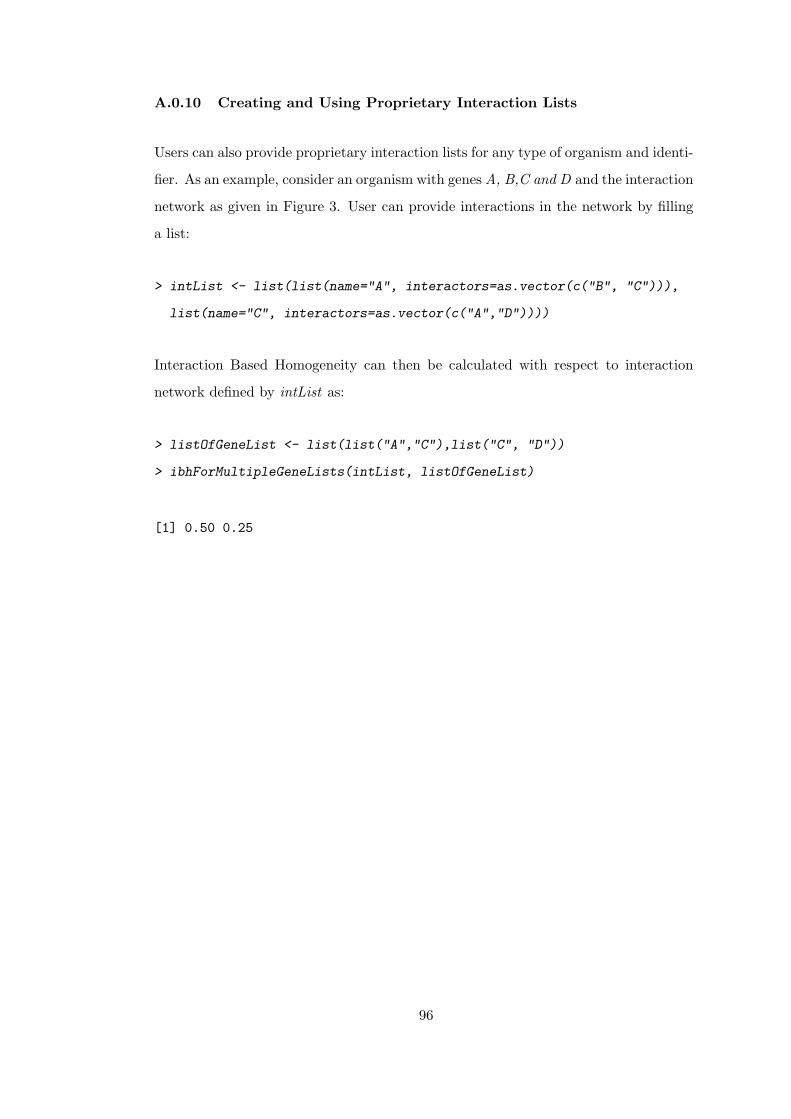
A.0.10 Creating and Using Proprietary Interaction Lists
Users can also provide proprietary interaction lists for any type of organism and identi-
fier. As an example, consider an organism with genes A, B,C and D and the interaction
network as given in Figure 3. User can provide interactions in the network by filling
a list:
> intList <- list(list(name="A", interactors=as.vector(c("B", "C"))),
list(name="C", interactors=as.vector(c("A","D"))))
Interaction Based Homogeneity can then be calculated with respect to interaction
network defined by intList as:
> listOfGeneList <- list(list("A","C"),list("C", "D"))
> ibhForMultipleGeneLists(intList, listOfGeneList)
[1] 0.50 0.25
96
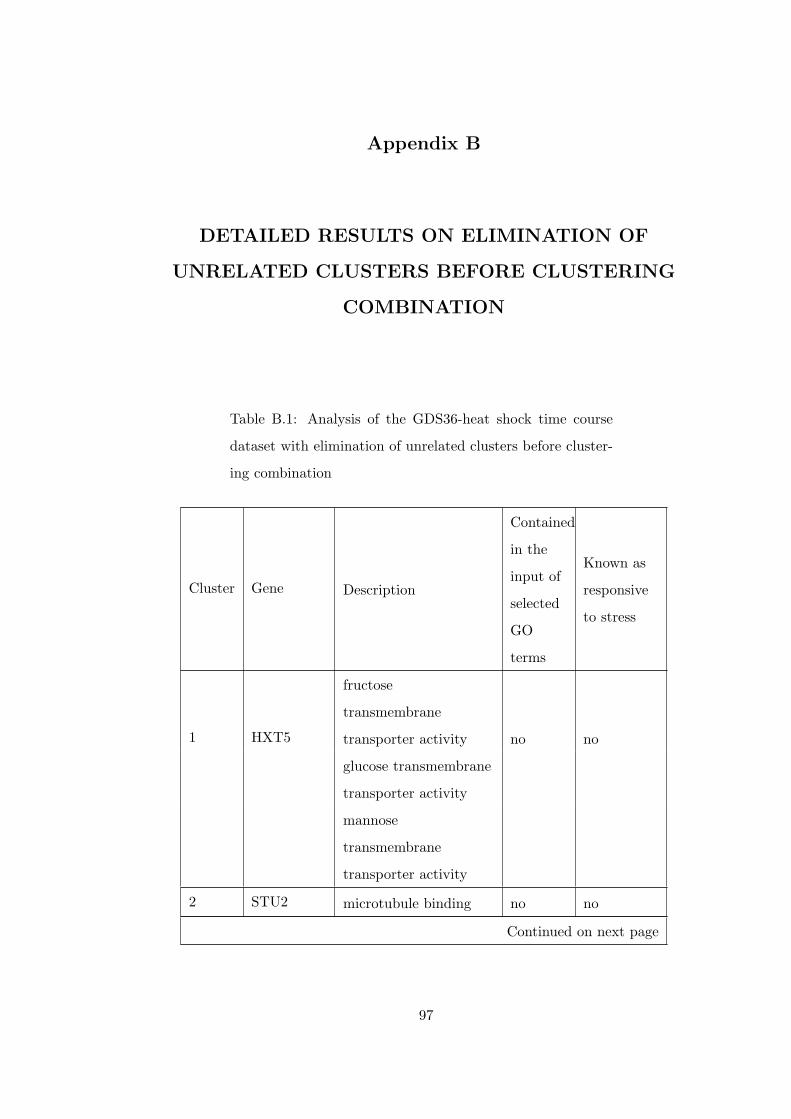
Appendix B
DETAILED RESULTS ON ELIMINATION OF
UNRELATED CLUSTERS BEFORE CLUSTERING
COMBINATION
Table B.1: Analysis of the GDS36-heat shock time course
dataset with elimination of unrelated clusters before cluster-
ing combination
Cluster Gene Description
Contained
in the
input of
selected
GO
terms
Known as
responsive
to stress
1 HXT5
fructose
transmembrane
transporter activity no no
glucose transmembrane
transporter activity
mannose
transmembrane
transporter activity
2 STU2 microtubule binding no no
Continued on next page
97
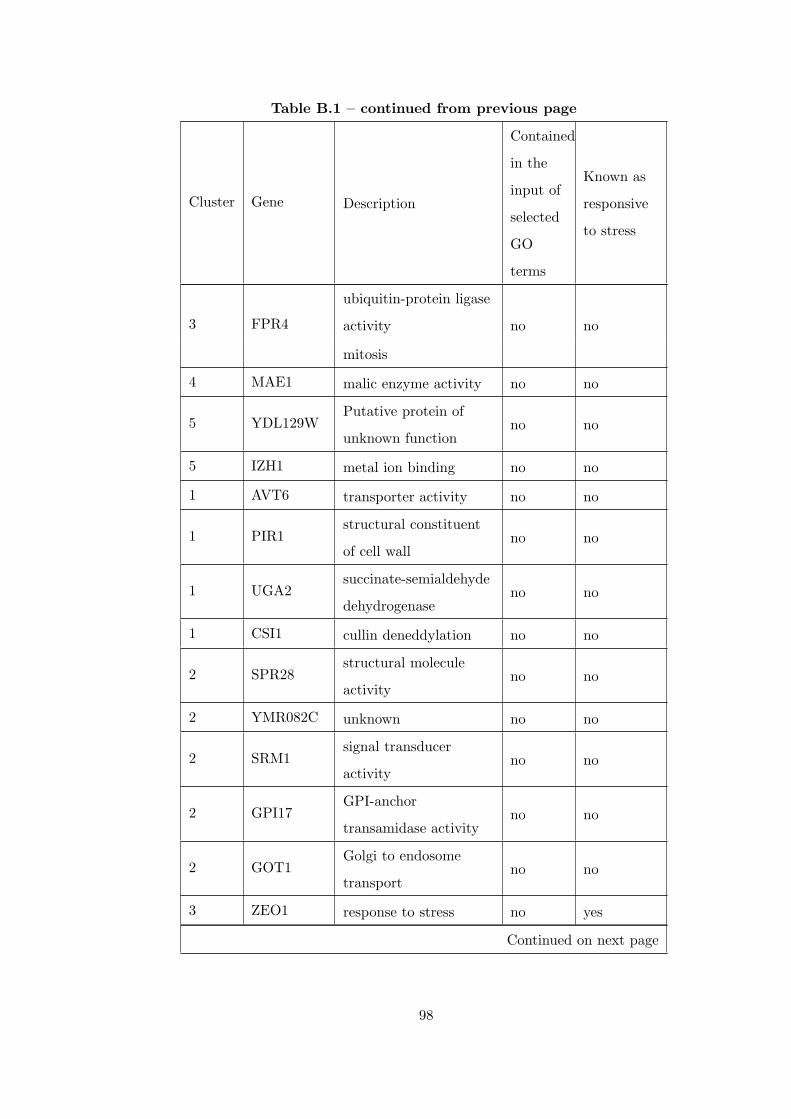
Table B.1 – continued from previous page
Cluster Gene Description
Contained
in the
input of
selected
GO
terms
Known as
responsive
to stress
3 FPR4
ubiquitin-protein ligase
activity no no
mitosis
4 MAE1 malic enzyme activity no no
5 YDL129WPutative protein of
unknown functionno no
5 IZH1 metal ion binding no no
1 AVT6 transporter activity no no
1 PIR1structural constituent
of cell wallno no
1 UGA2succinate-semialdehyde
dehydrogenaseno no
1 CSI1 cullin deneddylation no no
2 SPR28structural molecule
activityno no
2 YMR082C unknown no no
2 SRM1signal transducer
activityno no
2 GPI17GPI-anchor
transamidase activityno no
2 GOT1Golgi to endosome
transportno no
3 ZEO1 response to stress no yes
Continued on next page
98
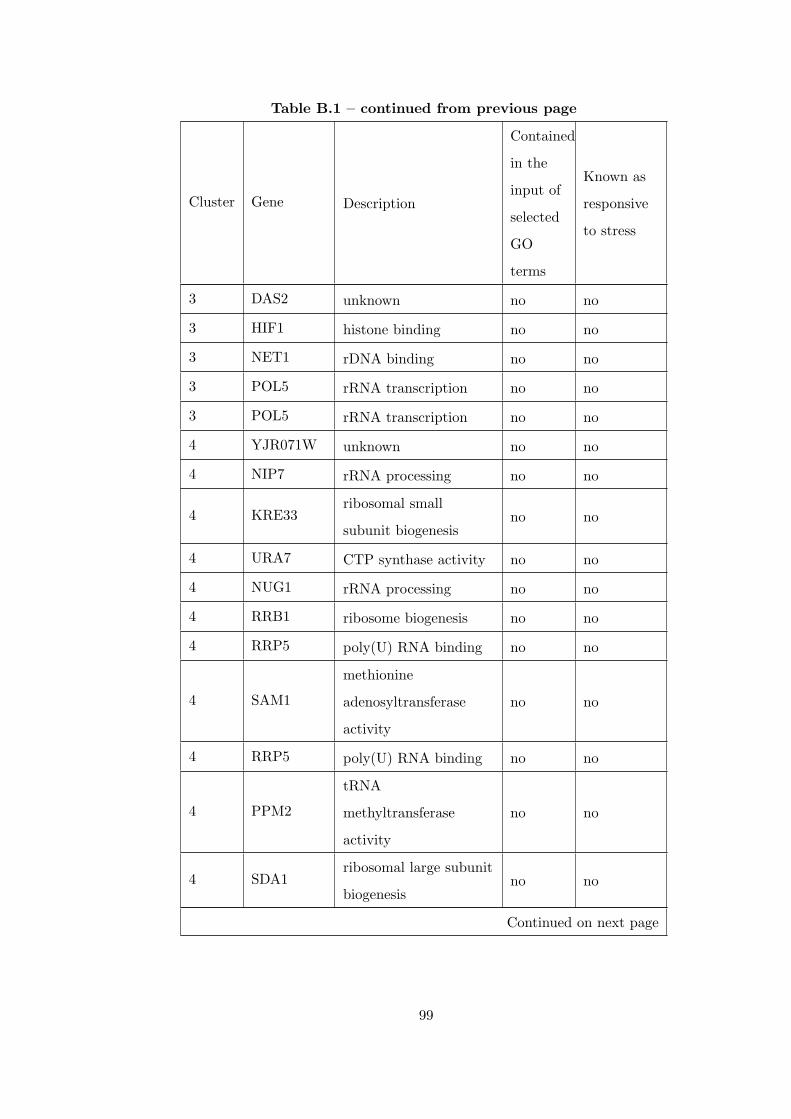
Table B.1 – continued from previous page
Cluster Gene Description
Contained
in the
input of
selected
GO
terms
Known as
responsive
to stress
3 DAS2 unknown no no
3 HIF1 histone binding no no
3 NET1 rDNA binding no no
3 POL5 rRNA transcription no no
3 POL5 rRNA transcription no no
4 YJR071W unknown no no
4 NIP7 rRNA processing no no
4 KRE33ribosomal small
subunit biogenesisno no
4 URA7 CTP synthase activity no no
4 NUG1 rRNA processing no no
4 RRB1 ribosome biogenesis no no
4 RRP5 poly(U) RNA binding no no
4 SAM1
methionine
adenosyltransferase
activity
no no
4 RRP5 poly(U) RNA binding no no
4 PPM2
tRNA
methyltransferase
activity
no no
4 SDA1ribosomal large subunit
biogenesisno no
Continued on next page
99
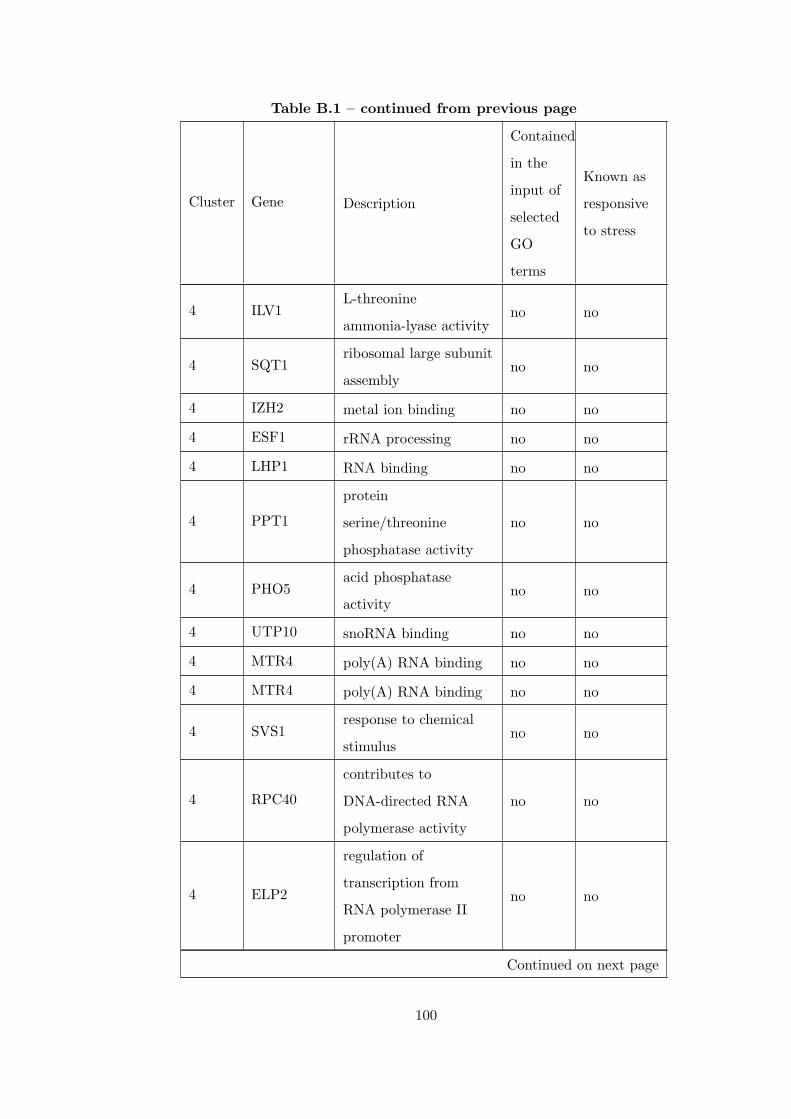
Table B.1 – continued from previous page
Cluster Gene Description
Contained
in the
input of
selected
GO
terms
Known as
responsive
to stress
4 ILV1L-threonine
ammonia-lyase activityno no
4 SQT1ribosomal large subunit
assemblyno no
4 IZH2 metal ion binding no no
4 ESF1 rRNA processing no no
4 LHP1 RNA binding no no
4 PPT1
protein
serine/threonine
phosphatase activity
no no
4 PHO5acid phosphatase
activityno no
4 UTP10 snoRNA binding no no
4 MTR4 poly(A) RNA binding no no
4 MTR4 poly(A) RNA binding no no
4 SVS1response to chemical
stimulusno no
4 RPC40
contributes to
DNA-directed RNA
polymerase activity
no no
4 ELP2
regulation of
transcription from
RNA polymerase II
promoter
no no
Continued on next page
100
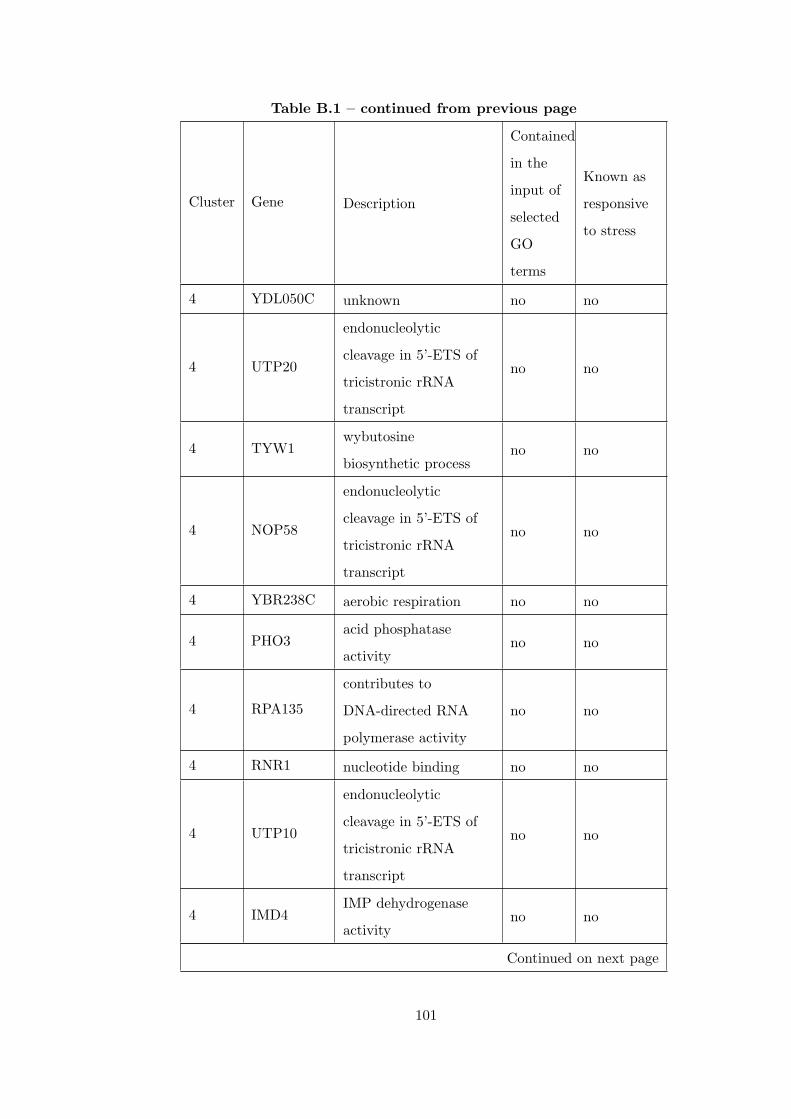
Table B.1 – continued from previous page
Cluster Gene Description
Contained
in the
input of
selected
GO
terms
Known as
responsive
to stress
4 YDL050C unknown no no
4 UTP20
endonucleolytic
cleavage in 5’-ETS of
tricistronic rRNA
transcript
no no
4 TYW1wybutosine
biosynthetic processno no
4 NOP58
endonucleolytic
cleavage in 5’-ETS of
tricistronic rRNA
transcript
no no
4 YBR238C aerobic respiration no no
4 PHO3acid phosphatase
activityno no
4 RPA135
contributes to
DNA-directed RNA
polymerase activity
no no
4 RNR1 nucleotide binding no no
4 UTP10
endonucleolytic
cleavage in 5’-ETS of
tricistronic rRNA
transcript
no no
4 IMD4IMP dehydrogenase
activityno no
Continued on next page
101
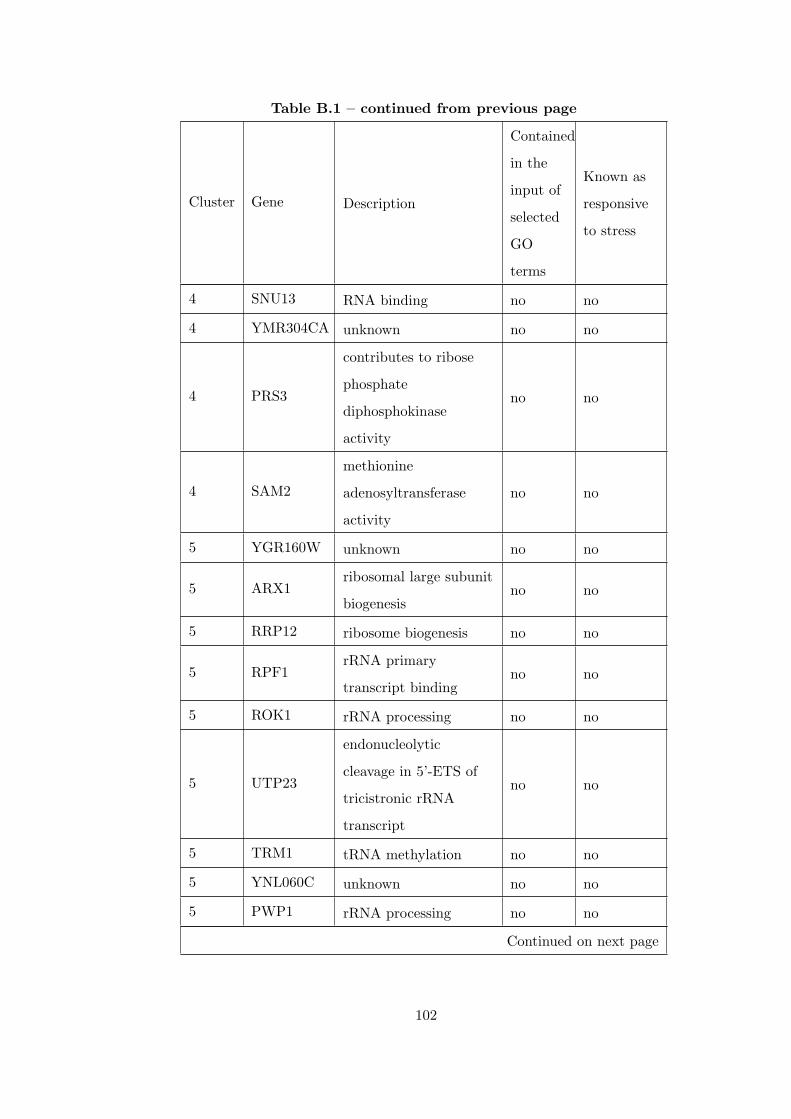
Table B.1 – continued from previous page
Cluster Gene Description
Contained
in the
input of
selected
GO
terms
Known as
responsive
to stress
4 SNU13 RNA binding no no
4 YMR304CA unknown no no
4 PRS3
contributes to ribose
phosphate
diphosphokinase
activity
no no
4 SAM2
methionine
adenosyltransferase
activity
no no
5 YGR160W unknown no no
5 ARX1ribosomal large subunit
biogenesisno no
5 RRP12 ribosome biogenesis no no
5 RPF1rRNA primary
transcript bindingno no
5 ROK1 rRNA processing no no
5 UTP23
endonucleolytic
cleavage in 5’-ETS of
tricistronic rRNA
transcript
no no
5 TRM1 tRNA methylation no no
5 YNL060C unknown no no
5 PWP1 rRNA processing no no
Continued on next page
102
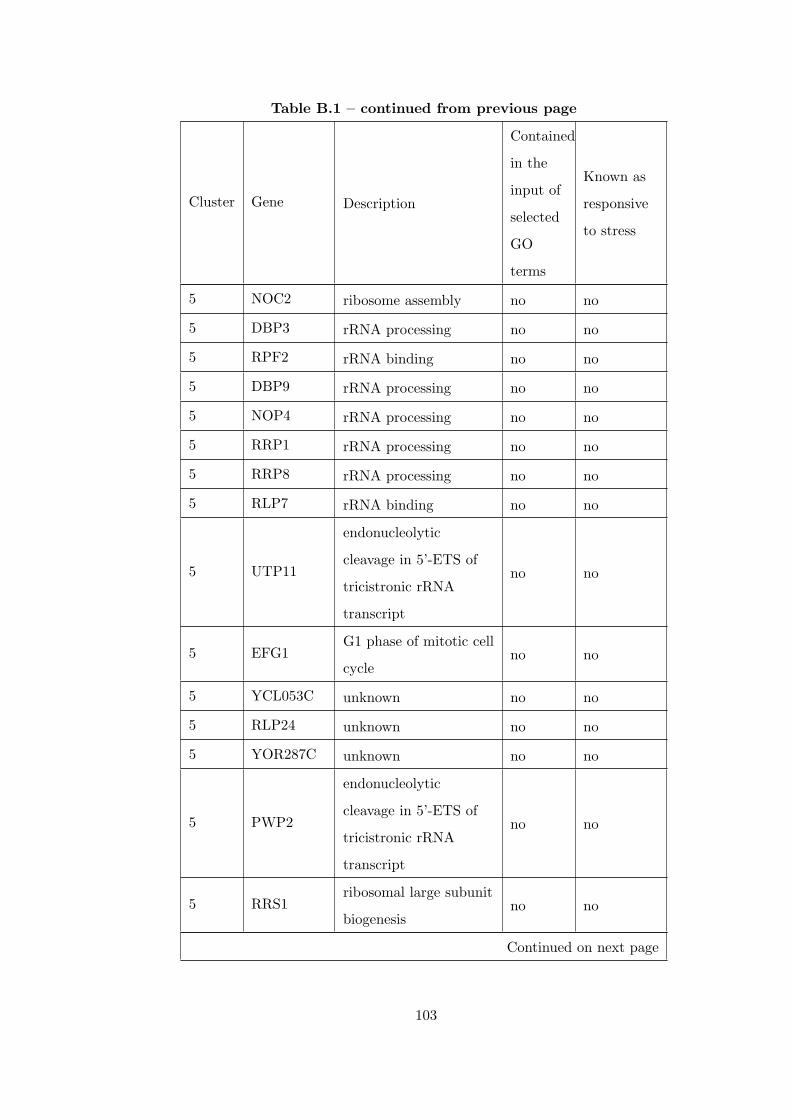
Table B.1 – continued from previous page
Cluster Gene Description
Contained
in the
input of
selected
GO
terms
Known as
responsive
to stress
5 NOC2 ribosome assembly no no
5 DBP3 rRNA processing no no
5 RPF2 rRNA binding no no
5 DBP9 rRNA processing no no
5 NOP4 rRNA processing no no
5 RRP1 rRNA processing no no
5 RRP8 rRNA processing no no
5 RLP7 rRNA binding no no
5 UTP11
endonucleolytic
cleavage in 5’-ETS of
tricistronic rRNA
transcript
no no
5 EFG1G1 phase of mitotic cell
cycleno no
5 YCL053C unknown no no
5 RLP24 unknown no no
5 YOR287C unknown no no
5 PWP2
endonucleolytic
cleavage in 5’-ETS of
tricistronic rRNA
transcript
no no
5 RRS1ribosomal large subunit
biogenesisno no
Continued on next page
103
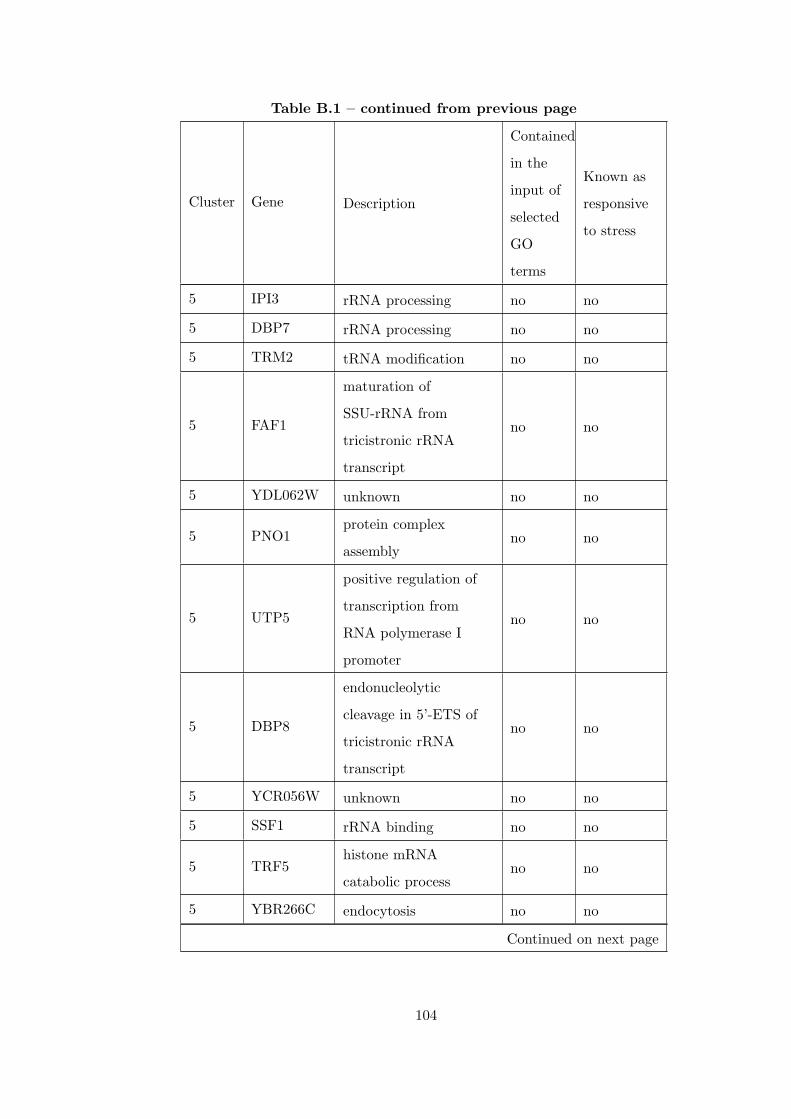
Table B.1 – continued from previous page
Cluster Gene Description
Contained
in the
input of
selected
GO
terms
Known as
responsive
to stress
5 IPI3 rRNA processing no no
5 DBP7 rRNA processing no no
5 TRM2 tRNA modification no no
5 FAF1
maturation of
SSU-rRNA from
tricistronic rRNA
transcript
no no
5 YDL062W unknown no no
5 PNO1protein complex
assemblyno no
5 UTP5
positive regulation of
transcription from
RNA polymerase I
promoter
no no
5 DBP8
endonucleolytic
cleavage in 5’-ETS of
tricistronic rRNA
transcript
no no
5 YCR056W unknown no no
5 SSF1 rRNA binding no no
5 TRF5histone mRNA
catabolic processno no
5 YBR266C endocytosis no no
Continued on next page
104
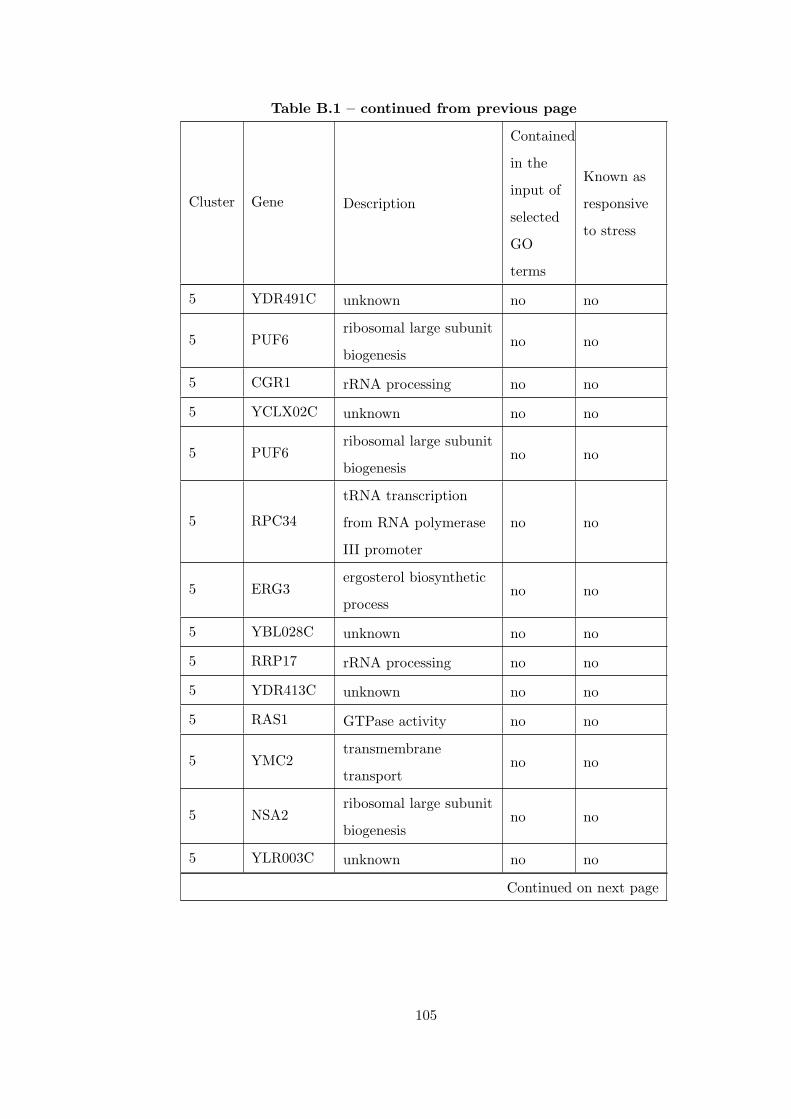
Table B.1 – continued from previous page
Cluster Gene Description
Contained
in the
input of
selected
GO
terms
Known as
responsive
to stress
5 YDR491C unknown no no
5 PUF6ribosomal large subunit
biogenesisno no
5 CGR1 rRNA processing no no
5 YCLX02C unknown no no
5 PUF6ribosomal large subunit
biogenesisno no
5 RPC34
tRNA transcription
from RNA polymerase
III promoter
no no
5 ERG3ergosterol biosynthetic
processno no
5 YBL028C unknown no no
5 RRP17 rRNA processing no no
5 YDR413C unknown no no
5 RAS1 GTPase activity no no
5 YMC2transmembrane
transportno no
5 NSA2ribosomal large subunit
biogenesisno no
5 YLR003C unknown no no
Continued on next page
105
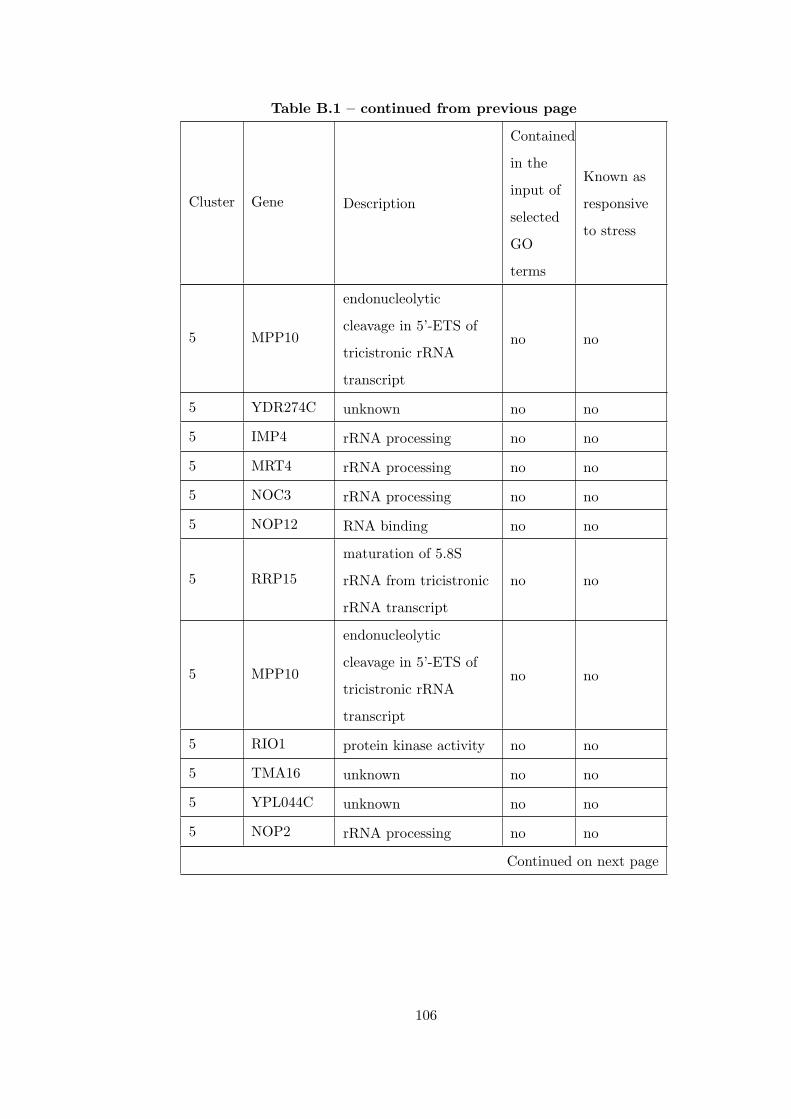
Table B.1 – continued from previous page
Cluster Gene Description
Contained
in the
input of
selected
GO
terms
Known as
responsive
to stress
5 MPP10
endonucleolytic
cleavage in 5’-ETS of
tricistronic rRNA
transcript
no no
5 YDR274C unknown no no
5 IMP4 rRNA processing no no
5 MRT4 rRNA processing no no
5 NOC3 rRNA processing no no
5 NOP12 RNA binding no no
5 RRP15
maturation of 5.8S
rRNA from tricistronic
rRNA transcript
no no
5 MPP10
endonucleolytic
cleavage in 5’-ETS of
tricistronic rRNA
transcript
no no
5 RIO1 protein kinase activity no no
5 TMA16 unknown no no
5 YPL044C unknown no no
5 NOP2 rRNA processing no no
Continued on next page
106
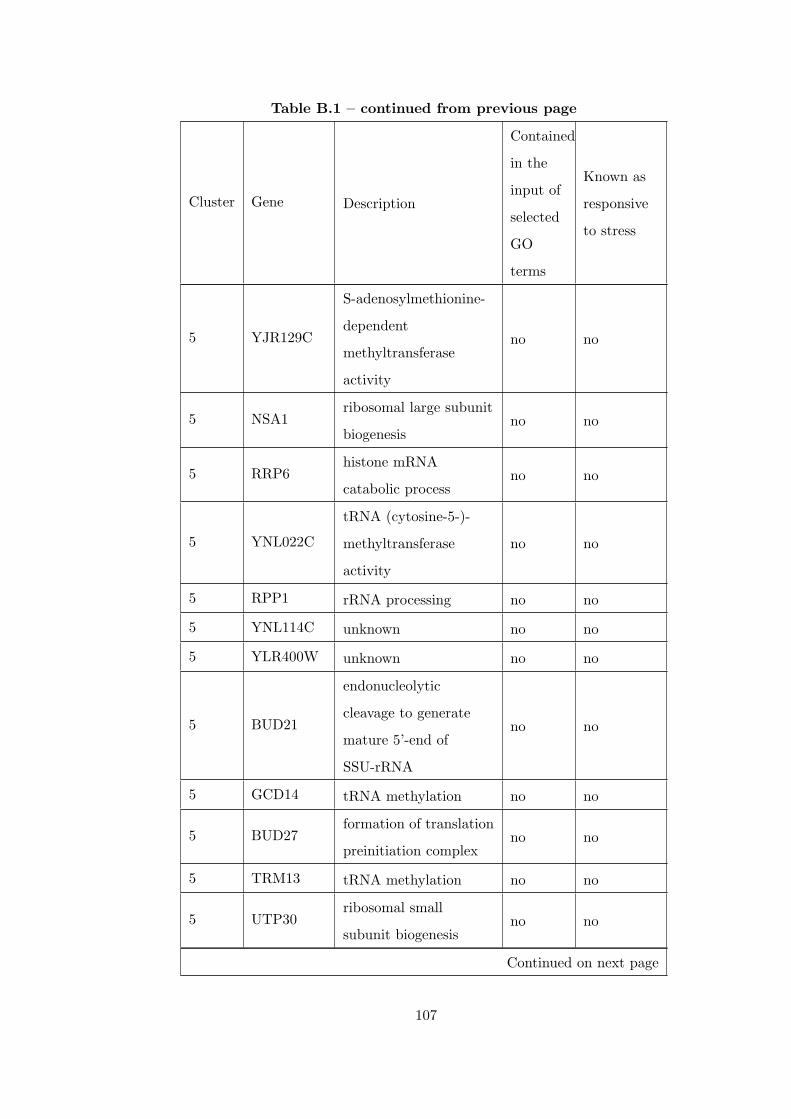
Table B.1 – continued from previous page
Cluster Gene Description
Contained
in the
input of
selected
GO
terms
Known as
responsive
to stress
5 YJR129C
S-adenosylmethionine-
dependent
methyltransferase
activity
no no
5 NSA1ribosomal large subunit
biogenesisno no
5 RRP6histone mRNA
catabolic processno no
5 YNL022C
tRNA (cytosine-5-)-
methyltransferase
activity
no no
5 RPP1 rRNA processing no no
5 YNL114C unknown no no
5 YLR400W unknown no no
5 BUD21
endonucleolytic
cleavage to generate
mature 5’-end of
SSU-rRNA
no no
5 GCD14 tRNA methylation no no
5 BUD27formation of translation
preinitiation complexno no
5 TRM13 tRNA methylation no no
5 UTP30ribosomal small
subunit biogenesisno no
Continued on next page
107
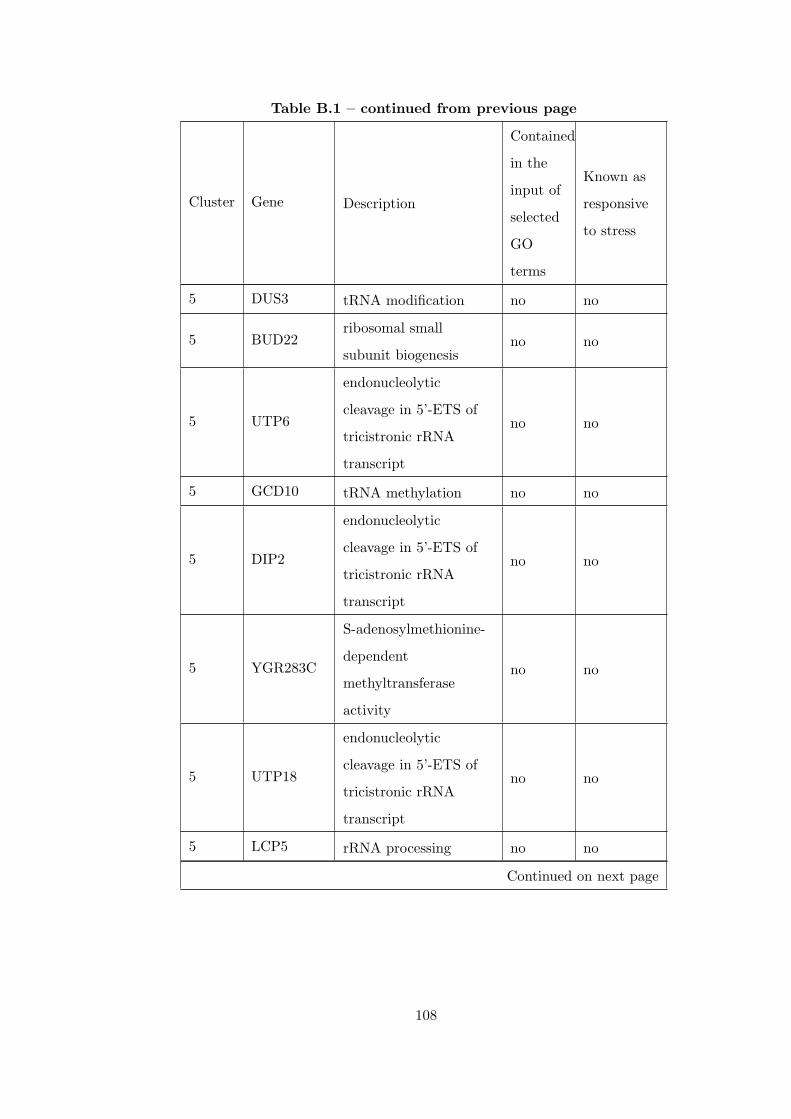
Table B.1 – continued from previous page
Cluster Gene Description
Contained
in the
input of
selected
GO
terms
Known as
responsive
to stress
5 DUS3 tRNA modification no no
5 BUD22ribosomal small
subunit biogenesisno no
5 UTP6
endonucleolytic
cleavage in 5’-ETS of
tricistronic rRNA
transcript
no no
5 GCD10 tRNA methylation no no
5 DIP2
endonucleolytic
cleavage in 5’-ETS of
tricistronic rRNA
transcript
no no
5 YGR283C
S-adenosylmethionine-
dependent
methyltransferase
activity
no no
5 UTP18
endonucleolytic
cleavage in 5’-ETS of
tricistronic rRNA
transcript
no no
5 LCP5 rRNA processing no no
Continued on next page
108
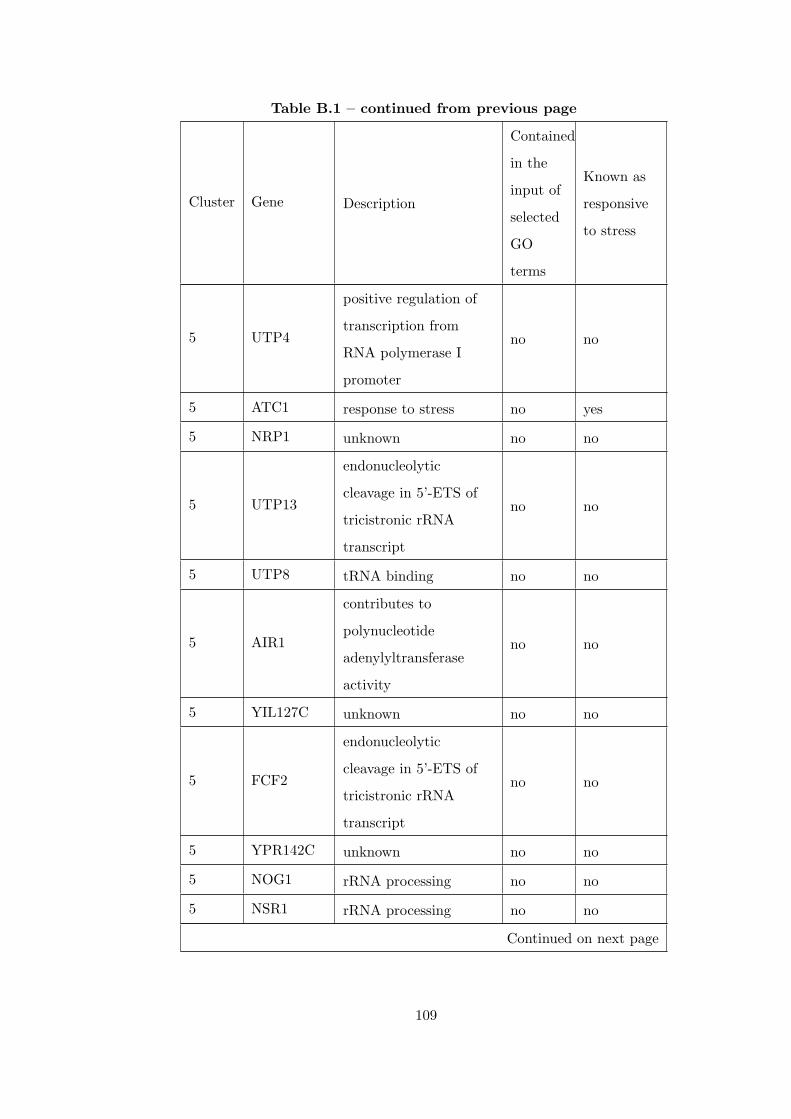
Table B.1 – continued from previous page
Cluster Gene Description
Contained
in the
input of
selected
GO
terms
Known as
responsive
to stress
5 UTP4
positive regulation of
transcription from
RNA polymerase I
promoter
no no
5 ATC1 response to stress no yes
5 NRP1 unknown no no
5 UTP13
endonucleolytic
cleavage in 5’-ETS of
tricistronic rRNA
transcript
no no
5 UTP8 tRNA binding no no
5 AIR1
contributes to
polynucleotide
adenylyltransferase
activity
no no
5 YIL127C unknown no no
5 FCF2
endonucleolytic
cleavage in 5’-ETS of
tricistronic rRNA
transcript
no no
5 YPR142C unknown no no
5 NOG1 rRNA processing no no
5 NSR1 rRNA processing no no
Continued on next page
109
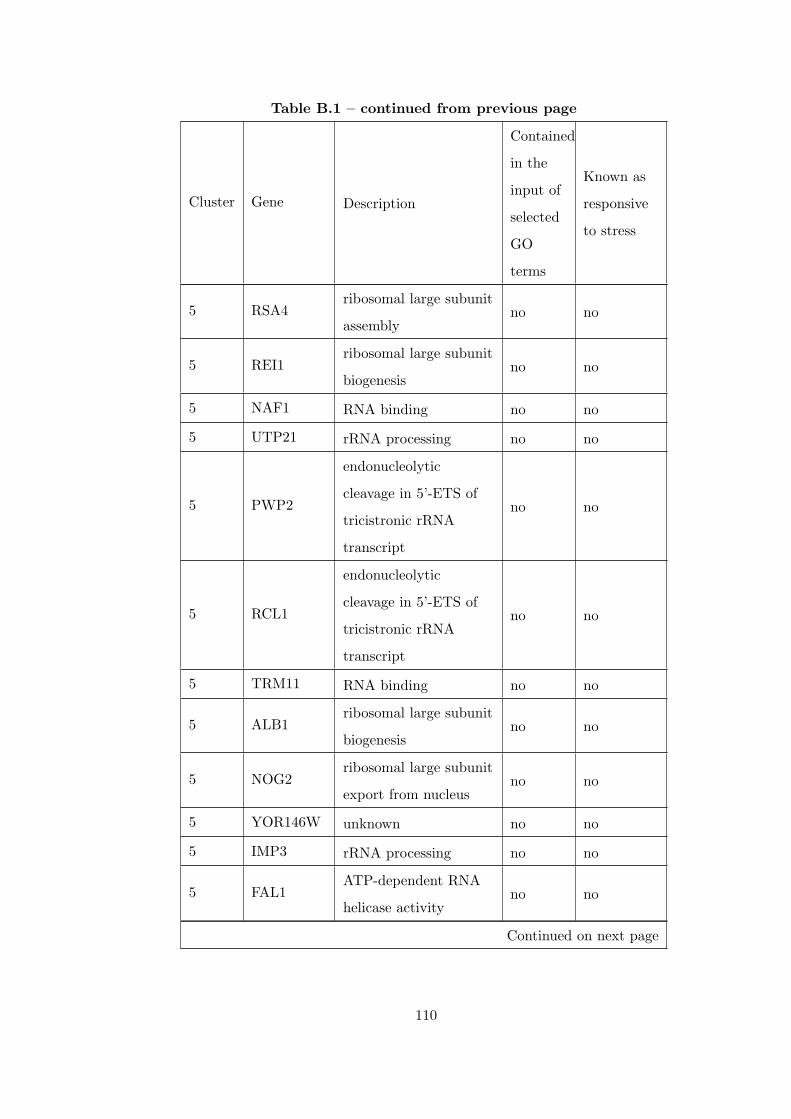
Table B.1 – continued from previous page
Cluster Gene Description
Contained
in the
input of
selected
GO
terms
Known as
responsive
to stress
5 RSA4ribosomal large subunit
assemblyno no
5 REI1ribosomal large subunit
biogenesisno no
5 NAF1 RNA binding no no
5 UTP21 rRNA processing no no
5 PWP2
endonucleolytic
cleavage in 5’-ETS of
tricistronic rRNA
transcript
no no
5 RCL1
endonucleolytic
cleavage in 5’-ETS of
tricistronic rRNA
transcript
no no
5 TRM11 RNA binding no no
5 ALB1ribosomal large subunit
biogenesisno no
5 NOG2ribosomal large subunit
export from nucleusno no
5 YOR146W unknown no no
5 IMP3 rRNA processing no no
5 FAL1ATP-dependent RNA
helicase activityno no
Continued on next page
110
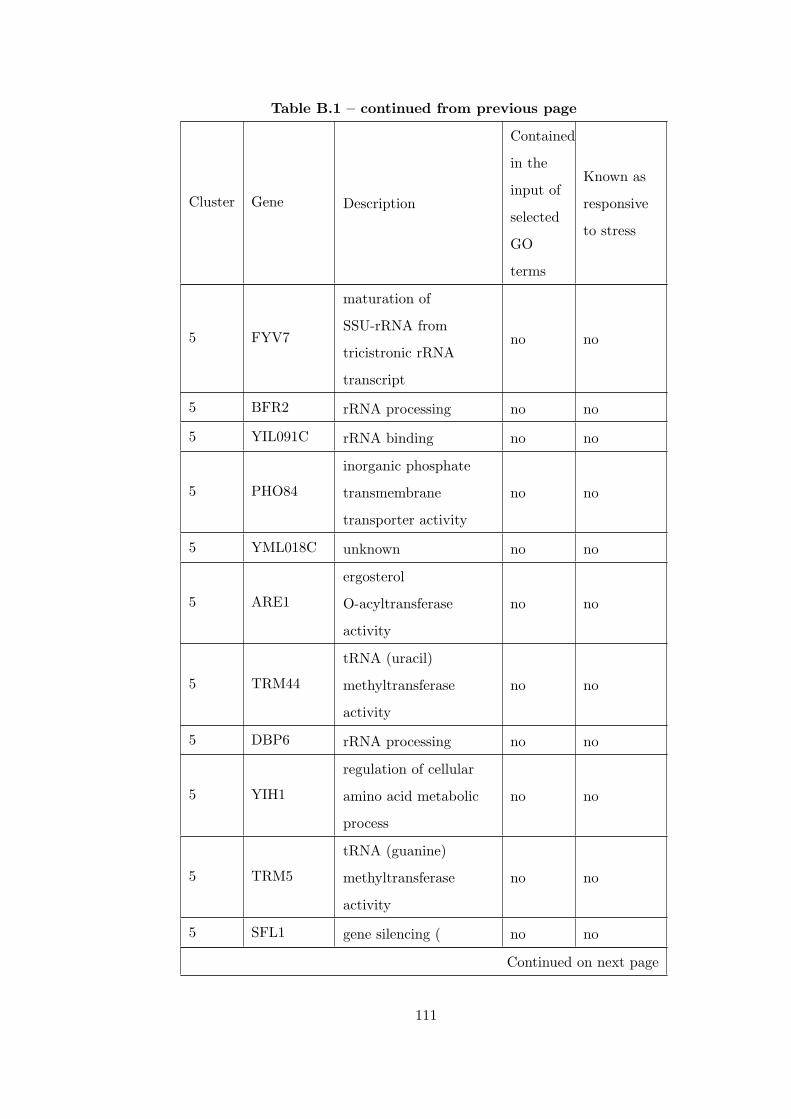
Table B.1 – continued from previous page
Cluster Gene Description
Contained
in the
input of
selected
GO
terms
Known as
responsive
to stress
5 FYV7
maturation of
SSU-rRNA from
tricistronic rRNA
transcript
no no
5 BFR2 rRNA processing no no
5 YIL091C rRNA binding no no
5 PHO84
inorganic phosphate
transmembrane
transporter activity
no no
5 YML018C unknown no no
5 ARE1
ergosterol
O-acyltransferase
activity
no no
5 TRM44
tRNA (uracil)
methyltransferase
activity
no no
5 DBP6 rRNA processing no no
5 YIH1
regulation of cellular
amino acid metabolic
process
no no
5 TRM5
tRNA (guanine)
methyltransferase
activity
no no
5 SFL1 gene silencing ( no no
Continued on next page
111
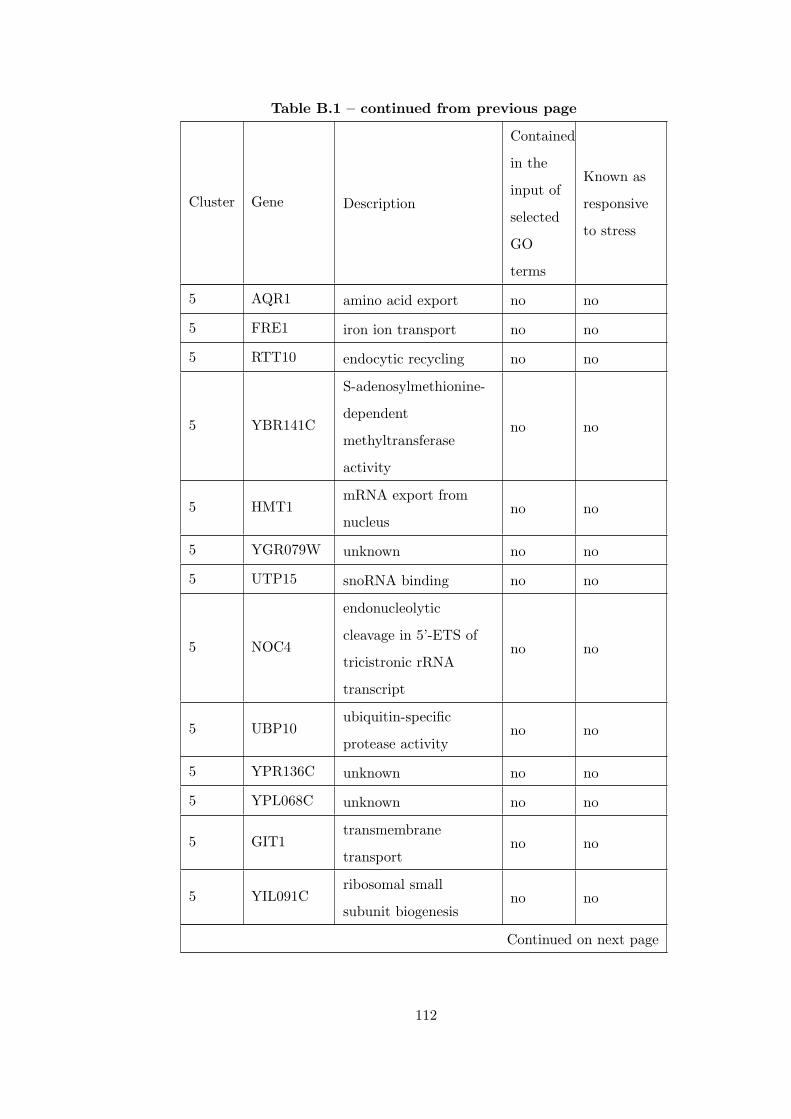
Table B.1 – continued from previous page
Cluster Gene Description
Contained
in the
input of
selected
GO
terms
Known as
responsive
to stress
5 AQR1 amino acid export no no
5 FRE1 iron ion transport no no
5 RTT10 endocytic recycling no no
5 YBR141C
S-adenosylmethionine-
dependent
methyltransferase
activity
no no
5 HMT1mRNA export from
nucleusno no
5 YGR079W unknown no no
5 UTP15 snoRNA binding no no
5 NOC4
endonucleolytic
cleavage in 5’-ETS of
tricistronic rRNA
transcript
no no
5 UBP10ubiquitin-specific
protease activityno no
5 YPR136C unknown no no
5 YPL068C unknown no no
5 GIT1transmembrane
transportno no
5 YIL091Cribosomal small
subunit biogenesisno no
Continued on next page
112
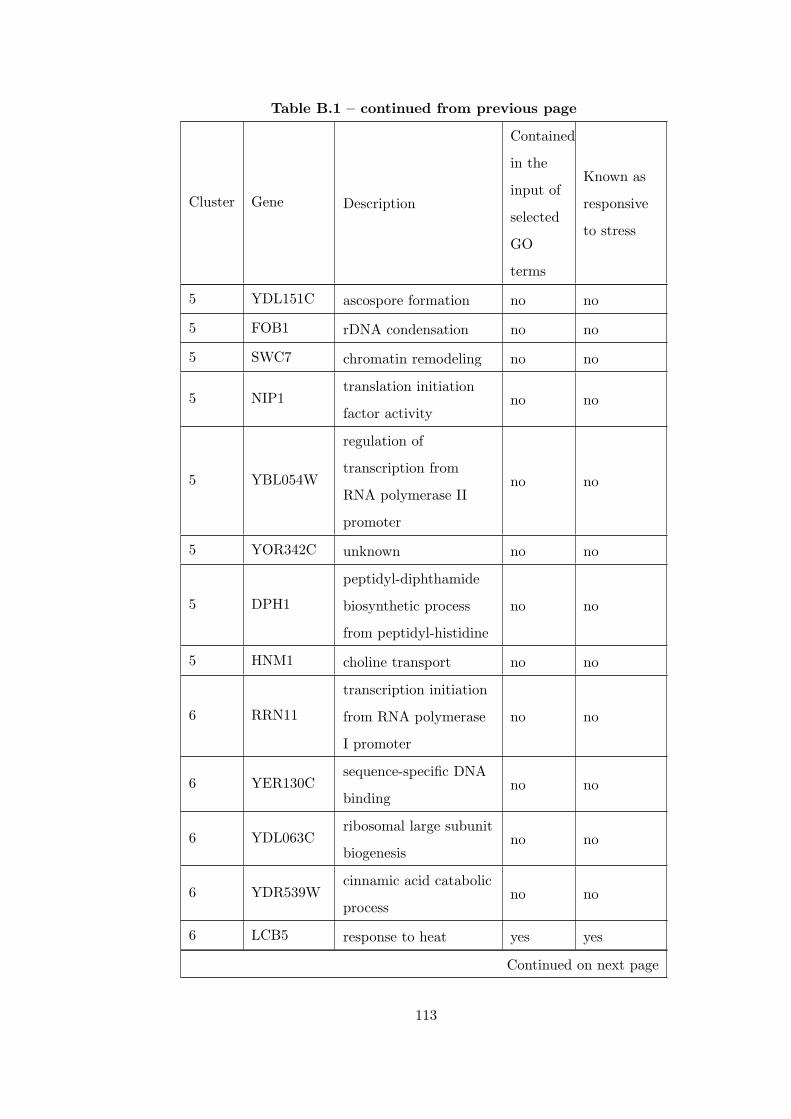
Table B.1 – continued from previous page
Cluster Gene Description
Contained
in the
input of
selected
GO
terms
Known as
responsive
to stress
5 YDL151C ascospore formation no no
5 FOB1 rDNA condensation no no
5 SWC7 chromatin remodeling no no
5 NIP1translation initiation
factor activityno no
5 YBL054W
regulation of
transcription from
RNA polymerase II
promoter
no no
5 YOR342C unknown no no
5 DPH1
peptidyl-diphthamide
biosynthetic process
from peptidyl-histidine
no no
5 HNM1 choline transport no no
6 RRN11
transcription initiation
from RNA polymerase
I promoter
no no
6 YER130Csequence-specific DNA
bindingno no
6 YDL063Cribosomal large subunit
biogenesisno no
6 YDR539Wcinnamic acid catabolic
processno no
6 LCB5 response to heat yes yes
Continued on next page
113
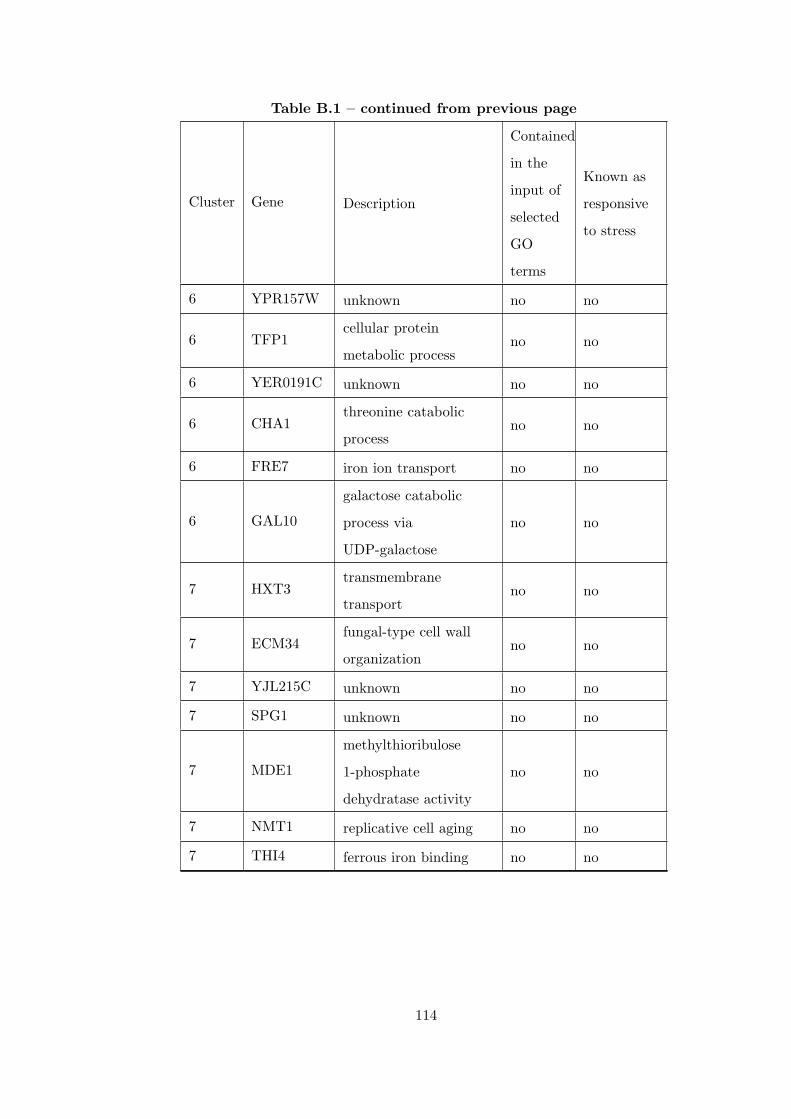
Table B.1 – continued from previous page
Cluster Gene Description
Contained
in the
input of
selected
GO
terms
Known as
responsive
to stress
6 YPR157W unknown no no
6 TFP1cellular protein
metabolic processno no
6 YER0191C unknown no no
6 CHA1threonine catabolic
processno no
6 FRE7 iron ion transport no no
6 GAL10
galactose catabolic
process via
UDP-galactose
no no
7 HXT3transmembrane
transportno no
7 ECM34fungal-type cell wall
organizationno no
7 YJL215C unknown no no
7 SPG1 unknown no no
7 MDE1
methylthioribulose
1-phosphate
dehydratase activity
no no
7 NMT1 replicative cell aging no no
7 THI4 ferrous iron binding no no
114
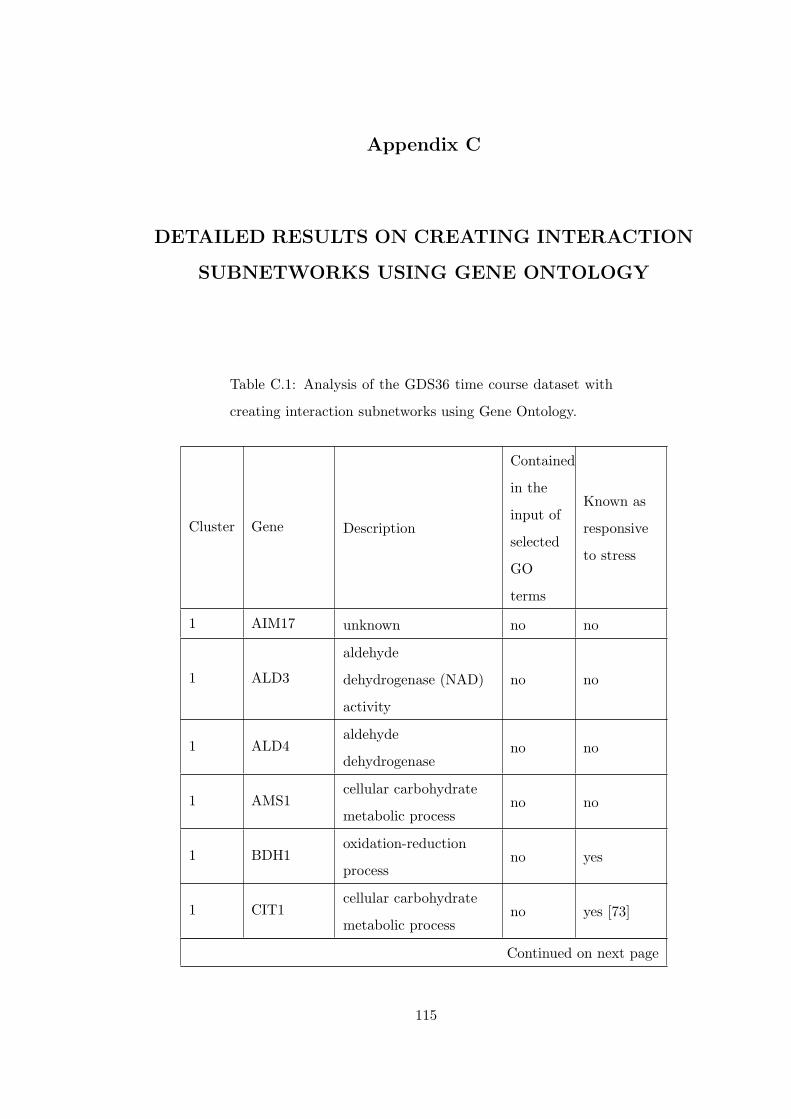
Appendix C
DETAILED RESULTS ON CREATING INTERACTION
SUBNETWORKS USING GENE ONTOLOGY
Table C.1: Analysis of the GDS36 time course dataset with
creating interaction subnetworks using Gene Ontology.
Cluster Gene Description
Contained
in the
input of
selected
GO
terms
Known as
responsive
to stress
1 AIM17 unknown no no
1 ALD3
aldehyde
dehydrogenase (NAD)
activity
no no
1 ALD4aldehyde
dehydrogenaseno no
1 AMS1cellular carbohydrate
metabolic processno no
1 BDH1oxidation-reduction
processno yes
1 CIT1cellular carbohydrate
metabolic processno yes [73]
Continued on next page
115
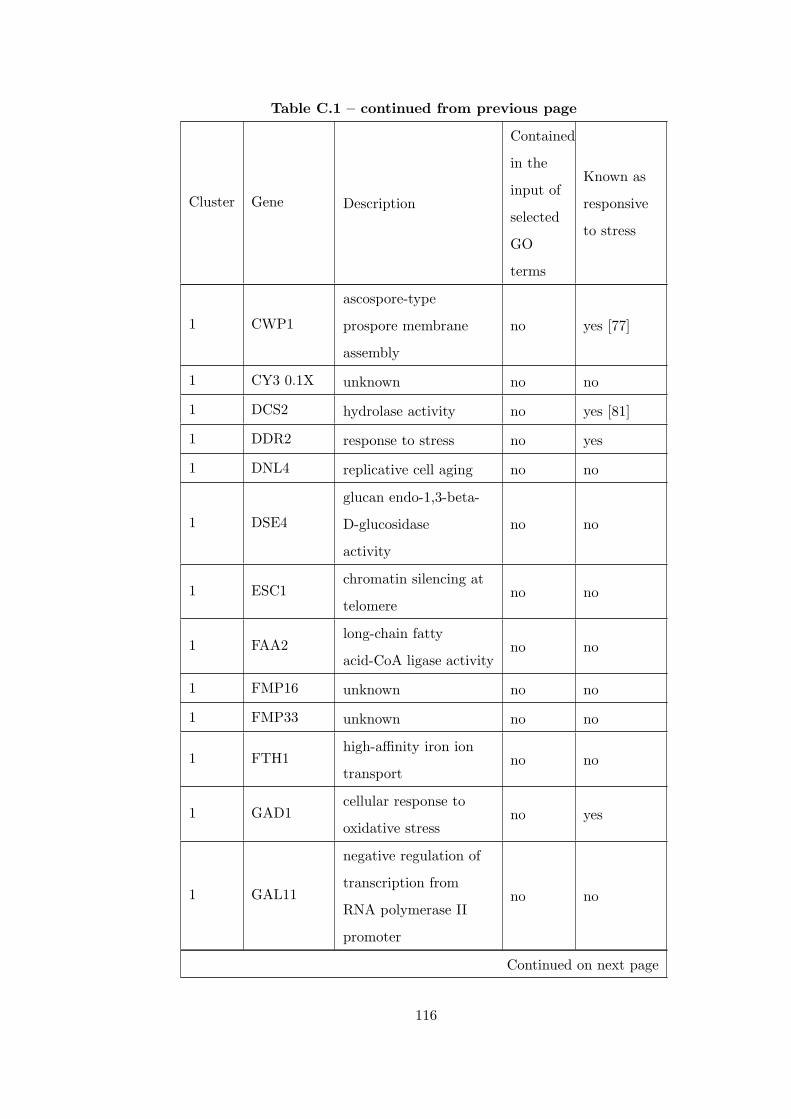
Table C.1 – continued from previous page
Cluster Gene Description
Contained
in the
input of
selected
GO
terms
Known as
responsive
to stress
1 CWP1
ascospore-type
prospore membrane
assembly
no yes [77]
1 CY3 0.1X unknown no no
1 DCS2 hydrolase activity no yes [81]
1 DDR2 response to stress no yes
1 DNL4 replicative cell aging no no
1 DSE4
glucan endo-1,3-beta-
D-glucosidase
activity
no no
1 ESC1chromatin silencing at
telomereno no
1 FAA2long-chain fatty
acid-CoA ligase activityno no
1 FMP16 unknown no no
1 FMP33 unknown no no
1 FTH1high-affinity iron ion
transportno no
1 GAD1cellular response to
oxidative stressno yes
1 GAL11
negative regulation of
transcription from
RNA polymerase II
promoter
no no
Continued on next page
116
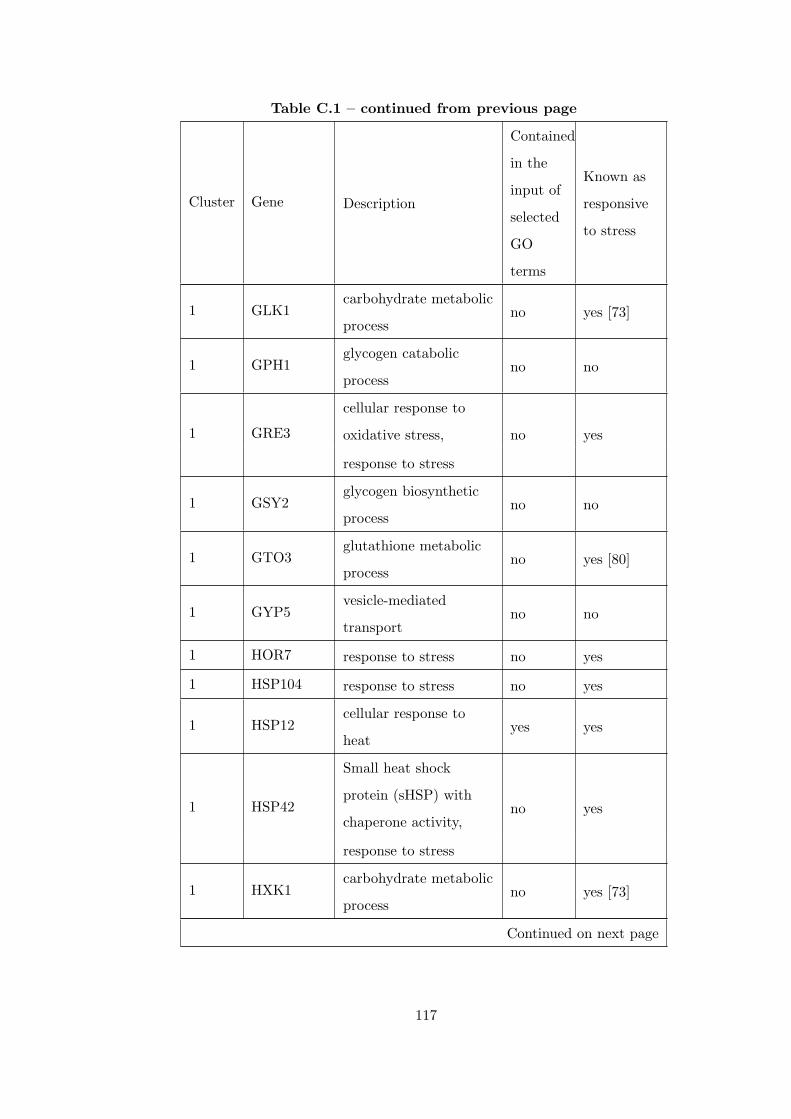
Table C.1 – continued from previous page
Cluster Gene Description
Contained
in the
input of
selected
GO
terms
Known as
responsive
to stress
1 GLK1carbohydrate metabolic
processno yes [73]
1 GPH1glycogen catabolic
processno no
1 GRE3
cellular response to
oxidative stress, no yes
response to stress
1 GSY2glycogen biosynthetic
processno no
1 GTO3glutathione metabolic
processno yes [80]
1 GYP5vesicle-mediated
transportno no
1 HOR7 response to stress no yes
1 HSP104 response to stress no yes
1 HSP12cellular response to
heatyes yes
1 HSP42
Small heat shock
protein (sHSP) with
chaperone activity,no yes
response to stress
1 HXK1carbohydrate metabolic
processno yes [73]
Continued on next page
117
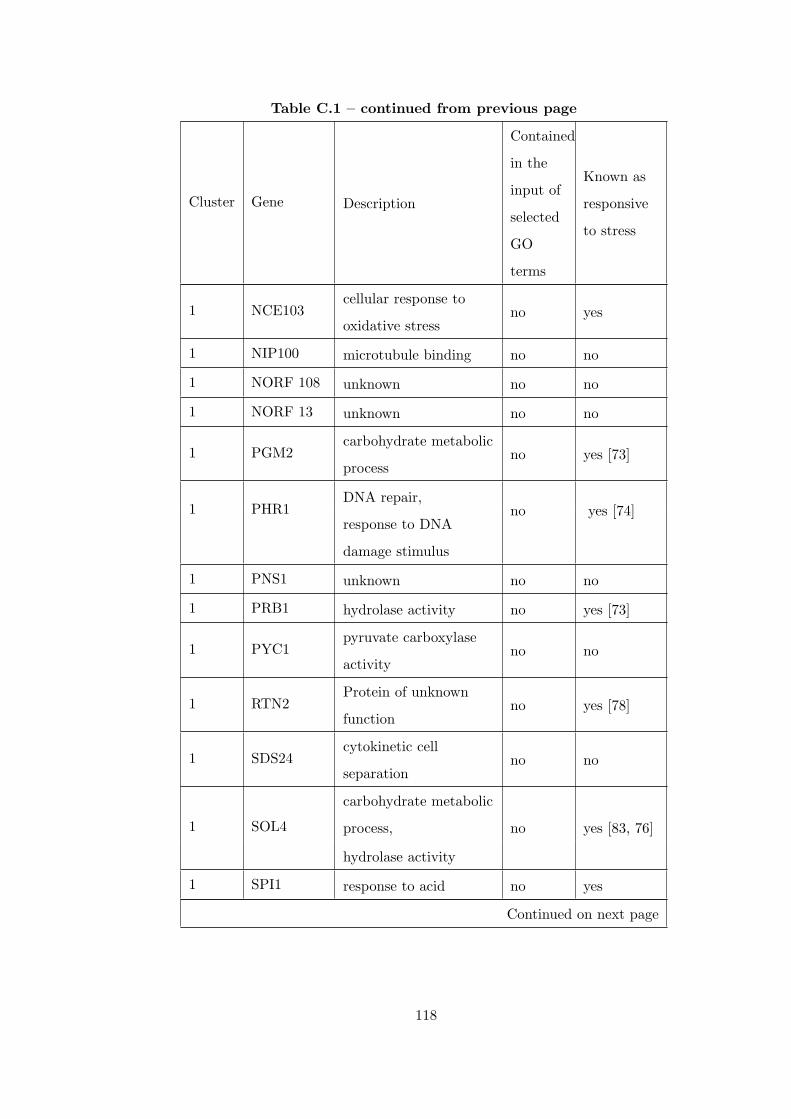
Table C.1 – continued from previous page
Cluster Gene Description
Contained
in the
input of
selected
GO
terms
Known as
responsive
to stress
1 NCE103cellular response to
oxidative stressno yes
1 NIP100 microtubule binding no no
1 NORF 108 unknown no no
1 NORF 13 unknown no no
1 PGM2carbohydrate metabolic
processno yes [73]
1 PHR1DNA repair,
no yes [74]response to DNA
damage stimulus
1 PNS1 unknown no no
1 PRB1 hydrolase activity no yes [73]
1 PYC1pyruvate carboxylase
activityno no
1 RTN2Protein of unknown
functionno yes [78]
1 SDS24cytokinetic cell
separationno no
1 SOL4
carbohydrate metabolic
process, no yes [83, 76]
hydrolase activity
1 SPI1 response to acid no yes
Continued on next page
118
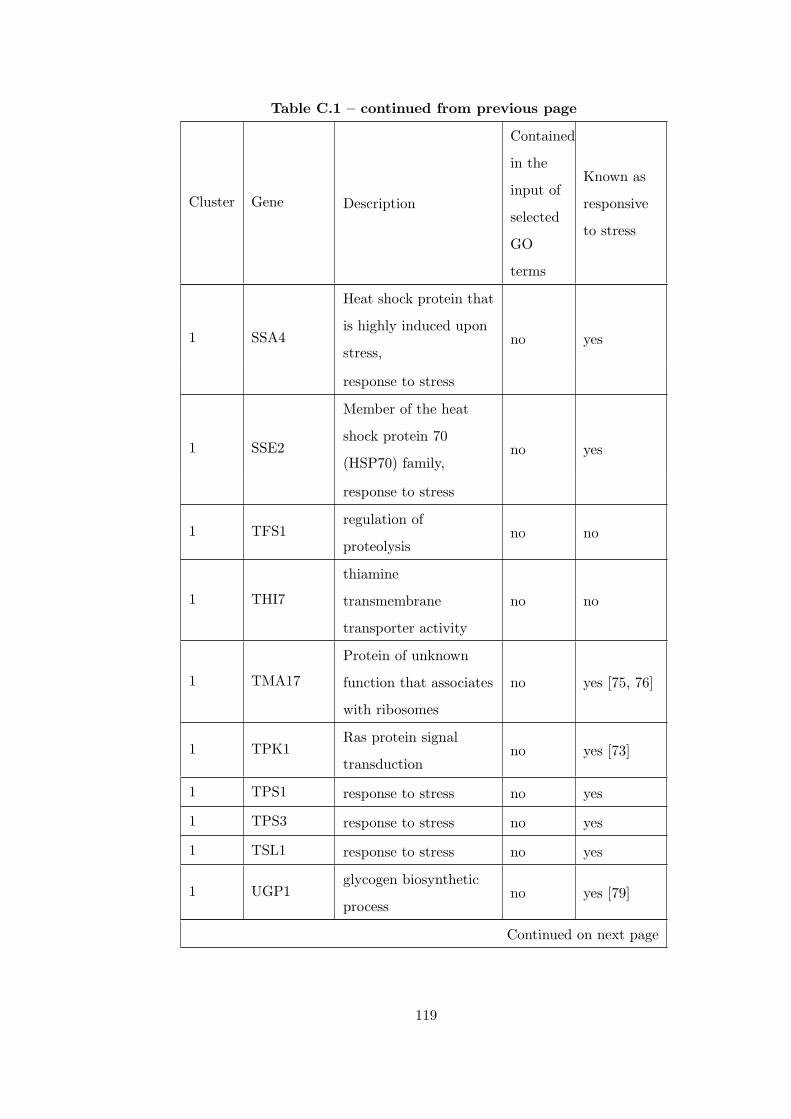
Table C.1 – continued from previous page
Cluster Gene Description
Contained
in the
input of
selected
GO
terms
Known as
responsive
to stress
1 SSA4
Heat shock protein that
is highly induced upon
stress,no yes
response to stress
1 SSE2
Member of the heat
shock protein 70
(HSP70) family,no yes
response to stress
1 TFS1regulation of
proteolysisno no
1 THI7
thiamine
transmembrane
transporter activity
no no
1 TMA17
Protein of unknown
function that associates
with ribosomes
no yes [75, 76]
1 TPK1Ras protein signal
transductionno yes [73]
1 TPS1 response to stress no yes
1 TPS3 response to stress no yes
1 TSL1 response to stress no yes
1 UGP1glycogen biosynthetic
processno yes [79]
Continued on next page
119
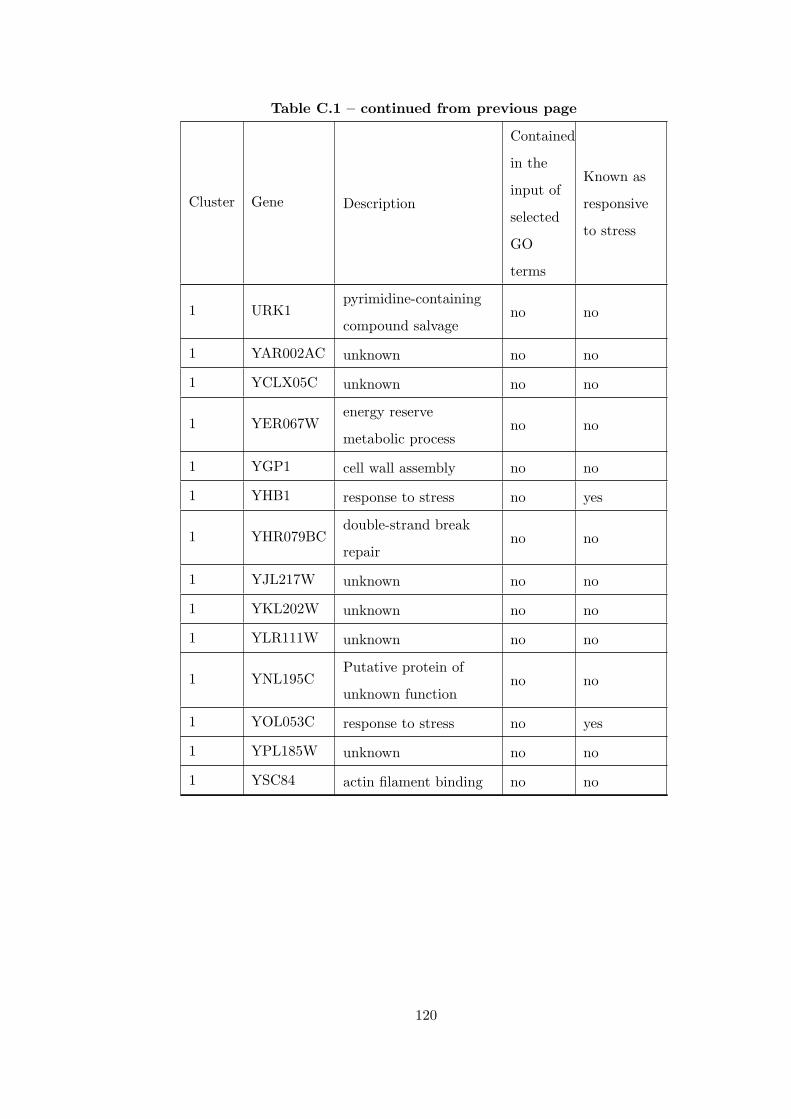
Table C.1 – continued from previous page
Cluster Gene Description
Contained
in the
input of
selected
GO
terms
Known as
responsive
to stress
1 URK1pyrimidine-containing
compound salvageno no
1 YAR002AC unknown no no
1 YCLX05C unknown no no
1 YER067Wenergy reserve
metabolic processno no
1 YGP1 cell wall assembly no no
1 YHB1 response to stress no yes
1 YHR079BCdouble-strand break
repairno no
1 YJL217W unknown no no
1 YKL202W unknown no no
1 YLR111W unknown no no
1 YNL195CPutative protein of
unknown functionno no
1 YOL053C response to stress no yes
1 YPL185W unknown no no
1 YSC84 actin filament binding no no
120
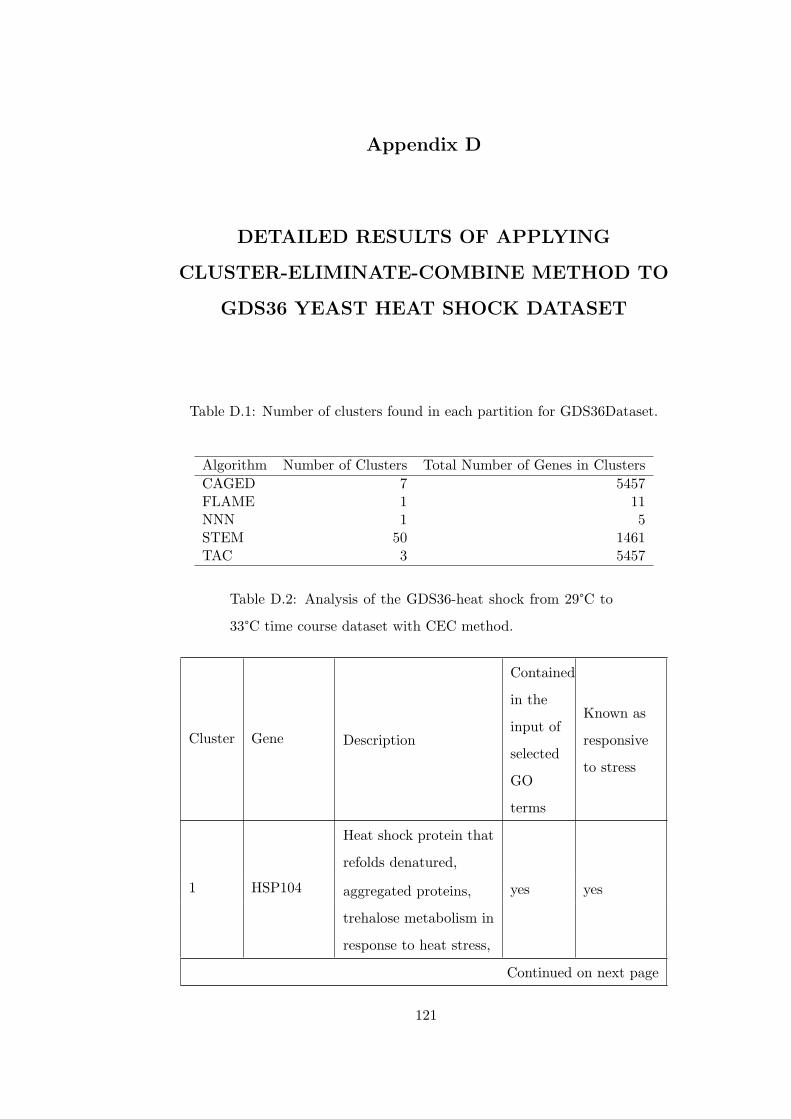
Appendix D
DETAILED RESULTS OF APPLYING
CLUSTER-ELIMINATE-COMBINE METHOD TO
GDS36 YEAST HEAT SHOCK DATASET
Table D.1: Number of clusters found in each partition for GDS36Dataset.
Algorithm Number of Clusters Total Number of Genes in ClustersCAGED 7 5457FLAME 1 11NNN 1 5STEM 50 1461TAC 3 5457
Table D.2: Analysis of the GDS36-heat shock from 29°C to
33°C time course dataset with CEC method.
Cluster Gene Description
Contained
in the
input of
selected
GO
terms
Known as
responsive
to stress
1 HSP104
Heat shock protein that
refolds denatured,
yes yesaggregated proteins,
trehalose metabolism in
response to heat stress,
Continued on next page
121
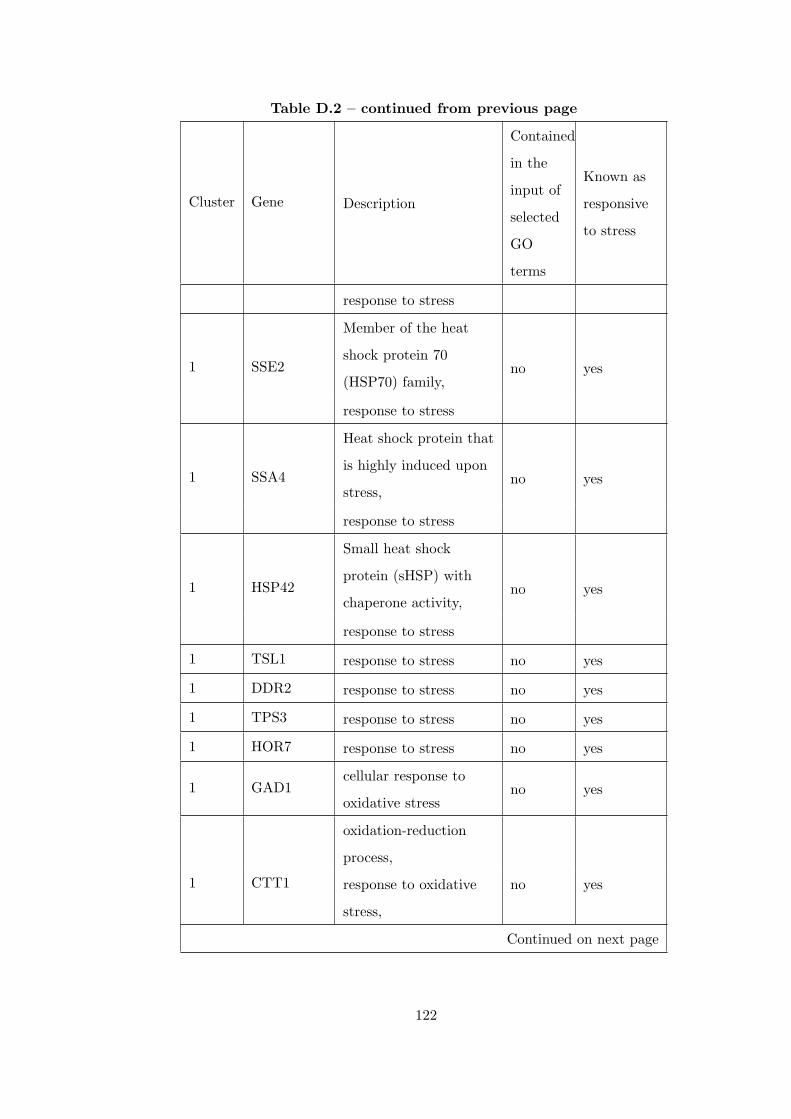
Table D.2 – continued from previous page
Cluster Gene Description
Contained
in the
input of
selected
GO
terms
Known as
responsive
to stress
response to stress
1 SSE2
Member of the heat
shock protein 70
(HSP70) family,no yes
response to stress
1 SSA4
Heat shock protein that
is highly induced upon
stress,no yes
response to stress
1 HSP42
Small heat shock
protein (sHSP) with
chaperone activity,no yes
response to stress
1 TSL1 response to stress no yes
1 DDR2 response to stress no yes
1 TPS3 response to stress no yes
1 HOR7 response to stress no yes
1 GAD1cellular response to
oxidative stressno yes
1 CTT1
oxidation-reduction
process,
no yesresponse to oxidative
stress,
Continued on next page
122
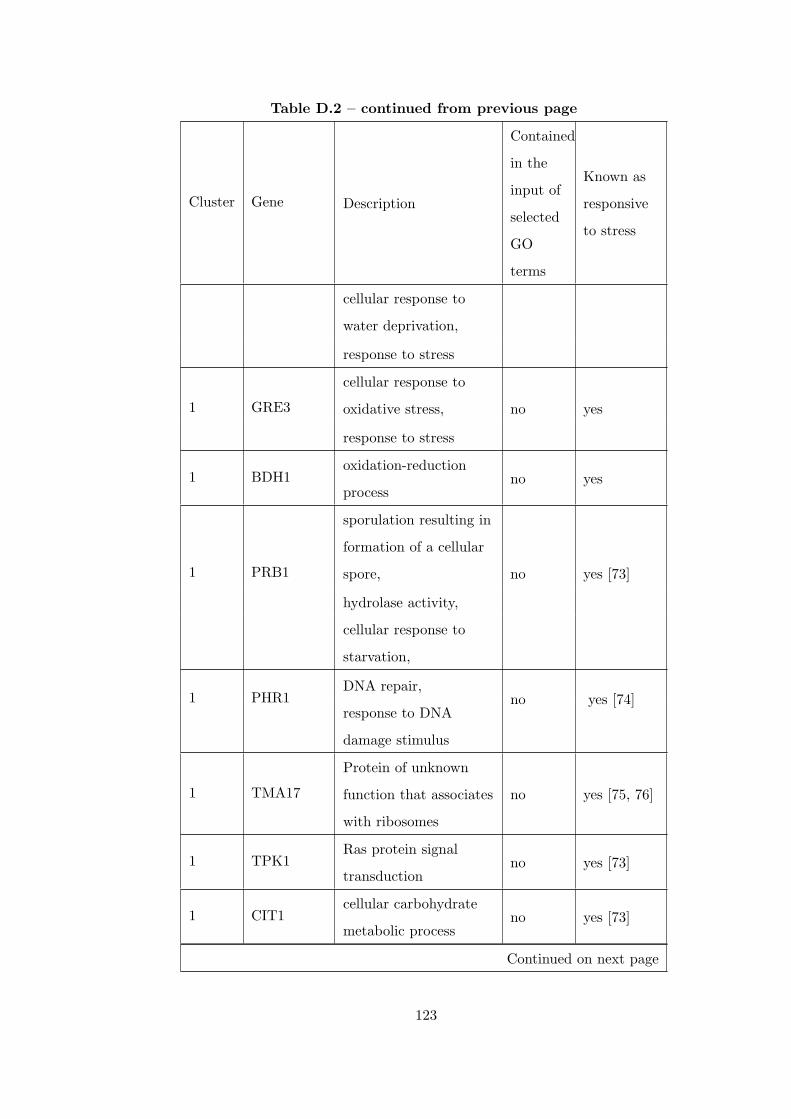
Table D.2 – continued from previous page
Cluster Gene Description
Contained
in the
input of
selected
GO
terms
Known as
responsive
to stress
cellular response to
water deprivation,
response to stress
1 GRE3
cellular response to
oxidative stress, no yes
response to stress
1 BDH1oxidation-reduction
processno yes
1 PRB1
sporulation resulting in
formation of a cellular
spore, no yes [73]
hydrolase activity,
cellular response to
starvation,
1 PHR1DNA repair,
no yes [74]response to DNA
damage stimulus
1 TMA17
Protein of unknown
function that associates
with ribosomes
no yes [75, 76]
1 TPK1Ras protein signal
transductionno yes [73]
1 CIT1cellular carbohydrate
metabolic processno yes [73]
Continued on next page
123
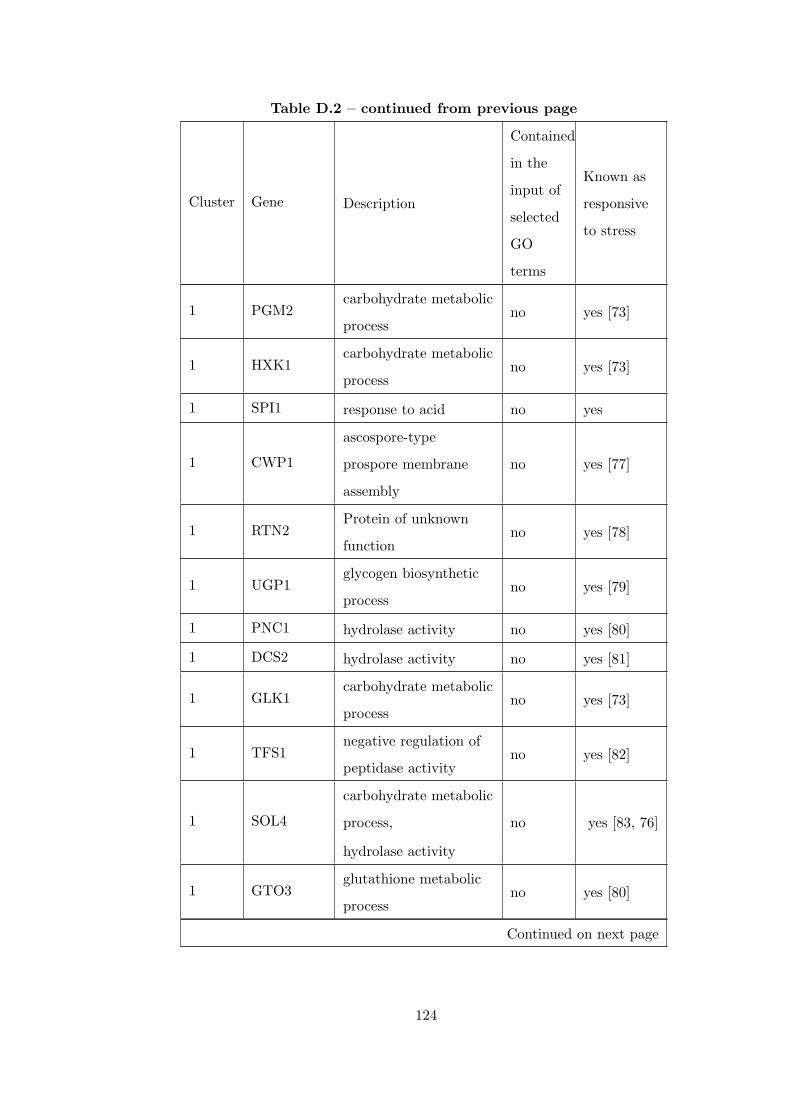
Table D.2 – continued from previous page
Cluster Gene Description
Contained
in the
input of
selected
GO
terms
Known as
responsive
to stress
1 PGM2carbohydrate metabolic
processno yes [73]
1 HXK1carbohydrate metabolic
processno yes [73]
1 SPI1 response to acid no yes
1 CWP1
ascospore-type
prospore membrane
assembly
no yes [77]
1 RTN2Protein of unknown
functionno yes [78]
1 UGP1glycogen biosynthetic
processno yes [79]
1 PNC1 hydrolase activity no yes [80]
1 DCS2 hydrolase activity no yes [81]
1 GLK1carbohydrate metabolic
processno yes [73]
1 TFS1negative regulation of
peptidase activityno yes [82]
1 SOL4
carbohydrate metabolic
process, no yes [83, 76]
hydrolase activity
1 GTO3glutathione metabolic
processno yes [80]
Continued on next page
124
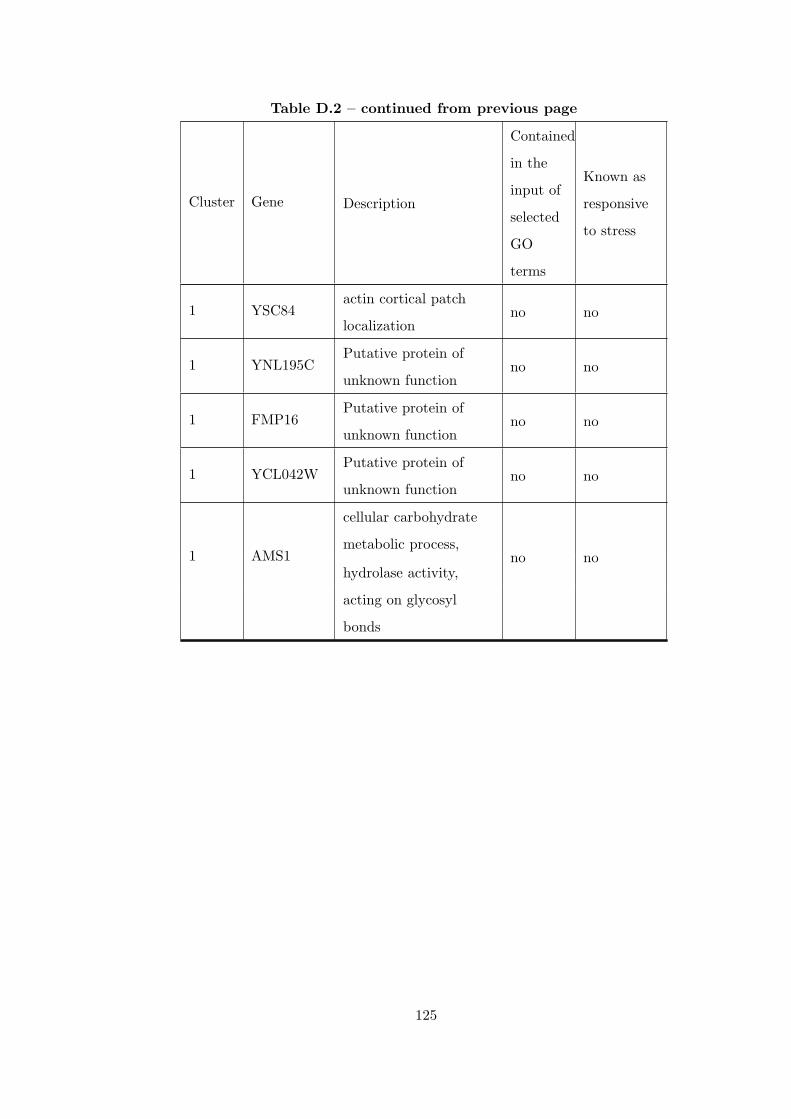
Table D.2 – continued from previous page
Cluster Gene Description
Contained
in the
input of
selected
GO
terms
Known as
responsive
to stress
1 YSC84actin cortical patch
localizationno no
1 YNL195CPutative protein of
unknown functionno no
1 FMP16Putative protein of
unknown functionno no
1 YCL042WPutative protein of
unknown functionno no
1 AMS1
cellular carbohydrate
metabolic process,no no
hydrolase activity,
acting on glycosyl
bonds
125
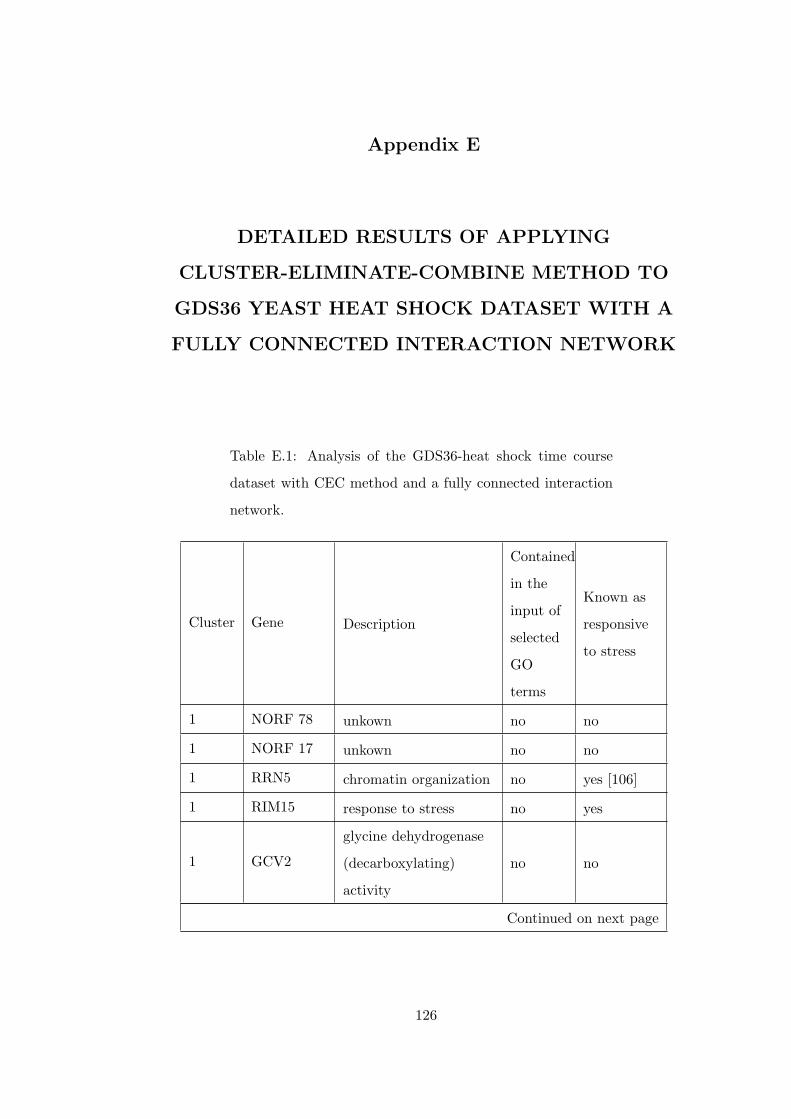
Appendix E
DETAILED RESULTS OF APPLYING
CLUSTER-ELIMINATE-COMBINE METHOD TO
GDS36 YEAST HEAT SHOCK DATASET WITH A
FULLY CONNECTED INTERACTION NETWORK
Table E.1: Analysis of the GDS36-heat shock time course
dataset with CEC method and a fully connected interaction
network.
Cluster Gene Description
Contained
in the
input of
selected
GO
terms
Known as
responsive
to stress
1 NORF 78 unkown no no
1 NORF 17 unkown no no
1 RRN5 chromatin organization no yes [106]
1 RIM15 response to stress no yes
1 GCV2
glycine dehydrogenase
(decarboxylating)
activity
no no
Continued on next page
126
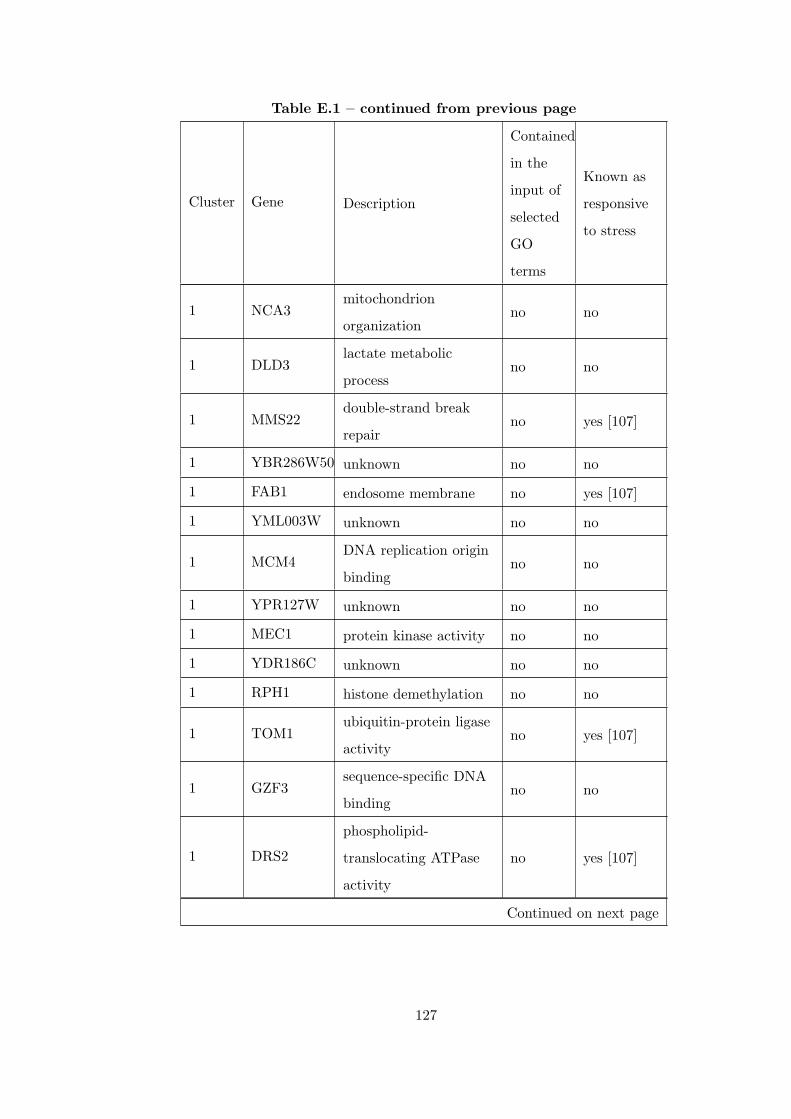
Table E.1 – continued from previous page
Cluster Gene Description
Contained
in the
input of
selected
GO
terms
Known as
responsive
to stress
1 NCA3mitochondrion
organizationno no
1 DLD3lactate metabolic
processno no
1 MMS22double-strand break
repairno yes [107]
1 YBR286W50 unknown no no
1 FAB1 endosome membrane no yes [107]
1 YML003W unknown no no
1 MCM4DNA replication origin
bindingno no
1 YPR127W unknown no no
1 MEC1 protein kinase activity no no
1 YDR186C unknown no no
1 RPH1 histone demethylation no no
1 TOM1ubiquitin-protein ligase
activityno yes [107]
1 GZF3sequence-specific DNA
bindingno no
1 DRS2
phospholipid-
translocating ATPase
activity
no yes [107]
Continued on next page
127
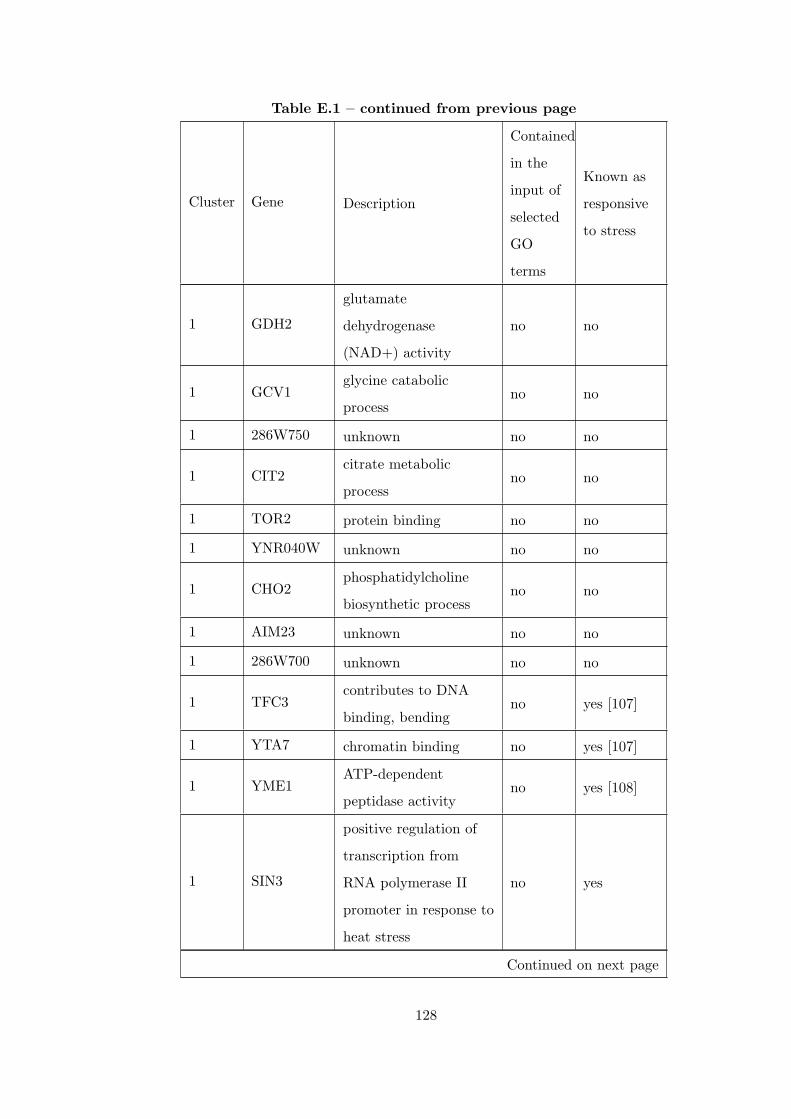
Table E.1 – continued from previous page
Cluster Gene Description
Contained
in the
input of
selected
GO
terms
Known as
responsive
to stress
1 GDH2
glutamate
dehydrogenase
(NAD+) activity
no no
1 GCV1glycine catabolic
processno no
1 286W750 unknown no no
1 CIT2citrate metabolic
processno no
1 TOR2 protein binding no no
1 YNR040W unknown no no
1 CHO2phosphatidylcholine
biosynthetic processno no
1 AIM23 unknown no no
1 286W700 unknown no no
1 TFC3contributes to DNA
binding, bendingno yes [107]
1 YTA7 chromatin binding no yes [107]
1 YME1ATP-dependent
peptidase activityno yes [108]
1 SIN3
positive regulation of
transcription from
RNA polymerase II
promoter in response to
heat stress
no yes
Continued on next page
128
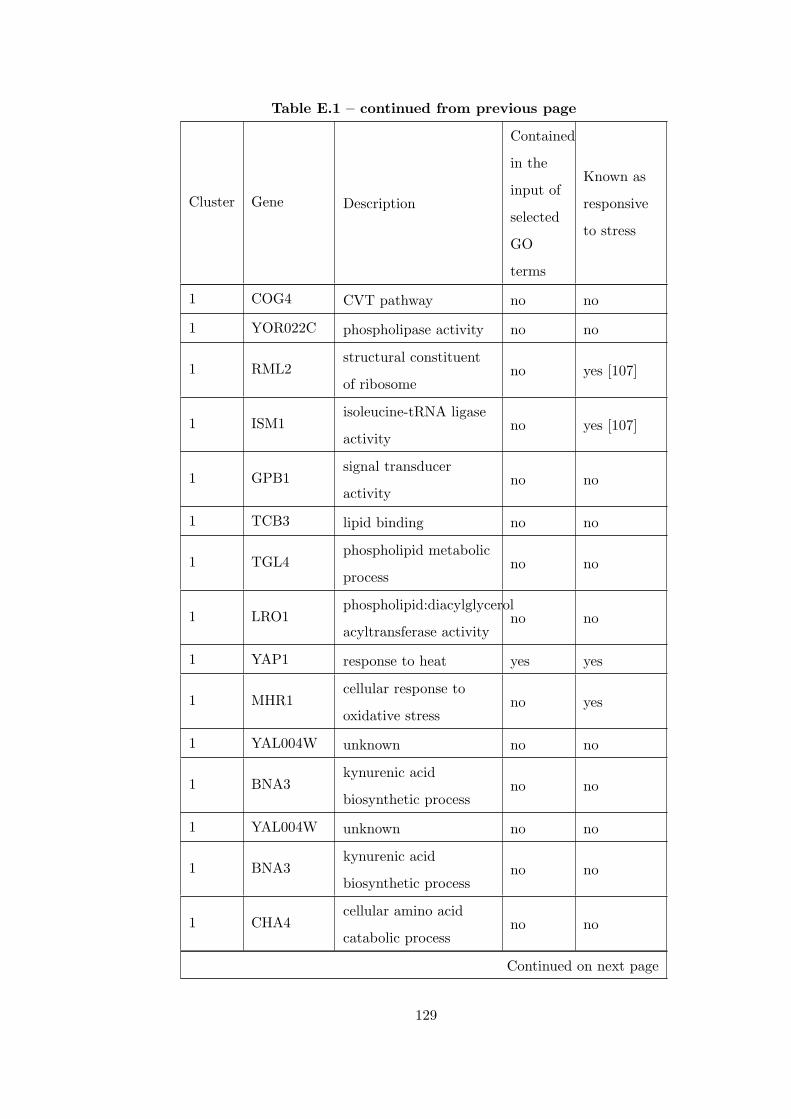
Table E.1 – continued from previous page
Cluster Gene Description
Contained
in the
input of
selected
GO
terms
Known as
responsive
to stress
1 COG4 CVT pathway no no
1 YOR022C phospholipase activity no no
1 RML2structural constituent
of ribosomeno yes [107]
1 ISM1isoleucine-tRNA ligase
activityno yes [107]
1 GPB1signal transducer
activityno no
1 TCB3 lipid binding no no
1 TGL4phospholipid metabolic
processno no
1 LRO1phospholipid:diacylglycerol
acyltransferase activityno no
1 YAP1 response to heat yes yes
1 MHR1cellular response to
oxidative stressno yes
1 YAL004W unknown no no
1 BNA3kynurenic acid
biosynthetic processno no
1 YAL004W unknown no no
1 BNA3kynurenic acid
biosynthetic processno no
1 CHA4cellular amino acid
catabolic processno no
Continued on next page
129
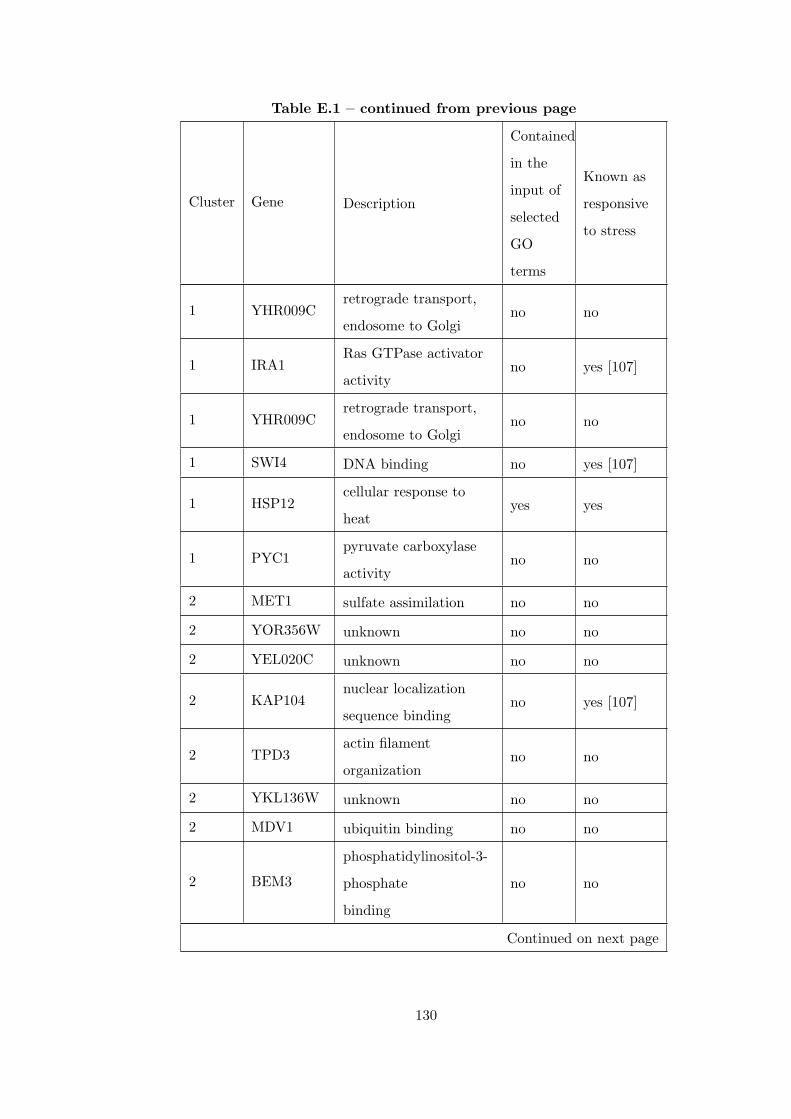
Table E.1 – continued from previous page
Cluster Gene Description
Contained
in the
input of
selected
GO
terms
Known as
responsive
to stress
1 YHR009Cretrograde transport,
endosome to Golgino no
1 IRA1Ras GTPase activator
activityno yes [107]
1 YHR009Cretrograde transport,
endosome to Golgino no
1 SWI4 DNA binding no yes [107]
1 HSP12cellular response to
heatyes yes
1 PYC1pyruvate carboxylase
activityno no
2 MET1 sulfate assimilation no no
2 YOR356W unknown no no
2 YEL020C unknown no no
2 KAP104nuclear localization
sequence bindingno yes [107]
2 TPD3actin filament
organizationno no
2 YKL136W unknown no no
2 MDV1 ubiquitin binding no no
2 BEM3
phosphatidylinositol-3-
phosphate
binding
no no
Continued on next page
130
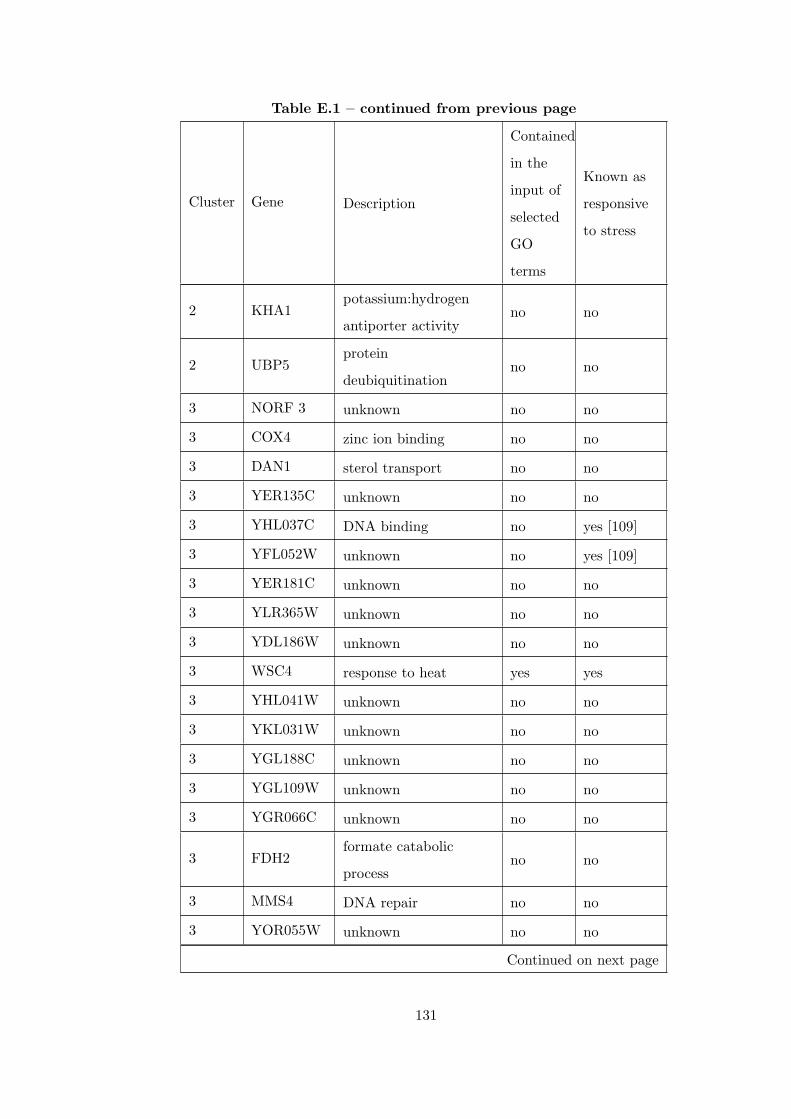
Table E.1 – continued from previous page
Cluster Gene Description
Contained
in the
input of
selected
GO
terms
Known as
responsive
to stress
2 KHA1potassium:hydrogen
antiporter activityno no
2 UBP5protein
deubiquitinationno no
3 NORF 3 unknown no no
3 COX4 zinc ion binding no no
3 DAN1 sterol transport no no
3 YER135C unknown no no
3 YHL037C DNA binding no yes [109]
3 YFL052W unknown no yes [109]
3 YER181C unknown no no
3 YLR365W unknown no no
3 YDL186W unknown no no
3 WSC4 response to heat yes yes
3 YHL041W unknown no no
3 YKL031W unknown no no
3 YGL188C unknown no no
3 YGL109W unknown no no
3 YGR066C unknown no no
3 FDH2formate catabolic
processno no
3 MMS4 DNA repair no no
3 YOR055W unknown no no
Continued on next page
131
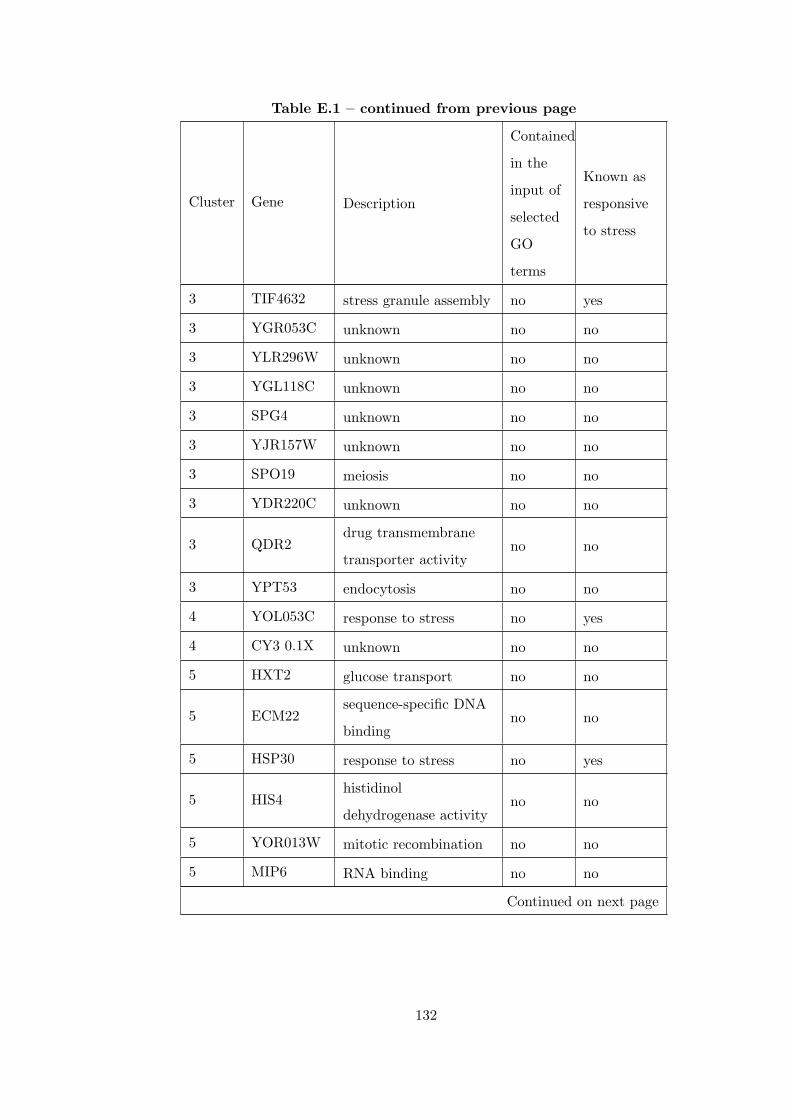
Table E.1 – continued from previous page
Cluster Gene Description
Contained
in the
input of
selected
GO
terms
Known as
responsive
to stress
3 TIF4632 stress granule assembly no yes
3 YGR053C unknown no no
3 YLR296W unknown no no
3 YGL118C unknown no no
3 SPG4 unknown no no
3 YJR157W unknown no no
3 SPO19 meiosis no no
3 YDR220C unknown no no
3 QDR2drug transmembrane
transporter activityno no
3 YPT53 endocytosis no no
4 YOL053C response to stress no yes
4 CY3 0.1X unknown no no
5 HXT2 glucose transport no no
5 ECM22sequence-specific DNA
bindingno no
5 HSP30 response to stress no yes
5 HIS4histidinol
dehydrogenase activityno no
5 YOR013W mitotic recombination no no
5 MIP6 RNA binding no no
Continued on next page
132
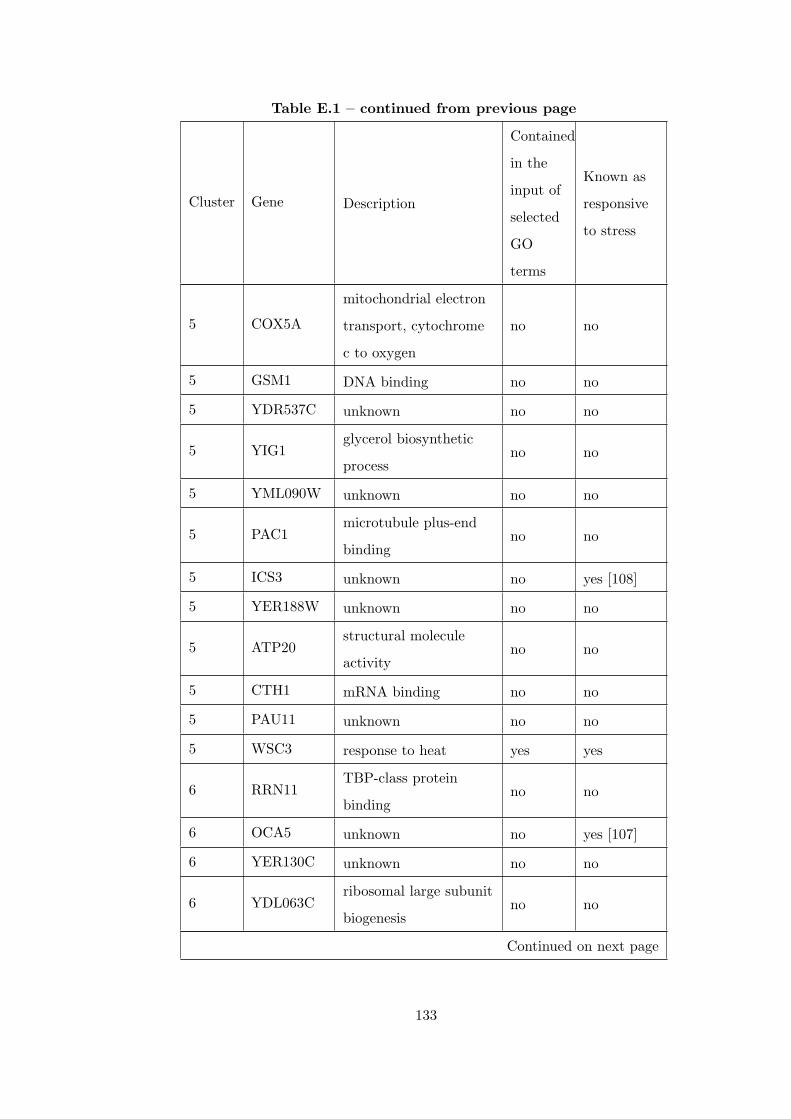
Table E.1 – continued from previous page
Cluster Gene Description
Contained
in the
input of
selected
GO
terms
Known as
responsive
to stress
5 COX5A
mitochondrial electron
transport, cytochrome
c to oxygen
no no
5 GSM1 DNA binding no no
5 YDR537C unknown no no
5 YIG1glycerol biosynthetic
processno no
5 YML090W unknown no no
5 PAC1microtubule plus-end
bindingno no
5 ICS3 unknown no yes [108]
5 YER188W unknown no no
5 ATP20structural molecule
activityno no
5 CTH1 mRNA binding no no
5 PAU11 unknown no no
5 WSC3 response to heat yes yes
6 RRN11TBP-class protein
bindingno no
6 OCA5 unknown no yes [107]
6 YER130C unknown no no
6 YDL063Cribosomal large subunit
biogenesisno no
Continued on next page
133
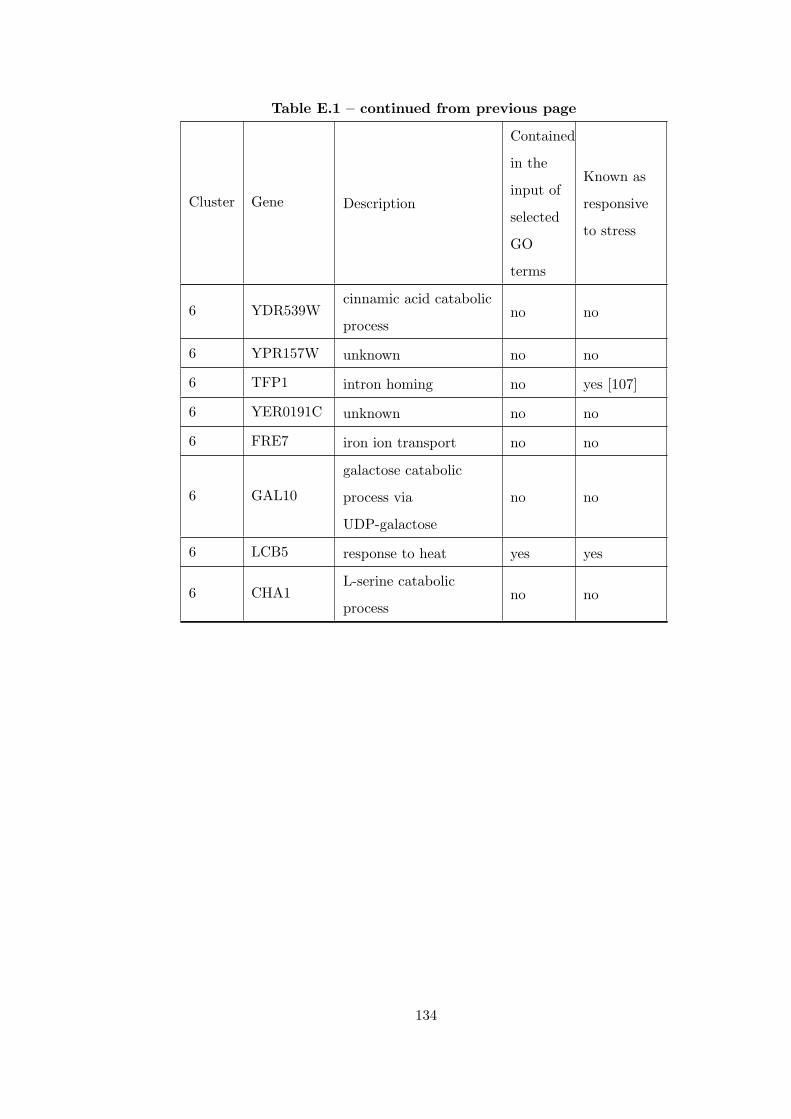
Table E.1 – continued from previous page
Cluster Gene Description
Contained
in the
input of
selected
GO
terms
Known as
responsive
to stress
6 YDR539Wcinnamic acid catabolic
processno no
6 YPR157W unknown no no
6 TFP1 intron homing no yes [107]
6 YER0191C unknown no no
6 FRE7 iron ion transport no no
6 GAL10
galactose catabolic
process via
UDP-galactose
no no
6 LCB5 response to heat yes yes
6 CHA1L-serine catabolic
processno no
134
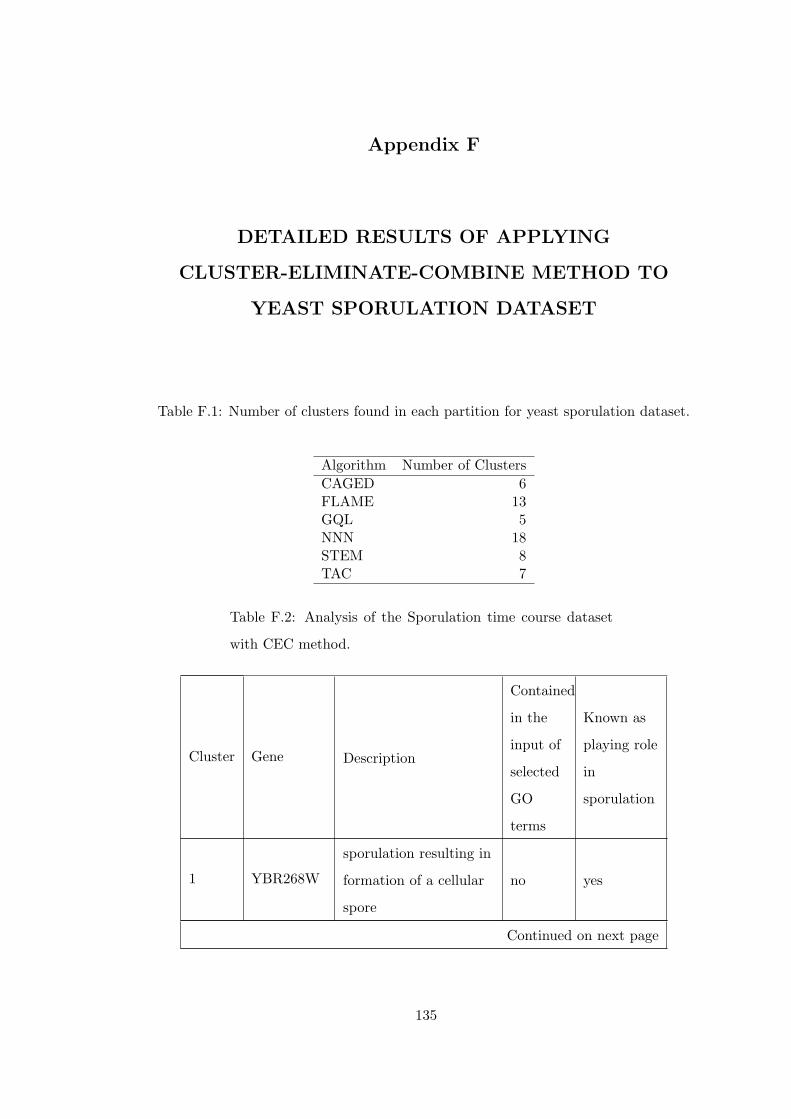
Appendix F
DETAILED RESULTS OF APPLYING
CLUSTER-ELIMINATE-COMBINE METHOD TO
YEAST SPORULATION DATASET
Table F.1: Number of clusters found in each partition for yeast sporulation dataset.
Algorithm Number of ClustersCAGED 6FLAME 13GQL 5NNN 18STEM 8TAC 7
Table F.2: Analysis of the Sporulation time course dataset
with CEC method.
Cluster Gene Description
Contained
in the
input of
selected
GO
terms
Known as
playing role
in
sporulation
1 YBR268W
sporulation resulting in
formation of a cellular
spore
no yes
Continued on next page
135
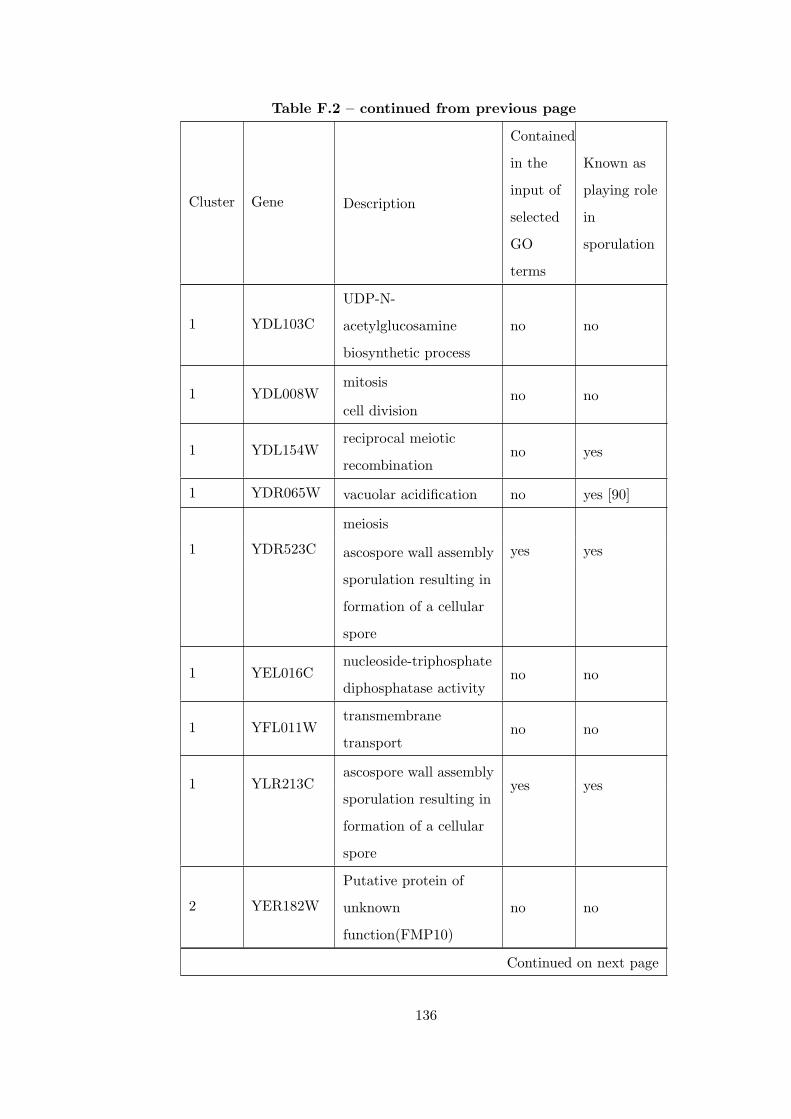
Table F.2 – continued from previous page
Cluster Gene Description
Contained
in the
input of
selected
GO
terms
Known as
playing role
in
sporulation
1 YDL103C
UDP-N-
acetylglucosamine
biosynthetic process
no no
1 YDL008Wmitosis
no nocell division
1 YDL154Wreciprocal meiotic
recombinationno yes
1 YDR065W vacuolar acidification no yes [90]
1 YDR523C
meiosis
yes yesascospore wall assembly
sporulation resulting in
formation of a cellular
spore
1 YEL016Cnucleoside-triphosphate
diphosphatase activityno no
1 YFL011Wtransmembrane
transportno no
1 YLR213Cascospore wall assembly
yes yessporulation resulting in
formation of a cellular
spore
2 YER182W
Putative protein of
unknown
function(FMP10)
no no
Continued on next page
136
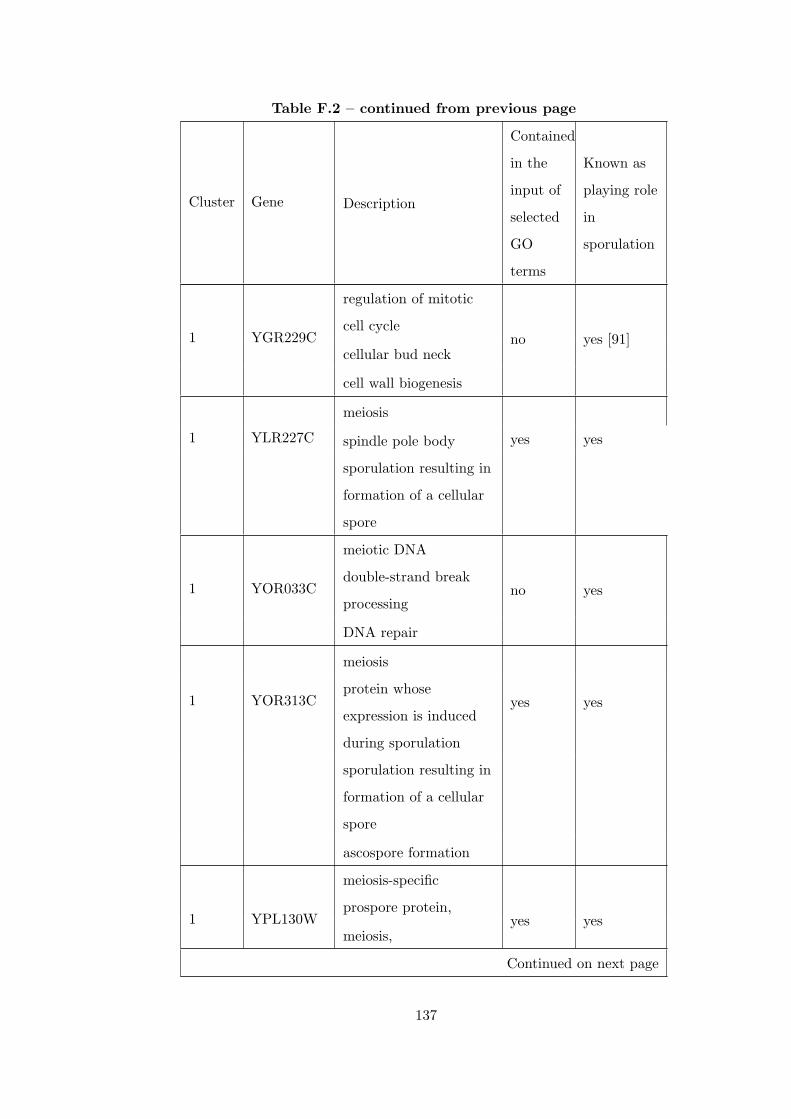
Table F.2 – continued from previous page
Cluster Gene Description
Contained
in the
input of
selected
GO
terms
Known as
playing role
in
sporulation
1 YGR229C
regulation of mitotic
cell cycleno yes [91]
cellular bud neck
cell wall biogenesis
1 YLR227C
meiosis
yes yesspindle pole body
sporulation resulting in
formation of a cellular
spore
1 YOR033C
meiotic DNA
double-strand break
processingno yes
DNA repair
1 YOR313C
meiosis
yes yesprotein whose
expression is induced
during sporulation
sporulation resulting in
formation of a cellular
spore
ascospore formation
1 YPL130W
meiosis-specific
prospore protein,yes yes
meiosis,
Continued on next page
137
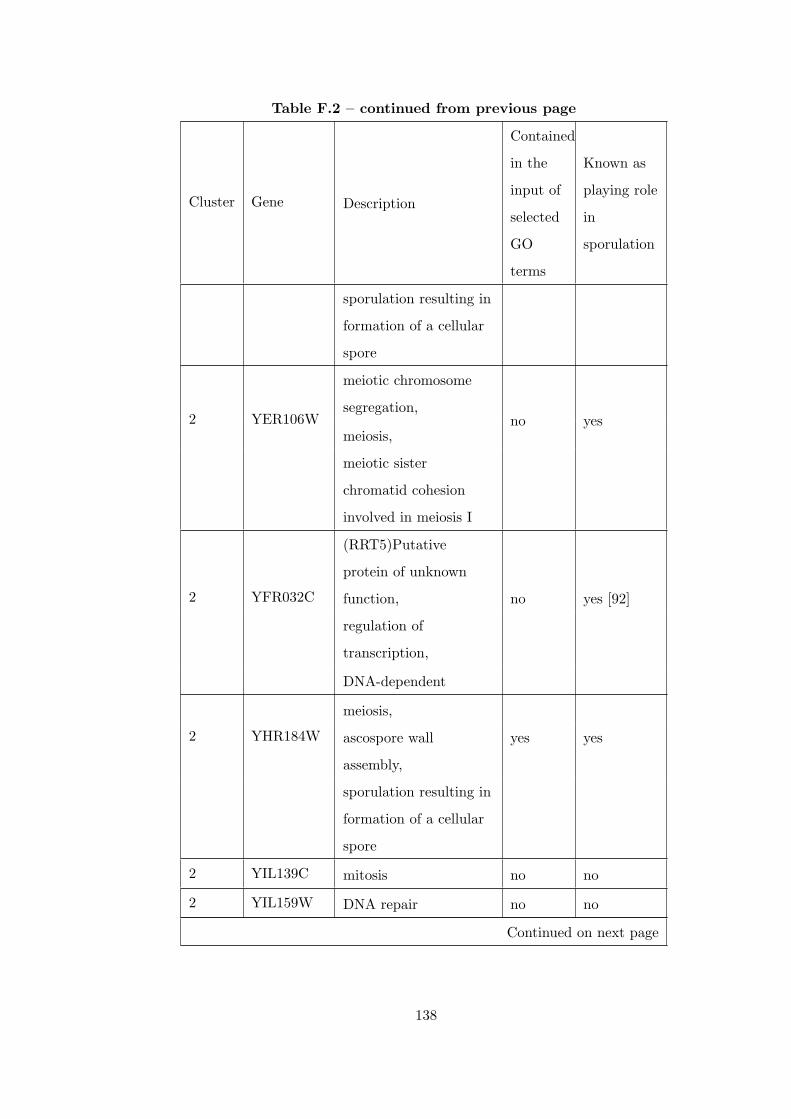
Table F.2 – continued from previous page
Cluster Gene Description
Contained
in the
input of
selected
GO
terms
Known as
playing role
in
sporulation
sporulation resulting in
formation of a cellular
spore
2 YER106W
meiotic chromosome
segregation,no yes
meiosis,
meiotic sister
chromatid cohesion
involved in meiosis I
2 YFR032C
(RRT5)Putative
protein of unknown
function, no yes [92]
regulation of
transcription,
DNA-dependent
2 YHR184W
meiosis,
yes yesascospore wall
assembly,
sporulation resulting in
formation of a cellular
spore
2 YIL139C mitosis no no
2 YIL159W DNA repair no no
Continued on next page
138
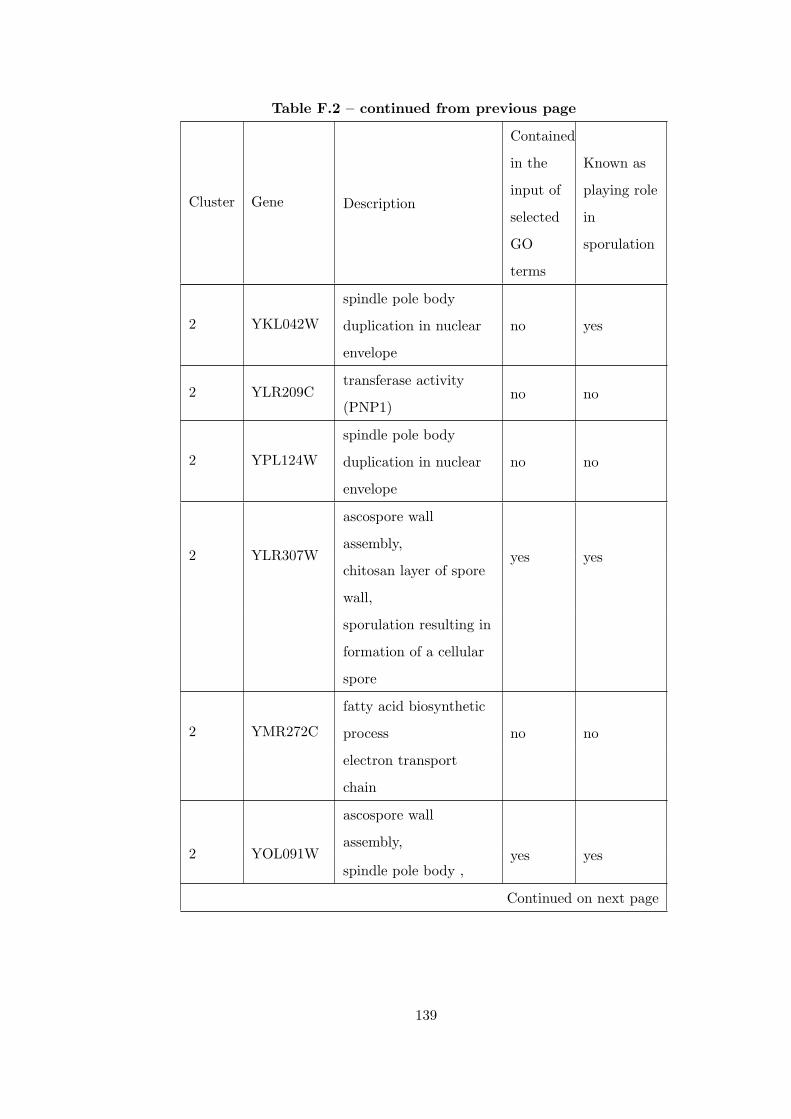
Table F.2 – continued from previous page
Cluster Gene Description
Contained
in the
input of
selected
GO
terms
Known as
playing role
in
sporulation
2 YKL042W
spindle pole body
duplication in nuclear
envelope
no yes
2 YLR209Ctransferase activity
(PNP1)no no
2 YPL124W
spindle pole body
duplication in nuclear
envelope
no no
2 YLR307W
ascospore wall
assembly,yes yes
chitosan layer of spore
wall,
sporulation resulting in
formation of a cellular
spore
2 YMR272C
fatty acid biosynthetic
process no no
electron transport
chain
2 YOL091W
ascospore wall
assembly,yes yes
spindle pole body ,
Continued on next page
139
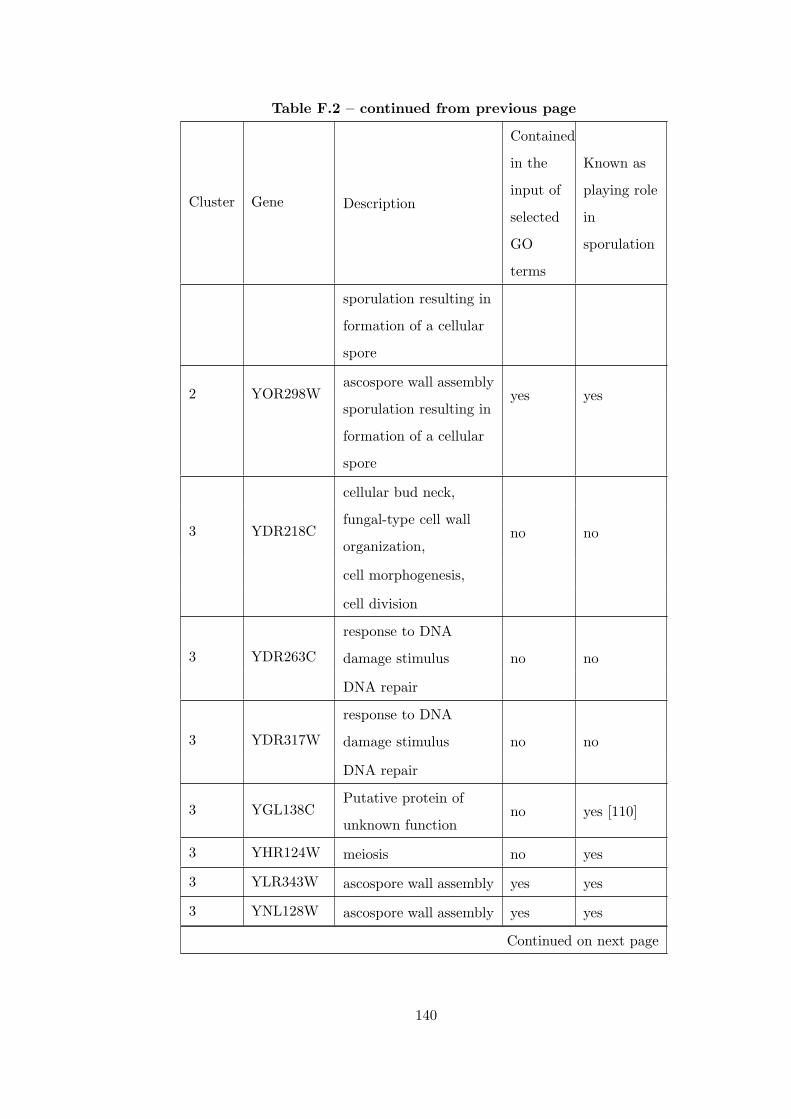
Table F.2 – continued from previous page
Cluster Gene Description
Contained
in the
input of
selected
GO
terms
Known as
playing role
in
sporulation
sporulation resulting in
formation of a cellular
spore
2 YOR298Wascospore wall assembly
yes yessporulation resulting in
formation of a cellular
spore
3 YDR218C
cellular bud neck,
no nofungal-type cell wall
organization,
cell morphogenesis,
cell division
3 YDR263C
response to DNA
damage stimulus no no
DNA repair
3 YDR317W
response to DNA
damage stimulus no no
DNA repair
3 YGL138CPutative protein of
unknown functionno yes [110]
3 YHR124W meiosis no yes
3 YLR343W ascospore wall assembly yes yes
3 YNL128W ascospore wall assembly yes yes
Continued on next page
140
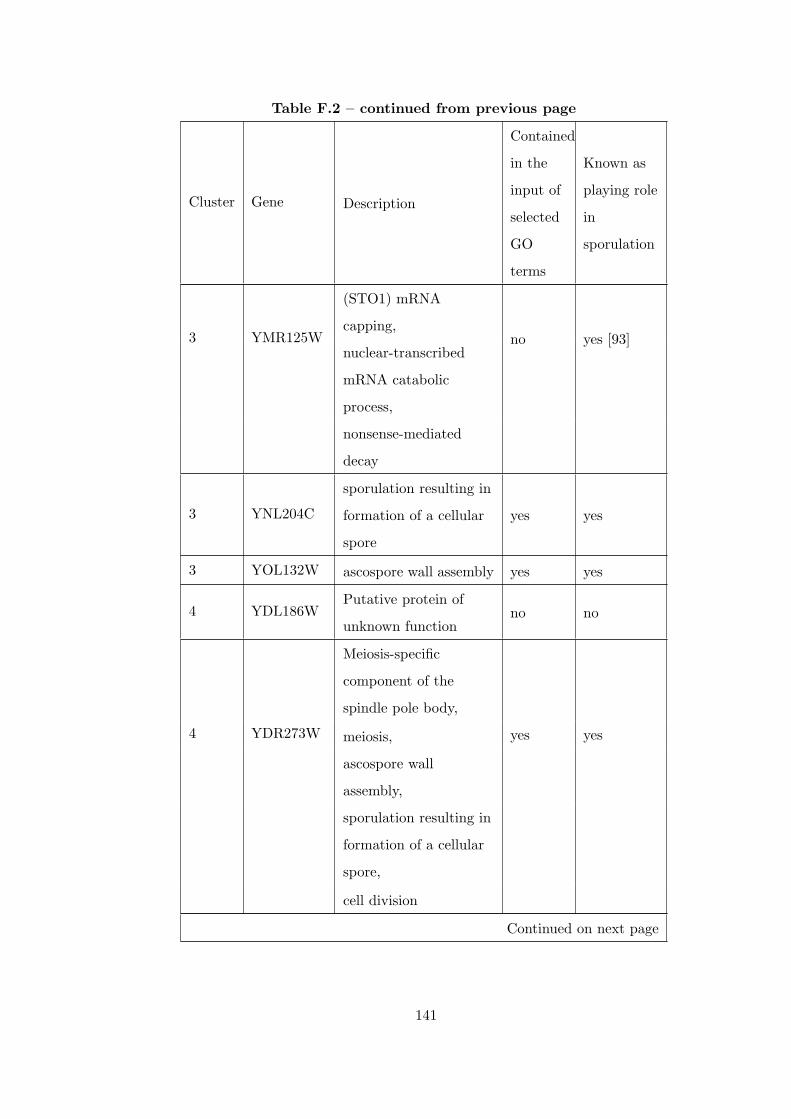
Table F.2 – continued from previous page
Cluster Gene Description
Contained
in the
input of
selected
GO
terms
Known as
playing role
in
sporulation
3 YMR125W
(STO1) mRNA
capping,no yes [93]
nuclear-transcribed
mRNA catabolic
process,
nonsense-mediated
decay
3 YNL204C
sporulation resulting in
formation of a cellular
spore
yes yes
3 YOL132W ascospore wall assembly yes yes
4 YDL186WPutative protein of
unknown functionno no
4 YDR273W
Meiosis-specific
component of the
spindle pole body,
yes yesmeiosis,
ascospore wall
assembly,
sporulation resulting in
formation of a cellular
spore,
cell division
Continued on next page
141
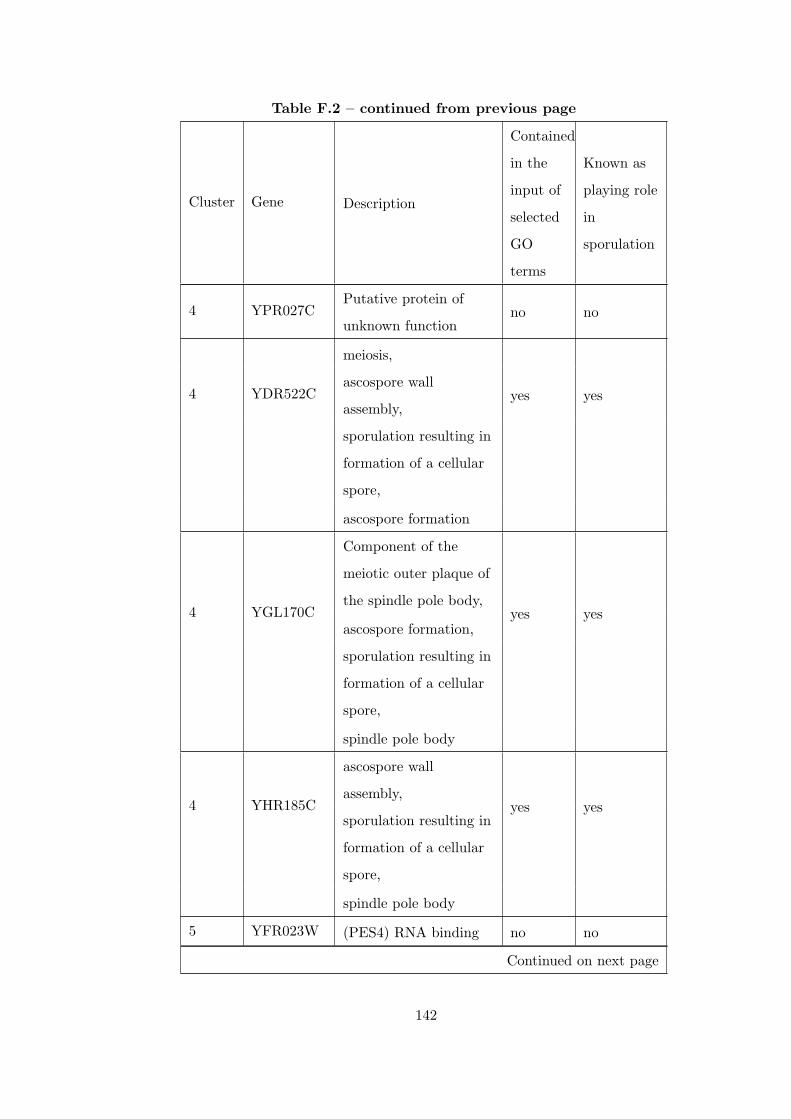
Table F.2 – continued from previous page
Cluster Gene Description
Contained
in the
input of
selected
GO
terms
Known as
playing role
in
sporulation
4 YPR027CPutative protein of
unknown functionno no
4 YDR522C
meiosis,
yes yesascospore wall
assembly,
sporulation resulting in
formation of a cellular
spore,
ascospore formation
4 YGL170C
Component of the
meiotic outer plaque of
the spindle pole body,yes yes
ascospore formation,
sporulation resulting in
formation of a cellular
spore,
spindle pole body
4 YHR185C
ascospore wall
assembly,yes yes
sporulation resulting in
formation of a cellular
spore,
spindle pole body
5 YFR023W (PES4) RNA binding no no
Continued on next page
142
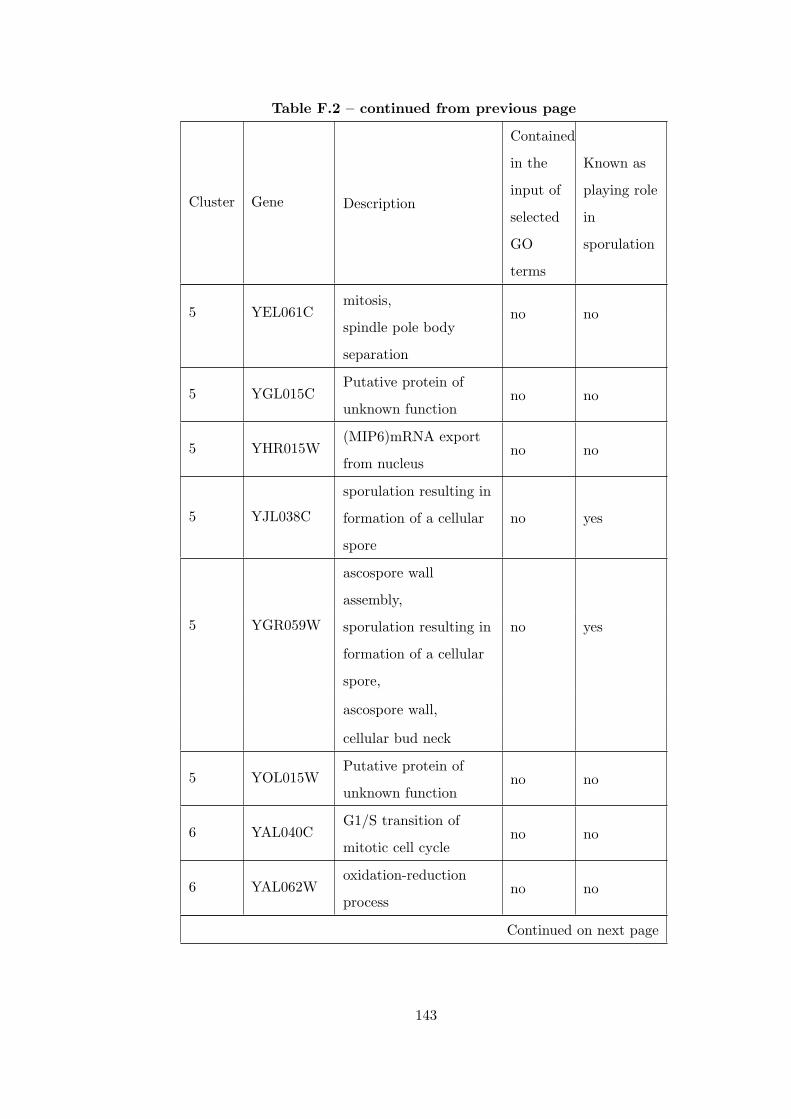
Table F.2 – continued from previous page
Cluster Gene Description
Contained
in the
input of
selected
GO
terms
Known as
playing role
in
sporulation
5 YEL061Cmitosis,
no nospindle pole body
separation
5 YGL015CPutative protein of
unknown functionno no
5 YHR015W(MIP6)mRNA export
from nucleusno no
5 YJL038C
sporulation resulting in
formation of a cellular
spore
no yes
5 YGR059W
ascospore wall
assembly,
no yessporulation resulting in
formation of a cellular
spore,
ascospore wall,
cellular bud neck
5 YOL015WPutative protein of
unknown functionno no
6 YAL040CG1/S transition of
mitotic cell cycleno no
6 YAL062Woxidation-reduction
processno no
Continued on next page
143
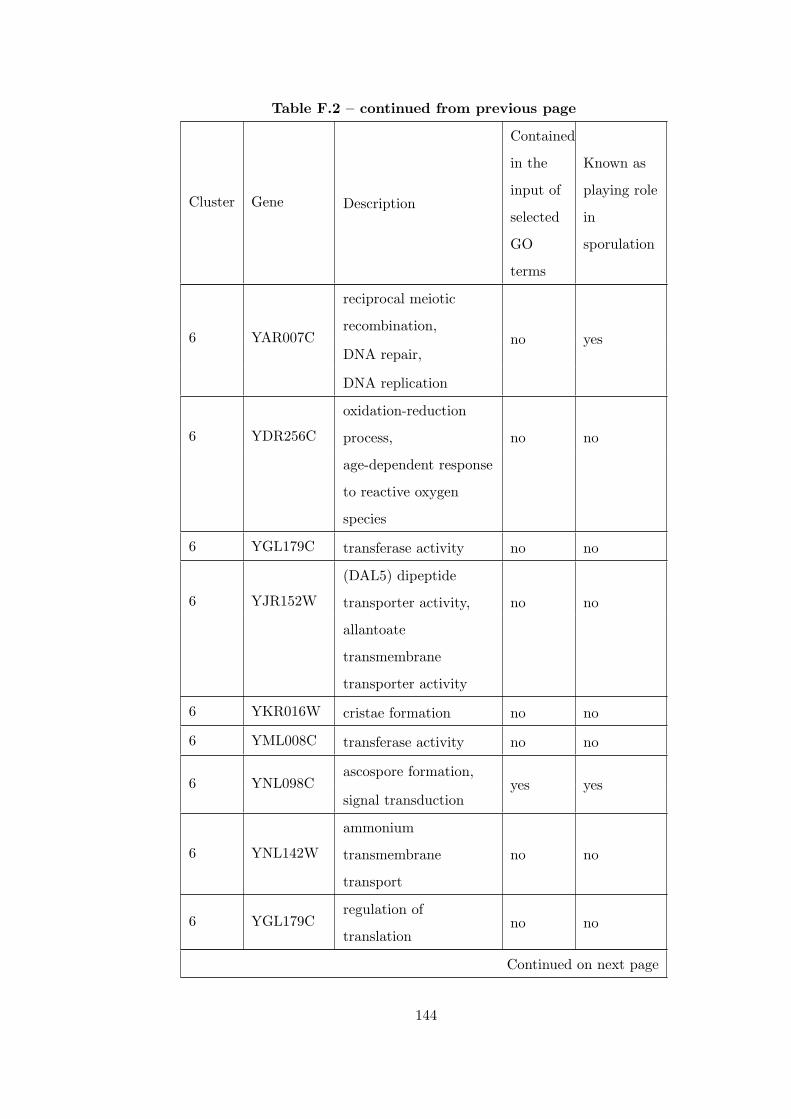
Table F.2 – continued from previous page
Cluster Gene Description
Contained
in the
input of
selected
GO
terms
Known as
playing role
in
sporulation
6 YAR007C
reciprocal meiotic
recombination,no yes
DNA repair,
DNA replication
6 YDR256C
oxidation-reduction
process, no no
age-dependent response
to reactive oxygen
species
6 YGL179C transferase activity no no
6 YJR152W
(DAL5) dipeptide
transporter activity, no no
allantoate
transmembrane
transporter activity
6 YKR016W cristae formation no no
6 YML008C transferase activity no no
6 YNL098Cascospore formation,
yes yessignal transduction
6 YNL142W
ammonium
transmembrane
transport
no no
6 YGL179Cregulation of
translationno no
Continued on next page
144
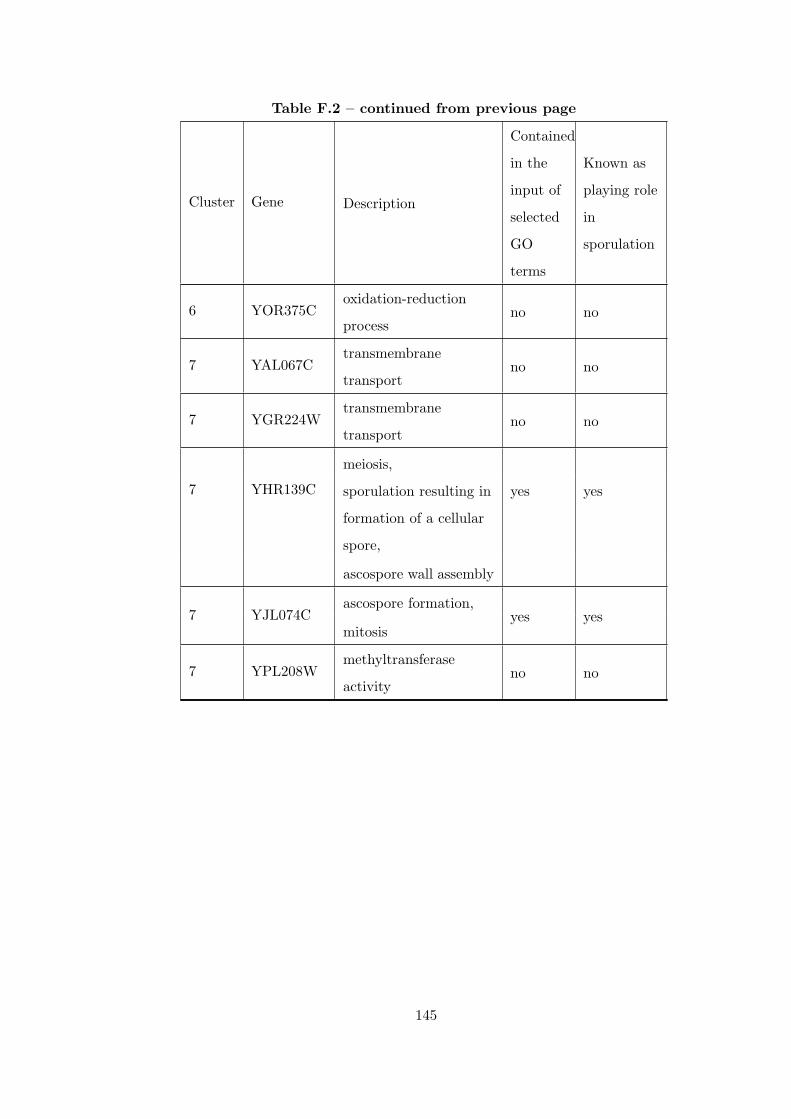
Table F.2 – continued from previous page
Cluster Gene Description
Contained
in the
input of
selected
GO
terms
Known as
playing role
in
sporulation
6 YOR375Coxidation-reduction
processno no
7 YAL067Ctransmembrane
transportno no
7 YGR224Wtransmembrane
transportno no
7 YHR139C
meiosis,
yes yessporulation resulting in
formation of a cellular
spore,
ascospore wall assembly
7 YJL074Cascospore formation,
yes yesmitosis
7 YPL208Wmethyltransferase
activityno no
145
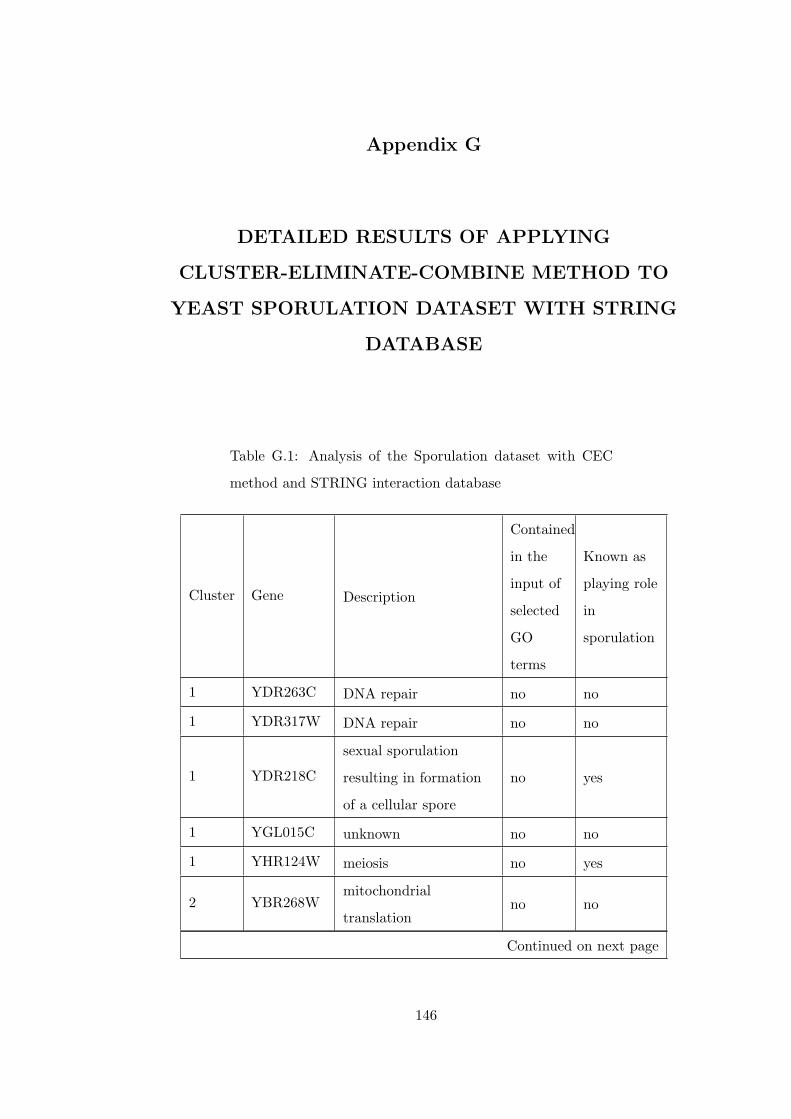
Appendix G
DETAILED RESULTS OF APPLYING
CLUSTER-ELIMINATE-COMBINE METHOD TO
YEAST SPORULATION DATASET WITH STRING
DATABASE
Table G.1: Analysis of the Sporulation dataset with CEC
method and STRING interaction database
Cluster Gene Description
Contained
in the
input of
selected
GO
terms
Known as
playing role
in
sporulation
1 YDR263C DNA repair no no
1 YDR317W DNA repair no no
1 YDR218C
sexual sporulation
resulting in formation
of a cellular spore
no yes
1 YGL015C unknown no no
1 YHR124W meiosis no yes
2 YBR268Wmitochondrial
translationno no
Continued on next page
146
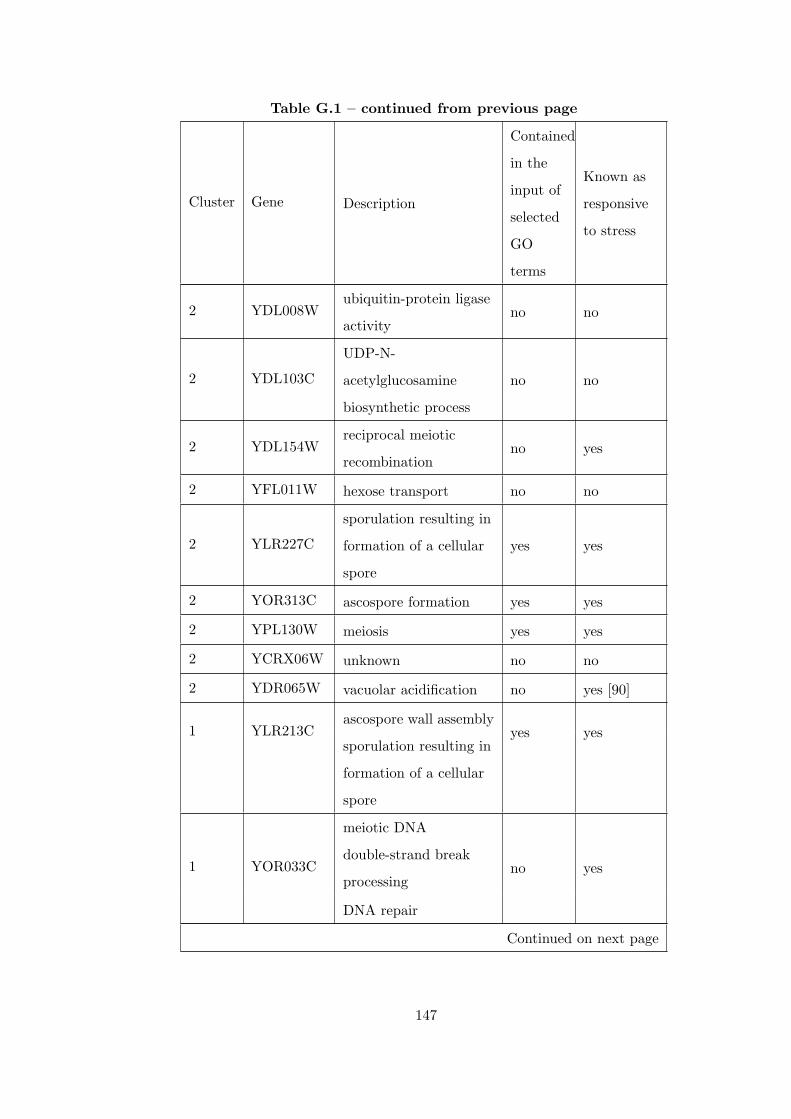
Table G.1 – continued from previous page
Cluster Gene Description
Contained
in the
input of
selected
GO
terms
Known as
responsive
to stress
2 YDL008Wubiquitin-protein ligase
activityno no
2 YDL103C
UDP-N-
acetylglucosamine
biosynthetic process
no no
2 YDL154Wreciprocal meiotic
recombinationno yes
2 YFL011W hexose transport no no
2 YLR227C
sporulation resulting in
formation of a cellular
spore
yes yes
2 YOR313C ascospore formation yes yes
2 YPL130W meiosis yes yes
2 YCRX06W unknown no no
2 YDR065W vacuolar acidification no yes [90]
1 YLR213Cascospore wall assembly
yes yessporulation resulting in
formation of a cellular
spore
1 YOR033C
meiotic DNA
double-strand break
processingno yes
DNA repair
Continued on next page
147
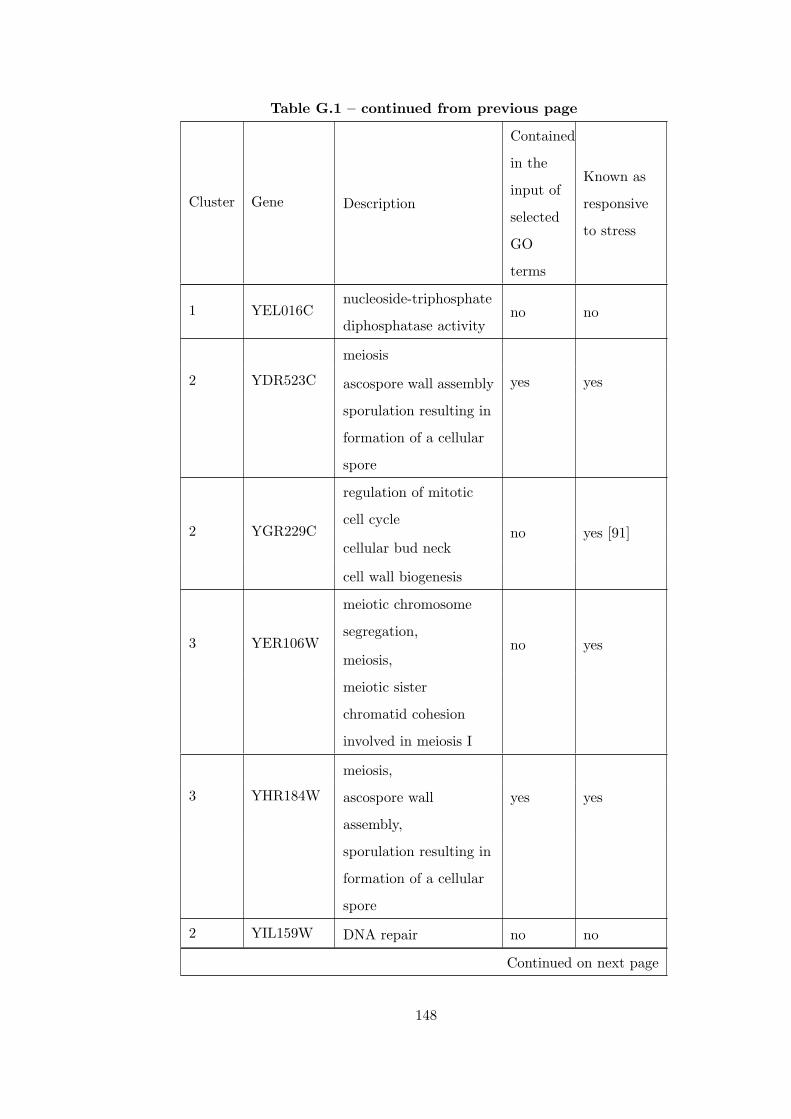
Table G.1 – continued from previous page
Cluster Gene Description
Contained
in the
input of
selected
GO
terms
Known as
responsive
to stress
1 YEL016Cnucleoside-triphosphate
diphosphatase activityno no
2 YDR523C
meiosis
yes yesascospore wall assembly
sporulation resulting in
formation of a cellular
spore
2 YGR229C
regulation of mitotic
cell cycleno yes [91]
cellular bud neck
cell wall biogenesis
3 YER106W
meiotic chromosome
segregation,no yes
meiosis,
meiotic sister
chromatid cohesion
involved in meiosis I
3 YHR184W
meiosis,
yes yesascospore wall
assembly,
sporulation resulting in
formation of a cellular
spore
2 YIL159W DNA repair no no
Continued on next page
148
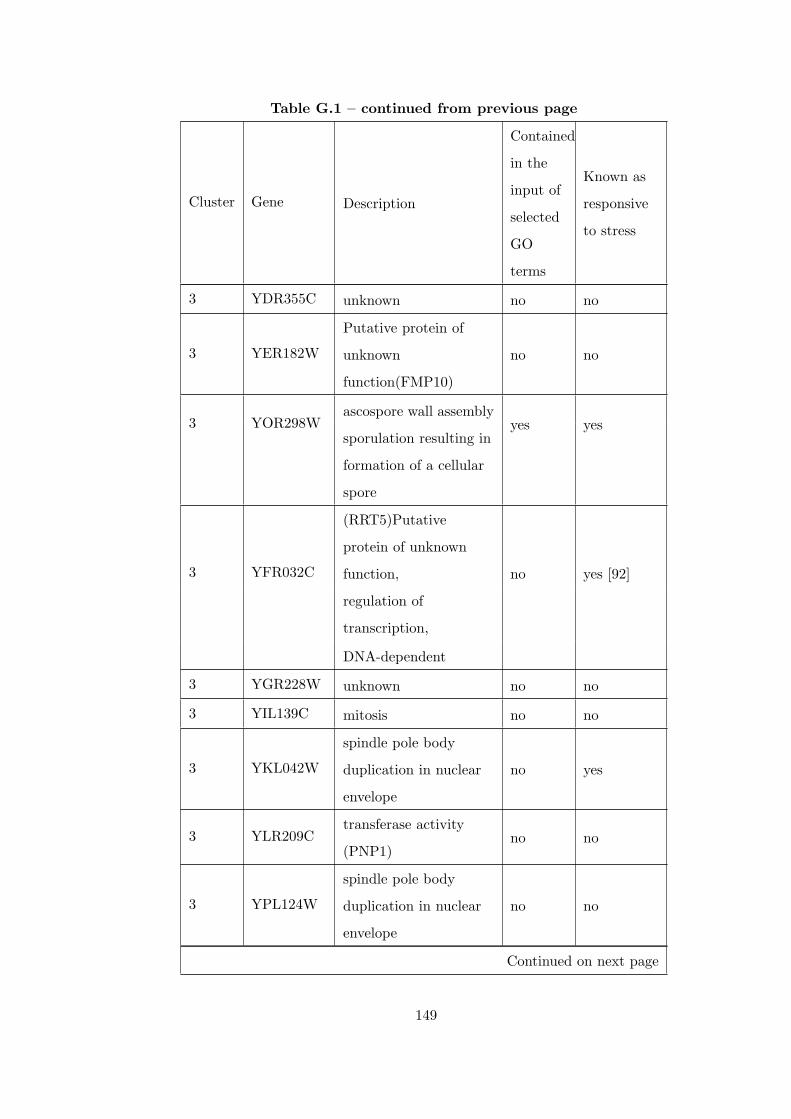
Table G.1 – continued from previous page
Cluster Gene Description
Contained
in the
input of
selected
GO
terms
Known as
responsive
to stress
3 YDR355C unknown no no
3 YER182W
Putative protein of
unknown
function(FMP10)
no no
3 YOR298Wascospore wall assembly
yes yessporulation resulting in
formation of a cellular
spore
3 YFR032C
(RRT5)Putative
protein of unknown
function, no yes [92]
regulation of
transcription,
DNA-dependent
3 YGR228W unknown no no
3 YIL139C mitosis no no
3 YKL042W
spindle pole body
duplication in nuclear
envelope
no yes
3 YLR209Ctransferase activity
(PNP1)no no
3 YPL124W
spindle pole body
duplication in nuclear
envelope
no no
Continued on next page
149
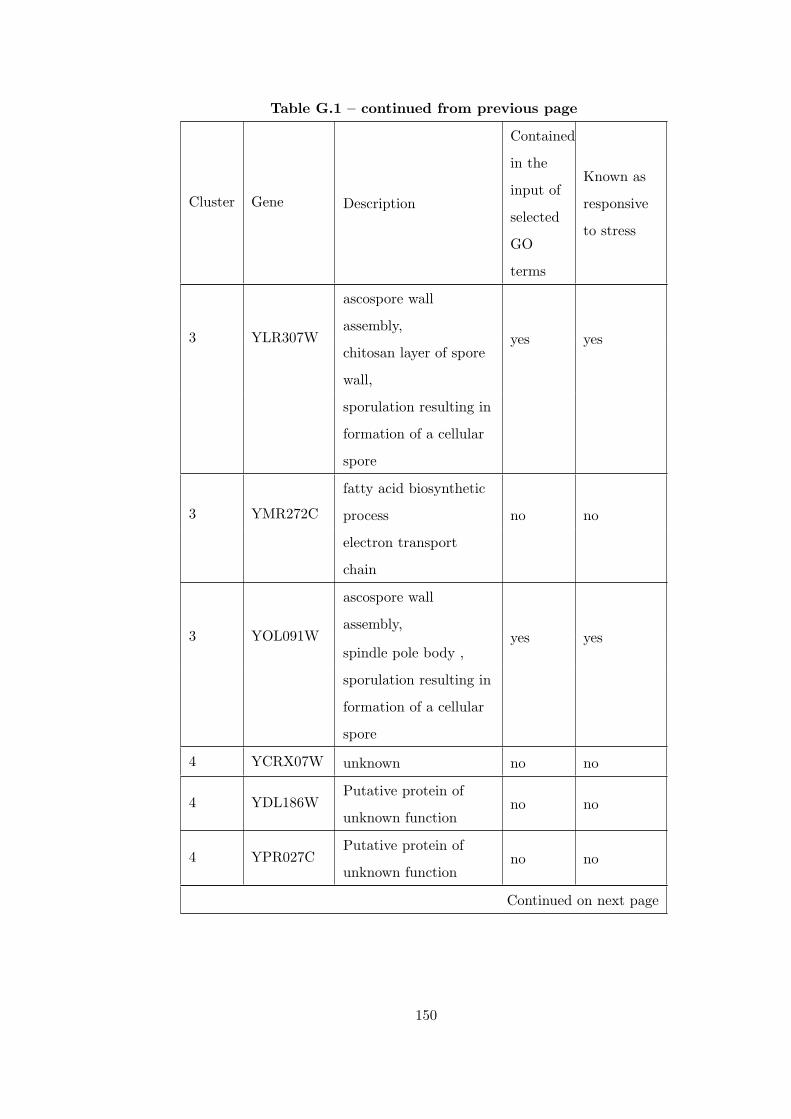
Table G.1 – continued from previous page
Cluster Gene Description
Contained
in the
input of
selected
GO
terms
Known as
responsive
to stress
3 YLR307W
ascospore wall
assembly,yes yes
chitosan layer of spore
wall,
sporulation resulting in
formation of a cellular
spore
3 YMR272C
fatty acid biosynthetic
process no no
electron transport
chain
3 YOL091W
ascospore wall
assembly,yes yes
spindle pole body ,
sporulation resulting in
formation of a cellular
spore
4 YCRX07W unknown no no
4 YDL186WPutative protein of
unknown functionno no
4 YPR027CPutative protein of
unknown functionno no
Continued on next page
150
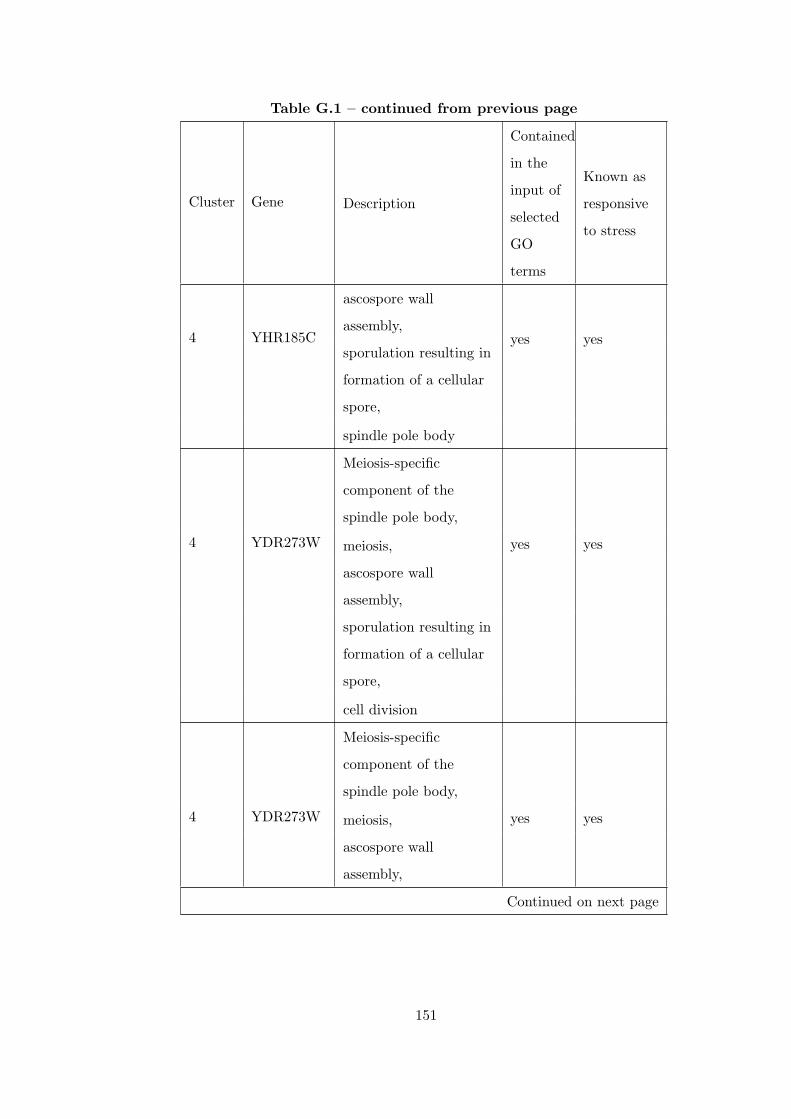
Table G.1 – continued from previous page
Cluster Gene Description
Contained
in the
input of
selected
GO
terms
Known as
responsive
to stress
4 YHR185C
ascospore wall
assembly,yes yes
sporulation resulting in
formation of a cellular
spore,
spindle pole body
4 YDR273W
Meiosis-specific
component of the
spindle pole body,
yes yesmeiosis,
ascospore wall
assembly,
sporulation resulting in
formation of a cellular
spore,
cell division
4 YDR273W
Meiosis-specific
component of the
spindle pole body,
yes yesmeiosis,
ascospore wall
assembly,
Continued on next page
151
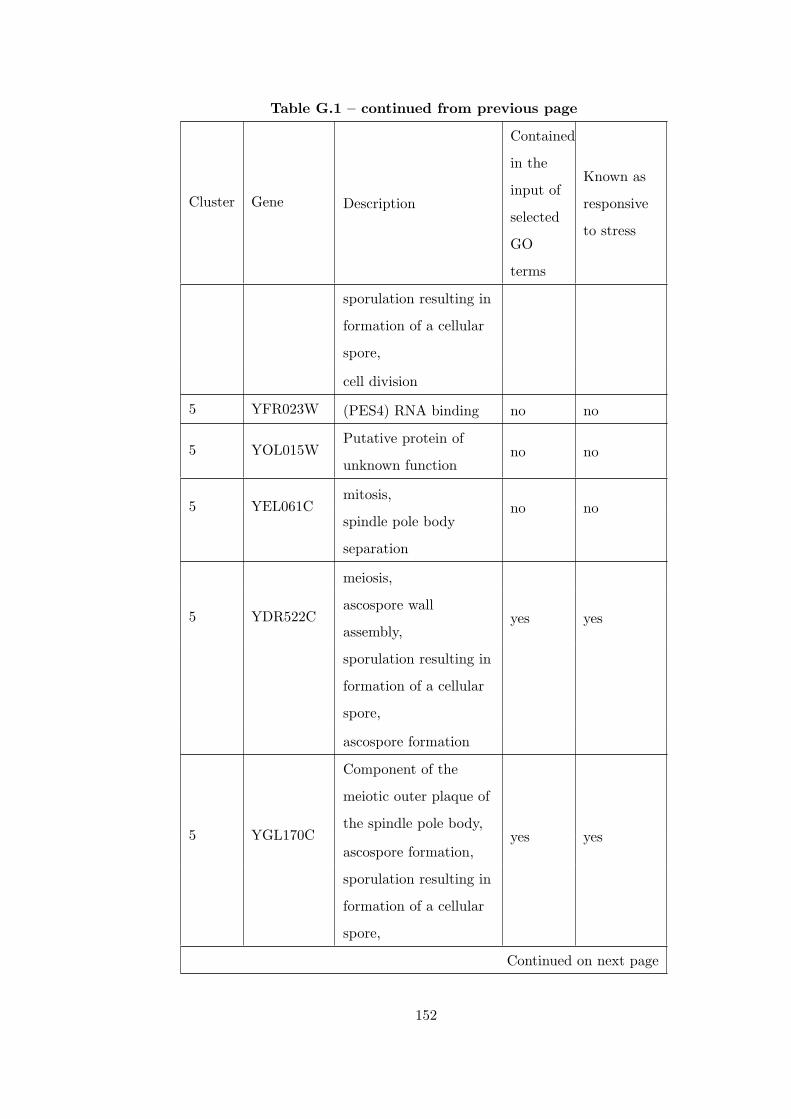
Table G.1 – continued from previous page
Cluster Gene Description
Contained
in the
input of
selected
GO
terms
Known as
responsive
to stress
sporulation resulting in
formation of a cellular
spore,
cell division
5 YFR023W (PES4) RNA binding no no
5 YOL015WPutative protein of
unknown functionno no
5 YEL061Cmitosis,
no nospindle pole body
separation
5 YDR522C
meiosis,
yes yesascospore wall
assembly,
sporulation resulting in
formation of a cellular
spore,
ascospore formation
5 YGL170C
Component of the
meiotic outer plaque of
the spindle pole body,yes yes
ascospore formation,
sporulation resulting in
formation of a cellular
spore,
Continued on next page
152
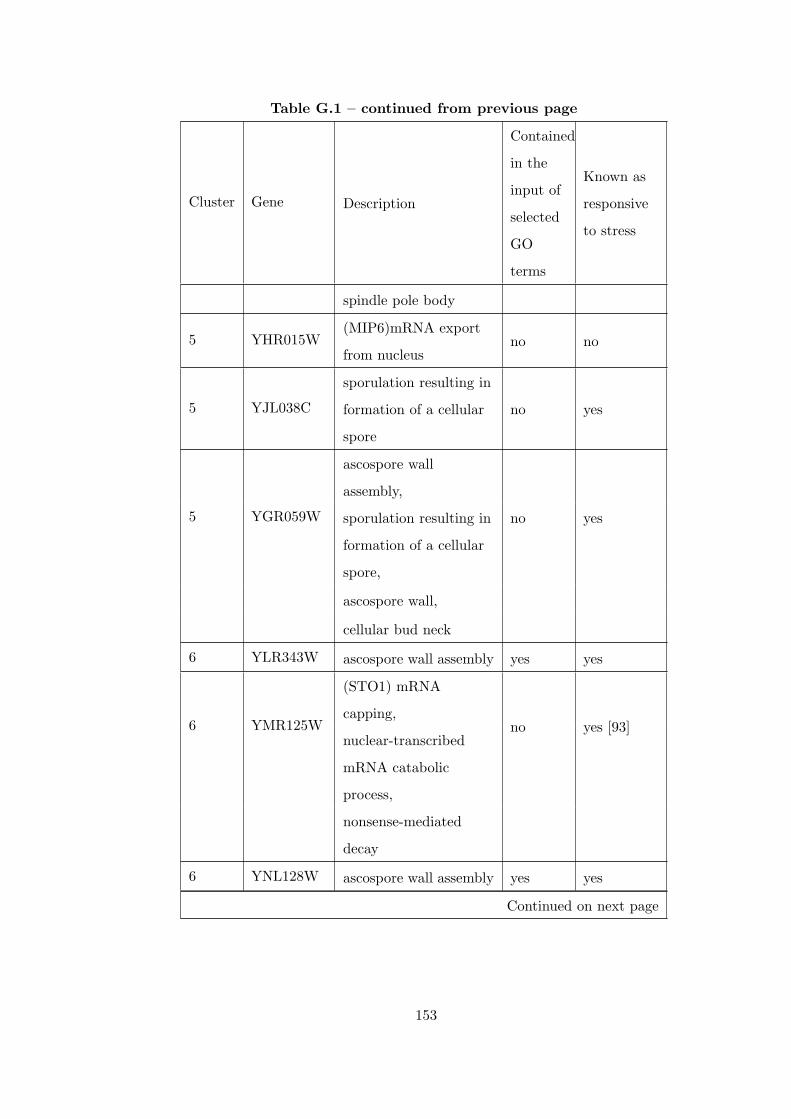
Table G.1 – continued from previous page
Cluster Gene Description
Contained
in the
input of
selected
GO
terms
Known as
responsive
to stress
spindle pole body
5 YHR015W(MIP6)mRNA export
from nucleusno no
5 YJL038C
sporulation resulting in
formation of a cellular
spore
no yes
5 YGR059W
ascospore wall
assembly,
no yessporulation resulting in
formation of a cellular
spore,
ascospore wall,
cellular bud neck
6 YLR343W ascospore wall assembly yes yes
6 YMR125W
(STO1) mRNA
capping,no yes [93]
nuclear-transcribed
mRNA catabolic
process,
nonsense-mediated
decay
6 YNL128W ascospore wall assembly yes yes
Continued on next page
153
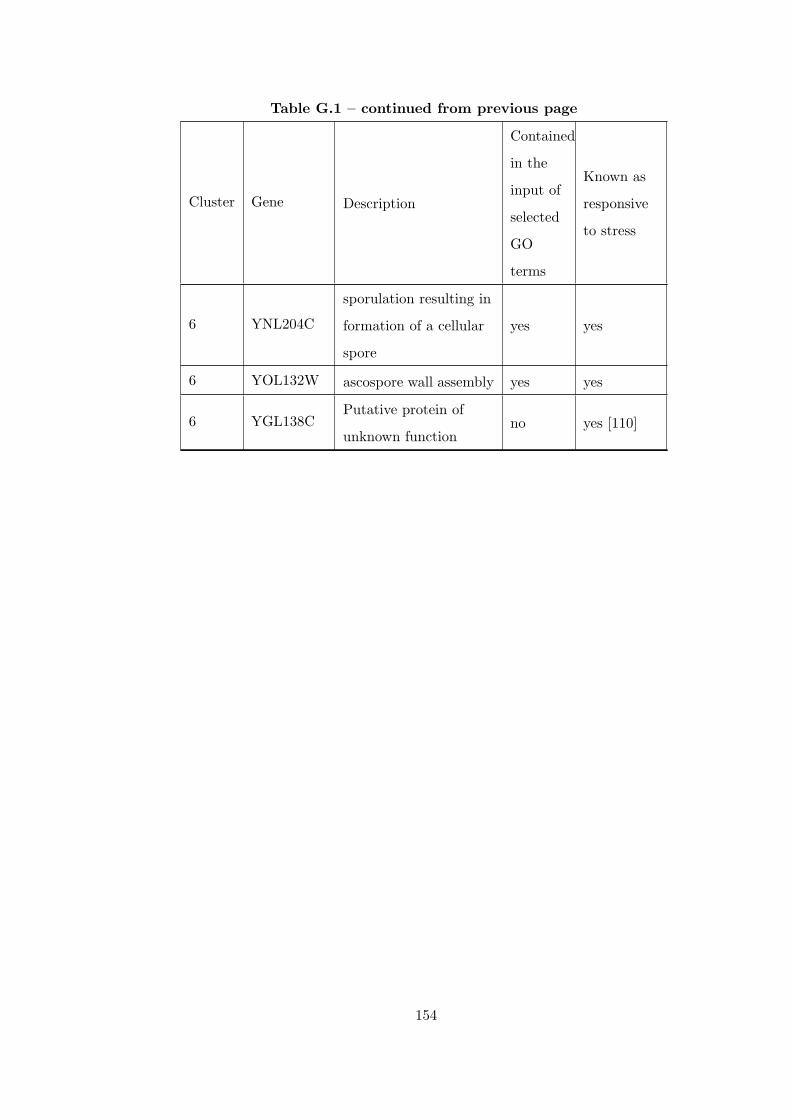
Table G.1 – continued from previous page
Cluster Gene Description
Contained
in the
input of
selected
GO
terms
Known as
responsive
to stress
6 YNL204C
sporulation resulting in
formation of a cellular
spore
yes yes
6 YOL132W ascospore wall assembly yes yes
6 YGL138CPutative protein of
unknown functionno yes [110]
154
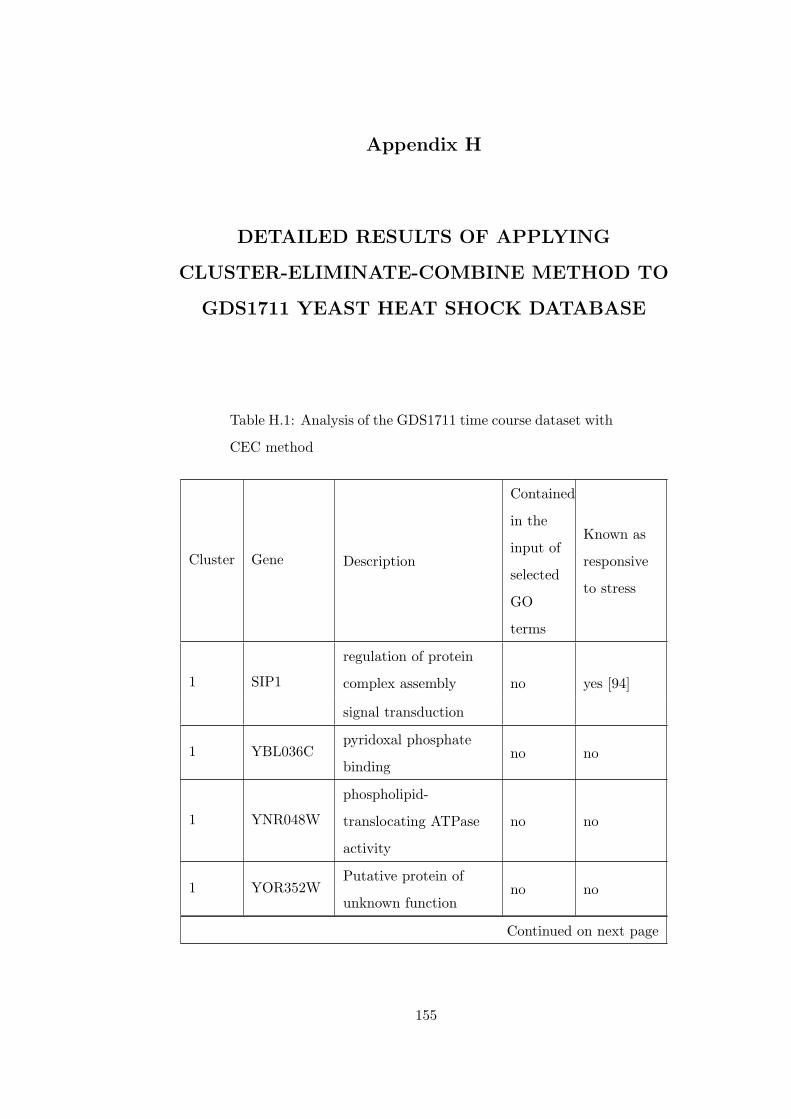
Appendix H
DETAILED RESULTS OF APPLYING
CLUSTER-ELIMINATE-COMBINE METHOD TO
GDS1711 YEAST HEAT SHOCK DATABASE
Table H.1: Analysis of the GDS1711 time course dataset with
CEC method
Cluster Gene Description
Contained
in the
input of
selected
GO
terms
Known as
responsive
to stress
1 SIP1
regulation of protein
complex assembly no yes [94]
signal transduction
1 YBL036Cpyridoxal phosphate
bindingno no
1 YNR048W
phospholipid-
translocating ATPase
activity
no no
1 YOR352WPutative protein of
unknown functionno no
Continued on next page
155
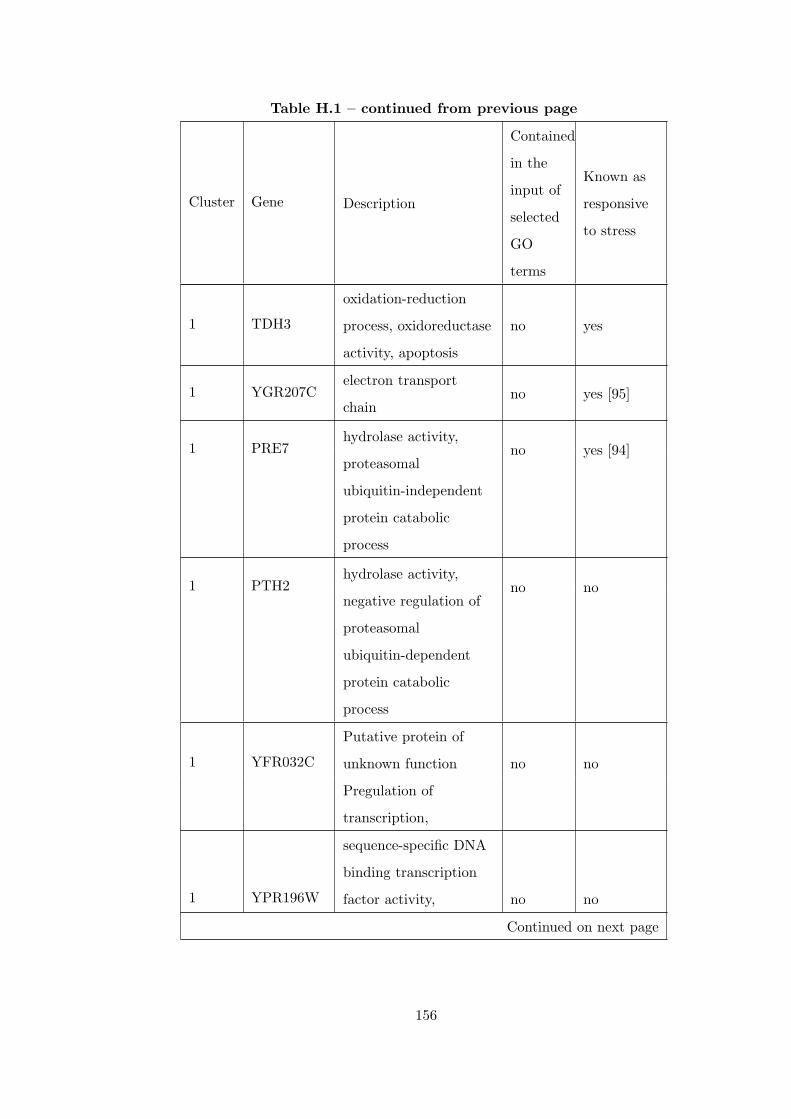
Table H.1 – continued from previous page
Cluster Gene Description
Contained
in the
input of
selected
GO
terms
Known as
responsive
to stress
1 TDH3
oxidation-reduction
process, oxidoreductase
activity, apoptosis
no yes
1 YGR207Celectron transport
chainno yes [95]
1 PRE7hydrolase activity,
no yes [94]proteasomal
ubiquitin-independent
protein catabolic
process
1 PTH2hydrolase activity,
no nonegative regulation of
proteasomal
ubiquitin-dependent
protein catabolic
process
1 YFR032C
Putative protein of
unknown function no no
Pregulation of
transcription,
1 YPR196W
sequence-specific DNA
binding transcription
factor activity, no no
Continued on next page
156
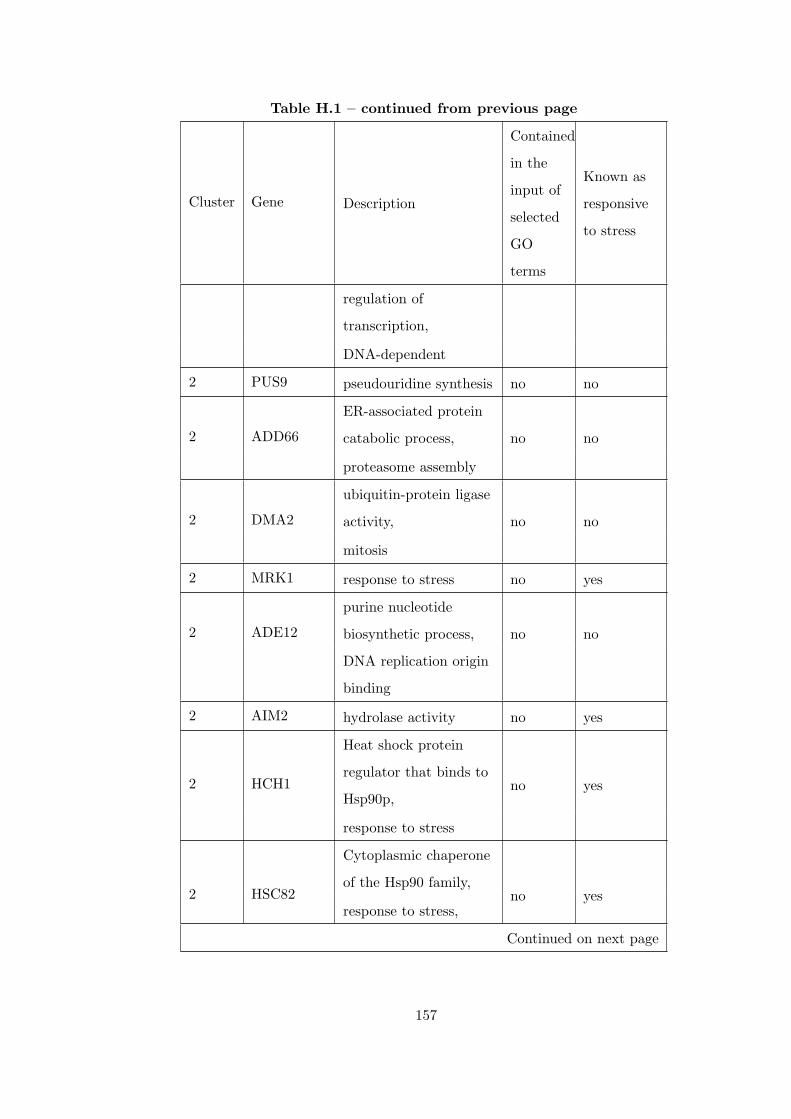
Table H.1 – continued from previous page
Cluster Gene Description
Contained
in the
input of
selected
GO
terms
Known as
responsive
to stress
regulation of
transcription,
DNA-dependent
2 PUS9 pseudouridine synthesis no no
2 ADD66
ER-associated protein
catabolic process, no no
proteasome assembly
2 DMA2
ubiquitin-protein ligase
activity, no no
mitosis
2 MRK1 response to stress no yes
2 ADE12
purine nucleotide
biosynthetic process, no no
DNA replication origin
binding
2 AIM2 hydrolase activity no yes
2 HCH1
Heat shock protein
regulator that binds to
Hsp90p,no yes
response to stress
2 HSC82
Cytoplasmic chaperone
of the Hsp90 family,no yes
response to stress,
Continued on next page
157
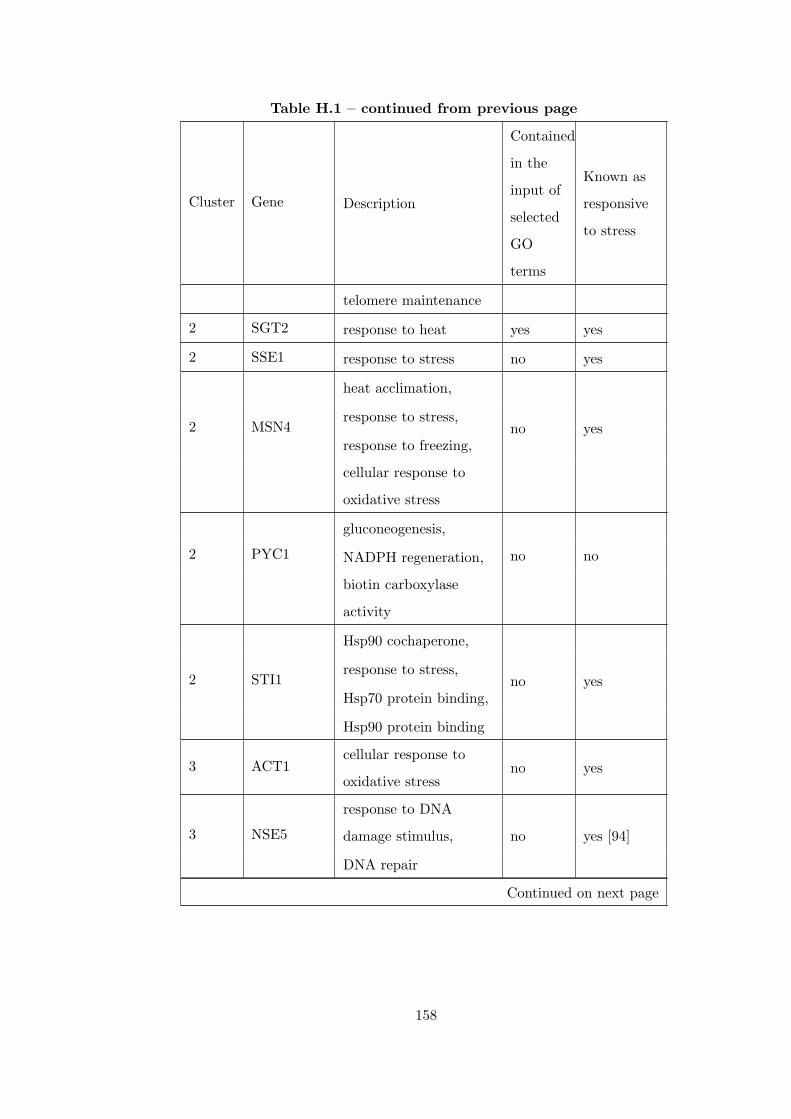
Table H.1 – continued from previous page
Cluster Gene Description
Contained
in the
input of
selected
GO
terms
Known as
responsive
to stress
telomere maintenance
2 SGT2 response to heat yes yes
2 SSE1 response to stress no yes
2 MSN4
heat acclimation,
no yesresponse to stress,
response to freezing,
cellular response to
oxidative stress
2 PYC1
gluconeogenesis,
no noNADPH regeneration,
biotin carboxylase
activity
2 STI1
Hsp90 cochaperone,
no yesresponse to stress,
Hsp70 protein binding,
Hsp90 protein binding
3 ACT1cellular response to
oxidative stressno yes
3 NSE5
response to DNA
damage stimulus, no yes [94]
DNA repair
Continued on next page
158
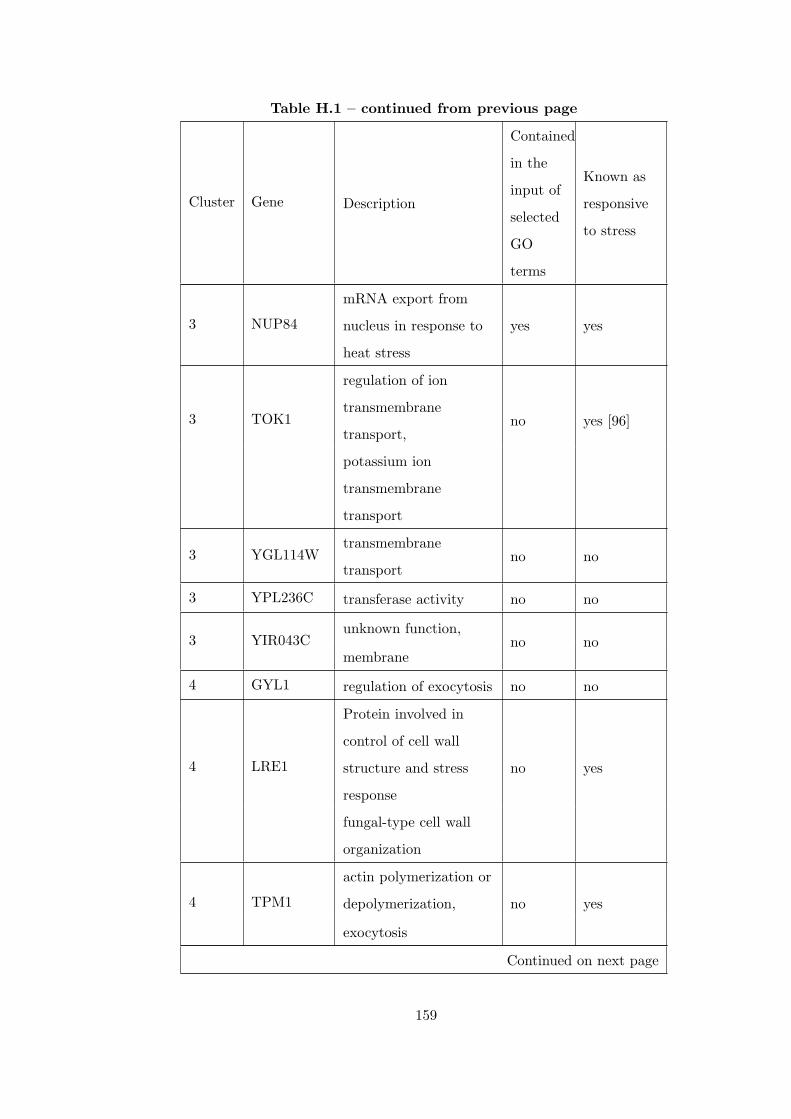
Table H.1 – continued from previous page
Cluster Gene Description
Contained
in the
input of
selected
GO
terms
Known as
responsive
to stress
3 NUP84
mRNA export from
nucleus in response to
heat stress
yes yes
3 TOK1
regulation of ion
transmembrane
transport,no yes [96]
potassium ion
transmembrane
transport
3 YGL114Wtransmembrane
transportno no
3 YPL236C transferase activity no no
3 YIR043Cunknown function,
no nomembrane
4 GYL1 regulation of exocytosis no no
4 LRE1
Protein involved in
control of cell wall
structure and stress
response
no yes
fungal-type cell wall
organization
4 TPM1
actin polymerization or
depolymerization, no yes
exocytosis
Continued on next page
159
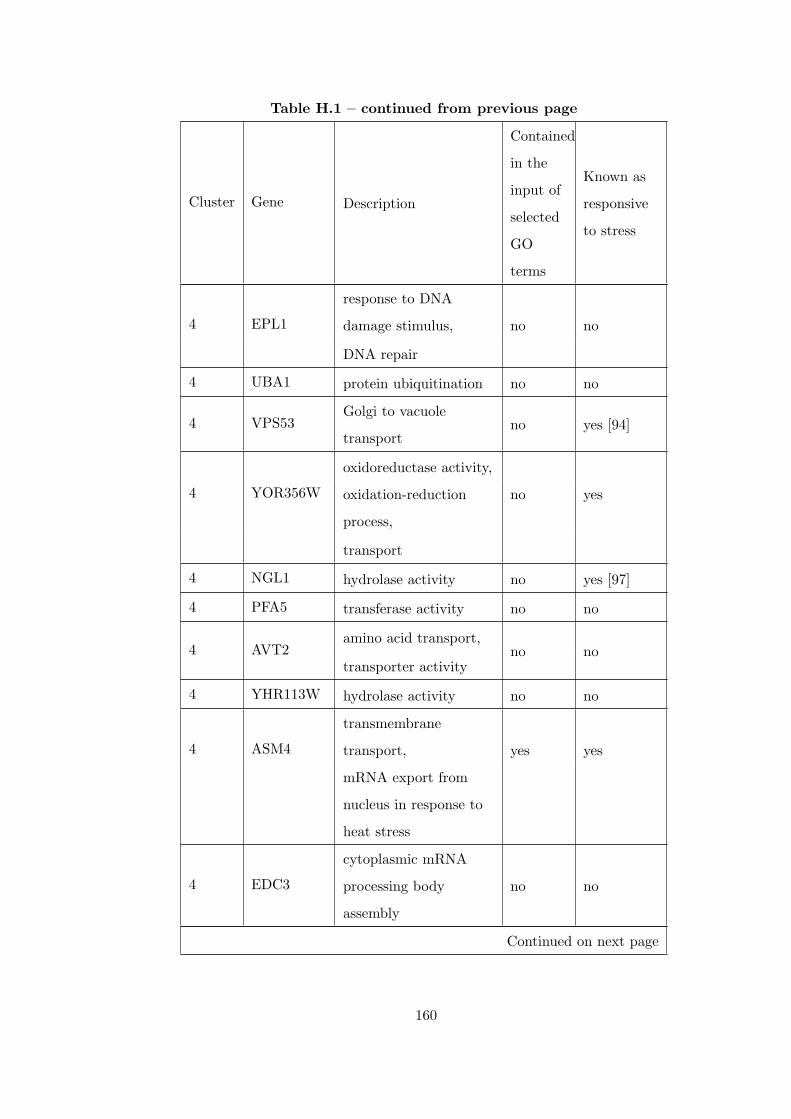
Table H.1 – continued from previous page
Cluster Gene Description
Contained
in the
input of
selected
GO
terms
Known as
responsive
to stress
4 EPL1
response to DNA
damage stimulus, no no
DNA repair
4 UBA1 protein ubiquitination no no
4 VPS53Golgi to vacuole
transportno yes [94]
4 YOR356W
oxidoreductase activity,
no yesoxidation-reduction
process,
transport
4 NGL1 hydrolase activity no yes [97]
4 PFA5 transferase activity no no
4 AVT2amino acid transport,
no notransporter activity
4 YHR113W hydrolase activity no no
4 ASM4
transmembrane
transport, yes yes
mRNA export from
nucleus in response to
heat stress
4 EDC3
cytoplasmic mRNA
processing body
assembly
no no
Continued on next page
160
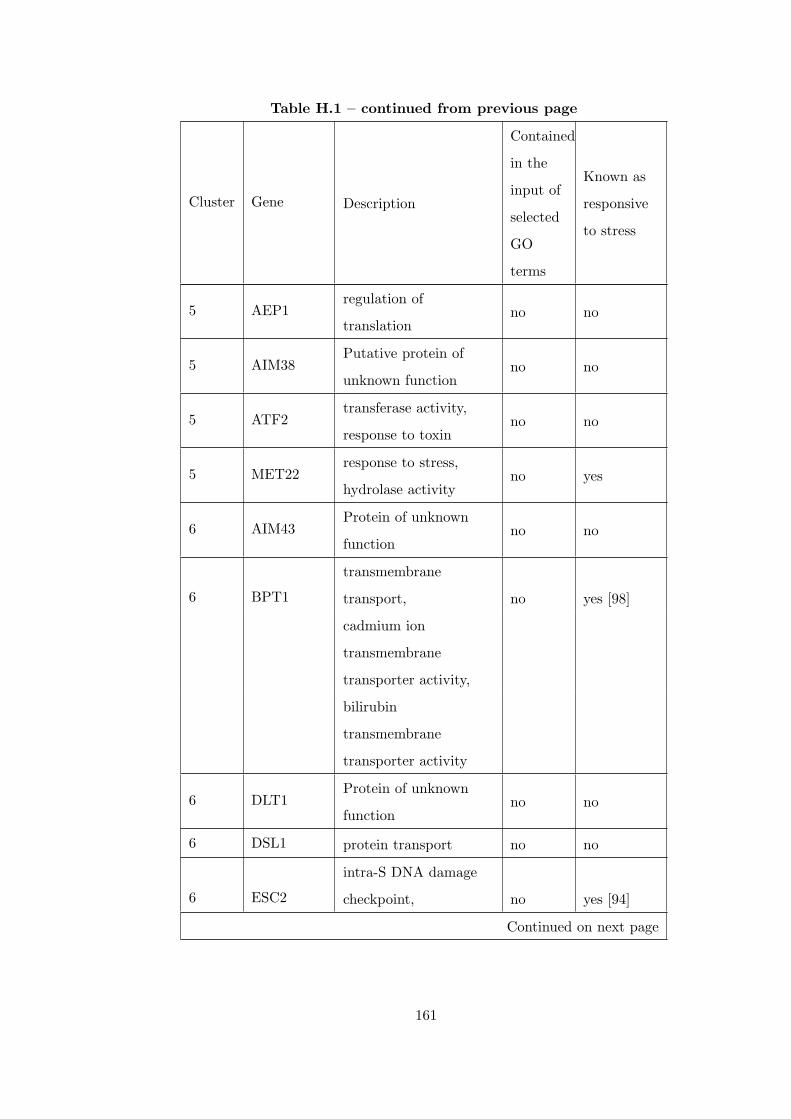
Table H.1 – continued from previous page
Cluster Gene Description
Contained
in the
input of
selected
GO
terms
Known as
responsive
to stress
5 AEP1regulation of
translationno no
5 AIM38Putative protein of
unknown functionno no
5 ATF2transferase activity,
response to toxinno no
5 MET22response to stress,
hydrolase activityno yes
6 AIM43Protein of unknown
functionno no
6 BPT1
transmembrane
transport, no yes [98]
cadmium ion
transmembrane
transporter activity,
bilirubin
transmembrane
transporter activity
6 DLT1Protein of unknown
functionno no
6 DSL1 protein transport no no
6 ESC2
intra-S DNA damage
checkpoint, no yes [94]
Continued on next page
161
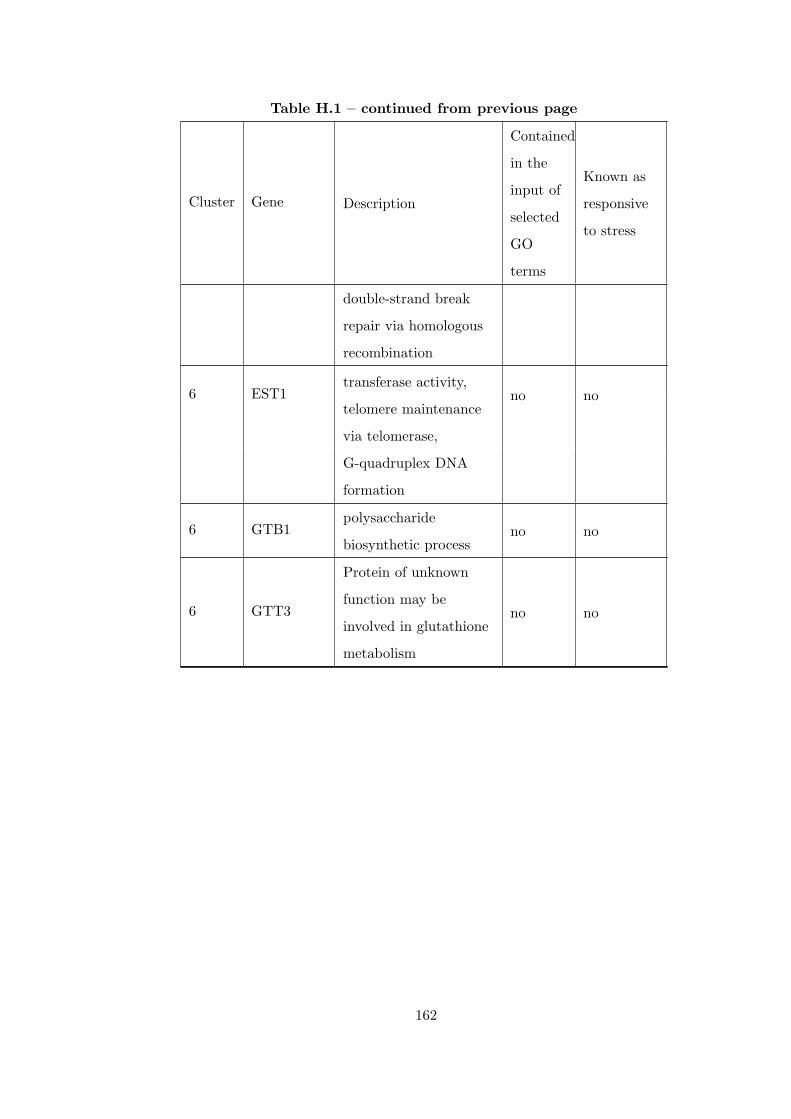
Table H.1 – continued from previous page
Cluster Gene Description
Contained
in the
input of
selected
GO
terms
Known as
responsive
to stress
double-strand break
repair via homologous
recombination
6 EST1transferase activity,
no notelomere maintenance
via telomerase,
G-quadruplex DNA
formation
6 GTB1polysaccharide
biosynthetic processno no
6 GTT3
Protein of unknown
function may be
involved in glutathione
metabolism
no no
162
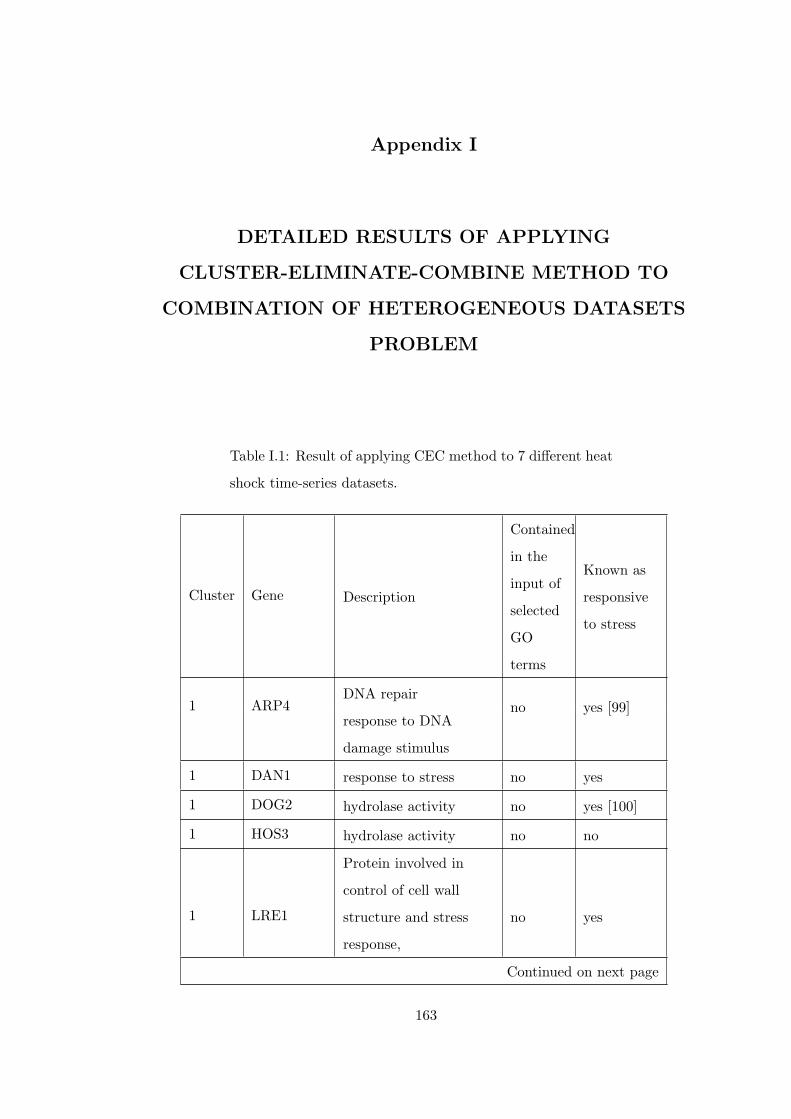
Appendix I
DETAILED RESULTS OF APPLYING
CLUSTER-ELIMINATE-COMBINE METHOD TO
COMBINATION OF HETEROGENEOUS DATASETS
PROBLEM
Table I.1: Result of applying CEC method to 7 different heat
shock time-series datasets.
Cluster Gene Description
Contained
in the
input of
selected
GO
terms
Known as
responsive
to stress
1 ARP4DNA repair
no yes [99]response to DNA
damage stimulus
1 DAN1 response to stress no yes
1 DOG2 hydrolase activity no yes [100]
1 HOS3 hydrolase activity no no
1 LRE1
Protein involved in
control of cell wall
structure and stress
response,
no yes
Continued on next page
163
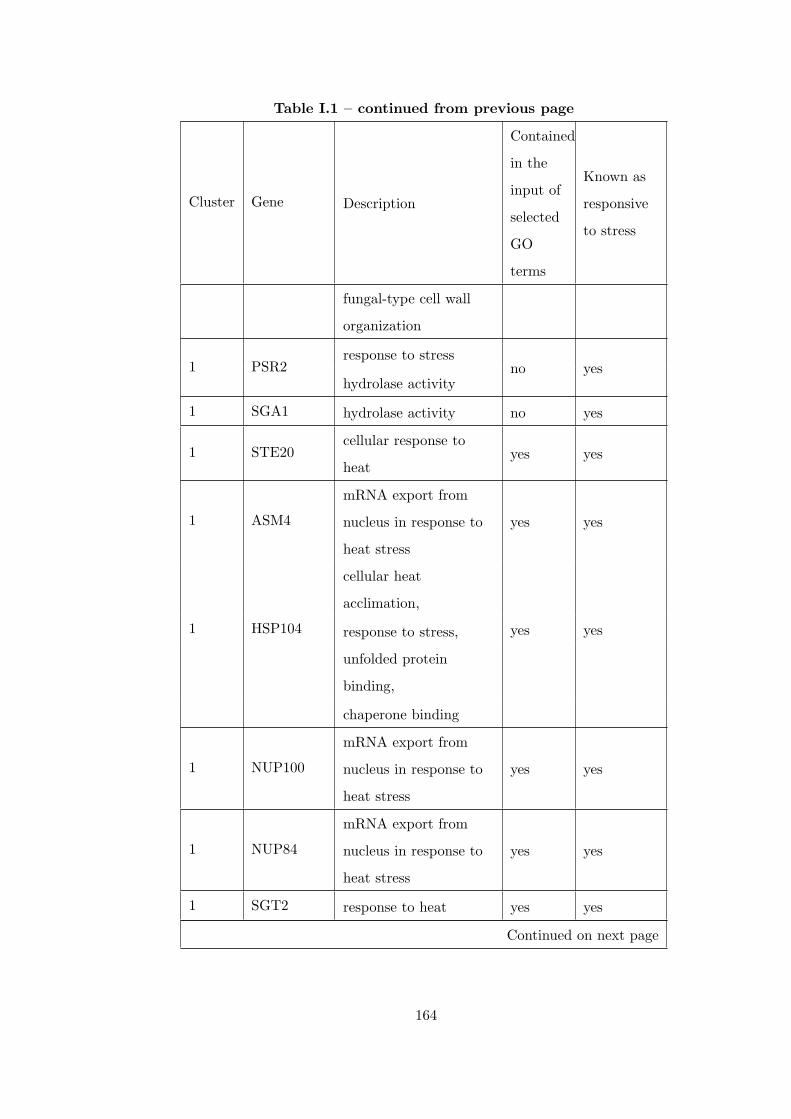
Table I.1 – continued from previous page
Cluster Gene Description
Contained
in the
input of
selected
GO
terms
Known as
responsive
to stress
fungal-type cell wall
organization
1 PSR2response to stress
no yeshydrolase activity
1 SGA1 hydrolase activity no yes
1 STE20cellular response to
heatyes yes
1 ASM4
mRNA export from
nucleus in response to
heat stress
yes yes
1 HSP104
cellular heat
acclimation,
yes yesresponse to stress,
unfolded protein
binding,
chaperone binding
1 NUP100
mRNA export from
nucleus in response to
heat stress
yes yes
1 NUP84
mRNA export from
nucleus in response to
heat stress
yes yes
1 SGT2 response to heat yes yes
Continued on next page
164
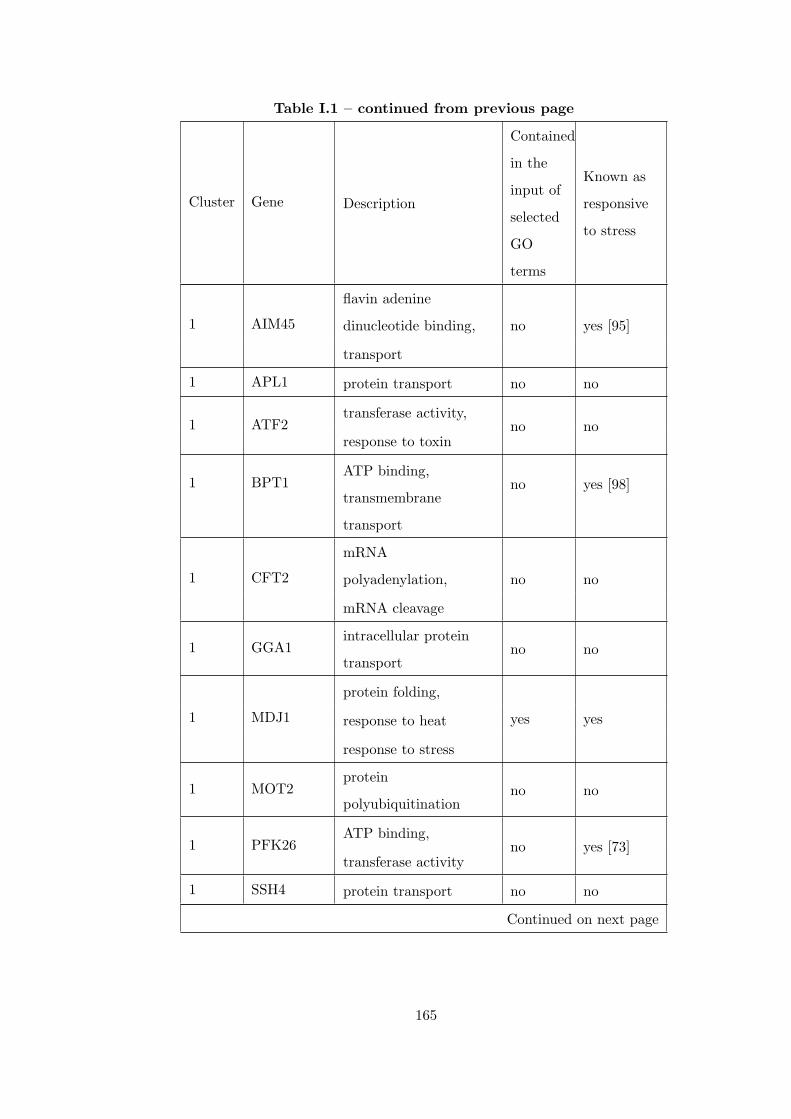
Table I.1 – continued from previous page
Cluster Gene Description
Contained
in the
input of
selected
GO
terms
Known as
responsive
to stress
1 AIM45
flavin adenine
dinucleotide binding, no yes [95]
transport
1 APL1 protein transport no no
1 ATF2transferase activity,
no noresponse to toxin
1 BPT1ATP binding,
no yes [98]transmembrane
transport
1 CFT2
mRNA
polyadenylation, no no
mRNA cleavage
1 GGA1intracellular protein
transportno no
1 MDJ1
protein folding,
yes yesresponse to heat
response to stress
1 MOT2protein
polyubiquitinationno no
1 PFK26ATP binding,
no yes [73]transferase activity
1 SSH4 protein transport no no
Continued on next page
165
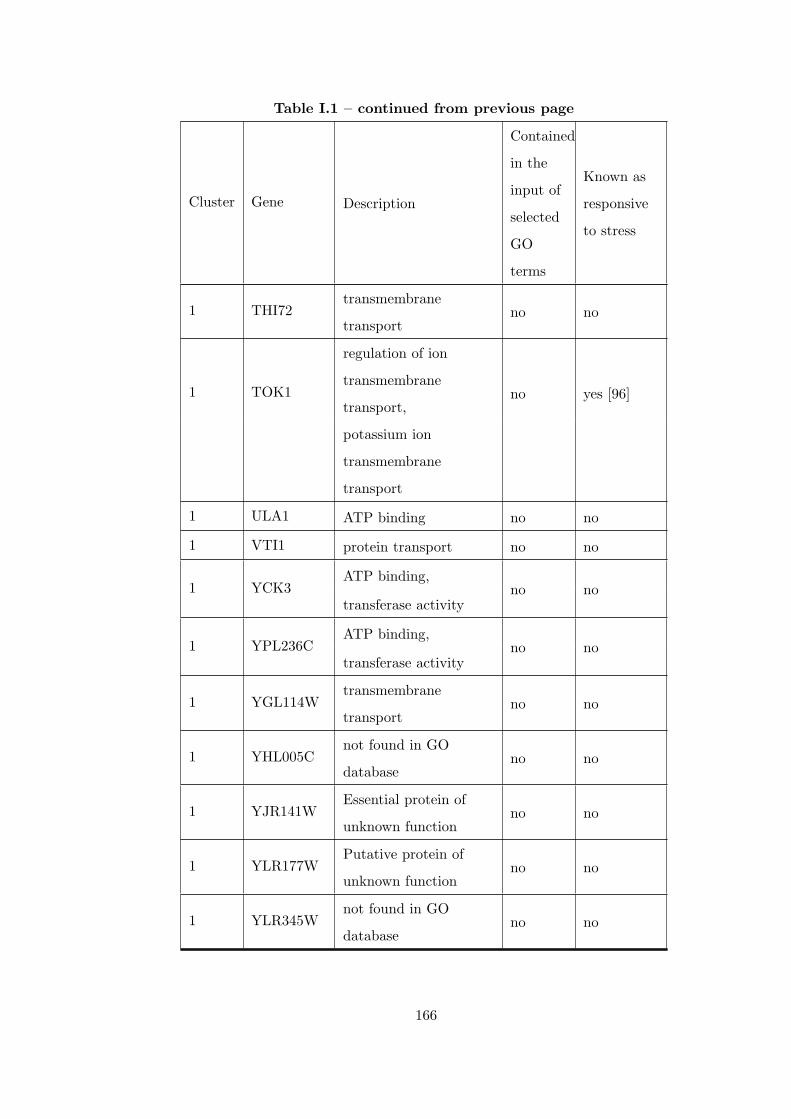
Table I.1 – continued from previous page
Cluster Gene Description
Contained
in the
input of
selected
GO
terms
Known as
responsive
to stress
1 THI72transmembrane
transportno no
1 TOK1
regulation of ion
transmembrane
transport,no yes [96]
potassium ion
transmembrane
transport
1 ULA1 ATP binding no no
1 VTI1 protein transport no no
1 YCK3ATP binding,
no notransferase activity
1 YPL236CATP binding,
no notransferase activity
1 YGL114Wtransmembrane
transportno no
1 YHL005Cnot found in GO
databaseno no
1 YJR141WEssential protein of
unknown functionno no
1 YLR177WPutative protein of
unknown functionno no
1 YLR345Wnot found in GO
databaseno no
166

PERSONAL
Name Surname : G. Kırçiçeği Y. KORKMAZ
Date of Birth : 01.01.1979
Phone : 312 566 02 90
Mobile Phone : 555 603 84 04
Email: [email protected]
Mailing Address :
Turgut Özal Mahallesi 2141. Sokak Akkent 2 Sitesi C
Blok No:25
Batıkent/ANKARA
Place of Birth : Bursa
Family Info: Married
EDUCATION
Doctorate of Philosophy (2006- 2012)
Middle East Technical University , Computer
Engineering Dep. CGPA : 3.57
Master of Science (1999-2002)
Middle East Technical University , Computer
Engineering Dep. CGPA : 3.71
Bachelor of Science (1994-1999)
Middle East Technical University, Computer
Engineering Dep. CGPA : 3.64 High Honor Student
VITA
167
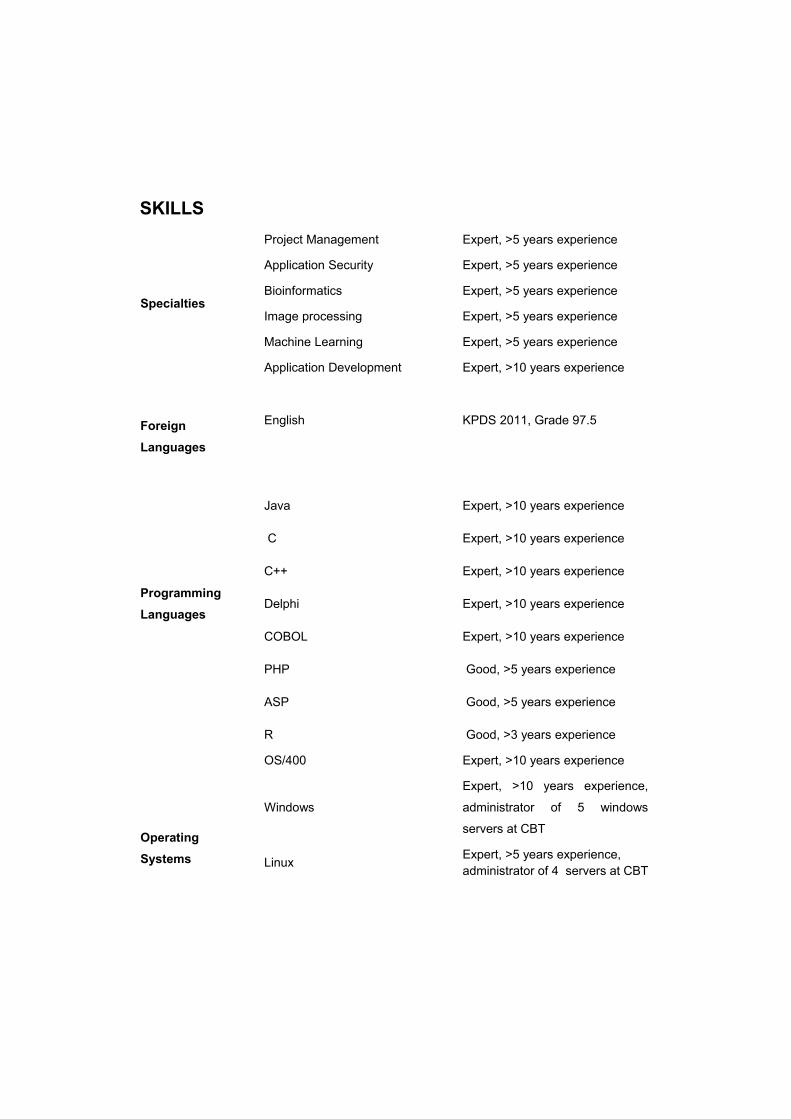
SKILLS
Specialties
Project Management Expert, >5 years experience
Application Security Expert, >5 years experience
Bioinformatics Expert, >5 years experience
Image processing Expert, >5 years experience
Machine Learning Expert, >5 years experience
Application Development Expert, >10 years experience
Foreign Languages
English KPDS 2011, Grade 97.5
Programming Languages
Java
C
C++
Delphi
COBOL
PHP
ASP
R
Expert, >10 years experience
Expert, >10 years experience
Expert, >10 years experience
Expert, >10 years experience
Expert, >10 years experience
Good, >5 years experience
Good, >5 years experience
Good, >3 years experience
Operating Systems
OS/400 Expert, >10 years experience
Windows
Expert, >10 years experience,
administrator of 5 windows
servers at CBT
Linux Expert, >5 years experience, administrator of 4 servers at CBT
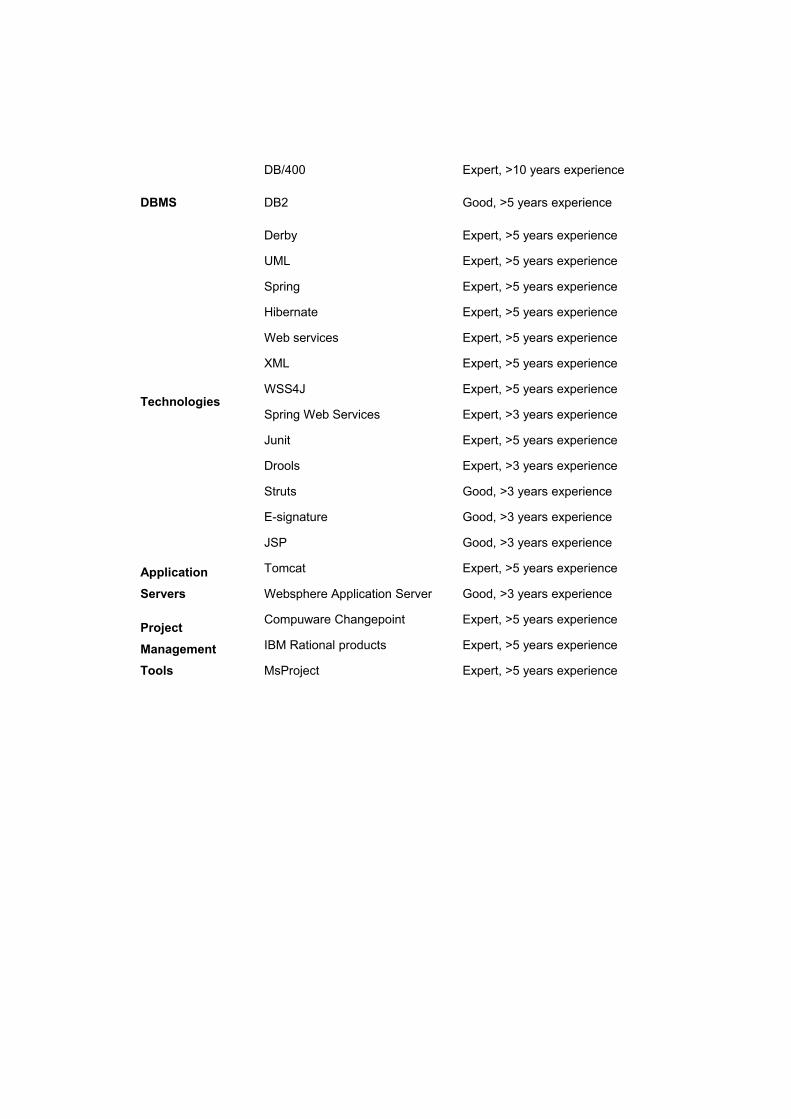
DBMS
DB/400
DB2
Derby
Expert, >10 years experience
Good, >5 years experience
Expert, >5 years experience
Technologies
UML Expert, >5 years experience
Spring Expert, >5 years experience
Hibernate Expert, >5 years experience
Web services Expert, >5 years experience
XML Expert, >5 years experience
WSS4J Expert, >5 years experience
Spring Web Services Expert, >3 years experience
Junit Expert, >5 years experience
Drools Expert, >3 years experience
Struts Good, >3 years experience
E-signature Good, >3 years experience
JSP Good, >3 years experience
Application Servers
Tomcat Expert, >5 years experience
Websphere Application Server Good, >3 years experience
Project Management Tools
Compuware Changepoint Expert, >5 years experience
IBM Rational products Expert, >5 years experience
MsProject Expert, >5 years experience

EMPLOYMENT
1. Central Bank of Turkey (CBT, TCMB)
(July 1999 – Now)
I am working in CBT as the project manager of the Banking Group which is
responsible for developing banking applications for the branches of CBT. Some projects that
I worked on are summarized in the following sections.
1.1. Public Electronic Payment System (PEPS-KEÖS (Kamu Elektronik Ödeme Sistemi) )
Public Electronic Payment System is one of the biggest e-government projects in
Turkey. It is designed to safely and efficiently perform government expenditures such as
provision of social benefits, salaries, pensions, travel and miscellaneous expenses incurred
by government employees on behalf of the government. It is a successful implementation of
the Treasury Single Account. By the use of PEPS, Turkish cash management was developed
from simple to active cash management and the Turkey's note on cash management was
raised from 1.2 to 3.6, which made the Turkish applications better than most developed
countries.
PEPS is a joint project of CBT, Treasury and Ministry of Finance. I was responsible
from the technical coordination between the organizations and I worked on the analysis,
design and coding of the project. I also worked in the regulatory phases of the project by
participating to the working group that wrote the protocol which was signed between three
organizations, prepared the changes in the related law and wrote the legal regulations of the
system.
1.2. Treasury Internet Banking System
The system enables Treasury to perform real-time inquiries about the balance and
movements of its accounts. The infrastructure that accepts e-signed payment orders and
performs the appropriate payments automatically is developed and in the testing phase now.
The project was developed by Java, Spring Web Services, Spring(Struts, Hibernate, JSP)
and COBOL. I worked both in the technical and regulatory phases of the project. As well as
actively developing the project, I contributed to the protocol that was signed between CBT
and Treasury.
1.3. Telephone Banking System
The Telephone Banking System serves the accountants of CBT since 2001. It was
developed by Delphi, COBOL and Java. The system makes use of special hardware called
voice boards to make use of telephone lines automatically.
1.4. Internet Banking System
The system is a web service based application developed for banks to perform real-
time inquiries about the balance and movements of their accounts.
1.5. TIC-ESTS(EMKT) Branch Interface
Turkish Interbank Clearing–Electronic Security Transfer and Settlement System (TIC-
ESTS) works in an integrated manner with the TIC-RTGS (EFT) to electronically transfer and
settle Turkish government securities with “delivery versus payment” (DVP) principle. I worked
on the CBT Branch interface of TIC-ESTS to enable CBT branches send, receive and
process messages of TIC-ESTS. The application was developed in Cobol and run in AS/400.
1.6. Message Transfer System
The system provides modules for applications to define, send and receive messages
between branches. By the message transfer system, applications can send their messages
to other AS/400 systems by just writing to a file and calling a module. The modules of the
system encapsulates all of the APPC programming and error handling mechanisms. The
system was developed in Cobol.
1.7. Application Security Group
The group worked on the possible attacks to applications and methods for preventing
them. We created reports that can be used as an internal reference for all of the software
developers in CBT for secure application development.
1.8. Cheque Clearing System
I first worked on the group that developed the cheque clearing system interface of
CBT in Cobol and Delphi. Then, for the new version of Cheque Clearing System, instead of

using Biztalk client internally, we created a Java based a web service client to communicate
with Microsoft Biztalk.
1.9. Central Bank of Northern Cyprus (KKTCMB) Cheque Clearing System
Worked on the KKTCMB interface of the Cheque Clearing System which was
developed by Java and COBOL. I detected critical security defects of the general Cheque
Clearing System of the country and reported them, which postponed the production date of
the system. The report is then used as a checklist and after all of the found defects are
cleared out second examination was requested. After our second examination, the cheque
clearing system was taken into production.
1.10. CBT Software Development Methodology Group
I worked in the methodology group whose aim is to determine and standardize an
application development methodology for CBT. We examined different methodologies and
decided to tailor Extreme Programming to our organization. The methodology is now actively
used by software development groups.
1.11. Microcomputer Environment Standardization Project
I worked in the group that aims to standardize the microcomputer environment. We
reported the problems in the environment that are mostly caused by the use of different
programming languages and configurations. The findings of the group is used as a basis for
a standardized microcomputer environment.
1.12. Informatics Crime Law Draft
Worked in the group that created the critics of CBT for Informatic Crimes Law Draft.
1.13. Year 2000 project
I worked on resolving the year 2000 problem of various applications of CBT.
1.14. YTL project
I worked on the TL-YTL conversion and the removal of 6 zeros from the TL projects in
order to adapt the branch applications to the changes needed by the conversions.
1.15. Accounting Archive System
The system generates reports from past accounting reports that are taken to the
archive. The reports are usually requested by the Government Accounting Bureau. In order
to create the archive, we processed and organized cartridges from all of the 21 branches of
CBT for the past 10 years. The system is developed by using Jasper Reports and Java.
1.16. CBT Branches Consolidation Project
As a part of the consolidation project that aims to centralize the branch applications
that were previously developed in a distributed manner, the applications used by CBT
branches' banking services are re-developed by using agile methodologies and Spring
infrastructure. I worked as the project manager of the development of the following systems:
1.16.1. Money Transfer System between Branches
The branches can send and receive money orders by this system.
1.16.2. Treasury Exportation Funds Payment System
The exporters and exportation funds that they receive from treasury are followed by this
system. The system is integrated by money order system, RTGS (EFT) and the accounting system.
1.16.3. Treasury R&D Funds Payment System
The firms that receive R&D funds from fairs are followed and their payments are made by
this system. The system is integrated by money order system, RTGS (EFT) and the accounting system.
1.16.4. Accounting Offices Payments System
Accounting offices sends payment orders to our branches and the orders are processed by
this system and sent to RTGS (EFT).
1.16.5. Branch Expense System
It is a basic module that are used by other branch applications. If an expense should be taken
from an accounting process, it is taken automatically by using predefined rules by expense system.
The system uses Drools to process the rules on the fly.
1.16.6. Electronic Banking System
The telephone banking system and its maintenance applications (for creating
passwords, adding/removing accounts to system, etc.) are redeveloped in Java.
2. The Scientific and Technological Research Council of Turkey (TUBITAK)
(November 1997 – June 1999)
I worked as a part-time technical researcher at TUBITAK on Form Archiving Prototype
System (FORMAR) and Constitutional Court Automation System. The FORMAR project is
selected as the best graduation project in 1999 in the research and development area in
computer engineering department.
3. PhD Thesis
In my PhD, I worked on data integration and bioinformatics. I started with the short time
series microarray data analysis, and then generalized the method to combine microarray data,
interaction networks and Gene Ontology. We created the ibh package, which is accepted to
Bioconductor, which computes the fitness of a given gene list to an interaction network. The ibh
package is available from http://www.bioconductor.org/packages/release/bioc/html/ibh.html.
4. Master's Thesis
In the master's thesis, I worked on creating an OCR for the Turkish language. I used image
processing techniques for preprocessing such as skew correction, noise removal and segmentation;
and applied neural network to create a classifier for Turkish characters. We combined it with a
Turkish post-processor and achieved very successful results that are far better than commercially
available tools at that time.
PUBLICATIONS 1. Kırçiçeği KORKMAZ, Rengül ÇETİN-ATALAY, Volkan ATALAY, Results of the
combination of multiple partitions for the analysis of short time series microarray data, European Conference on Computational Biology (ECCB), 2008 (Poster
presentation)
2. Kırçiçeği KORKMAZ, Rengül ÇETİN-ATALAY, Volkan ATALAY, Benefits of
Incorporating Biological Knowledge in Clustering Short Time Series Data ,
International Symposium on Health Informatics and Bioinformatics (HIBIT), 2008 (Poster
presentation)
3. Sait Ulas KORKMAZ, G. Kircicegi Y.AKINCI, Volkan ATALAY, A Character Recognizer
For Turkish Language, ICDAR 2003 : 1238-1241.
4. G.Kircicegi AKINCI, Sait Ulas KORKMAZ, Fatos Yarman VURAL, Karmasik Renkli
Dokumanlarda Sayfa Cozumlemesi, Sinyal Isleme veUygulamalari Kurultayi, pp 114-
120 Ankara 1999.