Embed Size (px)
Citation preview
Mining, Mapping, and Accelerating Scholarly Networks
Katy BörnerCyberinfrastructure for Network Science Center, DirectorInformation Visualization Laboratory, DirectorSchool of Library and Information ScienceIndiana University, Bloomington, [email protected]
With special thanks to the members at the Cyberinfrastructure for Network Science Center; the Sci2, NWB, and EpiC teams; and the VIVO Collaboration
Shared Horizons: Data, Biomedicine, and the Digital HumanitiesMaryland Institute for Technology.
April 11, 2013
Find your way
Find collaborators, friends
Identify trends
Terra bytes of data
Descriptive &PredictiveModels
2
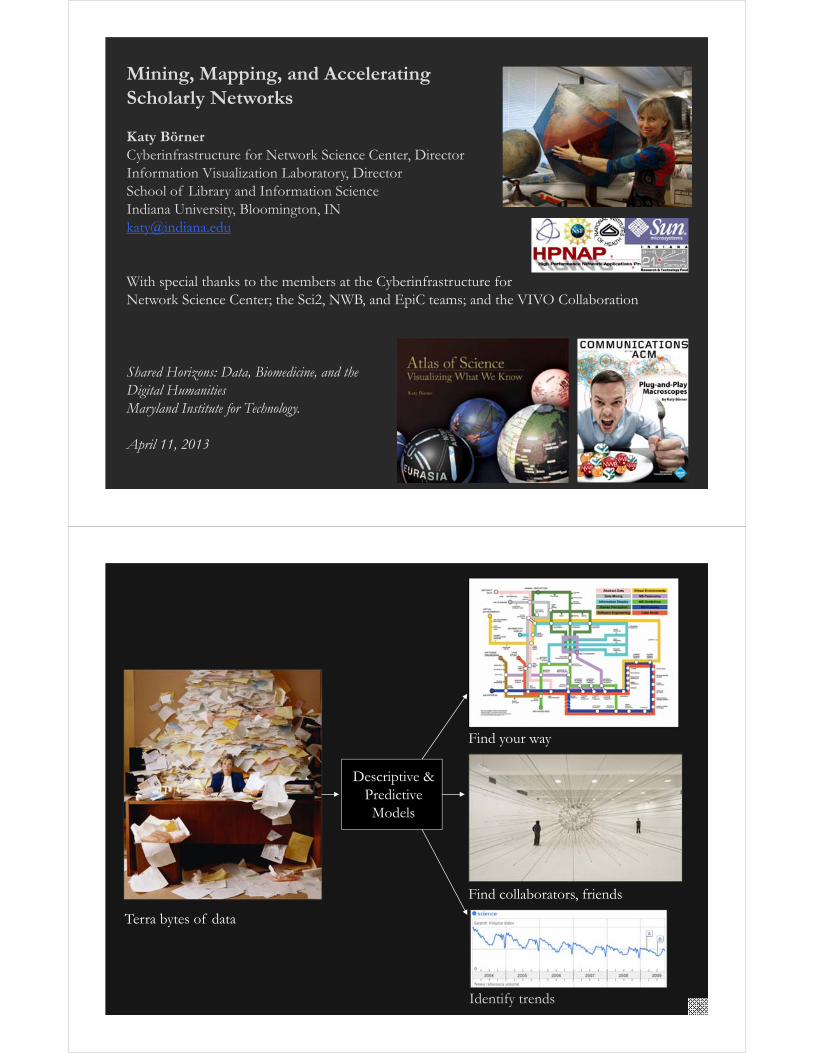
Type of Analysis vs. Level of Analysis
Micro/Individual(1-100 records)
Meso/Local(101–10,000 records)
Macro/Global(10,000 < records)
Statistical Analysis/Profiling
Individual person and their expertise profiles
Larger labs, centers, universities, research domains, or states
All of NSF, all of USA, all of science.
Temporal Analysis (When)
Funding portfolio of one individual
Mapping topic bursts in 20-years of PNAS
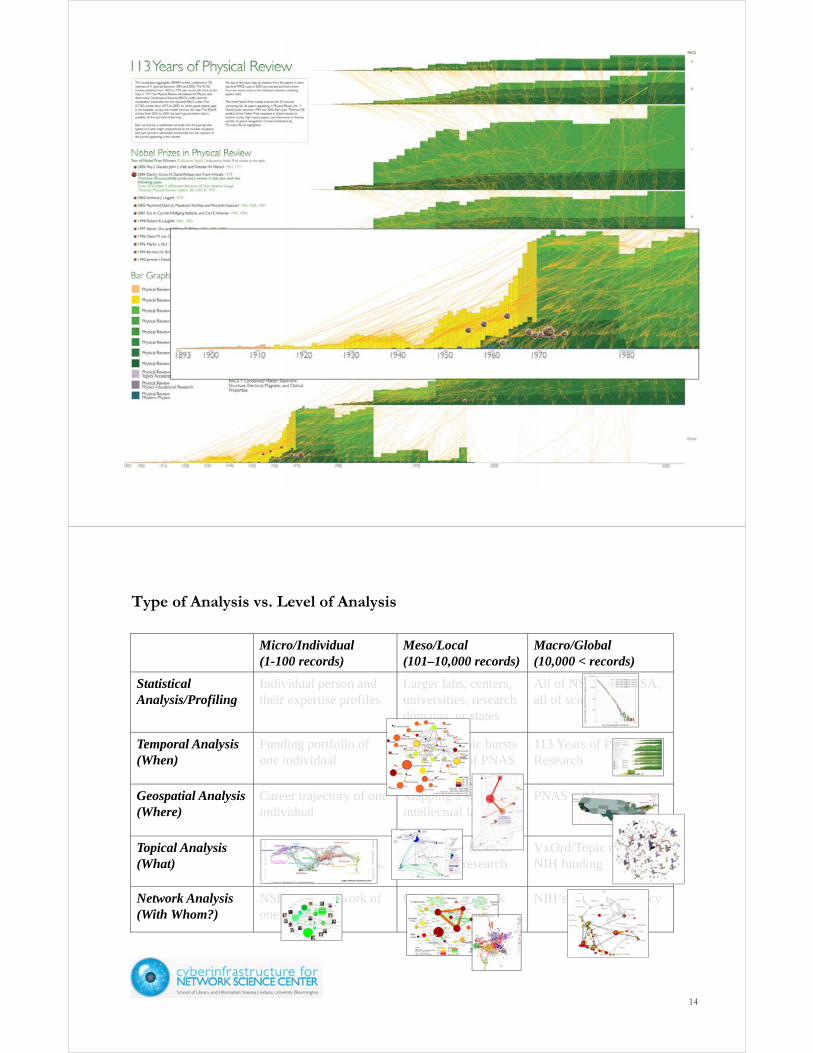
113 Years of Physics Research
Geospatial Analysis (Where)
Career trajectory of one individual
Mapping a states intellectual landscape
PNAS publications
Topical Analysis (What)
Base knowledge from which one grant draws.
Knowledge flows in Chemistry research
VxOrd/Topic maps of NIH funding
Network Analysis (With Whom?)
NSF Co-PI network of one individual
Co-author network NIH’s core competency
3
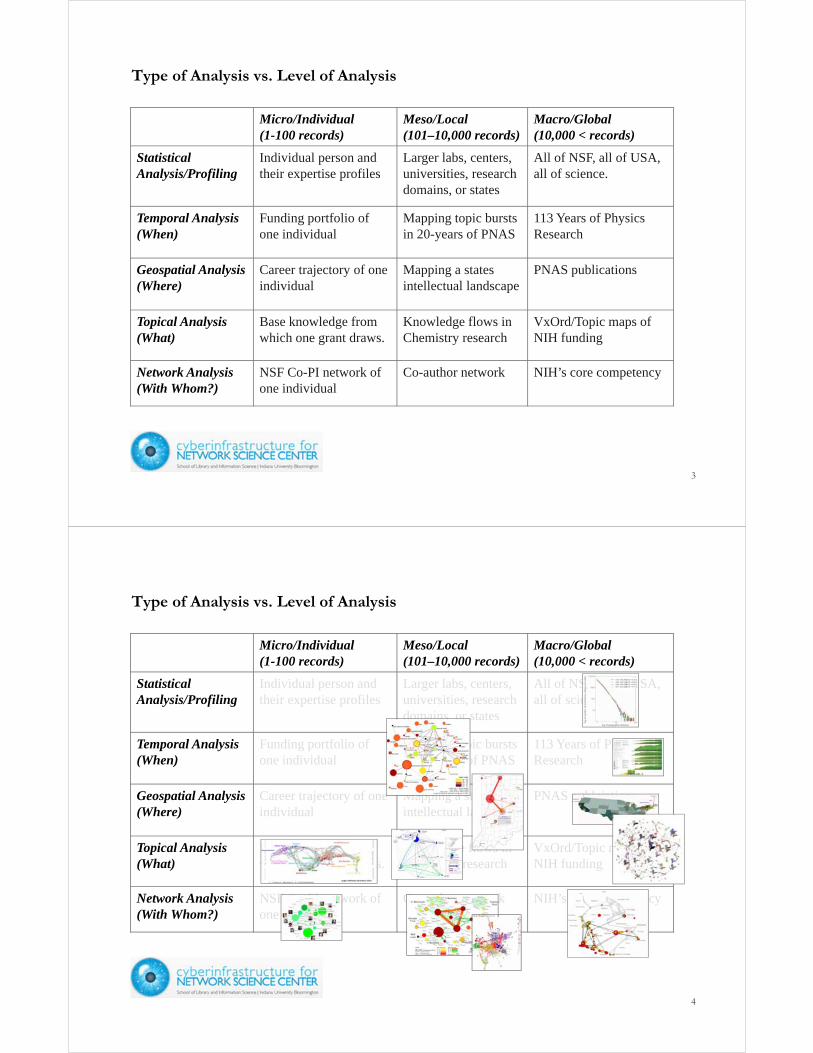
Type of Analysis vs. Level of Analysis
Micro/Individual(1-100 records)
Meso/Local(101–10,000 records)
Macro/Global(10,000 < records)
Statistical Analysis/Profiling
Individual person and their expertise profiles
Larger labs, centers, universities, research domains, or states
All of NSF, all of USA, all of science.
Temporal Analysis (When)
Funding portfolio of one individual
Mapping topic bursts in 20-years of PNAS
113 Years of Physics Research
Geospatial Analysis (Where)
Career trajectory of one individual
Mapping a states intellectual landscape
PNAS publciations
Topical Analysis (What)
Base knowledge from which one grant draws.
Knowledge flows in Chemistry research
VxOrd/Topic maps of NIH funding
Network Analysis (With Whom?)
NSF Co-PI network of one individual
Co-author network NIH’s core competency
4
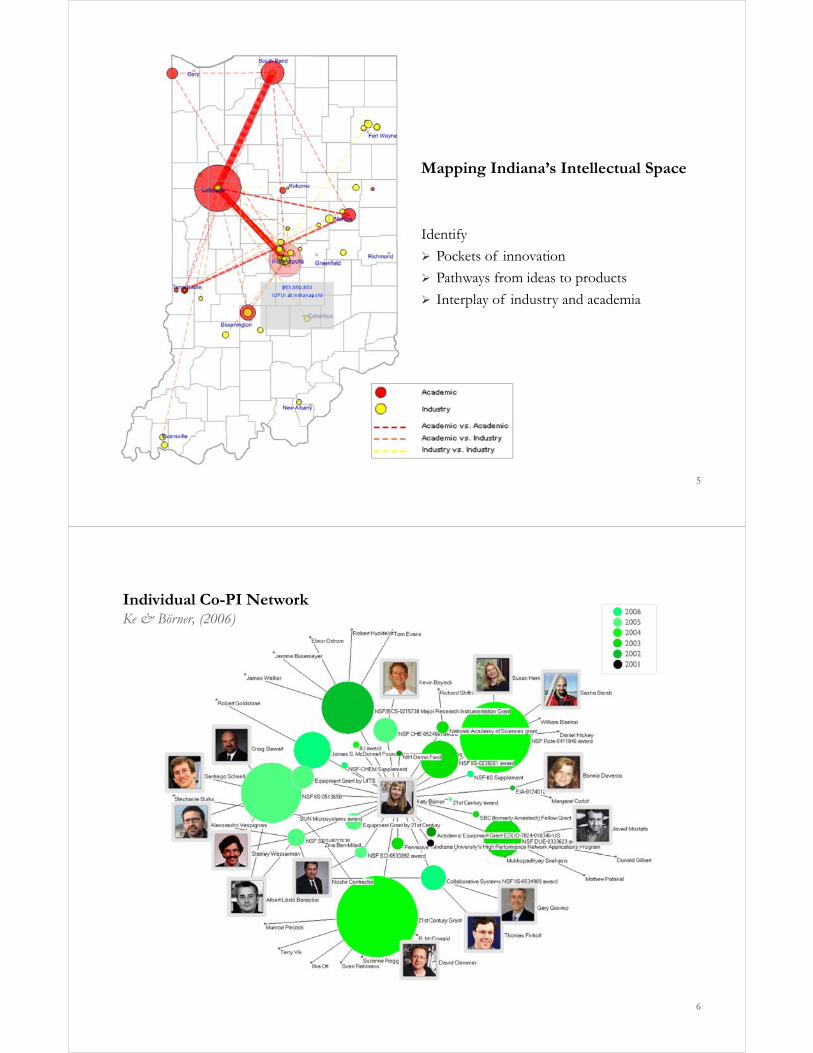
Mapping Indiana’s Intellectual Space
Identify
Pockets of innovation
Pathways from ideas to products
Interplay of industry and academia
5
Individual Co-PI Network Ke & Börner, (2006)
6
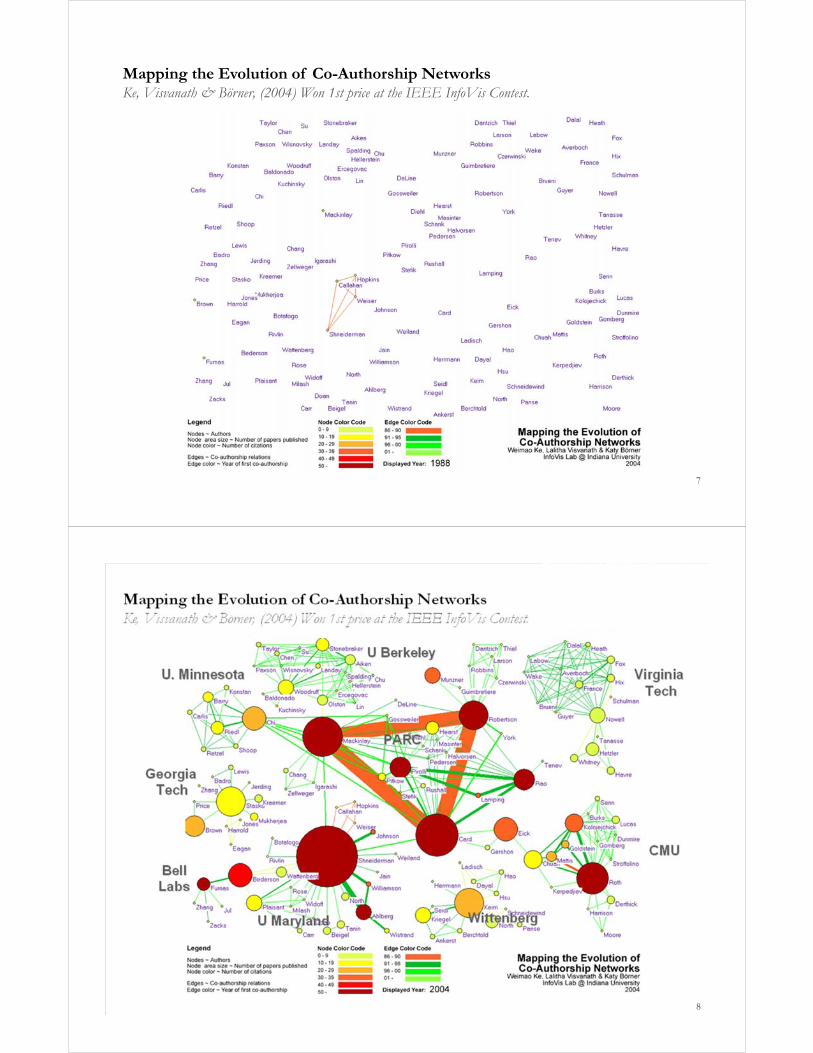
Mapping the Evolution of Co-Authorship Networks Ke, Visvanath & Börner, (2004) Won 1st price at the IEEE InfoVis Contest.
7
8
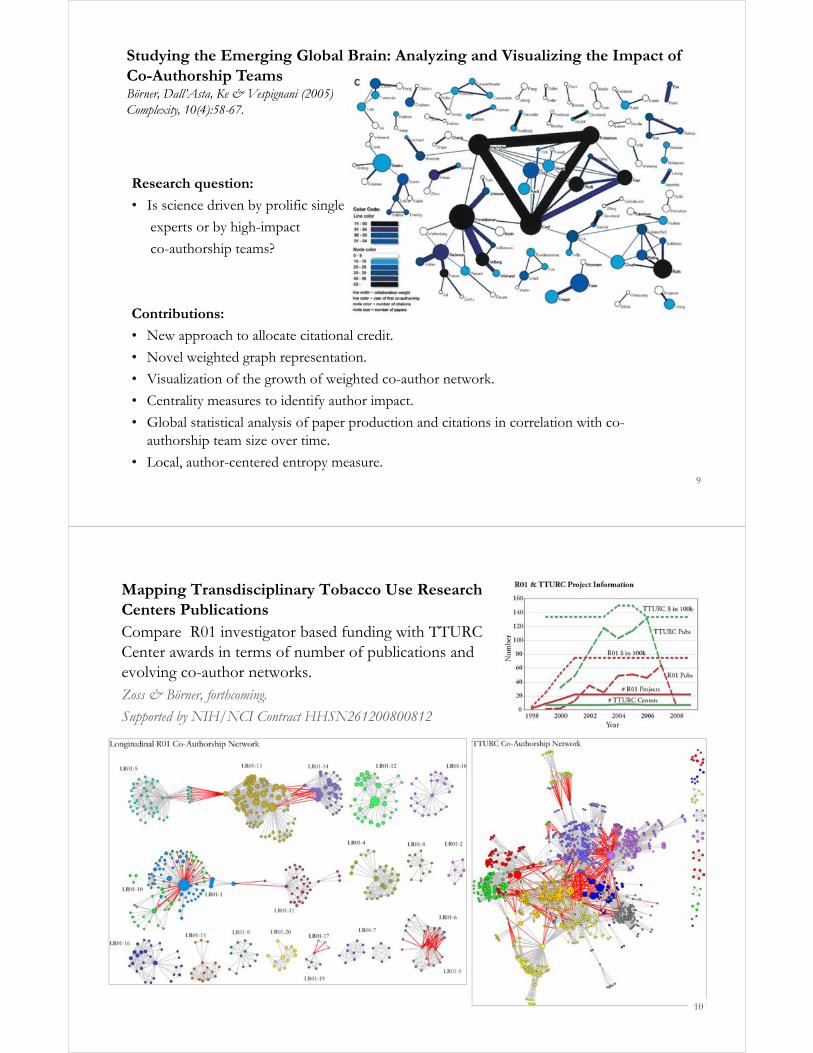
Research question:
• Is science driven by prolific single
experts or by high-impact
co-authorship teams?
Contributions:
• New approach to allocate citational credit.
• Novel weighted graph representation.
• Visualization of the growth of weighted co-author network.
• Centrality measures to identify author impact.
• Global statistical analysis of paper production and citations in correlation with co-authorship team size over time.
• Local, author-centered entropy measure.
Studying the Emerging Global Brain: Analyzing and Visualizing the Impact of Co-Authorship Teams Börner, Dall’Asta, Ke & Vespignani (2005) Complexity, 10(4):58-67.
9
Compare R01 investigator based funding with TTURC Center awards in terms of number of publications and evolving co-author networks.Zoss & Börner, forthcoming.
Supported by NIH/NCI Contract HHSN261200800812
Mapping Transdisciplinary Tobacco Use Research Centers Publications
10
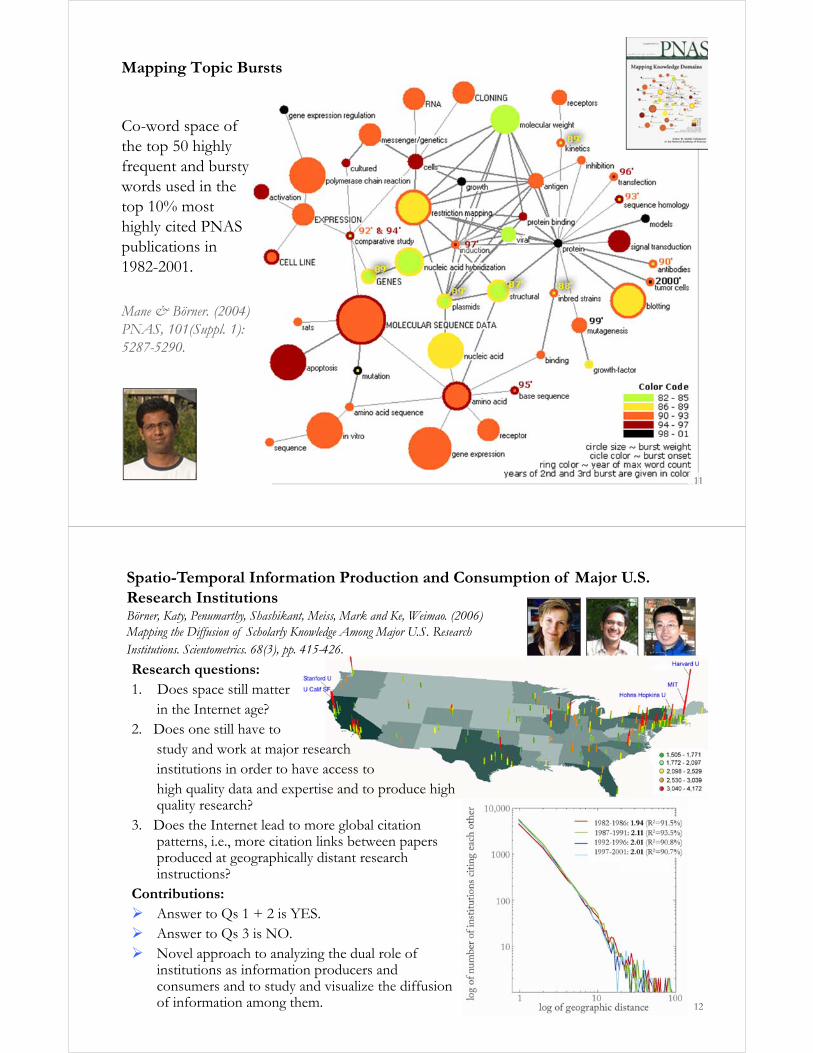
Co-word space of the top 50 highly frequent and bursty words used in the top 10% most highly cited PNAS publications in 1982-2001.
Mane & Börner. (2004) PNAS, 101(Suppl. 1):5287-5290.
Mapping Topic Bursts
11
Spatio-Temporal Information Production and Consumption of Major U.S. Research InstitutionsBörner, Katy, Penumarthy, Shashikant, Meiss, Mark and Ke, Weimao. (2006) Mapping the Diffusion of Scholarly Knowledge Among Major U.S. Research Institutions. Scientometrics. 68(3), pp. 415-426.
Research questions:1. Does space still matter
in the Internet age? 2. Does one still have to
study and work at major research institutions in order to have access to high quality data and expertise and to produce high quality research?
3. Does the Internet lead to more global citation patterns, i.e., more citation links between papers produced at geographically distant research instructions?
Contributions: Answer to Qs 1 + 2 is YES. Answer to Qs 3 is NO. Novel approach to analyzing the dual role of
institutions as information producers and consumers and to study and visualize the diffusion of information among them. 12
Type of Analysis vs. Level of Analysis
Micro/Individual(1-100 records)
Meso/Local(101–10,000 records)
Macro/Global(10,000 < records)
Statistical Analysis/Profiling
Individual person and their expertise profiles
Larger labs, centers, universities, research domains, or states
All of NSF, all of USA, all of science.
Temporal Analysis (When)
Funding portfolio of one individual
Mapping topic bursts in 20-years of PNAS
113 Years of Physics Research
Geospatial Analysis (Where)
Career trajectory of one individual
Mapping a states intellectual landscape
PNAS publciations
Topical Analysis (What)
Base knowledge from which one grant draws.
Knowledge flows in Chemistry research
VxOrd/Topic maps of NIH funding
Network Analysis (With Whom?)
NSF Co-PI network of one individual
Co-author network NIH’s core competency
14
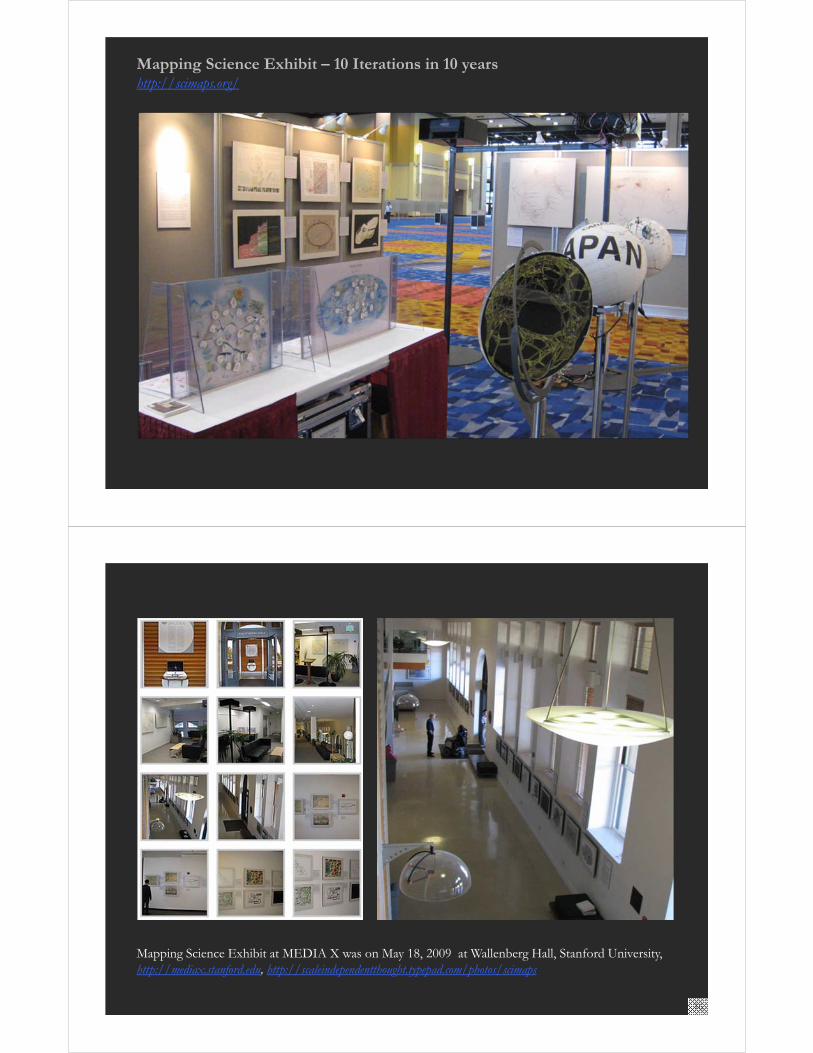
Mapping Science Exhibit – 10 Iterations in 10 yearshttp://scimaps.org/
Mapping Science Exhibit at MEDIA X was on May 18, 2009 at Wallenberg Hall, Stanford University,http://mediax.stanford.edu, http://scaleindependentthought.typepad.com/photos/scimaps
16
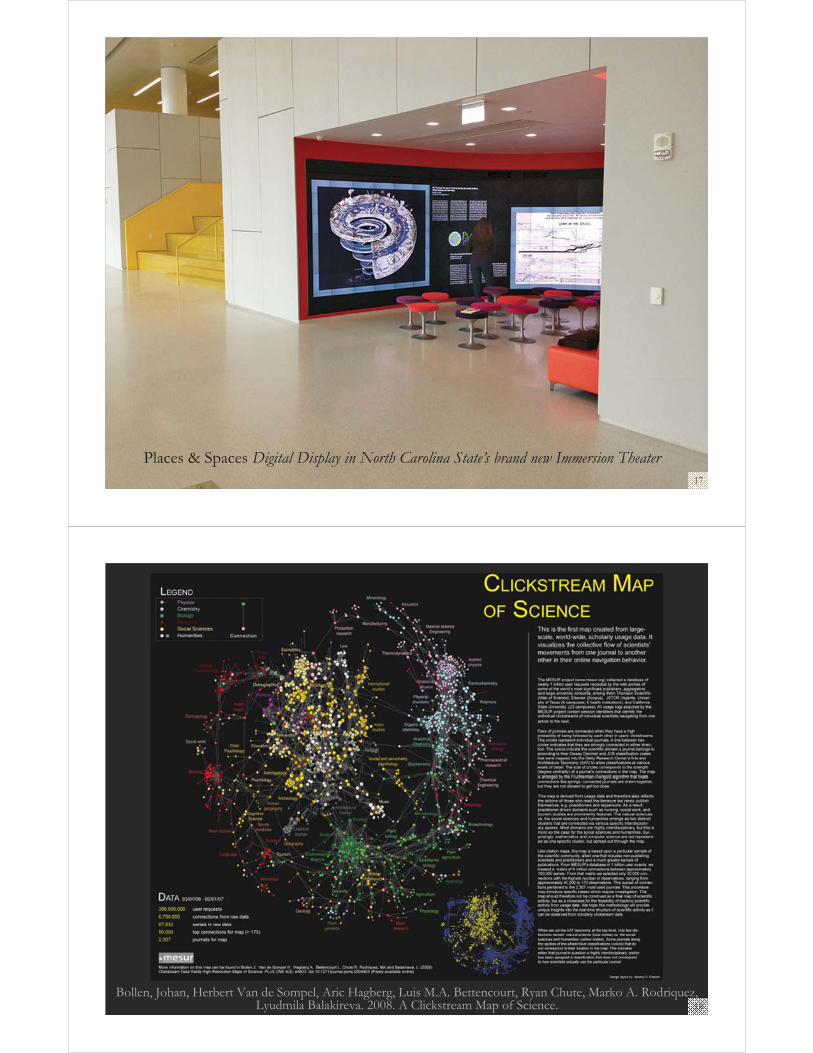
Places & Spaces Digital Display in North Carolina State’s brand new Immersion Theater17
Bollen, Johan, Herbert Van de Sompel, Aric Hagberg, Luis M.A. Bettencourt, Ryan Chute, Marko A. Rodriquez, Lyudmila Balakireva. 2008. A Clickstream Map of Science. 18
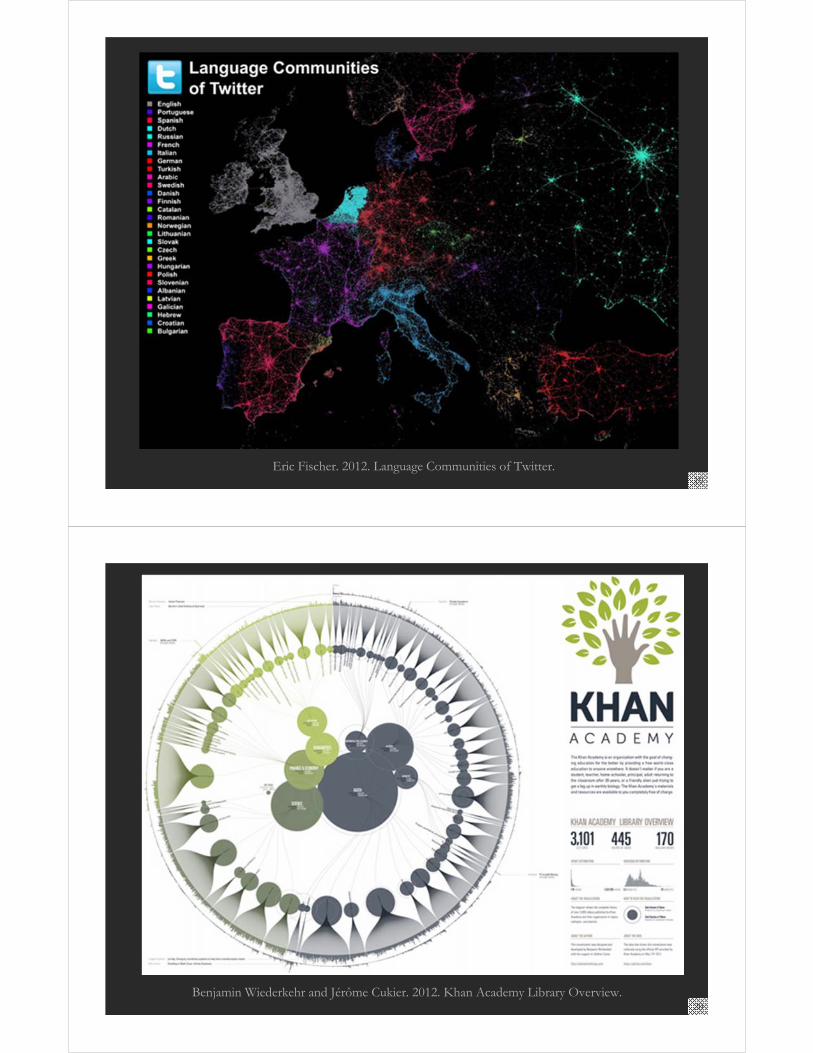
Eric Fischer. 2012. Language Communities of Twitter.19
Benjamin Wiederkehr and Jérôme Cukier. 2012. Khan Academy Library Overview.20
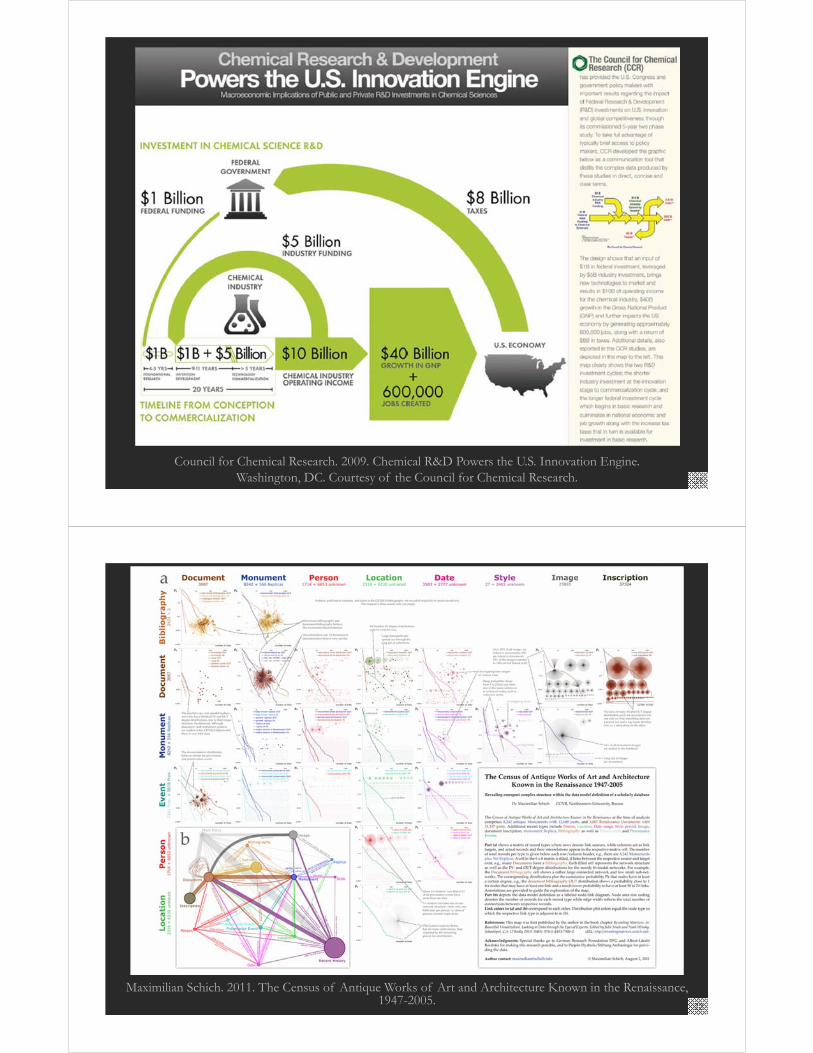
Council for Chemical Research. 2009. Chemical R&D Powers the U.S. Innovation Engine. Washington, DC. Courtesy of the Council for Chemical Research. 21
Maximilian Schich. 2011. The Census of Antique Works of Art and Architecture Known in the Renaissance, 1947-2005. 22
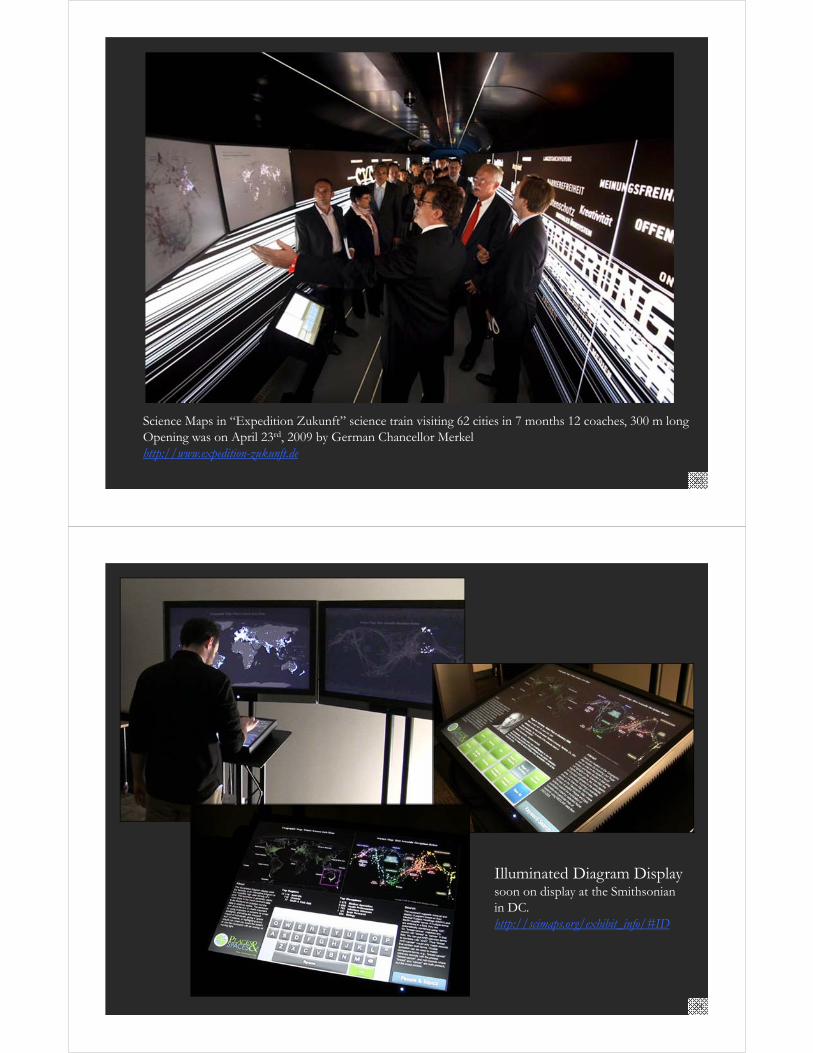
Science Maps in “Expedition Zukunft” science train visiting 62 cities in 7 months 12 coaches, 300 m long Opening was on April 23rd, 2009 by German Chancellor Merkelhttp://www.expedition-zukunft.de
23
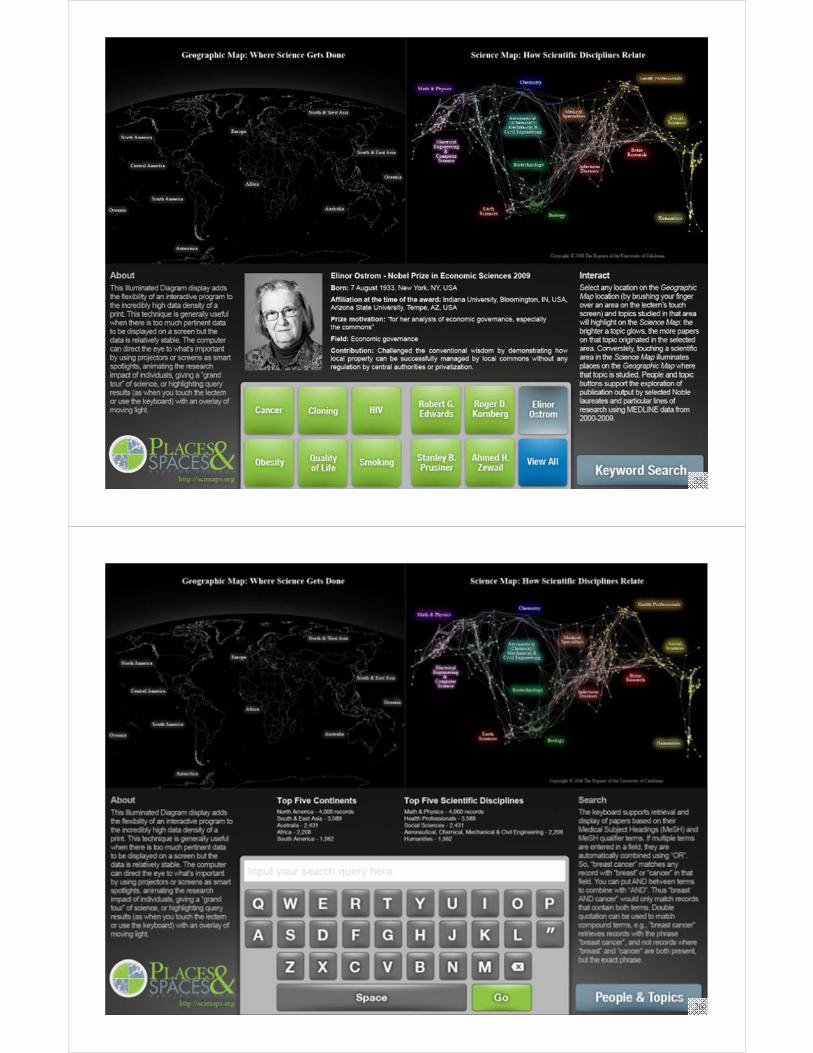
Illuminated Diagram Display soon on display at the Smithsonian in DC.http://scimaps.org/exhibit_info/#ID
24
25
26
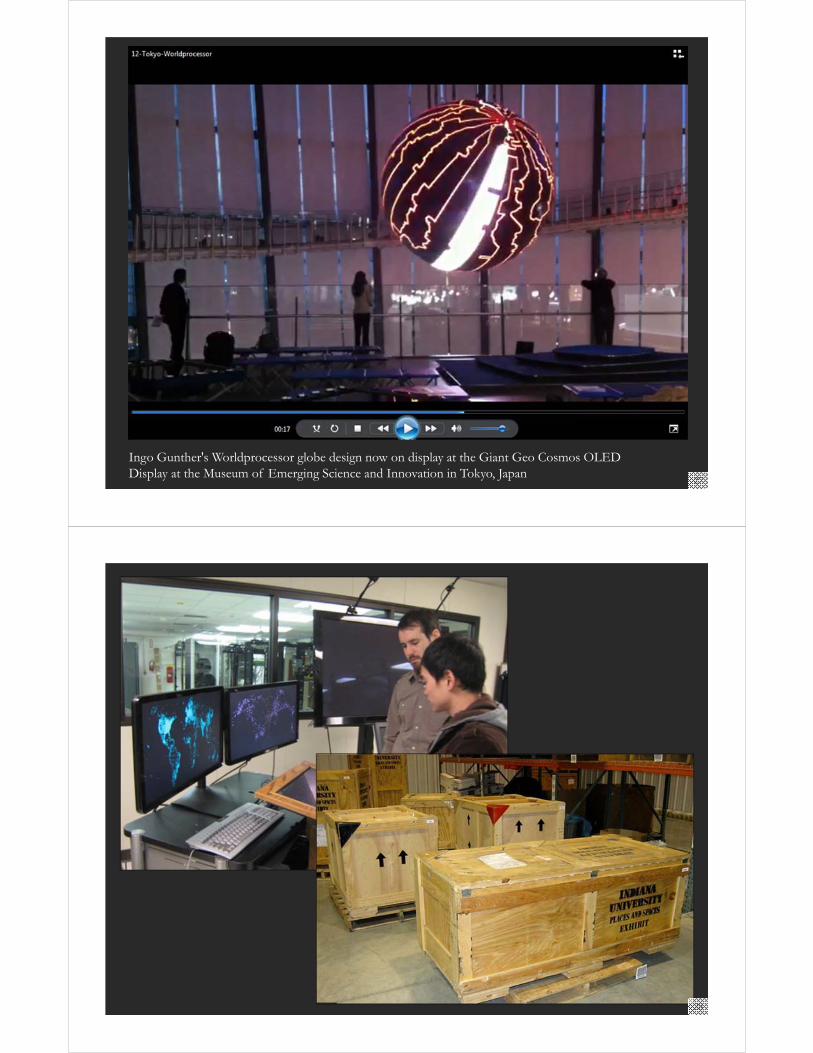
Ingo Gunther's Worldprocessor globe design now on display at the Giant Geo Cosmos OLED Display at the Museum of Emerging Science and Innovation in Tokyo, Japan
27
28
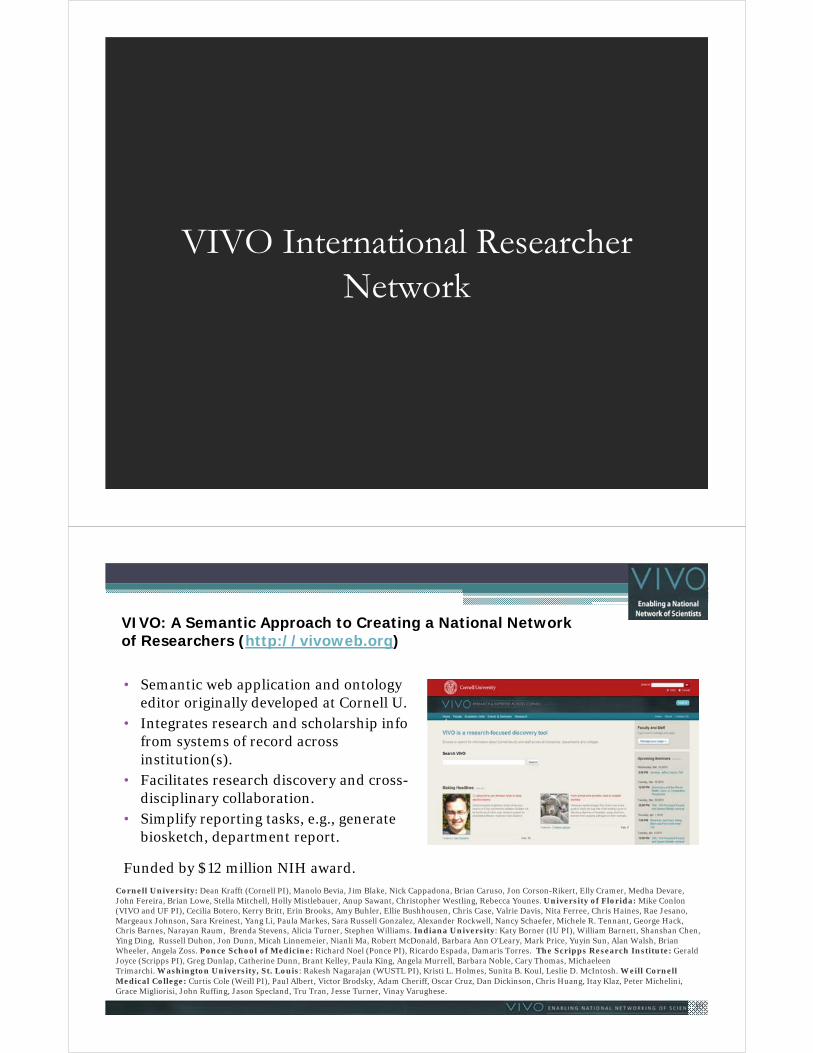
VIVO International Researcher Network
VIVO: A Semantic Approach to Creating a National Network of Researchers (http://vivoweb.org)
• Semantic web application and ontology editor originally developed at Cornell U.
• Integrates research and scholarship info from systems of record across institution(s).
• Facilitates research discovery and cross-disciplinary collaboration.
• Simplify reporting tasks, e.g., generate biosketch, department report.
Funded by $12 million NIH award. Cornell University: Dean Krafft (Cornell PI), Manolo Bevia, Jim Blake, Nick Cappadona, Brian Caruso, Jon Corson-Rikert, Elly Cramer, Medha Devare, John Fereira, Brian Lowe, Stella Mitchell, Holly Mistlebauer, Anup Sawant, Christopher Westling, Rebecca Younes. University of Florida: Mike Conlon (VIVO and UF PI), Cecilia Botero, Kerry Britt, Erin Brooks, Amy Buhler, Ellie Bushhousen, Chris Case, Valrie Davis, Nita Ferree, Chris Haines, Rae Jesano, Margeaux Johnson, Sara Kreinest, Yang Li, Paula Markes, Sara Russell Gonzalez, Alexander Rockwell, Nancy Schaefer, Michele R. Tennant, George Hack, Chris Barnes, Narayan Raum, Brenda Stevens, Alicia Turner, Stephen Williams. Indiana University: Katy Borner (IU PI), William Barnett, Shanshan Chen, Ying Ding, Russell Duhon, Jon Dunn, Micah Linnemeier, Nianli Ma, Robert McDonald, Barbara Ann O'Leary, Mark Price, Yuyin Sun, Alan Walsh, Brian Wheeler, Angela Zoss. Ponce School of Medicine: Richard Noel (Ponce PI), Ricardo Espada, Damaris Torres. The Scripps Research Institute: Gerald Joyce (Scripps PI), Greg Dunlap, Catherine Dunn, Brant Kelley, Paula King, Angela Murrell, Barbara Noble, Cary Thomas, Michaeleen Trimarchi. Washington University, St. Louis: Rakesh Nagarajan (WUSTL PI), Kristi L. Holmes, Sunita B. Koul, Leslie D. McIntosh. Weill Cornell Medical College: Curtis Cole (Weill PI), Paul Albert, Victor Brodsky, Adam Cheriff, Oscar Cruz, Dan Dickinson, Chris Huang, Itay Klaz, Peter Michelini, Grace Migliorisi, John Ruffing, Jason Specland, Tru Tran, Jesse Turner, Vinay Varughese.
30
31
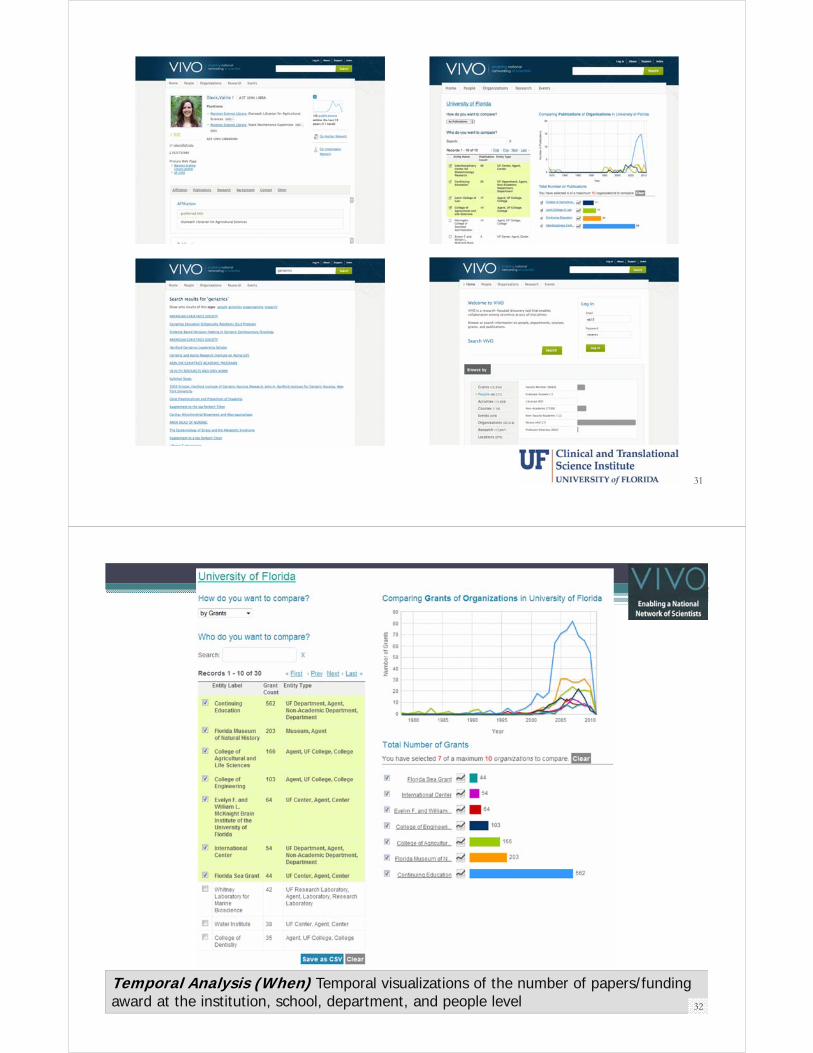
Temporal Analysis (When) Temporal visualizations of the number of papers/funding award at the institution, school, department, and people level 32
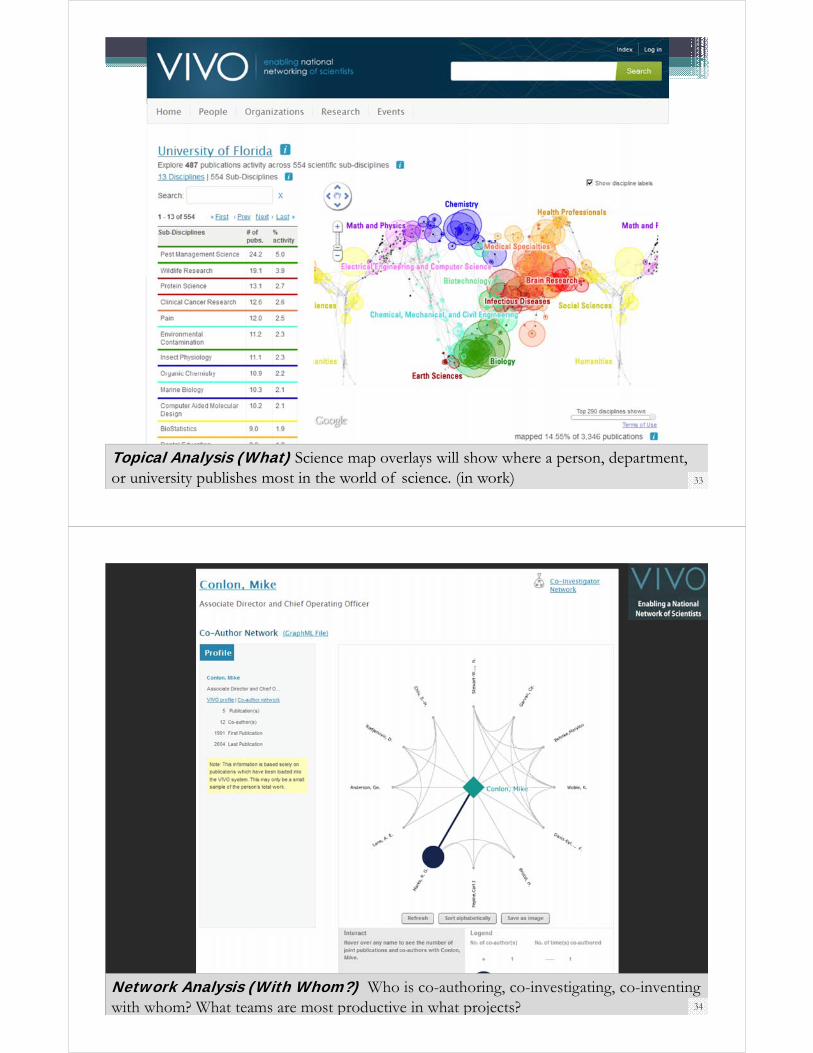
Topical Analysis (What) Science map overlays will show where a person, department, or university publishes most in the world of science. (in work) 33
Network Analysis (With Whom?) Who is co-authoring, co-investigating, co-inventing with whom? What teams are most productive in what projects? 34
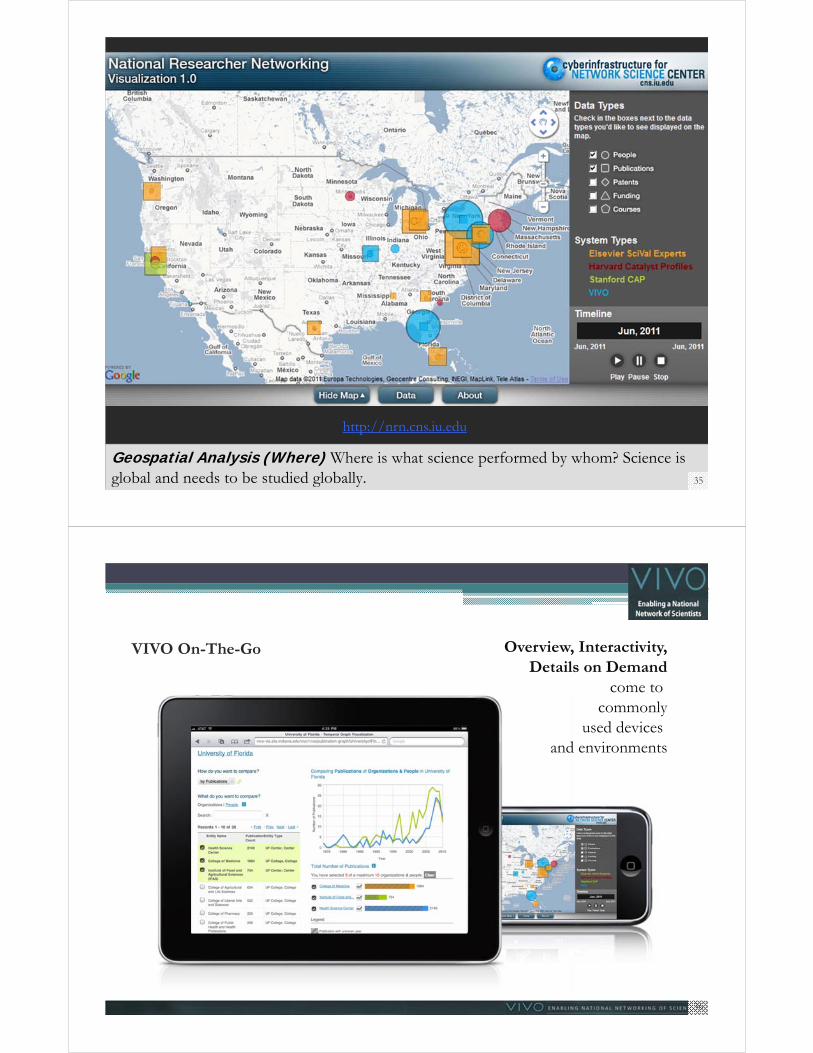
http://nrn.cns.iu.edu
Geospatial Analysis (Where) Where is what science performed by whom? Science is global and needs to be studied globally. 35
36
Overview, Interactivity,Details on Demand
come to commonly
used devices and environments
VIVO On-The-Go
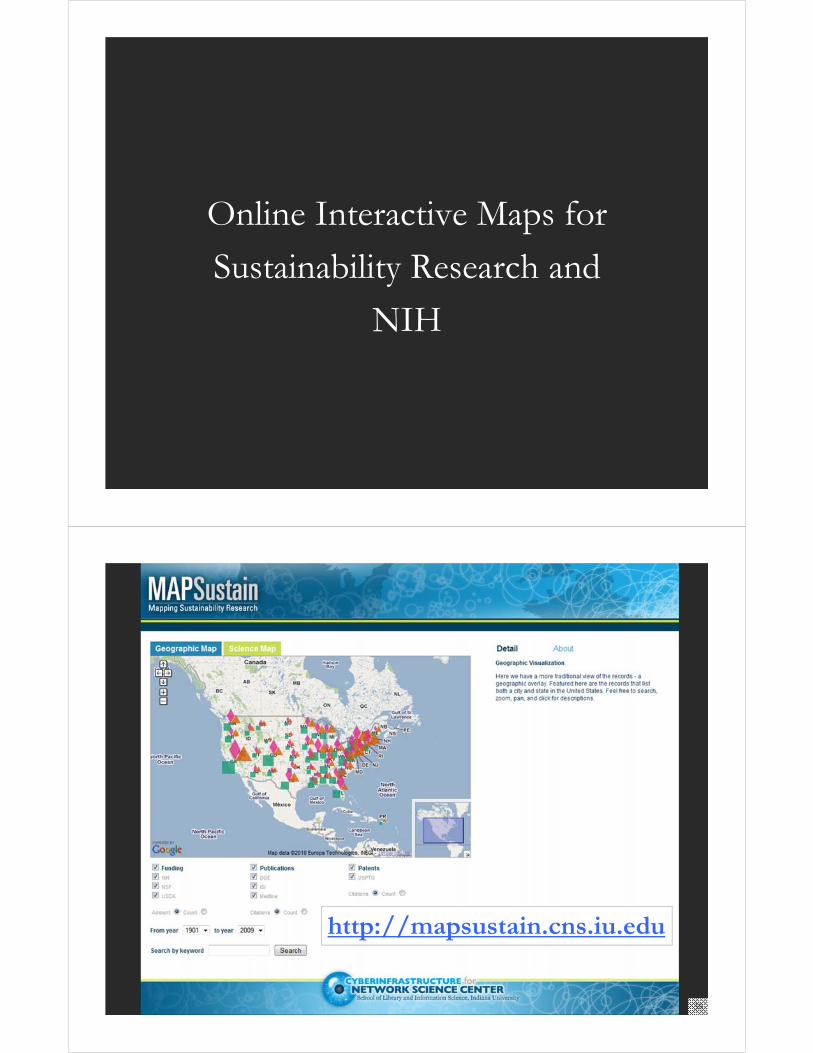
Online Interactive Maps for
Sustainability Research and
NIH
http://mapsustain.cns.iu.edu
38
39
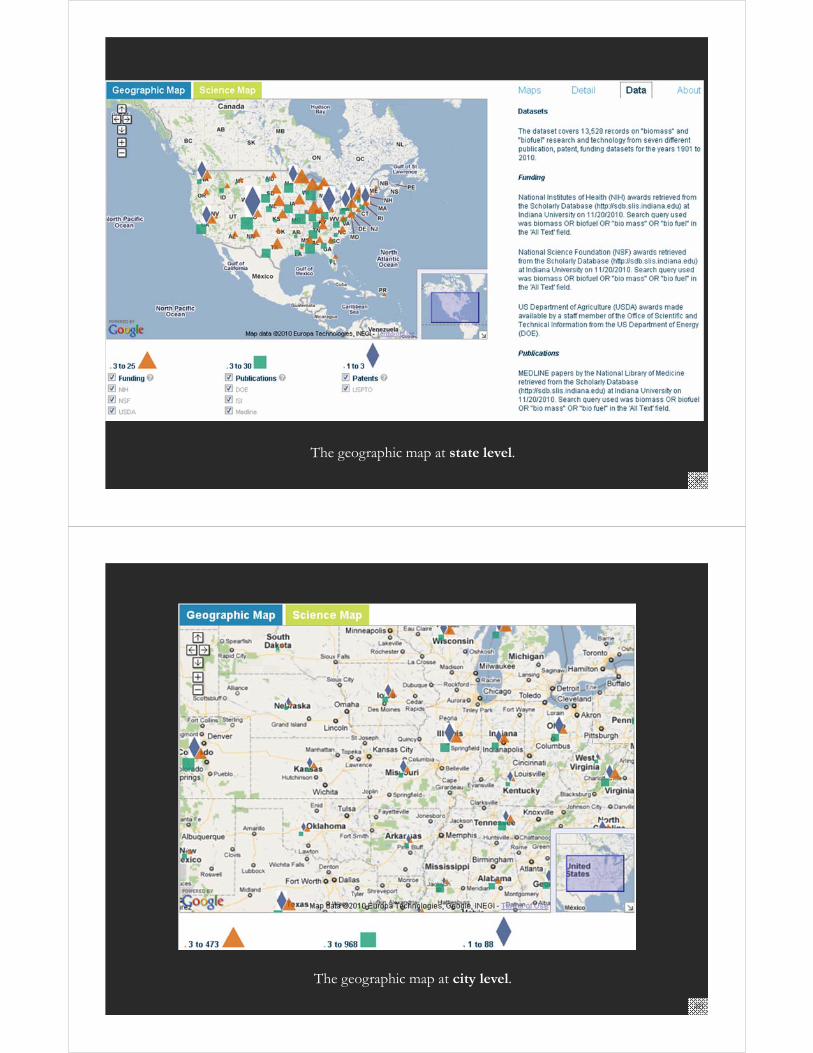
The geographic map at state level.
40
The geographic map at city level.
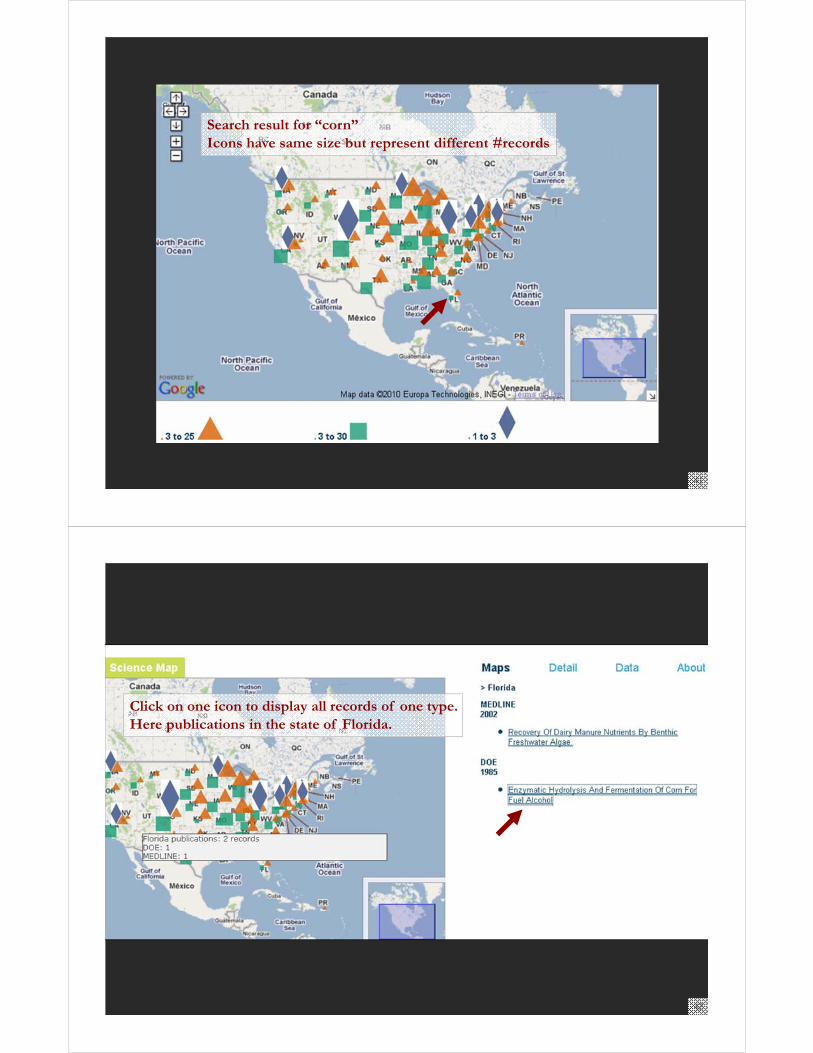
Search result for “corn”Icons have same size but represent different #records
41
Click on one icon to display all records of one type.Here publications in the state of Florida.
42
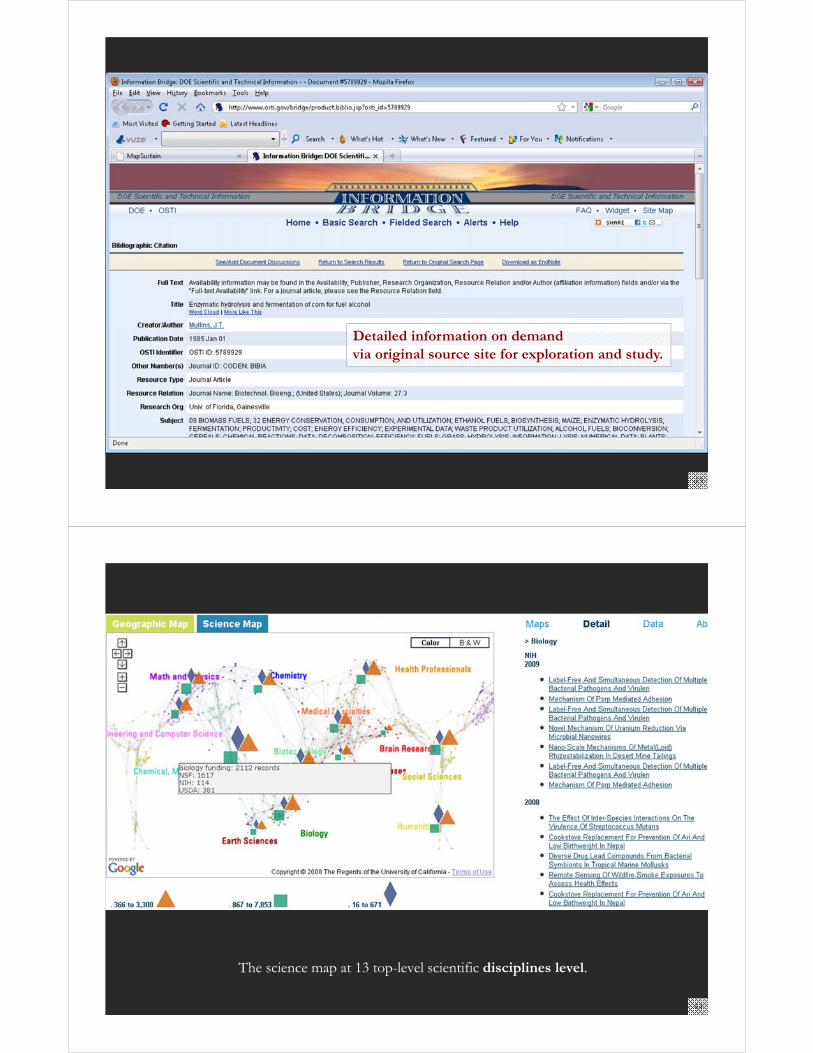
Detailed information on demand via original source site for exploration and study.
43
44
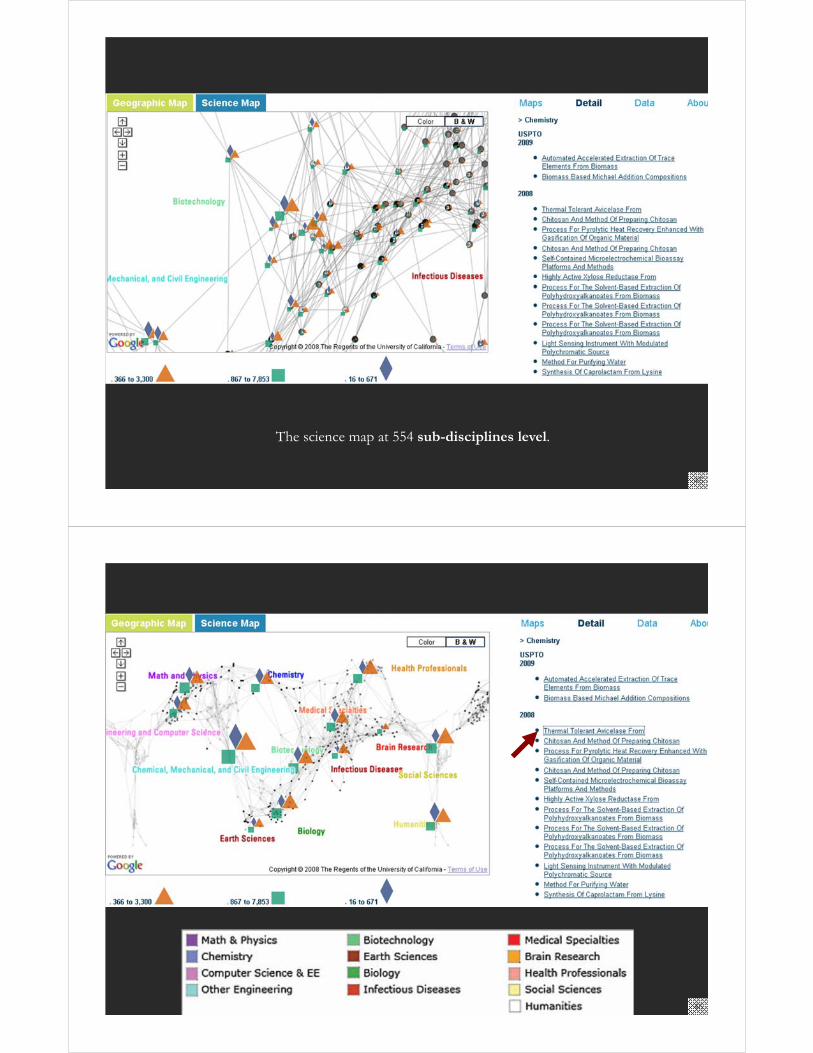
The science map at 13 top-level scientific disciplines level.
45
The science map at 554 sub-disciplines level.
46
47
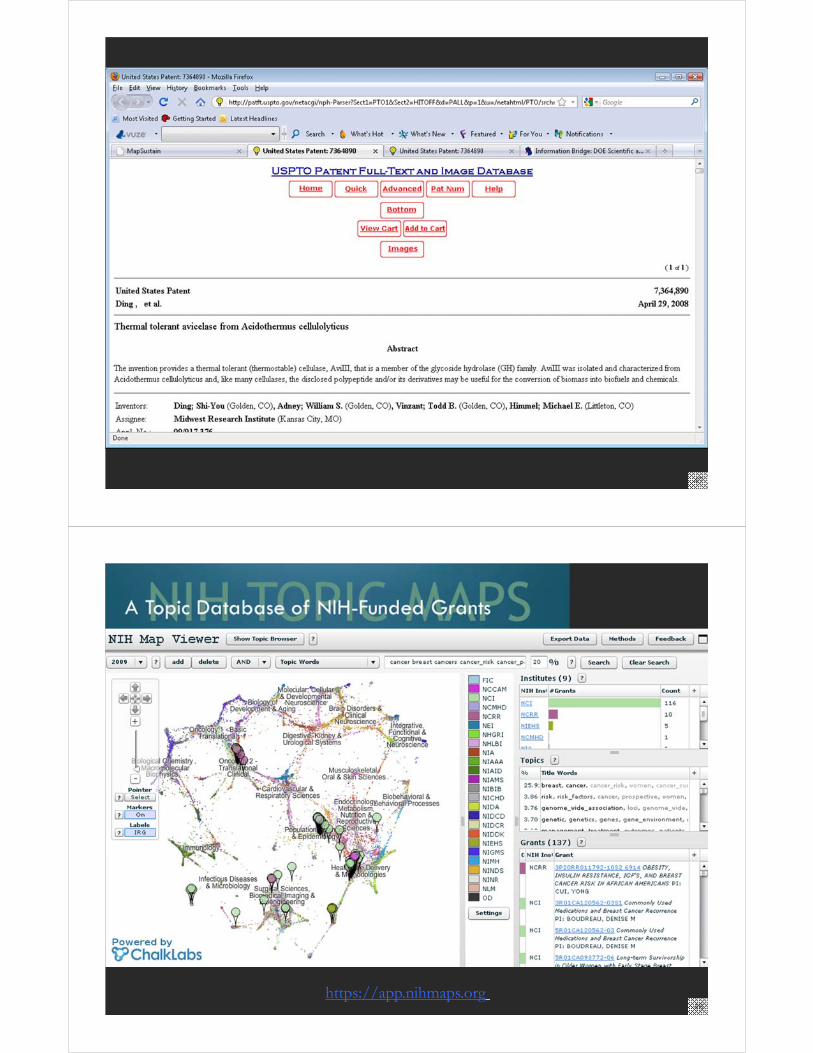
https://app.nihmaps.org48
https://app.nihmaps.org
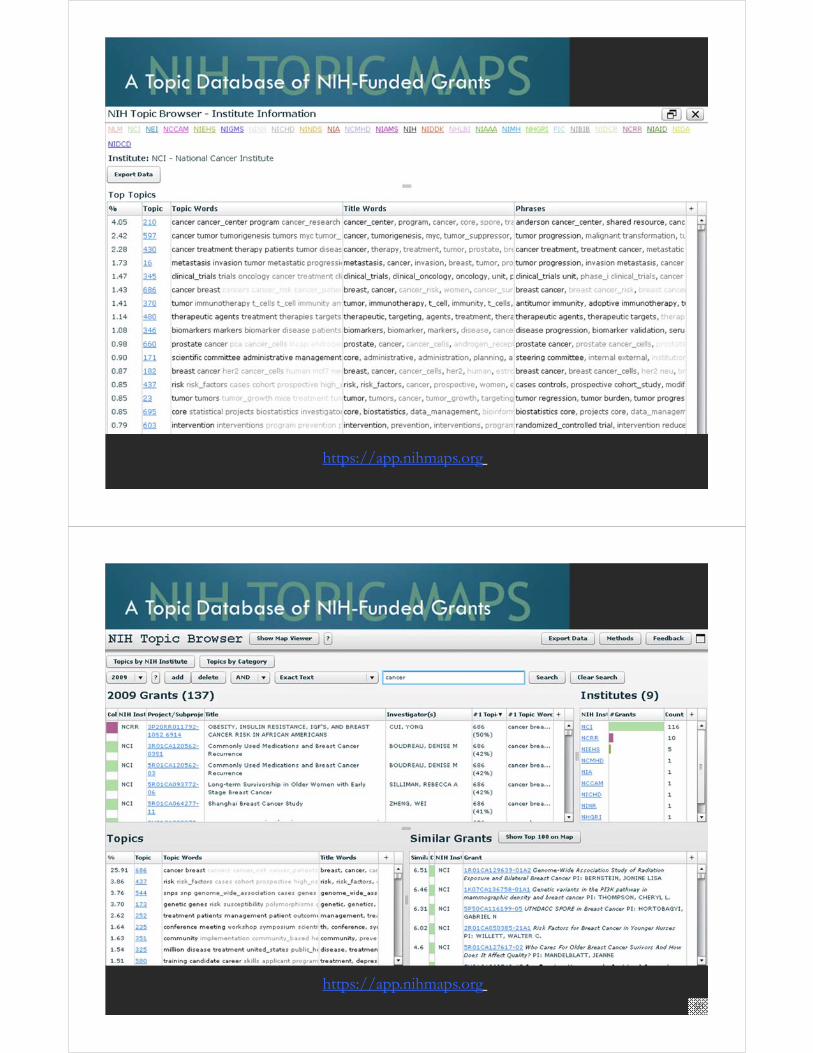
https://app.nihmaps.org50
https://app.nihmaps.org51
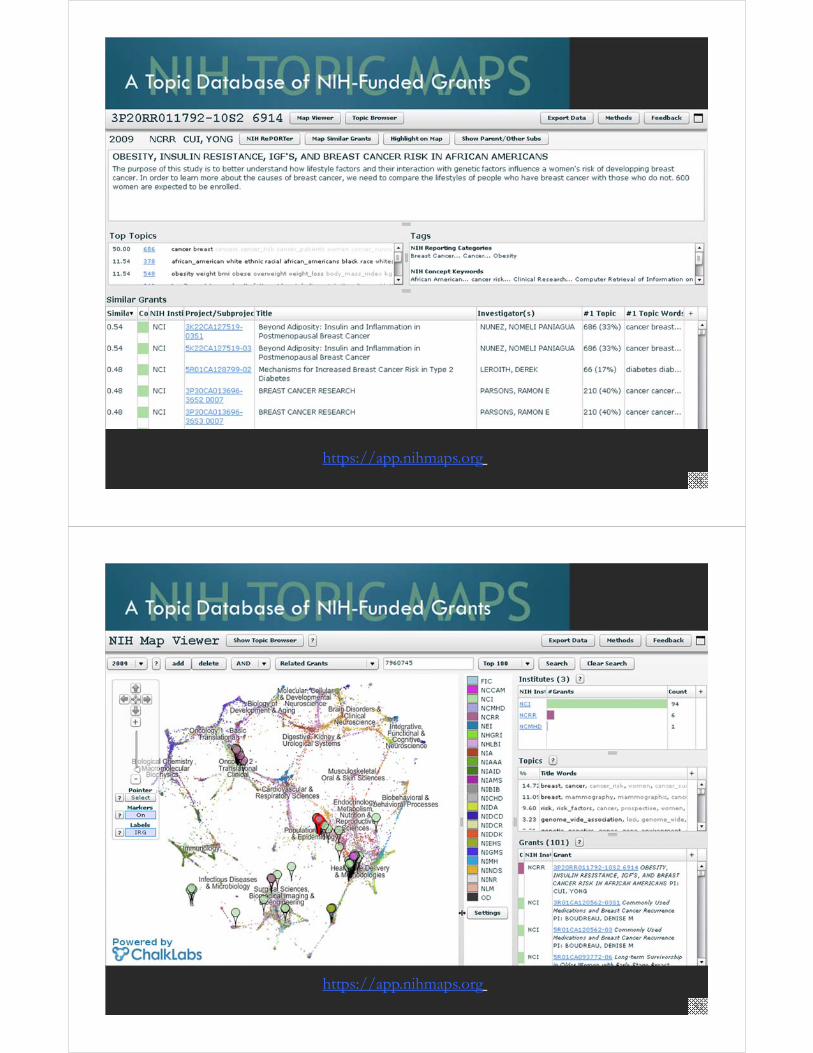
https://app.nihmaps.org52
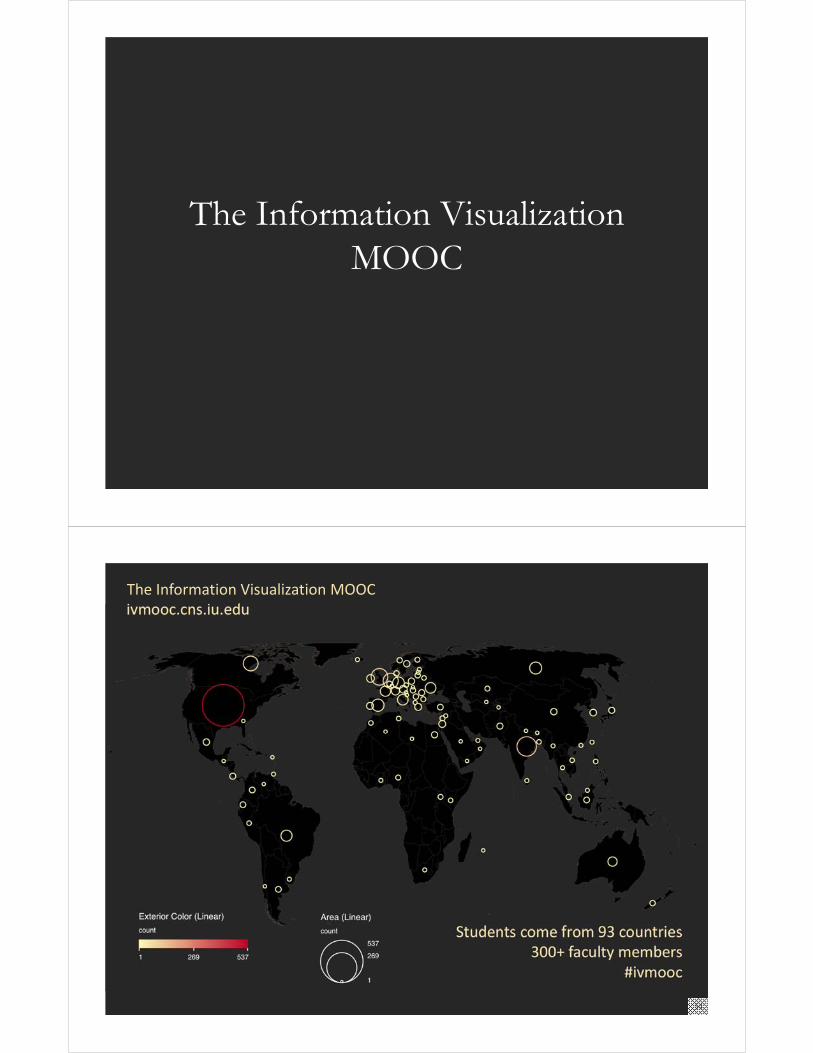
The Information Visualization MOOC
The Information Visualization MOOCivmooc.cns.iu.edu
Students come from 93 countries300+ faculty members
#ivmooc
54
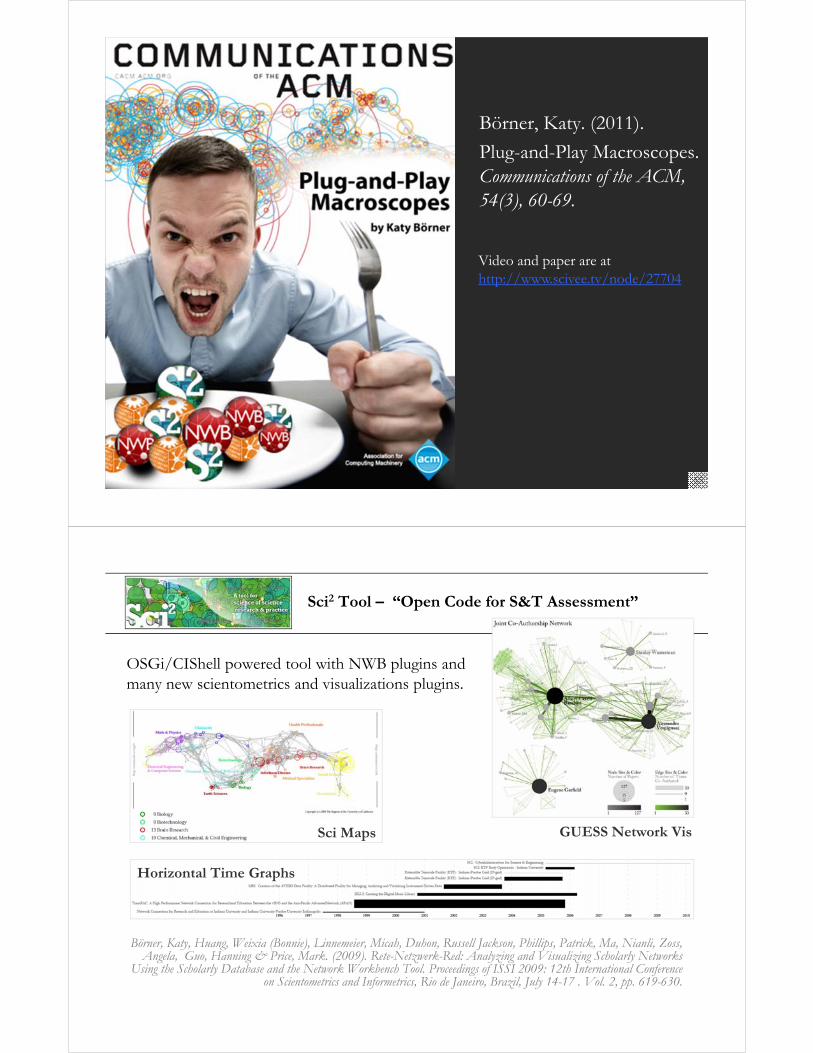
Börner, Katy. (2011).
Plug-and-Play Macroscopes. Communications of the ACM, 54(3), 60-69.
Video and paper are athttp://www.scivee.tv/node/27704
55
Sci2 Tool – “Open Code for S&T Assessment”
OSGi/CIShell powered tool with NWB plugins and many new scientometrics and visualizations plugins.
Börner, Katy, Huang, Weixia (Bonnie), Linnemeier, Micah, Duhon, Russell Jackson, Phillips, Patrick, Ma, Nianli, Zoss, Angela, Guo, Hanning & Price, Mark. (2009). Rete-Netzwerk-Red: Analyzing and Visualizing Scholarly Networks
Using the Scholarly Database and the Network Workbench Tool. Proceedings of ISSI 2009: 12th International Conference on Scientometrics and Informetrics, Rio de Janeiro, Brazil, July 14-17 . Vol. 2, pp. 619-630.
Horizontal Time Graphs
Sci Maps GUESS Network Vis
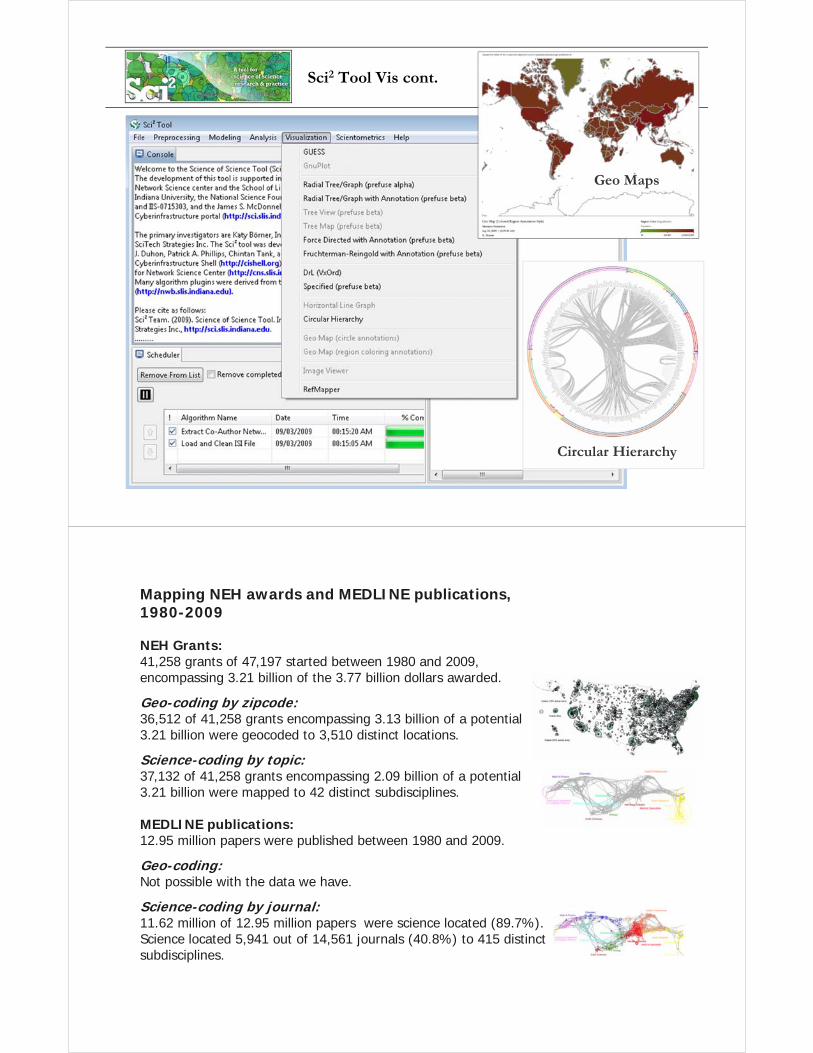
Sci2 Tool Vis cont.
Geo Maps
Circular Hierarchy
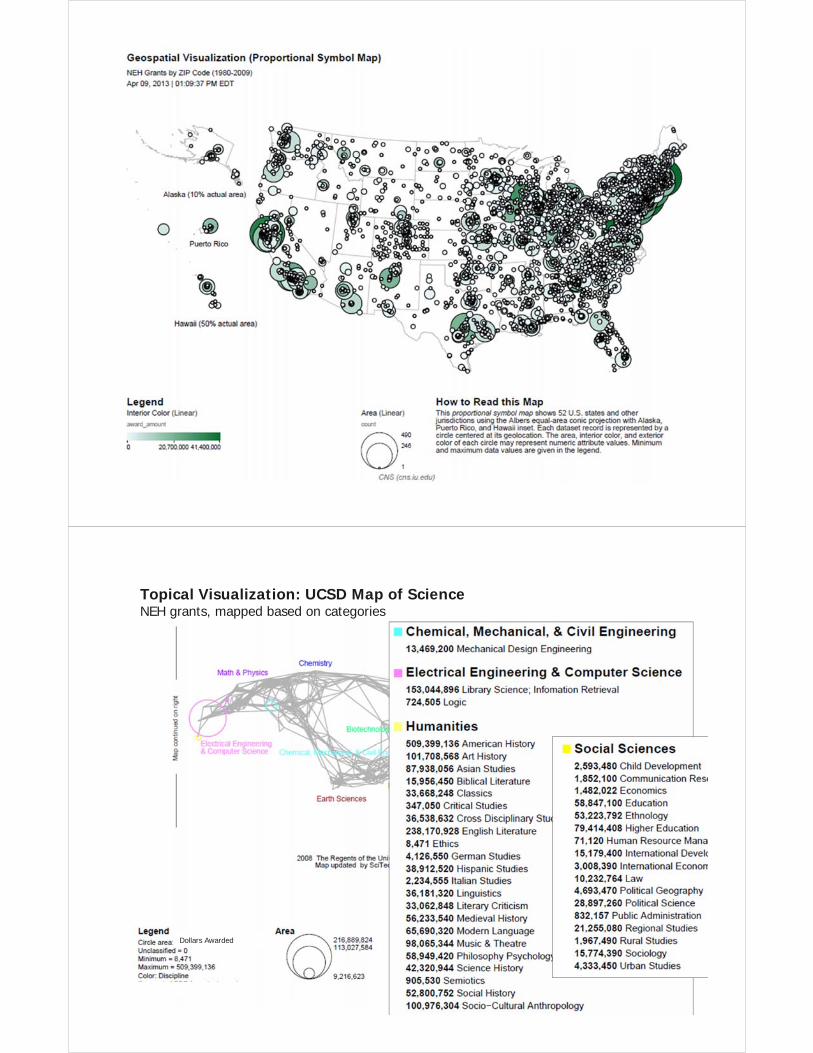
Mapping NEH awards and MEDLINE publications, 1980-2009
NEH Grants: 41,258 grants of 47,197 started between 1980 and 2009, encompassing 3.21 billion of the 3.77 billion dollars awarded.
Geo-coding by zipcode: 36,512 of 41,258 grants encompassing 3.13 billion of a potential 3.21 billion were geocoded to 3,510 distinct locations.
Science-coding by topic: 37,132 of 41,258 grants encompassing 2.09 billion of a potential 3.21 billion were mapped to 42 distinct subdisciplines.
MEDLINE publications: 12.95 million papers were published between 1980 and 2009.
Geo-coding: Not possible with the data we have.
Science-coding by journal: 11.62 million of 12.95 million papers were science located (89.7%).Science located 5,941 out of 14,561 journals (40.8%) to 415 distinct subdisciplines.
Topical Visualization: UCSD Map of ScienceNEH grants, mapped based on categories
Dollars Awarded
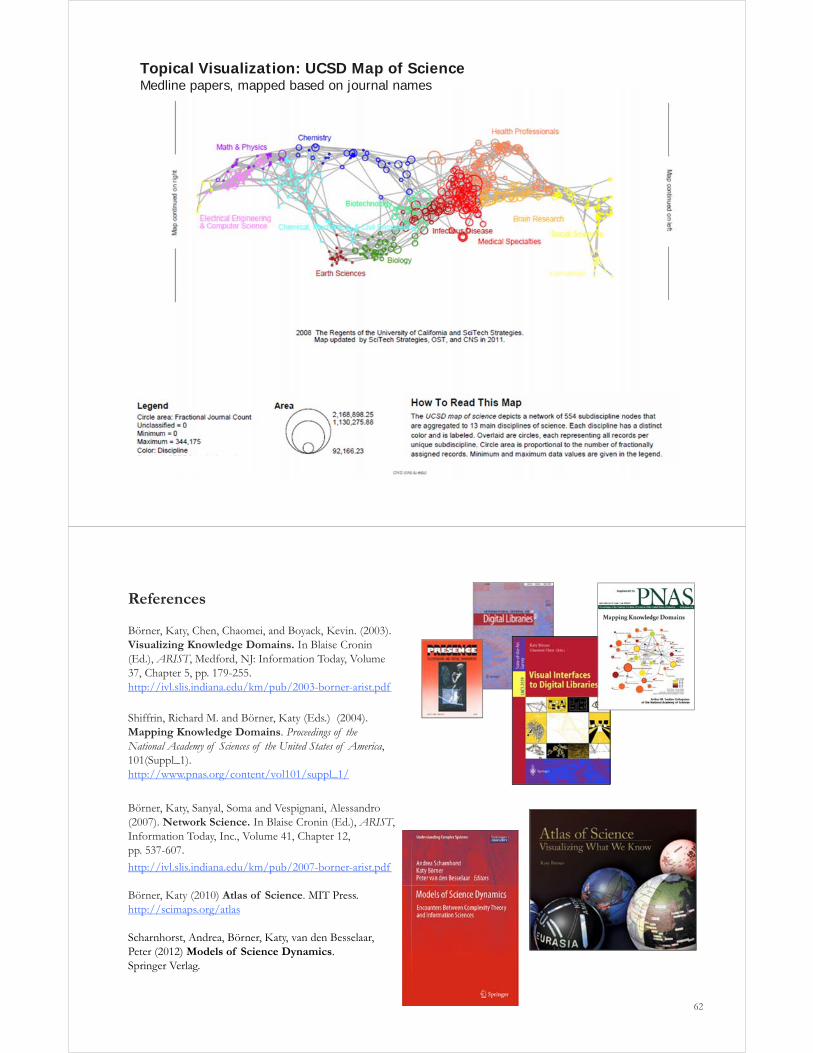
Topical Visualization: UCSD Map of ScienceMedline papers, mapped based on journal names
References
Börner, Katy, Chen, Chaomei, and Boyack, Kevin. (2003). Visualizing Knowledge Domains. In Blaise Cronin (Ed.), ARIST, Medford, NJ: Information Today, Volume 37, Chapter 5, pp. 179-255. http://ivl.slis.indiana.edu/km/pub/2003-borner-arist.pdf
Shiffrin, Richard M. and Börner, Katy (Eds.) (2004). Mapping Knowledge Domains. Proceedings of the National Academy of Sciences of the United States of America, 101(Suppl_1). http://www.pnas.org/content/vol101/suppl_1/
Börner, Katy, Sanyal, Soma and Vespignani, Alessandro (2007). Network Science. In Blaise Cronin (Ed.), ARIST, Information Today, Inc., Volume 41, Chapter 12, pp. 537-607.
http://ivl.slis.indiana.edu/km/pub/2007-borner-arist.pdf
Börner, Katy (2010) Atlas of Science. MIT Press.http://scimaps.org/atlas
Scharnhorst, Andrea, Börner, Katy, van den Besselaar, Peter (2012) Models of Science Dynamics. Springer Verlag.
62
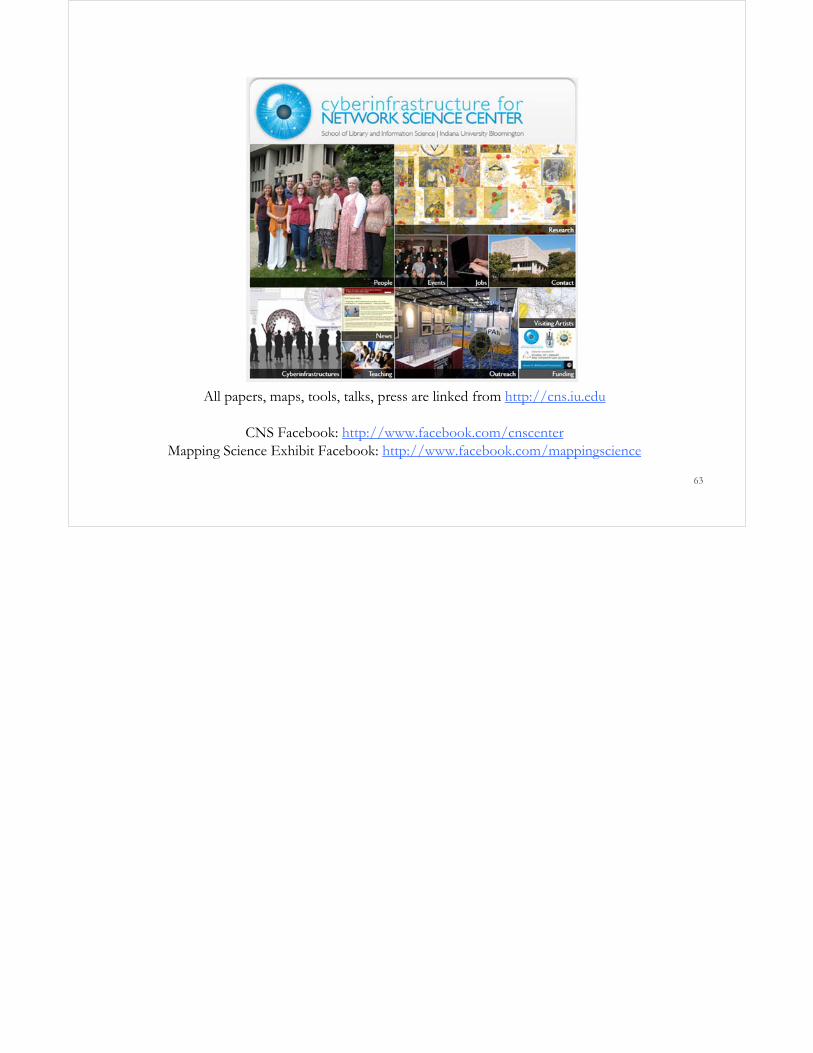
All papers, maps, tools, talks, press are linked from http://cns.iu.edu
CNS Facebook: http://www.facebook.com/cnscenterMapping Science Exhibit Facebook: http://www.facebook.com/mappingscience
63