Embed Size (px)
Citation preview
7/30/2019 Mining Industry Energy Bandwidth
http://slidepdf.com/reader/full/mining-industry-energy-bandwidth 1/47

7/30/2019 Mining Industry Energy Bandwidth
http://slidepdf.com/reader/full/mining-industry-energy-bandwidth 2/47
7/30/2019 Mining Industry Energy Bandwidth
http://slidepdf.com/reader/full/mining-industry-energy-bandwidth 3/47
Contents
Executive Summary.................................................................................................................1
1. Introduction..................................................................................................................5
2. Background ..................................................................................................................7
2.1 Mining Industry Energy Sources ...................................................................................72.2 Materials Mined and Recovery Ratio ............................................................................72.3 Mining Methods.............................................................................................................8
3. Mining Equipment.......................................................................................................9
3.1 Extraction.....................................................................................................................10
3.2 Materials Handling Equipment ....................................................................................113.3 Beneficiation & Processing Equipment .......................................................................12
4. Bandwidth Calculation Methodology ......................................................................13
4.1 Method for Determining Current Mining Energy Consumption .................................144.2 Best Practice, Practical Minimum, and Theoretical Minimum Energy Consumption 164.3 Factoring in Electricity Generation Losses in the Analysis.........................................174.4 Estimating Annual Energy Consumption and Energy-Savings Opportunity ..............18
5. Uncertainties and Data Quality ................................................................................19
6. Conclusion ..................................................................................................................21
References...............................................................................................................................25
Appendix A: Current Energy Consumption and Savings Potential by Equipment
Category in Coal, Metal, and Mineral Mining.............................................27
Appendix B: Energy Requirements and Efficiencies of Equipment Types in
Coal, Metals and Minerals Mining................................................................31
Appendix C: Total Energy Consumption by Mining Stage across
Coal, Metals and Minerals Mining (TBtu/yr) .............................................. 35
Appendix D: Assumptions for U.S. Mining Industry Bandwidth Analysis......................37
Appendix E: Glossary of Mining Terms..............................................................................41
7/30/2019 Mining Industry Energy Bandwidth
http://slidepdf.com/reader/full/mining-industry-energy-bandwidth 4/47
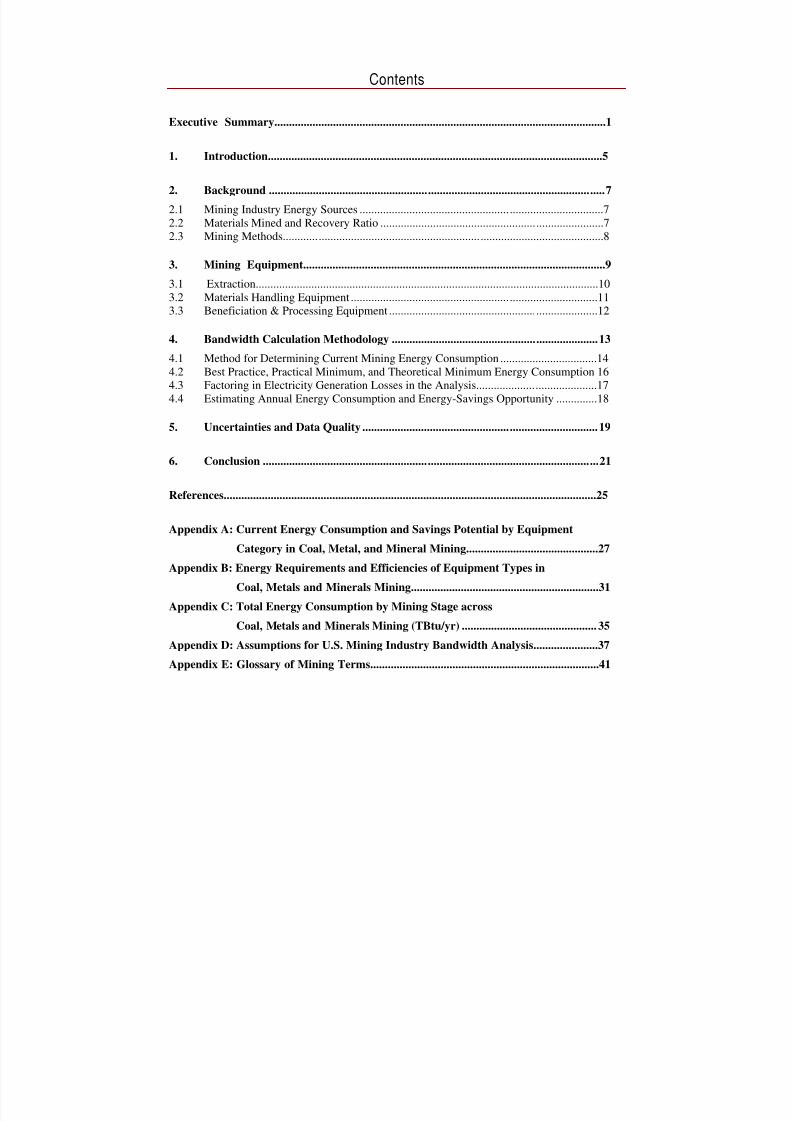
Mining Energy Bandwidth Analysis Process and Technology Scope
Ex loration
Extraction
Blasting
DewateringDrilling Digging
Ventilation
Materials Handling
ElectricDiesel
Beneficiation & ProcessingSeparationsGrindingCrushing
Finished Product
7/30/2019 Mining Industry Energy Bandwidth
http://slidepdf.com/reader/full/mining-industry-energy-bandwidth 5/47
Executive Summary
The Industrial Technologies Program (ITP) in the U.S. Department of Energy’s (DOE) Office of Energy Efficiency and Renewable Energy (EERE) works with the U.S. industry to reduce its
energy consumption and environmental impact nationwide. ITP relies on analytical studies toidentify large energy reduction opportunities in energy-intensive industries and uses these resultsto guide its R&D portfolio.
One facet of energy analysis includes energy bandwidth studies which focus on a particularindustry and analyze the energy-saving potential of key processes in that industry. The energybandwidth, determined from these studies, illustrates the total energy-saving opportunity thatexists in the industry if the current processes are improved by implementing more energy-efficient practices and by using advanced technologies.
This bandwidth analysis report was conducted to assist the ITP Mining R&D program in
identifying energy-saving opportunities in coal, metals, and mineral mining. These opportunitieswere analyzed in key mining processes of blasting, dewatering, drilling, digging, ventilation,materials handling, crushing, grinding, and separations.1
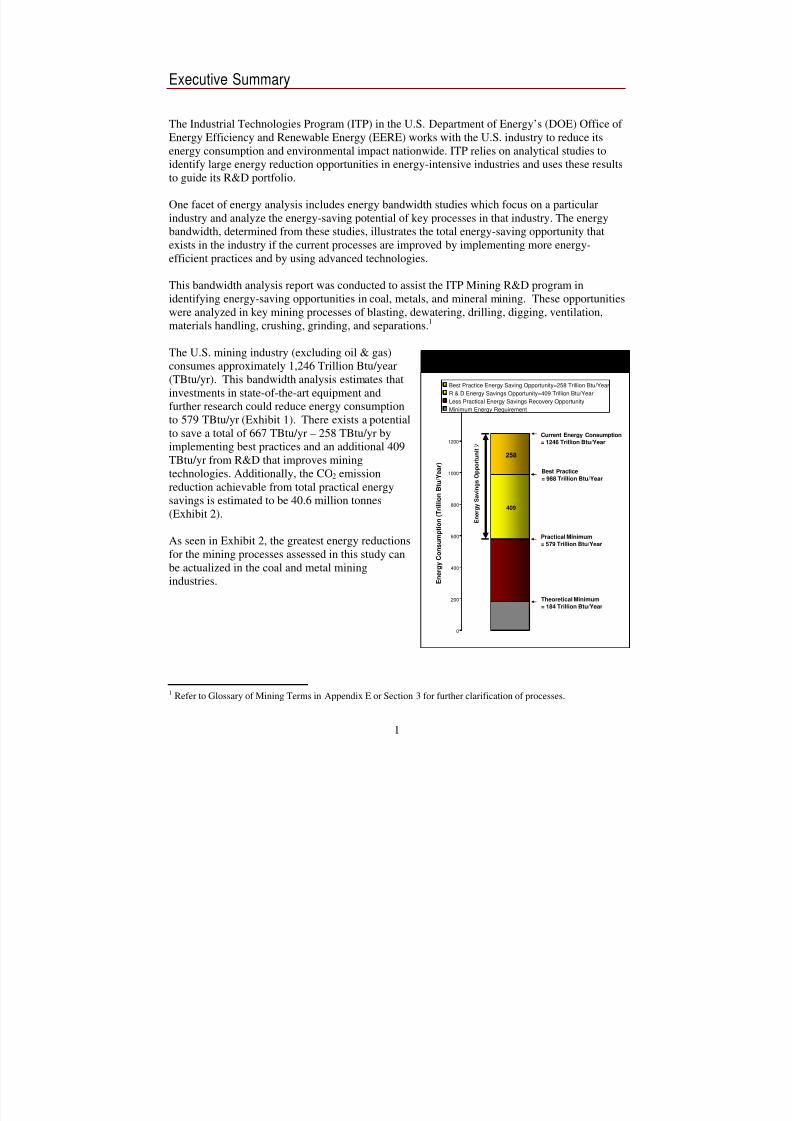
The U.S. mining industry (excluding oil & gas)consumes approximately 1,246 Trillion Btu/year(TBtu/yr). This bandwidth analysis estimates thatinvestments in state-of-the-art equipment andfurther research could reduce energy consumptionto 579 TBtu/yr (Exhibit 1). There exists a potentialto save a total of 667 TBtu/yr – 258 TBtu/yr by
implementing best practices and an additional 409TBtu/yr from R&D that improves miningtechnologies. Additionally, the CO2 emissionreduction achievable from total practical energysavings is estimated to be 40.6 million tonnes(Exhibit 2).
Exhibit 1. U.S. Mining Industry EnergyBandwidth
409
258
0
200
400
600
800
1000
1200
1400
E n e r g y C o n s u m p t i o n ( T r i l l i o n B t u / Y e a r )
Best Practice Energy Saving Opportunity=258 Trillion Btu/Year
R & D Energy Savings Opportunity=409 Trillion Btu/Year
Less Practical Energy Savings Recovery Opportunity
Minimum Energy Requirement
Current Energy Consumption
= 1246 Trillion Btu/Year
Theoretical Minimum
= 184 Trillion Btu/Year
Best Practice
= 988 Trillion Btu/Year
Practical Minimum
= 579 Trillion Btu/Year
E n e r g y S a v i n g s O p p o r t u n i t
As seen in Exhibit 2, the greatest energy reductionsfor the mining processes assessed in this study canbe actualized in the coal and metal miningindustries.
1 Refer to Glossary of Mining Terms in Appendix E or Section 3 for further clarification of processes.
1
7/30/2019 Mining Industry Energy Bandwidth
http://slidepdf.com/reader/full/mining-industry-energy-bandwidth 6/47
Exhibit 2. Energy Savings Opportunity by Commodity Type (TBtu/yr)CurrentEnergy
Consumption
Energy Savingsfrom R&DImproving
EnergyEfficiency
Energy Savingsfrom
Implementing
Best Practices
TotalPracticalEnergy
Savings
CO2 Reductionfrom Total
Practical Energy
Savings(million tonnes)*
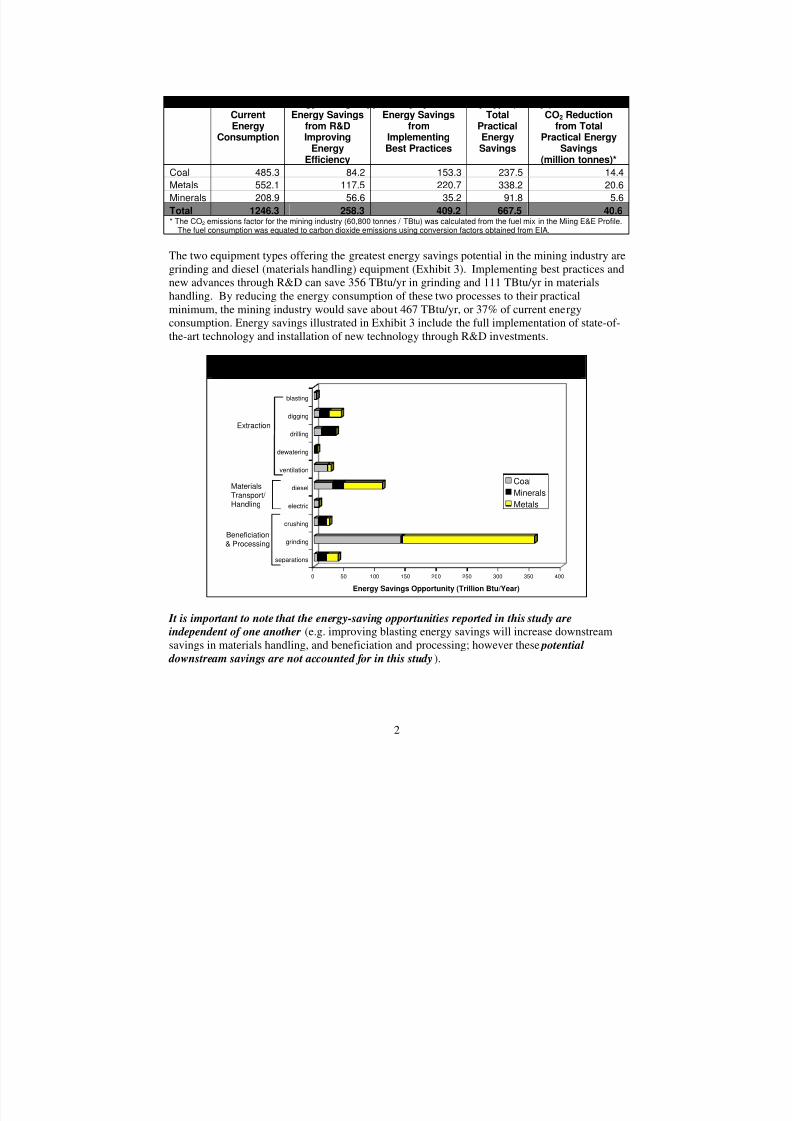
Coal 485.3 84.2 153.3 237.5 14.4
Metals 552.1 117.5 220.7 338.2 20.6
Minerals 208.9 56.6 35.2 91.8 5.6
Total 1246.3 258.3 409.2 667.5 40.6* The CO2 emissions factor for the mining industry (60,800 tonnes / TBtu) was calculated from the fuel mix in the Miing E&E Profile.
The fuel consumption was equated to carbon dioxide emissions using conversion factors obtained from EIA.
The two equipment types offering the greatest energy savings potential in the mining industry aregrinding and diesel (materials handling) equipment (Exhibit 3). Implementing best practices andnew advances through R&D can save 356 TBtu/yr in grinding and 111 TBtu/yr in materials
handling. By reducing the energy consumption of these two processes to their practicalminimum, the mining industry would save about 467 TBtu/yr, or 37% of current energyconsumption. Energy savings illustrated in Exhibit 3 include the full implementation of state-of-the-art technology and installation of new technology through R&D investments.
Exhibit 3. Energy-Saving Opportunity in U.S. Mining Industry for Top 10Energy-Intensive Processes
0 50 100 150 200 250 300 350 400
Energy Savings Opportunity (Trillion Btu/Year)
separations
grinding
crushing
electric
diesel
ventilation
dewatering
drilling
digging
blasting
Coal
Minerals
Metals
Extraction
MaterialsTransport/ Handling
Beneficiation& Processing
It is important to note that the energy-saving opportunities reported in this study areindependent of one another (e.g. improving blasting energy savings will increase downstreamsavings in materials handling, and beneficiation and processing; however these potential downstream savings are not accounted for in this study).
2
7/30/2019 Mining Industry Energy Bandwidth
http://slidepdf.com/reader/full/mining-industry-energy-bandwidth 7/47
Methodology The bandwidth analysis relies on estimating the following quantities:
• Current Energy Consumption – The average energy consumption for performing a givenprocess
• Best Practice Energy Consumption – The energy consumed by mine sites with above-average energy efficiency
• Practical Minimum Energy Consumption – The energy that would be required after R&Dachieves substantial improvements in the energy efficiency of mining processes
• Theoretical Minimum Energy Consumption – The energy required to complete a givenprocess, assuming it could be accomplished without any energy losses
The difference between current energy consumption and best practice consumption correspondsto energy-saving opportunities from investments made in state-of-the-art technologies oropportunity existing today which has not been fully implemented in mine operations. Thedifference between best practice and practical minimum energy consumption quantifies
opportunities for research and development or near-term opportunity with few barriers toachieving it. Finally, the difference between the practical and theoretical minimum energyconsumption refers to the energy recovery opportunity which is considered impractical toachieve because it is a long-term opportunity with major barriers or is infeasible.
This analysis uses data on the current energy requirements for mining equipment used in keyprocesses based on calculations from the SHERPA modeling software2 and published equipmentefficiency values. However, no single value for the theoretical minimum energy requirement formining could be sourced, even for a specific mining commodity, because of the wide variabilityin mining process requirements. The mining process is unique in that unlike most industrialprocesses, the starting raw materials and conditions for production vary widely, sometimes by
more than an order of magnitude, in energy intensity (Btu/ton produced). Therefore, an averagetheoretical value was approximated by evaluating the average performance efficiency of miningequipment. Practical minimum energy requirements represent a value between the theoreticaland best practice performance of mining equipment. The best practice value can be benchmarkedat a specific point in time; however, the practical minimum energy levels are a moving targetsince today’s estimates of practical machine efficiencies are not absolute and may be surpassedvia improvement in science and technology over time. For several mining processes, estimatesof practical limits were based on literature approximating the maximum efficiency of equipmenttypes. When practical efficiency estimates were unavailable, the analysis assumed the practicalminimum to be two-thirds of the way from the best practice energy consumption to thetheoretical minimum energy consumption.3
To reflect more inclusive energy savings, the bandwidth analysis used tacit energy values of electrical energy consumption (i.e., generation and distribution losses are factored in addition to
2 Western Engineering, Inc. – SHERPA Software - software used by the mining industry to model mining operationsand estimate capital, energy, labor and other costs of production.
3 Practical Min = Best Practice - (Best Practice - Theoretical Min)* 2/3 (see page 17)
3

7/30/2019 Mining Industry Energy Bandwidth
http://slidepdf.com/reader/full/mining-industry-energy-bandwidth 8/47
onsite electrical consumption). Including generation and distribution losses in bandwidthestimates is essential as saving 1 Btu of onsite electricity translates to a total savings of over 3.17Btu using current data (EIA 2006). The practical minimum values were adjusted to reflect 2020electrical distribution systems, where the ratio of offsite to onsite electricity consumption isassumed to be 3.05 (EIA 2006). Theoretical values, however, assume zero electrical losses.
4
7/30/2019 Mining Industry Energy Bandwidth
http://slidepdf.com/reader/full/mining-industry-energy-bandwidth 9/47
1. Introduction
The U.S. mining industry provides essential raw materials like coal, metals, minerals, sand, andgravel to the nation’s manufacturing and construction industries, utilities and other businesses.
Nearly 24 tons of material are consumed annually per capita in the United States; 4 further,common consumer products can use a vast variety of mined materials, for example, a telephoneis manufactured from as many as 42 different mined materials, including aluminum, beryllium,coal, copper, gold, iron, limestone, and silica. Mining these materials consumes significantenergy – in 2002, the mining industry spent $3.2 billion on energy, or 21% of the total cost of itssupplies (not including labor).5 Given the large role mining industry plays in the U.S. economyand the energy intensity of the mining processes, tapping into the potential for energy savingsacross different mined commodities could yield significant impact. The magnitude of thesepotential savings can be quantified using the energy bandwidth analysis – a method forestimating the opportunity in various processes based on their theoretical energy consumptionand the practical minimum energy use achievable by implementing R&D results and best
practices.
This mining industry energy bandwidth analysis was conducted to assist the IndustrialTechnologies Program’s (ITP) Mining subprogram, an initiative of the U.S. Department of Energy’s (DOE) Office of Energy Efficiency and Renewable Energy (EERE), to maximize theimpact of its R&D in reducing industrial energy consumption. Although the study focuses onequipment used in coal, metals, and industrial minerals mining, some results can also be appliedto the oil & gas exploration and production industries, since similar equipment is used in bothindustries.
This bandwidth study expands on the previous work conducted in Energy and Environmental
Profile of the U.S. Mining Industry ( E&E Profile), a study published by DOE in 2002 tobenchmark energy use for various mining technologies.6 It uses similar methods to estimate theaverage energy consumption of key equipment used in coal, metals, and mineral mining. Inabsence of energy data on many mined commodities in the U.S., the E&E Profile benchmarksenergy consumption for eight mined commodities, collectively responsible for approximately78% of the energy used in the U.S. mining industry. These commodities were used to define theaverage Btu/ton for coal, metals, and industrial minerals which was then proportioned against thetotal mined material for each sector in the mining industry to account for the remainder of themining industry.
Additionally, there is very little data available on U.S. mining industry for energy use by specific
mining process, equipment type or fuel type utilized. Thus the E&E Profile assumes a “typical”mine and uses data from a combination of sources including production data from federal and
4 National Mining Association. “Per capita consumption of minerals – 2006”. February 2007.http://www.nma.org/pdf/m_consumption.pdf
5 U.S. Department of Commerce, Bureau of Census, Mining Industry Series, 2002 (Supplies include mineralsreceived, purchased machinery installed, resales, purchased fuels consumed, purchased electric energy and contractwork.) This does not include withheld data.
6 U.S. Department of Energy. Energy and Environmental Profile of the U.S. Mining Industry. 2002.
5

7/30/2019 Mining Industry Energy Bandwidth
http://slidepdf.com/reader/full/mining-industry-energy-bandwidth 10/47
industry sources (Census of Mineral Industries). Estimates are based on the SHERPA Mine Cost
Estimating Model and Mine and Mill Equipment Costs, an Estimator’s Guide from WesternMine Engineering, Inc. to model the typical equipment required for various types of mineoperations (e.g. longwall mine, western surface mine, etc.) and the energy consumption of eachmajor equipment unit. The SHERPA software was used to identify the type and number of
equipment units optimally used in a hypothetical mine based on certain assumptions and inputs.The Estimator’s Guide identified the energy cost for particular equipment types, which isdetermined by annual surveys of U.S. equipment manufacturers and distributors, fuel and energysuppliers, and mining companies. This model and equipment cost guide served the need toestablish and manipulate baseline assumptions and inputs in order to develop hypothetical minesdeemed reasonable by industry experts.
While the E&E Profile provides detailed data for the estimated energy consumption of eachpiece of equipment required in a typical mine, this report focuses on the average energyconsumption of similar equipment types to estimate the potential for energy savings for a givenprocess. Similar equipment was grouped into the following categories based on their process
use: blasting, dewatering, drilling, digging, ventilation, materials handling, crushing, grinding,and separations. Thus the analysis in this report identifies the equipment categories whichprovide the greatest opportunities for energy savings in the U.S. mining industry.
6
7/30/2019 Mining Industry Energy Bandwidth
http://slidepdf.com/reader/full/mining-industry-energy-bandwidth 11/47
2. Background
2.1 Mining Industry Energy Sources
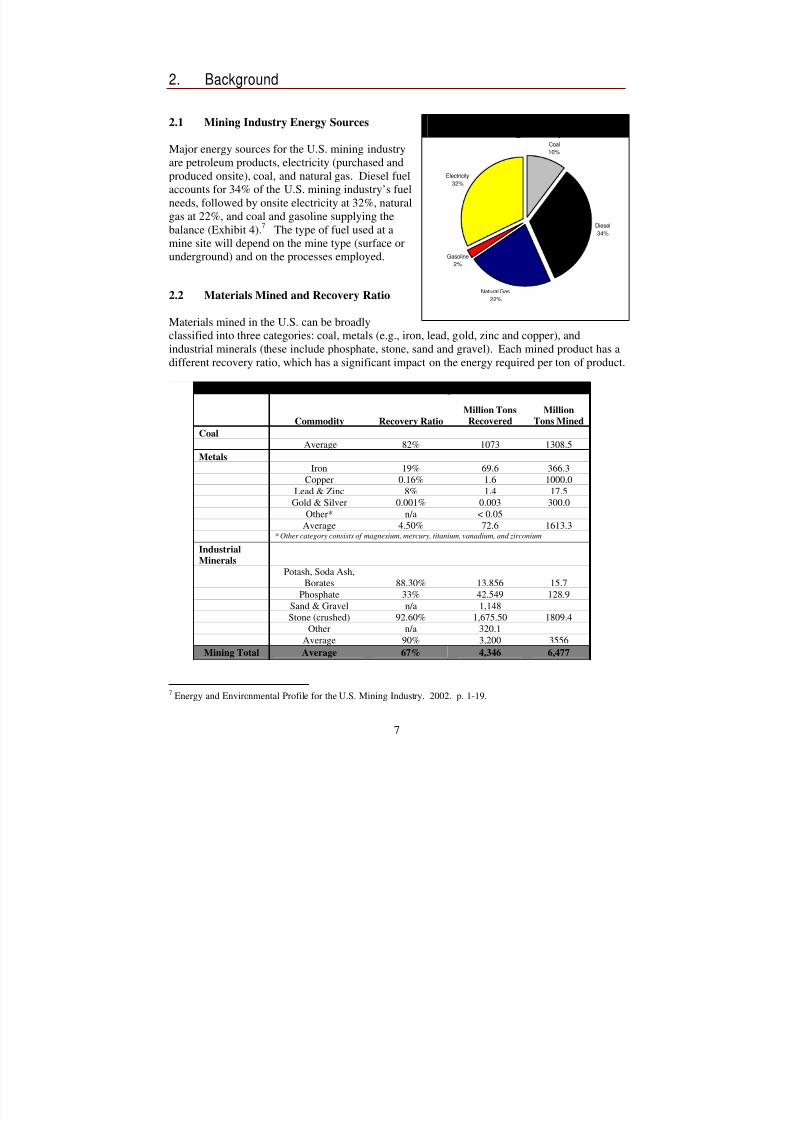
Major energy sources for the U.S. mining industryare petroleum products, electricity (purchased andproduced onsite), coal, and natural gas. Diesel fuelaccounts for 34% of the U.S. mining industry’s fuelneeds, followed by onsite electricity at 32%, naturalgas at 22%, and coal and gasoline supplying thebalance (Exhibit 4).
7The type of fuel used at a
mine site will depend on the mine type (surface orunderground) and on the processes employed.
2.2 Materials Mined and Recovery Ratio
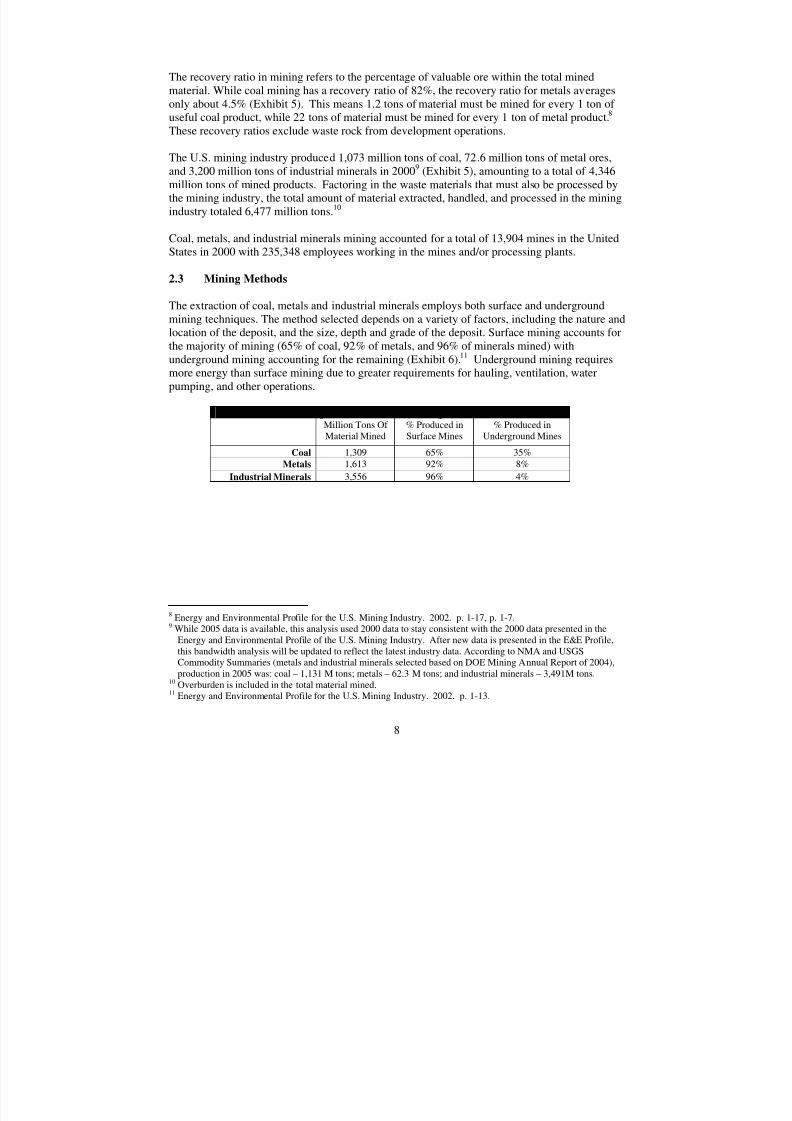
Materials mined in the U.S. can be broadlyclassified into three categories: coal, metals (e.g., iron, lead, gold, zinc and copper), andindustrial minerals (these include phosphate, stone, sand and gravel). Each mined product has adifferent recovery ratio, which has a significant impact on the energy required per ton of product.
Exhibit 4. Fuels Consumed in the U.S.Mining Industry
Coal
10%
Diesel
34%
Natural Gas
22%
Gasoline
2%
Electricity
32%
Exhibit 5. Mined Material Recovery in 2000
Commodity Recovery Ratio
Million Tons
Recovered
Million
Tons Mined
Coal
Average 82% 1073 1308.5Metals
Iron 19% 69.6 366.3Copper 0.16% 1.6 1000.0
Lead & Zinc 8% 1.4 17.5Gold & Silver 0.001% 0.003 300.0
Other* n/a < 0.05Average 4.50% 72.6 1613.3
* Other category consists of magnesium, mercury, titanium, vanadium, and zirconium
Industrial
Minerals
Potash, Soda Ash,Borates 88.30% 13.856 15.7
Phosphate 33% 42.549 128.9Sand & Gravel n/a 1,148Stone (crushed) 92.60% 1,675.50 1809.4
Other n/a 320.1Average 90% 3,200 3556
Mining Total Average 67% 4,346 6,477
7 Energy and Environmental Profile for the U.S. Mining Industry. 2002. p. 1-19.
7
7/30/2019 Mining Industry Energy Bandwidth
http://slidepdf.com/reader/full/mining-industry-energy-bandwidth 12/47
The recovery ratio in mining refers to the percentage of valuable ore within the total minedmaterial. While coal mining has a recovery ratio of 82%, the recovery ratio for metals averagesonly about 4.5% (Exhibit 5). This means 1.2 tons of material must be mined for every 1 ton of useful coal product, while 22 tons of material must be mined for every 1 ton of metal product.8 These recovery ratios exclude waste rock from development operations.
The U.S. mining industry produced 1,073 million tons of coal, 72.6 million tons of metal ores,and 3,200 million tons of industrial minerals in 20009 (Exhibit 5), amounting to a total of 4,346million tons of mined products. Factoring in the waste materials that must also be processed bythe mining industry, the total amount of material extracted, handled, and processed in the miningindustry totaled 6,477 million tons.10
Coal, metals, and industrial minerals mining accounted for a total of 13,904 mines in the UnitedStates in 2000 with 235,348 employees working in the mines and/or processing plants.
2.3 Mining Methods
The extraction of coal, metals and industrial minerals employs both surface and undergroundmining techniques. The method selected depends on a variety of factors, including the nature andlocation of the deposit, and the size, depth and grade of the deposit. Surface mining accounts forthe majority of mining (65% of coal, 92% of metals, and 96% of minerals mined) withunderground mining accounting for the remaining (Exhibit 6).11 Underground mining requiresmore energy than surface mining due to greater requirements for hauling, ventilation, waterpumping, and other operations.
Exhibit 6. Underground and Surface Mining in the United StatesMillion Tons Of Material Mined
% Produced inSurface Mines
% Produced inUnderground Mines
Coal 1,309 65% 35%
Metals 1,613 92% 8%
Industrial Minerals 3,556 96% 4%
8 Energy and Environmental Profile for the U.S. Mining Industry. 2002. p. 1-17, p. 1-7.9 While 2005 data is available, this analysis used 2000 data to stay consistent with the 2000 data presented in the
Energy and Environmental Profile of the U.S. Mining Industry. After new data is presented in the E&E Profile,this bandwidth analysis will be updated to reflect the latest industry data. According to NMA and USGSCommodity Summaries (metals and industrial minerals selected based on DOE Mining Annual Report of 2004),production in 2005 was: coal – 1,131 M tons; metals – 62.3 M tons; and industrial minerals – 3,491M tons.
10 Overburden is included in the total material mined.11 Energy and Environmental Profile for the U.S. Mining Industry. 2002. p. 1-13.
8
7/30/2019 Mining Industry Energy Bandwidth
http://slidepdf.com/reader/full/mining-industry-energy-bandwidth 13/47
3. Mining Equipment
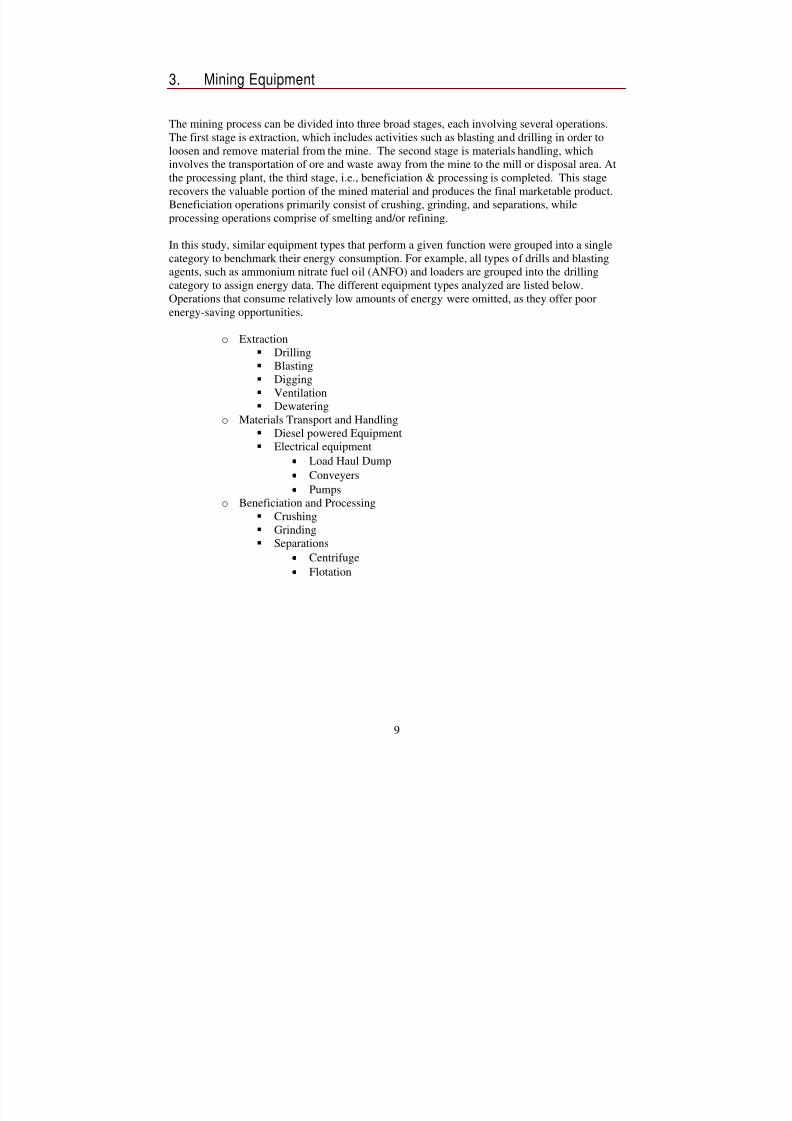
The mining process can be divided into three broad stages, each involving several operations.The first stage is extraction, which includes activities such as blasting and drilling in order to
loosen and remove material from the mine. The second stage is materials handling, whichinvolves the transportation of ore and waste away from the mine to the mill or disposal area. Atthe processing plant, the third stage, i.e., beneficiation & processing is completed. This stagerecovers the valuable portion of the mined material and produces the final marketable product.Beneficiation operations primarily consist of crushing, grinding, and separations, whileprocessing operations comprise of smelting and/or refining.
In this study, similar equipment types that perform a given function were grouped into a singlecategory to benchmark their energy consumption. For example, all types of drills and blastingagents, such as ammonium nitrate fuel oil (ANFO) and loaders are grouped into the drillingcategory to assign energy data. The different equipment types analyzed are listed below.
Operations that consume relatively low amounts of energy were omitted, as they offer poorenergy-saving opportunities.
o Extraction Drilling Blasting Digging Ventilation Dewatering
o Materials Transport and Handling Diesel powered Equipment
Electrical equipment• Load Haul Dump
• Conveyers
• Pumpso Beneficiation and Processing
Crushing Grinding Separations
• Centrifuge
• Flotation
9
7/30/2019 Mining Industry Energy Bandwidth
http://slidepdf.com/reader/full/mining-industry-energy-bandwidth 14/47
3.1 Extraction
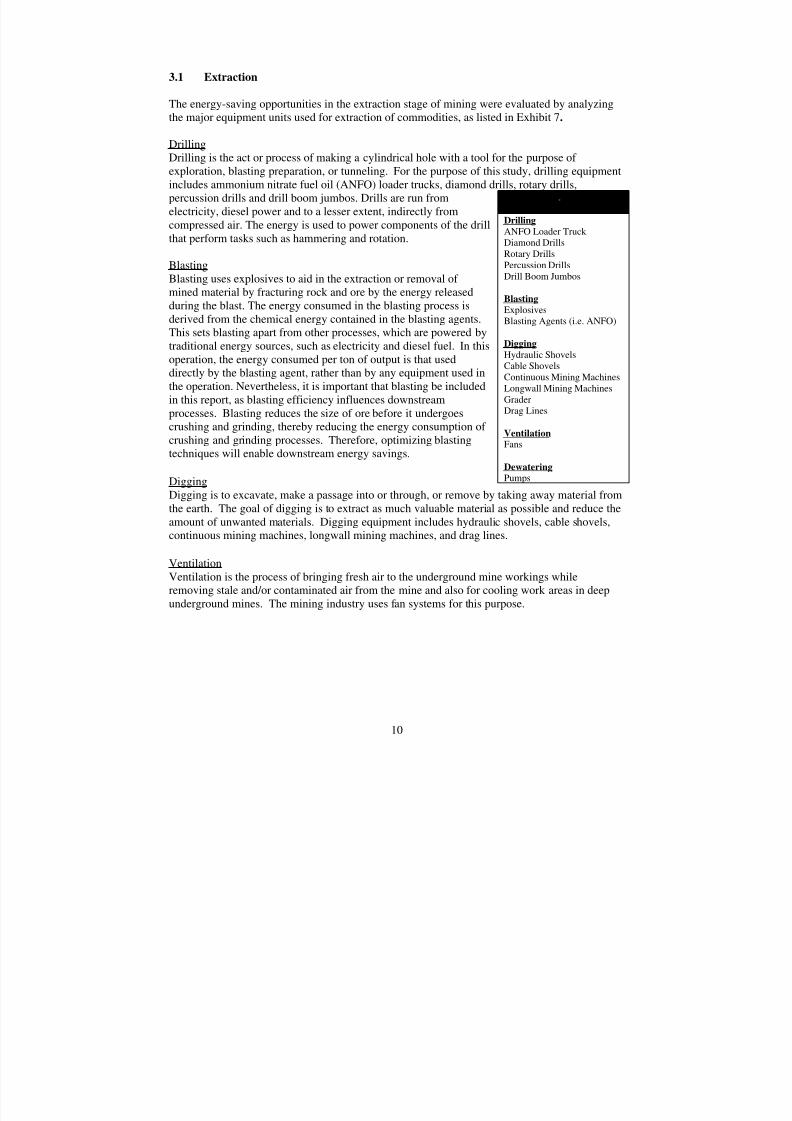
The energy-saving opportunities in the extraction stage of mining were evaluated by analyzingthe major equipment units used for extraction of commodities, as listed in Exhibit 7 .
DrillingDrilling is the act or process of making a cylindrical hole with a tool for the purpose of exploration, blasting preparation, or tunneling. For the purpose of this study, drilling equipmentincludes ammonium nitrate fuel oil (ANFO) loader trucks, diamond drills, rotary drills,percussion drills and drill boom jumbos. Drills are run fromelectricity, diesel power and to a lesser extent, indirectly fromcompressed air. The energy is used to power components of the drillthat perform tasks such as hammering and rotation.
Exhibit 7. ExtractionEquipment
Drilling
ANFO Loader Truck Diamond DrillsRotary DrillsPercussion DrillsDrill Boom Jumbos
BlastingExplosivesBlasting Agents (i.e. ANFO)
Digging
Hydraulic ShovelsCable ShovelsContinuous Mining MachinesLongwall Mining MachinesGraderDrag Lines
Ventilation
Fans
DewateringPumps
BlastingBlasting uses explosives to aid in the extraction or removal of
mined material by fracturing rock and ore by the energy releasedduring the blast. The energy consumed in the blasting process isderived from the chemical energy contained in the blasting agents.This sets blasting apart from other processes, which are powered bytraditional energy sources, such as electricity and diesel fuel. In thisoperation, the energy consumed per ton of output is that useddirectly by the blasting agent, rather than by any equipment used inthe operation. Nevertheless, it is important that blasting be includedin this report, as blasting efficiency influences downstreamprocesses. Blasting reduces the size of ore before it undergoescrushing and grinding, thereby reducing the energy consumption of crushing and grinding processes. Therefore, optimizing blastingtechniques will enable downstream energy savings.
DiggingDigging is to excavate, make a passage into or through, or remove by taking away material fromthe earth. The goal of digging is to extract as much valuable material as possible and reduce theamount of unwanted materials. Digging equipment includes hydraulic shovels, cable shovels,continuous mining machines, longwall mining machines, and drag lines.
VentilationVentilation is the process of bringing fresh air to the underground mine workings while
removing stale and/or contaminated air from the mine and also for cooling work areas in deepunderground mines. The mining industry uses fan systems for this purpose.
10
7/30/2019 Mining Industry Energy Bandwidth
http://slidepdf.com/reader/full/mining-industry-energy-bandwidth 15/47
DewateringDewatering is the process of pumping water from the mine workings. Pumping systems arelarge energy consumers. This study assumes end-suction pumps (i.e. centrifugal) as the onlyequipment used for dewatering the mine during extraction.12
3.2 Materials Handling Equipment
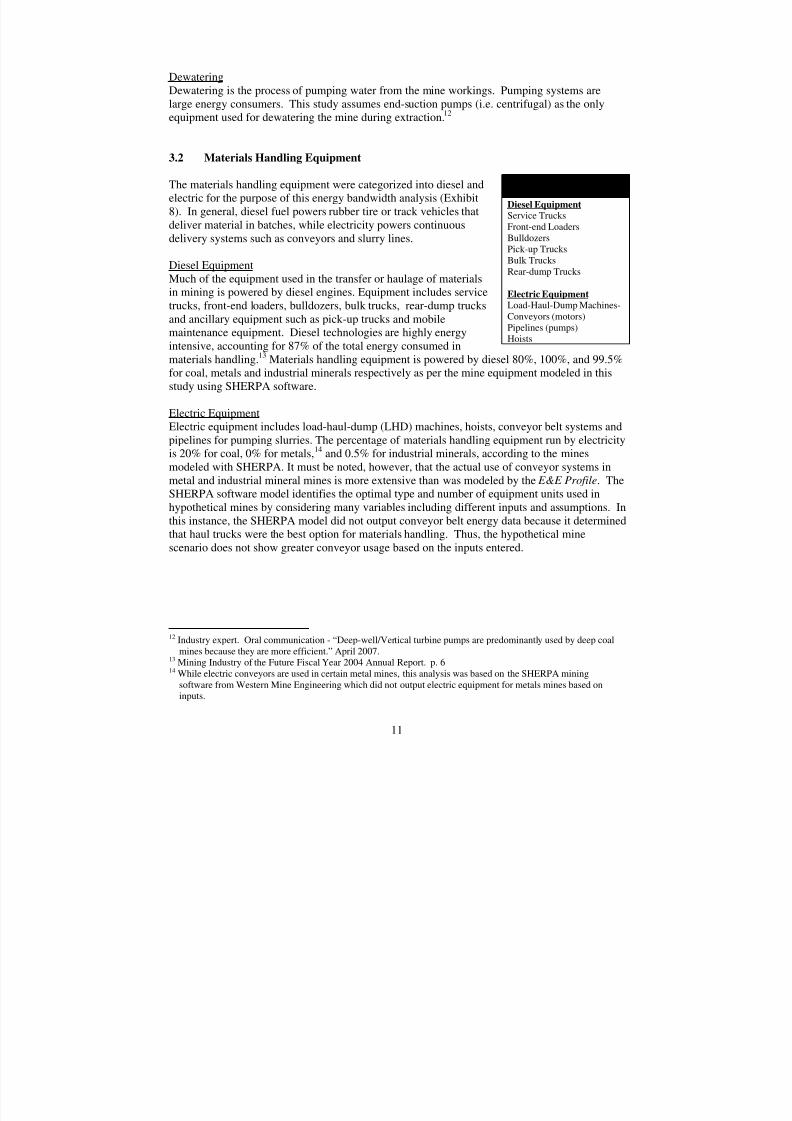
The materials handling equipment were categorized into diesel andelectric for the purpose of this energy bandwidth analysis (Exhibit8). In general, diesel fuel powers rubber tire or track vehicles thatdeliver material in batches, while electricity powers continuousdelivery systems such as conveyors and slurry lines.
Diesel EquipmentMuch of the equipment used in the transfer or haulage of materials
in mining is powered by diesel engines. Equipment includes servicetrucks, front-end loaders, bulldozers, bulk trucks, rear-dump trucksand ancillary equipment such as pick-up trucks and mobilemaintenance equipment. Diesel technologies are highly energyintensive, accounting for 87% of the total energy consumed inmaterials handling.13 Materials handling equipment is powered by diesel 80%, 100%, and 99.5%for coal, metals and industrial minerals respectively as per the mine equipment modeled in thisstudy using SHERPA software.
Exhibit 8. MaterialsHandling Equipment
Diesel EquipmentService TrucksFront-end LoadersBulldozersPick-up TrucksBulk TrucksRear-dump Trucks
Electric EquipmentLoad-Haul-Dump Machines-Conveyors (motors)Pipelines (pumps)Hoists
Electric EquipmentElectric equipment includes load-haul-dump (LHD) machines, hoists, conveyor belt systems andpipelines for pumping slurries. The percentage of materials handling equipment run by electricityis 20% for coal, 0% for metals,14 and 0.5% for industrial minerals, according to the minesmodeled with SHERPA. It must be noted, however, that the actual use of conveyor systems inmetal and industrial mineral mines is more extensive than was modeled by the E&E Profile. TheSHERPA software model identifies the optimal type and number of equipment units used inhypothetical mines by considering many variables including different inputs and assumptions. Inthis instance, the SHERPA model did not output conveyor belt energy data because it determinedthat haul trucks were the best option for materials handling. Thus, the hypothetical minescenario does not show greater conveyor usage based on the inputs entered.
12 Industry expert. Oral communication - “Deep-well/Vertical turbine pumps are predominantly used by deep coalmines because they are more efficient.” April 2007.
13 Mining Industry of the Future Fiscal Year 2004 Annual Report. p. 614 While electric conveyors are used in certain metal mines, this analysis was based on the SHERPA mining
software from Western Mine Engineering which did not output electric equipment for metals mines based oninputs.
11
7/30/2019 Mining Industry Energy Bandwidth
http://slidepdf.com/reader/full/mining-industry-energy-bandwidth 16/47
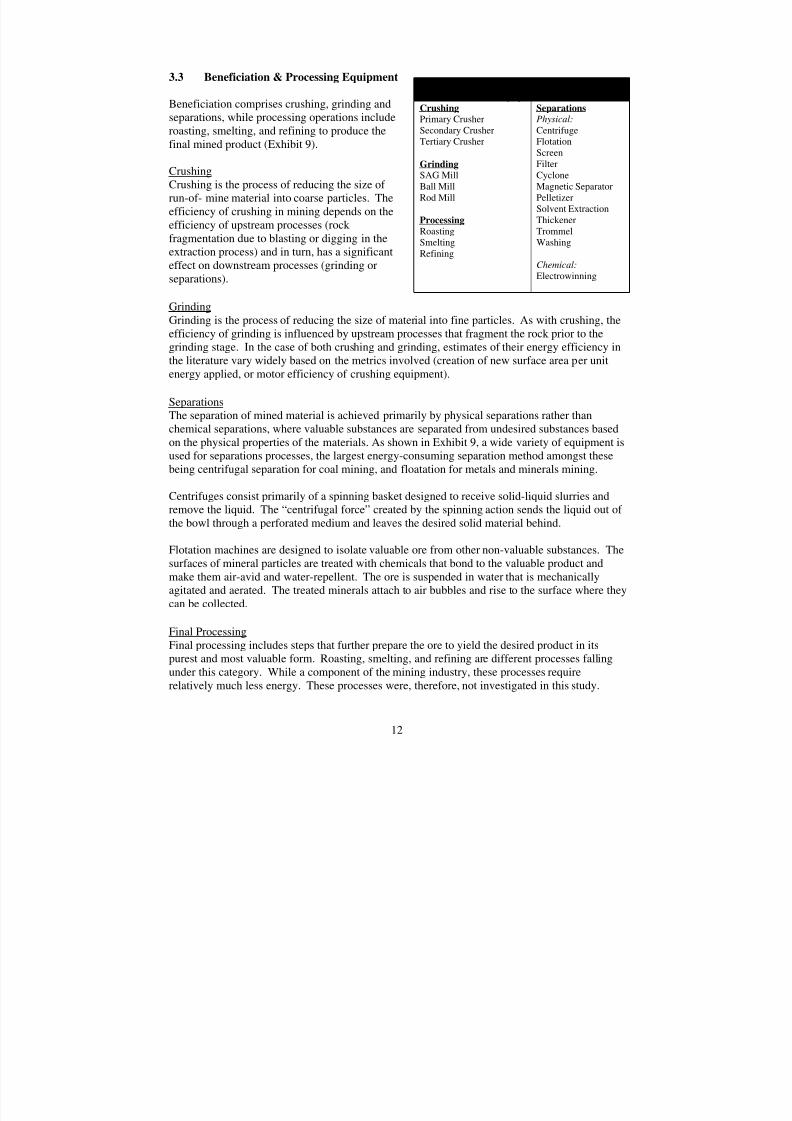
3.3 Beneficiation & Processing EquipmentExhibit 9. Beneficiation and Processing
EquipmentCrushingPrimary CrusherSecondary CrusherTertiary Crusher
GrindingSAG MillBall MillRod Mill
Processing
RoastingSmeltingRefining
SeparationsPhysical:
CentrifugeFlotationScreenFilterCycloneMagnetic SeparatorPelletizerSolvent ExtractionThickenerTrommelWashing
Chemical:
Electrowinning
Beneficiation comprises crushing, grinding andseparations, while processing operations includeroasting, smelting, and refining to produce the
final mined product (Exhibit 9).
CrushingCrushing is the process of reducing the size of run-of- mine material into coarse particles. Theefficiency of crushing in mining depends on theefficiency of upstream processes (rock fragmentation due to blasting or digging in theextraction process) and in turn, has a significanteffect on downstream processes (grinding orseparations).
GrindingGrinding is the process of reducing the size of material into fine particles. As with crushing, theefficiency of grinding is influenced by upstream processes that fragment the rock prior to thegrinding stage. In the case of both crushing and grinding, estimates of their energy efficiency inthe literature vary widely based on the metrics involved (creation of new surface area per unitenergy applied, or motor efficiency of crushing equipment).
SeparationsThe separation of mined material is achieved primarily by physical separations rather thanchemical separations, where valuable substances are separated from undesired substances based
on the physical properties of the materials. As shown in Exhibit 9, a wide variety of equipment isused for separations processes, the largest energy-consuming separation method amongst thesebeing centrifugal separation for coal mining, and floatation for metals and minerals mining.
Centrifuges consist primarily of a spinning basket designed to receive solid-liquid slurries andremove the liquid. The “centrifugal force” created by the spinning action sends the liquid out of the bowl through a perforated medium and leaves the desired solid material behind.
Flotation machines are designed to isolate valuable ore from other non-valuable substances. Thesurfaces of mineral particles are treated with chemicals that bond to the valuable product andmake them air-avid and water-repellent. The ore is suspended in water that is mechanically
agitated and aerated. The treated minerals attach to air bubbles and rise to the surface where theycan be collected.
Final ProcessingFinal processing includes steps that further prepare the ore to yield the desired product in itspurest and most valuable form. Roasting, smelting, and refining are different processes fallingunder this category. While a component of the mining industry, these processes requirerelatively much less energy. These processes were, therefore, not investigated in this study.
12
7/30/2019 Mining Industry Energy Bandwidth
http://slidepdf.com/reader/full/mining-industry-energy-bandwidth 17/47
4. Bandwidth Calculation Methodology
This bandwidth study estimates the achievable energy savings for different commodity groups –coal, metals and industrial minerals. The analysis examines energy-saving opportunities in
common processes rather than opportunities for operational improvement (e.g., using moreefficient fans rather than more efficient fan utilization, or improving diesel engines rather thanimproving routing for diesel equipment).
Mining process equipment was analyzed according to three main stages: extraction, materialstransport and handling, and beneficiation and processing (section 3). Similar equipment units thatperform a given function were grouped into a single category to benchmark their energyconsumption. See section 3, Mining Equipment (page 9) for equipments analyzed.
For each equipment type, the current energy consumption, best practice energy consumption,practical minimum, and theoretical minimum energy consumption were estimated.
• Current Energy Consumption – The actual average energy consumption forperforming a given process
• Best Practice Energy Consumption – The energy consumed by mining sites withabove average energy efficiency
• Practical Minimum Energy Consumption – The energy that would be required afterR&D achieves substantial improvements in the energy efficiency of the miningtechnology
• Theoretical Minimum Energy Consumption – The energy required to complete agiven process, assuming it could be accomplished without any energy losses
The energy-savings opportunity is calculated as the difference between the current energyconsumption and the practical minimum energy consumption, assuming that mining productionrates remain constant.
Energy Savings Potential = Current Energy Consumption – Practical Minimum Energy Required
The bandwidth analysis is based on energy data on eight mined commodities that in sum accountfor 78% of the total energy use by the U.S. mining industry. The eight commodities are coal;potash, soda ash and borate; iron; copper; lead and zinc; gold and silver; phosphate rock; andlimestone. These commodities were used to define the average Btu/ton for coal, metals, andindustrial minerals which was then proportioned against the total mined material for each sector
in the mining industry to account for the remainder of the mining industry.
Values are reported in Btu/ton of material handled, as well as Btu/yr consumption. Quantifyingthe above measures of energy consumption for each equipment type enabled an estimate of theentire mining industry’s current energy consumption and potential for energy reduction. It alsoidentified the equipment types that would provide the greatest opportunity for energy reductionin mining operations.
13
7/30/2019 Mining Industry Energy Bandwidth
http://slidepdf.com/reader/full/mining-industry-energy-bandwidth 18/47
4.1 Method for Determining Current Mining Energy Consumption
This study estimates current energy consumption relying on the same data sources andassumptions as used in the E&E Profile.
15 The E&E Profile used the SHERPA Mine Cost
Estimating Model along with Mine and Mill Equipment Costs, an Estimator’s Guide fromWestern Mine Engineering, Inc. The SHERPA software was used to model several minesdiffering by ore type, mining technique, and production rate. For each mine, the energyconsumption (Btu/ton) of key processes (drilling, digging etc.) was calculated. These valueswere then used to determine the average energy consumption of key processes in coal, metal, andmineral mining.
Step 1: Determine equipment energy requirements for individual model mines
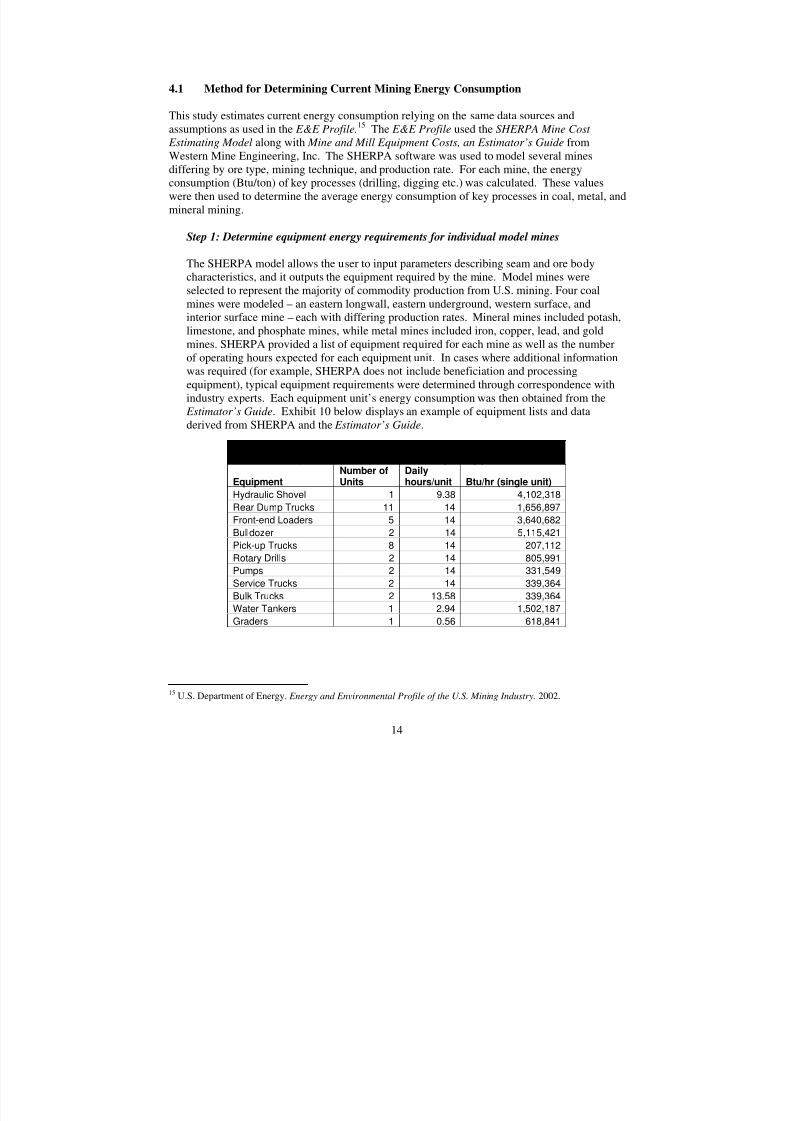
The SHERPA model allows the user to input parameters describing seam and ore bodycharacteristics, and it outputs the equipment required by the mine. Model mines wereselected to represent the majority of commodity production from U.S. mining. Four coalmines were modeled – an eastern longwall, eastern underground, western surface, andinterior surface mine – each with differing production rates. Mineral mines included potash,limestone, and phosphate mines, while metal mines included iron, copper, lead, and goldmines. SHERPA provided a list of equipment required for each mine as well as the numberof operating hours expected for each equipment unit. In cases where additional informationwas required (for example, SHERPA does not include beneficiation and processingequipment), typical equipment requirements were determined through correspondence withindustry experts. Each equipment unit’s energy consumption was then obtained from the Estimator’s Guide. Exhibit 10 below displays an example of equipment lists and dataderived from SHERPA and the Estimator’s Guide.
Exhibit 10. Extraction and Materials Handling Equipment for AssumedInterior (Coal) Surface Mine (9,967 tons per day produced)
EquipmentNumber ofUnits
Dailyhours/unit Btu/hr (single unit)
Hydraulic Shovel 1 9.38 4,102,318
Rear Dump Trucks 11 14 1,656,897
Front-end Loaders 5 14 3,640,682
Bulldozer 2 14 5,115,421
Pick-up Trucks 8 14 207,112
Rotary Drills 2 14 805,991
Pumps 2 14 331,549
Service Trucks 2 14 339,364
Bulk Trucks 2 13.58 339,364Water Tankers 1 2.94 1,502,187
Graders 1 0.56 618,841
15 U.S. Department of Energy. Energy and Environmental Profile of the U.S. Mining Industry. 2002.
14
7/30/2019 Mining Industry Energy Bandwidth
http://slidepdf.com/reader/full/mining-industry-energy-bandwidth 19/47
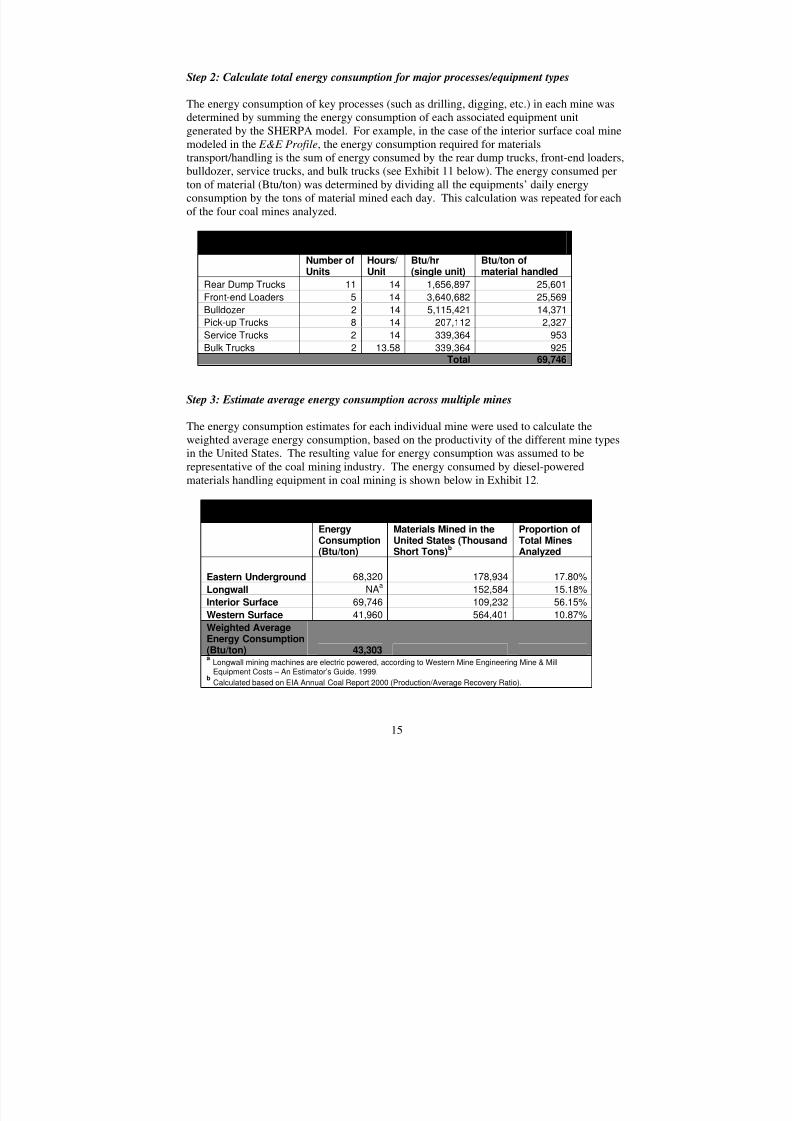
Step 2: Calculate total energy consumption for major processes/equipment types
The energy consumption of key processes (such as drilling, digging, etc.) in each mine wasdetermined by summing the energy consumption of each associated equipment unitgenerated by the SHERPA model. For example, in the case of the interior surface coal mine
modeled in the E&E Profile, the energy consumption required for materialstransport/handling is the sum of energy consumed by the rear dump trucks, front-end loaders,bulldozer, service trucks, and bulk trucks (see Exhibit 11 below). The energy consumed perton of material (Btu/ton) was determined by dividing all the equipments’ daily energyconsumption by the tons of material mined each day. This calculation was repeated for eachof the four coal mines analyzed.
Exhibit 11. Diesel-Powered Materials Handling Equipment for AssumedInterior (Coal) Surface Mine (9,967 tons per day produced)
Number ofUnits
Hours/Unit
Btu/hr(single unit)
Btu/ton ofmaterial handled
Rear Dump Trucks 11 14 1,656,897 25,601
Front-end Loaders 5 14 3,640,682 25,569Bulldozer 2 14 5,115,421 14,371
Pick-up Trucks 8 14 207,112 2,327
Service Trucks 2 14 339,364 953
Bulk Trucks 2 13.58 339,364 925
Total 69,746
Step 3: Estimate average energy consumption across multiple mines
The energy consumption estimates for each individual mine were used to calculate theweighted average energy consumption, based on the productivity of the different mine typesin the United States. The resulting value for energy consumption was assumed to berepresentative of the coal mining industry. The energy consumed by diesel-poweredmaterials handling equipment in coal mining is shown below in Exhibit 12.
Exhibit 12. Diesel-Powered Materials Handling Equipment:Average Energy Consumption for Coal Mines Modeled
EnergyConsumption(Btu/ton)
Materials Mined in theUnited States (ThousandShort Tons)
b
Proportion ofTotal MinesAnalyzed
Eastern Underground 68,320 178,934 17.80%
Longwall NAa
152,584 15.18%
Interior Surface 69,746 109,232 56.15%
Western Surface 41,960 564,401 10.87%
Weighted AverageEnergy Consumption(Btu/ton) 43,303a Longwall mining machines are electric powered, according to Western Mine Engineering Mine & MillEquipment Costs – An Estimator’s Guide. 1999.
b Calculated based on EIA Annual Coal Report 2000 (Production/Average Recovery Ratio).
15

7/30/2019 Mining Industry Energy Bandwidth
http://slidepdf.com/reader/full/mining-industry-energy-bandwidth 20/47
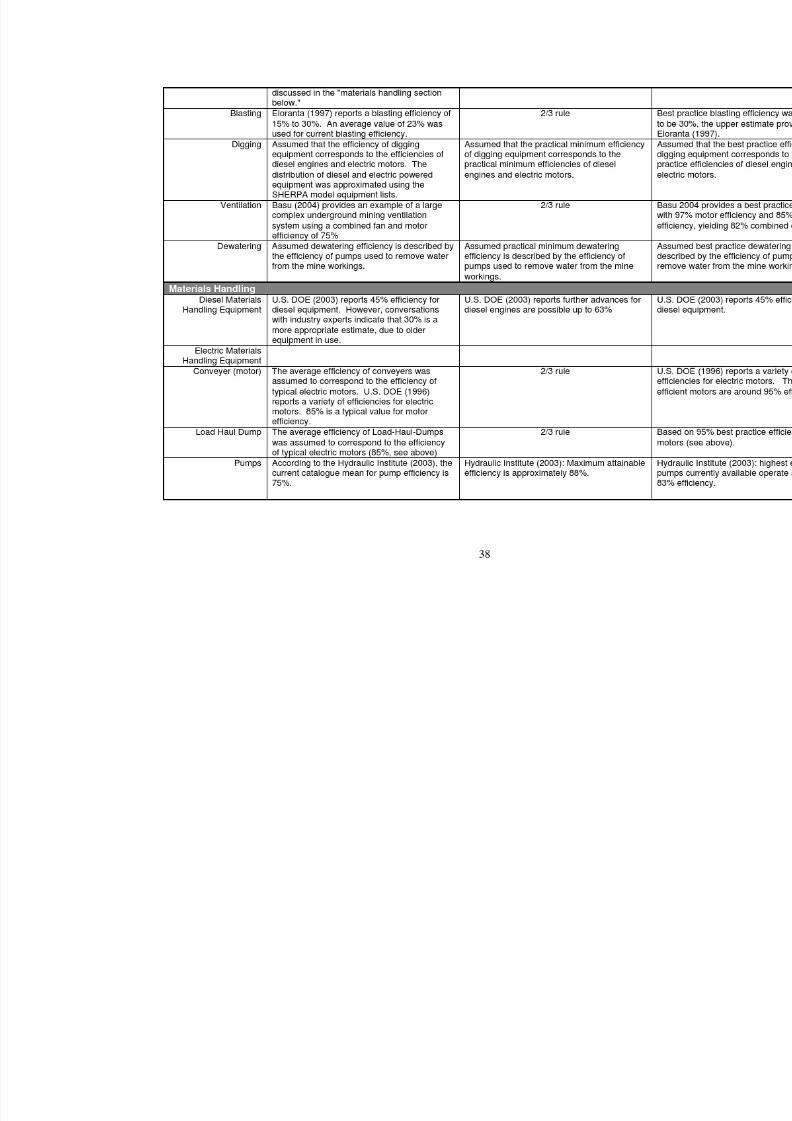
4.2 Best Practice, Practical Minimum, and Theoretical Minimum Energy Consumption
General methods for determining the best practice, practical minimum, and theoretical minimumenergy consumption are discussed below. Detailed assumptions are listed in Appendix D (page37).
Best Practice Energy ConsumptionEstimates of best practice energy consumption were based on a variety of published sourcesreporting the energy efficiencies of top-performing mining equipment. In cases whereequipment characteristics varied significantly, or when equipment efficiency data wasunavailable, this study used other indicators of efficiency such as the motors used to powerelectric equipment.
Theoretical Minimum EnergyThe theoretical minimum energy is defined as the minimum energy needed to complete a givenprocess, in absence of any energy losses to heat, noise etc. For example, theoretical minimum
energy describes the energy required to haul rock from a mining area to a process area, butexcludes the energy lost in the diesel engine powering the truck. Since mining is predominantly amechanical process, no single value for the current or theoretical minimum energy requirementfor mining can be derived, even within a single mineral group, since the depth at which thematerial is mined and the type of refining required varies widely. Every commodity that is minedhas different mechanical and physical properties. Therefore, different mines will have drasticallyvarying energy requirements for a given process, and it is difficult to pinpoint the theoreticalminimum energy necessary for such operations. At best, average values for energy consumptionmay be approximated by evaluating the average performance of mining equipment.Theoretical minimum energy was calculated using current energy consumption and publishedestimates of equipment efficiency.
Equipment efficiency can be expressed as:
Efficiency = Theoretical Minimum EnergyEnergy Consumption
The theoretical minimum energy for completing a process could thus be calculated as follows:Theoretical Minimum Energy = Energy Consumption * Efficiency
The calculations used direct equipment efficiency foremost, but in cases where these data wereunavailable, indirect equipment efficiency was used as the next best alternative. For example, in
the case of conveyer belts for materials transport, the efficiency of the motor powering theconveyer was used. In another case, centrifuge minimum energy consumption was not based onefficiency values but rather on a theoretical calculation for the kinetic energy of a solid-liquidslurry.
Practical Minimum EnergyThe practical minimum energy is considered to be the closest approach to the theoretical limitallowed by implementing current best practices and technologies developed by ongoing R&D.
16

7/30/2019 Mining Industry Energy Bandwidth
http://slidepdf.com/reader/full/mining-industry-energy-bandwidth 21/47
Practical minimum energy values are however a moving target. Science and technologycontinuously improve energy efficiency and waste recovery. New technologies will bedeveloped that will change what is now perceived as the practical minimum. In some cases, thepractical minimum energy for a process was determined from published estimates of futureattainable efficiencies for equipment. In other cases where no published practical minimum
target could be found, this study assumes that practical minimum energy is two-thirds of the waybetween best practical energy requirement and theoretical minimum energy requirements.
“2/3 approximation” for Estimating Practical Minimum Energy Consumption
Practical Min = Best Practice - (Best Practice - Theoretical Min)* 2/3
Practical minimum energy calculations for equipment using motors, pumps, and diesel engineswere all based on published estimates of practical efficiency limits. Had the practical minimumenergy consumption for diesel engines, motors and pumps been calculated using the 2/3 rule, theerror would range from 0.02 to 14%, as shown in Exhibit 13. For pumps, motors, and diesel
engines, the 2/3 approximation provides a good approximation of practical minimum energyconsumption, though slightly overestimating in each case (this would lead to underestimatingpotential energy savings). While these results do not prove that the practical minimum energyconsumption can be calculated using the 2/3 rule for all equipment types, it does demonstratethat the 2/3 rule can provide a useful approximation in some cases , when published values areunavailable. This rule was used in calculating onsite practical minimum energy, which is lateradjusted for generation and distribution losses (see section 4.3).
Exhibit 13. Error Associated with "2/3 approximation"for Materials Handling Equipment used in Mineral Mining
Equipment
Practical Minimum EnergyRequirement (Btu/ton), based oncurrent energy consumption andpublished estimates of practical
efficiency limits
Practical MinimumEnergy Requirement(Btu/ton), calculatedusing the "2/3 rule"
% Error
Diesel Equipment 4515 5162 14%
Conveyor (Motor) 11 11 ~2%
Pumps 221 221 ~0.02%
4.3 Factoring in Electricity Generation Losses in the Analysis
Much of the equipment included in this analysis relies on electricity. Since electricity generationand distribution is associated with substantial energy losses, it is important to utilize the tacitenergy consumption values, i.e., the energy used onsite plus the energy lost in generating anddistributing that energy, instead of only onsite consumption. According to data reported by theEnergy Information Administration (EIA, 2006), 2.17 Btu are lost in transmission anddistribution for every 1 Btu delivered to the industrial sector.
16In other words, consuming 1 Btu
16 EIA AEO 2006, Table 2
17
7/30/2019 Mining Industry Energy Bandwidth
http://slidepdf.com/reader/full/mining-industry-energy-bandwidth 22/47
of electricity onsite requires a total electricity consumption of 3.17 Btu. Conversely, saving 1Btu onsite translates to saving 3.17 Btu. Therefore, tacit energy was included in this study inorder to quantify energy saving potential more accurately.
The current and best practice energy consumption of electrical equipment was, therefore,
multiplied by a factor of 3.17 to estimate the total energy consumption. However, total energyconsumption was calculated differently for practical minimum and theoretical minimum energyconsumption estimates. Since the practical minimum energy consumption would hypotheticallybe obtained in the future, EIA predictions for 2020 are used to determine electricity losses. EIApredicts that in 2020, the ratio of offsite to onsite electricity consumption will be 3.05—the valueused in this analysis to calculate the tacit practical minimum energy. Further, the definition of theoretical minimum energy consumption requires that all processes involve zero energy losses.Therefore, theoretical minimum energy estimates assume zero electricity losses.
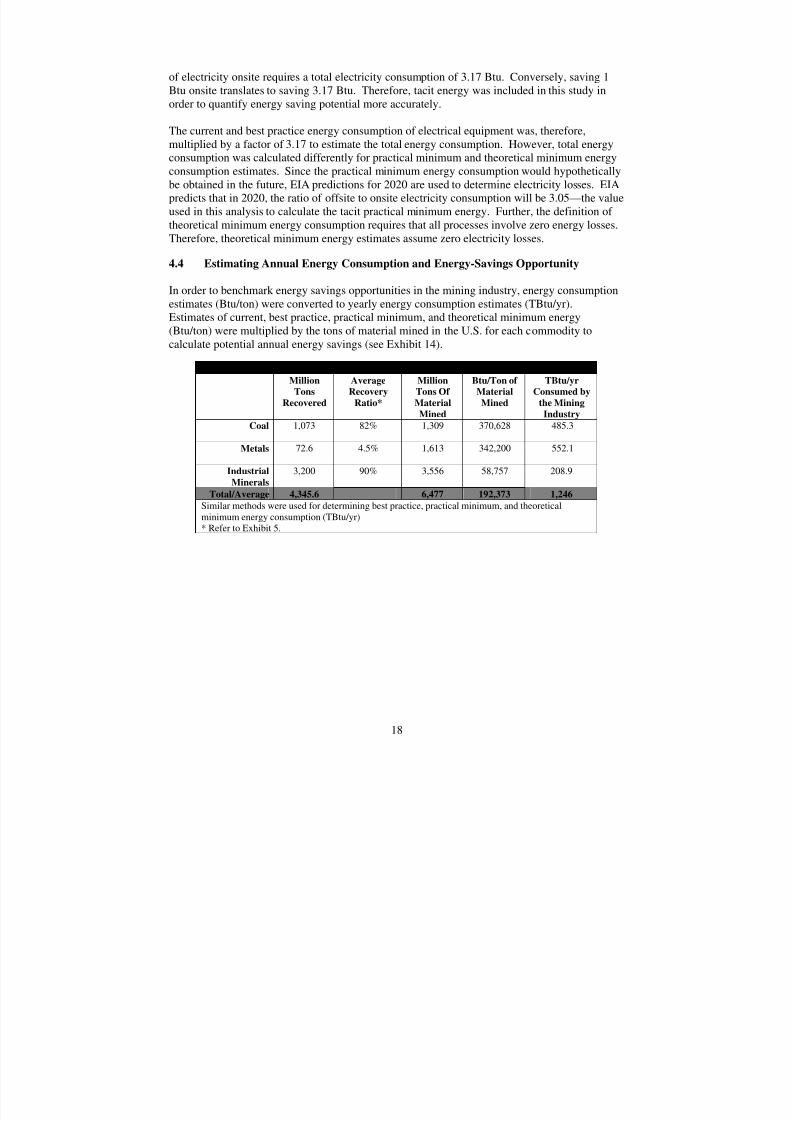
4.4 Estimating Annual Energy Consumption and Energy-Savings Opportunity
In order to benchmark energy savings opportunities in the mining industry, energy consumptionestimates (Btu/ton) were converted to yearly energy consumption estimates (TBtu/yr).Estimates of current, best practice, practical minimum, and theoretical minimum energy(Btu/ton) were multiplied by the tons of material mined in the U.S. for each commodity tocalculate potential annual energy savings (see Exhibit 14).
Exhibit 14. Current Energy Consumption by Commodity GroupMillion
Tons
Recovered
Average
Recovery
Ratio*
Million
Tons Of
Material
Mined
Btu/Ton of
Material
Mined
TBtu/yr
Consumed by
the Mining
Industry
Coal 1,073 82% 1,309 370,628 485.3
Metals 72.6 4.5% 1,613 342,200 552.1
Industrial
Minerals
3,200 90% 3,556 58,757 208.9
Total/Average 4,345.6 6,477 192,373 1,246
Similar methods were used for determining best practice, practical minimum, and theoreticalminimum energy consumption (TBtu/yr)* Refer to Exhibit 5.
18

7/30/2019 Mining Industry Energy Bandwidth
http://slidepdf.com/reader/full/mining-industry-energy-bandwidth 23/47
5. Uncertainties and Data Quality
A major challenge in analyzing the mining industry’s energy consumption is the variability inmining operations. Even within a single mineral group, processes will differ according to the
depth at which the material is mined and the degree of refining required. Moreover, everycommodity that is mined has different mechanical and physical properties. These properties canvary over an order of magnitude between deposits and can vary significantly even withinindividual mines. For example, the work indices (a measure of energy required to grind rock) of mined commodities vary from 1.43 kWh/ton for calcined clay to 134.5 kWh/ton for mica.17 Thisresults in large variations in grinding equipment energy requirements. Therefore, different mineswill have drastically different energy requirements for a given process. A mine could bedesigned for maximum efficiency, yet consume more energy than an inefficient mine with thesame output.
The large variation in mine’s energy consumption is evidenced by two recent Canadian studies
benchmarking the energy consumption of 10 underground mines and 7 open pit mines. Theaverage energy requirement of the underground mines was 25,000 Btu/ton, with a standarddeviation of 11,000 Btu/ton, while the average energy requirement of the open pit mines was1,000 Btu/ton with a standard deviation of 700 Btu/ton (CIPEC, 2005). The variation in thesemines’ energy consumption can arise from a number of factors, including mining method,equipment selection, geology, economies of scale, ore composition, and customer requirements.
It is also important to keep in mind the small sample size used in this bandwidth study. Thisreport is based on the E&E Profile, which studies eight commodities selected by the Departmentof Energy and the National Mining Association for analysis. Further, the energy estimates foreach commodity are limited by the number of mining methods analyzed for that commodity.
Given the small sample size, there are obviously uncertainties associated with extrapolatingenergy requirements across the mining industry. Nevertheless, the eight commodities analyzedaccount for over 78% of energy consumption in U.S. mining, representing the majority of theenergy-saving opportunity. Moreover, many of the commodities analyzed can be representativeof other commodities (e.g., copper of molybdenum and gold of platinum).
Despite the uncertainties involved in estimating the entire mining industry’s energyconsumption, this study’s estimates correspond well with other estimates of mining energyconsumption. According to the EIA Annual Energy Outlook 2006, the mining industry(including oil and natural gas) consumes approximately 2,500 TBtu/yr,18 or approximately 3,000TBtu/yr including electricity losses. The EIA data include oil and natural gas mining along with
other mining activities in its published values for mining industry energy consumption. Thisreport estimates that the coal, metal, and mineral mining industries alone consume 1,246 TBtu/y,or about 1/3 of total mining energy consumption (including oil and natural gas).
17 SME Mineral Processing Handbook. Table 10. Average Work Indexes. 1985.18 Annual Energy Outlook 2006 Supplemental Tables: Table 32
19

7/30/2019 Mining Industry Energy Bandwidth
http://slidepdf.com/reader/full/mining-industry-energy-bandwidth 24/47
20
7/30/2019 Mining Industry Energy Bandwidth
http://slidepdf.com/reader/full/mining-industry-energy-bandwidth 25/47
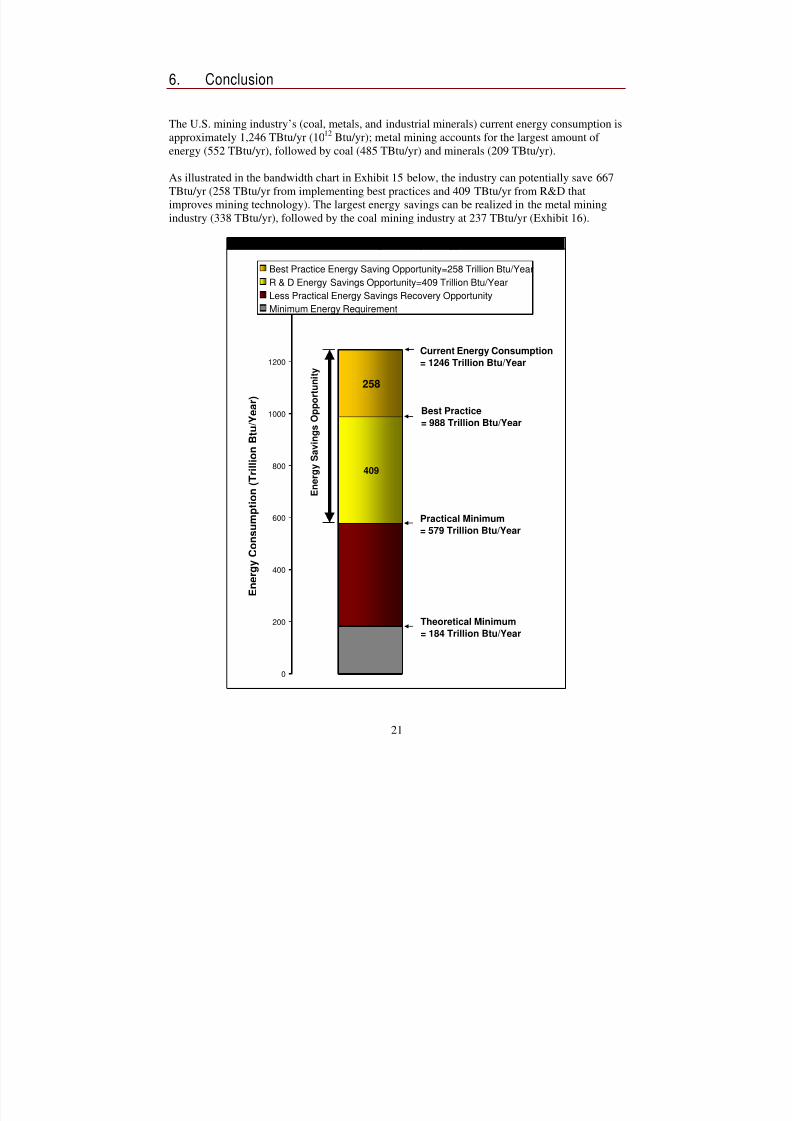
6. Conclusion
The U.S. mining industry’s (coal, metals, and industrial minerals) current energy consumption isapproximately 1,246 TBtu/yr (1012 Btu/yr); metal mining accounts for the largest amount of
energy (552 TBtu/yr), followed by coal (485 TBtu/yr) and minerals (209 TBtu/yr).
As illustrated in the bandwidth chart in Exhibit 15 below, the industry can potentially save 667TBtu/yr (258 TBtu/yr from implementing best practices and 409 TBtu/yr from R&D thatimproves mining technology). The largest energy savings can be realized in the metal miningindustry (338 TBtu/yr), followed by the coal mining industry at 237 TBtu/yr (Exhibit 16).
Exhibit 15. U.S. Mining Industry Energy Bandwidth
409
258
0
200
400
600
800
1000
1200
1400
E
n e r g y C o n s u m p t i o n ( T r i l l i o n
B t u / Y e a r )
Best Practice Energy Saving Opportunity=258 Trillion Btu/Year
R & D Energy Savings Opportunity=409 Trillion Btu/Year
Less Practical Energy Savings Recovery OpportunityMinimum Energy Requirement
Current Energy Consumption
= 1246 Trillion Btu/Year
Theoretical Minimum
= 184 Trillion Btu/Year
Best Practice
= 988 Trillion Btu/Year
Practical Minimum
= 579 Trillion Btu/Year
E n e r g y S a v
i n g s O p p o r t u n i t y
21
7/30/2019 Mining Industry Energy Bandwidth
http://slidepdf.com/reader/full/mining-industry-energy-bandwidth 26/47
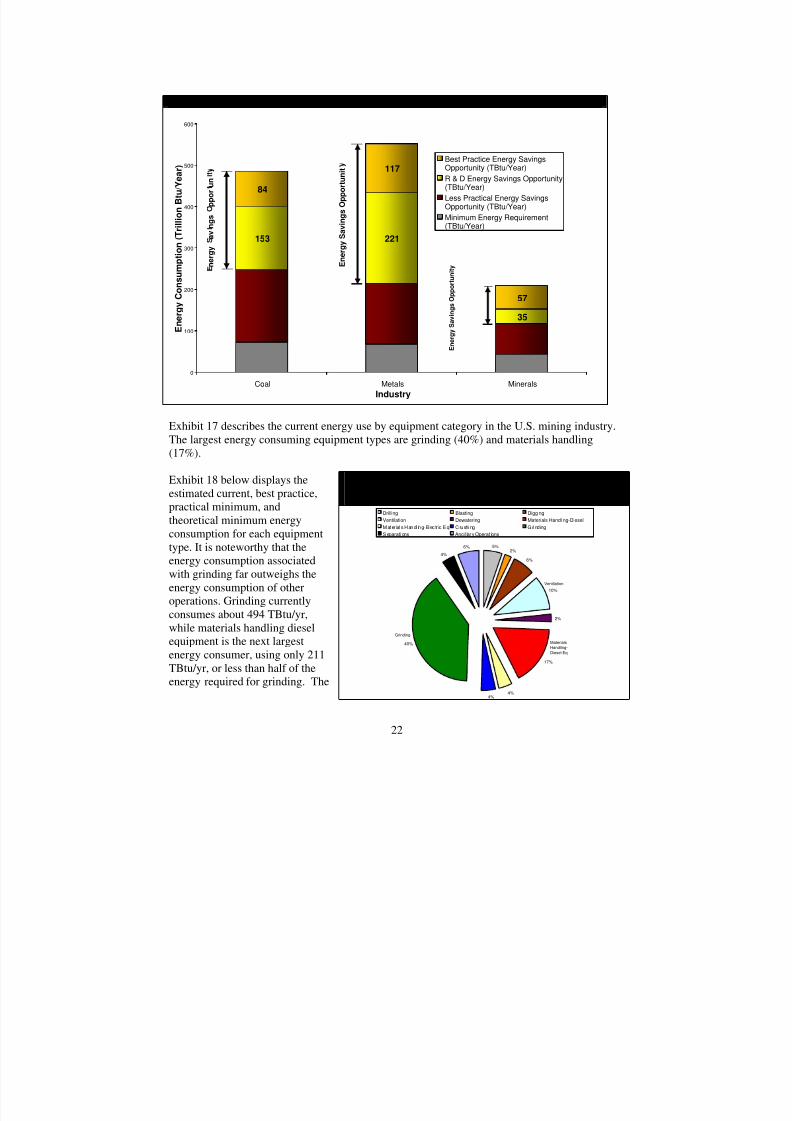
Exhibit 17 describes the current energy use by equipment category in the U.S. mining industry.The largest energy consuming equipment types are grinding (40%) and materials handling(17%).
Exhibit 18 below displays theestimated current, best practice,practical minimum, andtheoretical minimum energyconsumption for each equipmenttype. It is noteworthy that theenergy consumption associatedwith grinding far outweighs theenergy consumption of otheroperations. Grinding currentlyconsumes about 494 TBtu/yr,while materials handling dieselequipment is the next largestenergy consumer, using only 211TBtu/yr, or less than half of theenergy required for grinding. The
Exhibit 16. U.S. Mining Industry Energy Bandwidth for Coal, Metal, and Mineral Mining
153 221
35
84
117
57
0
100
200
300
400
500
600
Coal Metals Minerals
Industry
E n e r g y C
o n s u m p t i o n ( T r i l l i o n B t u / Y e a r )
Best Practice Energy SavingsOpportunity (TBtu/Year)
R & D Energy Savings Opportunity(TBtu/Year)
Less Practical Energy SavingsOpportunity (TBtu/Year)
Minimum Energy Requirement(TBtu/Year)
E n e r g y S a v i n g s O p p o r t u n i t
n e r g y
a v n g s
p p o r u n
E n e r g y S a v i n g s O p p o r t u n i t y
Exhibit 17. Contribution of Current Energy Use byEquipment across the Mining Industry(Values account for electricity losses)
5%2%
6%
10%
2%
17%
4%4%
40%
4%
6%
Drilling Blasting Digging
Ventilation Dewatering Materials Handling-Diesel
Mater ial s Han dl in g-Elec tr ic Eq C ru shing Grind ing
S eparati ons Ancil lar y Operat ions
Grinding
Materials
Handling-
Diesel Eq
Ventilation
22
7/30/2019 Mining Industry Energy Bandwidth
http://slidepdf.com/reader/full/mining-industry-energy-bandwidth 27/47
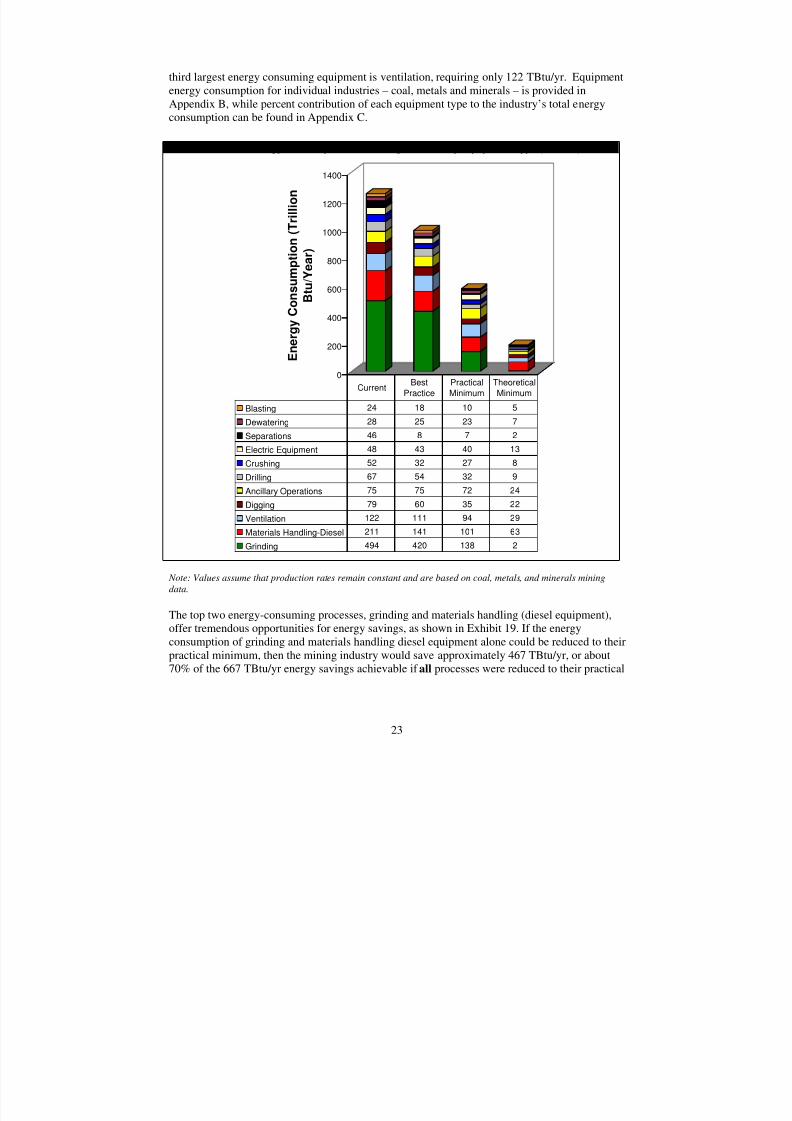
third largest energy consumingenergy consumption for individuAppendix B, while perceconsumption can be found in
equipment ental industries – c n
nt contribution of each nergyAppendix C.
Note: Values assume that production rates remain constant and are based on coal, metals, and minerals mining
data.
The top two energy-consuming processes, grinding and materials handling (diesel equipment),offer tremendous opportunities for energy savings, as shown in Exhibit 19. If the energyconsumption of grinding and materials handling diesel equipment alone could be reduced to theirpractical minimum, then the mining industry would save approximately 467 TBtu/yr, or about70% of the 667 TBtu/yr energy savings achievable if all processes were reduced to their practical
is ventilation, requiring only 122 TBtu/yr. Equipmoal, metals and minerals – is provided iequipment type to the industry’s total e
Exhibit 18. Energy Consumption and Saving Potential by Equipment Type (TBtu/Yr)
0
200
400
r g y C o n
s u m p t i o n ( T r i l l i o n
B
t u / Y e a r )
600
800
1000
1200
1400
E n e
Blasting 24 18 10 5
Dewatering 28 25 23 7
Separations 46 8 7 2
Electric Equipment 48 43 40 13
Crushing 52 32 27 8
Drilling 67 54 32 9
Ancillary Operations 75 75 72 24
Digging 79 60 35 22
Ventilation 122 111 94 29
Materials Handling-Diesel 211 141 101 63
Grinding 494 420 138 2
CurrentBest
Practice
Practical
Minimum
Theoretical
Minimum
23
7/30/2019 Mining Industry Energy Bandwidth
http://slidepdf.com/reader/full/mining-industry-energy-bandwidth 28/47
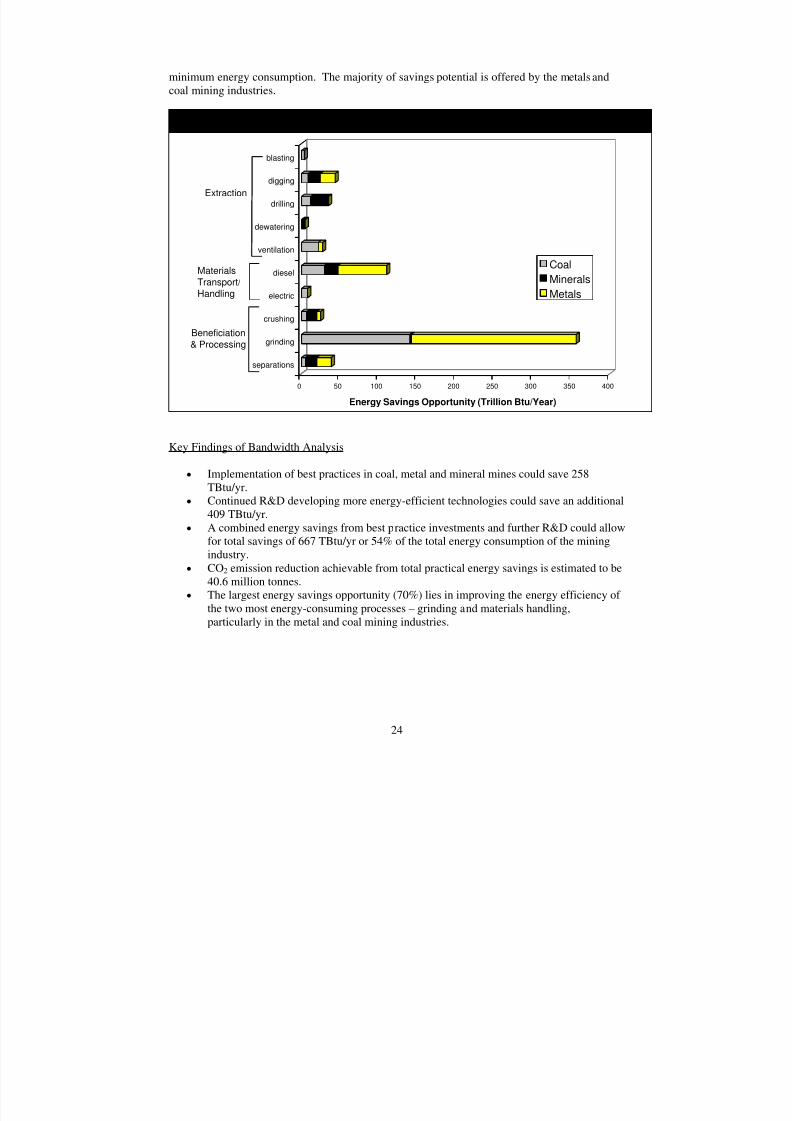
minim andcoal m
um energy consumption. The majority of savings potential is offered by the metalsining industries.
Exhibit 19. Energy Saving Opportunity in U.S. Mining Industry for Top 10 Energy-Intensive Processes(includes energy savings from implementing best practices and R&D)
0 50 100 150 200 250 300 350 400
Energy Savings Opportunity (Trillion Btu/Year)
separations
grinding
crushing
electric
diesel
ventilation
dewatering
drilling
digging
blasting
Coal
Minerals
Metals
Extraction
Materials
Transport/
Handling
Beneficiation
& Processing
Key Findings of Bandwidth Analysis
• Implementation of best practices in coal, metal and mineral mines could save 258TBtu/yr.
• Continued R&D developing more energy-efficient technologies could save an additional
A combined energy savings from best practice investments and further R&D could allow409 TBtu/yr.
•
for total savings of 667 TBtu/yr or 54% of the total energy consumption of the miningindustry.
• CO2 emission reduction achievable from total practical energy savings is estimated to be40.6 million tonnes.
• The largest energy savings opportunity (70%) lies in improving the energy efficiency of the two most energy-consuming processes – grinding and materials handling,particularly in the metal and coal mining industries.
24
7/30/2019 Mining Industry Energy Bandwidth
http://slidepdf.com/reader/full/mining-industry-energy-bandwidth 29/47
References
AOG (2005): "AOG to focus on throughput in 2005". AOG (Advanced Optimization Group)Newsletter, Volume 4, Issue 1. 2005.
Basu (2004): “Design Innovations for Energy Efficiency in Underground Mine Ventilation.”Presented at the 13th Intl. Mine Planning and Equipment Selection Symposium 1-3 Sep, 2004.Wroclaw, Poland.
CIPEC (2005): “Benchmarking the Energy Consumption of Canadian Underground Bulk Mines.” Canadian Industry Program for Energy Conservation. Natural Resources Canada, 2005.
CIPEC (2005): “Benchmarking the Energy Consumption of Canadian Open-Pit Mines.”Canadian Industry Program for Energy Conservation. Natural Resources Canada, 2005.
EIA (2006): “Annual Energy Outlook 2006 with Projections to 2030,” Table 2. U.S. DOE
Energy Information Administration. February 2006
Eloranta (1997): “Efficiency of Blasting vs. Crushing & Grinding,” Proceedings of the twenty-third conference of Explosives and Blasting Technique, Las Vegas, Nevada, February 2-6, 1997.
ternational Society of Explosives Engineers, Cleveland, Ohio
ean Guide to Pump Efficiency for Single Stage
Gre w
Simulation Software.” DOE Propos Nord unInternational Journal of Rock Mechanics,
U.S. DOE (2002): Energy and EnvironmDep tm U.S. DOof FreedomCar & Vehicle Technologies. August 2003.
Motor.” U.S. Department of Energy, EERE,Industrial Technologies Program. September 1996.
In European Commission (2003): “Europ
entrifugal Pumps.” May, 2003.Chttp://energyefficiency.jrc.cec.eu.int/motorchallenge/pdf/EU_pumpguide_final.pdf
en ade and Rajamani (1999): “Development of a 3-Dimensional Version of the Millsoft
al.
l d (1989): “The Effect of Thrust on the Performance of Percussive Rock Drills,”Mining Sciences, & Geomechanics Abstracts.
ental Profile for the U.S. Mining Industry, 2002. U.S.ar ent of Energy. Prepared by BCS, Incorporated.
E (2003): “Just the Basics, Diesel Engine.” U.S. Department of Energy, EERE, Office
U.S. DOE (1996): “Buying an Energy Efficient
25

7/30/2019 Mining Industry Energy Bandwidth
http://slidepdf.com/reader/full/mining-industry-energy-bandwidth 30/47
26
7/30/2019 Mining Industry Energy Bandwidth
http://slidepdf.com/reader/full/mining-industry-energy-bandwidth 31/47
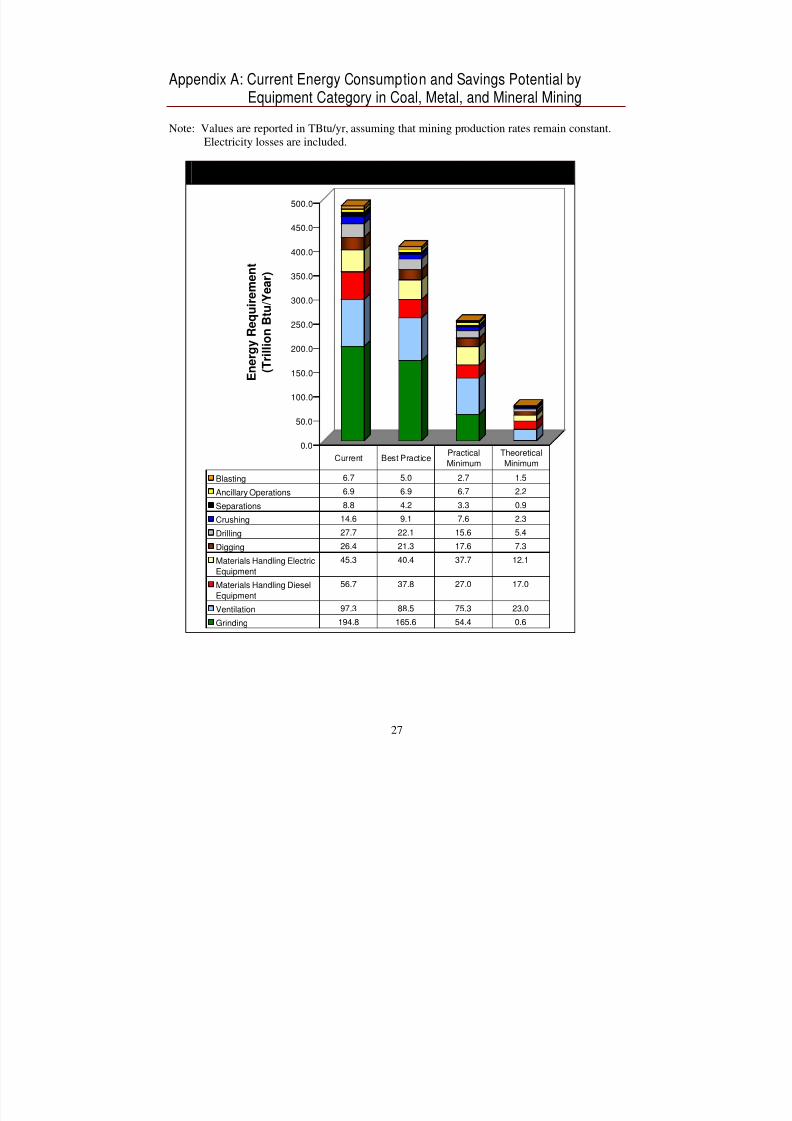
Appendix A: Current Energy Consumption and Savings Potential byEquipment Category in Coal, Metal, and Mineral Mining
Note: Values are reported in TBtu/yr, assuming that mining production rates remain constant.Electricity losses are included.
Exhibit 20. Energy Consumption by Equipment Categoryin Coal Mining Industry (TBtu/yr)
0.0
50.0
100.0
150.0
200.0
250.0
300.0
350.0
400.0
450.0
500.0
E n e r g y R e q u i r e
m e n t
( T r i l l i o n B t u / Y
e a r )
Blasting 6.7 5.0 2.7 1.5
Ancillary Operations 6.9 6.9 6.7 2.2
Separations 8.8 4.2 3.3 0.9
Crushing 14.6 9.1 7.6 2.3
Drilling 27.7 22.1 15.6 5.4
Digging 26.4 21.3 17.6 7.3
Materials Handling Electric
Equipment
45.3 40.4 37.7 12.1
Materials Handling Diesel
Equipment
56.7 37.8 27.0 17.0
Ventilation 97.3 88.5 75.3 23.0
Grinding 194.8 165.6 54.4 0.6
Current Best PracticePractical
Minimum
Theoretical
Minimum
27
7/30/2019 Mining Industry Energy Bandwidth
http://slidepdf.com/reader/full/mining-industry-energy-bandwidth 32/47
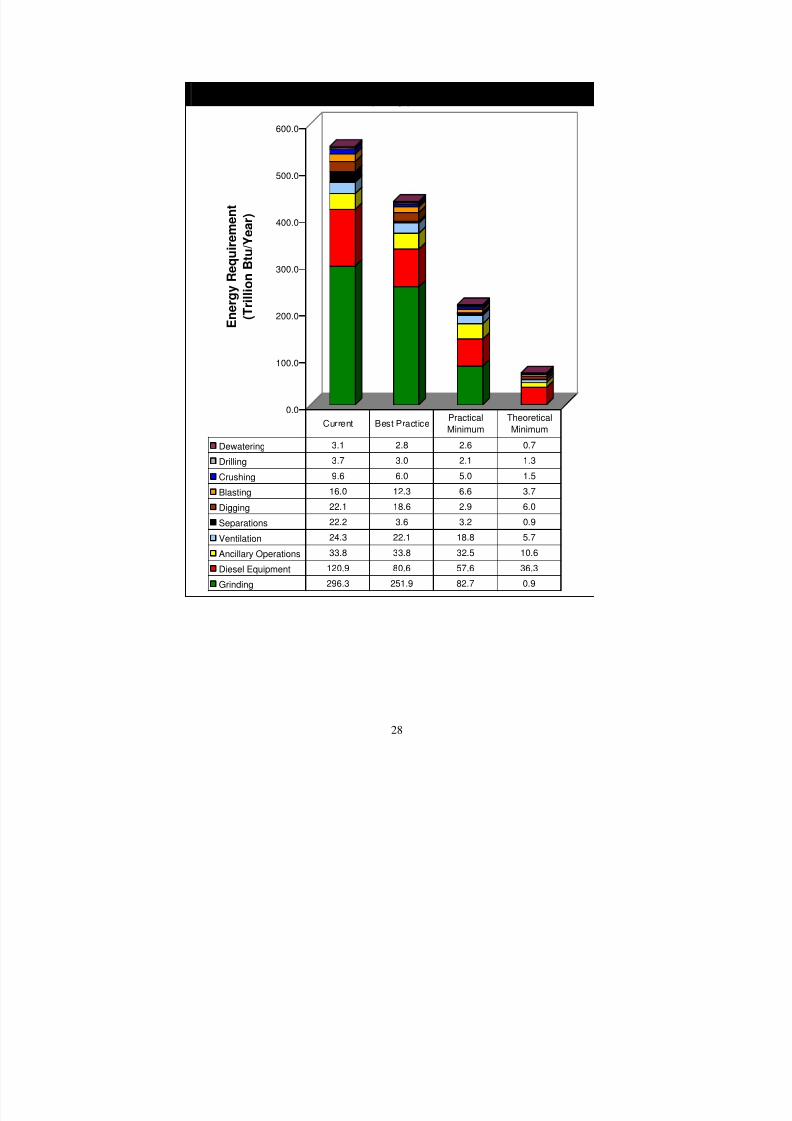
Exhibit 21. Energy Consumption by Equipment Category in Metal Mining Industry(TBtu/yr)
0.0
100.0
200.0
300.0
400.0
500.0
600.0
E n e r g
y R e q u i r e m e n t
( T r i l l i o n B t u / Y e a r )
Dewatering 3.1 2.8 2.6 0.7
Drilling 3.7 3.0 2.1 1.3
Crushing 9.6 6.0 5.0 1.5
Blasting 16.0 12.3 6.6 3.7
Digging 22.1 18.6 2.9 6.0
Separations 22.2 3.6 3.2 0.9
Ventilation 24.3 22.1 18.8 5.7
Ancillary Operations 33.8 33.8 32.5 10.6
Diesel Equipment 120.9 80.6 57.6 36.3
Grinding 296.3 251.9 82.7 0.9
Current Best PracticePractical
Minimum
Theoretical
Minimum
28
7/30/2019 Mining Industry Energy Bandwidth
http://slidepdf.com/reader/full/mining-industry-energy-bandwidth 33/47
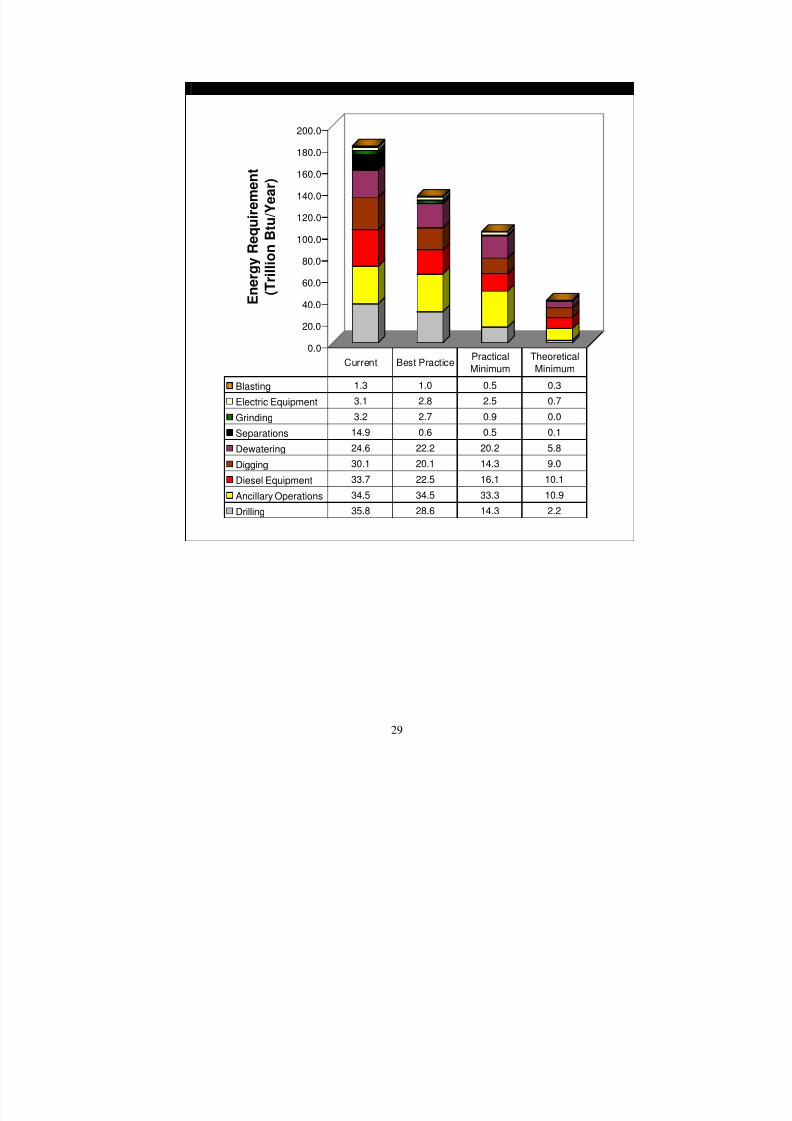
E (TBtu/yr)xhibit 22. Energy Consumption by Equipment Category in Mineral Mining Industry
0.0
20.0
40.0
60.0
80.0
100.0
120.0
140.0
160.0
180.0
200.0
E n e r g y R e q u i r e m e n t
( T r i l l i o n B t u / Y e a r )
Blasting 1.3 1.0 0.5 0.3
Electric Equipment 3.1 2.8 2.5 0.7
Grinding 3.2 2.7 0.9 0.0
Separations 14.9 0.6 0.5 0.1
Dewatering 24.6 22.2 20.2 5.8
Digging 30.1 20.1 14.3 9.0
Diesel Equipment 33.7 22.5 16.1 10.1
Ancillary Operations 34.5 34.5 33.3 10.9
Drilling 35.8 28.6 14.3 2.2
Current Best PracticePractical
Minimum
Theoretical
Minimum
29

7/30/2019 Mining Industry Energy Bandwidth
http://slidepdf.com/reader/full/mining-industry-energy-bandwidth 34/47
30
7/30/2019 Mining Industry Energy Bandwidth
http://slidepdf.com/reader/full/mining-industry-energy-bandwidth 35/47
31
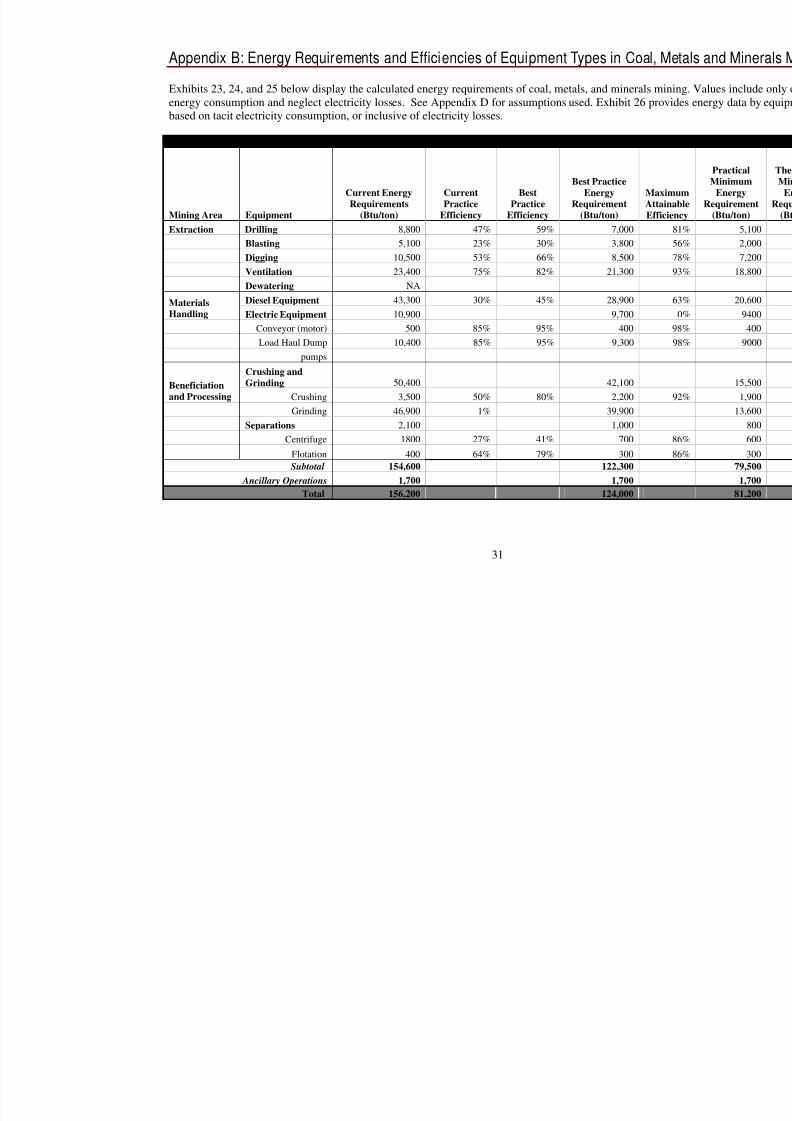
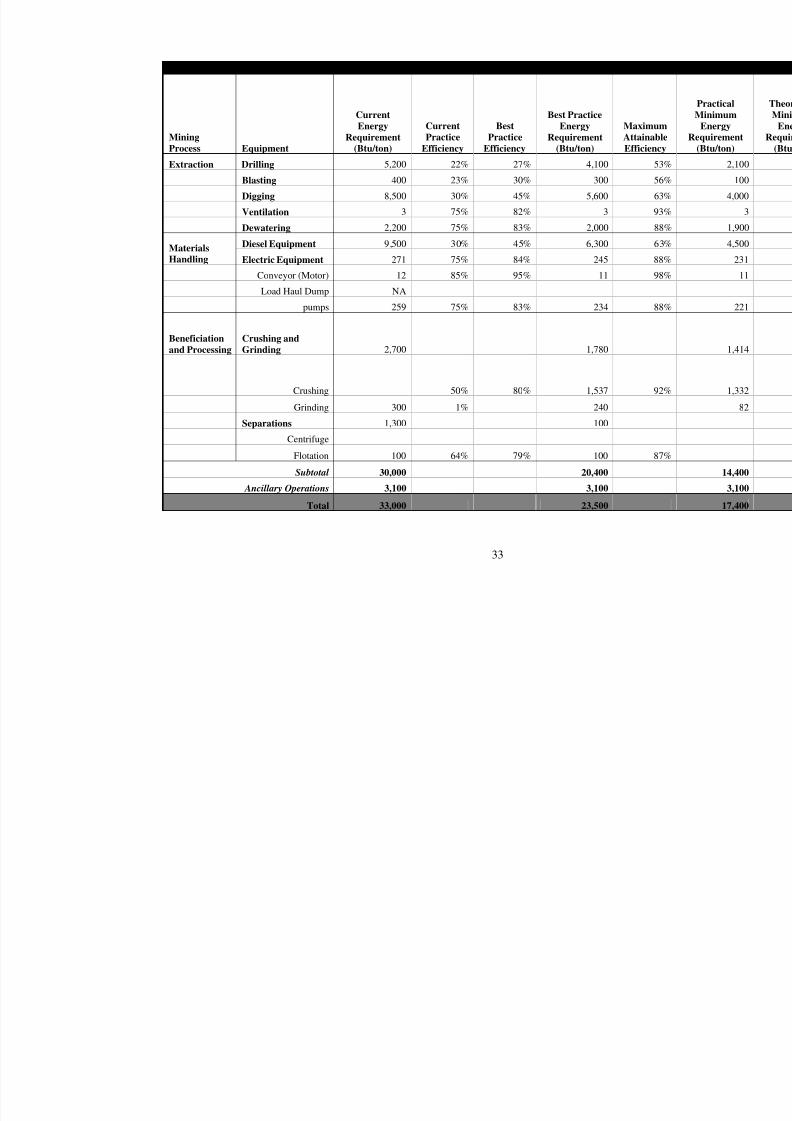
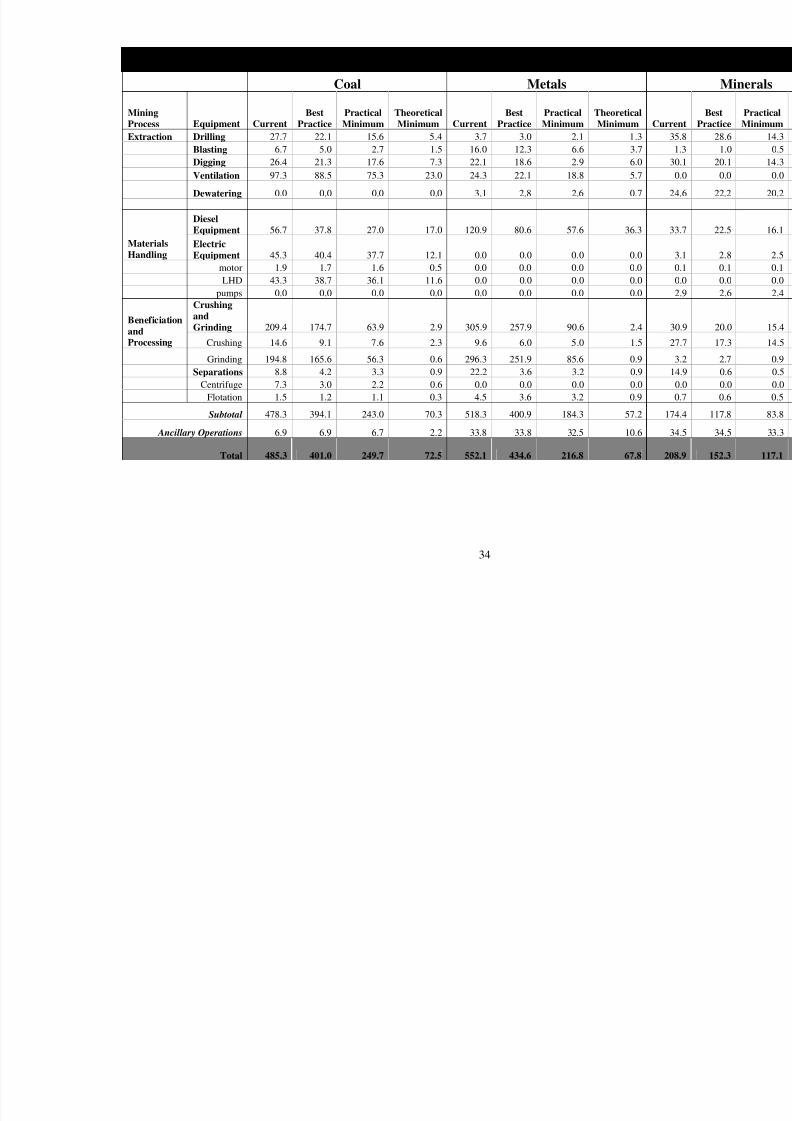
Appendix B: Energy Requirements and Efficiencies of Equipment Types in Coal,
Exhibits 23, 24, and 25 below display the calculated energy requirements of coal, metals, and minerals menergy consumption and neglect electricity losses. See Appendix D for assumptions used. Exhibit 26 prbased on tacit electricity consumption, or inclusive of electricity losses.
Exhibit 23. Energy Requirements and Efficiencies of Equipment Types in Coal Mining in Btu/yr (n
Mining Area Equipment
Current Energy
Requirements
(Btu/ton)
Current
Practice
Efficiency
Best
Practice
Efficiency
Best Practice
Energy
Requirement
(Btu/ton)
Ma
Att
Eff
Extraction Drilling 8,800 47% 59% 7,000
Blasting 5,100 23% 30% 3,800
Digging 10,500 53% 66% 8,500
Ventilation 23,400 75% 82% 21,300
Dewatering NA
Diesel Equipment 43,300 30% 45% 28,900 Materials
Handling Electric Equipment 10,900 9,700
Conveyor (motor) 500 85% 95% 400
Load Haul Dump 10,400 85% 95% 9,300
pumps
Crushing and
Grinding 50,400 42,100 Beneficiation
and Processing Crushing 3,500 50% 80% 2,200
Grinding 46,900 1% 39,900
Separations 2,100 1,000
Centrifuge 1800 27% 41% 700
Flotation 400 64% 79% 300
Subtotal 154,600 122,300
Ancillary Operations 1,700 1,700
Total 156,200 124,000
7/30/2019 Mining Industry Energy Bandwidth
http://slidepdf.com/reader/full/mining-industry-energy-bandwidth 36/47
32
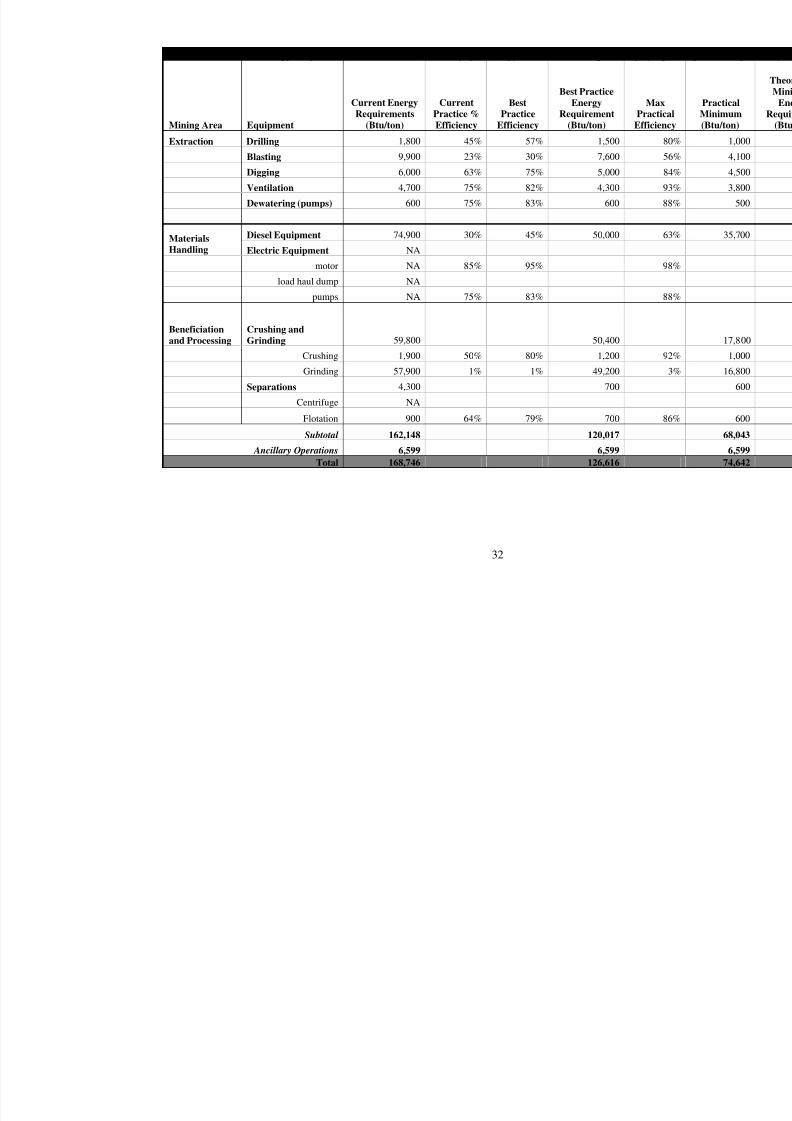
Exhibit 24. Energy Requirements and Efficiencies of Equipment Types in Metal Mining in Btu/yr (n
Mining Area Equipment
Current Energy
Requirements
(Btu/ton)
Current
Practice %
Efficiency
Best
Practice
Best Practice
Energy
Requirement
Ma
Pract
Efficiency (Btu/ton) Effici
Extraction Drilling 1,800 45% 57% 1,500
Blasting 9,900 23% 30% 7,600
Digging 6,000 63% 75% 5,000
Ventilation 4,700 75% 82% 4,300
Dewatering (pumps) 060 75% 83% 600
Diesel Equipment 3 45 50,0 74,900 0% % 00Materials
Handling EquipmentElectric NA
motor 8 95 NA 5% %
load haul dump NA
pumps 75 83 NA % %
B
an
eneficiation
d Processing
C
G 50,4rushing and
rinding 59,800 00
Crushing 0 50 % 1,200 1,90 % 80
rinding 57,900 1% 1% 49,200 G
Separations 4,300 700
Centrifuge NA
Flotation 64 % 900 % 79 700
Subtotal 16 120,02,148 17
Ancilla ns 6,59 ry Operatio 6,599 9
Total 168,746 126,616
7/30/2019 Mining Industry Energy Bandwidth
http://slidepdf.com/reader/full/mining-industry-energy-bandwidth 37/47
33
Exhibit 25. Energy Requirements and Efficiencies of Equipment Types in Mineral Mining in Btu/yr (
Mining
Process Equipment
Current
Energy
Requirement
(Btu/ton)
C
Efficiency Efficiency
Be
(Btu/ton)
M
Efficien
urrent
Practice
Best
Practice
st Practice
Energy
Requirement
aximu
Attainab
Extraction Drilling 5, 0 22% 27% 4, 0 520 10
Blasting 400 23% 30% 0 530
Digging 8, 0 30% 45 5, 650 % 600
Ventilation 3 75% 82% 3 9
Dewatering 2,200 75% 83% 2,000 8
Diesel Equipment 9, 0 30% 45% 0 650 6,30Materials
Handling Electric Equipment 27 % 24 81 75% 84 5
Conveyor (Mo 1 85% 95% 11 9tor) 2
Loa NAd Haul Dump
pumps 259 75% 83% 234 8
Beneficiation
and Processing
Crushing and
Grinding 2,700 1,780
Crushing 50 80% 1,53 9% 7
Grinding 30 1% 240 0
Separations 1,30 100 0
Centrifuge
64 % 8Flotation 100 % 79 100
Subt 3 2 otal 0,000 0,400
Ancillary Operations 3,100 3,100
Total 33,000 23,500
7/30/2019 Mining Industry Energy Bandwidth
http://slidepdf.com/reader/full/mining-industry-energy-bandwidth 38/47
34
Exhibit 26. Current, Best Practice, Practical Minimum, and Theoretical Minimum Energy C(TBtu/yr, including electricity losses)
Coal Metals
Mining
Process Equipment Current
Best
Practice
Pr
Mi
Theoretical
Minim urrent
Best
tice
P eoretical
inim
actical
nimum um C Prac
ractical
Minimum
Th
M um C
Extractio illing 27.7 22.1 3.7 0 n Dr 15.6 5.4 3. 2.1 1.3
sting 5.0 16.Bla 6.7 2.7 1.5 0 12.3 6.6 3.7 ng .4 21.3 . Diggi 26 17.6 7.3 22 1 18.6 2.9 6.0
ation .3 88.5 75. 23 .3 18.8 5.7Ventil 97 3 .0 24 22.1
Dewatering .0 0.0 0. 0. 1 2. 0.70 0 0 3. 2.8 6
Diesel
Equipment 37.8 27. 17.0 0.9 57.6 3656.7 0 12 80.6 .3
Materials
HandlingElectric
pment .4 37 12 0 0. 0.Equi 45.3 40 .7 .1 0. 0.0 0 0
moto 7 1. 0. 0 0.0 0. 0.r 1.9 1. 6 5 0. 0 0
LHD 36 11 0 0. 0.43.3 38.7 .1 .6 0. 0.0 0 0
pumps 0. 0.0 0.0 0.0 0.0 0.0 0.0 0 0.0Crushing
and
Grinding 209.4 174.7 63.9 2.9 305.9 257.9 90.6 2.4 Beneficiati n
and
Processin hin 9.1 7.6 2.3 9.6 6.0 5.0 1.5
o
g Crus g 14.6
8 165.6 56 0.6 29 3 251.9 85 0.9 Grinding 194. .3 6. .6
Separations 8.8 4.2 3.3 0.9 22.2 3.6 3.2 0.9
Centrifuge 7.3 3.0 2.2 0.6 0.0 0.0 0.0 0.0
Flotation 1.5 1.1 0. 5 3. 0.1.2 3 4. 3.6 2 9
Subtotal 478. 1 243. 70 3 400.9 184. 57.2 3 394. 0 .3 518. 3
Ancillary Operations 6.9 6. 2.2 33 33.8 32 10.6 6.9 7 .8 .5
Total 485.3 401.0 249.7 72.5 552.1 434.6 216.8 67.8
7/30/2019 Mining Industry Energy Bandwidth
http://slidepdf.com/reader/full/mining-industry-energy-bandwidth 39/47
35
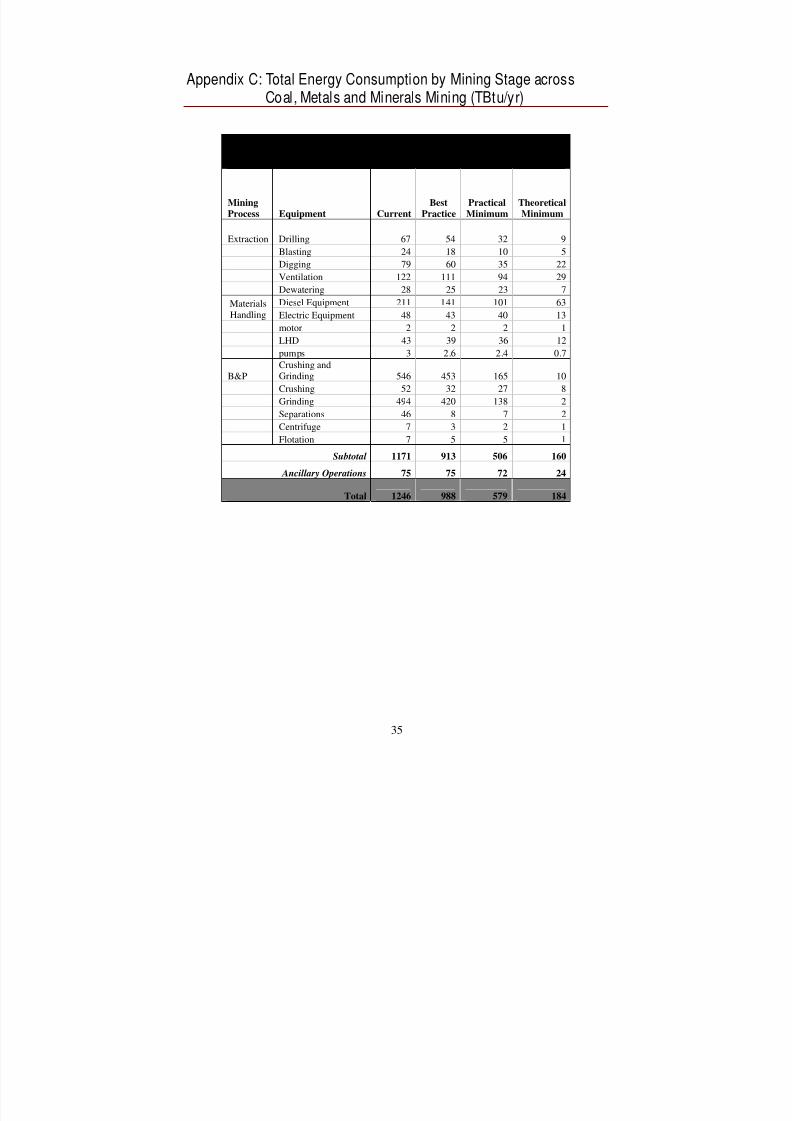
Appendix C: Total Energy Consumption by Mining Stage acrossMet a alsCoal, als nd Miner Mining (TBtu/yr)
Exhibit 27. Curren e mu it, Th oretical Mini m, Best Practice, and Pract calMinimum Energy Consumption across Coal, Me n ntal, and Mi eral Mi ing
(TBtu/yr, including electricity losses)
Mining
Process Equipment Current Practice
al
Minimum
re l
Minimum
Best Practic Theo tica
Extraction Drilling 67 54 32 9
Blasting 24 18 10 5
Digging 79 60 35 22
Ventilation 122 111 94 29
Dewaterin 28g 25 23 7
Diesel Equ ent 211 14 101ipm 1 63MaterHand
ialsling Electric Equipment 48 43 40 13
mot 2 2 2 1or
LHD 43 39 36 12
pu 3 4mps 2.6 2. 0.7
B&PCrushing andGrindi 546 453 165 10ng
Crushing 52 32 27 8
Grinding 494 42 1380 2
Sepa 46 8 7 2rations
Centrifuge 7 3 2 1
Flotation 7 5 5 1
Subtotal 1171 913 506 160
An ry Operations 75 75 72 24 cilla
Total 1246 988 579 184

7/30/2019 Mining Industry Energy Bandwidth
http://slidepdf.com/reader/full/mining-industry-energy-bandwidth 40/47
36
7/30/2019 Mining Industry Energy Bandwidth
http://slidepdf.com/reader/full/mining-industry-energy-bandwidth 41/47
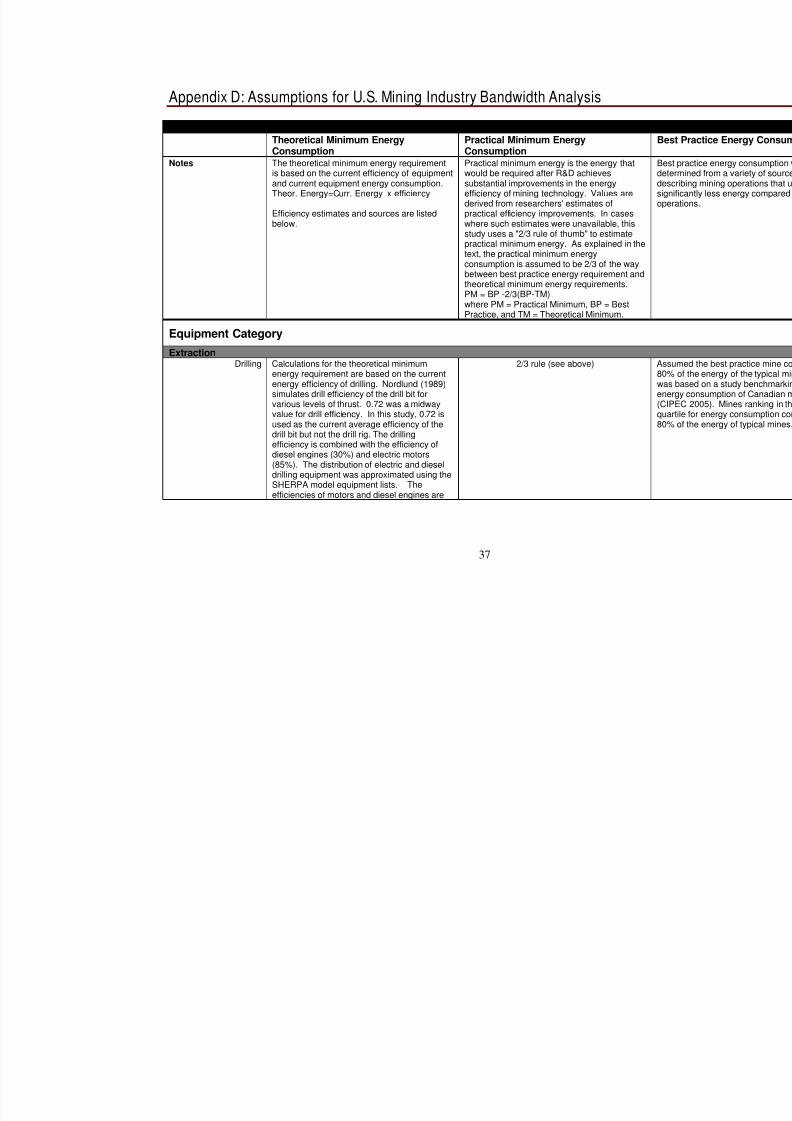
Appendix D: Assumptions for U.S. Mining Industry Bandwidth Analysis
Exhibit 28. Assumptions Used in Estimating Theoretical Minimum, Practical Minimum, and B
Theoretical Minimum Energy
Consumption
Practical Minimum Energy
ConsumptionNotes The theoretical minimum energy requirement
is based on the current efficiency of equipmentand current equipment energy consumption.Theor. Energy=Curr. Energy x efficiency
Efficiency estimates and sources are listedbelow.
Practical minimum energy is the energy thatwould be required after R&D achievessubstantial improvements in the energyefficiency of mining technology. Values arederived from researchers' estimates ofpractical efficiency improvements. In caseswhere such estimates were unavailable, thisstudy uses a "2/3 rule of thumb" to estimatepractical minimum energy. As explained in thetext, the practical minimum energyconsumption is assumed to be 2/3 of the waybetween best practice energy requirement andtheoretical minimum energy requirements.
PM = BP -2/3(BP-TM)where PM = Practical Minimum, BP = BestPractice, and TM = Theoretical Minimum.
Equipment Category
Extraction
Drilling Calculations for the theoretical minimumenergy requirement are based on the currentenergy efficiency of drilling. Nordlund (1989)simulates drill efficiency of the drill bit forvarious levels of thrust. 0.72 was a midwayvalue for drill efficiency. In this study, 0.72 isused as the current average efficiency of thedrill bit but not the drill rig. The drilling
efficiency is combined with the efficiency ofdiesel engines (30%) and electric motors(85%). The distribution of electric and dieseldrilling equipment was approximated using theSHERPA model equipment lists. Theefficiencies of motors and diesel engines are
2/3 rule (see above)
37
7/30/2019 Mining Industry Energy Bandwidth
http://slidepdf.com/reader/full/mining-industry-energy-bandwidth 42/47

7/30/2019 Mining Industry Energy Bandwidth
http://slidepdf.com/reader/full/mining-industry-energy-bandwidth 43/47
Beneficiation and Processing
Crushing cy 2/3 rule AOG (2005) reports current crushing efficienof 50%.
Grinding Grinding efficiency estimates vary significantly,depending on methods used. 1% efficiency
was found to be the most common estiSources citing 1% efficiency include AOG(2005), Eloranta (1997), Perry's (1963), Hukk(1975), Willis ((1998), Greenwade andRajamani (1999).
mate.
i
2/3 rule
Centrifuge y of a
serate
0 rpm. Currentefficiency values were based on this
2/3 rule Assumes the theoretical minimum energcentrifuge is the amount of energy required tobring a unit mass of coal in a centrifuge to atarget rotational speed. If sufficient time iavailable, the centrifuge speed could opat a fairly slow speed. Theoretical minimumenergy calculated for a unit mass of coal with0.7 mass concentration, in a 70 in. diametercentrifuge rotating at 30
calculation of theoretical minimum energy.Flotation Mechanical equipment in flotation machines
includes air compressors and rotatingimpellers. Efficiency is assumed to be theproduct of electric motor and pump efficiency.
and pump efficiency.
Practical efficiency is assumed to be theproduct of practical maximum electric motor
39

7/30/2019 Mining Industry Energy Bandwidth
http://slidepdf.com/reader/full/mining-industry-energy-bandwidth 44/47
40
7/30/2019 Mining Industry Energy Bandwidth
http://slidepdf.com/reader/full/mining-industry-energy-bandwidth 45/47
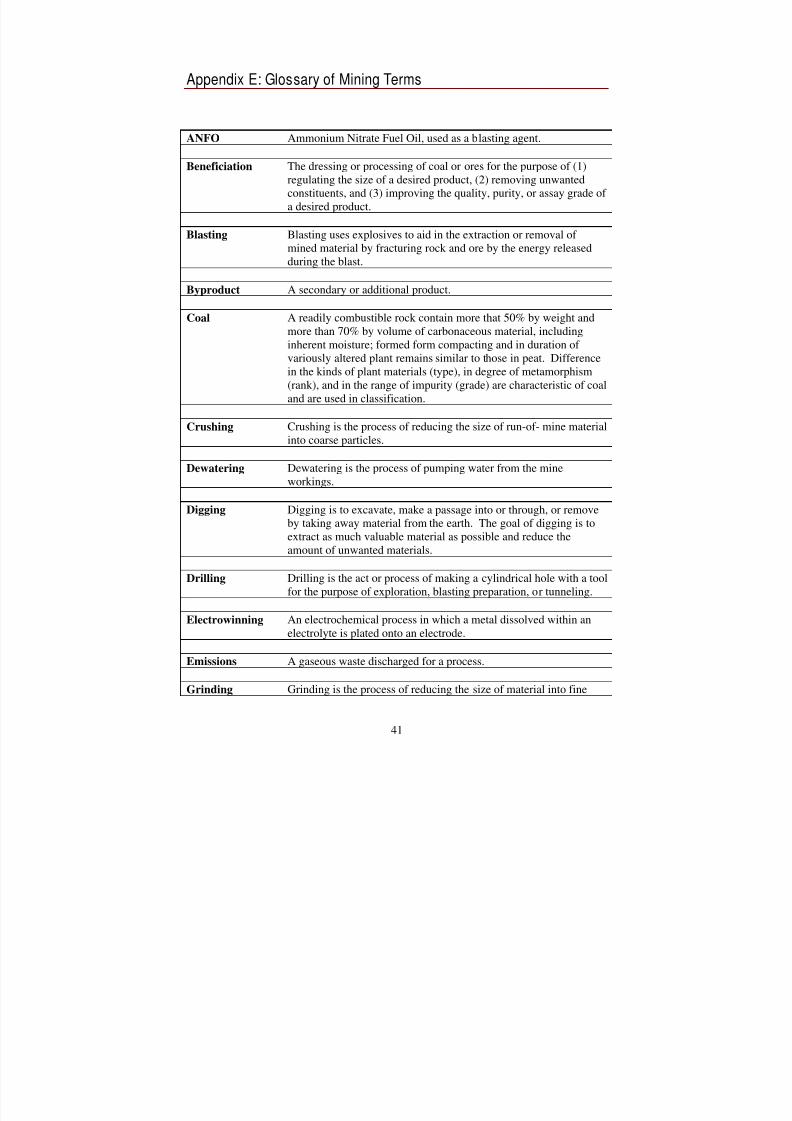
Appendix E: Glossary of Mining Terms
ANFO Ammonium Nitrate Fuel Oil, used as a blasting agent.
Beneficiation The dressing or processing of coal or ores for the purpose of (1)regulating the size of a desired product, (2) removing unwantedconstituents, and (3) improving the quality, purity, or assay grade of a desired product.
Blasting Blasting uses explosives to aid in the extraction or removal of mined material by fracturing rock and ore by the energy releasedduring the blast.
Byproduct A secondary or additional product.
Coal A readily combustible rock contain more that 50% by weight andmore than 70% by volume of carbonaceous material, includinginherent moisture; formed form compacting and in duration of variously altered plant remains similar to those in peat. Differencein the kinds of plant materials (type), in degree of metamorphism(rank), and in the range of impurity (grade) are characteristic of coaland are used in classification.
Crushing Crushing is the process of reducing the size of run-of- mine materialinto coarse particles.
Dewatering Dewatering is the process of pumping water from the mineworkings.
Digging Digging is to excavate, make a passage into or through, or removeby taking away material from the earth. The goal of digging is toextract as much valuable material as possible and reduce theamount of unwanted materials.
Drilling Drilling is the act or process of making a cylindrical hole with a tool
for the purpose of exploration, blasting preparation, or tunneling.
Electrowinning An electrochemical process in which a metal dissolved within anelectrolyte is plated onto an electrode.
Emissions A gaseous waste discharged for a process.
Grinding Grinding is the process of reducing the size of material into fine
41
7/30/2019 Mining Industry Energy Bandwidth
http://slidepdf.com/reader/full/mining-industry-energy-bandwidth 46/47
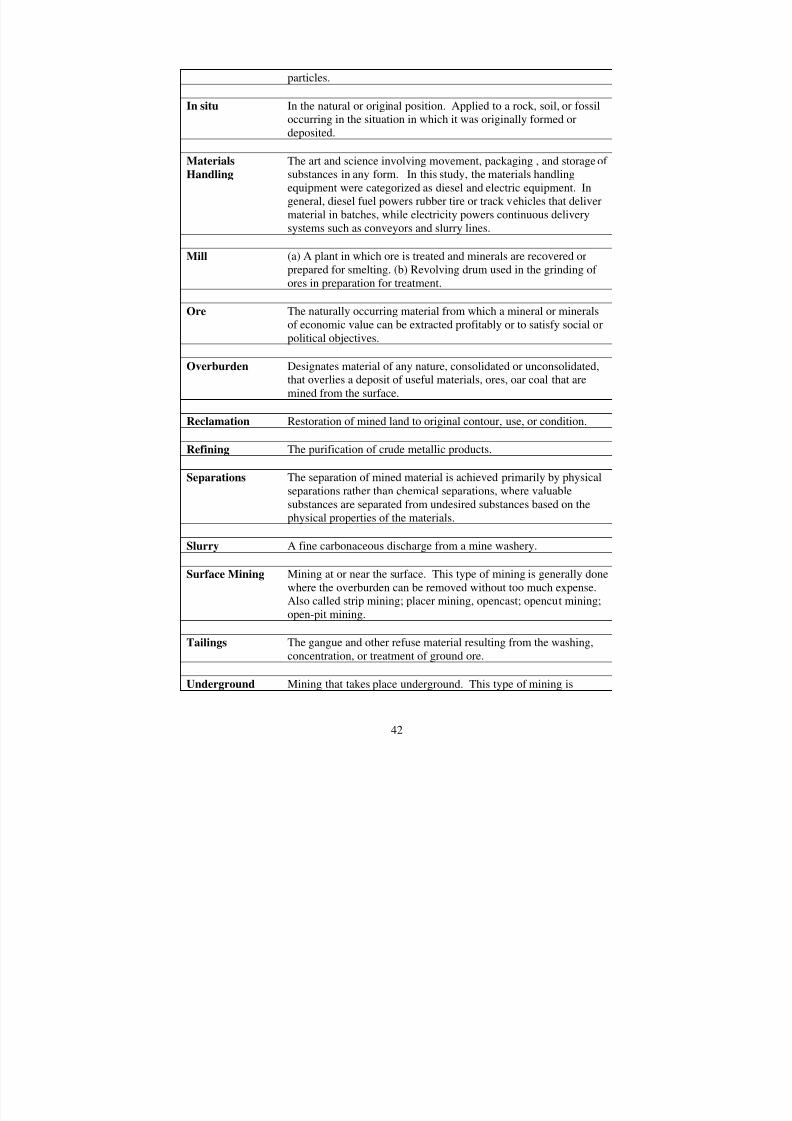
particles.
In situ In the natural or original position. Applied to a rock, soil, or fossiloccurring in the situation in which it was originally formed ordeposited.
Materials
Handling
The art and science involving movement, packaging , and storagesubstances in any form. In this study, the materials handlingequipment were categorized as diesel and electric equipment. Ingeneral, diesel fuel powers rubber tire or track vehicles that deliver
aterial in batches, while elec
of
tricity powers continuous deliverymsystems such as conveyors and slurry lines.
Mill
ting. (b) Revolving drum used in the grinding of (a) A plant in which ore is treated and minerals are recovered orrepared for smelp
ores in preparation for treatment.
Ore The naturally occurring material from which a mineral or mineralsof economic value can be extracted profitably or to satisfy social opolitical objectives.
r
Overburden Designates material of any nature, consolidated or unconsolidated,that overlies a deposit of useful materials, ores, oar coal that aremined from the surface.
Reclamation Restoration of mined land to original contour, use, or condition.
Refining ude metallic products.The purification of cr
Separations The separation of mined material is achieved primarily by physicaleparations rs ather than chemical separations, where valuable
substances are separated from undesired substances based on thephysical properties of the materials.
Slurry A fine carbonaceous discharge from a mine washery.
Surface Mining Mining at or near the surface. This type of mining is generally donewhere the overburden can be removed without too much expense.
lso called strip mining; placer mining, opencast; opencut mining;Aopen-pit mining.
Tailings The gangue and other refuse material resulting from the washing,concentration, or treatment of ground ore.
Underground Mining that takes place underground. This type of mining is
42

7/30/2019 Mining Industry Energy Bandwidth
http://slidepdf.com/reader/full/mining-industry-energy-bandwidth 47/47
Mining one where the valuable material is located deep enoughhere it is not economically viable to be removed by surface
generally dwmining.
Ventilation s the process of bringing fresh air to the underground
ine workings while removing stale and/or contaminated air from
Ventilation i
mthe mine and also for cooling work areas in deep undergroundmines.