Embed Size (px)
Citation preview
MINING IN TRANFORMATIONAL TIMES
Core DaysLa Ronge, SK
Pam Schwann, President
May 25, 2017
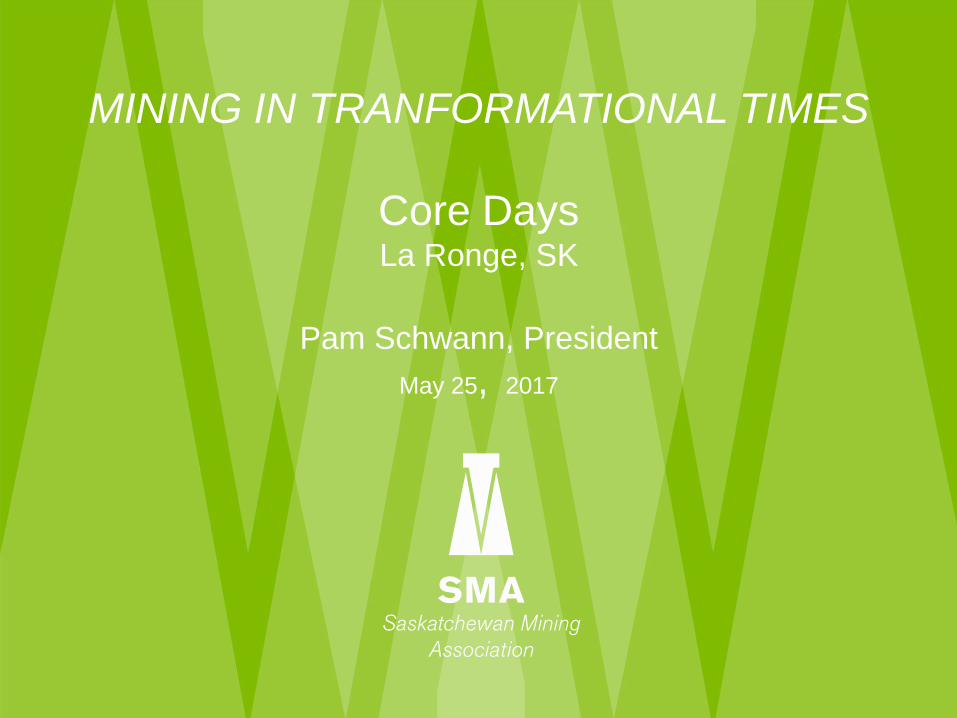
SASKATCHEWAN MINING ASSOCIATION
• Voice of the Saskatchewan mining industry.
• Over 45 Member companies including producers and exploration companies:
o PotashCorp, Mosaic, Agrium, Cameco, AREVA, Westmoreland Coal, Silver Standard Resources, HudBay Minerals, BHP Billiton, K+S Potash Canada Inc., Denison, Rio Tinto, Vale, Shore Gold Inc. Western Potash, and dozens of exploration companies.
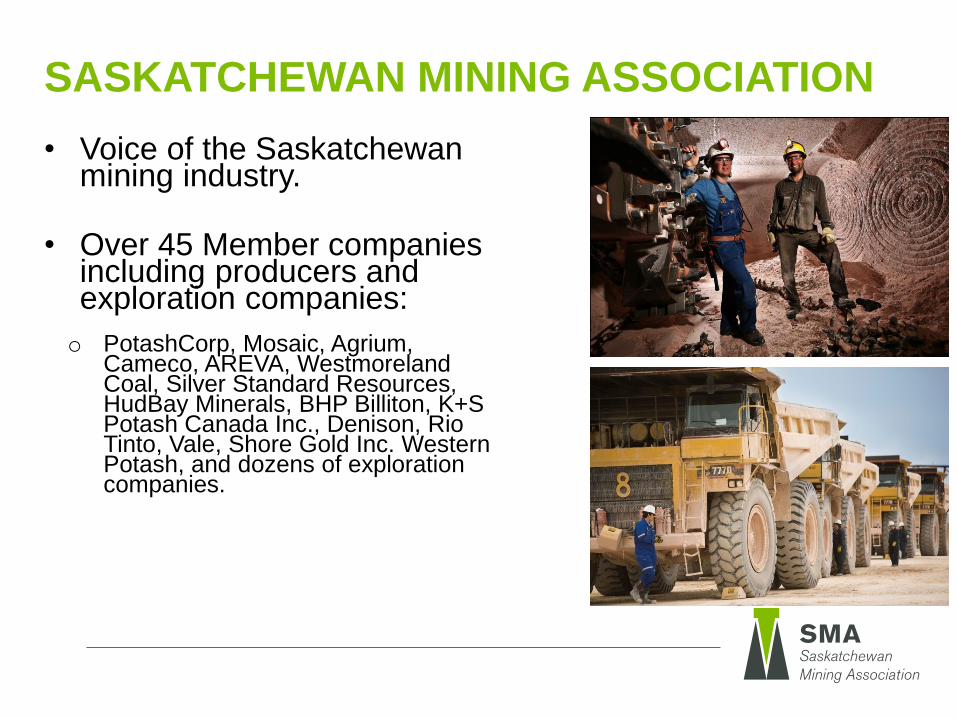
SASKATCHEWAN IS A CANADIAN &
GLOBAL LEADER IN MINING
#1Canadian Mineral
Investment Attraction
#1 Global
#1 Potash
Producer
Global
(30%)
#2 Uranium Producer
Global
(22%)
#4
Value of Mineral Product $5.5B
(drop)
#1 Industrial Employer
of Indigenous
people
#4
Canadian Expln $193
M
LeadingClient of Rail and Vessel Transport
MINING: PILLAR OF LOCAL &
PROVINCIAL ECONOMIES
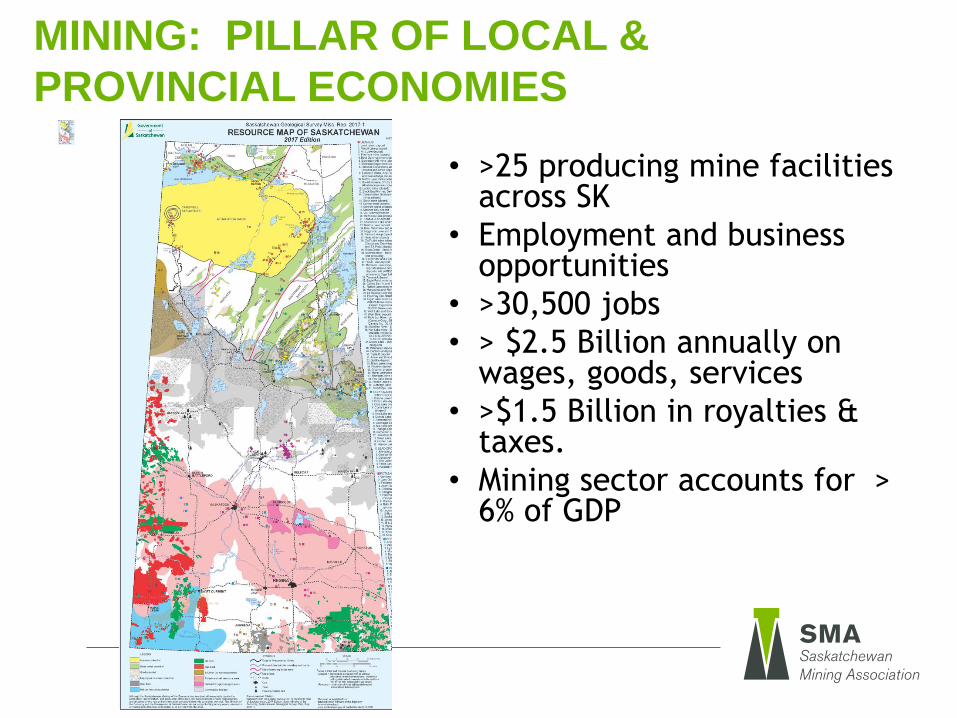
• >25 producing mine facilities across SK
• Employment and business opportunities
• >30,500 jobs
• > $2.5 Billion annually on wages, goods, services
• >$1.5 Billion in royalties &taxes.
• Mining sector accounts for > 6% of GDP
CANADIAN MINERAL PRODUCTION
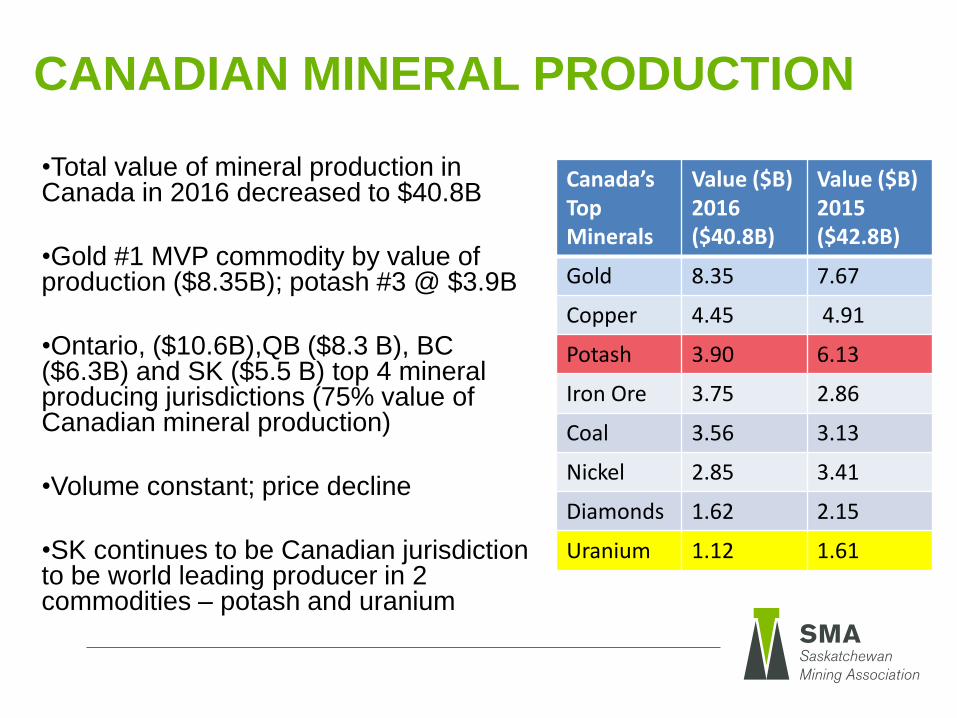
Canada’s Top Minerals
Value ($B)2016($40.8B)
Value ($B)2015($42.8B)
Gold 8.35 7.67
Copper 4.45 4.91
Potash 3.90 6.13
Iron Ore 3.75 2.86
Coal 3.56 3.13
Nickel 2.85 3.41
Diamonds 1.62 2.15
Uranium 1.12 1.61
•Total value of mineral production in Canada in 2016 decreased to $40.8B
•Gold #1 MVP commodity by value of production ($8.35B); potash #3 @ $3.9B
•Ontario, ($10.6B),QB ($8.3 B), BC ($6.3B) and SK ($5.5 B) top 4 mineral producing jurisdictions (75% value of Canadian mineral production)
•Volume constant; price decline
•SK continues to be Canadian jurisdiction to be world leading producer in 2 commodities – potash and uranium
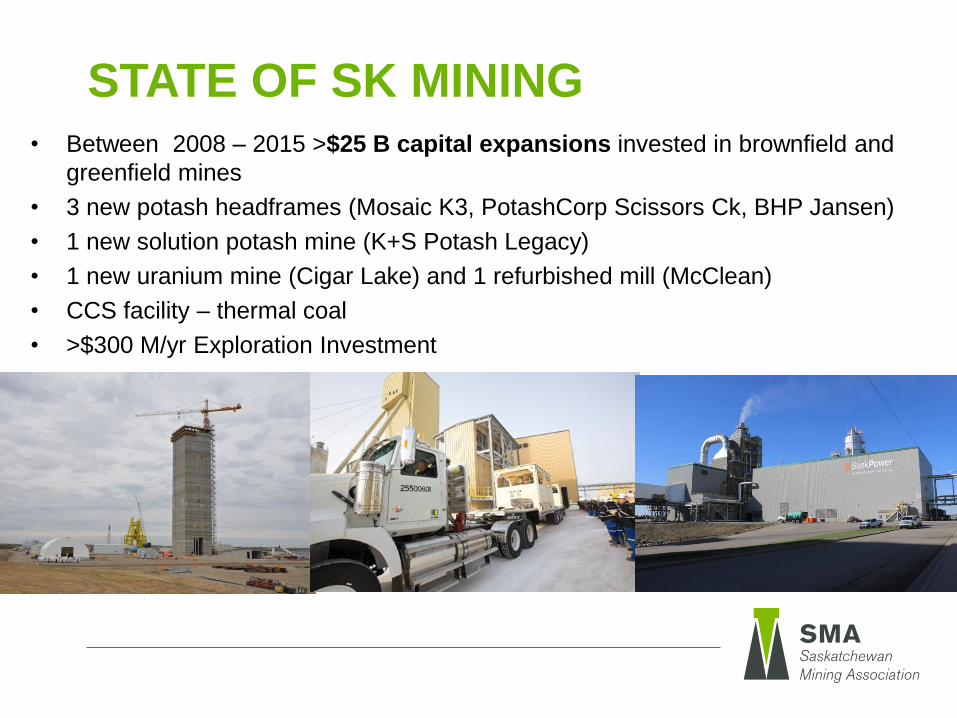
STATE OF SK MINING• Between 2008 – 2015 >$25 B capital expansions invested in brownfield and
greenfield mines
• 3 new potash headframes (Mosaic K3, PotashCorp Scissors Ck, BHP Jansen)
• 1 new solution potash mine (K+S Potash Legacy)
• 1 new uranium mine (Cigar Lake) and 1 refurbished mill (McClean)
• CCS facility – thermal coal
• >$300 M/yr Exploration Investment
MINING IN TRANSFORMATIONAL TIMES –
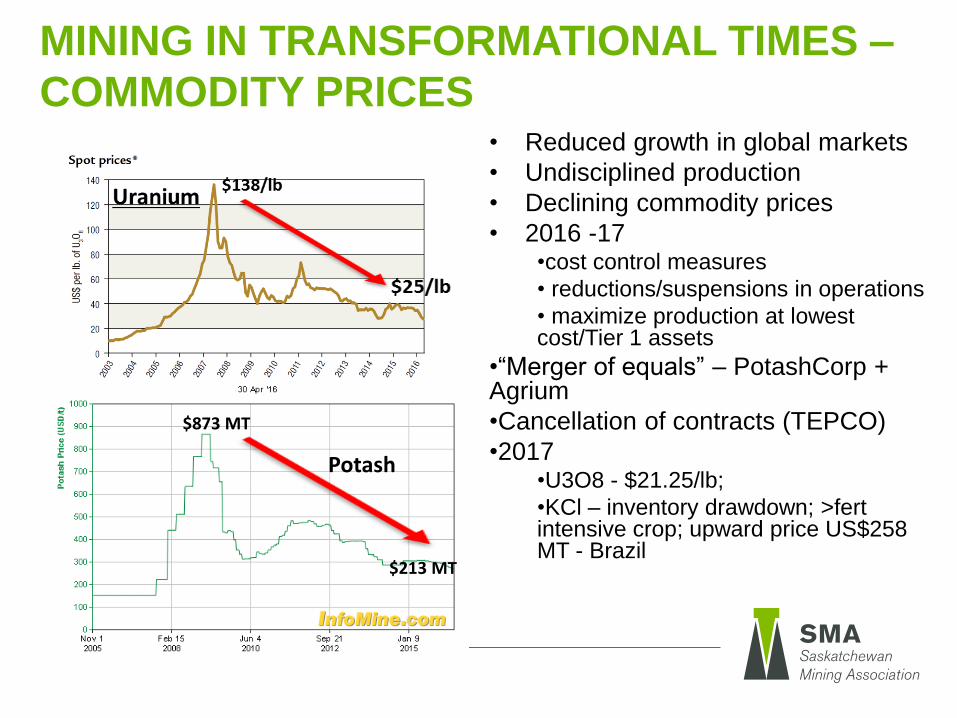
COMMODITY PRICES• Reduced growth in global markets
• Undisciplined production
• Declining commodity prices
• 2016 -17•cost control measures
• reductions/suspensions in operations
• maximize production at lowest cost/Tier 1 assets
•“Merger of equals” – PotashCorp + Agrium
•Cancellation of contracts (TEPCO)
•2017 •U3O8 - $21.25/lb;
•KCl – inventory drawdown; >fertintensive crop; upward price US$258 MT - Brazil
Potash
$138/lb
$873 MT
$213 MT
DRIVERS – China & India• BUT Positive Long Term Fundamentals
• GROWING GLOBAL POPULATION = > FOOD
+ > CLEAN ENERGY ON < LAND
• Growing industrialized middle class (9.2 B by 2050)
• China consumed 5% of world’s base metals in 1980s v ~30% today
• > meat, vegetable and electrical consumption
• crop production must increase by 70% by 2050
• Energy consumption increase by 75% by 2040
• Limited local potash and uranium resources
• Low C economy
• Trade Agreements • Federal Nuclear Cooperation Agreements - China and India
• Canada – European Free Trade Agreement
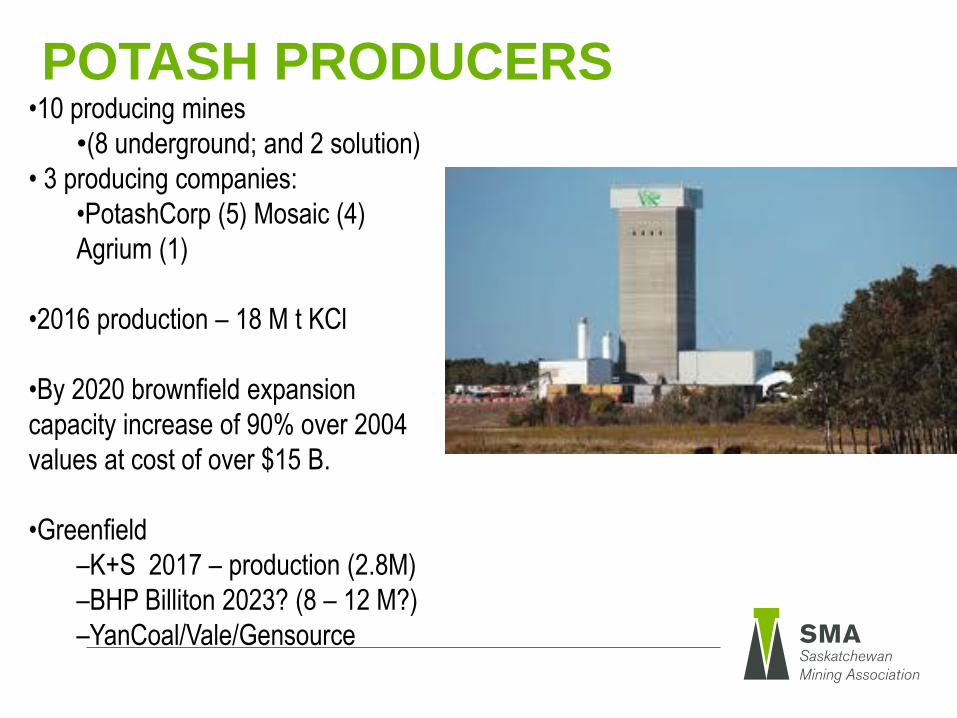
POTASH PRODUCERS •10 producing mines
•(8 underground; and 2 solution)
• 3 producing companies:
•PotashCorp (5) Mosaic (4)
Agrium (1)
•2016 production – 18 M t KCl
•By 2020 brownfield expansion
capacity increase of 90% over 2004
values at cost of over $15 B.
•Greenfield
–K+S 2017 – production (2.8M)
–BHP Billiton 2023? (8 – 12 M?)
–YanCoal/Vale/Gensource
Lanigan Division 4-Pass System
14.6 m
4.9 m
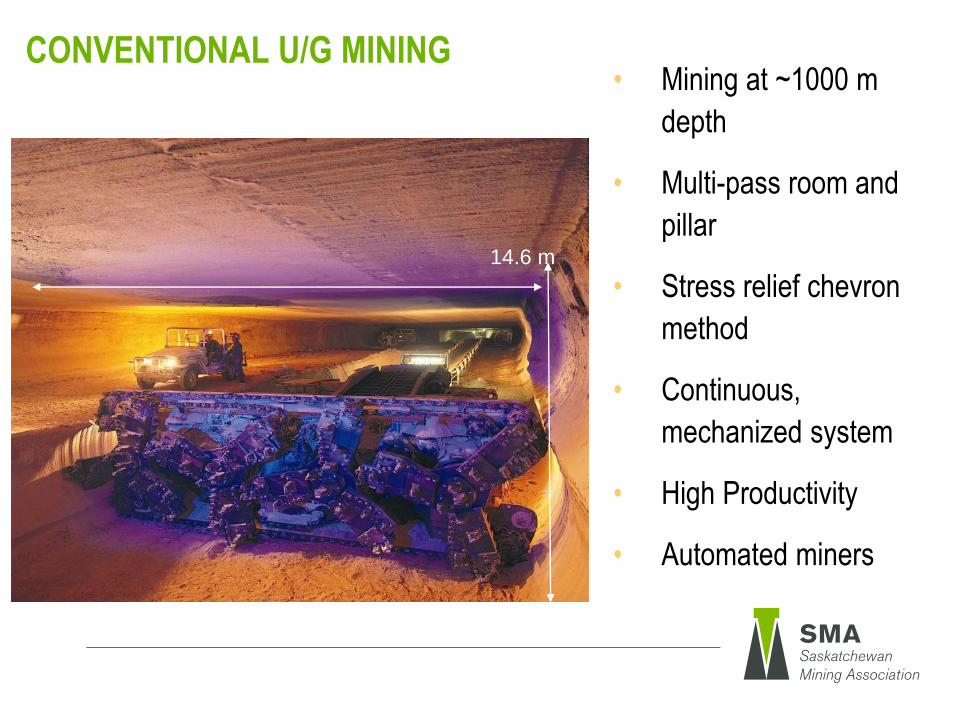
CONVENTIONAL U/G MINING • Mining at ~1000 m
depth
• Multi-pass room and
pillar
• Stress relief chevron
method
• Continuous,
mechanized system
• High Productivity
• Automated miners
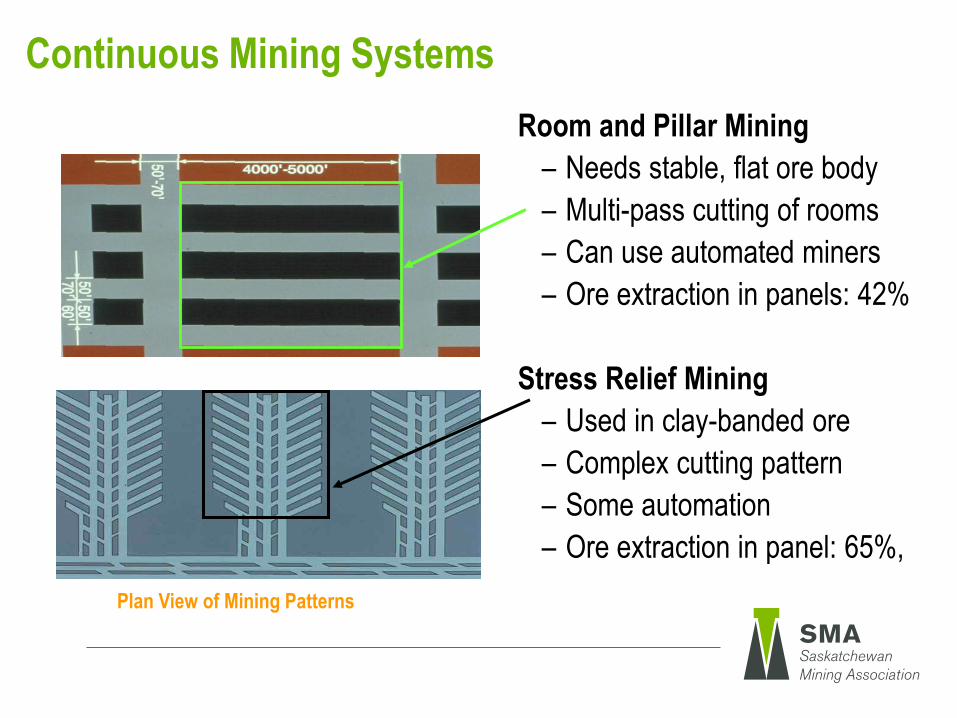
Continuous Mining Systems
Room and Pillar Mining
– Needs stable, flat ore body
– Multi-pass cutting of rooms
– Can use automated miners
– Ore extraction in panels: 42%
Stress Relief Mining
– Used in clay-banded ore
– Complex cutting pattern
– Some automation
– Ore extraction in panel: 65%, (42% overall)
Plan View of Mining Patterns
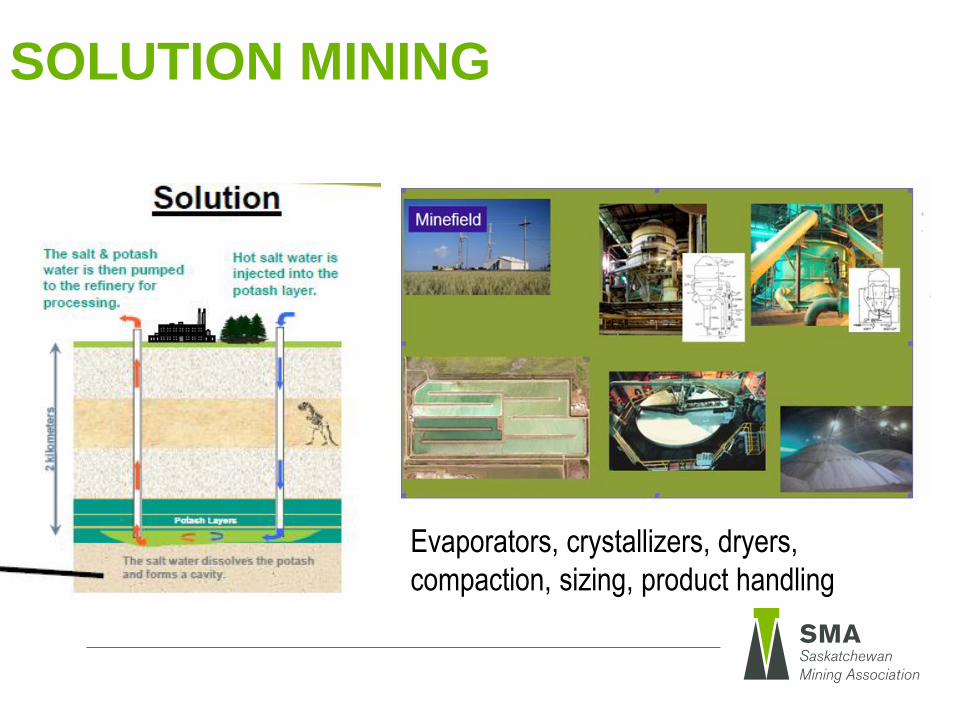
SOLUTION MINING
Evaporators, crystallizers, dryers,
compaction, sizing, product handling

URANIUM PRODUCERS
• 100% of Canadian production; 22% global production
• Record 35 M lbs U3O8 in 2016
• 2 operating mines in 2017
• McArthur River/Key - (~18 M lbs)
• Cigar Lake/ McClean lake (~16 M lbs)
• Eagle Point/Rabbit – production suspended in 1Q 2016
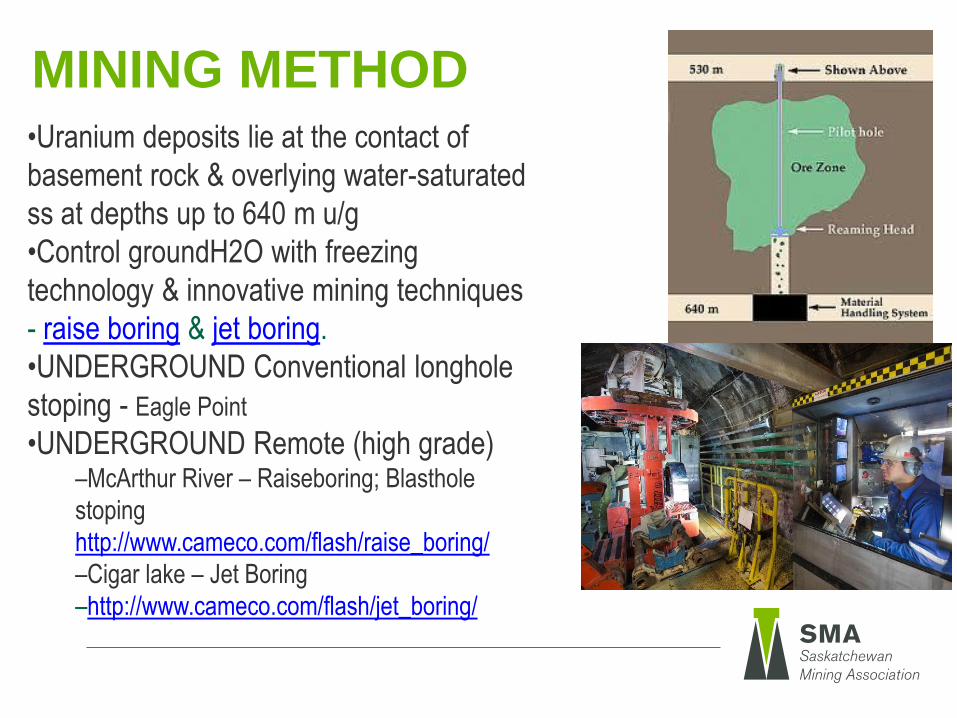
MINING METHOD •Uranium deposits lie at the contact of
basement rock & overlying water-saturated
ss at depths up to 640 m u/g
•Control groundH2O with freezing
technology & innovative mining techniques
- raise boring & jet boring.
•UNDERGROUND Conventional longhole
stoping - Eagle Point
•UNDERGROUND Remote (high grade)–McArthur River – Raiseboring; Blasthole
stoping
http://www.cameco.com/flash/raise_boring/
–Cigar lake – Jet Boring
–http://www.cameco.com/flash/jet_boring/
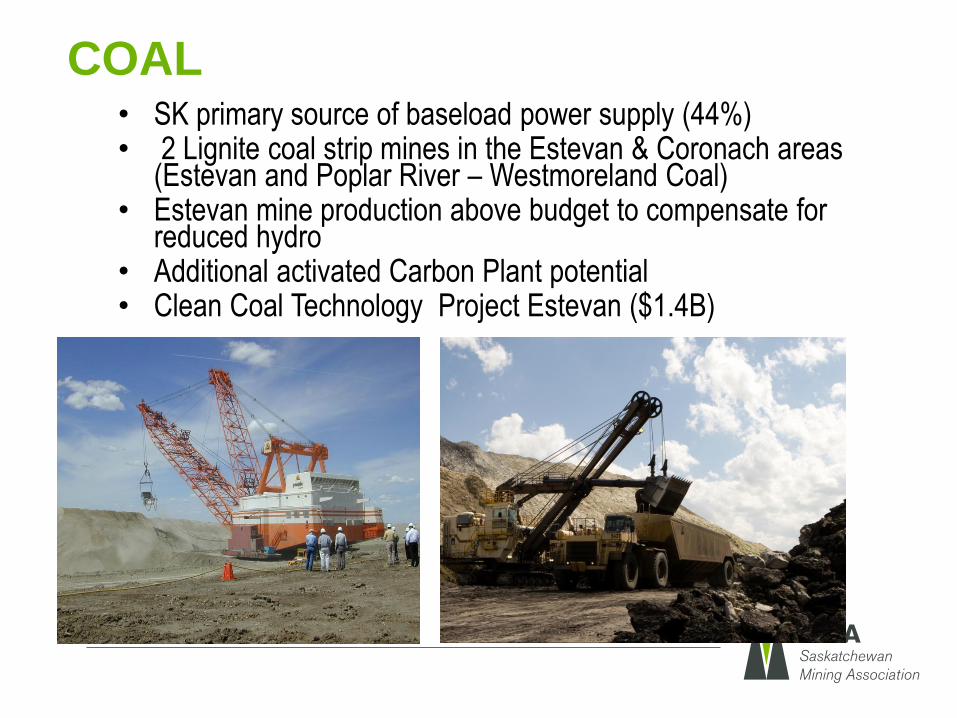
COAL• SK primary source of baseload power supply (44%)• 2 Lignite coal strip mines in the Estevan & Coronach areas
(Estevan and Poplar River – Westmoreland Coal)• Estevan mine production above budget to compensate for
reduced hydro• Additional activated Carbon Plant potential • Clean Coal Technology Project Estevan ($1.4B)
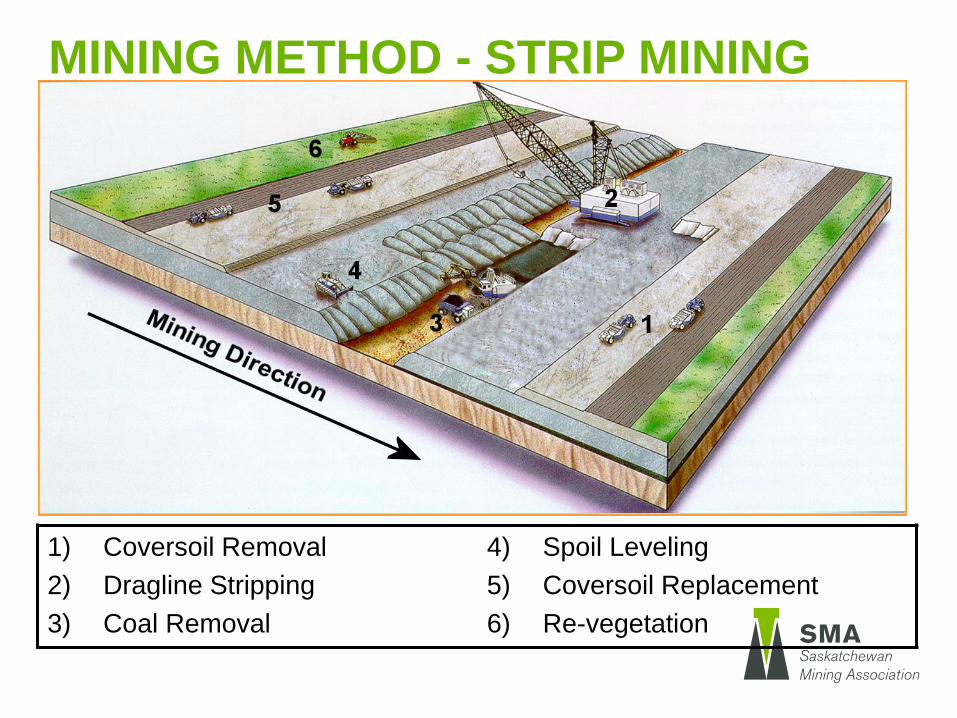
MINING METHOD - STRIP MINING
1) Coversoil Removal
2) Dragline Stripping
3) Coal Removal
4) Spoil Leveling
5) Coversoil Replacement
6) Re-vegetation
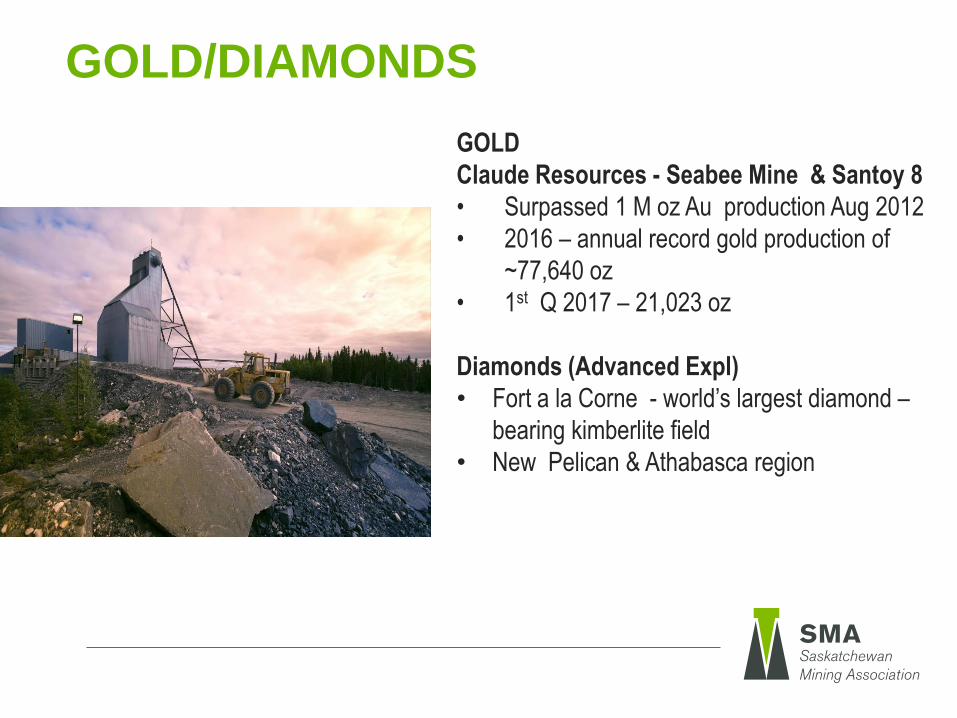
GOLD
Claude Resources - Seabee Mine & Santoy 8
• Surpassed 1 M oz Au production Aug 2012
• 2016 – annual record gold production of
~77,640 oz
• 1st Q 2017 – 21,023 oz
Diamonds (Advanced Expl)
• Fort a la Corne - world’s largest diamond –
bearing kimberlite field
• New Pelican & Athabasca region
GOLD/DIAMONDS
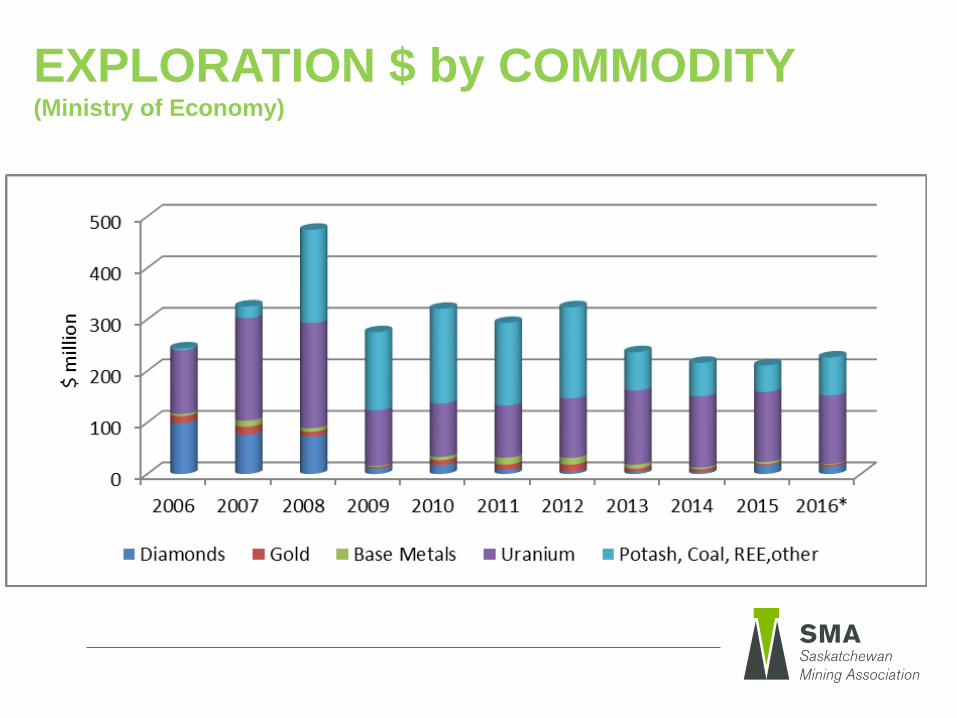
EXPLORATION $ by COMMODITY(Ministry of Economy)
MINING IN TRANSFORMATIONAL TIMES
- Regulatory
Multiple federal regulatory initiatives underway will strongly influence
mining’s operational viability
1. Expert Panel Report on EA Processes
2. Standing Committee Report on the Fisheries Act
3. Standing Committee Report on the Navigation Protection Act
4. Species at Risk Act – incl Woodland Caribou
5. MMER/Schedule 2
6. Migratory Birds Act
7. Climate Change
MINING IN TRANSFORMATIONAL TIMES
- Regulatory
Multiple federal regulatory initiatives underway will strongly influence
mining’s operational viability. Seen through lens’ of:
• Public Support
• Public Confidence
• Indigenous participation
• “Clean growth” – ongoing reductions in emissions, discharges

INDIGENOUS RELATIONSHIPS
Economic Outcomes (2016)
o Mining: decades-long constructive relationship
o Employment at minesites 2584
o 52% (1344) of all N. SK mine workers are RSN;
o $ 123 M Annual Payroll RSN
o 1 in 5 jobs in N SK directly related to mining.
o $312 M (43%) in goods and services purchased from
businesses based in N SK.
o Mining operations in S SK also increasing the number of
indigenous employees, suppliers and building educational
and economic capacity in indigenous communities –
PotashCorp Aboriginal Content Playbook
Employment 52% (1344) 1 in 5
Business 43% ($312 M)
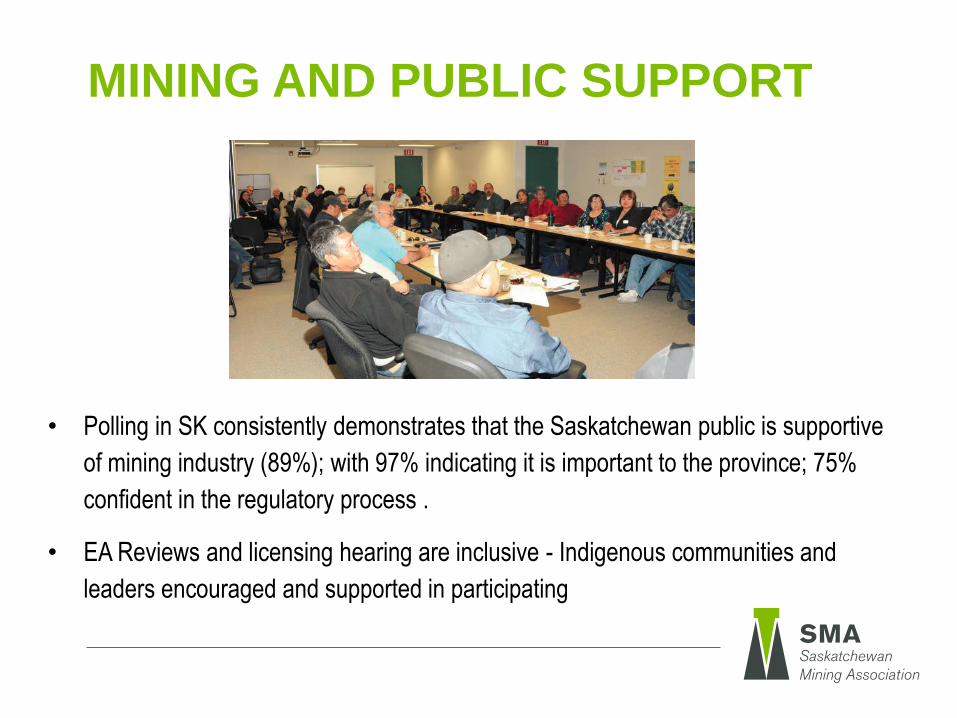
MINING AND PUBLIC SUPPORT
• Polling in SK consistently demonstrates that the Saskatchewan public is supportive
of mining industry (89%); with 97% indicating it is important to the province; 75%
confident in the regulatory process .
• EA Reviews and licensing hearing are inclusive - Indigenous communities and
leaders encouraged and supported in participating
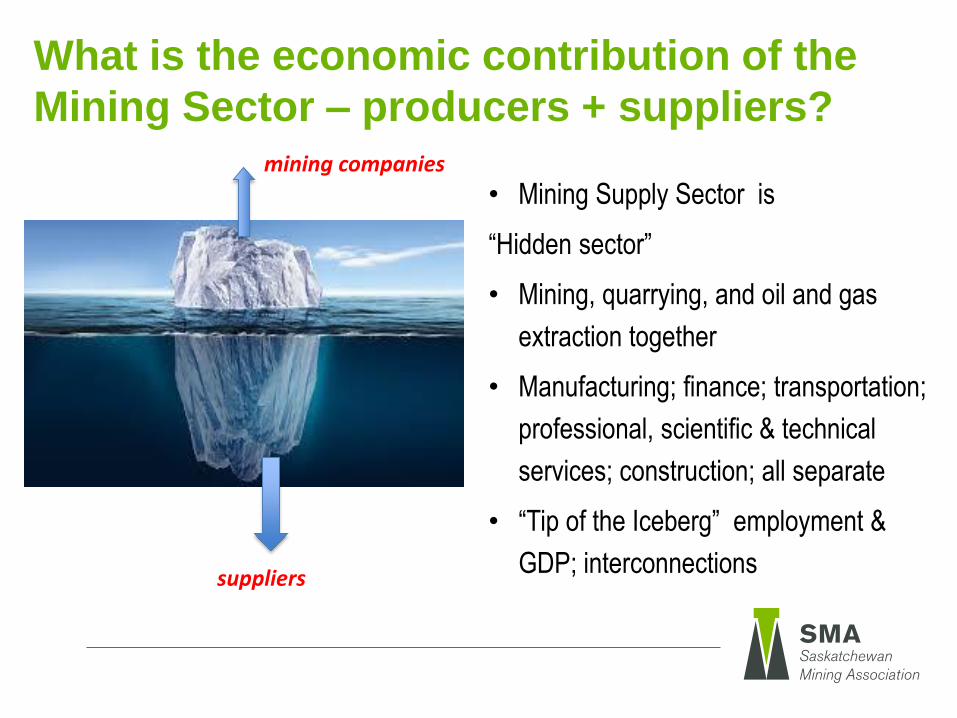
What is the economic contribution of the
Mining Sector – producers + suppliers?
• Mining Supply Sector is
“Hidden sector”
• Mining, quarrying, and oil and gas
extraction together
• Manufacturing; finance; transportation;
professional, scientific & technical
services; construction; all separate
• “Tip of the Iceberg” employment &
GDP; interconnectionssuppliers
mining companies
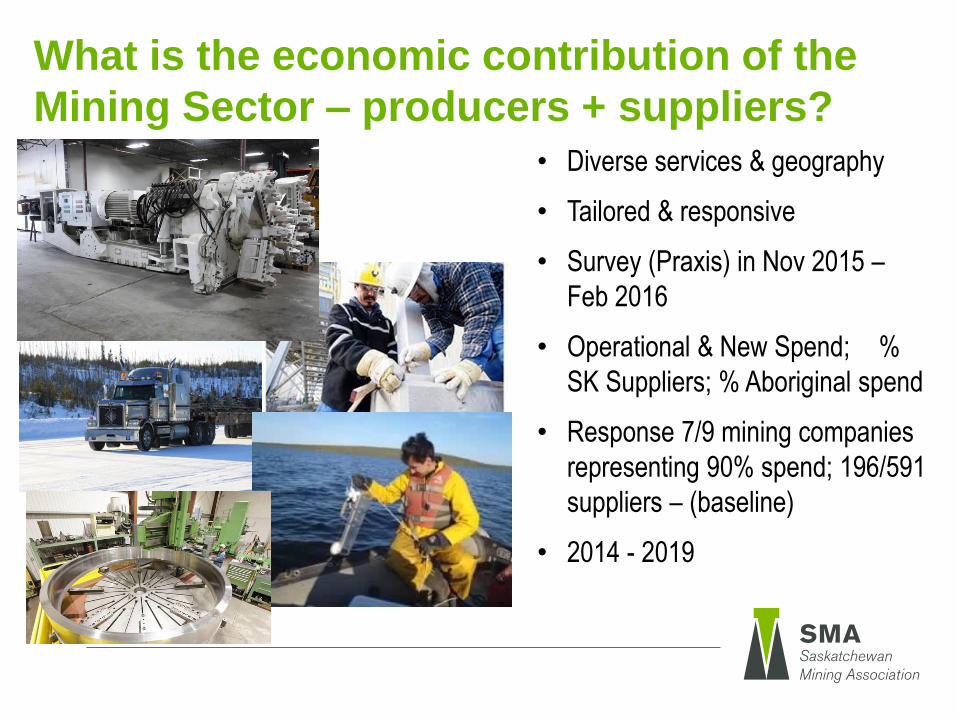
What is the economic contribution of the
Mining Sector – producers + suppliers?• Diverse services & geography
• Tailored & responsive
• Survey (Praxis) in Nov 2015 –
Feb 2016
• Operational & New Spend; %
SK Suppliers; % Aboriginal spend
• Response 7/9 mining companies
representing 90% spend; 196/591
suppliers – (baseline)
• 2014 - 2019
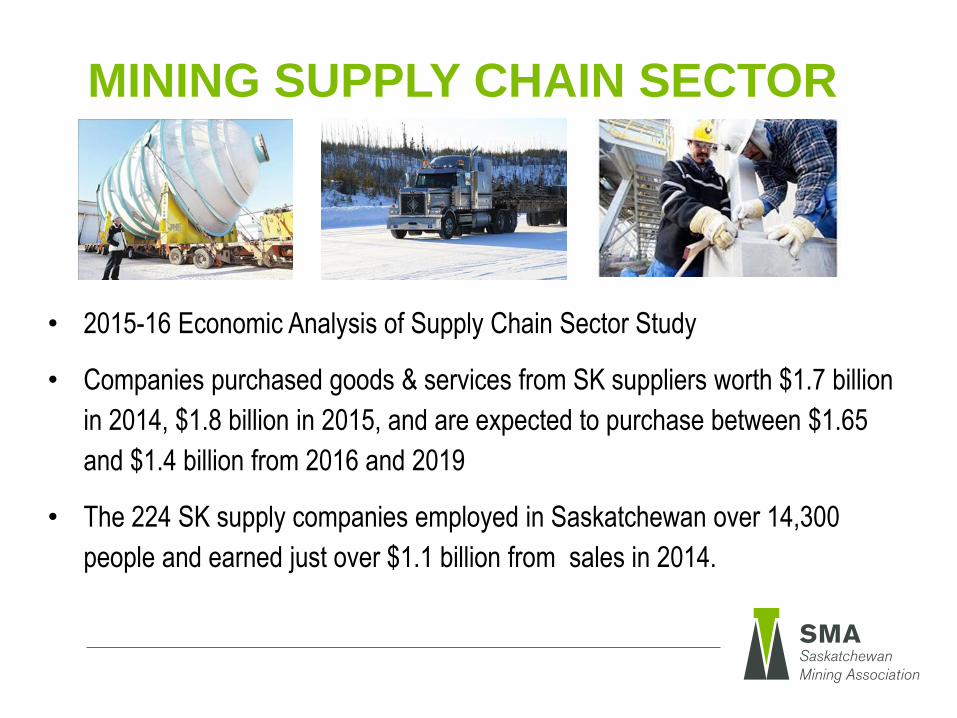
MINING SUPPLY CHAIN SECTOR
• 2015-16 Economic Analysis of Supply Chain Sector Study
• Companies purchased goods & services from SK suppliers worth $1.7 billion
in 2014, $1.8 billion in 2015, and are expected to purchase between $1.65
and $1.4 billion from 2016 and 2019
• The 224 SK supply companies employed in Saskatchewan over 14,300
people and earned just over $1.1 billion from sales in 2014.
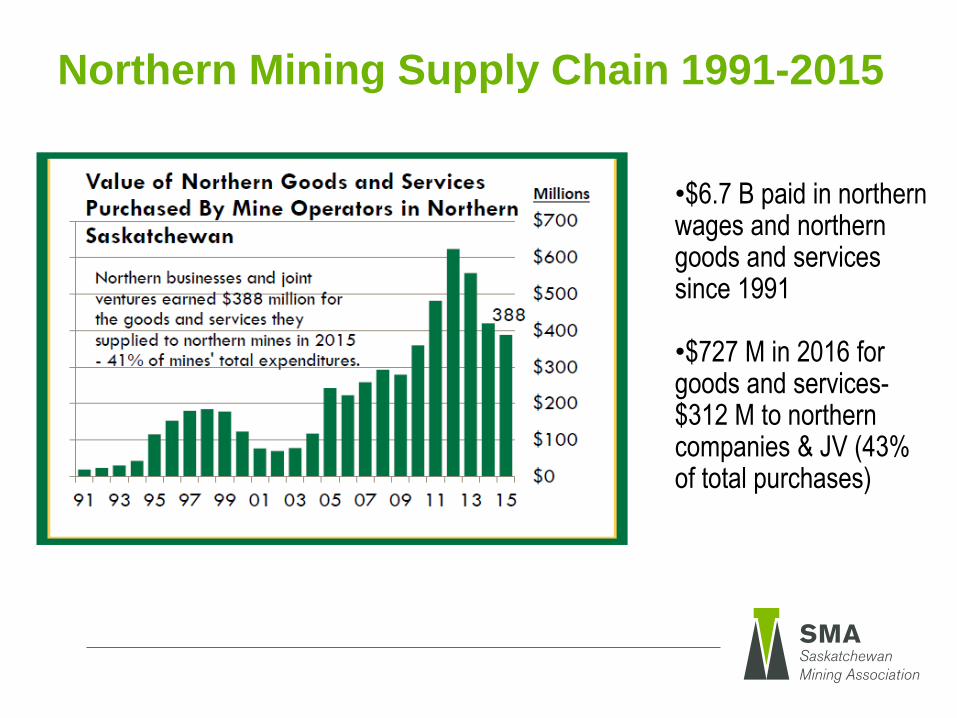
Northern Mining Supply Chain 1991-2015
•$6.7 B paid in northern wages and northern goods and services since 1991
•$727 M in 2016 for goods and services-$312 M to northern companies & JV (43% of total purchases)
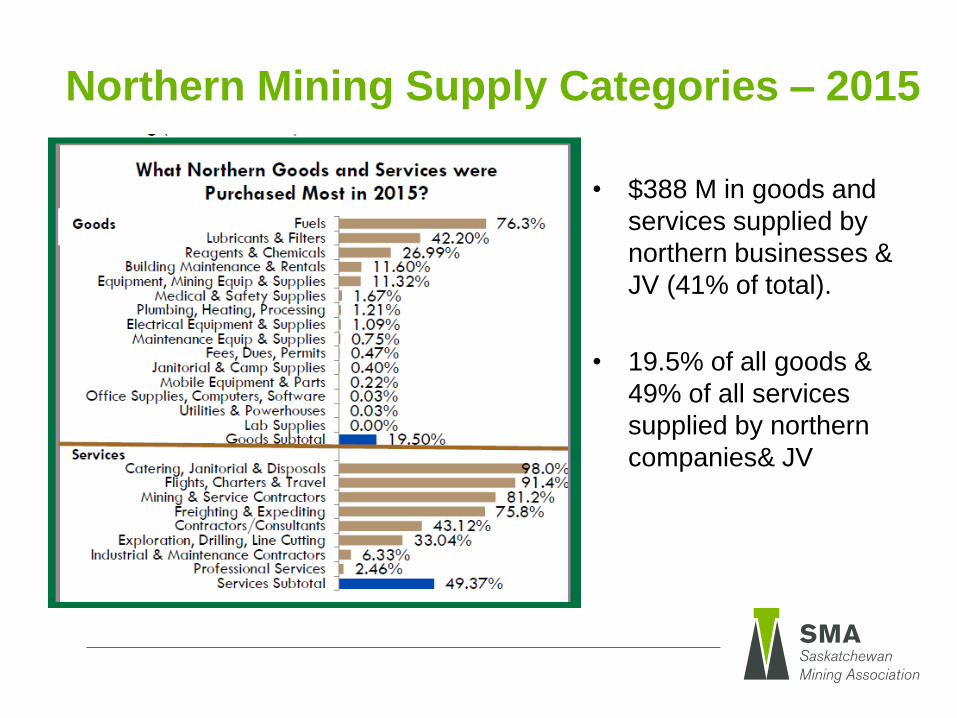
Northern Mining Supply Categories – 2015
• $388 M in goods and
services supplied by
northern businesses &
JV (41% of total).
• 19.5% of all goods &
49% of all services
supplied by northern
companies& JV
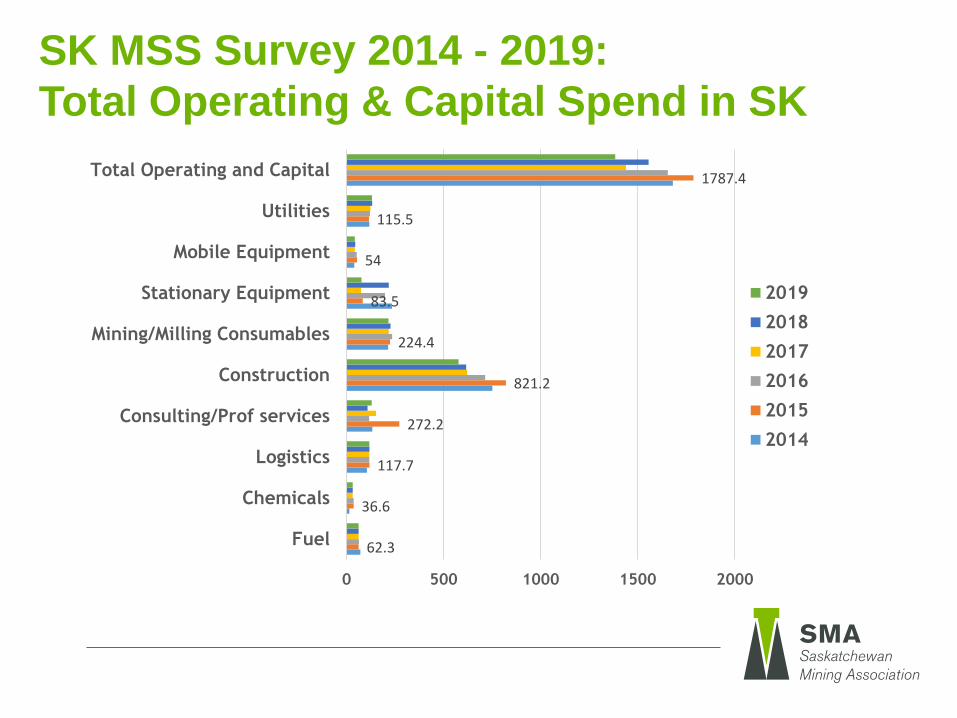
SK MSS Survey 2014 - 2019:
Total Operating & Capital Spend in SK
62.3
36.6
117.7
272.2
821.2
224.4
83.5
54
115.5
1787.4
0 500 1000 1500 2000
Fuel
Chemicals
Logistics
Consulting/Prof services
Construction
Mining/Milling Consumables
Stationary Equipment
Mobile Equipment
Utilities
Total Operating and Capital
2019
2018
2017
2016
2015
2014
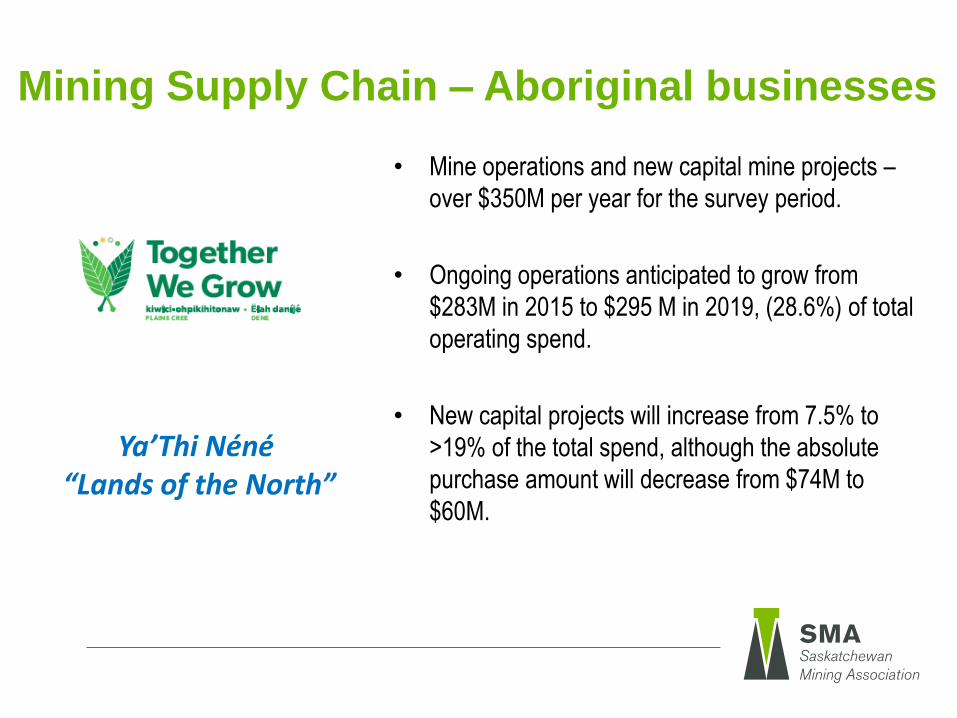
Mining Supply Chain – Aboriginal businesses
• Mine operations and new capital mine projects –
over $350M per year for the survey period.
• Ongoing operations anticipated to grow from
$283M in 2015 to $295 M in 2019, (28.6%) of total
operating spend.
• New capital projects will increase from 7.5% to
>19% of the total spend, although the absolute
purchase amount will decrease from $74M to
$60M.
Ya’Thi Néné“Lands of the North”
1500 - 2002 Victoria Avenue
Regina, SK S4P 0R7
Phone 306-757-9505
Fax 306-569-1085
Questions?