Embed Size (px)
Citation preview
LICENTIATE T H E S I S
Department of Civil, Environmental and Natural Resources EngineeringDivision of Mining and Geotechnical Engineering Rock Mass Transportation Systems in
Underground Mines: Consequences and Solutions when Mining at Greater Depths
ISSN 1402-1757ISBN 978-91-7583-886-1 (print)ISBN 978-91-7583-887-8 (pdf)
Luleå University of Technology 2017
Bartłom
iej Skawina R
ock Mass Transportation System
s in Underground M
ines: Consequences and Solutions w
hen Mining at G
reater Depths
Bartłomiej Skawina
Mining and Rock Engineering
Rock mass transportation systems inunderground mines: consequences andsolutions when mining at greater depths
Bartłomiej Skawina

Rock mass transportation systems inunderground mines: consequences and solutions when mining at greater depths

Printed by Luleå University of Technology, Graphic Production 2017
ISSN 1402-1757 ISBN 978-91-7583-886-1 (print)ISBN 978-91-7583-887-8 (pdf)
Luleå 2017
www.ltu.se
i
PREFACE The research work presented in this thesis is part of the I2 Mine Project (Innovative
Technologies and Concepts for the Intelligent Deep Mine of the Future), WP 2 subtask 2.1.1 and was carried out at the Division of Mining and Geotechnical Engineering at Luleå University of Technology. The project started in 2011 and ended in 2016. The aim of the project was to develop potential new mining methods or processes, or alter/modify already existing mining methods or systems. In this thesis, I have included a brief summary of the challenges related to rock mass transportation in deep underground mines. This helped me to further address the major critical problems that are related to mining at greater depths.
Before I move on I would like to thank all the people for sharing their knowledge, experiences and reflections with me. I would like to thank my supervisor Associate Prof. Jenny Greberg for her support and technical advice but also for allowing me to take a part in the I2 Mine Project. My thanks go to Dr. Abubakry Salama for his advice and good cooperation during and after the project and thanks to Prof. Håkan Schunnesson for his comments. It would be difficult to manage without having the LKAB and Boliden mining companies sharing their experiences and knowledge, therefore my last but not least thanks go to them too.
Bart omiej SkawinaMay, 2017Luleå, Sweden

ii
iii
ABSTRACT The research presented in this thesis addresses a number of challenges related to rock mass transportation in deep underground mines. In particular, high energy consumption and high exhaust gas emissions from diesel and electric LHDs, the effects of ore pass loss on the loading, hauling and dumping operations due to increasing stresses and increasing costs due to the longer vertical transportation of the rock masses. These critical challenges have been identified by a literature review and analysis of data collected from 15 international deep mines. In order to answer the formulated research questions, three studies on various issues related to rock mass transportation in deep underground mines were made, and the analysiswas performed mainly using discrete event simulation.
The thesis presents a study of energy consumption and exhaust gas emissions from diesel and electric LHDs with similar bucket sizes. The results show the possible energy savings and adecrease in CO2 emissions when using electric LHDs instead of diesel ones. The thesis also presents a study of the effects of ore pass loss on LHD operations and on the mine production.Maintaining the production with a lower number of operational ore pass structures by increasing the number of LHDs can have a negative effect on the production. This is because an increased number of LHDs in operation will results in increased waiting times for the LHDs and cause variations in the production rate. These variations can be large, causing severe consequences if not managed correctly. The results also show the importance of developing alternative plans for underground loading and hauling operations in case of an ore pass loss. Transportation of rock, especially when mining depth increases, is often associated with high costs and long transportation times. To decrease the amount of unnecessary rock transportation, near-to-face sorting plants may be one alternative. In the thesis, a study was performed on a possible reduction in rock mass transportation to the surface when using this technique. The results conclude that near-to-face sorting plants could lower the environmental effects generated by unnecessary rock transportation to the surface.
Keywords: rock transportation systems, discrete event simulation, deep underground mining, ore pass loss, LHD, sorting plant, energy consumption and gas emissions.

iv
v
LIST OF APPENDED PAPERS
PAPER ASalama A.J., Greberg J., Skawina B., and Gustafson A., Analyzing energy consumption and gas emissions of loading equipment in underground mining, CIM Journal, Vol. 6, No. 4, 2015, pp. 179-188, http://dx.doi.org/10.15834/cimj.2015.24.
PAPER BSkawina B., Greberg J., Salama A., and Gustafson A., The effects of ore pass loss on loading, hauling and dumping operations and production rates in sublevel caving mine, submitted for publication to Journal of Southern African Institute of Mining and Metallurgy, 2017.
PAPER CSkawina B., Greberg J., Salama A., and Novikov E., Evaluation of near-to-face sorting plant in an underground mine: A case study from Kristineberg mine, in Proceedings of the SME Annual Conference and Expo, 21st – 24th February 2016, Phoenix, USA, 2016a.

vi
vii
RELATED PUBLICATIONS
1. Greberg J., Salama A., Gustafson A., and Skawina B., Alternative process flow for underground mining operations: Analysis of conceptual transport methods using discrete event simulation, Minerals. 2016, 6(3), 65.
2. Salama A., Skawina B., Greberg J., and Sundqvist F., Future loading system at Kiirunavaara underground mining, Technical Report, Lulea University of Technology, Lulea, Sweden, 2015c.
3. Skawina B., Greberg J., Salama A., and Jonsson K., Ore pass loss mitigation approach in Malmberget mine, in Proceedings of the seventh international conference and exhibition on Mass Mining Conference, 9th - 11th May 2016, Sydney, Australia, 2016b, pp. 617-622.
4. Skawina B., Salama A., Greberg J., and Novikov E., Introducing a Sorting Plant in the Kristineberg Mine – an Analysis of the Effect on Production, Technical Report, Lulea University of Technology, Lulea, Sweden, 2015b.
5. Skawina B., Salama A., Greberg J., and Sundqvist F., Alternative Fleet Configuration for Malmberget Mine, Technical Report, Lulea University of Technology, Lulea, Sweden, 2015c.
6. Skawina B., Salama A., Greberg J., and Schunnesson H., Comparison of productionrates using different load-haul-dump fleet configurations: a case study from Kiirunavaara Mine, MPES2015 – Smart Innovation in Mining, The Southern African Institute of Mining and Metallurgy, 2015a.

viii
ix
CONTENTS
CHAPTER 1: INTRODUCTION .............................................................................................. 1
1.1 Problem statement ....................................................................................................... 11.2 Objectives .................................................................................................................... 21.3 Research scope ............................................................................................................ 21.4 Significance of the research......................................................................................... 3
CHAPTER 2: RESEARCH METHODS ................................................................................... 5
2.1 Literature review.......................................................................................................... 52.2 Data collection............................................................................................................. 62.3 Discrete Event Simulation ........................................................................................... 7
CHAPTER 3: UNDERGROUND ROCK TRANSPORTATION SYSTEMS........................ 11
3.1 Challenges of rock mass transportation in deep underground mines ........................ 123.1.1 Energy consumption .............................................................................................. 133.1.2 Ore pass losses ....................................................................................................... 133.1.3 Reduction of waste rock transportation ................................................................. 133.2 Energy consumption and noxious gas emissions of diesel and electric engines ....... 143.3 Ore pass structures..................................................................................................... 153.4 Pre-concentration....................................................................................................... 18
CHAPTER 4: ANALYSIS....................................................................................................... 21
4.1 Studied mines ............................................................................................................ 214.1.1 Kiirunavaara mine.................................................................................................. 214.1.2 Malmberget mine ................................................................................................... 234.1.3 Kristineberg mine................................................................................................... 254.2 Simulation models ..................................................................................................... 254.3 Verification and validation ........................................................................................ 28
CHAPTER 5: RESULTS AND DISCUSSION....................................................................... 31
5.1 Energy consumption and gas emissions of diesel and electric LHDs ....................... 315.1.1 LHD production rate .............................................................................................. 325.1.2 Energy consumption and cost ................................................................................ 335.1.3 Hourly energy consumption................................................................................... 345.1.4 Fuel consumption and gas emissions..................................................................... 355.2 Effects of the ore pass loss on loading and hauling operations ................................. 365.2.1 Time to mine out the production area .................................................................... 375.2.2 LHD waiting times caused by an ore pass loss...................................................... 395.2.3 Production rates ..................................................................................................... 41
x
5.3 Pre-concentration in underground mines................................................................... 44CHAPTER 6: CONCLUSIONS............................................................................................... 47
CHAPTER 7: FUTURE STUDIES.......................................................................................... 51
REFERENCES......................................................................................................................... 53
xi
LIST OF FIGURES Figure 1 Cycle steps in simulation study (Balci, 1990)....................................................... 8Figure 2 General classification of rock transportation system (Tatiya, 2013). ................. 11Figure 3 Ore pass structure (Modified source: LKAB). .................................................... 16Figure 4 Material sizing equipment (Hadjigeorgiou et al., 2005). .................................... 16Figure 5 Near-to-face sorting plant (Courtesy of TOMRA Sorting Solutions)................. 19Figure 6 Belt-type based sorter in operation (Robben et al., 2014). ................................. 20Figure 7 The 1045 m haulage level (Courtesy of LKAB). ................................................ 22Figure 8 The mining area considered in the Kiirunavaara study (Modified source: LKAB).
………………………………………………………………………………….22Figure 9 Malmberget ore bodies and haulage levels (Courtesy of LKAB). ..................... 23Figure 10 Production area A (Modified source: LKAB). ................................................... 24Figure 11 Production area B (Modified source: LKAB). ................................................... 24Figure 12 Production area C (Modified source: LKAB). ................................................... 24Figure 13 Layout of the mine used in the study (Modified source: Boliden, 2011)........... 25Figure 14 Flowchart of transportation processes used in the study based on the
Kristineberg mine. .............................................................................................. 26Figure 15 Model logic flowchart used in the study based on the Kiirunavaara and
Malmberget mines.............................................................................................. 27Figure 16 The typical trend for model value and cost (after Sargent, 2011)...................... 28Figure 17 Comparison of production rates (t/h) for diesel and electric LHDs. .................. 33Figure 18 Comparison of hourly energy consumption for diesel and electric LHDs......... 35Figure 19 Comparison of fuel consumption and CO2 emissions for diesel LHDs. ............ 36Figure 20 Time to finish mining production area A. .......................................................... 38Figure 21 Time to finish mining production area B. .......................................................... 38Figure 22 Time to finish mining production area C. .......................................................... 39Figure 23 LHD waiting times for the ore pass to become available (production area A). . 40Figure 24 LHD waiting times for the ore pass to become available (production area B). . 40Figure 25 LHD waiting times for the ore pass to become available (production area C). . 41Figure 26 Scenario vs. production rate for different areas based on the use of three LHDs.
…………………………………………………………………………….……42Figure 27 Scenario vs. production rate for different area based on the use of six LHDs... 42Figure 28 Correlation between the LHDs production rate and travelled distances in
production area C based on the use of one LHD................................................ 43Figure 29 Correlation between the LHDs production rate and travelled distances in
production area C based on the use of six LHD................................................. 43Figure 30 Comparison of sorting plant performance with the base case scenario. ............ 45Figure 31 The amount of material stacked in front of the sorting plant. ............................ 45

xii
xiii
LIST OF TABLES Table 1 Relationship between the appended papers and the research questions. ................. 2Table 2 Ore pass design to prevent interlocking arches (Hambley et al., 1983). ............... 17Table 3 Kinematics parameters for diesel and electric LHDs. ........................................... 32Table 4 Technical parameters for diesel and electric LHDs. .............................................. 32Table 5 Comparison of energy consumption and cost for diesel and electric LHDs.......... 33Table 6 Simulated scenarios. .............................................................................................. 37Table 7 Differences in tonnes of ore and waste transported to surface and backfill. ......... 44

1
CHAPTER 1: INTRODUCTION
An increasing number of underground mines worldwide are proceeding towards greater depths. In addition, several of the large open pit mines are planning or developing underground operations. As deposits are mined at greater depth, efficient mining processes are of great importance. To maintain or enhance mineral production in underground mines, numerous challenges have to be faced, especially when extracting mineral deposits at increasing depth (Bäckblom et al., 2010; Greberg and Salama, 2016). In Canada, the LaRonde gold mine owned by Agnico-Eagle mines operates at depths greater than 3,110 m belowsurface. The mine´s challenges related to increasing mine depths are related to high stressesand seismicity, rock support and ground control, long travelling distances, ventilation, logistics, temperature and ore pass losses (Greberg and Salama, 2016). In Sweden, the Kiirunavaara mine owned by Loussavaara-Kiirunavaara Aktiebolag (LKAB) is the world’s largest underground iron ore mine producer operating with main haulage level located at 1,365 m below surface. The mine’s challenges are related to high stresses and seismicity, rock support and ground control, long haul distances, high energy consumption, fragmentation, logistics and problems with ore passes (Greberg and Salama, 2016). In Chile, El Teniente mine owned by Codelco is the largest underground copper mine in the world operating at adepth greater than 1,000 m below surface. The mine began its operation in 1905 and the challenges related to increasing depth are related to long travelling distances, high energy consumption, ventilation limitations, communication and flow of information, fragmentation and logistics (Greberg and Salama, 2016). In Australia, Mt Isa owned by Mt Isa Mines is Australia’s deepest copper mine reaching depths greater than 1,900 m below surface level.The mine´s challenges related to increased mine depth are related to rock support and ground control, long travelling distances, high energy consumption, fragmentation, problems with orepasses and logistics (Greberg and Salama, 2016).
1.1 Problem statementThe rock transportation system has a considerable impact on the mining operations (Bloss et al., 2011). Poor decisions can lead to underperformance of the mine, resulting in declining performance of the mine and unexpected costs (Bloss et al., 2011). In the future, rock transportation systems will face increasing environmental regulations that will call for new equipment that is able to meet environmental legislations (Mielli, 2011).
Diesel fuelled mobile mining equipment is a significant consumer of energy in most underground mines and also a significant producer of gas emissions, requiring a vast amount of ventilation air (Bogunovic and Kecojevic, 2009). Using other types of power sources, such as electrical cable supply or battery charging may provide improvement regarding both energy consumption and gas emission (Paraszczak et al., 2013).
With increasing mining depth, distances and cost for transportation will also increase. In order to minimise the energy consumption and exhaust gas emissions efforts must be made on minimising the transported material while maintaining or increasing production. To streamline the operation more attention must be placed on more selective mining and also onthe underground and near-to-face sorting techniques.
Ore passes are common structures used for the vertical transportation of rock masses (Beus et al., 2001), and production in many deep underground mines depends on effective ore pass
2
functionality. In underground mines, ore passes frequently fail (Brummer, 1998) and are often subject to long-term loss of operational capacity. The commonly occurring ore pass problems in deep underground mines will affect the loading and transportation system when loaders and transportation vehicles will be concentrated at fewer loading and dumping points. The consequences of this and the solutions for maintaining the total production needs to be carefully evaluated before changes can be done to the system.
1.2 ObjectivesThe objectives of this research are to identify major challenges for underground rock transportation systems in deep mines and to study and evaluate possible solutions for critical parts of the system. More specifically, the research seeks to:
Identify challenges related to rock transportation when mining at greater depths; Analyse the energy consumption and gas emissions from diesel and electric LHDs in deep underground mines;Study the production effect of ore pass loss in deep underground mines;Study the production effect of using sorting plants for selective mining in underground mines.
The study is limited to hard rock underground mines using sublevel caving, block caving, stoping or cut and fill methods.
1.3 Research scope To fulfil the research objectives, the initial research question was formulated:
RQ1 – What are the major challenges related to the rock transportation system in deep underground mines?
After answering research question 1 the following research questions were derived:
RQ2 – How can the rock transportation system be improved?
RQ3 – What are the effects of ore pass loss on the rock transportation system?
RQ4 – How can the environmental effects related to the rock transportation system beminimised?
Table 1 Relationship between the appended papers and the research questions.
Appended papers
Research questions Paper A Paper B Paper C
RQ 1 X X XRQ 2 X X XRQ 3 XRQ 4 X X
In this study, Paper A presents an analysis of the energy consumption and gas emissions for different loading equipment in the Kiirunavaara mine. Paper B presents an analysis of the production effects of ore pass losses in Malmberget mine. Paper C presents an analysis of the impact on the rock transportation system when the amount of waste rock transported to thesurface, in Kristineberg mine, is reduced using a near-to-face sorting plant. The research is based on information collected from the specified mines and on the present operations used in the mine.
3
1.4 Significance of the researchThe main contribution of this research is to increase the understanding of the challenges associated with deep mining and to propose conceptual solutions for some of the most critical issues related to rock transportation in deep mining. This is done by evaluating and analysing the effects of ore pass losses on the LHD operations and on the production, the environmental impact (the emissions from) of diesel and electric LHDs and the possible reduction of unnecessary waste rock in the underground transportation system.

4
5
CHAPTER 2:RESEARCH METHOD
The research presented in this thesis is based on both qualitative and quantitative data. Qualitative data were collected using literature review and unstructured interviews and quantitative data were obtained from the studied and modelled mines. The research presented in this thesis is based on the following methodology:
Literature reviewData collectionAnalysis using Discrete Event Simulation (DES).
The literature review and collected information from 15 mines around the world are the basis for the answer to research question 1. Three mines (Kiirunavaara mine, Malmberget mine and Kristineberg mine), all located in northern Sweden, were studied and modelled to answer research questions 2, 3 and 4.
2.1 Literature reviewThe literature review includes primary and secondary sources. The primary sources are books, journals, research and technical reports and the secondary sources are conference proceedings, correspondence, master’s theses, doctoral theses and web documents. The study is split into a wide range of subject areas and covers the following topics:
1. Underground mining methodsCut and fillSublevel caving
2. Underground transportation systemsChallenges related to underground transportation systemsLHDs
i. Energy consumption and gas emissionsii. Loading and hauling practices
TrucksConveyorsTrainsOre pass structures
i. Designii. Rehabilitation strategies
iii. Previous experiencesMine planningContinuous mining equipment
3. Pre-concentrationSensor based machinesWaste rock rejection
4. Discrete event simulation
6
Simulation in miningC programmingProgramming in AutoMod
5. Statistical analysis in simulationVerification and validation tests.
2.2 Data collectionData from the studied mines were collected on several different occasions from January 2013 to September 2016. Data and information were collected as described below:
Interviews with mine operators and mine management
Interviews were conducted during three periods. The first interviews were conducted in February 2013 in Kiirunavaara mine, with a total of nine people interviewed. The second group of interviews took place in April 2014 in Malmberget mine, with a total of eleven people interviewed. The third group of interviews took place in May 2014 in Kristineberg mine, with a total number of three people interviewed. All the interviews were performed with the assistance of mine personnel. The purpose of these interviews was to clarify which operations and activities could affect deep mining in the future. The questions covered the following areas: general information about the mine, operational data, ore handling, the degree of automation, rock support, seismicity, current and future bottlenecks related to deep mining, and possible improvements in mining operations. Additionally, there were several mine visits to Kiirunavaara, Malmberget and Kristineberg mine. During these visits, each unit operation was physically observed and discussed, with the operators.
Internal reports and documentation from the mining operations
Internal reports and documentation were collected during the mine visits and covered the following areas: general information about the mine, operational data, ore handling system and rock support.
Operational data from the mining operations and data from the equipment manufacturers
This data included kinematics for the vehicles, loading, dumping and cycle times, environment specifications (layouts, practice, etc.), operating weight, engine power, bucket capacity/size and maintenance schedule. Furthermore, production data (blasting plans and Wireless Loader Information System (WOLIS) data gathered from Kiirunavaara and Malmberget mines), maintenance data of the equipment, operational data (covering a wide range of, for example, the typical strategy and behaviour for loading the machines, shift schedules, etc.) and layouts were also collected as input to the simulation.
Time studies
Data from the Kristineberg mine collected by mine personnel in 2011 was used for the study on near-to-face sorting. For the study on the effects of ore pass loss, data fromthe Malmberget mine operations was collected from both video camera recordings in March-April 2016 and a time study performed in September 2016. The time studies covered a wide range of vehicle performance data such as time spent at the face, time spent at the ore pass, turning time, time spent loading of the truck, time spent tippingthe ore into the crusher or time spent dumping the waste into backfilled drift.
7
2.3 Discrete Event SimulationA complex dynamic system such as the rock transportation system in an underground mine can be studied by performing an experiment with the actual system, building a physical model of the system or by creating a mathematical model of the system. The mathematical model of the system can be analysed by mathematical/numerical analysis or simulation. The random and complex nature of the mining operations makes it very difficult to model and analyse using numerical analysis. Discrete Event Simulation (DES) is recognised to be a suitable method for analysing dynamic complex systems, as for example, mining production systems.Pereira et al. (2010), Bradstreet (2010), Bailey et al. (2012), Greberg et al. (2015), Salama et al. (2015a-c) and Skawina et al. (2015a-c) have all recently performed simulation studies of underground haulage systems. DES is currently widely used in the mining industry for modelling rock transportation systems. DES is a simulation technique based on variables which change at those discrete points in time at which the events occur (Banks, 1999). The methods by which those events are controlled can be divided into the following approaches (Derrick et al., 1989):
Event scheduling (advances to next event)
Activity scanning/two-phase approach (advance/scan and update based on objects performing activities)
Three-phase-approach (based on activities bound to occur or store the variable and the ones that are conditional or cooperative)
Process interaction (emulating the flow of an object)
Transaction flow (time and state relationship are the same as in process interaction but movement and generation of objects differ).
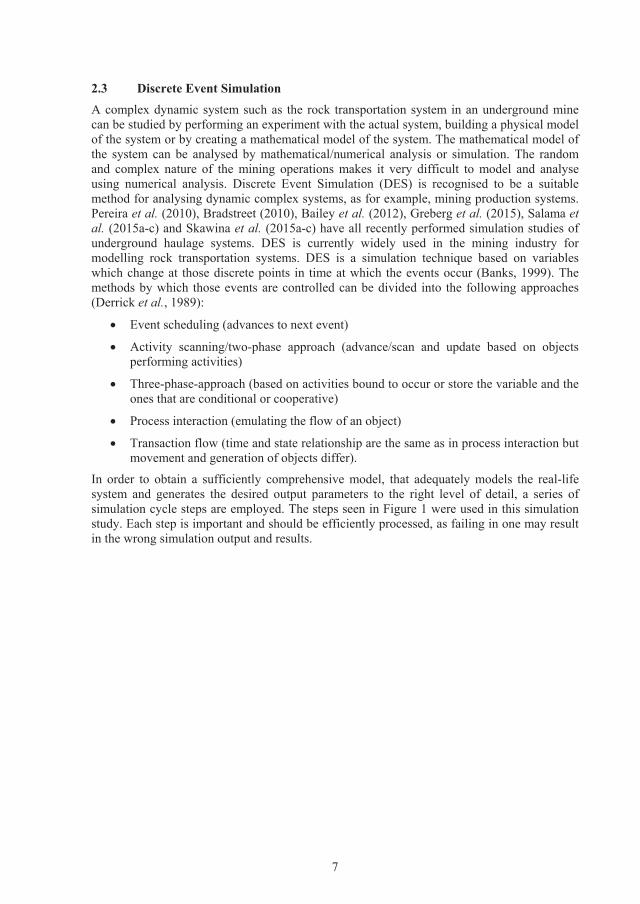
In order to obtain a sufficiently comprehensive model, that adequately models the real-lifesystem and generates the desired output parameters to the right level of detail, a series of simulation cycle steps are employed. The steps seen in Figure 1 were used in this simulation study. Each step is important and should be efficiently processed, as failing in one may result in the wrong simulation output and results.
8
Figure 1 Cycle steps in simulation study (Balci, 1990).
In this study, DES was applied by using operational data and collected information to create simulation models, run simulations and predict and test new situations and scenarios. DES gave access to dynamic animation, enabled the implementation of randomness in the model, allowed modelling of the queuing and the traffic systems, and permitted answering what-if questions. The decision regarding the choice of this method was based on factors such as the possibility to adapt to different dynamic complex systems, time constraints and costs. Considering the system dynamic environment and high costs it was not possible to perform an experiment with the actual system or build a physical model of the system.
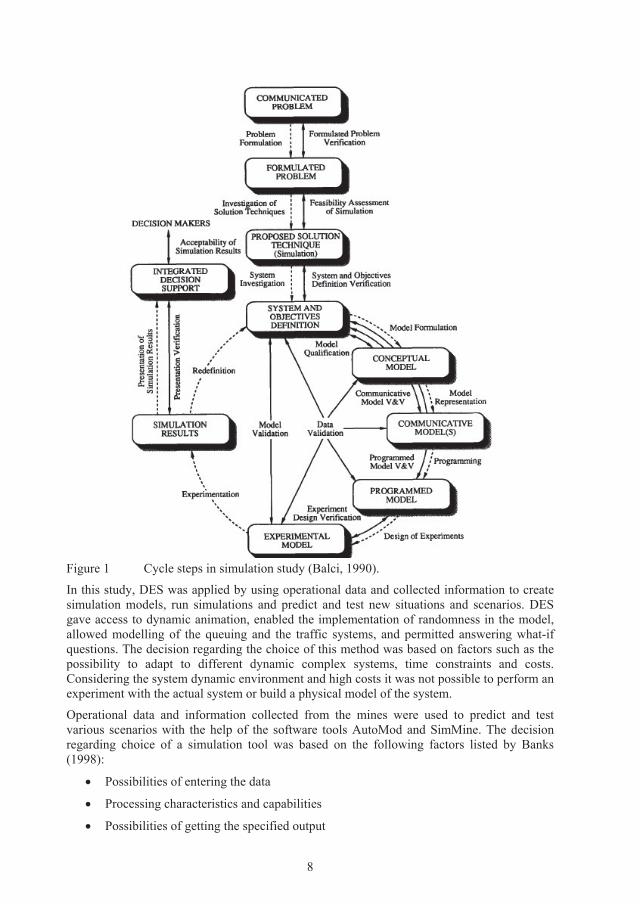
Operational data and information collected from the mines were used to predict and test various scenarios with the help of the software tools AutoMod and SimMine. The decisionregarding choice of a simulation tool was based on the following factors listed by Banks (1998):
Possibilities of entering the data
Processing characteristics and capabilities
Possibilities of getting the specified output
9
Environment
Vendor and costs.
Possibilities of entering the data are governed by the syntax of each developed software (the set of rules that govern the way the software operates in a given language). Consideration that were taken into account included the possible ways of entering the data (point-and-click, spreadsheet, visually interactive interface or coding), CAD translation (whether there is a possibility to convert CAD drawing into the system), importing a file (especially for large data files), exporting file for further input (if the exported file can be used as an input and updated automatically in the exported file) and whether software is able to import data in form of a statistical or mathematical distribution and included the interactive run controller (IRC –debugger greatly reduces the verification times). Usually, the point-and-click, visually interactive and spreadsheet type of entering the data is easier to learn and does not require high programming skills as oppose to when coding is required. This reduces the time of developing the simulation, running time of the simulation. This type of software is usually business or manufactured-oriented. However, the flexibility of the software would be reduced. Therefore many of the software developers have implemented a possibility of entering data using one or mixture of different techniques. Processing characteristics that were considered were whether the software was powerful enough to construct the necessary models of transportation systems. Also, the speed, run-time flexibility (ability to stack up a series of runs), random variate generator (ability to generate the random variates), ability to reset a series of runs, independent replications that uses different set of random numbers, local and global variables, programming (the level of freedom the user have to program) and portability (possibility to use the software on different operating systems) were considered. Output considerations covered the ability to provide various types of reports: from detailed measured variables to tailor made presentations. Also, the level of freedom in custom performance measure and write to file features was considered. Environment consideration focused on the various aspects such as ease of use/learning, animation capability, run-only version or stability of the software. Vendor consideration covered the aspects of whether the vendor was well established on the market and well known and whether it provides support, maintenance and updates regularly especially on time of the error. Costs vary from software to software but did in this case not constrain the selection of the optimal software. Since the software can be categorized depending on the purpose of use, the general classification of the software is divided into general-purpose software (for example: GPSS/H, SLX, SIMSCRIPT, AweSim, SIMPLE++ or Extend), manufacturing-oriented software (for example: ProModel, AutoMod, Taylor II, WITNESS, AIM or Arena), business process reengineering (for example: BP$im, ProcessModel, SIMPROCESS or TimeMachine) and simulation-based scheduling (for example: Tempo, AutoSched or FACTOR) (Banks, 1998). General purpose software can be used to develop other manufacturing, business or simulation oriented software (Sturgul, 1999).

10
11
CHAPTER 3:UNDERGROUND ROCK TRANSPORTATION SYSTEMS
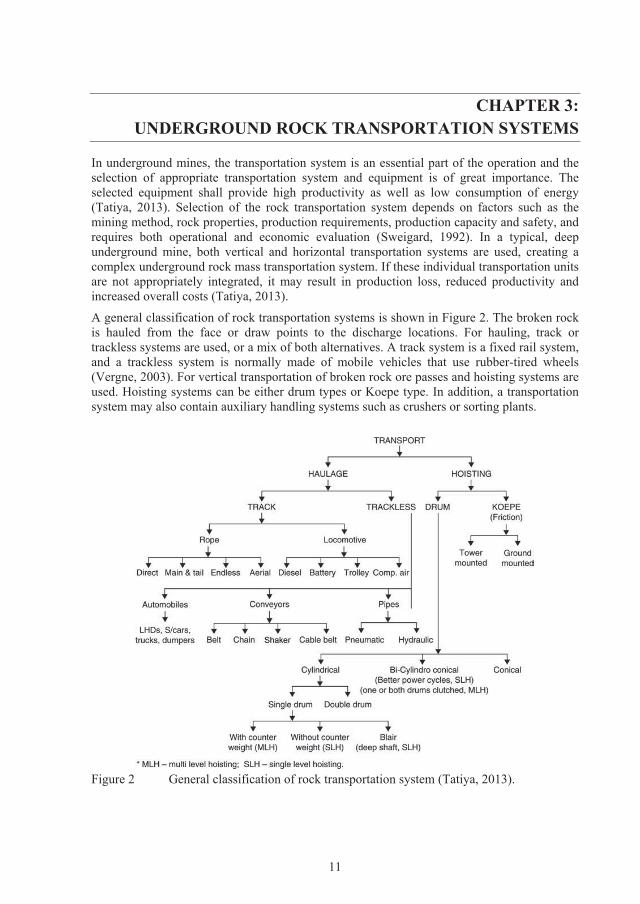
In underground mines, the transportation system is an essential part of the operation and the selection of appropriate transportation system and equipment is of great importance. The selected equipment shall provide high productivity as well as low consumption of energy (Tatiya, 2013). Selection of the rock transportation system depends on factors such as the mining method, rock properties, production requirements, production capacity and safety, and requires both operational and economic evaluation (Sweigard, 1992). In a typical, deep underground mine, both vertical and horizontal transportation systems are used, creating a complex underground rock mass transportation system. If these individual transportation units are not appropriately integrated, it may result in production loss, reduced productivity and increased overall costs (Tatiya, 2013).
A general classification of rock transportation systems is shown in Figure 2. The broken rock is hauled from the face or draw points to the discharge locations. For hauling, track or trackless systems are used, or a mix of both alternatives. A track system is a fixed rail system, and a trackless system is normally made of mobile vehicles that use rubber-tired wheels (Vergne, 2003). For vertical transportation of broken rock ore passes and hoisting systems are used. Hoisting systems can be either drum types or Koepe type. In addition, a transportation system may also contain auxiliary handling systems such as crushers or sorting plants.
Figure 2 General classification of rock transportation system (Tatiya, 2013).
12
All three mines presented in this study (Kiirunavaara, Malmberget and Kristineberg mine) uses Load-Haul and Dump machines (LHDs). LHDs are rubber-tired loaders commonly used to move ore from the working face to the loading bays or the dumping locations. LHDs are flexible, but incur high operational costs and have, depending on the type, often high environmental impact (Bloss et al., 2011). According to Bloss et al. (2011), LHDs operate effectively at a lower gradient (best, up to 14% and effective, up to 20%) and shorter tramming distances (efficient, up to 200 m). Standard LHD models are powered by diesel or electricity, have different bucket sizes (3 to 11.6 m3) and are designed differently depending on the working requirements. For example, a low-profile LHD is designed to work in flat-dipping narrow-vein ore bodies (Bloss et al., 2011).
3.1 Challenges of rock mass transportation in deep underground minesThe problems related to rock mass transportation in deep underground mines were identified through interviews, questionnaires and a literature review, using several case studies within the I2 Mine project. In this study, deep is defined as more than 1000 m. Altogether 15 mines, located in Canada, USA, Chile, Australia, Zambia, Finland and Sweden were studied(Greberg and Salama, 2016). The mines were visited and mine personnel were interviewed and answered a questionnaire. The respondents ranged from mine planners to geomechanicsto mine engineers. In each mine, at least two persons were interviewed. The interviews and questions covered the following topics:
General information about the mine (mining method, mine characteristics, ventilation including cooling of the air system, material handling system, rock support, mine planning process, development and production processes)
Operational data (shift schedules, number of personnel, equipment parameters)
Degree of automation and mine planning process
Current and future bottlenecks related to deep mining
Comparison of present and previous process flows
Safety in mining
Issues related to production efficiency
Ground control problems that affected the mine planning and sequencing.
The study found that the most critical problems in deep underground mining operations are: high stresses and seismicity (10 out of 15 mines), rock support and ground control (12 out of 15 mines), high energy consumption (8 out of 15 mines), ventilation limitations (11 out of 15 mines), communication and flow of information (2 out of 15 mines), fragmentation (5 out of 15 mines), logistics (14 out of 15 mines), loading operations (2 out of 15 mines), problems with ore passes (8 out of 15 mines), temperature (3 out of 15 mines), media access (2 out of 15 mines) and longer haul distances (12 out of 15 mines). In addition, the conceptual study "Smart Mine of the Future" (Bäckblom et al., 2010) identified the following future challenges: safer mining, leaner mining, greener mining (energy efficiency and CO2reduction), increased ore recovery and reduced impact of the generated waste rock. Other challenges addressed by Mielli (2011) are the lack of specialised personnel, sustainable mining and extreme and remote mining. Based on the studies above, where issues related to the rock mass transportation and its effect on production, cost and emissions were emphasizedby a majority of the studied mines the following challenges related to rock transportation in deep underground mines are being addressed in this research:
13
Energy consumption and gas emissions
Problems related to ore pass losses
Unnecessary transportation of rock.
3.1.1 Energy consumptionThe energy consumption of typical mining operations ranges from 20% to 40% of the mining operational cost (Mielli, 2011) and the ventilation absorbs one-third of the power costs for the mine (Vergne, 2003). When an underground mine reaches greater depths, the cost of ventilation increases, due to the need of the air to travel further distances and the thermal gradient and pressure can heat the air to the point where further refrigeration is required (Halim, 2013; Berglund and Gunther, 2014). The thermal gradient is the rate at which the temperature changes with depth (McGraw-Hill Dictionary, 2003). With the present operational ventilation requirements, the deeper the mine, the larger and more powerful the ventilation systems must be used to be able to pump the air down to the production areas. With increasing mining depth the energy consumption and cost will consequently increase (Salama, 2014). Furthermore, longer hauling distances also increase the energy consumption in loading and hauling operations. The energy costs of diesel trucks are higher than those of electric trucks, shafts or conveyor transportation systems (Salama et al., 2014b; Greberg and Salama, 2016). In order to minimise the environmental impact of the mining operations and to minimise cost, it is essential to find alternatives to the currently used hauling and transportation systems. For example, replacing diesel LHDs with electric LHD may provide several benefits, since the electric LHDs generates no gas emissions, have lower energy consumption and also emit less heat, and thus have a positive effect on the need for ventilation (Salama, 2014; Paraszczak et al., 2013; Halim, 2013). The energy consumption of diesel and electric engines and exhaust gas emissions from diesel engines are further discussed in section 3.2.
3.1.2 Ore pass lossesDespite the existence of design guidelines, ore pass related problems persist (Hadjigeorgiou and Stacey, 2013; Brummer, 1998; Hambley, 1987) and are considered as one of the greatest risks for deep underground mining operations (Greberg and Salama, 2016). In the case of an ore pass loss, the cost of restoring an ore pass is often higher than the initial cost of development (Brummer, 1998). If sufficient redundancy does not exist, when the function of an ore pass is lost the production may be disturbed (Mielli, 2011). Increased rock stresses and seismicity at greater depths may also lead to demands for decreased sizes of ore passes and downsizing of drifts. Therefore, it is important to have a mitigation strategy to be able to react quickly and efficiently in the event of ore pass loss (Greberg and Salama, 2016; Skawina et al., 2016b). Ore pass structures are further discussed in section 3.3.
3.1.3 Reduction of waste rock transportationThe strategy for the rock mass transportation impacts the mining operations (Bloss et al.,2011). For a similar transportation solution, the energy consumption and operational costs will increase when the transportation distances become longer. However, energy consumption and operational costs can be reduced by, for example, preventing waste from being created, re-using waste, recycling waste or improving the storage and treatment of waste (Yilmaz, 2011). A possible way to minimise the energy used for transport and to maintain a high production level at low cost is to, as far as possible, separate the waste rock from the ore, and thereby, avoiding unnecessary transport of waste. Furthermore, the separation of the waste
14
rock close to the face could improve the grade of ore delivered to the surface, lower the cost of metal productions, reduce milling and tailing disposal and lower the cut-off grade (Bamber et al., 2004). Skawina et al., (2015b) concluded that integration of a near-to-face sorting plant in an underground mine may help reduce the energy consumption and the unnecessary transportation of the rock. Pre-concentration as a method to minimise the amount of waste work transported to the surface are further discussed in section 3.4
3.2 Energy consumption and noxious gas emissions of diesel and electric enginesDiesel powered mobile mining equipment are widely used around the world and have considerable advantages due to their flexibility, durability and high efficiency, which make them a favourable option for many underground mines. However, when many units are in operation, high levels of energy consumption and diesel exhaust exposure are generated (Pronk et al., 2009). If the working areas are not ventilated properly, workers will be at risk of being affected by noxious gases and carcinogenic agents (Pronk et al., 2009). Reduction of energy consumption and noxious gas emissions in an underground mine may be achieved by replacing older mining equipment powered by older diesel engines with newer equipment powered by newer low-emission engines that meet current and future health and safety regulations. Given the high environmental impact and high operational costs related to ventilation for diesel vehicles, only replacing old diesel equipment with newer ones may not be enough and it may be necessary to select other alternative power sources. Some alternatives to mobile diesel equipment in underground hard rock mines are tether (powered through a trailing cable that can be deployed or retracted), trolley-line (powered from an overhead cable), electric equipment, battery powered electric equipment, hybrid diesel/electric equipment and hydrogen fuel cell equipment (Paraszczak et al., 2014; Varaschin and Souza, 2015). Powering through tethered cable offers good performance for vehicles operating at relatively short and well-defined paths. However, the disadvantages of tethered cable charged LHD’s are reduced versatility, cable faults, cable relocation issues, limited haul range, restricted movement and cable wear (Chadwick, 1996; Paraszczak et al.,2013; Paterson and Knights, 2013; Paraszczak et al., 2014). Overhead power lines require additional infrastructure but are impractical for LHDs that require a high manoeuvrability and operational flexibility (Paraszczak et al., 2013). Batteries offer movement flexibility, but are heavy, have a low energy storage capacity and must, therefore, be regularly recharged(Paraszczak et al., 2013). Replacing diesel engines with electric engines could be attractive, since the electric engines have lower noise levels, emit no exhaust gases, and generate less heat than diesel LHDs (Chadwick, 1996; Bloss et al., 2011; Paraszczak et al., 2013; Paraszczak et al., 2014). In Sweden, limit values for diesel exhaust and noxious gasses are regulated for nitrogen dioxide (NO2) and carbon monoxide (CO) (Roiste et al., 2013). Carbon dioxide (CO2) is used to indicate diesel exhaust exposure (Arbetsmiljöverket, 2010). In the absence of field measurements, consumption can be estimated based on available energy models (Bise, 2003), that are less expensive but also less accurate (Salama, 2014). When analysing diesel powered loading and dumping equipment, equation 1 can be used to estimate the fuel consumption (Kecojevic and Komljenovic, 2010). For electric LHDs, the motor input power and the time the equipment is utilized are used to estimate the electric energy consumption.
FC = (K GHP LF)/KPL (1) where:
FC – Diesel fuel consumption (L/h),K – Engine specific fuel consumption (kg/kWh),GHP – Gross engine horsepower (kW),
15
LF – Load factor (%),KPL – Weight of fuel (kg/L).
To compare diesel LHDs with electric LHDs, equation 2 (Packer, 2011) is used to convert the fuel consumed (FC) into kilowatt hours (kWh).
E = (FC A)/B (2)where:
ED – Diesel energy consumption (kWh),A = 38.6 MJ/L – Amount of heat released by the combusted fuel (Engineering
Conversion Factors),B = 3.6 MJ – Heat used to produce 1 kWh (Engineering Conversion Factors).
The energy consumption is derived from the Energy Mass Balance model, estimated based on the loading cycles (from the loading point to the dumping point and back to the loading point)and equation 3 (Salama, 2014) is used for both diesel and electric LHDs.
E = (TR g [( + B ) V + (V V )])/1000 t (3)where:
E – Energy consumption (kWh),TR – Total resistance (t),g – Acceleration due to gravity (m/s2),
– Gross vehicle weight (t),B – Bucket capacity (t),
– Vehicle speed when loaded (m/s),V – Vehicle speed when empty (m/s),t – Loading cycle time (h).
CO2 emissions from diesel fuels are calculated based on the diesel conversion factors published by the United States Environmental Protection Agency (2005) and can be calculated as:
CO = FC CC 10 0.99 [44/12] (4)where:
CC – Carbon content for the diesel fuel (g/L),0.99 – Oxidation factor (kg/kW/h),44/12 – Ratio of the molecular weight of CO2 to the molecular weight of carbon.
3.3 Ore pass structuresOre passes (Figure 3) are commonly used transportation system that connects two levels in anunderground mine (Hambley, 1987; Beus et al., 2001). This is because they provide a low-cost method to move large amounts of ore downward between the levels (Bloss et al., 2011). In general ore passes require good technical design and shall preferably be located in good ground conditions since they are subject to large, constant operational wear (Bloss et al.,2011). Despite this, they frequently fail (Brummer, 1998).
16
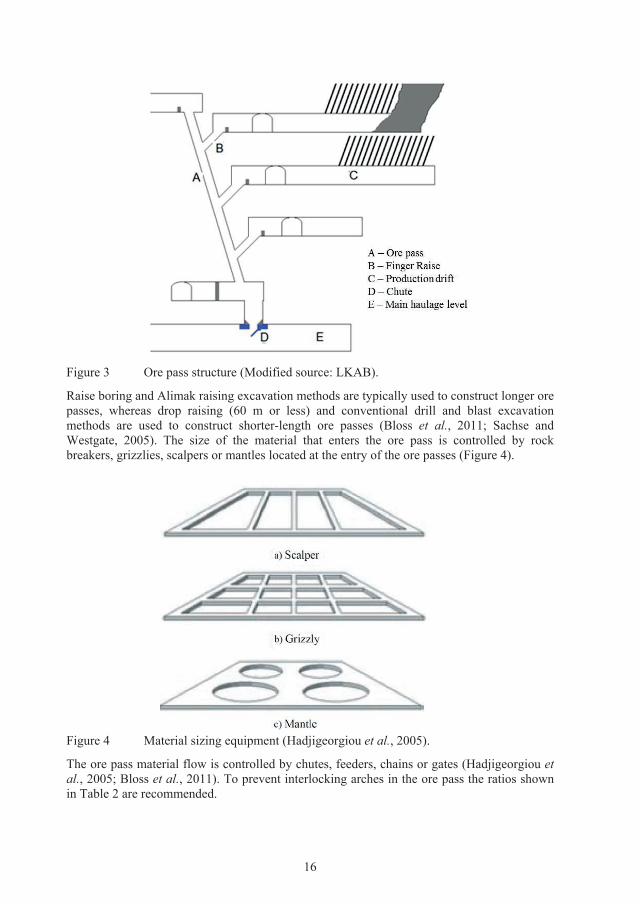
Figure 3 Ore pass structure (Modified source: LKAB).
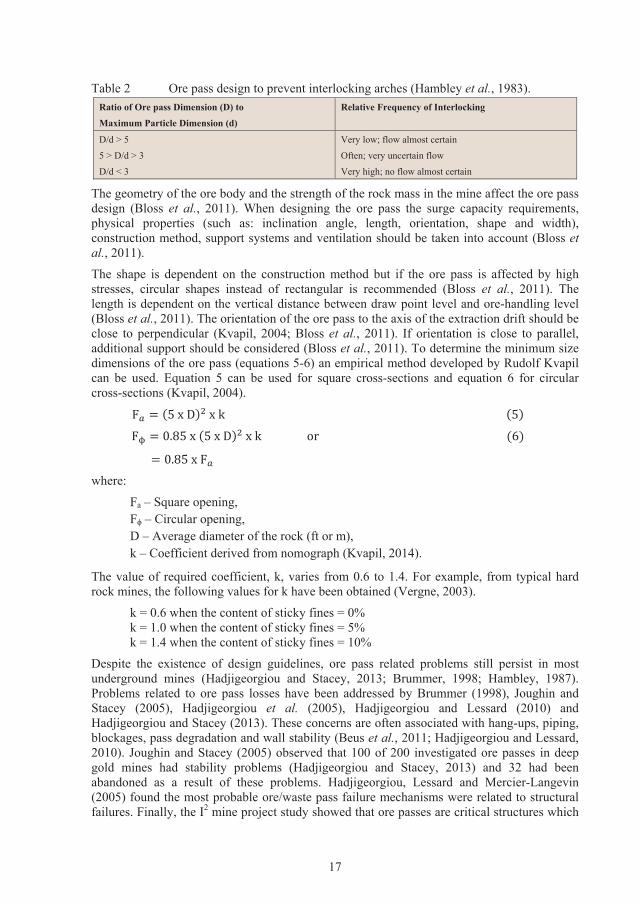
Raise boring and Alimak raising excavation methods are typically used to construct longer orepasses, whereas drop raising (60 m or less) and conventional drill and blast excavation methods are used to construct shorter-length ore passes (Bloss et al., 2011; Sachse and Westgate, 2005). The size of the material that enters the ore pass is controlled by rock breakers, grizzlies, scalpers or mantles located at the entry of the ore passes (Figure 4).
Figure 4 Material sizing equipment (Hadjigeorgiou et al., 2005).
The ore pass material flow is controlled by chutes, feeders, chains or gates (Hadjigeorgiou et al., 2005; Bloss et al., 2011). To prevent interlocking arches in the ore pass the ratios shown in Table 2 are recommended.
17
Table 2 Ore pass design to prevent interlocking arches (Hambley et al., 1983).Ratio of Ore pass Dimension (D) to
Maximum Particle Dimension (d)
Relative Frequency of Interlocking
D/d > 5
5 > D/d > 3
D/d < 3
Very low; flow almost certain
Often; very uncertain flow
Very high; no flow almost certain
The geometry of the ore body and the strength of the rock mass in the mine affect the ore pass design (Bloss et al., 2011). When designing the ore pass the surge capacity requirements, physical properties (such as: inclination angle, length, orientation, shape and width), construction method, support systems and ventilation should be taken into account (Bloss et al., 2011).
The shape is dependent on the construction method but if the ore pass is affected by high stresses, circular shapes instead of rectangular is recommended (Bloss et al., 2011). The length is dependent on the vertical distance between draw point level and ore-handling level (Bloss et al., 2011). The orientation of the ore pass to the axis of the extraction drift should be close to perpendicular (Kvapil, 2004; Bloss et al., 2011). If orientation is close to parallel, additional support should be considered (Bloss et al., 2011). To determine the minimum size dimensions of the ore pass (equations 5-6) an empirical method developed by Rudolf Kvapil can be used. Equation 5 can be used for square cross-sections and equation 6 for circularcross-sections (Kvapil, 2004).
F = (5 x D) x k (5)
F = 0.85 x (5 x D) x k or (6)
= 0.85 x F where:
Fa – Square opening, F – Circular opening,D – Average diameter of the rock (ft or m),k – Coefficient derived from nomograph (Kvapil, 2014).
The value of required coefficient, k, varies from 0.6 to 1.4. For example, from typical hard rock mines, the following values for k have been obtained (Vergne, 2003).
k = 0.6 when the content of sticky fines = 0%k = 1.0 when the content of sticky fines = 5%k = 1.4 when the content of sticky fines = 10%
Despite the existence of design guidelines, ore pass related problems still persist in most underground mines (Hadjigeorgiou and Stacey, 2013; Brummer, 1998; Hambley, 1987). Problems related to ore pass losses have been addressed by Brummer (1998), Joughin andStacey (2005), Hadjigeorgiou et al. (2005), Hadjigeorgiou and Lessard (2010) andHadjigeorgiou and Stacey (2013). These concerns are often associated with hang-ups, piping, blockages, pass degradation and wall stability (Beus et al., 2011; Hadjigeorgiou and Lessard, 2010). Joughin and Stacey (2005) observed that 100 of 200 investigated ore passes in deep gold mines had stability problems (Hadjigeorgiou and Stacey, 2013) and 32 had been abandoned as a result of these problems. Hadjigeorgiou, Lessard and Mercier-Langevin (2005) found the most probable ore/waste pass failure mechanisms were related to structural failures. Finally, the I2 mine project study showed that ore passes are critical structures which
18
are considered as one of the greatest risks in deep underground mining operations (Greberg and Salama, 2016).
3.4 Pre-concentrationPre-concentration is used to minimise the amount of waste rock transported to the surface and is, along with dilution control and selective mining, the most economically effective methodto prevent the problem with waste (Yilmaz, 2011). Pre-concentration consists of several phases, including crushing the broken material into smaller pieces, screening the material by separation and rejecting waste rock from the further ore handling system in order to dispose ofit beforehand. Pre-concentration systems are usually small in size and made of modules that easily can be re-allocated in an underground mine (Klein et al., 2003b).
Klein et al. (2002 and 2003a-b) discussed the merits of pre-concentration plants using simulation where the location of the pre-concentration plant for two different methods of sorting was applied in an underground mining-process. Klein et al. (2003a) conducted apreliminary analysis of pre-concentration and found increased production potential with the pre-concentration plant. Bamber et al. (2004) showed the impact on ore tonnage, cost estimations and grade estimations of the implementation of pre-concentration for bulk mining in underground narrow-vein mining. Advantages of using pre-concentration are well knownand are listed as follows:
Reduction of waste rock further upstream (Feasby, 1995; Klein et al., 2002; Peters et al., 1999; Schena et al., 1990).
Reduction in cost of mineral processing and quantity of fine materials (Feasby, 1995; Klein et al., 2002; Peters et al., 1999; Schena et al., 1990).
Potential of increased production (Feasby, 1995; Klein et al., 2002; Peters et al., 1999; Schena et al., 1990).
Possibility of separating reactive from non-reactive waste (Klein et al., 2003a-b).
Improvement of selective mining by reducing dilution. This is better in narrower orebodies (Klein et al., 2002).
Flexibility and improved resource utilization (Feasby, 1995; Klein et al., 2002; Peters et al., 1999; Schena et al., 1990).
Possibility of increasing the mining rate without the need to increase upstream mining processing (Feasby, 1995; Klein et al., 2002; Peters et al., 1999; Schena et al., 1990).
Less processing further upstream results in less tailings. However, this should be confronted with additional operational costs caused by implementing the pre-concentrator (Peter et al., 1999).
Pre-concentration affects mine depth and grade (Lloyd, 1978 and Peters et al., 1999). The deeper the mine, the better the opportunity to reduce transportation costs (Klein et al., 2003a-b).
In order to successfully implement a pre-concentration plant in an underground mine, theprocessing plant should be able to treat the ore with a wide range of feed throughput and grade of the material (Lloyd, 1978; Klein et al., 2002; Bamber et al., 2004). Coarse-particle separation is preferable (Lloyd, 1978; Klein et al., 2002; Bamber et al., 2004). There should be a minimum amount of infrastructure with dry processes preferred over wet processes (Lloyd, 1978; Klein et al., 2002). Coarse material should be rejected as early as possible (Bamber et al., 2004). Maximum recovery of ore must be achieved (Bamber et al., 2004). A
19
maximum of 60% of the tonnage mined can be rejected (95% metal recovery is optimum) (Lloyd, 1978; Bamber et al., 2004). Another important consideration is the cost of removing the waste from the system compared to the cost and energy necessary for further comminution. Moreover, Peters et al. (1999) addressed ore body characteristics, geology characteristics of the rock mass hosting the mineral processing plant, distance of mine from concentrator and backfill requirements as a number of factors affecting the feasibility of underground pre-concentration. These factors should be investigated beforehand as they govern whether or not pre-concentration will be feasible with the mines existing technologies.Additionally, Klein et al. (2003a) addressed several mining processing integration issues that would affect the use of pre-concentration:
Mining method
Mining sequence
Number of active production drifts
Access development
Selection, productivity and reliability of materials handling equipment
Short-term storage facilitates for ore, concentrate and waste
Location of underground processing plant (this will have a significant impact on performance and design).
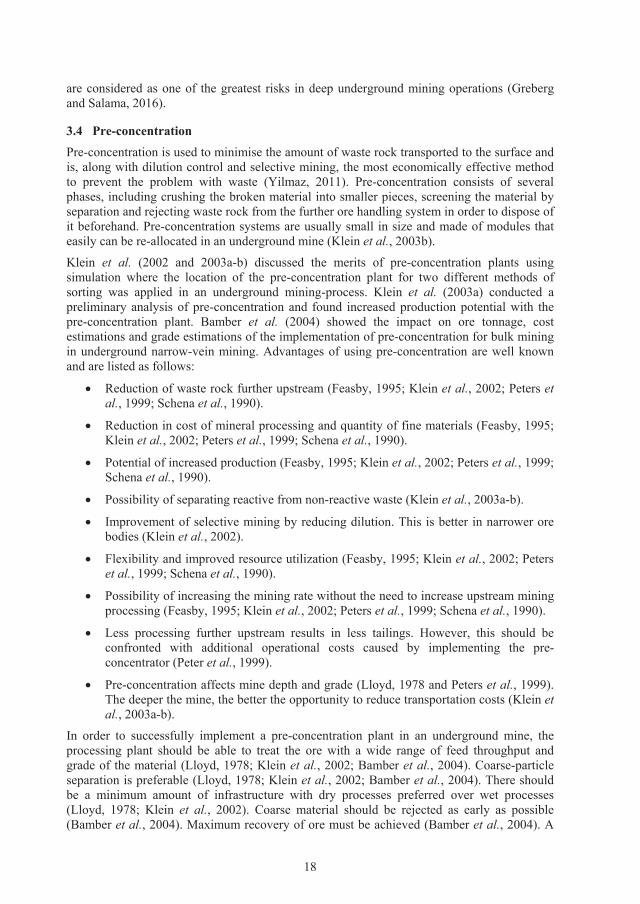
In the study presented in this thesis, the effects on production of implementing underground pre-concentration (Figure 5) by a near-to-face ore sorting plant in the Kristineberg mine are modelled and analysed. This type of near-to-face sorting plant uses a dense media separation system. Dense media separation is a gravity separation process in which dense particles are mixed with water and separated in a sink-float process.
Figure 5 Near-to-face sorting plant (Courtesy of TOMRA Sorting Solutions).
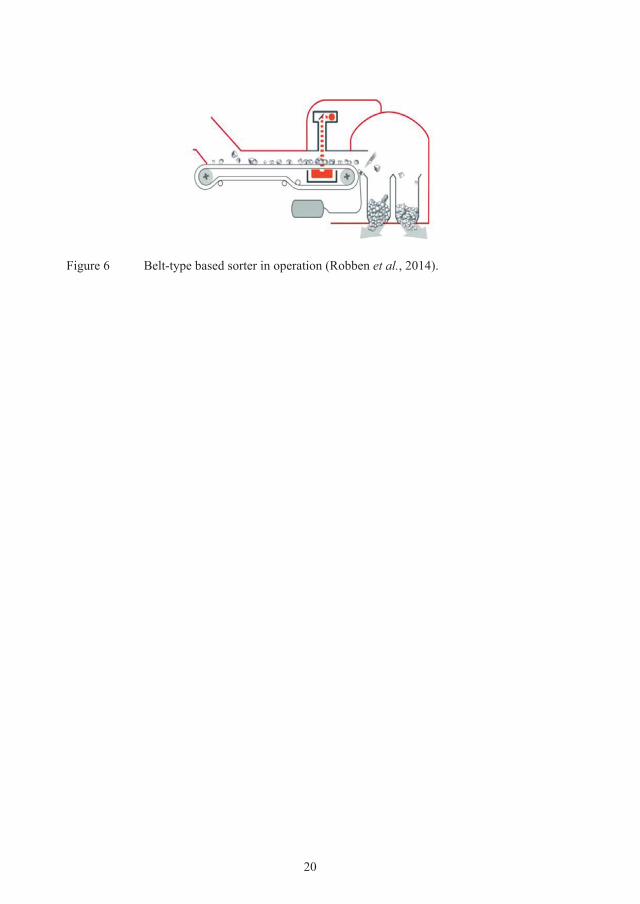
The system mechanically ejects the particles from the feed stream depending on the information obtained from x-ray transmission (XRT) sensors and 3D laser scanner based on both density and rate of refraction of light within a particular mineral (Figure 6). It can pre-concentrate the metal ore up to 300 mm size and the sorter uses a belt-type sensor. The XRT technology relies on transmission and attenuation of hard x-rays as they pass through solid matter (Robben et al., 2014; Hubbell and Seltzer, 1996).
20
Figure 6 Belt-type based sorter in operation (Robben et al., 2014).
21
CHAPTER 4: ANALYSIS
The specific problems related to rock mass transportation systems when mining depth increases, which were formulated in the research questions, were identified through an international survey of 15 deep mines and a literature review. In order to answer the research questions, further analysis was performed by simulation. The simulation tool AutoMod was used to model Malmberget and Kristineberg mine while the Kiirunavaara mine was modelled with both AutoMod and SimMine. Both AutoMod and SimMine allow running the model,change and control the variables, view an interactive animation, optimise the fleet size and schedule and simulate production and development activities. The AutoMod and SimMine tools were selected for this study as they can model the rock transportation systems of the selected mines with the necessary level of detail, they are also commonly used simulation language environments and they are capable of satisfying the characteristics necessary for the study. Furthermore, the AutoMod has a powerful graphic engine and high programming flexibility which means that the user is able to program custom-built model, such as a truck haulage system, rail-veyor system, shaft handling system, mine development, production cycle modelling, tele-remote operated equipment and more (Yuriy and Runciman, 2013).Finally, the selected tools have inbuilt debugging and tracing features that make verification and validation processes easier. Additional features include spreadsheet interface (to model without entering complex logic), extensions (AutoStat, AutoSched and AutoView), generation of material handling systems (Automated Guided Vehicles - AGV, conveyors, bridge cranes, Automated Storage/Retrieval systems - AS/RS and power-and-free P&F system) and possibility to program by use of C functions. Even though the AutoMod simulation environment allows high customisation (Rohrer, 1997; Banks, 2004), it requires ahigh level of programming skills. For example, in order to import a CAD-drawing as path mover system, the custom made extension software is required. The SimMine tool is a mine-oriented simulation package that uses a point-and-click interface and does not require codingand programming skills.
4.1 Studied minesThree mines (Kiirunavaara mine, Malmberget mine and Kristineberg mine), all located in northern Sweden, were studied and modelled to answer research questions 2, 3 and 4. The two first mines use sublevel caving as the method of extraction (LKAB mines) and the third mine uses the cut and fill mining method (Boliden mine).
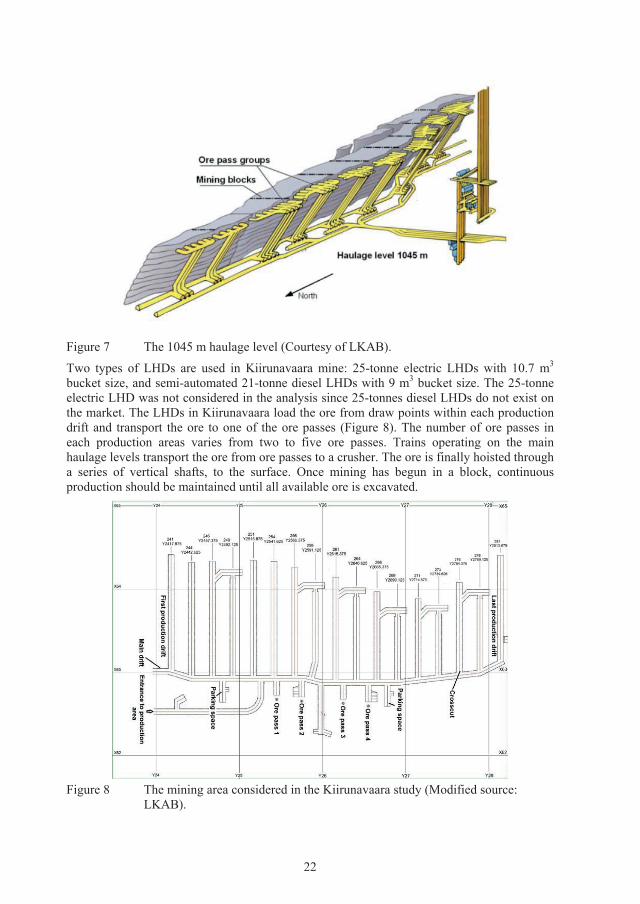
4.1.1 Kiirunavaara mineThe LKAB Kiirunavaara mine is one of the world’s largest underground iron ore mines. The mine uses sublevel caving as a method of extraction and produces around 27.5 million tonnes of ore per year. On average the ore body is around 80 m wide, 4 km long and 2 km deep. At present, there are two main haulage levels, one at 1045 m and one at 1365 m. The mine is divided into blocks (Figure 7 – 1045 haulage level). Each block consists of several sublevels in which loading and hauling operations take place. LHDs are used to load and haul the iron ore from the production faces to the ore passes.
22
Figure 7 The 1045 m haulage level (Courtesy of LKAB).
Two types of LHDs are used in Kiirunavaara mine: 25-tonne electric LHDs with 10.7 m3
bucket size, and semi-automated 21-tonne diesel LHDs with 9 m3 bucket size. The 25-tonne electric LHD was not considered in the analysis since 25-tonnes diesel LHDs do not exist on the market. The LHDs in Kiirunavaara load the ore from draw points within each production drift and transport the ore to one of the ore passes (Figure 8). The number of ore passes in each production areas varies from two to five ore passes. Trains operating on the main haulage levels transport the ore from ore passes to a crusher. The ore is finally hoisted through a series of vertical shafts, to the surface. Once mining has begun in a block, continuous production should be maintained until all available ore is excavated.
Figure 8 The mining area considered in the Kiirunavaara study (Modified source: LKAB).
23
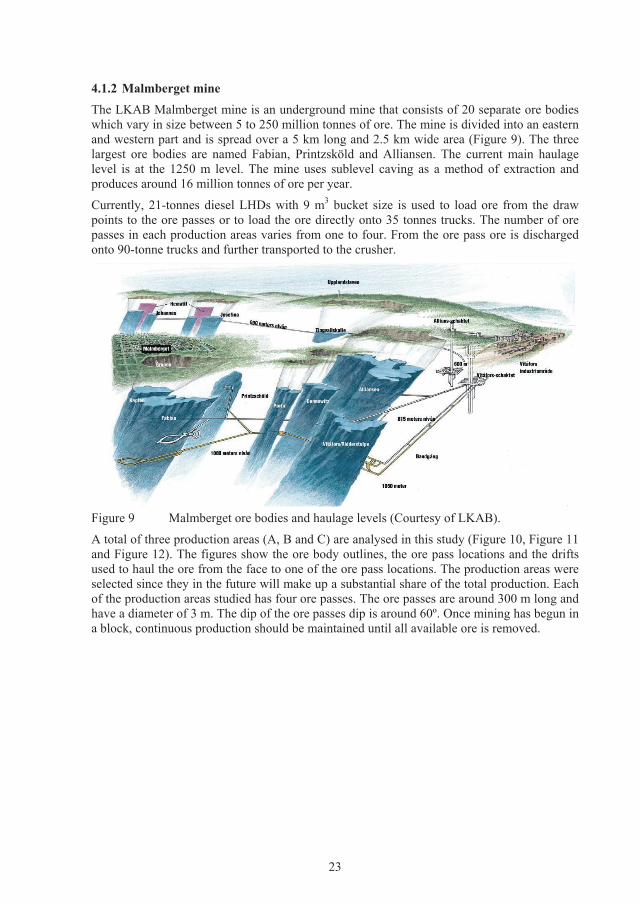
4.1.2 Malmberget mineThe LKAB Malmberget mine is an underground mine that consists of 20 separate ore bodies which vary in size between 5 to 250 million tonnes of ore. The mine is divided into an eastern and western part and is spread over a 5 km long and 2.5 km wide area (Figure 9). The three largest ore bodies are named Fabian, Printzsköld and Alliansen. The current main haulage level is at the 1250 m level. The mine uses sublevel caving as a method of extraction and produces around 16 million tonnes of ore per year.
Currently, 21-tonnes diesel LHDs with 9 m3 bucket size is used to load ore from the draw points to the ore passes or to load the ore directly onto 35 tonnes trucks. The number of ore passes in each production areas varies from one to four. From the ore pass ore is discharged onto 90-tonne trucks and further transported to the crusher.
Figure 9 Malmberget ore bodies and haulage levels (Courtesy of LKAB).
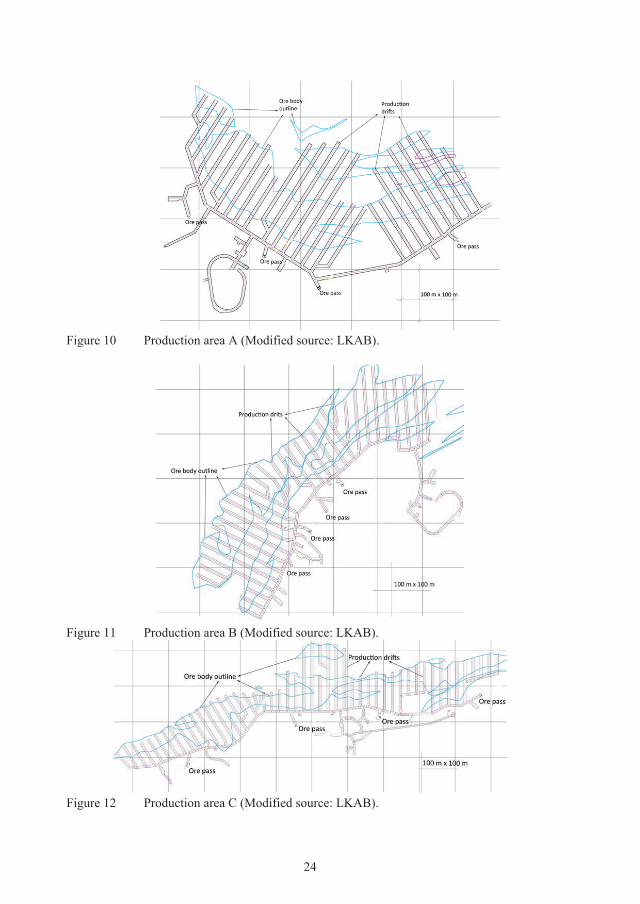
A total of three production areas (A, B and C) are analysed in this study (Figure 10, Figure 11and Figure 12). The figures show the ore body outlines, the ore pass locations and the drifts used to haul the ore from the face to one of the ore pass locations. The production areas were selected since they in the future will make up a substantial share of the total production. Eachof the production areas studied has four ore passes. The ore passes are around 300 m long and have a diameter of 3 m. The dip of the ore passes dip is around 60º. Once mining has begun in a block, continuous production should be maintained until all available ore is removed.
24
Figure 10 Production area A (Modified source: LKAB).
Figure 11 Production area B (Modified source: LKAB).
Figure 12 Production area C (Modified source: LKAB).
25
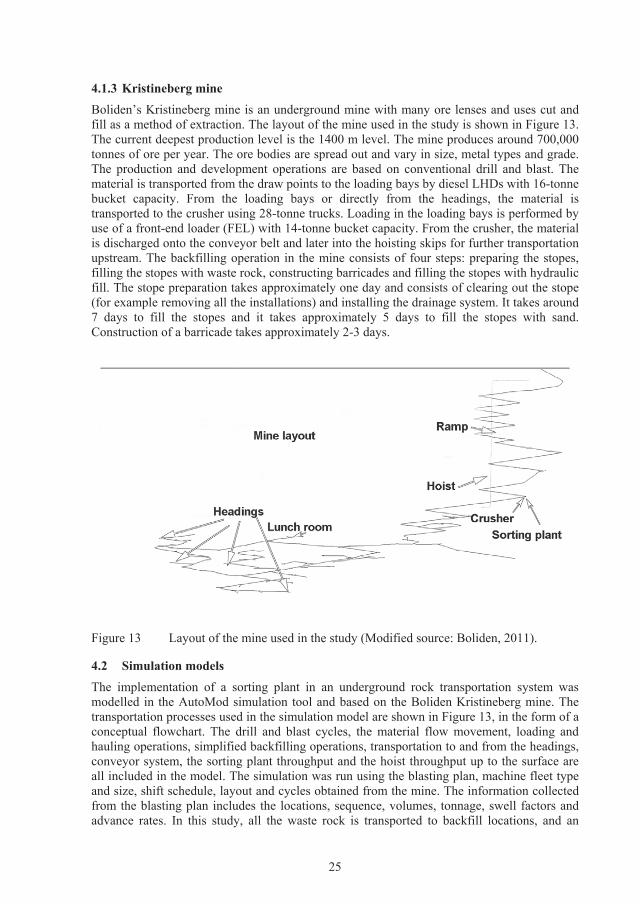
4.1.3 Kristineberg mineBoliden’s Kristineberg mine is an underground mine with many ore lenses and uses cut andfill as a method of extraction. The layout of the mine used in the study is shown in Figure 13.The current deepest production level is the 1400 m level. The mine produces around 700,000 tonnes of ore per year. The ore bodies are spread out and vary in size, metal types and grade. The production and development operations are based on conventional drill and blast. The material is transported from the draw points to the loading bays by diesel LHDs with 16-tonne bucket capacity. From the loading bays or directly from the headings, the material is transported to the crusher using 28-tonne trucks. Loading in the loading bays is performed by use of a front-end loader (FEL) with 14-tonne bucket capacity. From the crusher, the materialis discharged onto the conveyor belt and later into the hoisting skips for further transportation upstream. The backfilling operation in the mine consists of four steps: preparing the stopes,filling the stopes with waste rock, constructing barricades and filling the stopes with hydraulic fill. The stope preparation takes approximately one day and consists of clearing out the stope(for example removing all the installations) and installing the drainage system. It takes around 7 days to fill the stopes and it takes approximately 5 days to fill the stopes with sand.Construction of a barricade takes approximately 2-3 days.
Figure 13 Layout of the mine used in the study (Modified source: Boliden, 2011).
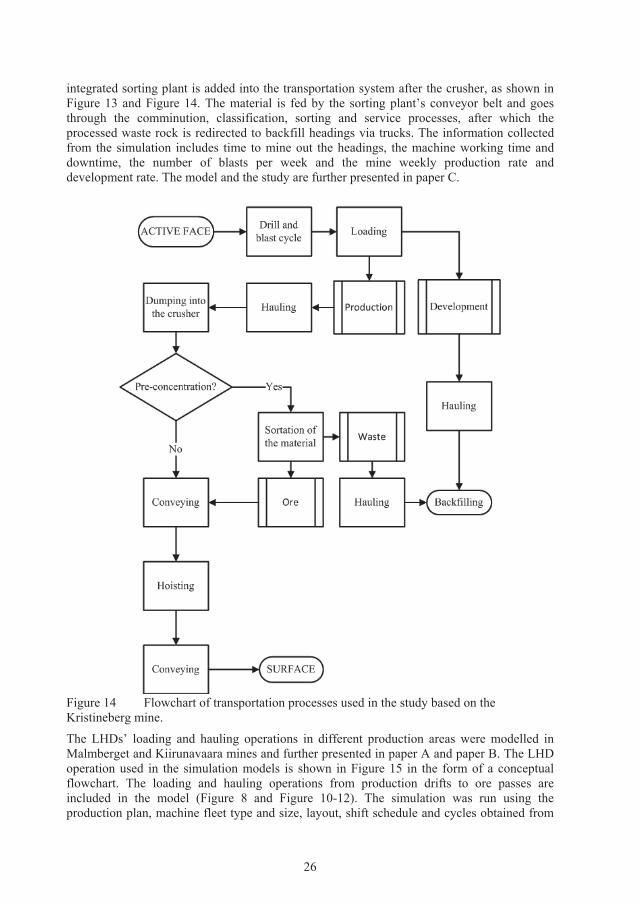
4.2 Simulation modelsThe implementation of a sorting plant in an underground rock transportation system was modelled in the AutoMod simulation tool and based on the Boliden Kristineberg mine. The transportation processes used in the simulation model are shown in Figure 13, in the form of aconceptual flowchart. The drill and blast cycles, the material flow movement, loading and hauling operations, simplified backfilling operations, transportation to and from the headings, conveyor system, the sorting plant throughput and the hoist throughput up to the surface are all included in the model. The simulation was run using the blasting plan, machine fleet type and size, shift schedule, layout and cycles obtained from the mine. The information collected from the blasting plan includes the locations, sequence, volumes, tonnage, swell factors and advance rates. In this study, all the waste rock is transported to backfill locations, and an
26
integrated sorting plant is added into the transportation system after the crusher, as shown in Figure 13 and Figure 14. The material is fed by the sorting plant’s conveyor belt and goes through the comminution, classification, sorting and service processes, after which the processed waste rock is redirected to backfill headings via trucks. The information collected from the simulation includes time to mine out the headings, the machine working time and downtime, the number of blasts per week and the mine weekly production rate and development rate. The model and the study are further presented in paper C.
Figure 14 Flowchart of transportation processes used in the study based on the Kristineberg mine.
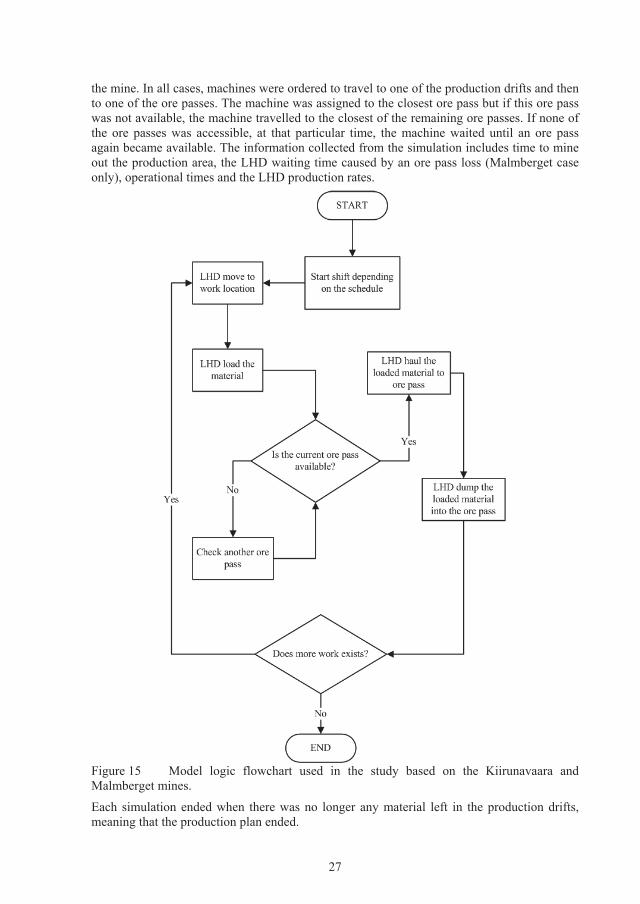
The LHDs’ loading and hauling operations in different production areas were modelled in Malmberget and Kiirunavaara mines and further presented in paper A and paper B. The LHD operation used in the simulation models is shown in Figure 15 in the form of a conceptual flowchart. The loading and hauling operations from production drifts to ore passes are included in the model (Figure 8 and Figure 10-12). The simulation was run using the production plan, machine fleet type and size, layout, shift schedule and cycles obtained from
27
the mine. In all cases, machines were ordered to travel to one of the production drifts and then to one of the ore passes. The machine was assigned to the closest ore pass but if this ore passwas not available, the machine travelled to the closest of the remaining ore passes. If none of the ore passes was accessible, at that particular time, the machine waited until an ore pass again became available. The information collected from the simulation includes time to mine out the production area, the LHD waiting time caused by an ore pass loss (Malmberget case only), operational times and the LHD production rates.
Figure 15 Model logic flowchart used in the study based on the Kiirunavaara and Malmberget mines.
Each simulation ended when there was no longer any material left in the production drifts,meaning that the production plan ended.
28
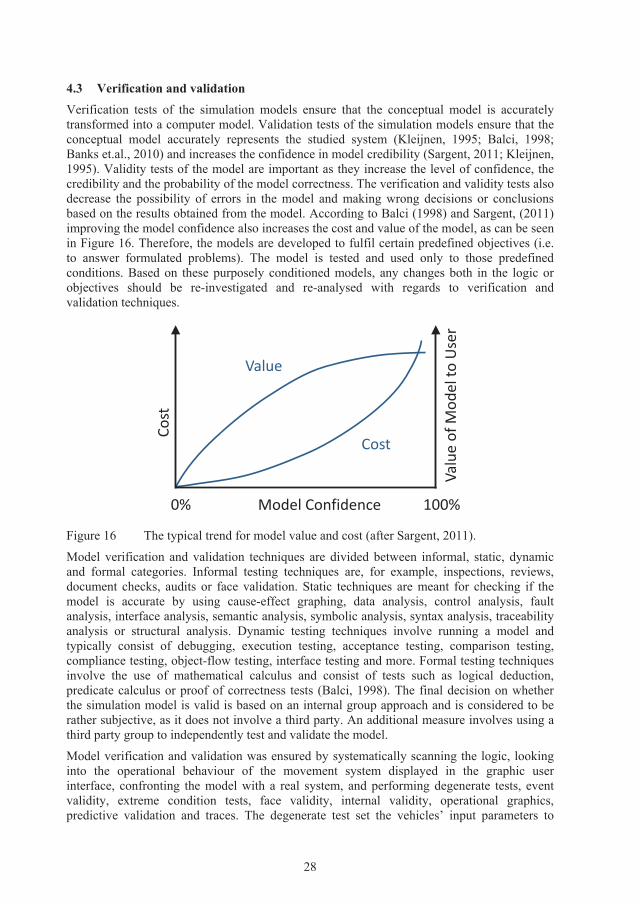
4.3 Verification and validationVerification tests of the simulation models ensure that the conceptual model is accurately transformed into a computer model. Validation tests of the simulation models ensure that the conceptual model accurately represents the studied system (Kleijnen, 1995; Balci, 1998;Banks et.al., 2010) and increases the confidence in model credibility (Sargent, 2011; Kleijnen, 1995). Validity tests of the model are important as they increase the level of confidence, the credibility and the probability of the model correctness. The verification and validity tests also decrease the possibility of errors in the model and making wrong decisions or conclusions based on the results obtained from the model. According to Balci (1998) and Sargent, (2011)improving the model confidence also increases the cost and value of the model, as can be seen in Figure 16. Therefore, the models are developed to fulfil certain predefined objectives (i.e.to answer formulated problems). The model is tested and used only to those predefined conditions. Based on these purposely conditioned models, any changes both in the logic or objectives should be re-investigated and re-analysed with regards to verification and validation techniques.
Figure 16 The typical trend for model value and cost (after Sargent, 2011).
Model verification and validation techniques are divided between informal, static, dynamic and formal categories. Informal testing techniques are, for example, inspections, reviews, document checks, audits or face validation. Static techniques are meant for checking if the model is accurate by using cause-effect graphing, data analysis, control analysis, fault analysis, interface analysis, semantic analysis, symbolic analysis, syntax analysis, traceability analysis or structural analysis. Dynamic testing techniques involve running a model and typically consist of debugging, execution testing, acceptance testing, comparison testing, compliance testing, object-flow testing, interface testing and more. Formal testing techniques involve the use of mathematical calculus and consist of tests such as logical deduction, predicate calculus or proof of correctness tests (Balci, 1998). The final decision on whether the simulation model is valid is based on an internal group approach and is considered to be rather subjective, as it does not involve a third party. An additional measure involves using a third party group to independently test and validate the model.
Model verification and validation was ensured by systematically scanning the logic, looking into the operational behaviour of the movement system displayed in the graphic user interface, confronting the model with a real system, and performing degenerate tests, event validity, extreme condition tests, face validity, internal validity, operational graphics, predictive validation and traces. The degenerate test set the vehicles’ input parameters to
Cost
Value
0% 100%Model Confidence
Cost
Valu
e of
Mod
el to
Use
r
29
different values and looked at changes in the average number of cycles. The comparison with the real system required a series of checks with real values (yearly production and productivity of the individual unit structures or equipment) and discussion with the mining engineers working in the studied mines. An event validity test compared the number of blasts performed weekly in the given mine to the number of blasts performed in the simulation. An extreme condition test was used to set the bucket capacity of the loaders to zero and see whether the production results would also equal zero. Face validity was ensured by asking the specialists and experts involved in the study if the model behaved reasonably. Internal validity was tested by ensuring that, after changing the random set number and comparing the results, the model’s results did not stand out too much from those with which they were compared with. This was important because the models involved were using different distributions. Operational graphics were tested by displaying some of the important variables on the graphic user interface and observing whether they changed acceptably over time. A prediction validation test manually calculated some of the output results and compared them to the run results. Traces were also part of the verification process. This debugging technique is used to trace a specific entity and is useful in determining the exactness of a model’s logic (Sargent, 2011). Verification and validation made in the respective studies are further presented in papers A, B and C.

30
31
CHAPTER 5:RESULTS AND DISCUSSION
This study identified the challenges of the rock mass transportation systems in deep underground mines through a literature review and a review of the several case studies within the I2 Mine project. As described in section 3.1, the study showed that high stresses and seismicity, rock support and ground control, high energy consumption, ventilation limitations,communication and flow of information, fragmentation, logistics, loading operations, problems with ore passes, temperature, media access and long travelling distances are considered critical problems in deep underground mining operations. From there, three major challenges; energy consumption and gas emissions (addressing the ventilation limitations), problem related to ore pass loss and reducing unnecessary transportation of the rock (related to logistics and long travelling distances), were selected and further addressed in Paper A, Paper B and Paper C. These three major challenges were selected as they are related to the rock mass transportation system and identified as being critical. Paper A addresses energy consumption and gas emissions (section 5.1), paper B considers the effects of ore pass loss on LHD operations (section 5.2), and paper C addresses reduction of rock transportation by introducing pre-concentration with a near-to-face sorter (section 5.3).
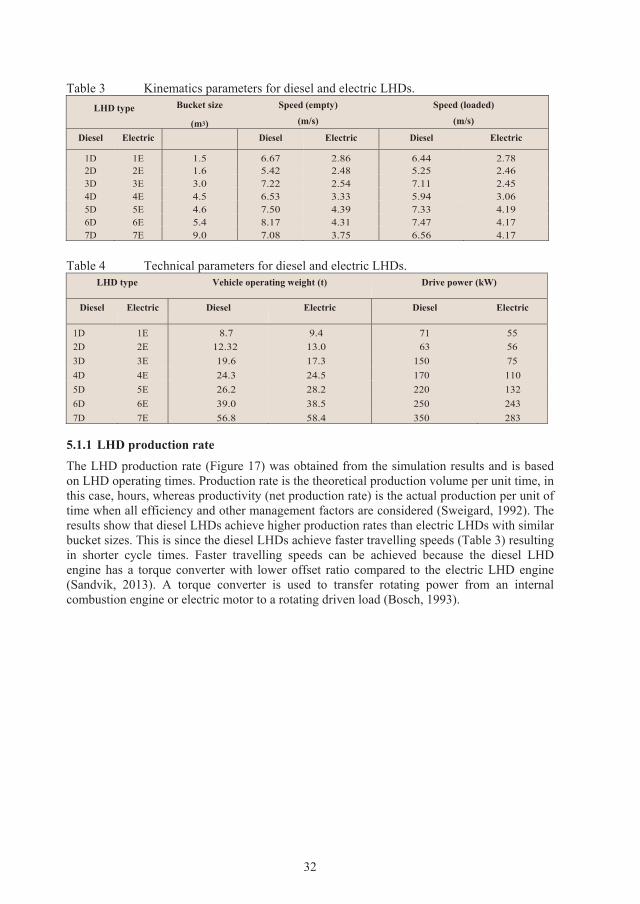
5.1 Energy consumption and gas emissions of diesel and electric LHDsPaper A presents the analysis of the energy consumption and gas emissions for 14 different types of LHDs (seven 1D-7D diesel LHDs and seven 1E-7E electric LHDs) using DES. The bucket size increases with increasing number, meaning that the 1D and 1E are the smallestbucket sizes and the 7D and 7E are the largest bucket sizes analysed in the study. Both diesel and electric LHDs were analysed to compare hourly production rates, hourly energy consumption, and CO2 emissions. The fuel and electricity consumption of a vehicle was determined based on the machine loading rate, vehicle efficiency, road gradient and surface features, load factors, and LHD operating time. Vehicle efficiency is defined here as the percentage of total time that a machine will actually operate as dictated by maintenance, scheduling, and operating practices (Berkhimer, 2011). Good management of the operation will result in a high operating efficiency and poor management will result in a low operating efficiency (Berkhimer, 2011). Table 3 shows the kinematics parameters for diesel and electric LHDs used in the study and Table 4 shows the technical parameters used for energy consumption calculations. In the analysis, the third gear was used as an average speed for all studied LHDs (Table 3) and the drive power energy (Table 4) was used for the calculation of energy consumption. The LHD 7D kinematics and technical parameters were obtained from staff at the mine. The data for other of machine types (1D-6D and 1E-7E) were obtained from the manufacturers and estimated based on assumptions of the manufacturers’ experts. The ratio of the machine input power to the machine drive power from the LHD 7D was used to estimate the load factor. To measure the input power, a strip chart recorder was used in the mine. The measurements from the strip chart recorder for LHD 7D resulted in an average of 274 kW. Based on Table 4, for LHD 7D, the drive power capacity of 350 kW gives a load factor of 78%. However, the input power for other LHD types could not be measured, since LHD 7D is the only LHD type currently operating in the mine. Therefore, the same load factor of 78% was assumed for other LHDs.
32
Table 3 Kinematics parameters for diesel and electric LHDs.LHD type Bucket size
(m3)
Speed (empty)
(m/s)
Speed (loaded)
(m/s)
Diesel Electric Diesel Electric Diesel Electric
1D 1E 1.5 6.67 2.86 6.44 2.782D 2E 1.6 5.42 2.48 5.25 2.463D 3E 3.0 7.22 2.54 7.11 2.454D 4E 4.5 6.53 3.33 5.94 3.065D 5E 4.6 7.50 4.39 7.33 4.196D 6E 5.4 8.17 4.31 7.47 4.177D 7E 9.0 7.08 3.75 6.56 4.17
Table 4 Technical parameters for diesel and electric LHDs.LHD type Vehicle operating weight (t) Drive power (kW)
Diesel Electric Diesel Electric Diesel Electric
1D 1E 8.7 9.4 71 552D 2E 12.32 13.0 63 563D 3E 19.6 17.3 150 754D 4E 24.3 24.5 170 1105D 5E 26.2 28.2 220 1326D 6E 39.0 38.5 250 2437D 7E 56.8 58.4 350 283
5.1.1 LHD production rate The LHD production rate (Figure 17) was obtained from the simulation results and is based on LHD operating times. Production rate is the theoretical production volume per unit time, in this case, hours, whereas productivity (net production rate) is the actual production per unit of time when all efficiency and other management factors are considered (Sweigard, 1992). The results show that diesel LHDs achieve higher production rates than electric LHDs with similar bucket sizes. This is since the diesel LHDs achieve faster travelling speeds (Table 3) resulting in shorter cycle times. Faster travelling speeds can be achieved because the diesel LHD engine has a torque converter with lower offset ratio compared to the electric LHD engine (Sandvik, 2013). A torque converter is used to transfer rotating power from an internal combustion engine or electric motor to a rotating driven load (Bosch, 1993).
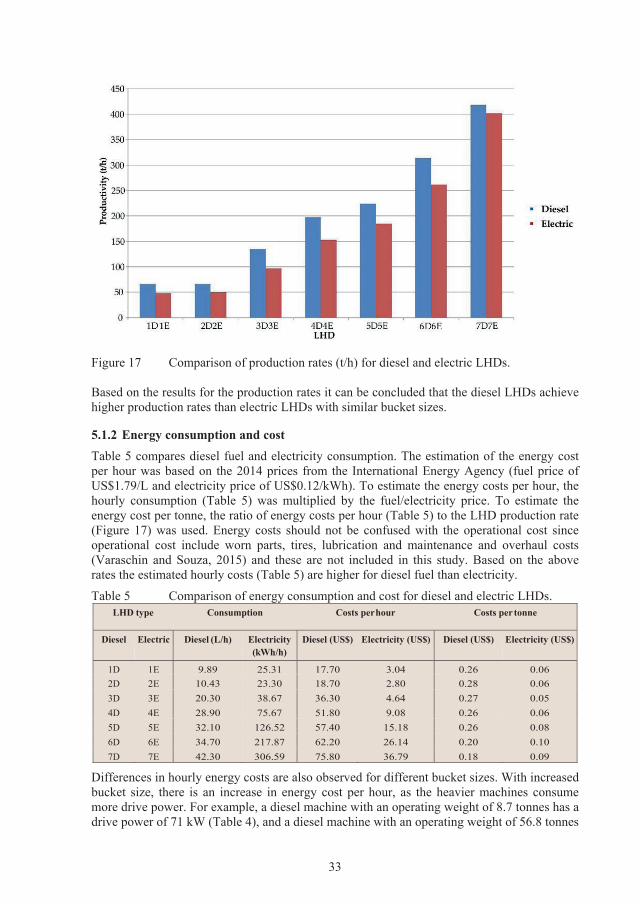
33
Figure 17 Comparison of production rates (t/h) for diesel and electric LHDs.
Based on the results for the production rates it can be concluded that the diesel LHDs achieve higher production rates than electric LHDs with similar bucket sizes.
5.1.2 Energy consumption and costTable 5 compares diesel fuel and electricity consumption. The estimation of the energy cost per hour was based on the 2014 prices from the International Energy Agency (fuel price of US$1.79/L and electricity price of US$0.12/kWh). To estimate the energy costs per hour, the hourly consumption (Table 5) was multiplied by the fuel/electricity price. To estimate the energy cost per tonne, the ratio of energy costs per hour (Table 5) to the LHD production rate(Figure 17) was used. Energy costs should not be confused with the operational cost since operational cost include worn parts, tires, lubrication and maintenance and overhaul costs (Varaschin and Souza, 2015) and these are not included in this study. Based on the above rates the estimated hourly costs (Table 5) are higher for diesel fuel than electricity.
Table 5 Comparison of energy consumption and cost for diesel and electric LHDs.LHD type Consumption Costs perhour Costs per tonne
Diesel Electric Diesel (L/h) Electricity(kWh/h)
Diesel (US$) Electricity (US$) Diesel (US$) Electricity (US$)
1D 1E 9.89 25.31 17.70 3.04 0.26 0.062D 2E 10.43 23.30 18.70 2.80 0.28 0.063D 3E 20.30 38.67 36.30 4.64 0.27 0.054D 4E 28.90 75.67 51.80 9.08 0.26 0.065D 5E 32.10 126.52 57.40 15.18 0.26 0.086D 6E 34.70 217.87 62.20 26.14 0.20 0.107D 7E 42.30 306.59 75.80 36.79 0.18 0.09
Differences in hourly energy costs are also observed for different bucket sizes. With increased bucket size, there is an increase in energy cost per hour, as the heavier machines consume more drive power. For example, a diesel machine with an operating weight of 8.7 tonnes has a drive power of 71 kW (Table 4), and a diesel machine with an operating weight of 56.8 tonnes
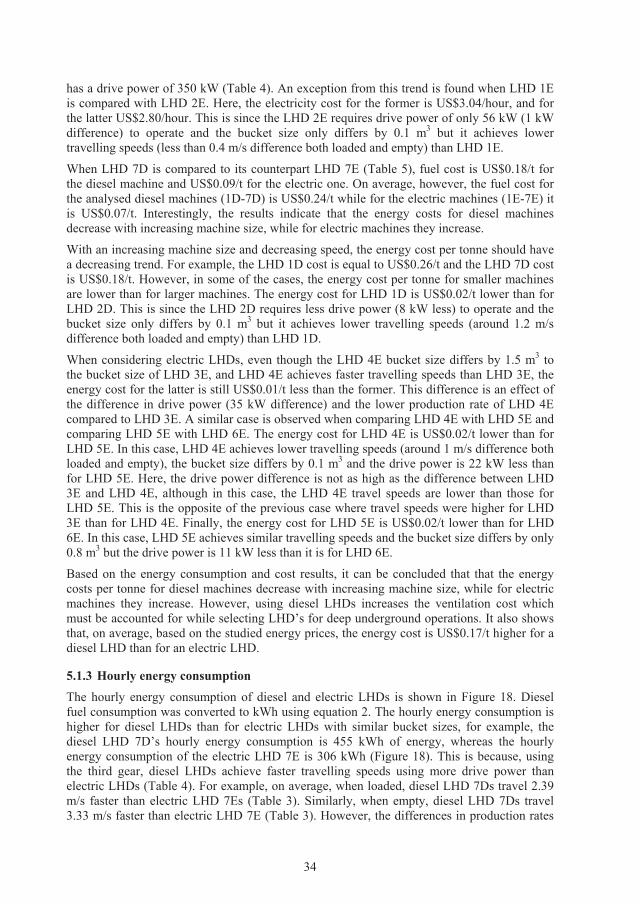
34
has a drive power of 350 kW (Table 4). An exception from this trend is found when LHD 1E is compared with LHD 2E. Here, the electricity cost for the former is US$3.04/hour, and for the latter US$2.80/hour. This is since the LHD 2E requires drive power of only 56 kW (1 kW difference) to operate and the bucket size only differs by 0.1 m3 but it achieves lower travelling speeds (less than 0.4 m/s difference both loaded and empty) than LHD 1E.
When LHD 7D is compared to its counterpart LHD 7E (Table 5), fuel cost is US$0.18/t for the diesel machine and US$0.09/t for the electric one. On average, however, the fuel cost for the analysed diesel machines (1D-7D) is US$0.24/t while for the electric machines (1E-7E) it is US$0.07/t. Interestingly, the results indicate that the energy costs for diesel machines decrease with increasing machine size, while for electric machines they increase.
With an increasing machine size and decreasing speed, the energy cost per tonne should have a decreasing trend. For example, the LHD 1D cost is equal to US$0.26/t and the LHD 7D cost is US$0.18/t. However, in some of the cases, the energy cost per tonne for smaller machines are lower than for larger machines. The energy cost for LHD 1D is US$0.02/t lower than for LHD 2D. This is since the LHD 2D requires less drive power (8 kW less) to operate and the bucket size only differs by 0.1 m3 but it achieves lower travelling speeds (around 1.2 m/s difference both loaded and empty) than LHD 1D.
When considering electric LHDs, even though the LHD 4E bucket size differs by 1.5 m3 to the bucket size of LHD 3E, and LHD 4E achieves faster travelling speeds than LHD 3E, the energy cost for the latter is still US$0.01/t less than the former. This difference is an effect ofthe difference in drive power (35 kW difference) and the lower production rate of LHD 4Ecompared to LHD 3E. A similar case is observed when comparing LHD 4E with LHD 5E and comparing LHD 5E with LHD 6E. The energy cost for LHD 4E is US$0.02/t lower than for LHD 5E. In this case, LHD 4E achieves lower travelling speeds (around 1 m/s difference both loaded and empty), the bucket size differs by 0.1 m3 and the drive power is 22 kW less than for LHD 5E. Here, the drive power difference is not as high as the difference between LHD 3E and LHD 4E, although in this case, the LHD 4E travel speeds are lower than those for LHD 5E. This is the opposite of the previous case where travel speeds were higher for LHD 3E than for LHD 4E. Finally, the energy cost for LHD 5E is US$0.02/t lower than for LHD 6E. In this case, LHD 5E achieves similar travelling speeds and the bucket size differs by only 0.8 m3 but the drive power is 11 kW less than it is for LHD 6E.
Based on the energy consumption and cost results, it can be concluded that that the energy costs per tonne for diesel machines decrease with increasing machine size, while for electric machines they increase. However, using diesel LHDs increases the ventilation cost which must be accounted for while selecting LHD’s for deep underground operations. It also shows that, on average, based on the studied energy prices, the energy cost is US$0.17/t higher for a diesel LHD than for an electric LHD.
5.1.3 Hourly energy consumption The hourly energy consumption of diesel and electric LHDs is shown in Figure 18. Diesel fuel consumption was converted to kWh using equation 2. The hourly energy consumption is higher for diesel LHDs than for electric LHDs with similar bucket sizes, for example, the diesel LHD 7D’s hourly energy consumption is 455 kWh of energy, whereas the hourly energy consumption of the electric LHD 7E is 306 kWh (Figure 18). This is because, using the third gear, diesel LHDs achieve faster travelling speeds using more drive power than electric LHDs (Table 4). For example, on average, when loaded, diesel LHD 7Ds travel 2.39 m/s faster than electric LHD 7Es (Table 3). Similarly, when empty, diesel LHD 7Ds travel 3.33 m/s faster than electric LHD 7E (Table 3). However, the differences in production rates
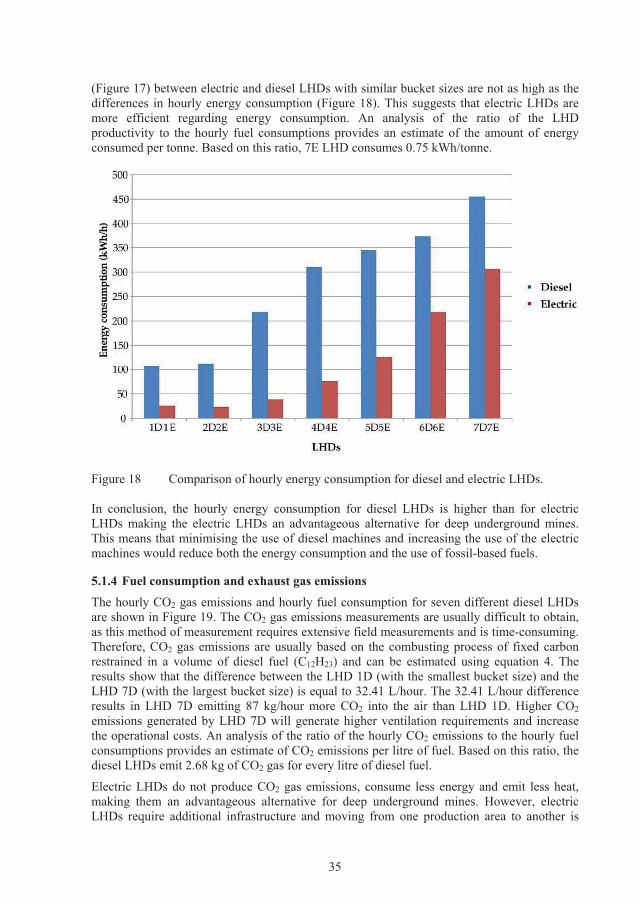
35
(Figure 17) between electric and diesel LHDs with similar bucket sizes are not as high as the differences in hourly energy consumption (Figure 18). This suggests that electric LHDs are more efficient regarding energy consumption. An analysis of the ratio of the LHD productivity to the hourly fuel consumptions provides an estimate of the amount of energy consumed per tonne. Based on this ratio, 7E LHD consumes 0.75 kWh/tonne.
Figure 18 Comparison of hourly energy consumption for diesel and electric LHDs.
In conclusion, the hourly energy consumption for diesel LHDs is higher than for electric LHDs making the electric LHDs an advantageous alternative for deep underground mines.This means that minimising the use of diesel machines and increasing the use of the electric machines would reduce both the energy consumption and the use of fossil-based fuels.
5.1.4 Fuel consumption and exhaust gas emissions The hourly CO2 gas emissions and hourly fuel consumption for seven different diesel LHDs are shown in Figure 19. The CO2 gas emissions measurements are usually difficult to obtain, as this method of measurement requires extensive field measurements and is time-consuming.Therefore, CO2 gas emissions are usually based on the combusting process of fixed carbon restrained in a volume of diesel fuel (C12H23) and can be estimated using equation 4. The results show that the difference between the LHD 1D (with the smallest bucket size) and the LHD 7D (with the largest bucket size) is equal to 32.41 L/hour. The 32.41 L/hour difference results in LHD 7D emitting 87 kg/hour more CO2 into the air than LHD 1D. Higher CO2emissions generated by LHD 7D will generate higher ventilation requirements and increase the operational costs. An analysis of the ratio of the hourly CO2 emissions to the hourly fuel consumptions provides an estimate of CO2 emissions per litre of fuel. Based on this ratio, the diesel LHDs emit 2.68 kg of CO2 gas for every litre of diesel fuel.
Electric LHDs do not produce CO2 gas emissions, consume less energy and emit less heat, making them an advantageous alternative for deep underground mines. However, electric LHDs require additional infrastructure and moving from one production area to another is
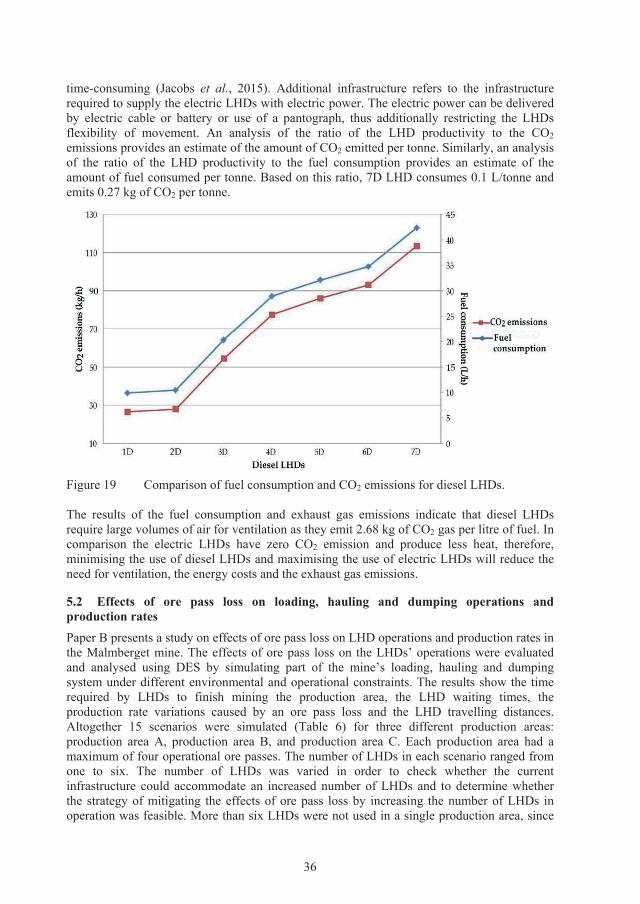
36
time-consuming (Jacobs et al., 2015). Additional infrastructure refers to the infrastructure required to supply the electric LHDs with electric power. The electric power can be delivered by electric cable or battery or use of a pantograph, thus additionally restricting the LHDs flexibility of movement. An analysis of the ratio of the LHD productivity to the CO2emissions provides an estimate of the amount of CO2 emitted per tonne. Similarly, an analysis of the ratio of the LHD productivity to the fuel consumption provides an estimate of the amount of fuel consumed per tonne. Based on this ratio, 7D LHD consumes 0.1 L/tonne and emits 0.27 kg of CO2 per tonne.
Figure 19 Comparison of fuel consumption and CO2 emissions for diesel LHDs.
The results of the fuel consumption and exhaust gas emissions indicate that diesel LHDs require large volumes of air for ventilation as they emit 2.68 kg of CO2 gas per litre of fuel. In comparison the electric LHDs have zero CO2 emission and produce less heat, therefore,minimising the use of diesel LHDs and maximising the use of electric LHDs will reduce the need for ventilation, the energy costs and the exhaust gas emissions.
5.2 Effects of ore pass loss on loading, hauling and dumping operations and production ratesPaper B presents a study on effects of ore pass loss on LHD operations and production rates in the Malmberget mine. The effects of ore pass loss on the LHDs’ operations were evaluated and analysed using DES by simulating part of the mine’s loading, hauling and dumping system under different environmental and operational constraints. The results show the time required by LHDs to finish mining the production area, the LHD waiting times, the production rate variations caused by an ore pass loss and the LHD travelling distances.Altogether 15 scenarios were simulated (Table 6) for three different production areas: production area A, production area B, and production area C. Each production area had a maximum of four operational ore passes. The number of LHDs in each scenario ranged from one to six. The number of LHDs was varied in order to check whether the current infrastructure could accommodate an increased number of LHDs and to determine whether the strategy of mitigating the effects of ore pass loss by increasing the number of LHDs in operation was feasible. More than six LHDs were not used in a single production area, since
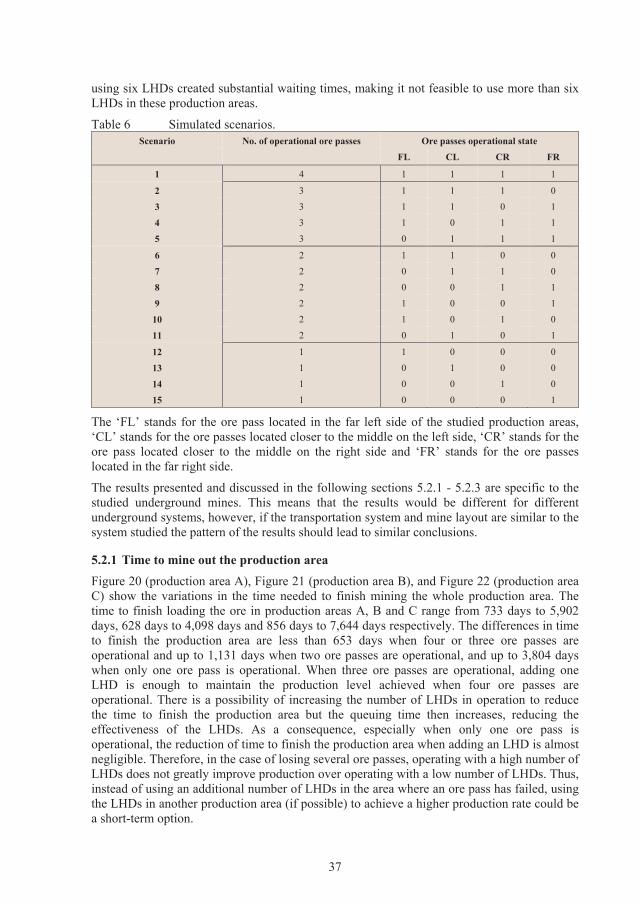
37
using six LHDs created substantial waiting times, making it not feasible to use more than sixLHDs in these production areas.
Table 6 Simulated scenarios.Scenario No. of operational ore passes Ore passes operational state
FL CL CR FR
1 4 1 1 1 1
2 3 1 1 1 0
3 3 1 1 0 1
4 3 1 0 1 1
5 3 0 1 1 1
6 2 1 1 0 0
7 2 0 1 1 0
8 2 0 0 1 1
9 2 1 0 0 1
10 2 1 0 1 0
11 2 0 1 0 1
12 1 1 0 0 0
13 1 0 1 0 0
14 1 0 0 1 0
15 1 0 0 0 1
The ‘FL’ stands for the ore pass located in the far left side of the studied production areas, ‘CL’ stands for the ore passes located closer to the middle on the left side, ‘CR’ stands for the ore pass located closer to the middle on the right side and ‘FR’ stands for the ore passes located in the far right side.
The results presented and discussed in the following sections 5.2.1 - 5.2.3 are specific to the studied underground mines. This means that the results would be different for differentunderground systems, however, if the transportation system and mine layout are similar to the system studied the pattern of the results should lead to similar conclusions.
5.2.1 Time to mine out the production areaFigure 20 (production area A), Figure 21 (production area B), and Figure 22 (production areaC) show the variations in the time needed to finish mining the whole production area. The time to finish loading the ore in production areas A, B and C range from 733 days to 5,902days, 628 days to 4,098 days and 856 days to 7,644 days respectively. The differences in time to finish the production area are less than 653 days when four or three ore passes areoperational and up to 1,131 days when two ore passes are operational, and up to 3,804 days when only one ore pass is operational. When three ore passes are operational, adding one LHD is enough to maintain the production level achieved when four ore passes are operational. There is a possibility of increasing the number of LHDs in operation to reduce the time to finish the production area but the queuing time then increases, reducing the effectiveness of the LHDs. As a consequence, especially when only one ore pass is operational, the reduction of time to finish the production area when adding an LHD is almost negligible. Therefore, in the case of losing several ore passes, operating with a high number of LHDs does not greatly improve production over operating with a low number of LHDs. Thus, instead of using an additional number of LHDs in the area where an ore pass has failed, using the LHDs in another production area (if possible) to achieve a higher production rate could be a short-term option.
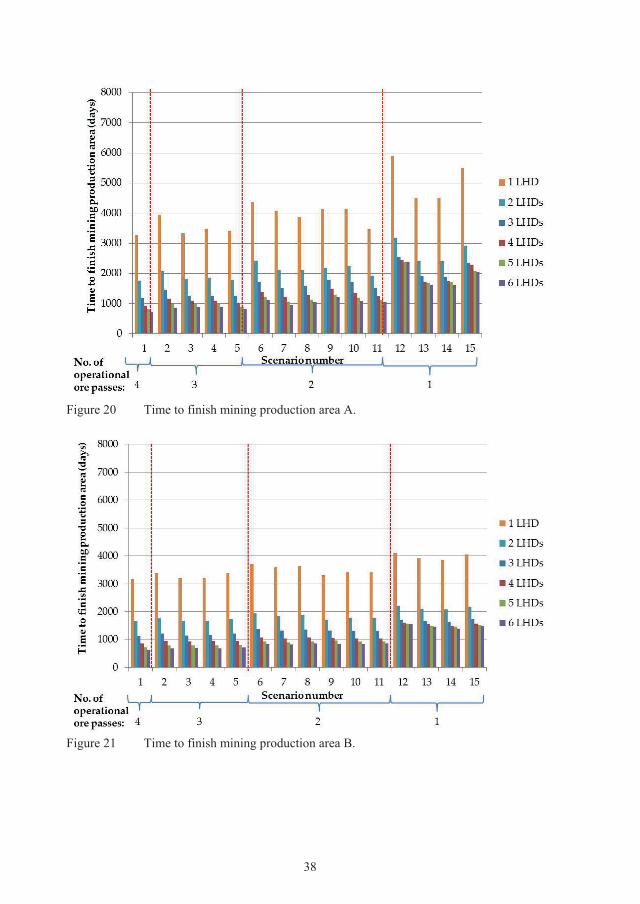
38
Figure 20 Time to finish mining production area A.
Figure 21 Time to finish mining production area B.
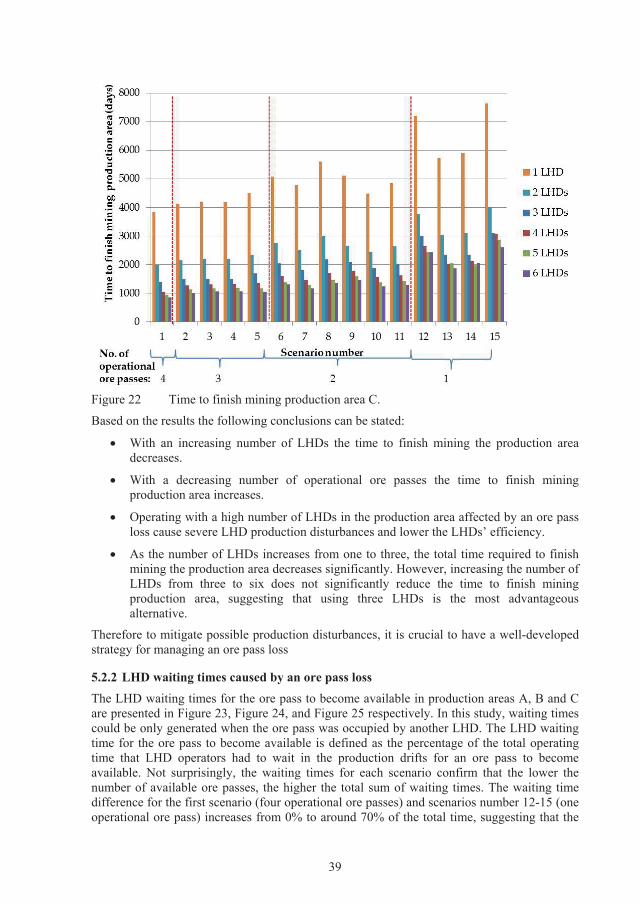
39
Figure 22 Time to finish mining production area C.
Based on the results the following conclusions can be stated:
With an increasing number of LHDs the time to finish mining the production area decreases.
With a decreasing number of operational ore passes the time to finish mining production area increases.
Operating with a high number of LHDs in the production area affected by an ore pass loss cause severe LHD production disturbances and lower the LHDs’ efficiency.
As the number of LHDs increases from one to three, the total time required to finish mining the production area decreases significantly. However, increasing the number of LHDs from three to six does not significantly reduce the time to finish mining production area, suggesting that using three LHDs is the most advantageous alternative.
Therefore to mitigate possible production disturbances, it is crucial to have a well-developed strategy for managing an ore pass loss
5.2.2 LHD waiting times caused by an ore pass lossThe LHD waiting times for the ore pass to become available in production areas A, B and C are presented in Figure 23, Figure 24, and Figure 25 respectively. In this study, waiting times could be only generated when the ore pass was occupied by another LHD. The LHD waiting time for the ore pass to become available is defined as the percentage of the total operating time that LHD operators had to wait in the production drifts for an ore pass to become available. Not surprisingly, the waiting times for each scenario confirm that the lower the number of available ore passes, the higher the total sum of waiting times. The waiting time difference for the first scenario (four operational ore passes) and scenarios number 12-15 (one operational ore pass) increases from 0% to around 70% of the total time, suggesting that the
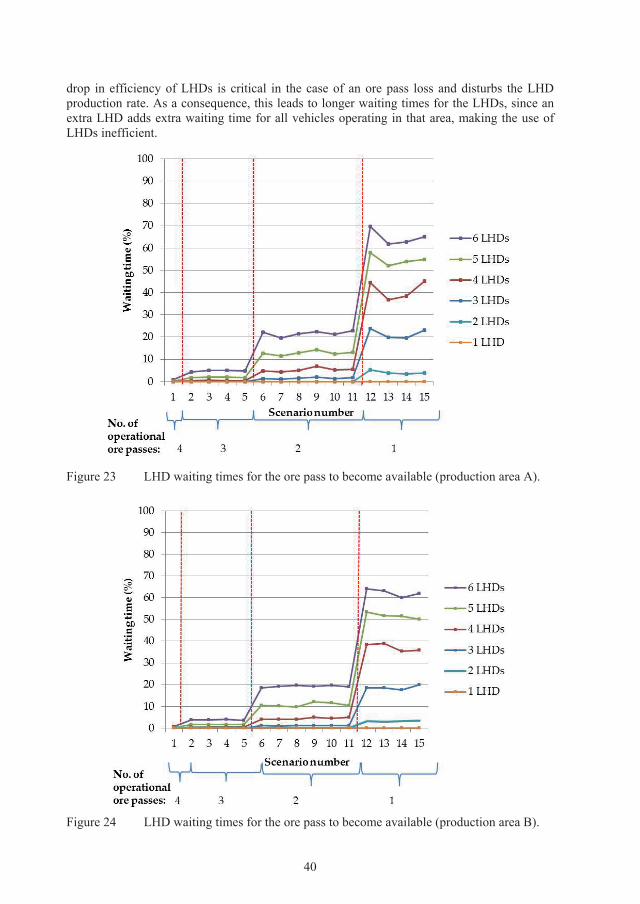
40
drop in efficiency of LHDs is critical in the case of an ore pass loss and disturbs the LHD production rate. As a consequence, this leads to longer waiting times for the LHDs, since an extra LHD adds extra waiting time for all vehicles operating in that area, making the use of LHDs inefficient.
Figure 23 LHD waiting times for the ore pass to become available (production area A).
Figure 24 LHD waiting times for the ore pass to become available (production area B).
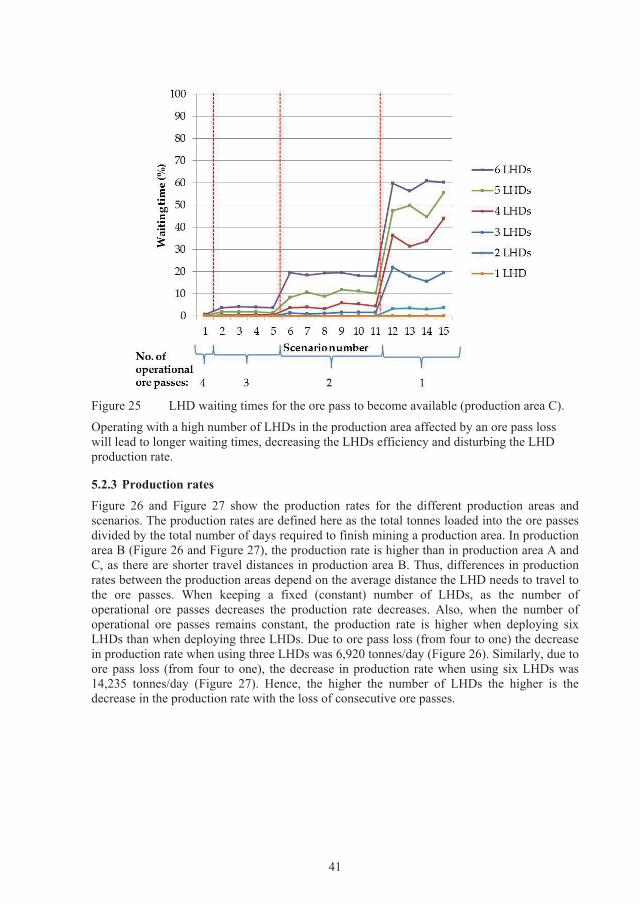
41
Figure 25 LHD waiting times for the ore pass to become available (production area C).
Operating with a high number of LHDs in the production area affected by an ore pass loss will lead to longer waiting times, decreasing the LHDs efficiency and disturbing the LHD production rate.
5.2.3 Production ratesFigure 26 and Figure 27 show the production rates for the different production areas and scenarios. The production rates are defined here as the total tonnes loaded into the ore passes divided by the total number of days required to finish mining a production area. In production area B (Figure 26 and Figure 27), the production rate is higher than in production area A and C, as there are shorter travel distances in production area B. Thus, differences in production rates between the production areas depend on the average distance the LHD needs to travel to the ore passes. When keeping a fixed (constant) number of LHDs, as the number of operational ore passes decreases the production rate decreases. Also, when the number of operational ore passes remains constant, the production rate is higher when deploying six LHDs than when deploying three LHDs. Due to ore pass loss (from four to one) the decrease in production rate when using three LHDs was 6,920 tonnes/day (Figure 26). Similarly, due to ore pass loss (from four to one), the decrease in production rate when using six LHDs was 14,235 tonnes/day (Figure 27). Hence, the higher the number of LHDs the higher is the decrease in the production rate with the loss of consecutive ore passes.
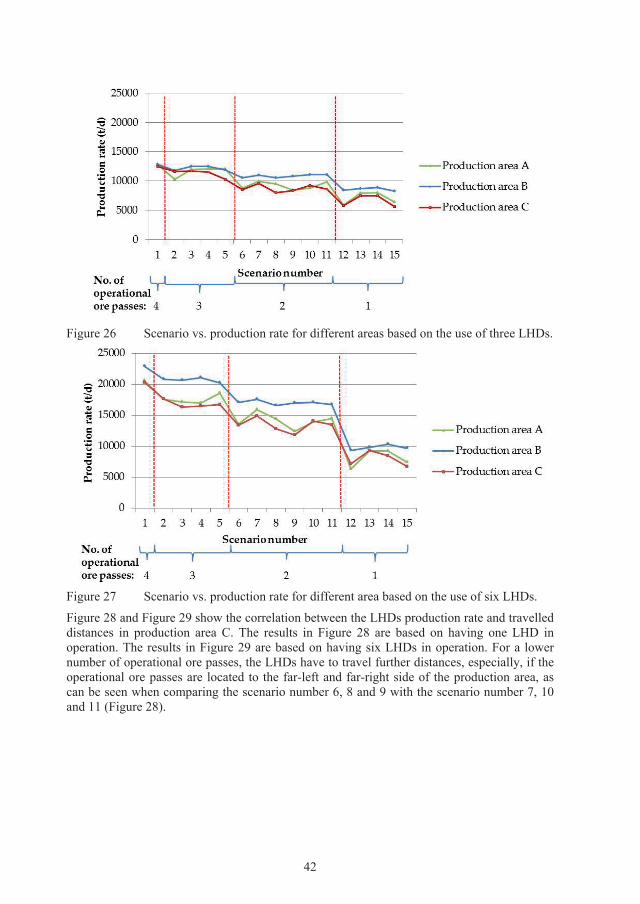
42
Figure 26 Scenario vs. production rate for different areas based on the use of three LHDs.
Figure 27 Scenario vs. production rate for different area based on the use of six LHDs.
Figure 28 and Figure 29 show the correlation between the LHDs production rate and travelled distances in production area C. The results in Figure 28 are based on having one LHD in operation. The results in Figure 29 are based on having six LHDs in operation. For a lowernumber of operational ore passes, the LHDs have to travel further distances, especially, if the operational ore passes are located to the far-left and far-right side of the production area, ascan be seen when comparing the scenario number 6, 8 and 9 with the scenario number 7, 10 and 11 (Figure 28).
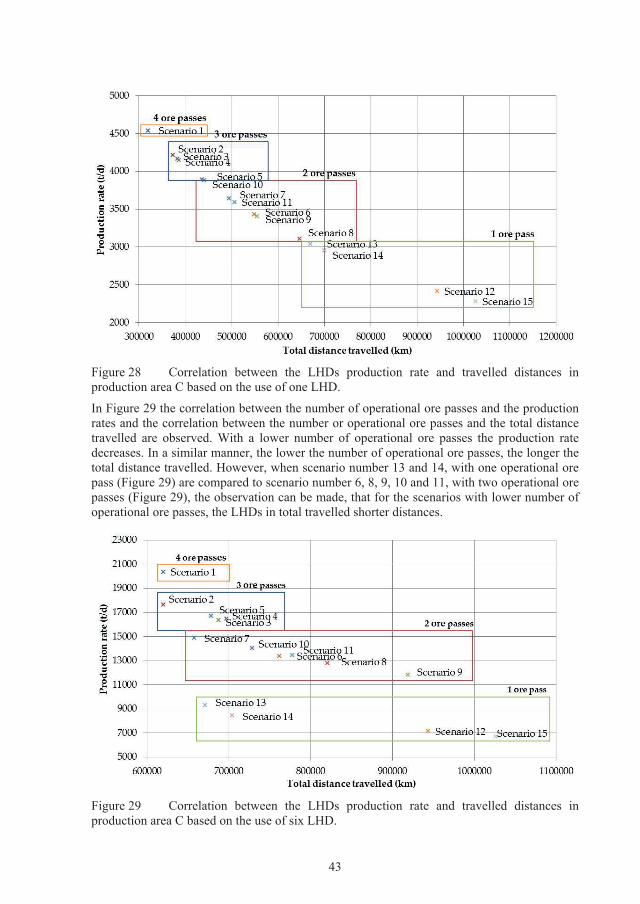
43
Figure 28 Correlation between the LHDs production rate and travelled distances in production area C based on the use of one LHD.
In Figure 29 the correlation between the number of operational ore passes and the production rates and the correlation between the number or operational ore passes and the total distance travelled are observed. With a lower number of operational ore passes the production rate decreases. In a similar manner, the lower the number of operational ore passes, the longer the total distance travelled. However, when scenario number 13 and 14, with one operational orepass (Figure 29) are compared to scenario number 6, 8, 9, 10 and 11, with two operational orepasses (Figure 29), the observation can be made, that for the scenarios with lower number of operational ore passes, the LHDs in total travelled shorter distances.
Figure 29 Correlation between the LHDs production rate and travelled distances in production area C based on the use of six LHD.
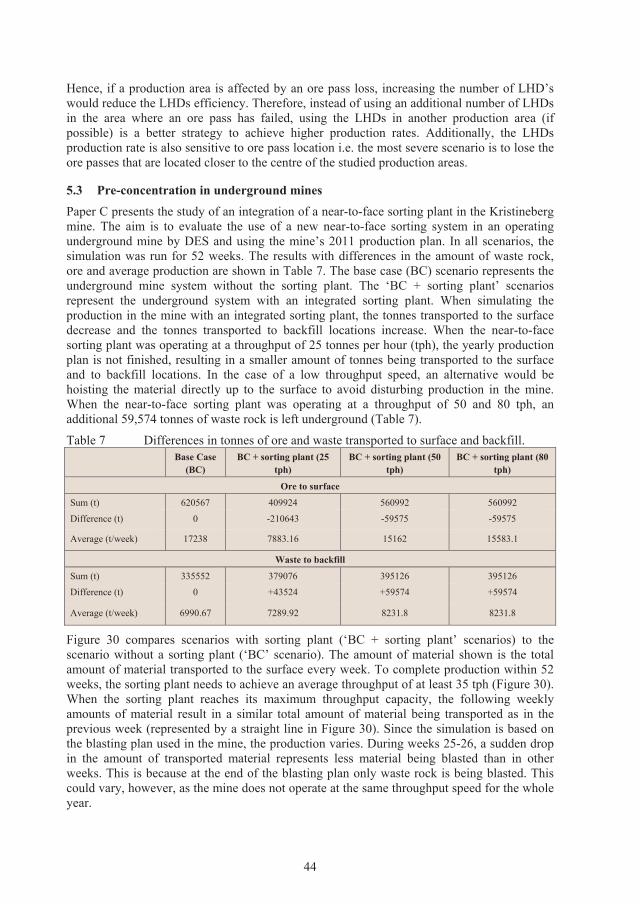
44
Hence, if a production area is affected by an ore pass loss, increasing the number of LHD’s would reduce the LHDs efficiency. Therefore, instead of using an additional number of LHDs in the area where an ore pass has failed, using the LHDs in another production area (if possible) is a better strategy to achieve higher production rates. Additionally, the LHDs production rate is also sensitive to ore pass location i.e. the most severe scenario is to lose the ore passes that are located closer to the centre of the studied production areas.
5.3 Pre-concentration in underground mines Paper C presents the study of an integration of a near-to-face sorting plant in the Kristineberg mine. The aim is to evaluate the use of a new near-to-face sorting system in an operating underground mine by DES and using the mine’s 2011 production plan. In all scenarios, the simulation was run for 52 weeks. The results with differences in the amount of waste rock, ore and average production are shown in Table 7. The base case (BC) scenario represents the underground mine system without the sorting plant. The ‘BC + sorting plant’ scenarios represent the underground system with an integrated sorting plant. When simulating the production in the mine with an integrated sorting plant, the tonnes transported to the surface decrease and the tonnes transported to backfill locations increase. When the near-to-face sorting plant was operating at a throughput of 25 tonnes per hour (tph), the yearly production plan is not finished, resulting in a smaller amount of tonnes being transported to the surface and to backfill locations. In the case of a low throughput speed, an alternative would be hoisting the material directly up to the surface to avoid disturbing production in the mine. When the near-to-face sorting plant was operating at a throughput of 50 and 80 tph, an additional 59,574 tonnes of waste rock is left underground (Table 7).
Table 7 Differences in tonnes of ore and waste transported to surface and backfill.Base Case
(BC)BC + sorting plant (25
tph)BC + sorting plant (50
tph)BC + sorting plant (80
tph)
Ore to surface
Sum (t) 620567 409924 560992 560992
Difference (t) 0 -210643 -59575 -59575
Average (t/week) 17238 7883.16 15162 15583.1
Waste to backfill
Sum (t) 335552 379076 395126 395126
Difference (t) 0 +43524 +59574 +59574
Average (t/week) 6990.67 7289.92 8231.8 8231.8
Figure 30 compares scenarios with sorting plant (‘BC + sorting plant’ scenarios) to the scenario without a sorting plant (‘BC’ scenario). The amount of material shown is the total amount of material transported to the surface every week. To complete production within 52 weeks, the sorting plant needs to achieve an average throughput of at least 35 tph (Figure 30). When the sorting plant reaches its maximum throughput capacity, the following weekly amounts of material result in a similar total amount of material being transported as in the previous week (represented by a straight line in Figure 30). Since the simulation is based on the blasting plan used in the mine, the production varies. During weeks 25-26, a sudden drop in the amount of transported material represents less material being blasted than in other weeks. This is because at the end of the blasting plan only waste rock is being blasted. This could vary, however, as the mine does not operate at the same throughput speed for the whole year.
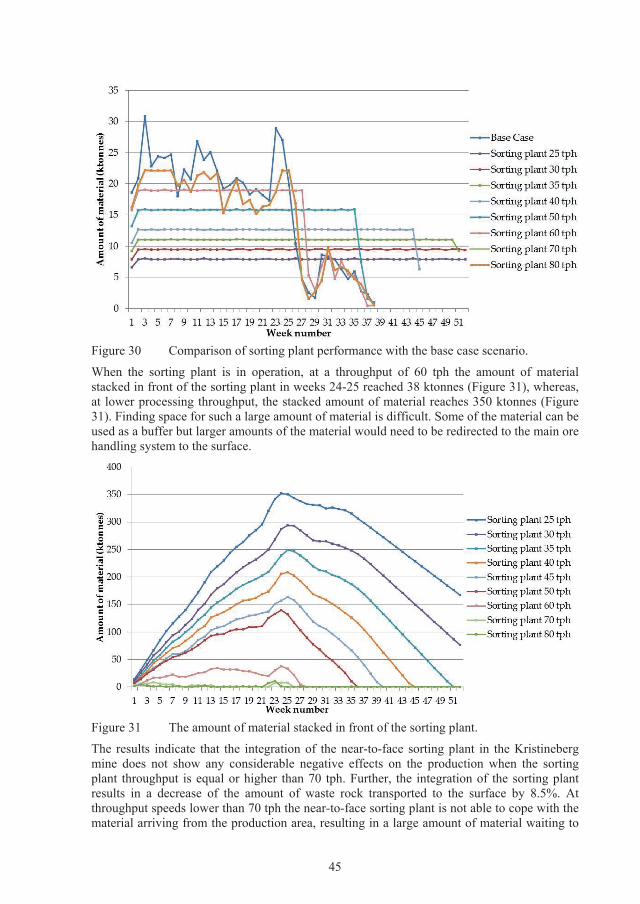
45
Figure 30 Comparison of sorting plant performance with the base case scenario.
When the sorting plant is in operation, at a throughput of 60 tph the amount of material stacked in front of the sorting plant in weeks 24-25 reached 38 ktonnes (Figure 31), whereas,at lower processing throughput, the stacked amount of material reaches 350 ktonnes (Figure 31). Finding space for such a large amount of material is difficult. Some of the material can be used as a buffer but larger amounts of the material would need to be redirected to the main ore handling system to the surface.
Figure 31 The amount of material stacked in front of the sorting plant.
The results indicate that the integration of the near-to-face sorting plant in the Kristineberg mine does not show any considerable negative effects on the production when the sorting plant throughput is equal or higher than 70 tph. Further, the integration of the sorting plant results in a decrease of the amount of waste rock transported to the surface by 8.5%. At throughput speeds lower than 70 tph the near-to-face sorting plant is not able to cope with the material arriving from the production area, resulting in a large amount of material waiting to
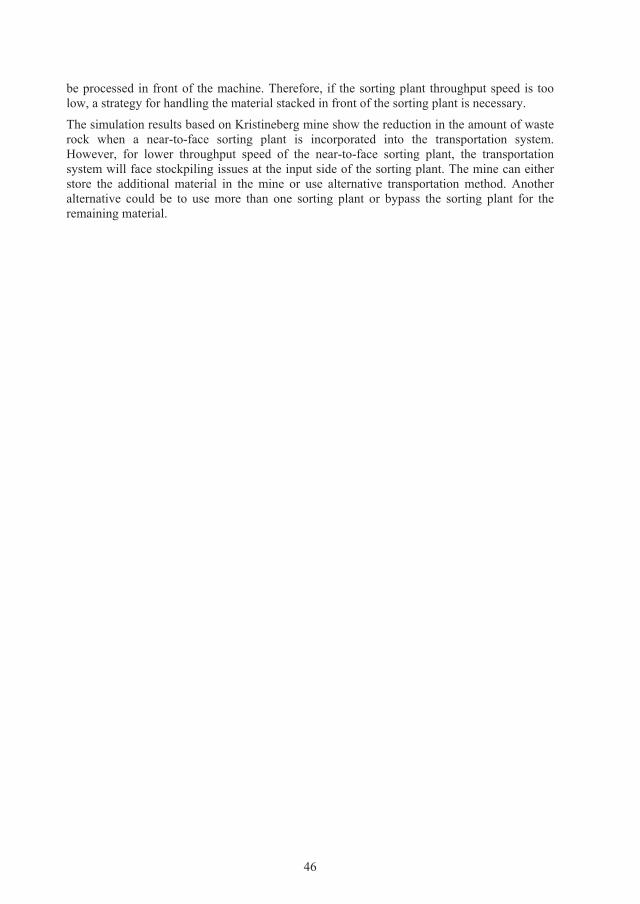
46
be processed in front of the machine. Therefore, if the sorting plant throughput speed is too low, a strategy for handling the material stacked in front of the sorting plant is necessary.
The simulation results based on Kristineberg mine show the reduction in the amount of waste rock when a near-to-face sorting plant is incorporated into the transportation system.However, for lower throughput speed of the near-to-face sorting plant, the transportation system will face stockpiling issues at the input side of the sorting plant. The mine can either store the additional material in the mine or use alternative transportation method. Another alternative could be to use more than one sorting plant or bypass the sorting plant for the remaining material.
47
CHAPTER 6:CONCLUSIONS
The research presented in this thesis has addressed the following issues:
Identification of the major challenges related to the rock transportation system in deep underground mines.
Analysis of the production variations for diesel LHD operations caused by long-term ore pass loss.
Analysis of the differences in performance between diesel and electric LHDs.
Analysis of the differences in energy consumption and gas emission between diesel and electric LHDs.
Analysis of the differences in rock mass transportation with and without the integration of a near-to-face sorting plant.
The following conclusions have been reached:
RQ1 What are the major challenges related to the rock transportation system in deep underground mines?
The study identified a number of challenges considered being critical in deep underground mining operations: high stresses and seismicity, rock support and ground control, high energy consumption, ventilation limitations, communication and flow of information, fragmentation, logistics, loading operations, problems with ore passes, temperature, media access and long travelling distances. Out of these, major challenges related to the rock transportation system were identified as being energy consumption and gas emissions (addressing the ventilation limitations), problems related to ore pass loss, and reducing unnecessary transportation of the rock (related to logistics and long travelling distances).
Energy consumption and gas emissions: Many of the mines studied and visited in the I2 Mine project considered high energy consumption (8 out of 15 mines) and ventilation requirements (11 out of 15 mines) as critical problems in deep underground mines. The mass movement system generates a large share of the energy consumption, which increases when rock masses has to be transported longer distances. Increased energy consumption and gas emissions at greater depths are strongly related to environment and ventilation requirements. The deeper the mine, the larger and more powerful the ventilation system is required in order to pump the air down into the drifts, resulting in high energy costs or even failing to provide the mine with enough fresh air.
Ore pass loss: Many of the mines studied and visited in the I2 Mine project (8 out of 15 mines) considered the potential loss of ore passes to be a critical issue for deep underground mines. This is as losing an ore pass creates disturbances in the rock mass transportation system, potentially disturbing the mine production. Exacerbating the problem, the potentially increased rock stresses and seismicity at greater depths may lead to a required decrease in the size of the ore passes further affecting the rock transportation.
48
Unnecessary rock mass transportation: Longer distances increase the energyconsumption, time and costs of rock transportation and most of the mines visited in theI2 Mine project (12 out of 15 mines) considered long transportation distances as acritical issue. One possible way to handle longer transportation distances is to reducethe unnecessary rock transportation, as this could improve the mining processes andreduce the costs and energy consumption related to longer travel.
RQ2 How can the rock transportation system be improved?
Paper A shows that diesel LHDs require large volumes of air (diesel LHD emitted2.68 kg of CO2 gas per litre of fuel compared to zero CO2 gas per litre fuel emitted byelectric LHD) for ventilation. It also shows that, on average, based on the studiedenergy prices, the energy cost is US$0.17/t higher for a diesel LHD than for an electricLHD. Therefore, minimising the use of diesel LHDs and maximising the use ofelectric LHDs will reduce the need for ventilation, the energy costs and the heat andexhaust gas emissions.
Paper B shows that the loss of ore passes causes severe LHD production disturbances.To mitigate possible production disturbances, it is crucial to have a well-developedstrategy for managing an ore pass loss. To maintain a high production rate, the LHDfleet has to be appropriately managed. For example, instead of using an additionalnumber of LHDs in the area where an ore pass has failed, using the LHDs in anotherproduction area (if possible) to achieve higher production rate could be an option. Asan example, in the presented case when one or two of four ore passes are lost, addingone additional LHD would be enough to maintain or even improve production.
Paper C shows that based, on the simulated production plan, integrating a near-to-facesorting plant in Kristineberg mine would reduce the amount of waste rock beingtransported to the surface by 8.5%. If the sorting plant average throughput speed islower than 70 tph, redirection of the material is required to avoid stacking of thematerial in front of the machine. In the case of stockpiling, a designated space shouldbe created. A possible alternative for improving the rock transportation system is touse more than one pre-concentration plant or let some of the material bypass thesorting plant.
RQ3 What are the effects of ore pass loss on the rock transportation system?
Paper B shows that for the studied case loss of the ore passes cause severe LHDproduction disturbances, leading to additional fleet requirements. Operating with ahigh number of LHDs in the production area affected by an ore pass loss will lowerthe LHDs’ efficiency and affect the production rate negatively. Based on the studiedproduction areas it can be concluded that for the studied case the deployment of threeLHDs is the most advantageous alternative. In addition, when two adjacent drifts areused for loading, the LHDs may have to travel to an ore pass located further awayfrom the production drift as the closer one may be occupied by another LHD. Thiswould lead to a decrease in the production rate and should be avoided. The resultsindicated that the most severe scenarios in the studied production areas are to lose theore passes that are located closer to the centre of the production area.
Ore pass loss results in an underperformance of the rock transportation system. Hence,in an event of an ore pass loss, he LHD efficiency has to be sacrificed in order tomaintain the production rates.
49
The paper also illustrates the possible severe consequences of incorrect handling ofore pass loss and highlights the need for a well-developed strategy for LHDoperations.
RQ4 How can the environmental effects related to the rock transportation system be minimised?
Paper A shows that, on average, based on the studied energy prices, the energy costsfor diesel and electric LHDs are US$0.24/t and US$0.07/t, respectively. Minimisingthe use of diesel machines and increasing the use of the electric machines wouldreduce energy consumption and the use of fossil-based fuels. Moreover, emissionsfrom diesel LHDs require large volumes of air for ventilation as they emit 2.68 kg ofCO2 gas per litre of fuel emissions from electric LHDs have zero CO2 and produceless heat. Additionally, the electric LHDs consume less energy. Although they areequipped with motors that require less energy to run, they achieve lower speeds thandiesel LHDs. To sum up, minimising the use of diesel LHDs will reduce emissions aswell as the need for ventilation to mitigate engine heat and emissions, thus loweringenergy consumption.
Paper C shows that the near-to-face sorting plant has the potential to significantlyreduce unnecessary rock transportation. The environmental effects related to the rocktransportation system can be minimised by implementing the near-to-face sorting plantin an underground mine that fulfil set of requirements such as in this case providingenough space for the near-to-face sorting plant infrastructure, addressing thefragmentation and backfilling issues and considering the distance from theconcentrator to backfilled location. Additionally addressing the cost of removing thewaste from the system compared to the cost and energy necessary for furthercomminution. This, in turn, will lower the environmental effects generated by hoistingwaste rock, surface rock transportation and further disposing and processing of therock on the surface.

50
51
CHAPTER 7:FUTURE STUDIES
In the coming decades, underground mines can be expected to operate at greater depths. The studies within the I2 Mine project found that the critical problems of deep underground mining operations are: high stresses and seismicity, rock support and ground control, high energy consumption, ventilation limitations, communication and flow of information,fragmentation, logistics, loading operations, problems with ore passes, temperature, media access and long travelling distances. From these, the energy consumption and gas emissions, ore pass loss and long travelling distances were further addressed in the work presented in this thesis. Based on the results from this research future studies should be conducted on the following issues:
Energy consumption and gas emissions of LHDsOperating at greater depths will increase energy costs and the ventilation needed to mitigate geothermal heat and exhaust gas emissions from working equipment. These expected cost increases will make the choice of LHDs an essential consideration. With the increasing ventilation problems caused by increasing depths, an important area of interest is the performance of the electric LHD machines, with a focus on the smaller ones, along with alternative ways of powering them. One of the interesting alternatives is the rapidly developing battery powered equipment. Another consideration is that the increased rock stresses in deeper mines may require a downsizing of the drifts and openings, and this will affect the size of equipment.
Ore pass lossIf ore passes are lost in the mining area, the resulting delays create disturbances and could jeopardise production. With the increasing problems caused by long-term ore pass loss,especially when mining at greater depths, the mines are forced to seek for other alternative methods. Thus, further studies are required with a focus to look at alternative options for ore pass design and mine infrastructure and come up with better ore pass loss mitigation strategies. This new options and mitigation strategies should aim at helping to improve the current underground transportation systems by either eliminating the risk of losing an ore pass or creating alternative methods for transporting rock masses to the surface or plans in form of guidelines.
Unnecessary rock mass transportationOperating at greater depths will increase costs because of the additional activities and energy required for longer transportation distances. The use of selective mining and pre-concentration is desirable and has a great potential for lowering not only the operational costs but also the environmental effects generated by longer transportation distances. Thus, further studies that address the factors governing the feasibility of selective mining, the near-to-face sorting plant and mining processing integration of near-to-face sorting issues are required.

52
53
REFERENCES
Arbetsmiljöverket, Hygieniska gränsvärden och åtgärder mot luftföroreningar, AFS 2005:17, Arbetsmiljöverket, Stockholm, 2010.
Bäckblom G., Forssberg E., Haugen S., Johansson J., Naarttijärvi T., and Öhlander B., MIFU –Smart Mine of the Future, Report, 2010.
Bailey M., Olsson B., and Glassock C., Underground Ore Handling Systems, 2012. Retrieved from http://www.miningone.com.au [accessed 2015-09-01].
Balci O., Guidelines for Successful Simulation Studies, in Proceedings of the 1990 Winter Simulation Conference in New Orleans, Louisiana, December 2-12 1990, pp. 25-32.
Bamber A., Klein B., Morin M., and Scoble M., Reducing Selectivity in Narrow-Vein Mining through the Integration of Underground Pre-concentration, in Proceedings of the Second International Symposium in Mining Techniques of Narrow-Vein Deposits, 2004, pp. 92-103.
Banks J., Carson J.S., Nelson B.L., and Nicol D.M., Discrete event system simulation, Upper Saddle River, NJ: Pearson Education, 2010.
Banks J., Getting started with Automod, Bountiful, UT: Brooks-PRI Automation, 2004.Banks J., Handbook of Simulation: Principles, Methodology, Advances, Applications, and Practice,
John Wiley, New York, USA, 1998.Bradstreet D., Simulation of Pillara’s Haulage System, 2010. Retrieved from
http://www.docstoc.com/docs/29170454/SIMULATION-OF-PILLARAS-HAULAGE-SYSTEM [accessed 2015-09-11].
Berglund K. and Günther D., Challenges with Deep Mining: Case Studies at Mindola and Mufulira Underground Mines, Zambia, MSc thesis, Luleå University of Technology, Sweden, 2014.
Berkhimer E.N., Selection and Sizing of Excavating, Loading, and Hauling Equipment, in SME Mining Engineering Handbook, P. Darling, ed., SME, 2011, pp. 931 – 939.
Beus M.J., Pariseau W.G., Steward B.M., and Iverson S.R., Design of Ore Passes, in Underground Mining Methods, W. A. Hustrulid and R.L. Bullock, eds., SME, New York, 2001, pp. 627–634.
Bise C.J., Mining engineering analysis, Society for Mining, Metallurgy, and Exploration, SME, Inc. 8307 Shaffer Parkway, Littleton, CO 80127, USA, 2003.
Bloss M., Harvey P., Grant D., and Routley C., Underground Ore Movement, in SME Mining Engineering Handbook, P. Darling, ed., SME, 2011, pp. 1271 - 1294.
Bogunovic D. and Kecojevic V., Equipment CO2 emissions in surface coal mining, International Journal of Mining and Mineral Engineering, 1:2 (2009), pp. 172–180.
Bosch, R., Hydrodynamic couplings and converters, Automotive Handbook (3rd ed.), 1993 p. 539.Brummer R.K., Design of orepasses: methods for determining the useful life of ore passes based on
previous experience and case studies, Report to CAMIRO Mining Division, Ontario, Canada, 1998.
Burt R., Dense-Medium Separation, Ullmann’s Encyclopedia of Industrial Chemistry, Wiley Online Library, 2000. Retrieved from http://onlinelibrary.wiley.com/doi/10.1002/14356007.b02_22/pdf [accessed 2015-09-14].
Chadwick J., Tomorrow’s LHD, Mining Magazine, 1 Aug 1996, pp. 69–87.
54
Derrick E.J., Balci O., and Nance R.E., A Comparison of Selected Conceptual Frameworks for Simulated Modeling, Polytechnic Institute and State University, Blackburg, Virgina, USA, 1989.
DMS Powders, Dense Media Separation. Retrieved from http://onlinelibrary.wiley.com/doi/10.1002/14356007.b02_22/pdf [accessed 2015-08-07].
Feasby D.G. and Tremblay G.A., Role of mineral processing in reducing environmental liability of mine wastes, 27th Annual CMP Meeting, Ottawa, 1995.
Greberg J. and Sundqvist F., Simulation as a tool for mine planning, in Proceedings of 2nd
International Future Mining, Melbourne, Australia, 2011, pp. 273-278.Greberg J. and Salama A., Innovative mining methods and processes for deep steeply dipping
deposits, I2Mine Subtask 2.1.1, Technical Report, Luleå University of Technology, Lulea, Sweden, 2016.
Hadjigeorgiou J. and Lessard J.F., Strategies for restoring material flow in ore and waste pass systems, International Journal of Mining, Reclamation and Environment, 24 (2010), pp. 267-282.
Hadjigeorgiou J. and Stacey T.R., The absence of strategy in orepass planning, design and management, Journal of the Southern African Institute of Mining and Metallurgy, 133 (2013), pp. 795-801.
Hadjigeorgiou J., Lessard J. F., and Mercier-Langevin F., Ore pass practice in Canadian mines,Journal of the Southern African Institute of Mining and Metallurgy, 105 (2005), pp. 809-816.
Halim A. and Kerai M., Ventilation Requirement for ‘Electric’ Underground Hard Rock Mines – AConceptual Study, in the Australian Mine Ventilation Conference, Adelaide, SA, 1-3July 2013, pp. 215-220.
Hoare R.T. and Willis R.J., A Case Study of Animated Computer Simulation in the Australian Mining Industry, Journal of the Operational Research Society, 43 (1992), pp. 1113-1120.
Hubbell J.H. and Seltzer S.M., X-Ray attenuation coefficients, Gaithersburg, MD: US National Institute of Standards and Technology (NIST). Retrieved from http://www.nist.gov/pml/data/xraycoef/index.cfm [accessed 2015-08-07].
Hambley D.F., Design of Ore Pass Systems for Underground Mines, CIM Bulletin 897 (1987), pp. 25–30.
Hunt C., Simulation model of ore transport at the Henderson mine, Computers and Geoscience, 20 (1994), pp. 75-84.
Jacobs W., Hodkiewicz M.R., and Bräunl T., A Cost-Benefit Analysis of Electric Loaders to Reduce Diesel Emissions in Underground Hard Rock Mines, IEEE Transactions on industry applications, 51(3), May/June 2015, pp. 2565-2573.
Joughin W.C. and Stacey T.R., Risks associated with rockpasses in deep-level tabular mines based on historical pass performance, Journal of the Southern African Institute of Mining and Metallurgy, 105 (2005), pp. 795-802.
Kecojevic V. and Komljenovic D., Haul truck fuel consumption and CO2 emission under various engine load conditions, Mining Engineering, 62:12 (2010), pp. 44–48.
Kleijnen J., Verification and validation of simulation models, European Journal of Operational Research, 82 (1995), pp. 145-162.
Klein B., Dunbar W.S., and Scoble M., Integrating mining and mineral processing for advanced mining system, CIM Bulletin, 95:1057 (2002), pp. 63-68.
55
Klein B., Hall R., Scoble M., and Dunbar W., Simulation of integrated underground mining-processing, in APCOM, South Africa, 2003a.
Klein B., Hall R., Scoble R., and Morin M., Total system approach to design for underground mine-mill integration, CIM Bulletin, 96:1067 (2003b), pp. 65-71.
Kvapil R., Gravity flow in sublevel and panel caving – a common sense approach, Luleå University of Technology, Sweden, 2004.
Law A.M. and Kelton W.D., Simulation modeling analysis (2nd Ed.), New York: McGraw-Hill, 1991.
Lloyd P., The potential of integrated mining and extraction systems on the Witwatersrand, in Proceedings of the 11th International Commonwealth Mining and Metallurgical Congress,1978.
Engineering Conversion Factors, List of common conversion factor. Retrieved from http://w.astro.berkeley.edu/~wright/fuel_energy.html [accessed 2015-09-14].
McGraw-Hill Dictionary of Scientific & Technical Terms, 6E, The McGraw-Hill Companies, Inc, 2003. Retrieved fromhttp://encyclopedia2.thefreedictionary.com/Thermal+gradient [accessed 2015-09-08].
Mielli F., Three major mining challenges and their technological solutions, Mining Engineering, September 2011, pp. 69-72.
Packer N., A beginner’s Guide to Energy and Power, Staffordshire University, UK, February, 2011.Paraszczak J., Laflamme M., and Fytas K., Electric load-haul-dump machines: Real alternative for
diesel? CIM Journal, 4:1 (2013), pp. 13–19.Paraszczak J., Svedlund E., Fytas K., and Laflamme M., Electrification of loaders and trucks: A
step towards more sustainable underground mining, International Conference on Renewable Energies and Power Quality (ICREPQ’14), Cordoba, Spain 2014.
Peters O., Scoble M., and Schumacher T., The technical and economic potential of mineral processing underground, Annual General Meeting, CIM, Calgary, 1999.
Paterson W. and Knights P., Management of trailing cables on electrically powered load-haul-dump units, in Proceedings of the Mining Education Australia-Res. Projects Rev., 2012, pp. 67-74.
Pereira J. and Meech J., Autonomous vs Manual Haulage Trucks – How Mine Simulation Contributes to Future Haulage System Developments, CIM Meeting in Canada, 2010.
Pronk A., Coble J.J., and Stewart P., Occupational exposure to diesel engine exhaust: A literature review, Journal of Exposure Science and Environmental Epidemiology, 19 (2009), pp. 443–457.
Robben C., De Korte J., Wotruba H., and Robben M., Experiences in Dry Coarse Separation Using X-Ray-Transmission-Based Sorting, International Journal of Coal Preparation and Utilization, 34(2014), pp. 210-219.
Robinson S., Simulation: The Practice of Model Development and Use, John Wiley & Sons Ltd.,Chichester 2004.
Roiste C., Palmerk C., and Taxell P., Workplace exposure to dusts and aerosols - diesel exhaust,European Agency for Safety and Health at Work, OSH Wiki, Networking Knowledge, 2013. Retrieved fromhttp://oshwiki.eu/wiki/Workplace_exposure_to_dusts_and_aerosols_-_diesel_exhaust[accessed 2015-07-28].
56
Sachse U. and Westgate N., Rockpasses: a guide to excavation methodology, Journal of the Southern African Institute of Mining and Metallurgy, 105(2005), pp. 759-764.
Salama A., Haulage system optimization for underground mines, PhD Thesis, Lulea University of Technology, Lulea, 2014.
Salama A. and Greberg J., Optimization of Truck-Loader haulage system in an underground mine: A simulation approach using SimMine, In Proceedings of the 6th International Conference and Exhibition on Mass Mining, Sudbury, ON, Canada, 10-14, June 2012.
Salama A., Greberg J., and Schunnesson H., The use of discrete event simulation for underground haulage mining equipment selection, International Journal of Mining and Mineral Engineering, 5:3 (2014a), pp. 256–271.
Salama A., Nehring M., and Greberg J., Analysis of the impact of increasing mining rate in underground mining using simulation and mixed integer programming, submitted to Journal of Southern African Institute of Mining and Metallurgy, 2015a.
Salama A., Nehring M., and Greberg J., Operating value optimisation using simulation and mixed integer programming, International Journal of Mining, Reclamation and Environment, 28:1(2014b), pp. 25–46.
Salama A., Nehring M., Greberg J., and Schunnesson H., Evaluation of the impact of commodity price change on the mine plan of underground mining, International Journal of Mining Science and Technology, 25:3 (2015b), pp. 375-382.
Sandvik, Sandvik underground mining system. Retrieved fromhttp://www.sandvik.com [accessed 2015-05-13].
Sargent R.G., Verification and validation of simulation models, in Proceedings of the 2011 Winter Simulation Conference, Syracuse University, New York, 2011, pp. 183-198.
Schena G.D., Gochin R.J., and Ferrara G., Preconcentration by Dense-Medium Separation – An economic evaluation, Transactions IMM, Section C, 99 (1990), pp. C21-C31.
Sturgul J.R., Discrete mine system simulation in the United States, International Journal of Mining Reclamation and Environment, 13:2(1999), pp. 37-41.
Sweigard R.J., Materials Handling: Loading and Haulage, in SME Mining Engineering Handbook, H.L. Hartman, ed., SME, Colorado, 1992, pp. 761 – 782.
Tatiya R., Surface and underground excavations: Methods, techniques, and equipment, CRC Press, 2013.
United States Environmental Protection Agency, Office of Transportation and Air Quality, Emission facts: Average carbon dioxide emission resulting from gasoline and diesel fuel,2005, (EPA420-F-05-001). Retrieved from https://www.chargepoint.com/files/420f05001.pdf [accessed 2015-09-09].
Varaschin J. and De Souza E., Economics of diesel fleet replacement by electric mining equipment,2015. Retrieved from http://www.airfinders.ca/wp-content/uploads/2015/06/Economics-of-Diesel-Fleet-Replacement-by-Electric-Mining-Equipment.pdf [accessed 2015-09-09].
Vergne J., Hard Rock Miner’s Handbook, Arizona: McIntosh Engineering, 2003.Yilmaz E., Advances in reducing large volumes of environmentally harmful mine waste rocks and
tailings, Gospodarka Surowcami Mineralnymi, 27:12 (2011), pp. 89-112.Yuriy G. and Runciman N., Discrete-event simulation in underground mining – applicability and
experience at Vale Canada operations, World Mining Congress 05-WMC, Canada, 2013.

57
APPENDED PAPERS

PAPER A
Analyzing energy consumption and gas emissions ofloading equipment in underground mining
Salama A.J., Greberg J., Skawina B., and Gustafson A., Analyzing energy consumption and gas emissions of loading equipment in underground mining, CIM Journal, Vol. 6, No. 4, 2015, pp. 179-188, http://dx.doi.org/10.15834/cimj.2015.24.

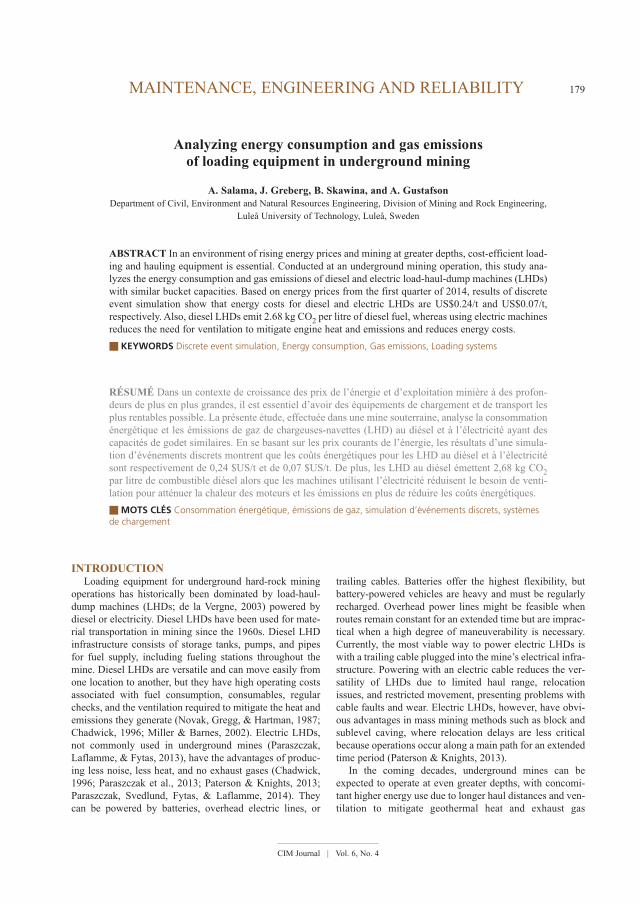
CIM Journal | Vol. 6, No. 4
MAINTENANCE, ENGINEERING AND RELIABILITY 179
INTRODUCTIONLoading equipment for underground hard-rock mining
operations has historically been dominated by load-haul-
dump machines (LHDs; de la Vergne, 2003) powered by
diesel or electricity. Diesel LHDs have been used for mate-
rial transportation in mining since the 1960s. Diesel LHD
infrastructure consists of storage tanks, pumps, and pipes
for fuel supply, including fueling stations throughout the
mine. Diesel LHDs are versatile and can move easily from
one location to another, but they have high operating costs
associated with fuel consumption, consumables, regular
checks, and the ventilation required to mitigate the heat and
emissions they generate (Novak, Gregg, & Hartman, 1987;
Chadwick, 1996; Miller & Barnes, 2002). Electric LHDs,
not commonly used in underground mines (Paraszczak,
Laflamme, & Fytas, 2013), have the advantages of produc-
ing less noise, less heat, and no exhaust gases (Chadwick,
1996; Paraszczak et al., 2013; Paterson & Knights, 2013;
Paraszczak, Svedlund, Fytas, & Laflamme, 2014). They
can be powered by batteries, overhead electric lines, or
trailing cables. Batteries offer the highest flexibility, but
battery-powered vehicles are heavy and must be regularly
recharged. Overhead power lines might be feasible when
routes remain constant for an extended time but are imprac-
tical when a high degree of maneuverability is necessary.
Currently, the most viable way to power electric LHDs is
with a trailing cable plugged into the mine’s electrical infra-
structure. Powering with an electric cable reduces the ver-
satility of LHDs due to limited haul range, relocation
issues, and restricted movement, presenting problems with
cable faults and wear. Electric LHDs, however, have obvi-
ous advantages in mass mining methods such as block and
sublevel caving, where relocation delays are less critical
because operations occur along a main path for an extended
time period (Paterson & Knights, 2013).
In the coming decades, underground mines can be
expected to operate at even greater depths, with concomi-
tant higher energy use due to longer haul distances and ven-
tilation to mitigate geothermal heat and exhaust gas
Analyzing energy consumption and gas emissions of loading equipment in underground mining
A. Salama, J. Greberg, B. Skawina, and A. GustafsonDepartment of Civil, Environment and Natural Resources Engineering, Division of Mining and Rock Engineering,
Luleå University of Technology, Luleå, Sweden
ABSTRACT In an environment of rising energy prices and mining at greater depths, cost-efficient load-
ing and hauling equipment is essential. Conducted at an underground mining operation, this study ana-
lyzes the energy consumption and gas emissions of diesel and electric load-haul-dump machines (LHDs)
with similar bucket capacities. Based on energy prices from the first quarter of 2014, results of discrete
event simulation show that energy costs for diesel and electric LHDs are US$0.24/t and US$0.07/t,
respectively. Also, diesel LHDs emit 2.68 kg CO2 per litre of diesel fuel, whereas using electric machines
reduces the need for ventilation to mitigate engine heat and emissions and reduces energy costs.
� KEYWORDS Discrete event simulation, Energy consumption, Gas emissions, Loading systems
RÉSUMÉ Dans un contexte de croissance des prix de l’énergie et d’exploitation minière à des profon-
deurs de plus en plus grandes, il est essentiel d’avoir des équipements de chargement et de transport les
plus rentables possible. La présente étude, effectuée dans une mine souterraine, analyse la consommation
énergétique et les émissions de gaz de chargeuses-navettes (LHD) au diésel et à l’électricité ayant des
capacités de godet similaires. En se basant sur les prix courants de l’énergie, les résultats d’une simula-
tion d’événements discrets montrent que les coûts énergétiques pour les LHD au diésel et à l’électricité
sont respectivement de 0,24 $US/t et de 0,07 $US/t. De plus, les LHD au diésel émettent 2,68 kg CO2par litre de combustible diésel alors que les machines utilisant l’électricité réduisent le besoin de venti-
lation pour atténuer la chaleur des moteurs et les émissions en plus de réduire les coûts énergétiques.
� MOTS CLÉS Consommation énergétique, émissions de gaz, simulation d’événements discrets, systèmesde chargement
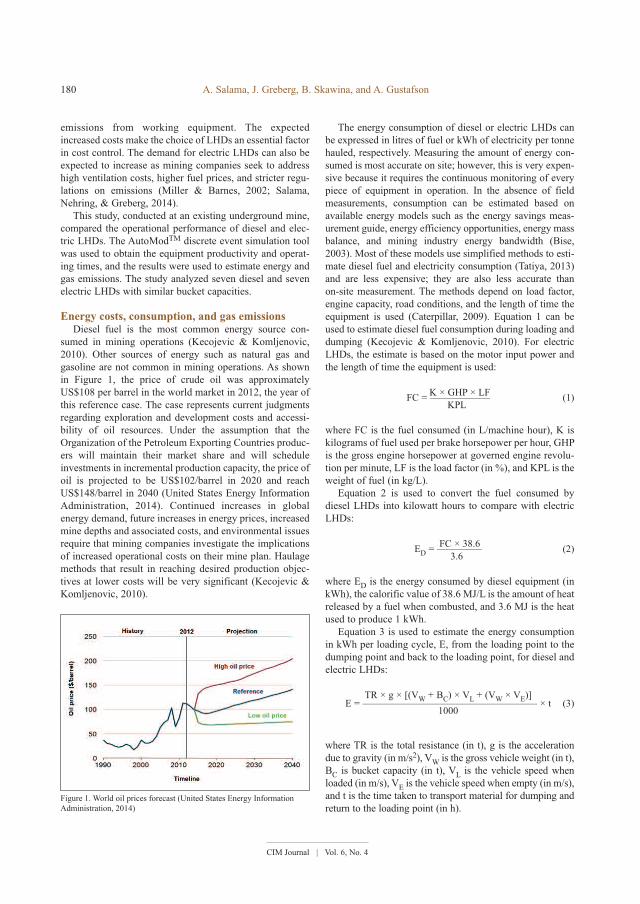
CIM Journal | Vol. 6, No. 4
180 A. Salama, J. Greberg, B. Skawina, and A. Gustafson
emissions from working equipment. The expected
increased costs make the choice of LHDs an essential factor
in cost control. The demand for electric LHDs can also be
expected to increase as mining companies seek to address
high ventilation costs, higher fuel prices, and stricter regu-
lations on emissions (Miller & Barnes, 2002; Salama,
Nehring, & Greberg, 2014).
This study, conducted at an existing underground mine,
compared the operational performance of diesel and elec-
tric LHDs. The AutoModTM discrete event simulation tool
was used to obtain the equipment productivity and operat-
ing times, and the results were used to estimate energy and
gas emissions. The study analyzed seven diesel and seven
electric LHDs with similar bucket capacities.
Energy costs, consumption, and gas emissionsDiesel fuel is the most common energy source con-
sumed in mining operations (Kecojevic & Komljenovic,
2010). Other sources of energy such as natural gas and
gasoline are not common in mining operations. As shown
in Figure 1, the price of crude oil was approximately
US$108 per barrel in the world market in 2012, the year of
this reference case. The case represents current judgments
regarding exploration and development costs and accessi-
bility of oil resources. Under the assumption that the
Organization of the Petroleum Exporting Countries produc-
ers will maintain their market share and will schedule
investments in incremental production capacity, the price of
oil is projected to be US$102/barrel in 2020 and reach
US$148/barrel in 2040 (United States Energy Information
Administration, 2014). Continued increases in global
energy demand, future increases in energy prices, increased
mine depths and associated costs, and environmental issues
require that mining companies investigate the implications
of increased operational costs on their mine plan. Haulage
methods that result in reaching desired production objec-
tives at lower costs will be very significant (Kecojevic &
Komljenovic, 2010).
The energy consumption of diesel or electric LHDs can
be expressed in litres of fuel or kWh of electricity per tonne
hauled, respectively. Measuring the amount of energy con-
sumed is most accurate on site; however, this is very expen-
sive because it requires the continuous monitoring of every
piece of equipment in operation. In the absence of field
measurements, consumption can be estimated based on
available energy models such as the energy savings meas-
urement guide, energy efficiency opportunities, energy mass
balance, and mining industry energy bandwidth (Bise,
2003). Most of these models use simplified methods to esti-
mate diesel fuel and electricity consumption (Tatiya, 2013)
and are less expensive; they are also less accurate than
on-site measurement. The methods depend on load factor,
engine capacity, road conditions, and the length of time the
equipment is used (Caterpillar, 2009). Equation 1 can be
used to estimate diesel fuel consumption during loading and
dumping (Kecojevic & Komljenovic, 2010). For electric
LHDs, the estimate is based on the motor input power and
the length of time the equipment is used:
K × GHP × LF FC = –––––––––––– (1) KPL
where FC is the fuel consumed (in L/machine hour), K is
kilograms of fuel used per brake horsepower per hour, GHP
is the gross engine horsepower at governed engine revolu-
tion per minute, LF is the load factor (in %), and KPL is the
weight of fuel (in kg/L).
Equation 2 is used to convert the fuel consumed by
diesel LHDs into kilowatt hours to compare with electric
LHDs:
FC × 38.6 ED = ––––––––– (2) 3.6
where ED is the energy consumed by diesel equipment (in
kWh), the calorific value of 38.6 MJ/L is the amount of heat
released by a fuel when combusted, and 3.6 MJ is the heat
used to produce 1 kWh.
Equation 3 is used to estimate the energy consumption
in kWh per loading cycle, E, from the loading point to the
dumping point and back to the loading point, for diesel and
electric LHDs:
TR × g × [(VW + BC) × VL + (VW × VE)] E = ––––––––––––––––––––––––––––––––––– × t (3) 1000
where TR is the total resistance (in t), g is the acceleration
due to gravity (in m/s2), VW is the gross vehicle weight (in t),
BC is bucket capacity (in t), VL is the vehicle speed when
loaded (in m/s), VE is the vehicle speed when empty (in m/s),
and t is the time taken to transport material for dumping and
return to the loading point (in h).Figure 1. World oil prices forecast (United States Energy Information
Administration, 2014)
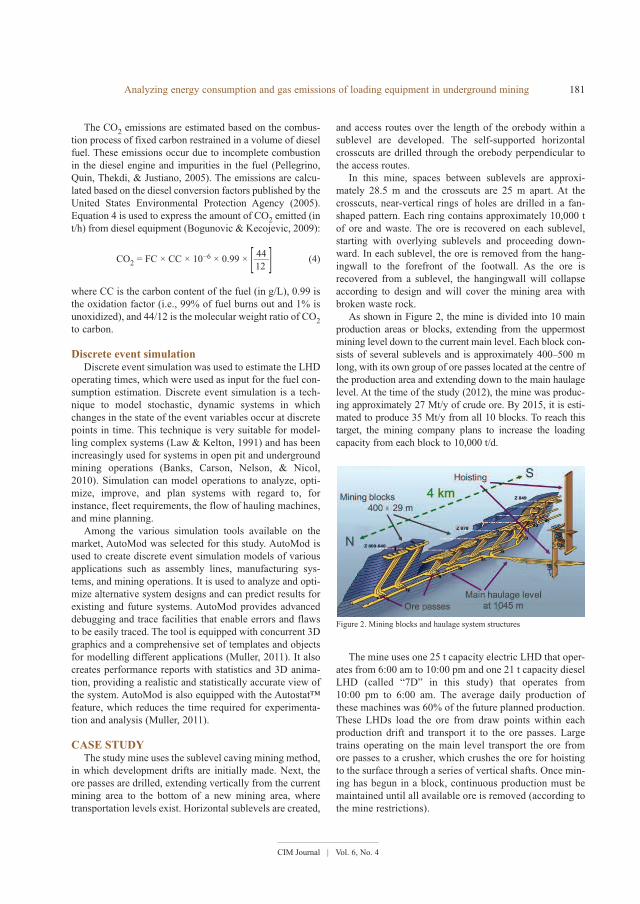
CIM Journal | Vol. 6, No. 4
Analyzing energy consumption and gas emissions of loading equipment in underground mining 181
The CO2 emissions are estimated based on the combus-
tion process of fixed carbon restrained in a volume of diesel
fuel. These emissions occur due to incomplete combustion
in the diesel engine and impurities in the fuel (Pellegrino,
Quin, Thekdi, & Justiano, 2005). The emissions are calcu-
lated based on the diesel conversion factors published by the
United States Environmental Protection Agency (2005).
Equation 4 is used to express the amount of CO2 emitted (in
t/h) from diesel equipment (Bogunovic & Kecojevic, 2009):
44 CO2 = FC × CC × 10−6 × 0.99 × [–––] (4) 12
where CC is the carbon content of the fuel (in g/L), 0.99 is
the oxidation factor (i.e., 99% of fuel burns out and 1% is
unoxidized), and 44/12 is the molecular weight ratio of CO2to carbon.
Discrete event simulation Discrete event simulation was used to estimate the LHD
operating times, which were used as input for the fuel con-
sumption estimation. Discrete event simulation is a tech-
nique to model stochastic, dynamic systems in which
changes in the state of the event variables occur at discrete
points in time. This technique is very suitable for model-
ling complex systems (Law & Kelton, 1991) and has been
increasingly used for systems in open pit and underground
mining operations (Banks, Carson, Nelson, & Nicol,
2010). Simulation can model operations to analyze, opti-
mize, improve, and plan systems with regard to, for
instance, fleet requirements, the flow of hauling machines,
and mine planning.
Among the various simulation tools available on the
market, AutoMod was selected for this study. AutoMod is
used to create discrete event simulation models of various
applications such as assembly lines, manufacturing sys-
tems, and mining operations. It is used to analyze and opti-
mize alternative system designs and can predict results for
existing and future systems. AutoMod provides advanced
debugging and trace facilities that enable errors and flaws
to be easily traced. The tool is equipped with concurrent 3D
graphics and a comprehensive set of templates and objects
for modelling different applications (Muller, 2011). It also
creates performance reports with statistics and 3D anima-
tion, providing a realistic and statistically accurate view of
the system. AutoMod is also equipped with the Autostat™
feature, which reduces the time required for experimenta-
tion and analysis (Muller, 2011).
CASE STUDYThe study mine uses the sublevel caving mining method,
in which development drifts are initially made. Next, the
ore passes are drilled, extending vertically from the current
mining area to the bottom of a new mining area, where
transportation levels exist. Horizontal sublevels are created,
and access routes over the length of the orebody within a
sublevel are developed. The self-supported horizontal
crosscuts are drilled through the orebody perpendicular to
the access routes.
In this mine, spaces between sublevels are approxi-
mately 28.5 m and the crosscuts are 25 m apart. At the
crosscuts, near-vertical rings of holes are drilled in a fan-
shaped pattern. Each ring contains approximately 10,000 t
of ore and waste. The ore is recovered on each sublevel,
starting with overlying sublevels and proceeding down-
ward. In each sublevel, the ore is removed from the hang-
ingwall to the forefront of the footwall. As the ore is
recovered from a sublevel, the hangingwall will collapse
according to design and will cover the mining area with
broken waste rock.
As shown in Figure 2, the mine is divided into 10 main
production areas or blocks, extending from the uppermost
mining level down to the current main level. Each block con-
sists of several sublevels and is approximately 400–500 m
long, with its own group of ore passes located at the centre of
the production area and extending down to the main haulage
level. At the time of the study (2012), the mine was produc-
ing approximately 27 Mt/y of crude ore. By 2015, it is esti-
mated to produce 35 Mt/y from all 10 blocks. To reach this
target, the mining company plans to increase the loading
capacity from each block to 10,000 t/d.
The mine uses one 25 t capacity electric LHD that oper-
ates from 6:00 am to 10:00 pm and one 21 t capacity diesel
LHD (called “7D” in this study) that operates from
10:00 pm to 6:00 am. The average daily production of
these machines was 60% of the future planned production.
These LHDs load the ore from draw points within each
production drift and transport it to the ore passes. Large
trains operating on the main level transport the ore from
ore passes to a crusher, which crushes the ore for hoisting
to the surface through a series of vertical shafts. Once min-
ing has begun in a block, continuous production must be
maintained until all available ore is removed (according to
the mine restrictions).
Figure 2. Mining blocks and haulage system structures
CIM Journal | Vol. 6, No. 4
182 A. Salama, J. Greberg, B. Skawina, and A. Gustafson
For this study, the energy consumption and gas emis-
sions for the LHD 7D and the other diesel LHDs shown in
Table 1 were compared to electric LHDs of similar bucket
size. The 25 t electric LHD was not considered for this
analysis because there was no available diesel counterpart
with similar bucket size. The LHD 7D data were collected
from the mine, whereas data for all other LHDs were
obtained from the manufacturers. The energy consumption
was estimated based on simulation results and empirical
formulas. Simulation was used to estimate LHD operating
times; the simulation results then served inputs to estimate
energy consumption and gas emissions. The combined use
of simulation and analytical calculations enables a more
accurate estimate of energy consumption and emissions
than the single analytical method traditionally used. The
single analytical method can be successfully applied when
a system involves fewer random activities. During loading
operations, randomness is present in many situations, such
as variability in loading and dump times, tramming dis-
tances, and times to clear boulders at the ore passes. When
a system contains uncertainty and random behaviour, the
discrete event simulation approach offers the advantage of
more accurate accounting for real-world uncertainty and
operations diversity.
Simulation model formulationThe simulation method for this research was chosen
because the mining system includes many uncertain opera-
tional elements and random behaviour. The discrete event
simulation approach was considered the most appropriate
technique to study such operations and can accurately
account for the real-world uncertainty and diverse variables
of the interdependent components in mining operations. A
detailed, accurate simulation model for large, complex sys-
tems requires a large dataset, statistical distributions of the
data, and a careful choice of simulation software. In this
study, the simulation model was developed using AutoMod
software, which consists of material movement systems
that allow users to model manual and automated equipment
such as LHDs with a high degree of accuracy (Muller,
2011). When system elements such as paths and stations are
known, then operating parameters such as speed, turning
speed, acceleration, and deceleration can be defined in the
movement system (Banks, 2004).
Input dataTable 1 shows the kinematics data for the diesel and
electric LHDs. Fourteen types of LHDs were analyzed
(seven diesel and seven electric) with similar bucket capac-
ities. The electric LHD 7E was not yet on the market; there-
fore, data for this machine were estimated based on
assumptions from the manufacturer’s experts. The average
speed for all LHDs operating in third gear was used for the
analysis.
Table 2 shows the technical parameters used for energy
consumption calculations. The calculated energy was the
energy required to drive the LHD. The operating weight of
both types of LHD increased in proportion to machine size.
The diesel LHDs had higher drive power compared to the
electric LHDs with similar bucket sizes. Normally, the fuel
or electricity consumption rate of a vehicle is determined
based on the machine loading rate, vehicle efficiency, road
Table 2. Technical parameters for diesel and electric LHDs (LHDs: load-haul-dump machines)
LHD type Vehicle operating weight (t) Drive power (kW)
Diesel Electric Diesel Electric Diesel Electric
1D 1E 8.7 9.4 71 55
2D 2E 12.32 13.0 63 56
3D 3E 19.6 17.3 150 75
4D 4E 24.3 24.5 170 110
5D 5E 26.2 28.2 220 132
6D 6E 39.0 38.5 250 243
7D 7E 56.8 58.4 350 283
Table 1. Kinematics parameters for diesel and electric LHDs (LHDs: load-haul-dump machines)
LHD type Bucket capacity Speed (empty) Speed (loaded) (m3) (m/s) (m/s)
Diesel Electric Diesel Electric Diesel Electric
1D 1E 1.5 6.67 2.86 6.44 2.78
2D 2E 1.6 5.42 2.48 5.25 2.46
3D 3E 3.0 7.22 2.54 7.11 2.45
4D 4E 4.5 6.53 3.33 5.94 3.06
5D 5E 4.6 7.50 4.39 7.33 4.19
6D 6E 5.4 8.17 4.31 7.47 4.17
7D 7E 9.0 7.08 3.75 6.56 4.17
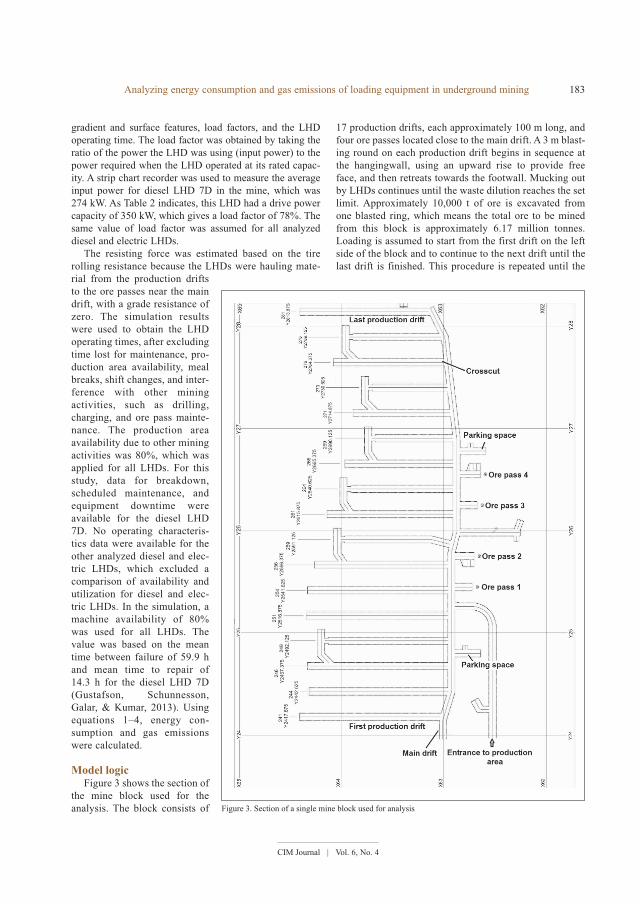
CIM Journal | Vol. 6, No. 4
Analyzing energy consumption and gas emissions of loading equipment in underground mining 183
gradient and surface features, load factors, and the LHD
operating time. The load factor was obtained by taking the
ratio of the power the LHD was using (input power) to the
power required when the LHD operated at its rated capac-
ity. A strip chart recorder was used to measure the average
input power for diesel LHD 7D in the mine, which was
274 kW. As Table 2 indicates, this LHD had a drive power
capacity of 350 kW, which gives a load factor of 78%. The
same value of load factor was assumed for all analyzed
diesel and electric LHDs.
The resisting force was estimated based on the tire
rolling resistance because the LHDs were hauling mate-
rial from the production drifts
to the ore passes near the main
drift, with a grade resistance of
zero. The simulation results
were used to obtain the LHD
operating times, after excluding
time lost for maintenance, pro-
duction area availability, meal
breaks, shift changes, and inter-
ference with other mining
activities, such as drilling,
charging, and ore pass mainte-
nance. The production area
availability due to other mining
activities was 80%, which was
applied for all LHDs. For this
study, data for breakdown,
scheduled maintenance, and
equipment downtime were
available for the diesel LHD
7D. No operating characteris-
tics data were available for the
other analyzed diesel and elec-
tric LHDs, which excluded a
comparison of availability and
utilization for diesel and elec-
tric LHDs. In the simulation, a
machine availability of 80%
was used for all LHDs. The
value was based on the mean
time between failure of 59.9 h
and mean time to repair of
14.3 h for the diesel LHD 7D
(Gustafson, Schunnesson,
Galar, & Kumar, 2013). Using
equations 1–4, energy con-
sumption and gas emissions
were calculated.
Model logicFigure 3 shows the section of
the mine block used for the
analysis. The block consists of
17 production drifts, each approximately 100 m long, and
four ore passes located close to the main drift. A 3 m blast-
ing round on each production drift begins in sequence at
the hangingwall, using an upward rise to provide free
face, and then retreats towards the footwall. Mucking out
by LHDs continues until the waste dilution reaches the set
limit. Approximately 10,000 t of ore is excavated from
one blasted ring, which means the total ore to be mined
from this block is approximately 6.17 million tonnes.
Loading is assumed to start from the first drift on the left
side of the block and to continue to the next drift until the
last drift is finished. This procedure is repeated until the
Figure 3. Section of a single mine block used for analysis
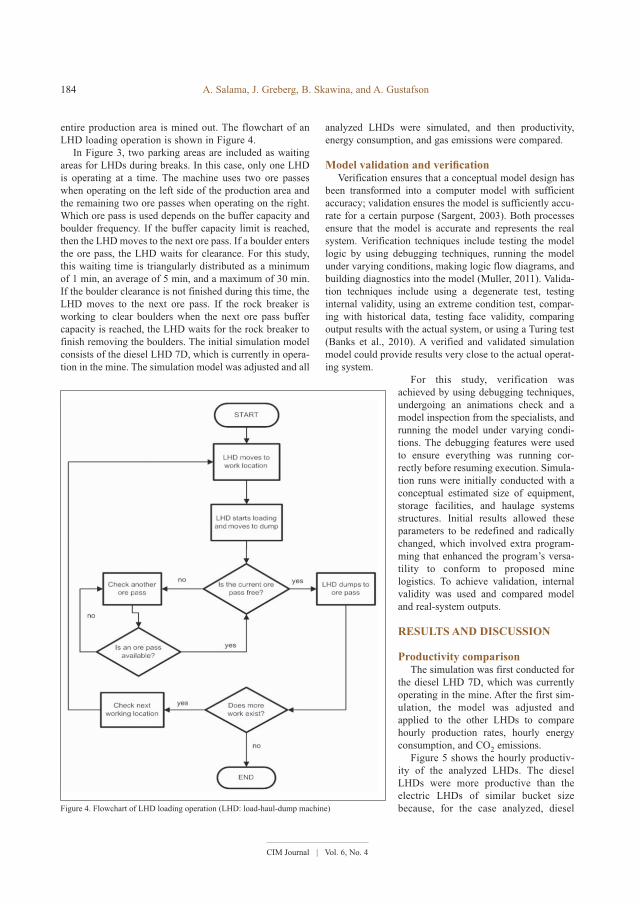
CIM Journal | Vol. 6, No. 4
184 A. Salama, J. Greberg, B. Skawina, and A. Gustafson
entire production area is mined out. The flowchart of an
LHD loading operation is shown in Figure 4.
In Figure 3, two parking areas are included as waiting
areas for LHDs during breaks. In this case, only one LHD
is operating at a time. The machine uses two ore passes
when operating on the left side of the production area and
the remaining two ore passes when operating on the right.
Which ore pass is used depends on the buffer capacity and
boulder frequency. If the buffer capacity limit is reached,
then the LHD moves to the next ore pass. If a boulder enters
the ore pass, the LHD waits for clearance. For this study,
this waiting time is triangularly distributed as a minimum
of 1 min, an average of 5 min, and a maximum of 30 min.
If the boulder clearance is not finished during this time, the
LHD moves to the next ore pass. If the rock breaker is
working to clear boulders when the next ore pass buffer
capacity is reached, the LHD waits for the rock breaker to
finish removing the boulders. The initial simulation model
consists of the diesel LHD 7D, which is currently in opera-
tion in the mine. The simulation model was adjusted and all
analyzed LHDs were simulated, and then productivity,
energy consumption, and gas emissions were compared.
Model validation and verificationVerification ensures that a conceptual model design has
been transformed into a computer model with sufficient
accuracy; validation ensures the model is sufficiently accu-
rate for a certain purpose (Sargent, 2003). Both processes
ensure that the model is accurate and represents the real
system. Verification techniques include testing the model
logic by using debugging techniques, running the model
under varying conditions, making logic flow diagrams, and
building diagnostics into the model (Muller, 2011). Valida-
tion techniques include using a degenerate test, testing
internal validity, using an extreme condition test, compar-
ing with historical data, testing face validity, comparing
output results with the actual system, or using a Turing test
(Banks et al., 2010). A verified and validated simulation
model could provide results very close to the actual operat-
ing system.
For this study, verification was
achieved by using debugging techniques,
undergoing an animations check and a
model inspection from the specialists, and
running the model under varying condi-
tions. The debugging features were used
to ensure everything was running cor-
rectly before resuming execution. Simula-
tion runs were initially conducted with a
conceptual estimated size of equipment,
storage facilities, and haulage systems
structures. Initial results allowed these
parameters to be redefined and radically
changed, which involved extra program-
ming that enhanced the program’s versa-
tility to conform to proposed mine
logistics. To achieve validation, internal
validity was used and compared model
and real-system outputs.
RESULTS AND DISCUSSION
Productivity comparisonThe simulation was first conducted for
the diesel LHD 7D, which was currently
operating in the mine. After the first sim-
ulation, the model was adjusted and
applied to the other LHDs to compare
hourly production rates, hourly energy
consumption, and CO2 emissions.
Figure 5 shows the hourly productiv-
ity of the analyzed LHDs. The diesel
LHDs were more productive than the
electric LHDs of similar bucket size
because, for the case analyzed, dieselFigure 4. Flowchart of LHD loading operation (LHD: load-haul-dump machine)
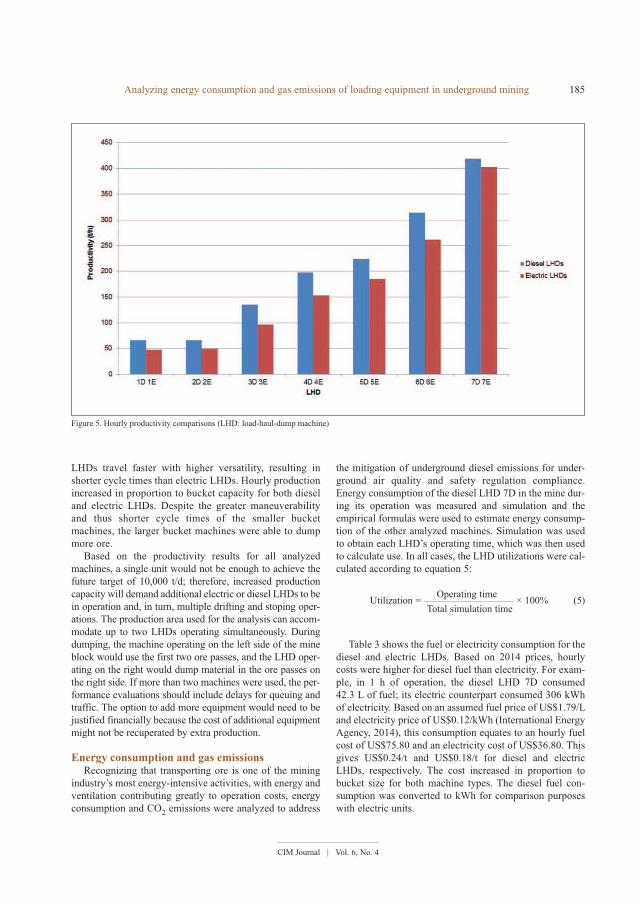
CIM Journal | Vol. 6, No. 4
Analyzing energy consumption and gas emissions of loading equipment in underground mining 185
LHDs travel faster with higher versatility, resulting in
shorter cycle times than electric LHDs. Hourly production
increased in proportion to bucket capacity for both diesel
and electric LHDs. Despite the greater maneuverability
and thus shorter cycle times of the smaller bucket
machines, the larger bucket machines were able to dump
more ore.
Based on the productivity results for all analyzed
machines, a single unit would not be enough to achieve the
future target of 10,000 t/d; therefore, increased production
capacity will demand additional electric or diesel LHDs to be
in operation and, in turn, multiple drifting and stoping oper-
ations. The production area used for the analysis can accom-
modate up to two LHDs operating simultaneously. During
dumping, the machine operating on the left side of the mine
block would use the first two ore passes, and the LHD oper-
ating on the right would dump material in the ore passes on
the right side. If more than two machines were used, the per-
formance evaluations should include delays for queuing and
traffic. The option to add more equipment would need to be
justified financially because the cost of additional equipment
might not be recuperated by extra production.
Energy consumption and gas emissionsRecognizing that transporting ore is one of the mining
industry’s most energy-intensive activities, with energy and
ventilation contributing greatly to operation costs, energy
consumption and CO2 emissions were analyzed to address
the mitigation of underground diesel emissions for under-
ground air quality and safety regulation compliance.
Energy consumption of the diesel LHD 7D in the mine dur-
ing its operation was measured and simulation and the
empirical formulas were used to estimate energy consump-
tion of the other analyzed machines. Simulation was used
to obtain each LHD’s operating time, which was then used
to calculate use. In all cases, the LHD utilizations were cal-
culated according to equation 5:
Operating time Utilization = –––––––––––––––––– × 100% (5) Total simulation time
Table 3 shows the fuel or electricity consumption for the
diesel and electric LHDs. Based on 2014 prices, hourly
costs were higher for diesel fuel than electricity. For exam-
ple, in 1 h of operation, the diesel LHD 7D consumed
42.3 L of fuel; its electric counterpart consumed 306 kWh
of electricity. Based on an assumed fuel price of US$1.79/L
and electricity price of US$0.12/kWh (International Energy
Agency, 2014), this consumption equates to an hourly fuel
cost of US$75.80 and an electricity cost of US$36.80. This
gives US$0.24/t and US$0.18/t for diesel and electric
LHDs, respectively. The cost increased in proportion to
bucket size for both machine types. The diesel fuel con-
sumption was converted to kWh for comparison purposes
with electric units.
Figure 5. Hourly productivity comparisons (LHD: load-haul-dump machine)
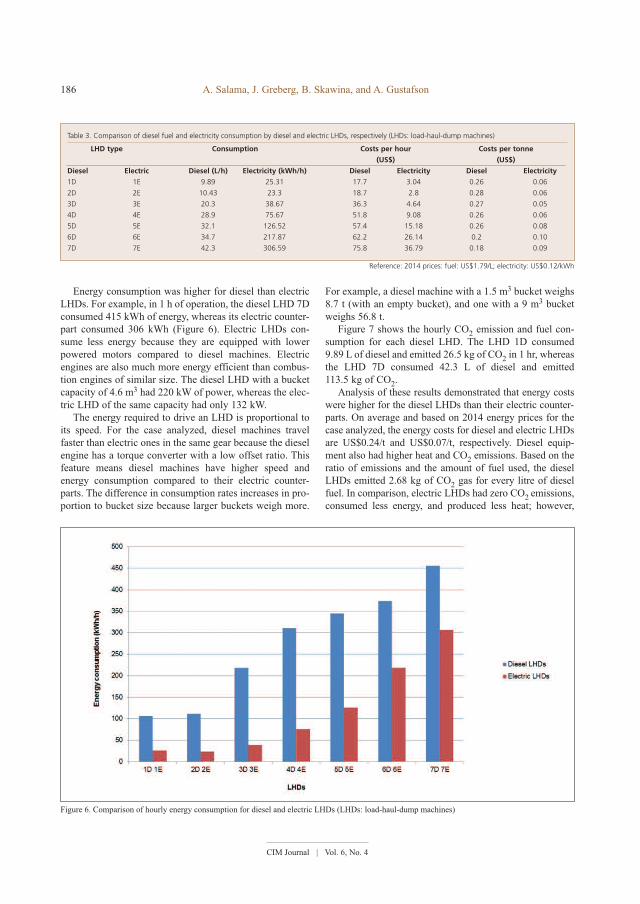
CIM Journal | Vol. 6, No. 4
186 A. Salama, J. Greberg, B. Skawina, and A. Gustafson
Energy consumption was higher for diesel than electric
LHDs. For example, in 1 h of operation, the diesel LHD 7D
consumed 415 kWh of energy, whereas its electric counter-
part consumed 306 kWh (Figure 6). Electric LHDs con-
sume less energy because they are equipped with lower
powered motors compared to diesel machines. Electric
engines are also much more energy efficient than combus-
tion engines of similar size. The diesel LHD with a bucket
capacity of 4.6 m3 had 220 kW of power, whereas the elec-
tric LHD of the same capacity had only 132 kW.
The energy required to drive an LHD is proportional to
its speed. For the case analyzed, diesel machines travel
faster than electric ones in the same gear because the diesel
engine has a torque converter with a low offset ratio. This
feature means diesel machines have higher speed and
energy consumption compared to their electric counter-
parts. The difference in consumption rates increases in pro-
portion to bucket size because larger buckets weigh more.
For example, a diesel machine with a 1.5 m3 bucket weighs
8.7 t (with an empty bucket), and one with a 9 m3 bucket
weighs 56.8 t.
Figure 7 shows the hourly CO2 emission and fuel con-
sumption for each diesel LHD. The LHD 1D consumed
9.89 L of diesel and emitted 26.5 kg of CO2 in 1 hr, whereas
the LHD 7D consumed 42.3 L of diesel and emitted
113.5 kg of CO2.
Analysis of these results demonstrated that energy costs
were higher for the diesel LHDs than their electric counter-
parts. On average and based on 2014 energy prices for the
case analyzed, the energy costs for diesel and electric LHDs
are US$0.24/t and US$0.07/t, respectively. Diesel equip-
ment also had higher heat and CO2 emissions. Based on the
ratio of emissions and the amount of fuel used, the diesel
LHDs emitted 2.68 kg of CO2 gas for every litre of diesel
fuel. In comparison, electric LHDs had zero CO2 emissions,
consumed less energy, and produced less heat; however,
Table 3. Comparison of diesel fuel and electricity consumption by diesel and electric LHDs, respectively (LHDs: load-haul-dump machines)
LHD type Consumption Costs per hour Costs per tonne
(US$) (US$)
Diesel Electric Diesel (L/h) Electricity (kWh/h) Diesel Electricity Diesel Electricity
1D 1E 9.89 25.31 17.7 3.04 0.26 0.06
2D 2E 10.43 23.3 18.7 2.8 0.28 0.06
3D 3E 20.3 38.67 36.3 4.64 0.27 0.05
4D 4E 28.9 75.67 51.8 9.08 0.26 0.06
5D 5E 32.1 126.52 57.4 15.18 0.26 0.08
6D 6E 34.7 217.87 62.2 26.14 0.2 0.10
7D 7E 42.3 306.59 75.8 36.79 0.18 0.09
Figure 6. Comparison of hourly energy consumption for diesel and electric LHDs (LHDs: load-haul-dump machines)
Reference: 2014 prices: fuel: US$1.79/L; electricity: US$0.12/kWh
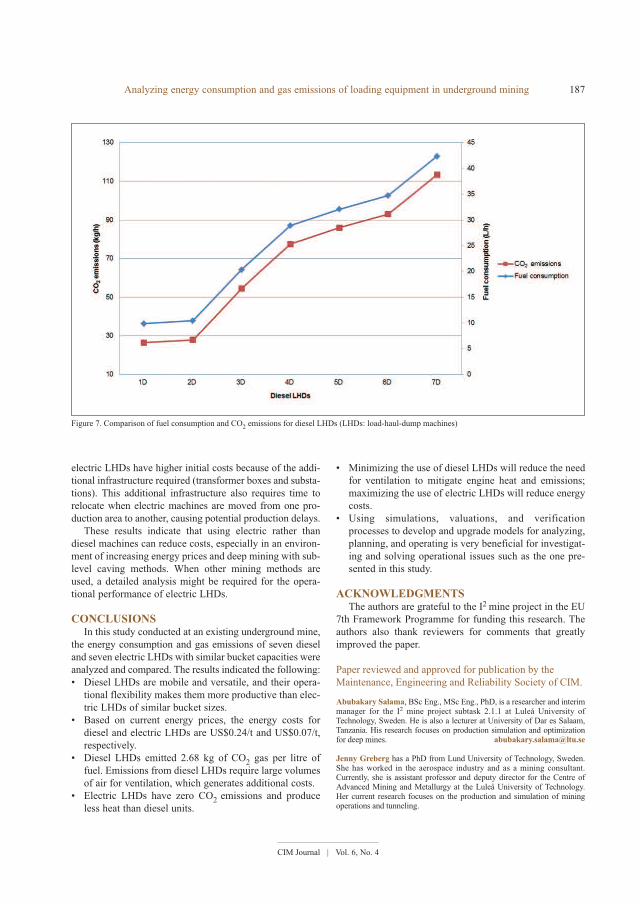
CIM Journal | Vol. 6, No. 4
Analyzing energy consumption and gas emissions of loading equipment in underground mining 187
electric LHDs have higher initial costs because of the addi-
tional infrastructure required (transformer boxes and substa-
tions). This additional infrastructure also requires time to
relocate when electric machines are moved from one pro-
duction area to another, causing potential production delays.
These results indicate that using electric rather than
diesel machines can reduce costs, especially in an environ-
ment of increasing energy prices and deep mining with sub-
level caving methods. When other mining methods are
used, a detailed analysis might be required for the opera-
tional performance of electric LHDs.
CONCLUSIONSIn this study conducted at an existing underground mine,
the energy consumption and gas emissions of seven diesel
and seven electric LHDs with similar bucket capacities were
analyzed and compared. The results indicated the following:
• Diesel LHDs are mobile and versatile, and their opera-
tional flexibility makes them more productive than elec-
tric LHDs of similar bucket sizes.
• Based on current energy prices, the energy costs for
diesel and electric LHDs are US$0.24/t and US$0.07/t,
respectively.
• Diesel LHDs emitted 2.68 kg of CO2 gas per litre of
fuel. Emissions from diesel LHDs require large volumes
of air for ventilation, which generates additional costs.
• Electric LHDs have zero CO2 emissions and produce
less heat than diesel units.
• Minimizing the use of diesel LHDs will reduce the need
for ventilation to mitigate engine heat and emissions;
maximizing the use of electric LHDs will reduce energy
costs.
• Using simulations, valuations, and verification
processes to develop and upgrade models for analyzing,
planning, and operating is very beneficial for investigat-
ing and solving operational issues such as the one pre-
sented in this study.
ACKNOWLEDGMENTSThe authors are grateful to the I2 mine project in the EU
7th Framework Programme for funding this research. The
authors also thank reviewers for comments that greatly
improved the paper.
Paper reviewed and approved for publication by the
Maintenance, Engineering and Reliability Society of CIM.
Abubakary Salama, BSc Eng., MSc Eng., PhD, is a researcher and interimmanager for the I2 mine project subtask 2.1.1 at Luleå University ofTechnology, Sweden. He is also a lecturer at University of Dar es Salaam,Tanzania. His research focuses on production simulation and optimizationfor deep mines. [email protected]
Jenny Greberg has a PhD from Lund University of Technology, Sweden.She has worked in the aerospace industry and as a mining consultant.Currently, she is assistant professor and deputy director for the Centre ofAdvanced Mining and Metallurgy at the Luleå University of Technology.Her current research focuses on the production and simulation of miningoperations and tunneling.
Figure 7. Comparison of fuel consumption and CO2 emissions for diesel LHDs (LHDs: load-haul-dump machines)
©2015 Canadian Institute of Mining, Metallurgy and Petroleum. All rights reserved.
188 A. Salama, J. Greberg, B. Skawina, and A. Gustafson
Bartłomiej Skawina is a PhD student at Luleå University of Technology. Hehas a MEng in civil engineering, specializing in mining and geotechnicalengineering. Currently, he is working for the I2 mine project, developinginnovative mining methods and automating mining cycles and processes.
Anna Gustafson has a PhD in the field of RAMS analysis of LHDs (withspecial relevance to autonomous operation) from the Operation andMaintenance Division at Luleå University of Technology. She is currentlyconducting research in the field of mine engineering, with a focus on mineequipment and production.
REFERENCES
Banks, J. (2004). Getting started with AutoMod (2nd ed.). Bountiful,UT: Brooks-PRI Automation.
Banks, J., Carson, J. S., Nelson, B. L., & Nicol, D. M. (2010). Discreteevent system simulation. Upper Saddle River, NJ: Pearson Education.
Bise, C. J. (2003). Mining engineering analysis (2nd ed.). Littleton, CO:Society for Mining, Metallurgy and Exploration.
Bogunovic, D., & Kecojevic, V. (2009). Equipment CO2 emission insurface coal mining. International Journal of Mining and Mineral Engi-neering, 1(2), 172–180. http://dx.doi.org/10.1504/IJMME.2009.023133
Caterpillar. (2009). Caterpillar performance handbook (39th ed.). Peo-ria, IL: Caterpillar Inc.
Chadwick, J. (1996). Tomorrow’s LHD. Mining Magazine, August, 69–87.
de la Vergne, J. N. (2003). The hard rock miner’s handbook (3rd ed.).North Bay, ON: McIntosh Engineering.
Gustafson, A., Schunnesson, H., Galar, D., & Kumar, U. (2013). Pro-duction and maintenance performance analysis: Manual versus semi-automatic LHDs. Journal of Quality in Maintenance Engineering,19(1), 74–88. http://dx.doi.org/10.1108/13552511311304492
International Energy Agency. (2014). Key world energy statistics.Retrieved from http://www.iea.org/publications/freepublications/publi-cation/keyworld2014.pdf
Kecojevic, V., & Komljenovic, D. (2010). Haul truck fuel consumptionand CO2 emission under various engine load conditions. Mining Engi-neering, 62(12), 44–48.
Law, A. M., & Kelton, W. D. (1991). Simulation modeling analysis (2nded.). New York, NY: McGraw-Hill.
Miller, A. R., & Barnes, D. L. (2002). Advanced underground vehiclepower and control fuel cell mine locomotive. Proceedings of the 2002United States Department of Energy (DOE) Hydrogen Program Review(NREL/CP-610-32405), 1–7. Retrieved from http://www.nrel.gov/docs/fy02osti/32405a30.pdf
Muller, D. (2011). AutoMod™—Providing simulation solutions forover 25 years. S. Jain, R. R. Creasey, J. Himmelspach, K. P. White, &M. Fu (Eds.). Proceedings of the 2011 Winter Simulation Conference,39–51. http://dx.doi.org/10.1109/WSC.2011.6147738
Novak, T., Gregg, A. J., & Hartman, H. L. (1987). Comparative per-formance study of diesel and electric face-haulage vehicles. Interna-tional Journal of Mining and Geological Engineering, 5(4), 405–417.http://dx.doi.org/10.1007/BF01552754
Paraszczak, J., Laflamme, M., & Fytas, K. (2013). Electric load-haul-
dump machines: Real alternative for diesel? CIM Journal, 4(1), 13–19.
Paraszczak, J., Svedlund, E., Fytas, K., & Laflamme, M. (2014). Electri-
fication of loaders and trucks: A step towards more sustainable under-
ground mining. Proceedings of the International Conference onRenewable Energies and Power Quality (ICREPQ’14), Cordoba, Spain.
Retrieved from http://www.icrepq.com/icrepq’14/240.14-Paraszczak.pdf
Paterson, W., & Knights, P. (2013). Management of trailing cables on
electrically powered load-haul-dump units. Mining Education Australia(MEA). Carlton South, Australia: The Australasian Institute of Mining
and Metallurgy (AusIMM), 67–74.
Pellegrino, J., Quin, J., Thekdi, A., & Justiano, M. (2005). Energy use, loss,
and opportunities analysis for US manufacturing and mining. Proceedingsof the 2005 ACEEE Summer Study on Energy Efficiency in Industry. Wash-
ington, DC: American Council for Energy Efficient Economy. Retrieved
from http://aceee.org/files/proceedings/2005/data/index.htm
Salama, A., Nehring, M., & Greberg, J. (2014). Operating value optimi-
sation using simulation and mixed integer programming. InternationalJournal of Mining, Reclamation and Environment, 28(1), 25–46.
http://dx.doi.org/10.1080/17480930.2013.768019
Sargent, R. G. (2003). Verification and validation of simulation models.
Proceedings of the 37th Conference on Winter Simulation, Syracuse,
NY, 130–143.
Tatiya, R. R. (2013). Surface and underground excavations: Methods,techniques, and equipment (2nd ed.). Boca Raton, FL: CRC Press.
http://dx.doi.org/10.1201/b14818
United States Energy Information Administration. (2014). Annualenergy outlook 2013 (DOE/EIA-0383). Washington, DC: Author.
Retrieved from www.eia.gov/forecasts/aeo/pdf/0383er(2014).pdf
United States Environmental Protection Agency, Office of Transporta-
tion and Air Quality. (2005). Emission facts: Average carbon dioxideemission resulting from gasoline and diesel fuel (EPA420-F-05-001).
Washington, DC: Author. Retrieved from https://www.chargepoint.com
/files/420f05001.pdf
United States Energy Information Administration. (2014). Annualenergy outlook 2014 (DOE/EIA-0383). Washington, DC: Author.
Retrieved from http://www.eia.gov/forecasts/archive/aeo14/pdf
/0383(2014).pdf
PAPER B
The effects of ore pass loss on loading, hauling and dumping operations and production rates in sublevel
caving mine
Skawina B., Greberg J., Salama A., and Gustafson A., The effects of ore pass loss on loading, hauling and dumping operations and production rates in sublevel caving mine, submitted to for publication to Journal of Southern African Institute of Mining and Metallurgy, 2017.

1
The effects of ore pass loss on loading, hauling and dumping operations and production rates in a sublevel caving mine
by 1*, Jenny Greberg1, Abubakary Salama2, and Anna Gustafson1
1 Department of Civil, Environment and Natural Resources Engineering Division of Mining and Rock Engineering,Luleå University of Technology, Luleå, Sweden
2 Department of Chemical and Mining, College of Engineering and Technology, The University of Dar es Salaam, P.O.Box 35131, Tanzania
* Correspondence: [email protected]; Tel.: +46-920-492-949
Synopsis: Ore pass failure is a well-known problem for deep mines and the risk of losing an ore
pass is associated with severe production disturbances. In the near future, one possible scenario
in the Loussavaara Kiirunavaara Aktiebolag (LKAB) Malmberget mine is to concentrate the
mining operation to fewer but larger production areas. Left with fewer, but larger, production areas
to operate, densification of work will increase, leading to increased use of the pre-existing ore
pass structures. Further, additional high stresses due to depth increase the risk for structural
failure of the ore passes. Consequently, the mine may face a dilemma of either improving the
current loading and hauling operations or using alternative transportation systems. Analysis of the
critical causes that are responsible for major disturbances in the flow, speed and safety of the
desired mine production are essential and an important basis for decision making regarding
alternative transportation systems. This paper analyses and evaluates the effects of ore pass loss
on loading, hauling and dumping operations and production rates using discrete event simulation,
by simulating part of the Malmberget mine loading and hauling system under different
environmental and operational constraints. The results show that in the case of ore pass loss, it is
possible to obtain desired production rates by using the Malmberget’s existing transportation
system and varying the LHD (Load-Haul-Dump machine) fleet size. However, if too many ore
passes are lost, the delays created in production would result in operation disturbances for the
LHDs. A possible solution is to redirect the fleet to different production areas or to construct an
additional entry to ore pass location that will allow accommodating more than one LHD in the
dumping area. If left with no ore passes to operate, the mine would have to change the method of
transporting the ore and use alternative transportation systems such as trucking.
Keywords: LHDs; ore pass loss; discrete event simulation; sublevel caving; Malmberget mine;
iron ore mine; underground mine.
2
Introduction
Today’s close-to-surface iron ore resources are increasingly being mined out and mining at greater
depths is necessary in order to secure the supply for future generations. Underground mining of
iron ore is performed through a number of different unit operations, such as extraction, transport,
storage or sizing the material. All unit operations are equally essential as they are successive and
performed in series and if one of them fails to deliver, it will affect the process and the unit
operations downstream, resulting in an insufficient flow of ore. One such unit operation usually
performed by Load-Haul-Dump (LHD) machines is loading, hauling and dumping of the material
from the production drifts into ore passes. An ore pass is used in underground mining to connect
two or more levels in a mine. In caving and sublevel stoping mines, the ore pass structures are
commonly used and many in number (Hambley, 1987). Ore pass structures are exposed to the risk
of failure, leading to a need for ore pass redevelopment or rehabilitation, thus creating a major
problem for the mining operations (Brummer, 1998). An ore pass loss can be the result of
operational or structural failure leading to either short-term or long-term loss. In this study, the loss
of an ore pass is modelled as a long-term loss with the ore pass being unavailable for the whole
duration of the study. This paper focuses on analysing the effects on the LHD operations and
related production rates following a long-term loss of one or more of the ore passes in an
underground metal mine using sublevel caving. In this study long-term is defined as the time that it
takes to mine out a whole production area. The effects of increasing the LHD fleet size in order to
maintain production are also analysed. Different scenarios have been used to analyse different
production areas, different numbers of vehicles and different numbers of available ore passes.
Background
Ore pass structures
One concern related to the use of ore pass structures is their ability to convey or store material
without unnecessary stoppages (Beus et al., 2001) that could result in unwanted disturbances in
production. These stoppages are associated with hang-ups, piping, blockages, ore pass
degradation and wall stability (Beus et al., 2001; Hadjigeorgiou and Lessard, 2010). Disturbances
are often the results of caving, poor fragmentation (boulder arching or cohesive arching), poor
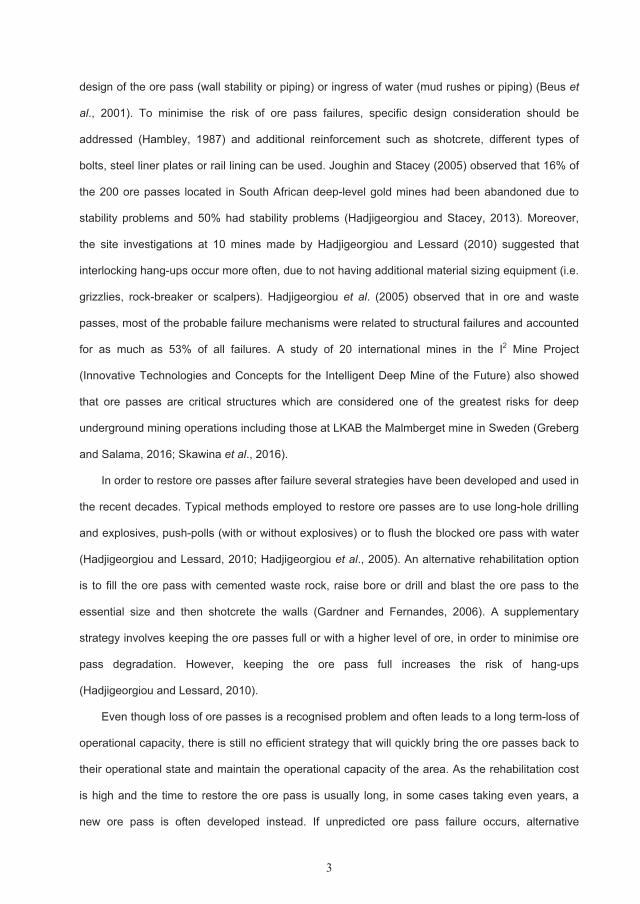
3
design of the ore pass (wall stability or piping) or ingress of water (mud rushes or piping) (Beus et
al., 2001). To minimise the risk of ore pass failures, specific design consideration should be
addressed (Hambley, 1987) and additional reinforcement such as shotcrete, different types of
bolts, steel liner plates or rail lining can be used. Joughin and Stacey (2005) observed that 16% of
the 200 ore passes located in South African deep-level gold mines had been abandoned due to
stability problems and 50% had stability problems (Hadjigeorgiou and Stacey, 2013). Moreover,
the site investigations at 10 mines made by Hadjigeorgiou and Lessard (2010) suggested that
interlocking hang-ups occur more often, due to not having additional material sizing equipment (i.e.
grizzlies, rock-breaker or scalpers). Hadjigeorgiou et al. (2005) observed that in ore and waste
passes, most of the probable failure mechanisms were related to structural failures and accounted
for as much as 53% of all failures. A study of 20 international mines in the I2 Mine Project
(Innovative Technologies and Concepts for the Intelligent Deep Mine of the Future) also showed
that ore passes are critical structures which are considered one of the greatest risks for deep
underground mining operations including those at LKAB the Malmberget mine in Sweden (Greberg
and Salama, 2016; Skawina et al., 2016).
In order to restore ore passes after failure several strategies have been developed and used in
the recent decades. Typical methods employed to restore ore passes are to use long-hole drilling
and explosives, push-polls (with or without explosives) or to flush the blocked ore pass with water
(Hadjigeorgiou and Lessard, 2010; Hadjigeorgiou et al., 2005). An alternative rehabilitation option
is to fill the ore pass with cemented waste rock, raise bore or drill and blast the ore pass to the
essential size and then shotcrete the walls (Gardner and Fernandes, 2006). A supplementary
strategy involves keeping the ore passes full or with a higher level of ore, in order to minimise ore
pass degradation. However, keeping the ore pass full increases the risk of hang-ups
(Hadjigeorgiou and Lessard, 2010).
Even though loss of ore passes is a recognised problem and often leads to a long term-loss of
operational capacity, there is still no efficient strategy that will quickly bring the ore passes back to
their operational state and maintain the operational capacity of the area. As the rehabilitation cost
is high and the time to restore the ore pass is usually long, in some cases taking even years, a
new ore pass is often developed instead. If unpredicted ore pass failure occurs, alternative
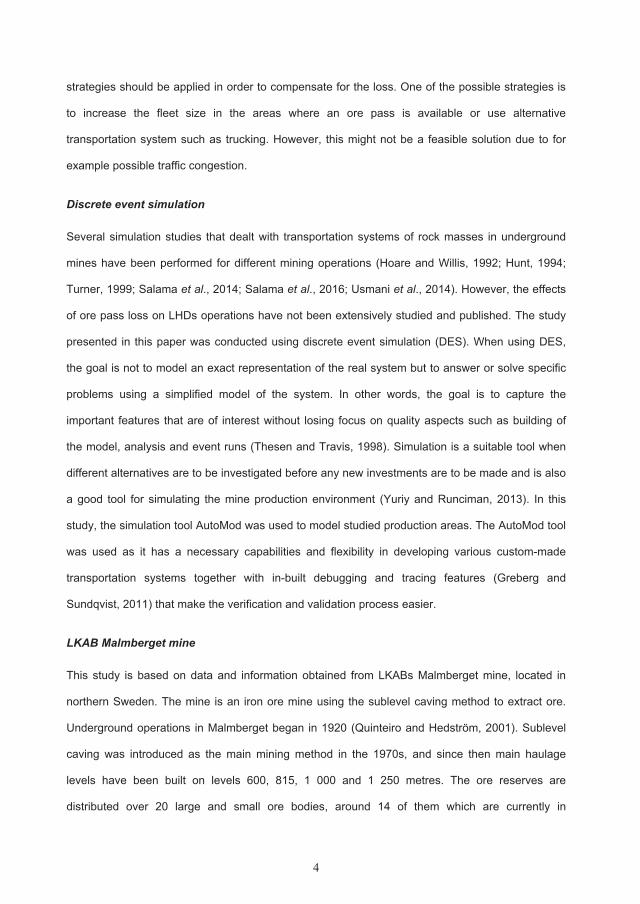
4
strategies should be applied in order to compensate for the loss. One of the possible strategies is
to increase the fleet size in the areas where an ore pass is available or use alternative
transportation system such as trucking. However, this might not be a feasible solution due to for
example possible traffic congestion.
Discrete event simulation
Several simulation studies that dealt with transportation systems of rock masses in underground
mines have been performed for different mining operations (Hoare and Willis, 1992; Hunt, 1994;
Turner, 1999; Salama et al., 2014; Salama et al., 2016; Usmani et al., 2014). However, the effects
of ore pass loss on LHDs operations have not been extensively studied and published. The study
presented in this paper was conducted using discrete event simulation (DES). When using DES,
the goal is not to model an exact representation of the real system but to answer or solve specific
problems using a simplified model of the system. In other words, the goal is to capture the
important features that are of interest without losing focus on quality aspects such as building of
the model, analysis and event runs (Thesen and Travis, 1998). Simulation is a suitable tool when
different alternatives are to be investigated before any new investments are to be made and is also
a good tool for simulating the mine production environment (Yuriy and Runciman, 2013). In this
study, the simulation tool AutoMod was used to model studied production areas. The AutoMod tool
was used as it has a necessary capabilities and flexibility in developing various custom-made
transportation systems together with in-built debugging and tracing features (Greberg and
Sundqvist, 2011) that make the verification and validation process easier.
LKAB Malmberget mine
This study is based on data and information obtained from LKABs Malmberget mine, located in
northern Sweden. The mine is an iron ore mine using the sublevel caving method to extract ore.
Underground operations in Malmberget began in 1920 (Quinteiro and Hedström, 2001). Sublevel
caving was introduced as the main mining method in the 1970s, and since then main haulage
levels have been built on levels 600, 815, 1 000 and 1 250 metres. The ore reserves are
distributed over 20 large and small ore bodies, around 14 of them which are currently in
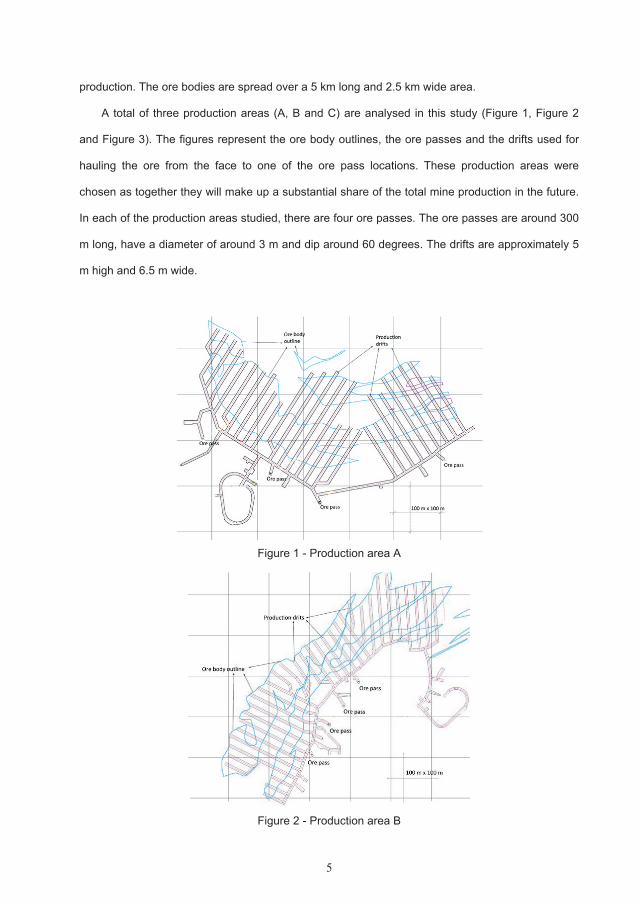
5
production. The ore bodies are spread over a 5 km long and 2.5 km wide area.
A total of three production areas (A, B and C) are analysed in this study (Figure 1, Figure 2
and Figure 3). The figures represent the ore body outlines, the ore passes and the drifts used for
hauling the ore from the face to one of the ore pass locations. These production areas were
chosen as together they will make up a substantial share of the total mine production in the future.
In each of the production areas studied, there are four ore passes. The ore passes are around 300
m long, have a diameter of around 3 m and dip around 60 degrees. The drifts are approximately 5
m high and 6.5 m wide.
Figure 1 - Production area A
Figure 2 - Production area B
6
Figure 3 - Production area C
The current loading practice in Malmberget mine is based on the use of manually operated
diesel LHDs with a 21-tonne bucket capacity. In the smaller ore bodies, there is usually one LHD in
operation. In larger production areas, between one and two LHDs are used simultaneously. The
number of ore passes in the ore bodies varies between one and four depending on the size of the
production area. The sequencing of drifts to be extracted is mainly based on rock stress-related
factors, the ancillary activities of the production drifts, distances to the ore passes (depending on
the production rate requirement) and the amount of ore left in each of the production drifts. The ore
is transported from the draw points to the ore passes. From the ore passes, the ore is collected on
the main haulage level by trucks and then hauled to the crusher, where the rock is fragmented and
further transported.
Simulation
The simulation was performed according to the simulation steps shown in Figure 4. Problem
formulation was made according to the objectives and overall project plan. The model was
conceptualized based on the Malmberget’s mining production areas. Data was collected from the
studied mine and model translation was done under supervision of the mining and simulation
experts involved in the study. Data collected from the mine was tested using statistical analyses
(see further description in section ‘Input data’). Before, during and after the experimental design,
verification and validation tests were performed (see further description in section ‘Simulation
model verification and validation’). Simulation runs, tests and design of experiments were
performed using the AutoMod tool. The results of the simulation runs were then further tested with
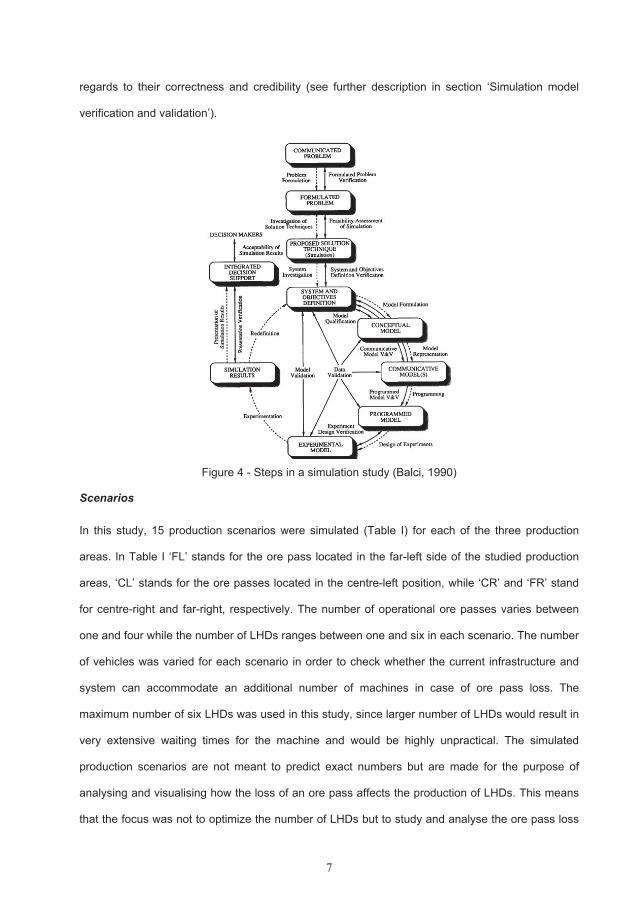
7
regards to their correctness and credibility (see further description in section ‘Simulation model
verification and validation’).
Figure 4 - Steps in a simulation study (Balci, 1990)
Scenarios
In this study, 15 production scenarios were simulated (Table I) for each of the three production
areas. In Table I ‘FL’ stands for the ore pass located in the far-left side of the studied production
areas, ‘CL’ stands for the ore passes located in the centre-left position, while ‘CR’ and ‘FR’ stand
for centre-right and far-right, respectively. The number of operational ore passes varies between
one and four while the number of LHDs ranges between one and six in each scenario. The number
of vehicles was varied for each scenario in order to check whether the current infrastructure and
system can accommodate an additional number of machines in case of ore pass loss. The
maximum number of six LHDs was used in this study, since larger number of LHDs would result in
very extensive waiting times for the machine and would be highly unpractical. The simulated
production scenarios are not meant to predict exact numbers but are made for the purpose of
analysing and visualising how the loss of an ore pass affects the production of LHDs. This means
that the focus was not to optimize the number of LHDs but to study and analyse the ore pass loss
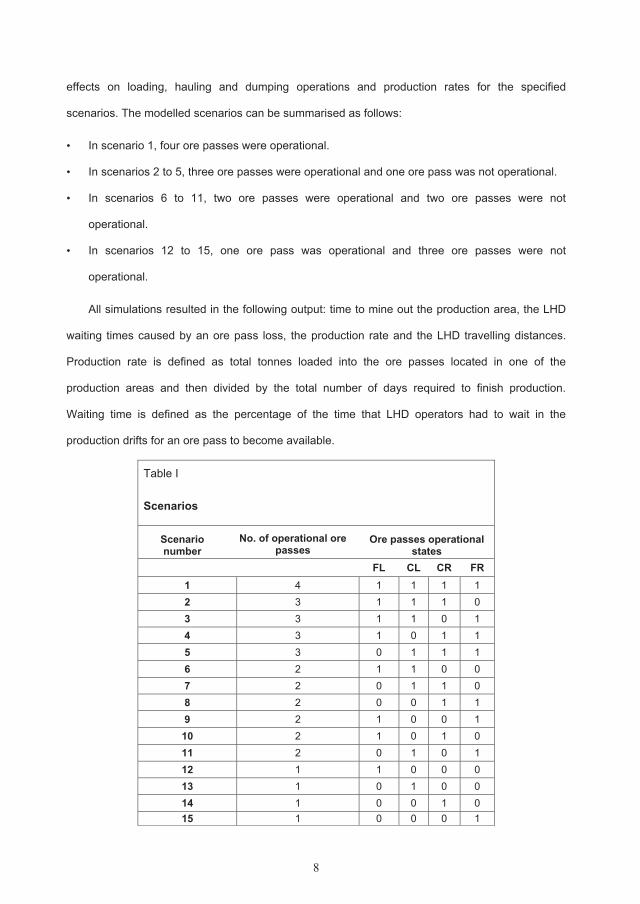
8
effects on loading, hauling and dumping operations and production rates for the specified
scenarios. The modelled scenarios can be summarised as follows:
• In scenario 1, four ore passes were operational.
• In scenarios 2 to 5, three ore passes were operational and one ore pass was not operational.
• In scenarios 6 to 11, two ore passes were operational and two ore passes were not
operational.
• In scenarios 12 to 15, one ore pass was operational and three ore passes were not
operational.
All simulations resulted in the following output: time to mine out the production area, the LHD
waiting times caused by an ore pass loss, the production rate and the LHD travelling distances.
Production rate is defined as total tonnes loaded into the ore passes located in one of the
production areas and then divided by the total number of days required to finish production.
Waiting time is defined as the percentage of the time that LHD operators had to wait in the
production drifts for an ore pass to become available.
Table I
Scenarios
Scenarionumber
No. of operational ore passes
Ore passes operational states
FL CL CR FR1 4 1 1 1 12 3 1 1 1 03 3 1 1 0 14 3 1 0 1 15 3 0 1 1 16 2 1 1 0 07 2 0 1 1 08 2 0 0 1 19 2 1 0 0 110 2 1 0 1 011 2 0 1 0 112 1 1 0 0 013 1 0 1 0 014 1 0 0 1 015 1 0 0 0 1
9
Simulation model verification and validation
A number of tests were performed in order to ensure the correctness of the model (verification)
and to ensure that the model reflects the real system (validation). Verification and validation tests
of the model are necessary to increase the level of confidence, the credibility and the probability of
the model correctness (Kleijnen, 1995; Sargent, 2011). Thus, verification and validation tests
reduce the risk of making errors and generating misleading results. When verifying, the simulation
model consistency with the conceptual model was ensured by testing the model behaviour with the
specialists and experts involved in the study. Moreover, by testing the logic with the use of an
interactive run controller (debugging feature), an examination of the animation and systematic
scanning of the logic was performed. When validating the model, a comparison of scenarios with
the real system was made with the assistance of specialists. This was ensured by comparing the
production data from the operating mine with the results from the simulation. In addition, extreme
condition tests, degenerate tests, traces and internal validity were used to test the credibility of the
model. An extreme condition test was performed on the LHDs by setting their bucket capacity to
zero and after the simulation was run observing the final production results. The degenerate test
was used to see how the average number of cycles, production rates and queuing changes when
different input parameters are used in the simulation model. Traces were used to trace the
behaviour of the specific entities during the run of the model (possible via debugging feature).
Tracing of an entity was used to see and observe any abnormal symptoms that the specific entity
displayed and further to determine the exactness of the model logic and if necessary correct the
model logic. Internal validity was tested (an additional of five replications were performed for each
set of different scenarios in each production area) by ensuring that, after changing the stream
random numbers in the model, the model’s results did not significantly differ from each other. In
most of the cases the results of running the model with different stream random numbers have
deviated from each other by no more than 5%. However, higher output variations were detected in
the production area C after running scenarios 12-15, with more than two LHDs in operation. The
output variation increased with the increased number of vehicles in operation. The highest output
variation was observed in the scenarios 12-15, with the six machines in operation, deviating by as
far as 11%. This deviation is related to the way in which the vehicles claim the ore pass locations.
10
The ore pass locations are claimed by vehicles after the bucket has been filled and before the
vehicle has started to travel to the ore pass location. This, depending on the performance of each
vehicle and the number of the vehicles used in the operation, especially for larger production
areas, with less number of the accessible ore pass locations, created a condition in which the
vehicle located further away from the accessible ore pass claimed the ore pass before the vehicle
located closer to that ore pass. Since the simulated production scenarios were not meant to predict
exact numbers but were made for the purpose of analysing and visualising how the loss of an ore
pass affects the production of LHDs, this was considered acceptable and no further action was
required.
Model settings and logic
The simplified model logic is described in the flow chart shown in Figure 5. In all cases, machines
were ordered to travel to one of the production drifts and then assigned to one of the ore passes.
The machine operators chose their destination by finding the closest ore pass. If the closest ore
pass is unavailable, the machines travel to another ore pass close by. If all ore passes were
unavailable, the machine operators waited until an ore pass was available. Meaning that the time
that affects the LHD cycle time is the time that LHD has to wait in the production drift for the ore
pass to become available. Each simulation ended when there was no longer any material left to be
loaded, meaning that the production level was mined out. It was assumed that there was enough
blasted material for loading at the faces at all times. The condition of the lighting in the drifts, floor,
roof and walls was not considered as obstacle to the loading processes, hence collisions with walls
or muck spillage of the muck would not influence the vehicles. To simplify the operation one type of
machine, a 21-tonne diesel LHD was in operation for 15 hours/day per simulated production area.
However, during this time the LHD encountered delays in operation whenever production
disturbances or breakdown of the vehicle took place, thus reducing the operating time to almost
10.3 hours/day. Work was performed seven days a week. During the breaks, the machine was
sent to the closest parking space. Whenever breakdown of a vehicle took place, the vehicle
stopped at its current location.
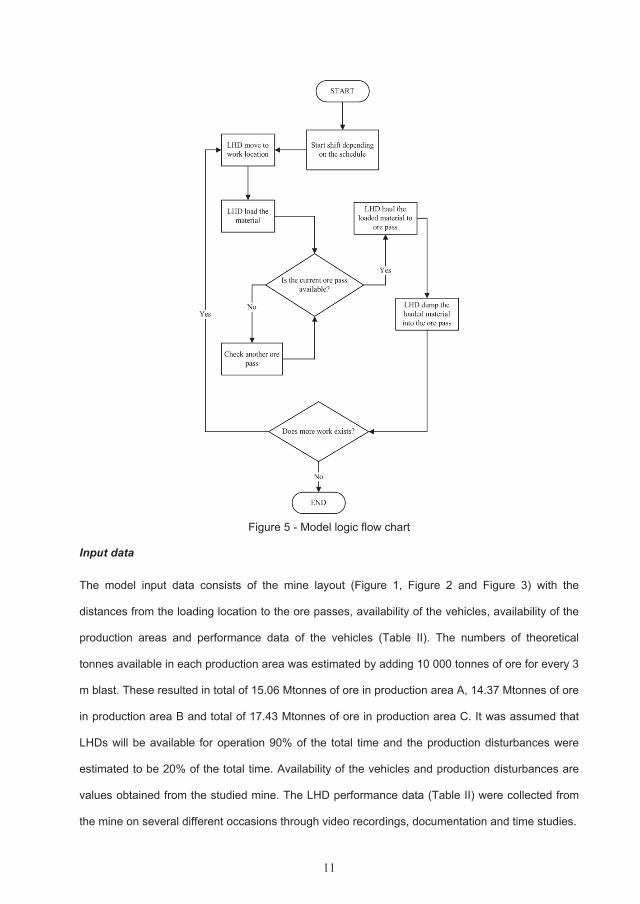
11
Figure 5 - Model logic flow chart
Input data
The model input data consists of the mine layout (Figure 1, Figure 2 and Figure 3) with the
distances from the loading location to the ore passes, availability of the vehicles, availability of the
production areas and performance data of the vehicles (Table II). The numbers of theoretical
tonnes available in each production area was estimated by adding 10 000 tonnes of ore for every 3
m blast. These resulted in total of 15.06 Mtonnes of ore in production area A, 14.37 Mtonnes of ore
in production area B and total of 17.43 Mtonnes of ore in production area C. It was assumed that
LHDs will be available for operation 90% of the total time and the production disturbances were
estimated to be 20% of the total time. Availability of the vehicles and production disturbances are
values obtained from the studied mine. The LHD performance data (Table II) were collected from
the mine on several different occasions through video recordings, documentation and time studies.
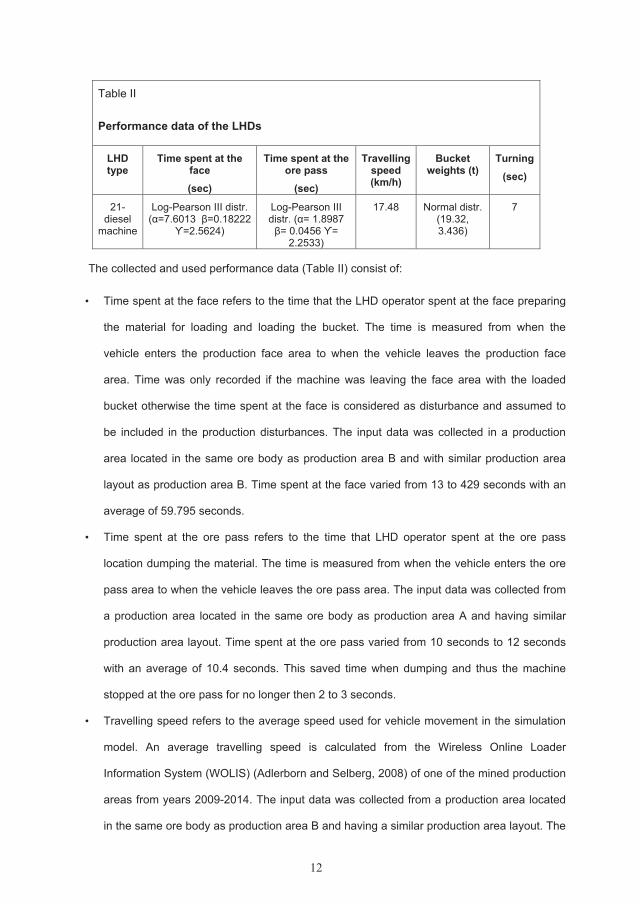
12
Table II
Performance data of the LHDs
LHD type
Time spent at the face(sec)
Time spent at the ore pass
(sec)
Travelling speed (km/h)
Bucket weights (t)
Turning
(sec)
21-diesel
machine
Log-Pearson III distr. (
)
Log-Pearson III distr. (
2.2533)
17.48 Normal distr. (19.32, 3.436)
7
The collected and used performance data (Table II) consist of:
• Time spent at the face refers to the time that the LHD operator spent at the face preparing
the material for loading and loading the bucket. The time is measured from when the
vehicle enters the production face area to when the vehicle leaves the production face
area. Time was only recorded if the machine was leaving the face area with the loaded
bucket otherwise the time spent at the face is considered as disturbance and assumed to
be included in the production disturbances. The input data was collected in a production
area located in the same ore body as production area B and with similar production area
layout as production area B. Time spent at the face varied from 13 to 429 seconds with an
average of 59.795 seconds.
• Time spent at the ore pass refers to the time that LHD operator spent at the ore pass
location dumping the material. The time is measured from when the vehicle enters the ore
pass area to when the vehicle leaves the ore pass area. The input data was collected from
a production area located in the same ore body as production area A and having similar
production area layout. Time spent at the ore pass varied from 10 seconds to 12 seconds
with an average of 10.4 seconds. This saved time when dumping and thus the machine
stopped at the ore pass for no longer then 2 to 3 seconds.
• Travelling speed refers to the average speed used for vehicle movement in the simulation
model. An average travelling speed is calculated from the Wireless Online Loader
Information System (WOLIS) (Adlerborn and Selberg, 2008) of one of the mined production
areas from years 2009-2014. The input data was collected from a production area located
in the same ore body as production area B and having a similar production area layout. The
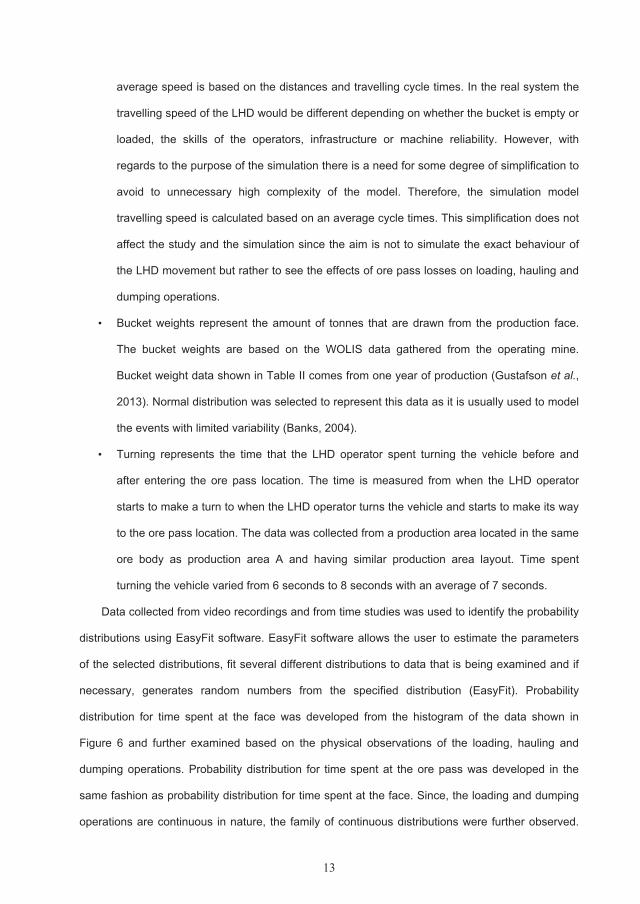
13
average speed is based on the distances and travelling cycle times. In the real system the
travelling speed of the LHD would be different depending on whether the bucket is empty or
loaded, the skills of the operators, infrastructure or machine reliability. However, with
regards to the purpose of the simulation there is a need for some degree of simplification to
avoid to unnecessary high complexity of the model. Therefore, the simulation model
travelling speed is calculated based on an average cycle times. This simplification does not
affect the study and the simulation since the aim is not to simulate the exact behaviour of
the LHD movement but rather to see the effects of ore pass losses on loading, hauling and
dumping operations.
• Bucket weights represent the amount of tonnes that are drawn from the production face.
The bucket weights are based on the WOLIS data gathered from the operating mine.
Bucket weight data shown in Table II comes from one year of production (Gustafson et al.,
2013). Normal distribution was selected to represent this data as it is usually used to model
the events with limited variability (Banks, 2004).
• Turning represents the time that the LHD operator spent turning the vehicle before and
after entering the ore pass location. The time is measured from when the LHD operator
starts to make a turn to when the LHD operator turns the vehicle and starts to make its way
to the ore pass location. The data was collected from a production area located in the same
ore body as production area A and having similar production area layout. Time spent
turning the vehicle varied from 6 seconds to 8 seconds with an average of 7 seconds.
Data collected from video recordings and from time studies was used to identify the probability
distributions using EasyFit software. EasyFit software allows the user to estimate the parameters
of the selected distributions, fit several different distributions to data that is being examined and if
necessary, generates random numbers from the specified distribution (EasyFit). Probability
distribution for time spent at the face was developed from the histogram of the data shown in
Figure 6 and further examined based on the physical observations of the loading, hauling and
dumping operations. Probability distribution for time spent at the ore pass was developed in the
same fashion as probability distribution for time spent at the face. Since, the loading and dumping
operations are continuous in nature, the family of continuous distributions were further observed.
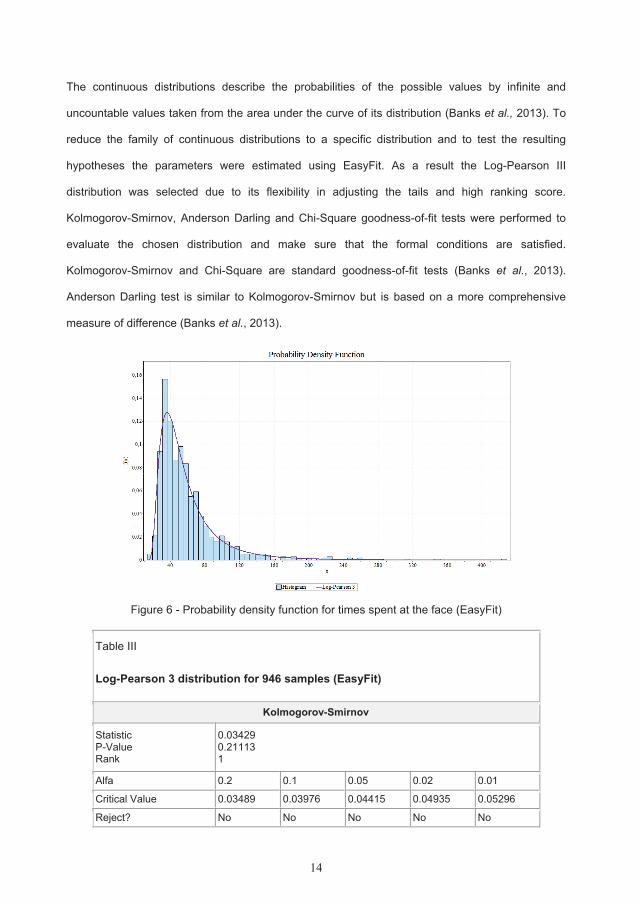
14
The continuous distributions describe the probabilities of the possible values by infinite and
uncountable values taken from the area under the curve of its distribution (Banks et al., 2013). To
reduce the family of continuous distributions to a specific distribution and to test the resulting
hypotheses the parameters were estimated using EasyFit. As a result the Log-Pearson III
distribution was selected due to its flexibility in adjusting the tails and high ranking score.
Kolmogorov-Smirnov, Anderson Darling and Chi-Square goodness-of-fit tests were performed to
evaluate the chosen distribution and make sure that the formal conditions are satisfied.
Kolmogorov-Smirnov and Chi-Square are standard goodness-of-fit tests (Banks et al., 2013).
Anderson Darling test is similar to Kolmogorov-Smirnov but is based on a more comprehensive
measure of difference (Banks et al., 2013).
Figure 6 - Probability density function for times spent at the face (EasyFit)
Table III
Log-Pearson 3 distribution for 946 samples (EasyFit)
Kolmogorov-Smirnov
StatisticP-ValueRank
0.034290.211131
Alfa 0.2 0.1 0.05 0.02 0.01
Critical Value 0.03489 0.03976 0.04415 0.04935 0.05296
Reject? No No No No No
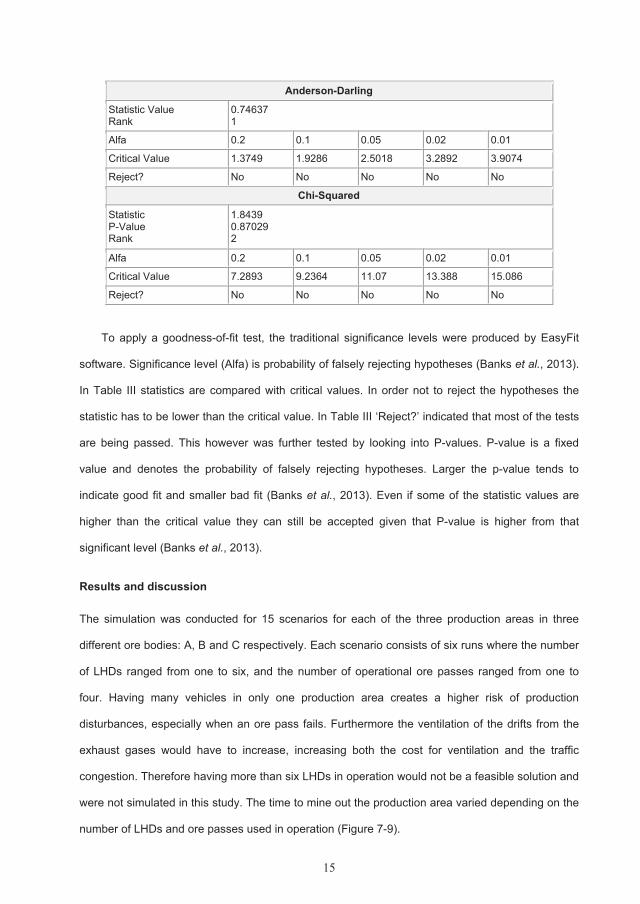
15
Anderson-Darling
Statistic Value Rank
0.746371
Alfa 0.2 0.1 0.05 0.02 0.01
Critical Value 1.3749 1.9286 2.5018 3.2892 3.9074
Reject? No No No No No
Chi-Squared
StatisticP-ValueRank
1.84390.870292
Alfa 0.2 0.1 0.05 0.02 0.01
Critical Value 7.2893 9.2364 11.07 13.388 15.086
Reject? No No No No No
To apply a goodness-of-fit test, the traditional significance levels were produced by EasyFit
software. Significance level (Alfa) is probability of falsely rejecting hypotheses (Banks et al., 2013).
In Table III statistics are compared with critical values. In order not to reject the hypotheses the
statistic has to be lower than the critical value. In Table III ‘Reject?’ indicated that most of the tests
are being passed. This however was further tested by looking into P-values. P-value is a fixed
value and denotes the probability of falsely rejecting hypotheses. Larger the p-value tends to
indicate good fit and smaller bad fit (Banks et al., 2013). Even if some of the statistic values are
higher than the critical value they can still be accepted given that P-value is higher from that
significant level (Banks et al., 2013).
Results and discussion
The simulation was conducted for 15 scenarios for each of the three production areas in three
different ore bodies: A, B and C respectively. Each scenario consists of six runs where the number
of LHDs ranged from one to six, and the number of operational ore passes ranged from one to
four. Having many vehicles in only one production area creates a higher risk of production
disturbances, especially when an ore pass fails. Furthermore the ventilation of the drifts from the
exhaust gases would have to increase, increasing both the cost for ventilation and the traffic
congestion. Therefore having more than six LHDs in operation would not be a feasible solution and
were not simulated in this study. The time to mine out the production area varied depending on the
number of LHDs and ore passes used in operation (Figure 7-9).
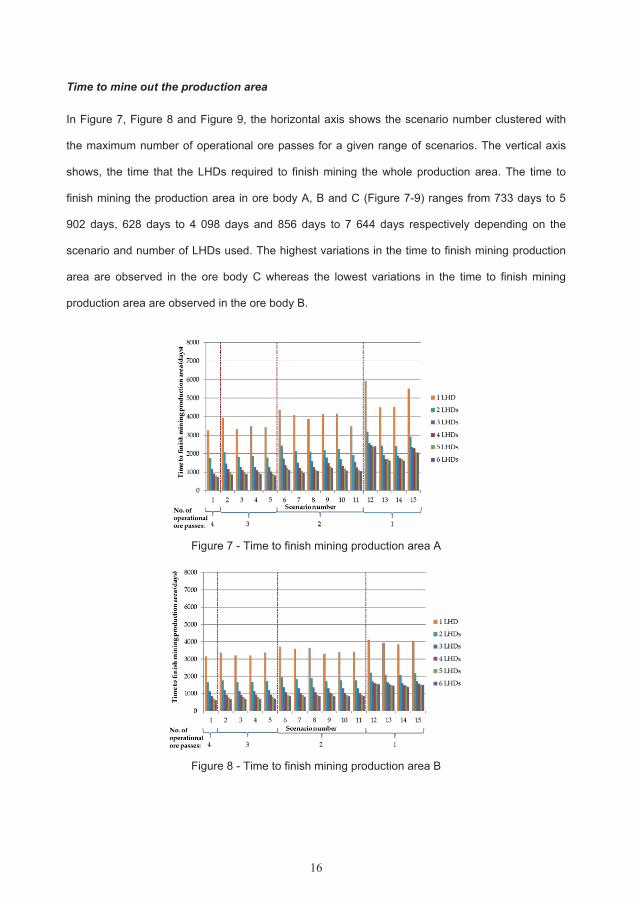
16
Time to mine out the production area
In Figure 7, Figure 8 and Figure 9, the horizontal axis shows the scenario number clustered with
the maximum number of operational ore passes for a given range of scenarios. The vertical axis
shows, the time that the LHDs required to finish mining the whole production area. The time to
finish mining the production area in ore body A, B and C (Figure 7-9) ranges from 733 days to 5
902 days, 628 days to 4 098 days and 856 days to 7 644 days respectively depending on the
scenario and number of LHDs used. The highest variations in the time to finish mining production
area are observed in the ore body C whereas the lowest variations in the time to finish mining
production area are observed in the ore body B.
Figure 7 - Time to finish mining production area A
Figure 8 - Time to finish mining production area B
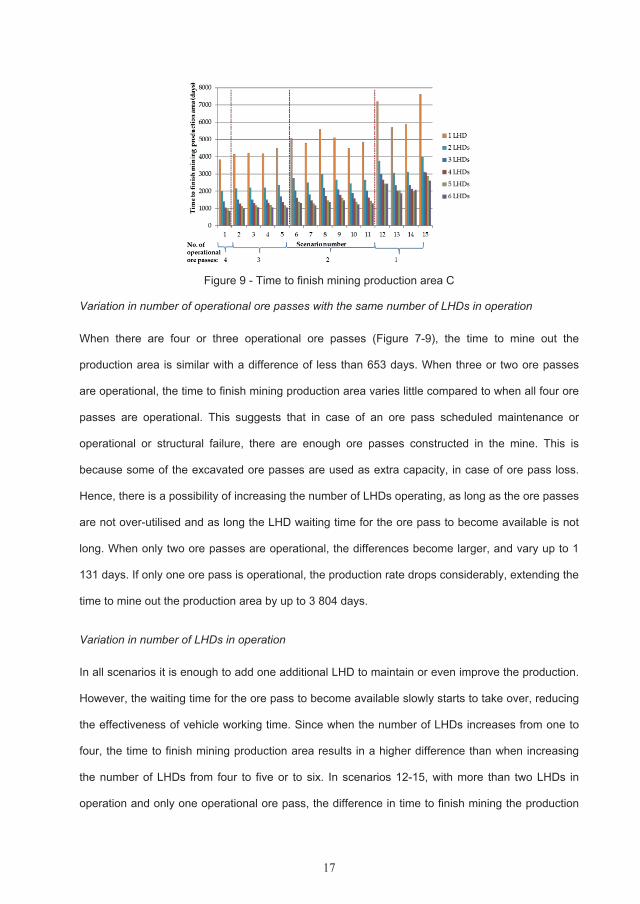
17
Figure 9 - Time to finish mining production area C
Variation in number of operational ore passes with the same number of LHDs in operation
When there are four or three operational ore passes (Figure 7-9), the time to mine out the
production area is similar with a difference of less than 653 days. When three or two ore passes
are operational, the time to finish mining production area varies little compared to when all four ore
passes are operational. This suggests that in case of an ore pass scheduled maintenance or
operational or structural failure, there are enough ore passes constructed in the mine. This is
because some of the excavated ore passes are used as extra capacity, in case of ore pass loss.
Hence, there is a possibility of increasing the number of LHDs operating, as long as the ore passes
are not over-utilised and as long the LHD waiting time for the ore pass to become available is not
long. When only two ore passes are operational, the differences become larger, and vary up to 1
131 days. If only one ore pass is operational, the production rate drops considerably, extending the
time to mine out the production area by up to 3 804 days.
Variation in number of LHDs in operation
In all scenarios it is enough to add one additional LHD to maintain or even improve the production.
However, the waiting time for the ore pass to become available slowly starts to take over, reducing
the effectiveness of vehicle working time. Since when the number of LHDs increases from one to
four, the time to finish mining production area results in a higher difference than when increasing
the number of LHDs from four to five or to six. In scenarios 12-15, with more than two LHDs in
operation and only one operational ore pass, the difference in time to finish mining the production
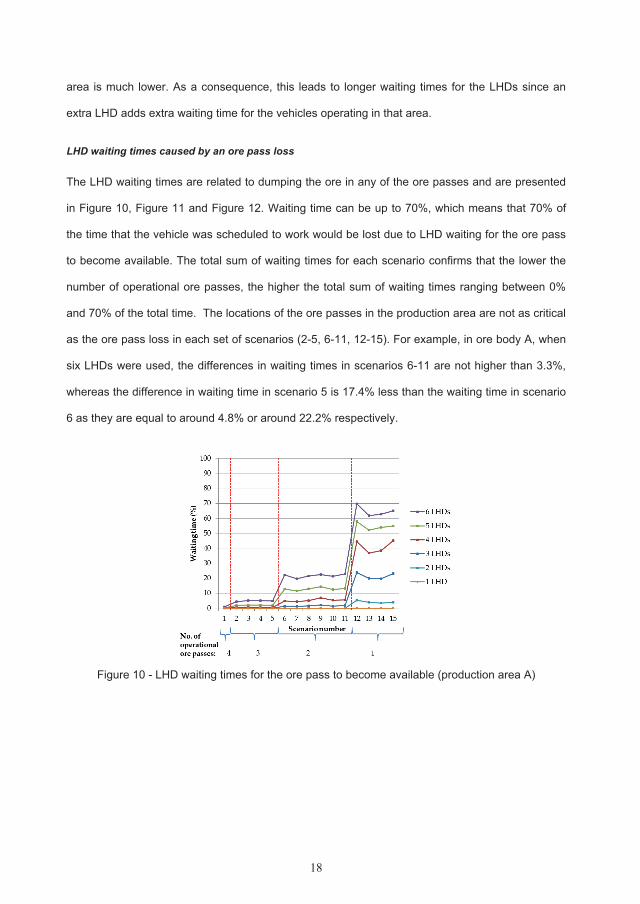
18
area is much lower. As a consequence, this leads to longer waiting times for the LHDs since an
extra LHD adds extra waiting time for the vehicles operating in that area.
LHD waiting times caused by an ore pass loss
The LHD waiting times are related to dumping the ore in any of the ore passes and are presented
in Figure 10, Figure 11 and Figure 12. Waiting time can be up to 70%, which means that 70% of
the time that the vehicle was scheduled to work would be lost due to LHD waiting for the ore pass
to become available. The total sum of waiting times for each scenario confirms that the lower the
number of operational ore passes, the higher the total sum of waiting times ranging between 0%
and 70% of the total time. The locations of the ore passes in the production area are not as critical
as the ore pass loss in each set of scenarios (2-5, 6-11, 12-15). For example, in ore body A, when
six LHDs were used, the differences in waiting times in scenarios 6-11 are not higher than 3.3%,
whereas the difference in waiting time in scenario 5 is 17.4% less than the waiting time in scenario
6 as they are equal to around 4.8% or around 22.2% respectively.
Figure 10 - LHD waiting times for the ore pass to become available (production area A)
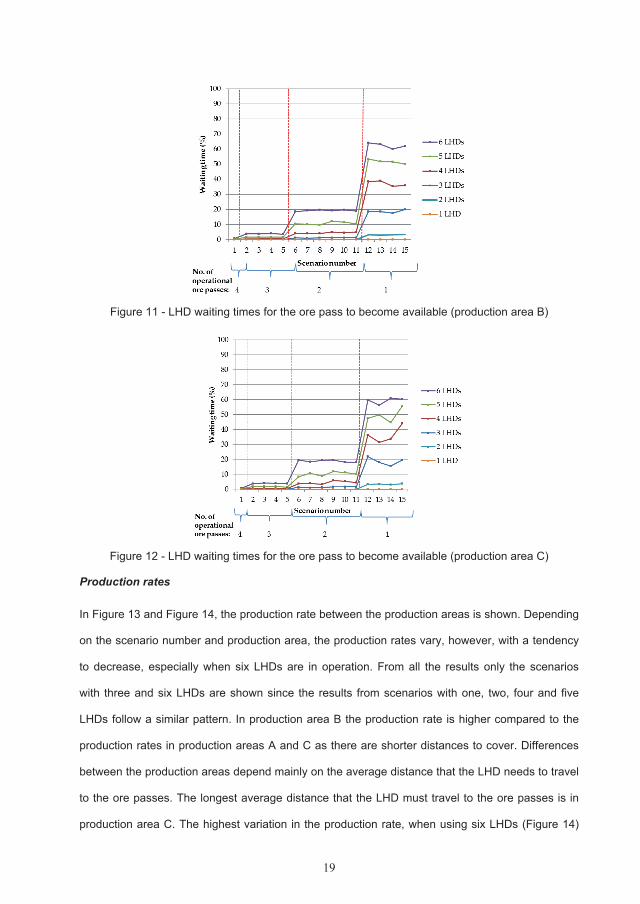
19
Figure 11 - LHD waiting times for the ore pass to become available (production area B)
Figure 12 - LHD waiting times for the ore pass to become available (production area C)
Production rates
In Figure 13 and Figure 14, the production rate between the production areas is shown. Depending
on the scenario number and production area, the production rates vary, however, with a tendency
to decrease, especially when six LHDs are in operation. From all the results only the scenarios
with three and six LHDs are shown since the results from scenarios with one, two, four and five
LHDs follow a similar pattern. In production area B the production rate is higher compared to the
production rates in production areas A and C as there are shorter distances to cover. Differences
between the production areas depend mainly on the average distance that the LHD needs to travel
to the ore passes. The longest average distance that the LHD must travel to the ore passes is in
production area C. The highest variation in the production rate, when using six LHDs (Figure 14)
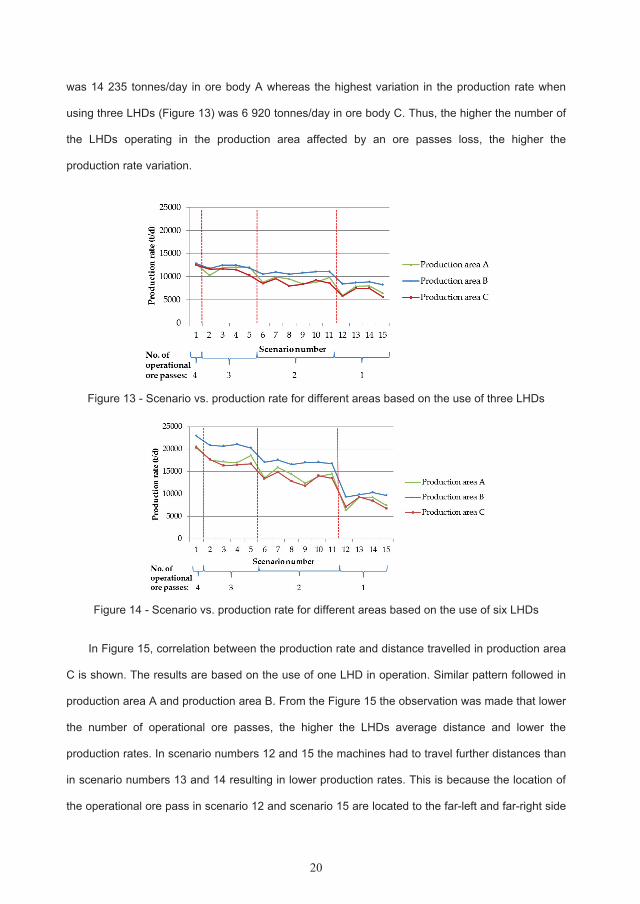
20
was 14 235 tonnes/day in ore body A whereas the highest variation in the production rate when
using three LHDs (Figure 13) was 6 920 tonnes/day in ore body C. Thus, the higher the number of
the LHDs operating in the production area affected by an ore passes loss, the higher the
production rate variation.
Figure 13 - Scenario vs. production rate for different areas based on the use of three LHDs
Figure 14 - Scenario vs. production rate for different areas based on the use of six LHDs
In Figure 15, correlation between the production rate and distance travelled in production area
C is shown. The results are based on the use of one LHD in operation. Similar pattern followed in
production area A and production area B. From the Figure 15 the observation was made that lower
the number of operational ore passes, the higher the LHDs average distance and lower the
production rates. In scenario numbers 12 and 15 the machines had to travel further distances than
in scenario numbers 13 and 14 resulting in lower production rates. This is because the location of
the operational ore pass in scenario 12 and scenario 15 are located to the far-left and far-right side
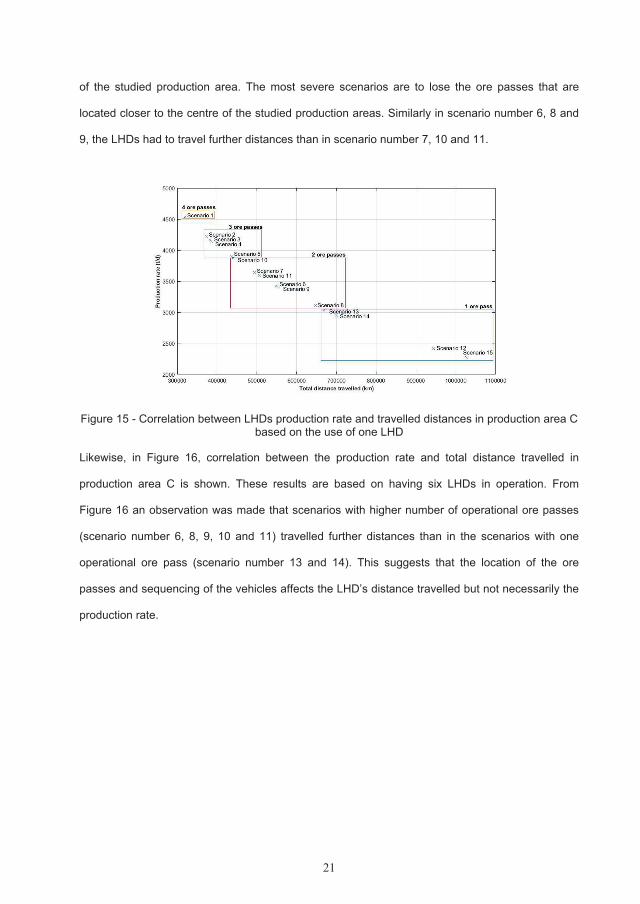
21
of the studied production area. The most severe scenarios are to lose the ore passes that are
located closer to the centre of the studied production areas. Similarly in scenario number 6, 8 and
9, the LHDs had to travel further distances than in scenario number 7, 10 and 11.
Figure 15 - Correlation between LHDs production rate and travelled distances in production area C based on the use of one LHD
Likewise, in Figure 16, correlation between the production rate and total distance travelled in
production area C is shown. These results are based on having six LHDs in operation. From
Figure 16 an observation was made that scenarios with higher number of operational ore passes
(scenario number 6, 8, 9, 10 and 11) travelled further distances than in the scenarios with one
operational ore pass (scenario number 13 and 14). This suggests that the location of the ore
passes and sequencing of the vehicles affects the LHD’s distance travelled but not necessarily the
production rate.
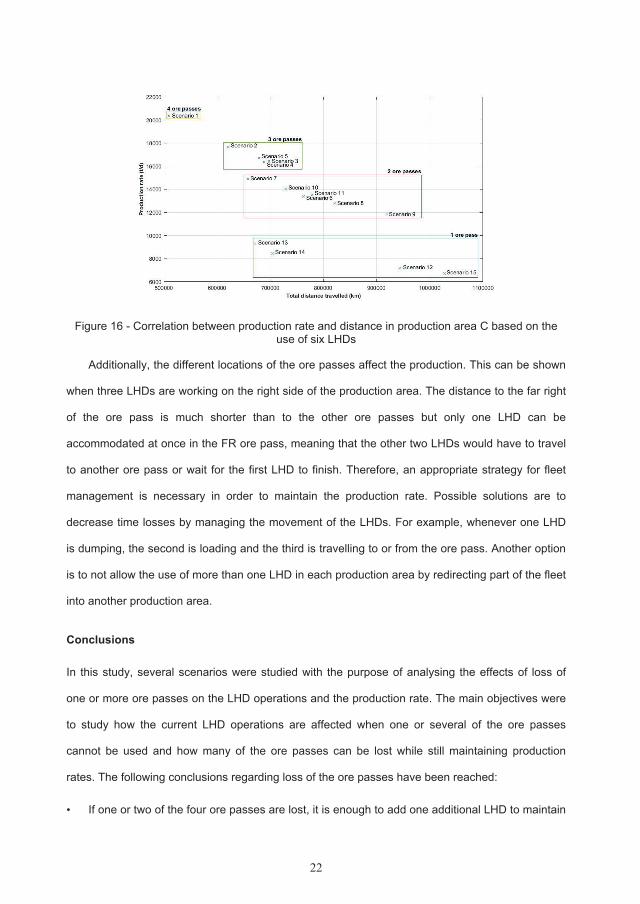
22
Figure 16 - Correlation between production rate and distance in production area C based on the use of six LHDs
Additionally, the different locations of the ore passes affect the production. This can be shown
when three LHDs are working on the right side of the production area. The distance to the far right
of the ore pass is much shorter than to the other ore passes but only one LHD can be
accommodated at once in the FR ore pass, meaning that the other two LHDs would have to travel
to another ore pass or wait for the first LHD to finish. Therefore, an appropriate strategy for fleet
management is necessary in order to maintain the production rate. Possible solutions are to
decrease time losses by managing the movement of the LHDs. For example, whenever one LHD
is dumping, the second is loading and the third is travelling to or from the ore pass. Another option
is to not allow the use of more than one LHD in each production area by redirecting part of the fleet
into another production area.
Conclusions
In this study, several scenarios were studied with the purpose of analysing the effects of loss of
one or more ore passes on the LHD operations and the production rate. The main objectives were
to study how the current LHD operations are affected when one or several of the ore passes
cannot be used and how many of the ore passes can be lost while still maintaining production
rates. The following conclusions regarding loss of the ore passes have been reached:
• If one or two of the four ore passes are lost, it is enough to add one additional LHD to maintain
23
or even improve production.
• In the scenario when only one ore pass remains in operation, the production rate of the
vehicles drops, due to increased waiting times, especially when extra LHDs are being used.
• Operating with a high number LHDs in the production area affected by an ore pass loss,
results in higher variations in production rate than when operating with a low number of LHDs.
Thus, instead of using additional number of the LHDs in the area where an ore pass failed,
using the LHDs in another production area (if possible) to achieve higher production rates
could be a short term option.
• When two drifts are used for loading next to each other, the LHDs may end up having to travel
to the ore pass located further away from the production drift as the closer one may be
occupied by another LHD. Consequently this would lead to a decrease in production rate and
should be avoided.
• When two ore passes are operational, using six LHDs would result in higher production rate
than when using five LHDs, whereas if there is only one ore pass remaining in operation,
using six LHDs would result in almost the same production rate than when using five LHDs.
The remaining ore pass used in operation becomes infinitely busy with the LHDs continuously
claiming that ore pass. This restricts the increased number of LHDs from dumping more
material into the ore pass and highlights the need for analysis of the system in order to avoid
increasing waiting times and traffic problems by using too many machines in the area.
• In the studied production areas the most severe scenarios are to lose the ore passes that are
located closer to the centre.
• The mine management should have a strategy for ore pass loss situations in order to be able
to mitigate the possible production disturbances and try to avoid high variations in the
production rates. Otherwise, loss of an ore pass would likely result in additional fleet
requirements or in production disturbances while the ore pass is being restored.
• In order to avoid increased waiting times and traffic congestions by using too many machines
in the working areas the suggestion is to evaluate whether the system can accommodate an
extra machine in the production area. Alternatively, the machine should be redirected into
another production area or optionally, additional ore pass inlets could be constructed to allow
24
entry for the incoming fleet.
The simulation created a baseline for future studies of possible alternatives and improvements
that can be made for future underground transportation systems. As most underground mines
operate with small economic margins, strategies should be developed to mitigate the production
disturbances related to loss of one or more ore passes. The results in this paper show clearly the
variations in achieved production rates depending on the number of additional LHDs in operation,
stressing the importance of a well-developed strategy.
References
Adlerborn, B. and Selberg, M. 2008. GIRON and WOLIS – Two mine applications. Proceedings of 5th International
Conference & Exibition on Mass Mining, Luleå, Sweden, 9-11 June 2008. pp. 637-642.
Balci, O. 1990. Guidelines for Successful Simulation Studies. Proceedings of the 1990 Winter Simulation Conference in
New Orleans, Louisiana, December 2-12 1990. pp. 25-32.
Banks, J. 2004. Getting started with AutoMod. Brooks Automation, Chelmsford, USA.
Banks, J., Carson, J.S., Nelson, B.L., and Nicol, D.M. 2013. Discrete-event system simulation. Pearson New
International 5th ed.
Beus, B.J., Pariseau, W.G., Steward, B.M., and Iverson, S.R. 2001. Design of ore passes, in underground mining
methods. SME Mining Underground Methods. Hustrulid, W.A. and Bullock, R.L. (eds). New York. pp. 627–634.
Brummer, R. 1998. Design of orepasses methods for determining the useful life of ore-passes based on previous
experience and case studies. Technical Report CAMIRO, Mining Division Limited: Sudbury, ON, Canada.
EasyFit, Available online: http://www.mathwave.com/easyfit-distribution-fitting.html [accessed on 2016-09-24].
Gardner, L.J. and Fernandes, N.D. 2006. Ore pass rehabilitation – Case studies from Impala Platinum Limited. Journal
of Southern African Institute of Mining and Metallurgy, vol. 106. pp. 17-24.
Greberg, J. and Salama, A. 2016. Innovative mining methods and processes for deep steeply dipping deposits: I2Mine
subtask 2.1.1. Technical Report from Luleå University of Technology, Luleå, Sweden.
Greberg, J. and Sundqvist, F. 2011. Simulation as a tool for mine planning. Proceedings of 2nd International Future
Mining, Sydney, 22-23 November 2011. pp. 273-278.
Gustafson, A., Schunnesson, H., Galar, D., and Kumar, U. 2013. Production and maintenance performance analysis:
manual versus semi-automatic LHDs. Journal of Quality in Maintenance Engineering, vol. 19, no. 1. pp. 74-88.
Hadjigeorgiou, J. and Lessard, J.F. 2010. Strategies for restoring material flow in ore and waste pass systems.
International of Mining Reclamation and Environment, vol. 24. pp. 267-282.
Hadjigeorgiou, J. and Stacey, T.R. 2013. The absence of strategy in orepass planning, design and management. Journal
of Southern African Institute of Mining and Metallurgy, vol. 133. pp. 795-801.
25
Hadjigeorgiou, J., Lessard, J.F., and Mercier-Langevin, F. 2005. Ore pass practice in Canadian mines. Journal of
Southern African Institute of Mining and Metallurgy, vol. 105. pp. 809-816.
Hambley, D.F. 1987. Design of ore pass systems for underground mines. Canadian Institute of Mining, Metallurgy and
Petroleum Bulletin, vol. 897. pp. 25–30.
Hoare, R.T. and Willis, R.J. 1992. A case study of animated computer simulation in the Australian mining industry.
Journal of Operational Research Society, vol. 43. pp. 1113-1120.
Hunt, C. 1994. Simulation model of ore transport at the Henderson mine. Computational Geosciences, vol. 20. pp. 75-84.
Joughin, W.C. and Stacey, T.R. 2005. Risks associated with rockpasses in deep-level tabular mines based on historical
pass performance. Journal of Southern African Institute of Mining and Metallurgy, vol. 105. pp. 795-802.
Kleijnen, J. 1995. Verification and validation of simulation models. European Journal of Operational Research, vol. 82.
pp. 145-162.
Quinteiro, M. and Hedström, O. 2001. Underground iron ore mining at LKAB, Sweden. SME Mining Underground
Methods. Hustrulid, W.A. and Bullock, R.L. (eds). New York. pp. 361-368.
Salama, A., Greberg, J., and Schunnesson, H. 2014. The use of discrete event simulation for underground haulage
mining equipment selection. International Journal of Mining and Mineral Engineering, vol. 5, no. 3. pp. 256-271.
Salama, A., Greberg, J., Gustafson A., and Skawina, B. 2016. Alternative process flow for underground mining
operations: Analysis of conceptual transport methods using discrete event simulation. Minerals, vol. 6, no. 3, 65.
Sargent, R.G. 2011. Verification and validation of simulation models. Proceedings of the 2011 Winter Simulation
Conference, Syracuse University, New York. pp. 183-198.
Skawina, B., Greberg, J., Jonsson, K., and Salama, A. 2016. Ore pass loss mitigation approach in Malmberget mine.
Proceedings of 7th International Conference & Exibition on Mass Mining, Sydney, 9-11 May 2016. pp. 617-622.
Thesen, A. and Travis, L.E. 1998. Handbook of simulation: Principles, Methodology, Advances, Applications, and
Practice. John Wiley, New York, USA.
Turner, R.J. 1999. Simulation in the mining industry of South Africa. International Journal of Surface Mining, Reclamation
and Environment, vol. 13. pp. 47-56.
Usmani, T., Szymanski, J., and Apel, D. 2014. Optimisation of LHDs operation at the extraction level in a block cave
project. International Journal of Mining and Mineral Engineering, vol. 5, no. 2. pp. 138-151.
Yuriy, G. and Runciman, N. 2013. Discrete-event simulation in underground mining – applicability and experience at Vale
Canada operations. World Mining Congress 05-WMC, Canada.

PAPER C
Evaluation of near-to-face sorting plant in an underground mine: A case study from Kristineberg
mine
Skawina B., Greberg J., Salama A., and Novikov E., Evaluation of near-to-face sorting plant in an underground mine: A case study from Kristineberg mine, in Proceedings of the SME Annual Conference and Expo, 21st – 24th February 2016, Phoenix, USA, 2016a.

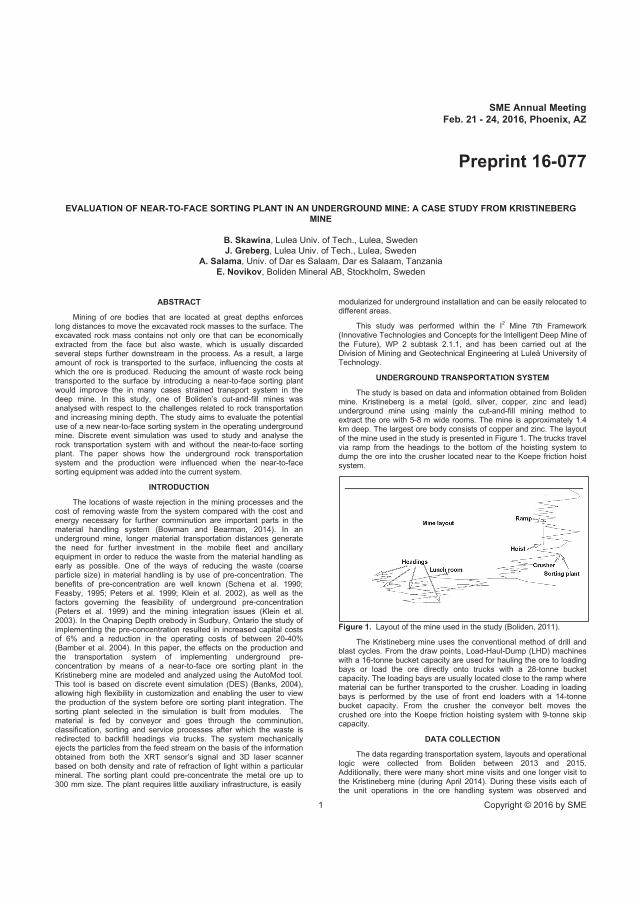
SME Annual MeetingFeb. 21 - 24, 2016, Phoenix, AZ
1 Copyright © 2016 by SME
Preprint 16-077
EVALUATION OF NEAR-TO-FACE SORTING PLANT IN AN UNDERGROUND MINE: A CASE STUDY FROM KRISTINEBERG MINE
B. Skawina, Lulea Univ. of Tech., Lulea, SwedenJ. Greberg, Lulea Univ. of Tech., Lulea, Sweden
A. Salama, Univ. of Dar es Salaam, Dar es Salaam, TanzaniaE. Novikov, Boliden Mineral AB, Stockholm, Sweden
ABSTRACT
Mining of ore bodies that are located at great depths enforces long distances to move the excavated rock masses to the surface. The excavated rock mass contains not only ore that can be economically extracted from the face but also waste, which is usually discarded several steps further downstream in the process. As a result, a large amount of rock is transported to the surface, influencing the costs at which the ore is produced. Reducing the amount of waste rock being transported to the surface by introducing a near-to-face sorting plant would improve the in many cases strained transport system in the deep mine. In this study, one of Boliden’s cut-and-fill mines was analysed with respect to the challenges related to rock transportationand increasing mining depth. The study aims to evaluate the potential use of a new near-to-face sorting system in the operating underground mine. Discrete event simulation was used to study and analyse the rock transportation system with and without the near-to-face sorting plant. The paper shows how the underground rock transportationsystem and the production were influenced when the near-to-face sorting equipment was added into the current system.
INTRODUCTION
The locations of waste rejection in the mining processes and the cost of removing waste from the system compared with the cost and energy necessary for further comminution are important parts in the material handling system (Bowman and Bearman, 2014). In an underground mine, longer material transportation distances generatethe need for further investment in the mobile fleet and ancillary equipment in order to reduce the waste from the material handling as early as possible. One of the ways of reducing the waste (coarse particle size) in material handling is by use of pre-concentration. The benefits of pre-concentration are well known (Schena et al. 1990; Feasby, 1995; Peters et al. 1999; Klein et al. 2002), as well as the factors governing the feasibility of underground pre-concentration(Peters et al. 1999) and the mining integration issues (Klein et al. 2003). In the Onaping Depth orebody in Sudbury, Ontario the study of implementing the pre-concentration resulted in increased capital costs of 6% and a reduction in the operating costs of between 20-40%(Bamber et al 2004). In this paper, the effects on the production and the transportation system of implementing underground pre-concentration by means of a near-to-face ore sorting plant in theKristineberg mine are modeled and analyzed using the AutoMod tool. This tool is based on discrete event simulation (DES) (Banks, 2004), allowing high flexibility in customization and enabling the user to view the production of the system before ore sorting plant integration. The sorting plant selected in the simulation is built from modules. The material is fed by conveyor and goes through the comminution, classification, sorting and service processes after which the waste is redirected to backfill headings via trucks. The system mechanically ejects the particles from the feed stream on the basis of the informationobtained from both the XRT sensor’s signal and 3D laser scanner based on both density and rate of refraction of light within a particular mineral. The sorting plant could pre-concentrate the metal ore up to 300 mm size. The plant requires little auxiliary infrastructure, is easily
modularized for underground installation and can be easily relocated to different areas.
This study was performed within the I2 Mine 7th Framework (Innovative Technologies and Concepts for the Intelligent Deep Mine of the Future), WP 2 subtask 2.1.1, and has been carried out at the Division of Mining and Geotechnical Engineering at Luleå University of Technology.
UNDERGROUND TRANSPORTATION SYSTEM
The study is based on data and information obtained from Boliden mine. Kristineberg is a metal (gold, silver, copper, zinc and lead) underground mine using mainly the cut-and-fill mining method to extract the ore with 5-8 m wide rooms. The mine is approximately 1.4 km deep. The largest ore body consists of copper and zinc. The layout of the mine used in the study is presented in Figure 1. The trucks travelvia ramp from the headings to the bottom of the hoisting system to dump the ore into the crusher located near to the Koepe friction hoist system.
Figure 1. Layout of the mine used in the study (Boliden, 2011).
The Kristineberg mine uses the conventional method of drill and blast cycles. From the draw points, Load-Haul-Dump (LHD) machines with a 16-tonne bucket capacity are used for hauling the ore to loading bays or load the ore directly onto trucks with a 28-tonne bucket capacity. The loading bays are usually located close to the ramp where material can be further transported to the crusher. Loading in loading bays is performed by the use of front end loaders with a 14-tonne bucket capacity. From the crusher the conveyor belt moves the crushed ore into the Koepe friction hoisting system with 9-tonne skip capacity.
DATA COLLECTION
The data regarding transportation system, layouts and operational logic were collected from Boliden between 2013 and 2015.Additionally, there were many short mine visits and one longer visit to the Kristineberg mine (during April 2014). During these visits each of the unit operations in the ore handling system was observed and
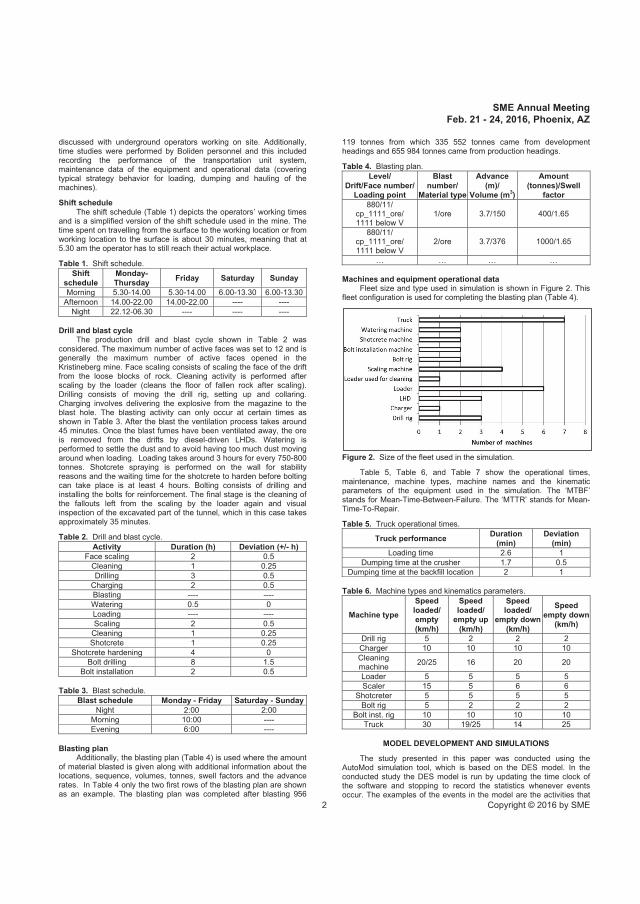
SME Annual MeetingFeb. 21 - 24, 2016, Phoenix, AZ
2 Copyright © 2016 by SME
discussed with underground operators working on site. Additionally, time studies were performed by Boliden personnel and this included recording the performance of the transportation unit system, maintenance data of the equipment and operational data (covering typical strategy behavior for loading, dumping and hauling of the machines).
Shift scheduleThe shift schedule (Table 1) depicts the operators’ working times
and is a simplified version of the shift schedule used in the mine. The time spent on travelling from the surface to the working location or from working location to the surface is about 30 minutes, meaning that at 5.30 am the operator has to still reach their actual workplace.
Table 1. Shift schedule. Shift
scheduleMonday-Thursday Friday Saturday Sunday
Morning 5.30-14.00 5.30-14.00 6.00-13.30 6.00-13.30Afternoon 14.00-22.00 14.00-22.00 ---- ----
Night 22.12-06.30 ---- ---- ----
Drill and blast cycleThe production drill and blast cycle shown in Table 2 was
considered. The maximum number of active faces was set to 12 and is generally the maximum number of active faces opened in the Kristineberg mine. Face scaling consists of scaling the face of the drift from the loose blocks of rock. Cleaning activity is performed after scaling by the loader (cleans the floor of fallen rock after scaling). Drilling consists of moving the drill rig, setting up and collaring. Charging involves delivering the explosive from the magazine to the blast hole. The blasting activity can only occur at certain times as shown in Table 3. After the blast the ventilation process takes around 45 minutes. Once the blast fumes have been ventilated away, the ore is removed from the drifts by diesel-driven LHDs. Watering is performed to settle the dust and to avoid having too much dust moving around when loading. Loading takes around 3 hours for every 750-800tonnes. Shotcrete spraying is performed on the wall for stability reasons and the waiting time for the shotcrete to harden before bolting can take place is at least 4 hours. Bolting consists of drilling and installing the bolts for reinforcement. The final stage is the cleaning of the fallouts left from the scaling by the loader again and visual inspection of the excavated part of the tunnel, which in this case takes approximately 35 minutes.
Table 2. Drill and blast cycle. Activity Duration (h) Deviation (+/- h)
Face scaling 2 0.5Cleaning 1 0.25Drilling 3 0.5
Charging 2 0.5Blasting ---- ----Watering 0.5 0Loading ---- ----Scaling 2 0.5
Cleaning 1 0.25Shotcrete 1 0.25
Shotcrete hardening 4 0Bolt drilling 8 1.5
Bolt installation 2 0.5
Table 3. Blast schedule. Blast schedule Monday - Friday Saturday - Sunday
Night 2:00 2:00Morning 10:00 ----Evening 6:00 ----
Blasting planAdditionally, the blasting plan (Table 4) is used where the amount
of material blasted is given along with additional information about the locations, sequence, volumes, tonnes, swell factors and the advance rates. In Table 4 only the two first rows of the blasting plan are shown as an example. The blasting plan was completed after blasting 956
119 tonnes from which 335 552 tonnes came from development headings and 655 984 tonnes came from production headings.
Table 4. Blasting plan. Level/
Drift/Face number/ Loading point
Blast number/
Material type
Advance (m)/
Volume (m3)
Amount (tonnes)/Swell
factor880/11/
cp_1111_ore/ 1111 below V
1/ore 3.7/150 400/1.65
880/11/ cp_1111_ore/ 1111 below V
2/ore 3.7/376 1000/1.65
… … … …
Machines and equipment operational dataFleet size and type used in simulation is shown in Figure 2. This
fleet configuration is used for completing the blasting plan (Table 4).
Figure 2. Size of the fleet used in the simulation.
Table 5, Table 6, and Table 7 show the operational times, maintenance, machine types, machine names and the kinematic parameters of the equipment used in the simulation. The ‘MTBF’ stands for Mean-Time-Between-Failure. The ‘MTTR’ stands for Mean-Time-To-Repair.
Table 5. Truck operational times.
Truck performance Duration(min)
Deviation(min)
Loading time 2.6 1Dumping time at the crusher 1.7 0.5
Dumping time at the backfill location 2 1
Table 6. Machine types and kinematics parameters.
Machine type
Speed loaded/empty (km/h)
Speed loaded/
empty up (km/h)
Speed loaded/
empty down (km/h)
Speed empty down
(km/h)
Drill rig 5 2 2 2Charger 10 10 10 10Cleaning machine 20/25 16 20 20
Loader 5 5 5 5Scaler 15 5 6 6
Shotcreter 5 5 5 5Bolt rig 5 2 2 2
Bolt inst. rig 10 10 10 10Truck 30 19/25 14 25
MODEL DEVELOPMENT AND SIMULATIONS
The study presented in this paper was conducted using the AutoMod simulation tool, which is based on the DES model. In the conducted study the DES model is run by updating the time clock of the software and stopping to record the statistics whenever events occur. The examples of the events in the model are the activities that
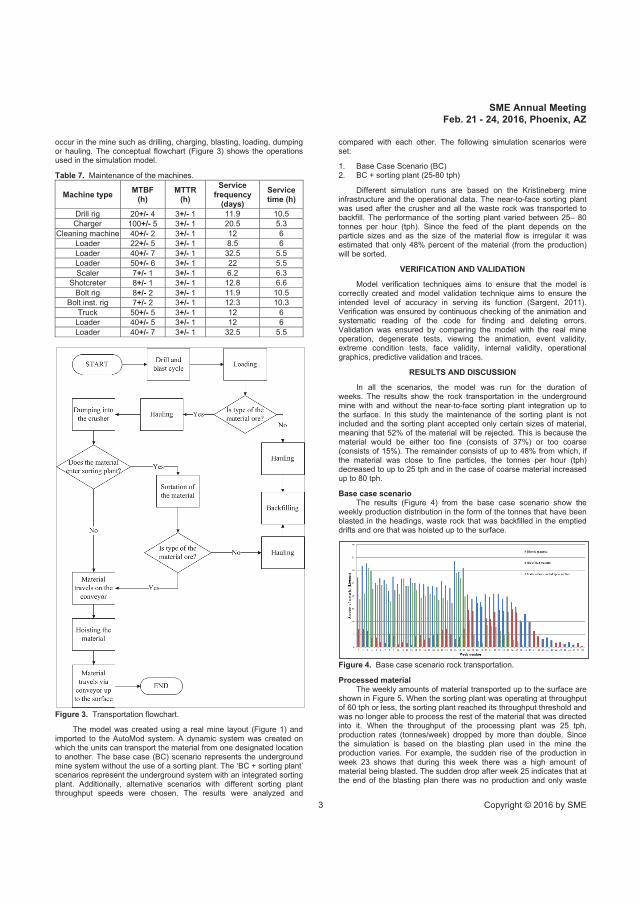
SME Annual MeetingFeb. 21 - 24, 2016, Phoenix, AZ
3 Copyright © 2016 by SME
occur in the mine such as drilling, charging, blasting, loading, dumping or hauling. The conceptual flowchart (Figure 3) shows the operations used in the simulation model.
Table 7. Maintenance of the machines.
Machine type MTBF(h)
MTTR(h)
Service frequency
(days)
Service time (h)
Drill rig 20+/- 4 3+/- 1 11.9 10.5Charger 100+/- 5 3+/- 1 20.5 5.3
Cleaning machine 40+/- 2 3+/- 1 12 6Loader 22+/- 5 3+/- 1 8.5 6Loader 40+/- 7 3+/- 1 32.5 5.5Loader 50+/- 6 3+/- 1 22 5.5Scaler 7+/- 1 3+/- 1 6.2 6.3
Shotcreter 8+/- 1 3+/- 1 12.8 6.6Bolt rig 8+/- 2 3+/- 1 11.9 10.5
Bolt inst. rig 7+/- 2 3+/- 1 12.3 10.3Truck 50+/- 5 3+/- 1 12 6
Loader 40+/- 5 3+/- 1 12 6Loader 40+/- 7 3+/- 1 32.5 5.5
Figure 3. Transportation flowchart.
The model was created using a real mine layout (Figure 1) and imported to the AutoMod system. A dynamic system was created on which the units can transport the material from one designated location to another. The base case (BC) scenario represents the underground mine system without the use of a sorting plant. The ‘BC + sorting plant’ scenarios represent the underground system with an integrated sorting plant. Additionally, alternative scenarios with different sorting plant throughput speeds were chosen. The results were analyzed and
compared with each other. The following simulation scenarios were set:
1. Base Case Scenario (BC)2. BC + sorting plant (25-80 tph)
Different simulation runs are based on the Kristineberg mineinfrastructure and the operational data. The near-to-face sorting plant was used after the crusher and all the waste rock was transported to backfill. The performance of the sorting plant varied between 25– 80tonnes per hour (tph). Since the feed of the plant depends on the particle sizes and as the size of the material flow is irregular it was estimated that only % percent of the material (from the production) will be sorted.
VERIFICATION AND VALIDATION
Model verification techniques aims to ensure that the model is correctly created and model validation technique aims to ensure the intended level of accuracy in serving its function (Sargent, 2011). Verification was ensured by continuous checking of the animation and systematic reading of the code for finding and deleting errors. Validation was ensured by comparing the model with the real mine operation, degenerate tests, viewing the animation, event validity, extreme condition tests, face validity, internal validity, operational graphics, predictive validation and traces.
RESULTS AND DISCUSSION
In all the scenarios, the model was run for the duration of weeks. The results show the rock transportation in the underground mine with and without the near-to-face sorting plant integration up to the surface. In this study the maintenance of the sorting plant is not included and the sorting plant accepted only certain sizes of material, meaning that 52% of the material will be rejected. This is because thematerial would be either too fine (consists of 37%) or too coarse(consists of 15%). The remainder consists of up to 48% from which, ifthe material was close to fine particles, the tonnes per hour (tph)decreased to up to 25 tph and in the case of coarse material increased up to 80 tph.
Base case scenarioThe results (Figure 4) from the base case scenario show the
weekly production distribution in the form of the tonnes that have been blasted in the headings, waste rock that was backfilled in the emptied drifts and ore that was hoisted up to the surface.
Figure 4. Base case scenario rock transportation.
Processed materialThe weekly amounts of material transported up to the surface are
shown in Figure 5. When the sorting plant was operating at throughput of 60 tph or less, the sorting plant reached its throughput threshold and was no longer able to process the rest of the material that was directed into it. When the throughput of the processing plant was 25 tph, production rates (tonnes/week) dropped by more than double. Since the simulation is based on the blasting plan used in the mine the production varies. For example, the sudden rise of the production in week 23 shows that during this week there was a high amount of material being blasted. The sudden drop after week 25 indicates that at the end of the blasting plan there was no production and only waste
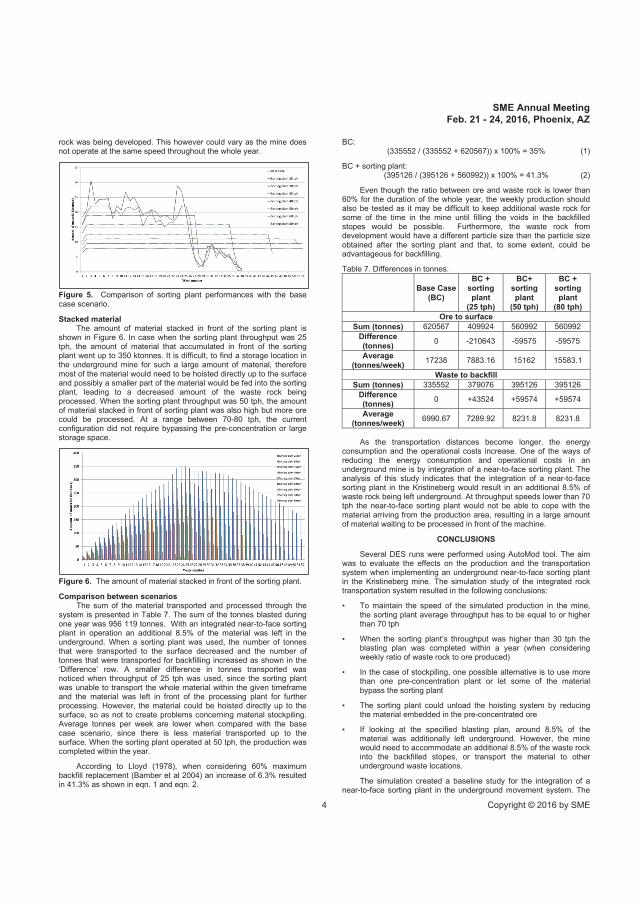
SME Annual MeetingFeb. 21 - 24, 2016, Phoenix, AZ
4 Copyright © 2016 by SME
rock was being developed. This however could vary as the mine does not operate at the same speed throughout the whole year.
Figure 5. Comparison of sorting plant performances with the base case scenario.
Stacked materialThe amount of material stacked in front of the sorting plant is
shown in Figure 6. In case when the sorting plant throughput was 25 tph, the amount of material that accumulated in front of the sorting plant went up to 350 ktonnes. It is difficult, to find a storage location in the underground mine for such a large amount of material, therefore most of the material would need to be hoisted directly up to the surface and possibly a smaller part of the material would be fed into the sorting plant, leading to a decreased amount of the waste rock being processed. When the sorting plant throughput was 50 tph, the amount of material stacked in front of sorting plant was also high but more ore could be processed. At a range between 70-80 tph, the current configuration did not require bypassing the pre-concentration or large storage space.
Figure 6. The amount of material stacked in front of the sorting plant.
Comparison between scenariosThe sum of the material transported and processed through the
system is presented in Table 7. The sum of the tonnes blasted during one year was 956 119 tonnes. With an integrated near-to-face sorting plant in operation an additional 8.5% of the material was left in the underground. When a sorting plant was used, the number of tonnes that were transported to the surface decreased and the number of tonnes that were transported for backfilling increased as shown in the‘Difference’ row. A smaller difference in tonnes transported was noticed when throughput of 25 tph was used, since the sorting plant was unable to transport the whole material within the given timeframe and the material was left in front of the processing plant for further processing. However, the material could be hoisted directly up to the surface, so as not to create problems concerning material stockpiling. Average tonnes per week are lower when compared with the base case scenario, since there is less material transported up to the surface. When the sorting plant operated at 50 tph, the production was completed within the year.
According to Lloyd (1978), when considering 60% maximum backfill replacement (Bamber et al 2004) an increase of 6.3% resulted in 41.3% as shown in eqn. 1 and eqn. 2.
BC:(335552 / (335552 + 620567)) x 100% = 35% (1)
BC + sorting plant:(395126 / (395126 + 560992)) x 100% = 41.3% (2)
Even though the ratio between ore and waste rock is lower than 60% for the duration of the whole year, the weekly production should also be tested as it may be difficult to keep additional waste rock for some of the time in the mine until filling the voids in the backfilled stopes would be possible. Furthermore, the waste rock from development would have a different particle size than the particle size obtained after the sorting plant and that, to some extent, could be advantageous for backfilling.
Table 7. Differences in tonnes.
Base Case (BC)
BC + sorting plant
(25 tph)
BC+ sorting plant
(50 tph)
BC + sorting plant
(80 tph)Ore to surface
Sum (tonnes) 620567 409924 560992 560992Difference (tonnes) 0 -210643 -59575 -59575
Average (tonnes/week) 17238 7883.16 15162 15583.1
Waste to backfillSum (tonnes) 335552 379076 395126 395126
Difference (tonnes) 0 +43524 +59574 +59574
Average (tonnes/week) 6990.67 7289.92 8231.8 8231.8
As the transportation distances become longer, the energy consumption and the operational costs increase. One of the ways of reducing the energy consumption and operational costs in an underground mine is by integration of a near-to-face sorting plant. The analysis of this study indicates that the integration of a near-to-face sorting plant in the Kristineberg would result in an additional 8.5% of waste rock being left underground. At throughput speeds lower than 70 tph the near-to-face sorting plant would not be able to cope with the material arriving from the production area, resulting in a large amount of material waiting to be processed in front of the machine.
CONCLUSIONS
Several DES runs were performed using AutoMod tool. The aim was to evaluate the effects on the production and the transportation system when implementing an underground near-to-face sorting plant in the Kristineberg mine. The simulation study of the integrated rock transportation system resulted in the following conclusions:
• To maintain the speed of the simulated production in the mine,the sorting plant average throughput has to be equal to or higherthan 70 tph
• When the sorting plant’s throughput was higher than 30 tph theblasting plan was completed within a year (when consideringweekly ratio of waste rock to ore produced)
• In the case of stockpiling, one possible alternative is to use morethan one pre-concentration plant or let some of the materialbypass the sorting plant
• The sorting plant could unload the hoisting system by reducingthe material embedded in the pre-concentrated ore
• If looking at the specified blasting plan, around 8.5% of thematerial was additionally left underground. However, the minewould need to accommodate an additional 8.5% of the waste rockinto the backfilled stopes, or transport the material to otherunderground waste locations.
The simulation created a baseline study for the integration of anear-to-face sorting plant in the underground movement system. The
SME Annual MeetingFeb. 21 - 24, 2016, Phoenix, AZ
5 Copyright © 2016 by SME
results show that there is a room for pre-concentration and an increase in the amount of ore delivered to surface. However, further studies that address the factors governing the feasibility of the near-to-face sorting plant and mining processing integration issues are required.
REFERENCES
Bowman D.J. and Bearman R.A. (2014), “Coarse waste rejectionthrough size based separation”, Mineral Engineering, 62, pp.
110.
Klein B., Dunbar W.S. and Scoble M. (2002), “Integrating miningand mineral processing for advanced mining system”, CIMBulletin, 95(1057), pp. 63-68.
Bamber A., Klein B., Morin M. and Scoble M. (2004), “ReducingSelectivity in Narrow-Vein Mining through the Integration ofUnderground Pre-concentration”, in Proceedings SecondInternational Symposium in Mining Techniques of Narrow-VeinDeposits, pp. 92-103.
Lloyd P. (1978), “The potential of integrated mining and extractionsystems on the Witwatersrand”, in Proceedings of the 11thInternational Commonwealth Mining and Metallurgical Congress.