Embed Size (px)
Citation preview

[EMBARGOED 00.01 TUES 17 APRIL]
Minimum Wage: Maximum Impact Alan Manning April 2012 © Resolution Foundation 2012
E: [email protected] T: 020 3372 2960 F: 020 3372 2999

About the Author
Professor Alan Manning is Head of the Economics Department at the London School of Economics where he has taught since 1989. He is one of the UK’s leading labour market economists and has published widely on the impacts of the minimum wage, monopsony, immigration and technological change on wages and employment.
Contents
Introduction ................................................................................................................ 1
Section 1 – The (success) story so far ......................................................................... 3
Section 2 – What if we were radical? Evidence on the impact of much higher
minimum wages ........................................................................................................ 11
Section 3 – Options for more radical reform ............................................................ 17
Conclusion ................................................................................................................. 24
Appendix ................................................................................................................... 25
Bibliography .............................................................................................................. 26

Resolution Foundation Page 1
Introduction
It is easy to forget that when it was first introduced in 1999, the National Minimum Wage (NMW) was
controversial. Its introduction had been a major policy proposal of the new Blair government but had
been strongly opposed by the outgoing Conservative government which provided dire warnings of
massive job losses. The Conservative Party remained committed to its abolition for some years. Today
this has changed – by 2005 David Cameron, then the new leader of the Conservatives said: “I think the
minimum wage has been a success”. The current Chancellor, George Osborne said in 2008 that “modern
Conservatives acknowledge the fairness of a minimum wage”.
So, 12 years later, when perhaps the NMW should be entering rebellious adolescence it seems to have
settled down into a premature staid middle age. Although political parties might quibble about the details
of how much the NMW should be increased each year, its continued existence is supported by all. This
broad acceptance partly reflects the fact that the minimum wage is very popular among the public. But it
also reflects the excellent job done by the Low Pay Commission (LPC) whose evidence-based approach has
limited the scope for political posturing in discussions about the appropriate level and form of the
minimum wage. In a poll of political experts by the Institute of Government, the minimum wage was
voted the most successful UK government policy of the past 30 years ahead of the Northern Ireland peace
process.
In political terms, then, the minimum wage is a resounding success. Its economic impact has also been
positive – as I describe later, the NMW has raised incomes for the lowest-paid, increased incentives to
work and reduced pressure on tax credits to prevent in-work poverty, all without jeopardizing
employment prospects. Yet today this success has led not to a widespread enthusiasm for its future
potential—once the economy picks up—but instead to widespread caution. Enthusiastic supporters of the
minimum wage are understandably anxious about jeopardising what has been achieved while those who
remain more sceptical know that their best hope is that the minimum wage either fades in value over
time or, at the very least, fades from public debate as a potentially radical tool of public policy.
In the short-term, of course, this conservatism makes sense; economic conditions put any major increase
in the value of the minimum wage off the table. Yet with work from the Resolution Foundation finding
growing evidence that stagnant wages may continue even once growth returns, over the long term this
curious consensus seems more unfortunate.1 Historical trends make clear just how important hourly wage
growth is for living standards. Although several important social and economic trends helped to boost
income for low to middle income households over the past forty years—most notably the rise of female
employment and the advent of tax credits—by far the largest driver of rising household income was
growth in the real value of hourly wages.2 Looking forwards, there is little reason to believe this central
role for hourly wages will diminish. There seems good reason, then, for us to reopen the question of
future policy on the minimum wage.
This paper therefore steps back from the current annual debate about the appropriate but small rise in
the value of the minimum wage to ask a bolder question: are there more radical reforms of the minimum
wage that could raise living standards in the years ahead? In part, we are interested in learning what
happens in labour markets where the minimum wage is much higher than it is in Britain today. But we are
1 Resolution Foundation, Squeezed Britain, January 2012 2 M. Brewer and L. Wren-Lewis, IFS analysis for the Resolution Foundation Commission on Living Standards, Why did Britain’s households get richer?, December 2011

Resolution Foundation Page 2
also interested in targeting – could a smarter design do more to benefit the groups that are most in need
of higher wages? And are there ways we could ‘project’ the effects of the minimum wage, so that it
doesn’t just raise wages at the very bottom, but also of those higher up the distribution?
The structure of the report is as follows. In Section 1 we review the evidence of the impact of the NMW
so far, including the overall effect on employment and the wage distribution. The conclusion is positive –
there is little evidence of any negative effect on employment but clear evidence of positive effects on low
end wages. This might lead some to conclude that the minimum wage should be raised significantly but
we would be more cautious. Section 2 therefore considers evidence from labour markets which already
experience a much higher minimum wage: first, other economies, notably France and New Zealand, and,
second, subsections of the UK labour market – certain regions, sectors and demographics – in which the
minimum wage is high relative to the median wage. We conclude that neither area gives us major reason
for concern, but nor does the evidence give us significant confidence to experiment with a much higher
national minimum wage. Section 3 therefore considers three other options which we hold to be both
relatively safe and quite promising in terms of their focus and impact: a higher minimum wage for those
aged over 30 (or 25), a higher minimum wage for London, and, finally, an approach that learns from the
living wage by extending the LPC’s remit to play a greater role in changing pay norms through non-
mandatory means.

Resolution Foundation Page 3
Section 1 – The (success) story so far
Although it has never been explicit, the LPC seems to arrive at its recommendations for the level of the
minimum wage by balancing a desire to have a high minimum, to benefit low-paid workers, against the
concern that job losses might arise if that minimum were to be set too high. How successful has it been in
striking this balance? This section runs through the evidence on the impact of the minimum wage on
employment and wages. First, we look briefly at the structure of the minimum wage and at its level.
The structure and level of the minimum wage
The current form of the NMW is a single national adult rate for everyone aged over 21 (formerly 22) with
lower rates for young people and people in training as well as a few other narrower exceptions. At the
time of writing the various rates are (valid from 1 October 2011 to 1 October 2012):
- £6.08 for adults aged 21 and over
- £4.98 for those aged 18 to 20
- £3.68 for those aged 16 to 17
- £2.60 for apprentices under 19 and those 19 or over and in the first year of an apprenticeship
In March 2012 the government announced that in October 2012 the adult NMW will be increased by 11
pence to £6.19 an hour whilst the rates for 16-17 and 18-20 year olds will be frozen (the apprentice rate
will be increased by 5 pence to £2.65 an hour). As Figure 1 shows, thus far the NMW has been increased in
cash terms every year, although increases have slowed recently. In real terms, adjusting for RPI inflation,
growth in the minimum wage was greatest in the early 2000s, particularly around 2001. Last year’s
revision in the cash value of the minimum wage, from £5.93 to £6.08, represented the largest ever real
terms fall in the value of the minimum wage.
Figure 1: Historic rates of the National Minimum Wage
£ per hour
Current prices Constant 2011 prices, adjusted for RPI
Source: Low Pay Commission
A more useful way to think about the relative generosity of the minimum wage is to consider its value
relative to median wages. As Figure 2 shows, the initial level of the adult minimum wage was very modest
at about 46 percent of median adult hourly earnings. In the following years, after the Low Pay Commission
decided that the early NMW had had little impact on employment, this rate was pushed up rather faster
than median earnings between 2001 and 2007 reaching 52 percent in 2010. In recent years, as with the
6.085.93
5.805.735.52
5.35
5.054.85
4.50
4.204.10
3.703.60
4.984.924.834.774.60
4.454.25
4.10
3.803.603.50
3.203.00
3.683.643.573.533.403.30
3.003.00
2.602.50
2.00
3.00
4.00
5.00
6.00
2000 2001 2002 2003 2004 2005 2006 2007 2008 2009 2010 2011 2012
Adult rate* 18-20* 16-17 Apprentice
6.086.24
6.386.276.286.356.196.11
5.845.615.56
5.115.124.98
5.185.325.225.245.285.215.17
4.934.814.75
4.424.27
3.683.833.933.873.873.92
3.683.78
2.602.63
2.00
3.00
4.00
5.00
6.00
2000 2001 2002 2003 2004 2005 2006 2007 2008 2009 2010 2011 2012
Adult rate* 18-20* 16-17 Apprentice
Resolution Foundation Page 4
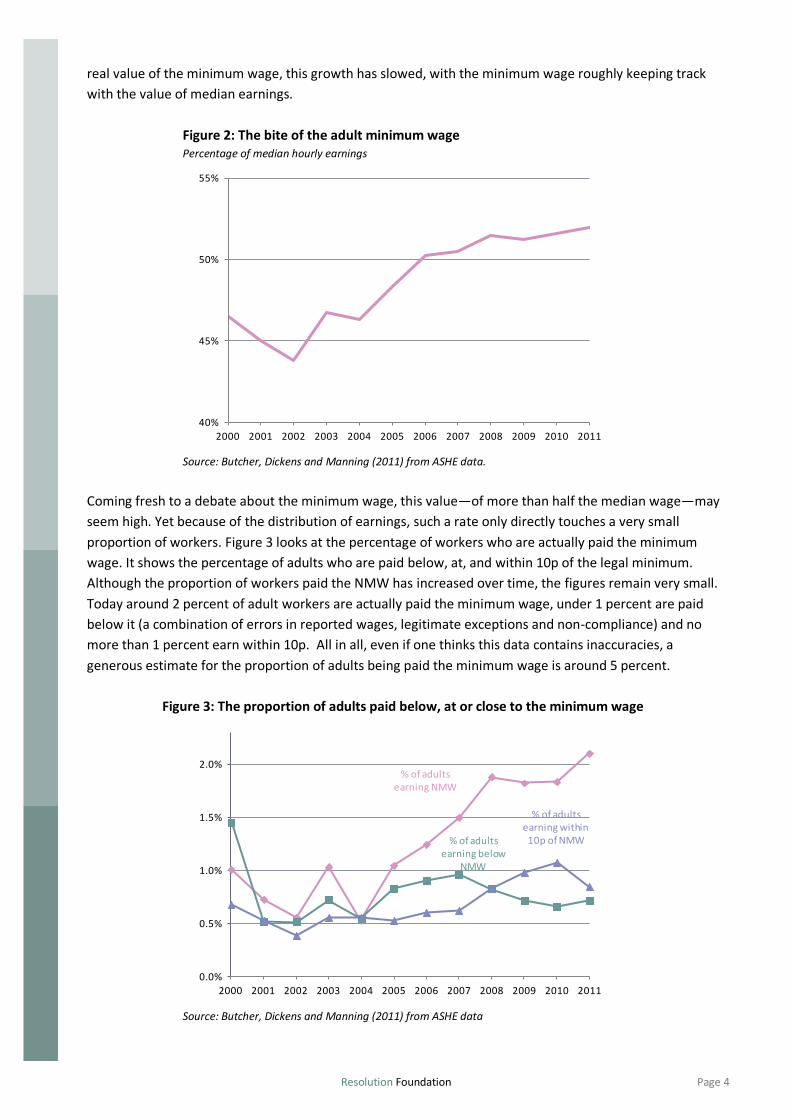
real value of the minimum wage, this growth has slowed, with the minimum wage roughly keeping track
with the value of median earnings.
Figure 2: The bite of the adult minimum wage Percentage of median hourly earnings
Source: Butcher, Dickens and Manning (2011) from ASHE data.
Coming fresh to a debate about the minimum wage, this value—of more than half the median wage—may
seem high. Yet because of the distribution of earnings, such a rate only directly touches a very small
proportion of workers. Figure 3 looks at the percentage of workers who are actually paid the minimum
wage. It shows the percentage of adults who are paid below, at, and within 10p of the legal minimum.
Although the proportion of workers paid the NMW has increased over time, the figures remain very small.
Today around 2 percent of adult workers are actually paid the minimum wage, under 1 percent are paid
below it (a combination of errors in reported wages, legitimate exceptions and non-compliance) and no
more than 1 percent earn within 10p. All in all, even if one thinks this data contains inaccuracies, a
generous estimate for the proportion of adults being paid the minimum wage is around 5 percent.
Figure 3: The proportion of adults paid below, at or close to the minimum wage
Source: Butcher, Dickens and Manning (2011) from ASHE data
40%
45%
50%
55%
2000 2001 2002 2003 2004 2005 2006 2007 2008 2009 2010 2011
% of adults earning NMW
% of adults earning below
NMW
% of adults earning within
10p of NMW
0.0%
0.5%
1.0%
1.5%
2.0%
2000 2001 2002 2003 2004 2005 2006 2007 2008 2009 2010 2011

Resolution Foundation Page 5
It is worth noting that the numbers reported in Figure 3 are lower than those usually produced by the LPC.
The difference is probably explained by timing. Because the NMW is raised in October each year, and
earnings generally rise over time (though less so at present), the fraction of workers paid the minimum
wage is likely to be highest in October just after the annual NMW rise and lowest in September just before
it. The LPC’s preferred measure of the NMW is the fraction of workers affected by each October’s annual
increase in the NMW, when the impact will be greatest. The estimates set out here, by contrast, are taken
from the Annual Survey of Hours and Earnings (ASHE), the dataset that is thought to be the most accurate
source for earnings. The ASHE survey is conducted in April of each year, roughly mid-way between each
NMW increase. It is therefore reasonable to think this represents an average measure over the year.
There is, of course, a great deal of variation in the impact of the minimum wage. The LPC has done an
excellent job in documenting these variations and there is little value in reproducing this work in detail
here.3 In short, the NMW has significantly more bite among women than among men, among part-timers
than full-timers, in low-wage regions than high-wage regions, among young people than among older
people (as discussed below), among those with no qualifications than among those with qualifications,
and (by a particularly substantial margin) among Pakistani and Bangladeshi workers than among the white
population. Figure 4 summarises the value of the current rate of the minimum wage for a number of
different subgroups.
Figure 4: Bite of the minimum wage NMW as a percentage of median earnings by group, employees aged 22 and over, 2010
Source: Low Pay Commission
The effect on employment and wages
What impact has the NMW had on the UK labour market in terms of employment and wage inequality?
When it comes to employment, there is little doubt that there is a level of the minimum wage at which
large numbers of jobs would be destroyed. The LPC rightly interprets its remit as ensuring the NMW
doesn’t breach this level. There is now a consensus that, at the moderate levels of the minimum wage we
have experienced in the UK, there has been very little if any adverse effect on employment. The LPC,
which includes employer-representatives, has been very thorough in investigating the impact of the NMW
3 See, for example, 2011 Annual Report of the LPC
51%
62%
57%
60%
53%
58%
60%
75%
83%
55%
84%
Men
Women
White
All non-white
Indian
Black
Other non-white
Pakistani
Bangladeshi
With qualifications
No qualifications
Resolution Foundation Page 6
so far, primarily through commissioned reports from independent academics, and has concluded that
there is no evidence of resultant job losses.
Rather than going over this evidence in detail, the Bibliography includes references to key publications
that have assessed the impact of the UK minimum wage on employment. The 2011 annual report of the
LPC contains a useful and objective overview of this evidence, which states: “The consensus of the
research findings on the impact of the National Minimum Wage in the UK is that it has not significantly
adversely affected employment but that it may have had a small negative effect on hours.”4
This is not to say that the LPC has identified no negative effects of the minimum wage. Summarising the
evidence in more detail, they state that:
“Our own analysis, commissioned research, evidence submitted in our consultation and anecdotal
evidence from visits and meetings have found that some employers have responded to the change in
earnings (and consequent increase in labour costs) by adjusting non-wage costs and changing pay
structures. Overtime and unsocial hours premia may have been reduced; pensions and annual leave
entitlement made less generous; pay zones (geographic and hierarchical) merged; or differentials may
have been squeezed. Further, there is also evidence to suggest that some firms may have coped with
minimum wage increases by reducing hours, raising prices, or by accepting lower profits. However, the
evidence available to date suggests that minimum wages do not appear to have cut employment to any
significant degree. Further, the reduced hours do not appear to have reduced weekly earnings and the
lower profits have not led to business closures.” 5
When interpreting the evidence now accumulated on the minimum wage it should be noted that the
strongest evidence on the employment effect of the NMW comes from the ‘big bang’ of introduction. It is
absolutely clear that this big change did not have any large adverse effect on employment as many had
predicted. But, although the LPC has continued to commission research into the employment impact of
the modest subsequent changes in the minimum wage, the small size of these changes mean that it is
very difficult to identify any impact of the NMW on employment from other factors causing employment
to change. The result is that we have arrived at the point where we are accumulating very little new
evidence on the employment impact of the NMW.
In summary, then, no evidence exists of negative impacts on employment or hours strong enough to
worry us about the negative effects of the minimum wage on overall employment income balancing out
positive effects. Of course, one might not be surprised by this conclusion if one thinks that the minimum
wage has been set at such a low level as to have no impact at all. But this is not the case – there do seem
to be sizeable effects on wage inequality.
The effect on wage inequality
It is clear that a minimum wage will raise the pay of those who had previously been paid below that rate,
assuming that compliance with the minimum is generally very high, as indeed evidence suggests it has
been in the UK. As Figure 5 (adjusted from analysis by the LPC), shows, the UK hourly wage distribution
has changed shape markedly in response to the minimum wage. There is now an abrupt cut-off at the
bottom of the distribution of UK hourly earnings, replacing what was formerly a slow gradation down to
extremely low levels of pay.
4 Low Pay Commission Report 2011, p.xi 5 Low Pay Commission Report 2011, p.x

Resolution Foundation Page 7
Figure 5: Impact of the minimum wage on the UK pay distribution Hourly earnings distribution for employees aged 22 and over by 25 pence band
Source: Low Pay Commission, current prices
With this effect being beyond dispute, a more interesting question is whether the minimum wage also
pushes up the earnings of employees on higher wages. Given the estimate (reported earlier) that fewer
than five percent of workers are paid at or around the minimum wage, one might think its introduction
would have had only a minimal effect on wage inequality. What does the evidence say? The first studies
of the impact of the minimum wage, conducted soon after its introduction, did indeed show little or no
‘spillover’ impact higher up the distribution.6 Current research, however, suggests that the later impact of
the minimum wage, after its value was increased towards 50 percent of the median wage, may have been
larger.7 This wider context is best shown by looking at the evolution of wage inequality in the UK. Figure 6
reports three conventional measures: the ratio of the 90th to 50th percentile of the wage distribution (this
refers to wage inequality within the top half of the wage distribution and is unlikely to be affected by the
minimum wage), the ratio of the 50th to 10th percentile and the ratio of the 50th to the 5th percentile.
6 (Dickens and Manning 2004a, b) 7 (Butcher, Dickens and Manning, 2011)
1997
2010
0%
1%
2%
3%
4%
0 2.5 5 7.5 10 12.5 15 17.5 20 22.5 25 27.5 30.00+
Pe
rce
nta
ge o
f jo
bs
Gross hourly pay excluding overtime (£)

Resolution Foundation Page 8
Figure 6: Key measures of wage inequality in Britain Hourly wage ratios, 1975-2010
Source: Butcher, Dickens and Manning (2011)
As can be seen, the 50:5 and 50:10 ratios both rose sharply in the 1980s, along with the 90:50, as
inequality fanned out across the entire earnings distribution. In the 1990s both then began to stabilize,
before falling from the late 1990s onwards, a fall that coincided with the introduction of the NMW. We
would expect this direct impact in the case of the 50:5 ratio; as we have seen, just under 5 percent of
employees are on or just above the minimum wage, and so the 5th percentile is most directly affected.
However, for the same impact to be seen on the 50:10 ratio would imply some ‘spillover’ effect. That is,
workers on wages quite some distance above the minimum wage appear to have seen their wages rise, as
firms have responded by—to some degree—maintaining pay differentials among low wage workers.
It is of course possible that the fall seen in the 50:10 ratio was the result of other factors which drove
down wage inequality at the bottom. Other evidence, though, supports the view that the minimum wage
has been key to this decline. Figure 7 looks at different areas in the UK, plotting the median wage in 1998
against the change in the value of the 10th percentile wages from 1999 to 2010. If the minimum wage had
exerted an impact on the 10th percentile we would expect a bigger rise in the 10th percentile in low-wage
areas of the UK – that is, areas in which the minimum wage has more bite. As the lines on the chart show,
this is exactly what we see: bottom half inequality fell faster in regions in which more people are paid the
minimum wage.
Log 90-50
Log 50-10
Log 50-5
0.4
0.5
0.6
0.7
0.8
19
75
19
77
19
79
19
81
19
83
19
85
19
87
19
89
19
91
19
93
19
95
19
97
19
99
20
01
20
03
20
05
20
07
20
09

Resolution Foundation Page 9
Figure 7: Impact of the minimum wage by region Change in the log 10th percentile wage1999-2010 against 1998 median wage in region
Source: Butcher, Dickens and Manning (2011) from ASHE data.
Other comparisons of the bite of the minimum wage also support this conclusion. The NMW, for example,
affects more women than men and the fall in the 50:10 ratio has been larger among women than men. In
sum, there is good reason to believe that, although only small numbers of adults are actually paid the
minimum wage, the policy has more pervasive effects on the wage distribution than this might imply.
Other research supports this conclusion, suggesting that the impact of the minimum wage likely tails off
to zero only at around the 20th percentile of the earnings distribution.8
What lessons can we learn?
So far, so good; the minimum wage has had a positive effect on low wages and earnings inequality in the
bottom half while having little or no recognizable negative effect on employment. Given this, a more
interesting question is: why has the minimum wage had no effect on employment? One answer to this
question is that the minimum wage has two counterbalancing effects. On the one hand, it raises labour
costs for employers, thereby having a potentially dampening effect on employment. On the other hand, it
raises pay for employees, increasing the incentive to work. We might think, therefore, that these positive
impacts on the supply of labour have offset (and in some cases more than offset, with some evidence
suggesting the NMW has had a positive impact on employment) any negative effects on employer-
demand for labour. That said, we are unlikely ever to know the whole story; the overall impact of a
minimum wage on employment is the complex result of impacts on labour costs, productivity, labour
supply, and a large number of other factors.
Standing back, then, what does the first thirteen years of the minimum wage tell us about how the
minimum wage might be used in the coming years to ease the squeeze on living standards? With no
adverse effect on employment detected, one might be tempted to conclude that we should continue to
push the NMW up at a faster rate than average earnings. Unfortunately, though, we need to be more
circumspect. The evidence tells us little about what would happen were we to go significantly further in
8 Butcher, Dickens and Manning (2011).

Resolution Foundation Page 10
raising the minimum wage faster than average wages. Any significant increase in the standard national
rate would be something of a leap into the unknown.
The next section therefore looks beyond the UK’s NMW history to explore two other sources of evidence
that might guide our steps: other economies with much higher minimum wages and sub-sections of the
UK labour market in which the minimum wage is very high compared to median wages.

Resolution Foundation Page 11
Section 2 – What if we were radical? Evidence on the impact of
much higher minimum wages
As we have seen above, the aggregate UK experience gives us little grounds on which to speculate about
the likely effects of a much higher minimum wage. In order to make a more informed estimate, we need
to look to labour markets in which the minimum wage is much higher than it is at present in the UK.
There are two main sources of such information. First, there are other countries in which a national
minimum wage is, or has been, much higher in relation to median earnings. Second, there are
subsections of the UK labour market in which the minimum wage has far greater ‘bite’ because the
general level of earnings is lower. In some cases this may mean specific industries or regions. In others it
may mean certain groups of workers, for example the young.
Other Countries
What lessons can we learn from other countries? Figure 8 presents the latest figures available from the
OECD on minimum wages in member countries as a percentage of median earnings for full-time workers.
The data only includes countries with a statutory minimum wage (those, like the Nordic and Germanic
economies that have a non-legislative system of minimum wages enforced through the mechanism of
collective bargaining are not included). Small variations between different countries should not be over-
interpreted because the data is sensitive to measurement issues. (Indeed the figure for the UK is lower
than that reported in Figure 1, probably because this dataset focuses only on full-time workers.) The
broader variations, though, provide a fair sense of the relative generosity of the minimum wage in each
case.
Figure 8: Minimum Wages in OECD Countries Percentage of Median Earnings for Full-time Workers
Source: OECD Labour Market Statistics, 2009
As Figure 8 confirms, the UK is mid-table when it comes to the level of the minimum wage relative to
median earnings. The UK level is in fact very similar to that in a large number of other advanced
economies, sitting within three percentage points of 12 out of the 23 countries covered in the above chart.
That said, several countries at a similar level of economic development to the UK do have much higher
minimum wages. These are the economies from which we might expect to learn something. France and
New Zealand stand out as being particularly worth further consideration, having particularly high levels of
the minimum wage, at about 60% of median earnings, while both also being broadly comparable to the
71%
60% 59%54% 54%
51% 51% 49% 48% 48% 47% 46% 45% 45% 45% 44% 44% 43% 43% 41%37% 36% 36%

Resolution Foundation Page 12
UK in terms of their level of economic development. (Turkey is at a quite different stage of development
and so is less relevant.)
What can we learn from these two examples? In the case of France, the minimum wage (known as the
Salaire Minimum Interprofessionnel de Croissance or SMIC) is notorious for being extremely high,
especially when combined with the high level of payroll taxes paid by employers. Organizations like the
OECD regularly call upon France to reduce its level. What do we see if we look for evidence on the impact
of the SMIC on employment?
The truth is that there is no high-quality study on the impact of the French minimum wage. This is largely
a consequence of the SMIC’s design rather than the failure of researchers. That’s because the SMIC is
raised each year on the basis of a complicated indexation scheme linked to the value of inflation and
earnings (though the French government also has the scope for discretionary increases). The
consequence is that the SMIC generally increases in value little by little year on year with no big jumps
(one exception took place under Miterrand in the early 1980s but at this point the SMIC was then around
current UK levels). As a result, there is no ‘big bang’ – similar to the introduction of the NMW in the UK or
the very large periodic rises in the minimum wage in the US – that provides a useful experiment for
economists to study. Overall, it is all but impossible to distinguish the impact of the SMIC from other
factors affecting labour market outcomes in France. Far from offering a salutary tale regarding the perils
of a large minimum wage, the French experience can tell us little either way. The accepted wisdom seems
to have little sound basis.
What of New Zealand? The country is also reported as having a very high current level of the minimum
wage in relation to median earnings but, unlike France, has also seen several sharp changes in the value of
the minimum wage over time, as is shown in Figure 9.
Figure 9: The Minimum Wage and Unemployment in New Zealand Percentage of median wage; percentage unemployment
Source: OECD Labour Market Statistics
What does the evidence say regarding any impact on employment? Alongside the value of the minimum
wage, Figure 9 also plots the New Zealand unemployment rate from the 1960s (when unemployment was
so low that it was said that the employment minister knew all the unemployed personally) to the period
around 1990 when unemployment hit 10 percent. Although no obvious pattern linking the minimum
Minimum wage as % of median (LHS)
Unemployment rate (RHS)
0%
2%
4%
6%
8%
10%
20%
40%
60%
80%
19
60
19
62
19
64
19
66
19
68
19
70
19
72
19
74
19
76
19
78
19
80
19
82
19
84
19
86
19
88
19
90
19
92
19
94
19
96
19
98
20
00
20
02
20
04
20
06
20
08

Resolution Foundation Page 13
wage and unemployment rates emerges, this does not tell us that there is no link between the two
variables. Instead, it suggests that, as might be expected, many other factors are at play.
That said, more detailed studies also fail to find a convincing link between the New Zealand minimum
wage and employment rates. The most robust study to date, from Hyslop and Stillman (2007), focuses on
young workers. It takes advantage of a significant change in the minimum wage for young people that
took place in New Zealand in 2001. The reforms saw the starting age for the adult minimum wage fall
from 20 to 18 years, effectively increasing the minimum wage for 18 and 19 year olds by 69 percent in the
course of just two years. It also raised the minimum wage that applies to 16 and 17 year old workers from
60 to 80 percent of the adult minimum over two years, resulting in a 41 percent increase.
Despite these very significant jumps in the value of the minimum wage for young people, the authors find
no robust evidence of a negative effect on youth employment or on hours worked. On the contrary, they
find some evidence of positive employment effects for all those in the 16 to 19 age group, with 16-17
year-olds in particular taking on more hours of paid work. They conclude that, by substantially raising
wages with no noticeable negative effect on hours or employment, the reform had a very strong net
positive impact on the earned income of young people in New Zealand.
In one sense, this study provides some reassurance of the impact of a very high minimum wage. Yet it is
important not to over-interpret Hylsop and Stillman’s results. Inferring lessons for the broader working
population from the youth labour market is fraught with difficulty (as discussed in more detail later), not
least because young people make up only a small proportion of the overall workforce and, as a result, any
increase in their wages can be more easily absorbed by employers than any hike in the adult minimum
wage.
What can we conclude overall from the experience of other countries? Certainly the evidence does not
give credence to exaggerated fears of a catastrophic effect of raising the UK minimum wage, even quite
substantially. But nor does it give us the kind of confidence we might seek in order to justify a departure
from the LPC’s gradualist approach. If the UK minimum wage were to be raised in line with the level seen
in New Zealand, this would mean an increase in its value of 30 percent. On the basis of the existing
evidence, such substantial increases, even if pursued over a few years, would need to be made
incrementally and with a great deal of caution.
Lessons from different segments of the UK labour market
We now turn to a second possible source of evidence on the impact of a much higher minimum wage:
subsections of the UK economy in which the minimum wage is very high in relation to the wider wage
distribution. What do we see when we consider the effects of the minimum wage on employment in
different regions in the UK, in different industries in the UK, and on workers of different ages?
In the case of regions, there is considerable variation in the bite of the minimum wage within the UK. For
example, the average share of UK adult workers being paid the minimum wage in 2007 was 3.8 percent
but this figure ranged from 0.6 percent in Sutton and 0.7 percent in South Buckinghamshire to as high as
11.8 percent in Derwentside and 15.2 percent in Blyth Valley. In the UK’s highest-wage areas the NMW
was equivalent to roughly 30 percent of average earnings. By contrast, in the lowest wage regions the
figure was over 70 percent. Studying the impact of regional variations within the UK should therefore give
us a good sense of what would happen if the UK minimum wage were to be raised to a much higher level.

Resolution Foundation Page 14
The answer is that there is little evidence to suggest we have yet reached the point at which the current
level of the UK minimum wage is causing unemployment in the low-wage areas of the country. Butcher
(2012) provides a useful summary of research into the impacts of the NMW on employment using spatial
data. Most studies echo Dickens, Riley and Wilkson (2009) in finding little or no statistically significant
effect on employment and this includes the lowest-wage regions. While some find studies find minor
effects in certain regions in certain years, Butcher concludes that ‘in summary the research from local area
analysis also fails to find strong evidence of any adverse employment level effects’.9
These are promising findings, though again our conclusions should be tentative. Regional labour markets
do not behave like national ones so although a regional analysis gives us little cause for concern it cannot
give us complete confidence that a hike in the national rate of the minimum wage would see no effect.
What about variations by sector? Certainly there are industries in the UK in which the minimum wage is
very high in relation to average earnings. Perhaps the most studied sector is the market for care workers
in residential homes for the elderly. As Machin, Manning and Rahman (2003) have shown, 30 percent of
workers in the residential care sector were paid below the initial 1999 minimum wage. Because of this
high concentration of low wage workers, the average increase in the pay bill required to comply with the
new minimum wage legislation was 3.6 percent, a very high figure by comparison to other industries. To
give some indication of the scale of this effect, a national minimum wage that would have affected a
similar number of adults across the UK would have been in excess of £8 per hour in 2010 (see the ready
reckoner in the Appendix). The sector therefore provides another good guide to the effects we might see
from a much higher national minimum wage.
In this case the authors do find that care homes in which the NMW had a larger impact saw falls in
employment relative to those in which the NMW had a low impact, though the size of the effect was very
modest given the size of the rise in the minimum wage. Machin and Wilson (2004) studied the impact of
the October 2001 rise in the NMW with similar conclusions. What lessons can we draw from this finding?
It is important to note the particularities of the social care industry. With much of their funding coming
from government in relatively inflexible grants, care homes are a poor analogy for private businesses.
Unable to pass on increases in costs in prices, but often able (in owner-managed homes) to substitute
owner labour for other workers , it is not surprising if rising unit labour costs result in lower employment.
Moreover, it is worth restating that the relative NMW rate at which effects have been seen in the care
industry is far higher than the level of the current UK minimum wage.
What about age? Internationally, it is common for minimum wages to have more ‘bite’ on the youth
labour market than the adult market. This pattern is even more marked in countries like the US, in which
there is essentially no separate lower minimum wage for youth. Although one thinks of the US as a
country with a generally low level of the minimum wage (see Table 1 above) the 2012 Statistical Abstract
of the United States reports that 15 percent of those aged 16 to 24 are paid at or below the federal
minimum wage. Even in countries like the UK where the minimum wage is lower for young workers, the
impact is also far higher among the young than among older workers. Figure 10 shows the UK NMW for
those aged 18 to 21 as a percentage of median earnings in this group. It confirms that that the minimum
wage is a much higher fraction of median earnings among the young than among older workers, having
risen from 65 percent in 1999 to over 75 percent in 2010 (compared with the figures of 46 percent and 52
percent set out in Figure 1).
9 Butcher (2012) p.34

Resolution Foundation Page 15
Figure 10: Minimum Wage for young people over time Percentage of Median Hourly Earnings for those aged 18-21 inclusive
Source: Butcher, Dickens and Manning (2011) from ASHE data
Unsurprisingly, the NMW also has far more bite when we look at the fraction of young workers paid the
minimum wage as compared to adults. Having said that, as Figure 11 shows, the overall proportion paid
the minimum wage remains fairly small – around 4 percent of 18 to 21 year olds are paid precisely the
NMW, around 2 percent below and around 2 percent within 10p of the NMW hourly rate.
Figure 11: Bite of the minimum wage for young people Proportion of 18-21 year-olds paid below, at or close to the Minimum Wage
Source: Butcher, Dickens and Manning (2011) from ASHE data
Because of its high level among young workers, much of the research into the employment effects of the
US minimum wage is focused on teenagers. As such, these studies essentially focus on specific labour
markets with very high minimum wages. In general, although there is controversy on the topic, such
studies tend to show that the employment effects of the US minimum wage on young workers are small.
As noted above, we should be cautious about generalizing this conclusion to the wider population. Except
in a very few industries, young workers are a very small fraction of the wage bill. Moreover, since teenage
workers later become adult workers, employers seeking to build long-term employment relationships may
60%
65%
70%
75%
2000 2001 2002 2003 2004 2005 2006 2007 2008 2009 2010 2011
earning NMW
earning below NMW
earning within 10p of NMW
0%
1%
2%
3%
4%
2000 2001 2002 2003 2004 2005 2006 2007 2008 2009 2010 2011

Resolution Foundation Page 16
be prepared to absorb an increase in wage costs in the early years. It would be risky to extrapolate from
the impact of high minimum wages on the youth labour market to the consequences of a similarly high
minimum wage being applied to the adult labour market.

Resolution Foundation Page 17
Section 3 – Options for more radical reform
What can we conclude from our summary of the evidence on the likely effects of a big increase in the
minimum wage? On the one hand we can be optimistic: there is no evidence to support alarmist claims
that raising the minimum wage faster than average earnings would necessarily and substantially harm
employment. On the other hand, we cannot be entirely confident that negative employment effects
would not occur. Moreover, the current policy of pursuing very small annual increases in the NMW means
we have reached a point where we are not learning much more about the employment impact. For all
that we might want to explore the positive impacts of a higher national minimum wage, this lack of
certainty and evidence should worry us. If our aim is to raise the living standards of low to middle income
households, a negative impact from the NMW on employment—which, were one to occur, would
disproportionately affect jobs at the lower end of the labour market—could have a substantial negative
effect.
This chapter therefore builds on the findings set out above by asking a further question: if one is nervous
about arguing for a general rise in the minimum wage (especially in the current climate) but is also
concerned that we may not have reached the limits of the good that the national minimum wage could do,
then what are the options for future reform? We consider the idea of introducing more variation in the
minimum wage in order to increase its impact where it is currently very low, as well as bolstering the
mandatory minimum with a more developed infrastructure to change pay norms.
These ideas are interesting not just because they provide a middle option between a nationally higher
rate and doing nothing, but also because of the more general limits of a strategy that is largely dependent
on a single, national minimum wage. This becomes clear when we consider the way in which today’s
minimum wage has impacted on the UK distribution of earnings—raising wages substantially at the very
bottom but only moderately higher up. An indirect implication of this fact has been that, as wage
differentials have compressed at the bottom of the distribution, some employers have reduced the
number of different occupations in their business, for example removing intermediate job tiers in
between entry level supervisory and managerial roles.
If we are thinking about a world in which the minimum wage does far more work in raising the earnings of
a far greater number of people, the blunt nature of these effects may well inhibit how far we could go.
This puts the onus on thinking about more sophisticated tools than a simple national minimum. Put
another way, the reasons for considering more variation in the minimum wage are not all about being
cautious—there is also an argument for opening up more opportunities to be ambitious with wage policy
over the longer term in a way that continues to limit the risk of surprising negative effects.
For these reasons, this section examines three promising options for reform of the UK minimum wage:
1. A premium minimum wage for adults above a certain age
2. Regional variation in the value of the minimum wage
3. The use of the minimum wage infrastructure to put broader upward pressure on pay norms
(1) A premium minimum wage for older adults?
Discussions over how the minimum wage should vary with age have traditionally focused on having lower
minimum wages for those below the age of traditional adulthood. For this reason, and because young

Resolution Foundation Page 18
workers earn much less than older workers, the UK NMW has a lower rate for those under 21 (formerly
22). This aspect of the NMW’s design helps to reduce the relative generosity of the minimum wage for
young people for whom, as we have seen, it is far higher than for adult workers relative to the average
wage. Nonetheless, even after the age of 21 there is considerable variation in the general level of wages
and the impact of the minimum wage. In other words, the motivation for a lower youth minimum does
not disappear once workers turn 21. Indeed, in some countries e.g. the Netherlands, the adult minimum
does not apply until the age of 25.
The result of the UK’s current approach is that, as Figure 12 confirms, the fraction of adults paid at or
below and near the minimum wage varies very substantially with age. Among 22 year olds, around 10
percent of workers are paid at or below the NMW. This figure then falls sharply with age before flattening
out at around 3 percent in the late 20s. One implication of this fact is that around one-third of all those
paid the NMW are under 30, while only 20 percent of the adult workforce as a whole falls into this age
group.
Figure 12: The Variation in the Incidence of the NMW by Age Percentage of workers in each category
Source: Butcher, Dickens and Manning (2011)
These distributional aspects of the current minimum wage policy are important when it comes to
targeting the low to middle income group. In particular, with many of the beneficiaries of today’s
minimum wage being young people in full-time higher education and/or living with their parents, the
system—although by definition well targeted at low paid individuals—is not particularly well targeted at
low income households. A higher minimum wage for older workers, perhaps those aged over 30, could
quite significantly improve this focus. Figure 13 makes this point clear by plotting, for workers within 10
percent of the adult minimum wage (and who report an hourly wage rate), the fraction that are the head
of a household or their partner, or the child of the head of a household. Older minimum wage recipients—
even those at age 25 and above—are very substantially more likely to run their own household. Among 22
year-olds, over 40 percent of minimum wage workers are the children of the head of a household. This
proportion falls to around 10 percent by age 30, while the proportion of minimum wage workers who are
the head of household or their partner rises from about 40 percent at age 22 to over 80 percent at age 30.
At or below NMW
within 10p of NMW
0%
5%
10%
15%
20%
25%
22 24 26 28 30 32 34 36 38 40Age

Resolution Foundation Page 19
Figure 13: The Household Status of Minimum Wage Workers by Age Percentage of households in each category
Source: Author’s Computations, Labour Force Survey
An additional concern around targeting is the extent to which the minimum wage raises the incomes of
parents with young children. Figure 14 shows that the number of children living in households containing
one or more minimum wage workers also varies very significantly with the age of those workers.
Households with a 22 year old minimum wage worker contain, on average, 0.5 children. This figure rises
only slightly in households in which the 22 year old is the head of household or the partner of the head of
household. At age 30, by contrast, the number of dependent children in the household rises to an
average of 1.5. A higher minimum wage for older workers would therefore benefit children living in low
income households more effectively than a higher general minimum wage.
Figure 14: The number of children in minimum wage households Average number of children under 19 in the households of minimum wage workers by age
Source: Author’s computations, Labour Force Survey.
There is, then, a fairly strong argument for raising the minimum wage for older workers. What level
would be reasonable? The ready reckoner provided in the Appendix shows that in 2010 if one wanted 5
percent of those aged over 30 to be paid the minimum wage, the appropriate level would have been
Head of Household or
Partner
Child of Head of Household
Other
0%
20%
40%
60%
80%
100%
22 24 26 28 30 32 34 36 38 40Age
All workers within 10% of
NMW
All workers within 10% of NMW who are HoH or Partner
0.40
0.60
0.80
1.00
1.20
1.40
1.60
1.80
22 24 26 28 30 32 34 36 38 40
Ave
rage
nu
mb
er o
f ch
ildre
n
Age

Resolution Foundation Page 20
£6.05, only around 4 percent higher than the national adult minimum wage at the time of £5.80. Were the
rate to be set higher, say at £6.50, around 10 percent of adults aged over 30 would be directly affected (as
of April 2010). Overall, our ready reckoner suggests that the difference in the earnings distributions
among older workers is not so dramatic as to support a much higher minimum wage without affecting a
much higher proportion of workers over 30 than are currently paid the NMW.
In all, then, the opportunity of raising the NMW for older workers might seem small. Yet it is important to
note that income from paid work makes up a very significant proportion of household income for workers
on the minimum wage. For example, wages make up around two thirds of household income in
households where a minimum wage worker is aged 30 or above. Boosting the minimum wage by figures in
the region of 5 to 10 percent could therefore have a non-trivial effect on material wellbeing when set
against alternative policy solutions, such as providing additional support through the tax-benefit system.
What would be the risks of a higher minimum wage for older workers? Chiefly the fact that such a rate
could make older workers less competitive relative to younger workers in the labour market. In the
present climate, with youth unemployment is so high and much talk of a ‘lost generation’, this may be a
blessing in disguise. Longer term, this trade-off would need to be monitored carefully just as the LPC
already carefully monitors existing rates of the minimum wage.
(2) A Premium for London
Given regional variation in wages across the UK, another way of varying the rate of the NMW worth
considering is a higher rate in certain regions. In reality, for reasons of simplicity and enforcement, we
would be unlikely to want to introduce a significant number of different regional rates. The best approach
to regional variation would likely be a two-level minimum wage with a higher level for London and the
wider South East. This region has quite significantly higher wages than others and so one might think
could support a higher minimum. That leaves the critical question of where the border to such a region
would be set. It is probably these practical difficulties that have prevented any regional variation to date.
These problems have a number of aspects.
The obvious difficulty is that at the border of a minimum wage region there would be sharp differences in
the minimum wage, with employers on one side of a street facing a different rate from those on the other.
This, one can imagine, could cause perverse incentives. How worried should we be about the practicality
of different minimum wages on different sides of the street? The US example should reassure us. There,
individual states are free to set their own minimum wage above the federal minimum, with many
exercising this right, especially as the federal minimum has eroded in value over time. This leads to sharp,
often large discontinuities (in some cases of 20 percent or more) in minimum wages at state lines. Indeed,
much research focuses on precisely this variation (see Dube, Lester and Reich, 2010, 2011) and does not
identify major problems. Moreover, a number of cities have also now introduced living wage ordinances,
meaning additional discontinuities.
Of course, US states are dissimilar in many ways from UK regions like the southeast or London. US states
are clearly defined political identities with a long tradition of autonomy in many areas, meaning that
discontinuities in wage rates run alongside others in relation to tax and employment law. This
environment does not translate readily to the UK although, in the past, there were differences in business
rates across local authorities.10 Overall, it seems unlikely that a regional minimum would present
insurmountable practical difficulties. Though drawing any border would prove contentious, some existing
10 Duranton, Gobillon and Overman, 2011

Resolution Foundation Page 21
structures, such as the Market Forces Factor used by government to estimate regional variation in labour
costs, could perhaps be used.
How much variation might be appropriate in the case of a higher London minimum wage? The ready
reckoner in the Appendix shows that the difference in the wage distribution between London and the rest
of the UK is far larger than the difference between people in their 20s and 30s discussed above. In 2010
the 5th percentile of the hourly wage distribution outside London was around £6.00 but in London it was
£6.40, roughly 7 percent higher. With a NMW set at £5.80 in 2010, this level of differential would have
suggested a minimum wage of about £6.20 for London. This suggests there is scope for firms in London to
pay more than the NMW without employment effects. Of course, although one could take a statutory,
compulsory approach to raising the NMW in London, one could also think about a voluntarist approach,
similar to that pursued by the campaign for the living wage.
(3) Learning lessons from the living wage?
This brings us onto a third way in which to achieve a broader impact through the existing architecture of
the minimum wage. An increasingly popular (and probably the most exciting current) idea relating to
wage policy is that of the ‘living wage’, based on the notion that “work should bring dignity and should
pay enough to provide families the essentials of life”11. London Citizens started a Living Wage campaign in
London in 2001 and have chalked up a considerable number of successes with a wide variety of employers
(from banks in Canary Wharf to universities to the GLA and the London Olympics) voluntarily signing up to
a commitment to pay a computed level of the living wage. The living wage for London is currently £8.30
per hour, 36 percent higher than the NMW of £6.08 per hour.
Following on from this success Citizens UK launched the Living Wage Foundation in 2011 with the aim of
computing, on a consistent basis, a living wage for the UK (linked to work by Professor Donald Hirsch on a
‘Minimum Income Standard’), and to campaign for its adoption by employers. The various living wage
campaigns have been amongst the most successful examples of grassroots community organizing in
recent years. Given their success it is natural to ask whether our approach to the minimum wage could
learn from the non-mandatory nature of the living wage.
Before considering this approach it is worth reflecting on the idea of the living wage, which remains poorly
understood in terms of both its true impact on household living standards and in terms of its relationship
to the minimum wage. The living wage differs in three important ways from the NMW, the first two of
which are fairly simple. First, the level is much higher—following our discussion above, it should be clear
that the proposed levels of the living wage would, if implemented as a national mandatory minimum
wage, take minimum wages in the UK to be the highest in the OECD, risking job losses that would cancel
out any benefit for the living standards of affected workers. Second, (and in part for this reason), the living
wage takes a non-mandatory approach rather than an approach of compulsion. Only employers who feel
they can afford it agree to pay the Living Wage.
The third difference between the living wage and NMW has wider implications: the difference in their
method of computation. Although the LPC does not follow an explicit principle in its deliberations over the
value of the NMW, in practice its decisions balance the benefits of a higher minimum wage against the
dangers of job losses if minimum wages are set too high. The result is that the level of the minimum wage
itself takes into account the essential trade-off that is at the heart of a NMW—between higher wages and
11 Hirsch and Moore (20011, p4)

Resolution Foundation Page 22
higher employment. One consequence of this approach is that it naturally leads to a minimum wage being
indexed, albeit implicitly rather than explicitly, to the general level of earnings rather than prices.
In contrast, the living wage (in its most widely acknowledged form) is based on a calculation called the
Minimum Income Standard (MIS). The MIS is computed by asking members of the public their views about
the consumption necessary to provide an adequate standard of living in modern Britain. In this way, a
minimum basket of goods is determined for different family types and then converted into a single hourly
wage.12 Differences in the cost of living across regions mean that the result—the value of the living
wage—is higher in London than elsewhere. One consequence of this methodology is that the living wage
is linked to prices rather than earnings. An earnings link will arise only if the public’s view of an acceptable
standard of living changes in line with the general level of pay. This fact is important because, over the
medium term, earnings rise faster than prices.13
In light of this approach, it is worth reflecting on one common narrative about the living wage—that, by
guaranteeing a minimum standard of living, a living wage can take over from the role currently played by
key parts of the welfare state and, in particular, the role played by tax credits. In some cases, this claim
takes the form of an argument that such cash transfers are ‘subsidies’ for low wages which would be
better replaced by a living wage, ensuring that people in work don’t need additional support in order, for
example, to raise a family.
It is important to realize that it is, in practice, impossible for the living wage to achieve what it says on the
tin—namely guaranteeing a minimum standard of living for all families. Although higher hourly wages
could of course raise living standards, a household’s standard of living is determined not only by the
hourly wages its members earn but also by how many earners there are in the household, by how many
dependents there are, and by how many hours are worked. An hourly wage could only account of these
facts if it varied on the basis of all these factors. It is for this reason that tax credits and other welfare
benefits, which vary in precisely this way, play a vital role in supporting living standards of low income
families, a role that an hourly wage—whatever its rate—could never play. Indeed, the methodology used
to compute the living wage assumes the continued existence of welfare benefits for low-income
households. For example, the living wage for London, calculated by the Greater London Authority at £8.30
in 2011, would have been £10.40 if means-tested benefits did not exist.14
Whatever our strategy on minimum and living wages, therefore, the welfare system is likely to remain a
more effective mechanism for delivering a minimum standard of living for families. Yet despite these
limitations, the living wage retains some very attractive features. It encapsulates the principle of a ‘fair
day’s pay for a fair day’s work’ in a way the minimum wage does not, a principle which resonates widely.
This emotional appeal makes it a useful campaigning tool. Its voluntarist approach also makes the living
wage a useful complement to a statutory NMW. As has been pointed out, the NMW is, in some ways, a
blunt weapon, and a weapon whose effects are limited in an economy in which we know well that many
employers can afford to pay more.
What lessons can we draw from the living wage for our approach to the minimum wage given these
limitations and strengths? One approach worth considering would be doing more to encourage employers
to voluntarily pay the living wage, for example by offering them some sort of accreditation when they do.
12 see http://www.minimumincomestandard.org/downloads/2011_launch/MIS_report_2011.pdf for the latest computations 13 Though at the present time prices are, unusually, rising faster than earnings 14 GLA Economics A fairer London: The 2011 living wage in London, 2011

Resolution Foundation Page 23
Another approach would be to use the tool of public sector wage policy. Should the public sector lead by
example and pay all its workers (or even workers for firms on public sector contracts) the living wage?
This would be extremely difficult in the current climate. Although, on the one hand, there is a strong case
for ensuring that the public sector is a model employer, it is problematic if the public sector offers terms
and conditions of employment in excess of those on offer in the private sector. In the current fiscal
climate, public money spent on higher pay is likely to mean job losses and cuts to key services.
A more promising approach might therefore be to extend the remit of the LPC to take a non-binding
judgment on affordable wages, possibly by sector. In its current negotiations over the level of the NMW,
the LPC is rightly constrained by the lowest common denominator - because of concern about job losses
in the social care sector, for example, the LPC sets a minimum far below the level that would cause job
losses in the finance sector. One option would be for the LPC to continue with this approach but to also
make an additional judgment, informed by commissioned research, on rates that might be sustainable
without job losses in major sectors. Such a judgment—on the ‘affordable’ minimum wage in each sector—
would be non-binding but could help to strengthen the arm of employees in securing pay deals above the
minimum wage. As well as helping to change pay norms, it would also encourage a more active strategy of
raising the performance of sectors locked into a dependence on low wage work (in other words, sectors in
which the affordable wage is lowest). Such sectors would be a good target for skills strategies, for example,
seeking to lift the floor of the minimum wage that is viable at the national level. It is, of course, important
to recognize that such sectoral recommendations on affordable wages would be only as good as the
underlying analysis and that the administrative challenges posed would be considerable.

Resolution Foundation Page 24
Conclusion
The minimum wage has undoubtedly been a success. It has won widespread political support, is hugely
popular among the public and—even though a surprisingly small fraction of workers are paid it—seems to
have had more pervasive effects on wage inequality than one might expect. It has done so without any
clear adverse effect on employment. Yet despite this success, we have found ourselves in a strange
position of conservatism. Our immediate caution owes much to the gloomy economic circumstances. Yet
even with forecasts now suggesting an unprecedented sustained squeeze on earnings—even after growth
returns—there has been surprising little suggestion of a more ambitious, long-term strategy for how we
might use the NMW, one of few proven tools to raise low end wages, once economic growth returns.
How can we break this stalemate? On the one hand, the LPC must be right to see a large rise in the
minimum wage as a leap in the dark. Experience from other countries and from parts of the UK labour
market does not provide much helpful guidance about what to expect in terms of employment effects.
That said, evidence also belies alarmist claims that mass job losses would inevitably arise from any
significant increases in the national rate. Weighing up this evidence overall, it seems that if the NMW is to
be retained in its current form, a reasonable middle ground would be to link its value, implicitly or even
explicitly, to growth in the value of median earnings.
But perhaps the current form of the NMW needs changing. It may be that, given the challenges we now
face to living standards, we now need to revisit some of the key debates about design. Here, we have
considered some alternatives. The idea of introducing a premium NMW for older workers, for example
those over 30, has merit. This would have the added benefit of making the minimum wage somewhat
better targeted on low-income households. The downside is that older workers do not earn so much
more (at the lower percentiles of the distribution) than younger workers, meaning that any adult
premium minimum would be not be much higher than the current adult NMW.
The second possibility we have considered is a higher minimum wage for London. Earnings in London are
much higher than in the rest of the UK so the current NMW has less impact in London than it might. A
higher rate in this region could lift the wages of large numbers of workers. Although there would be
practical difficulties there is little reason to think they would be insurmountable.
Finally, we have considered what could be learned from the approach of the living wage. As we saw, the
method of computing the living wage delivers a number that is far too high to be considered as a national,
mandatory minimum wage. A narrative that views a living wage as an alternative to existing support
through the welfare system, in particular tax credits, overlooks the fact that an hourly wage for individual
workers can never guarantee a minimum standard of living at the household level, where living standards
depend on the hours of work and the number of children. That said, these limitations take nothing away
from the fact that higher hourly wages would help to raise household income. The living wage campaign
has demonstrated the virtues of a voluntarist approach. There may be a case for doing more to leverage
the authority of the LPC to change pay norms. Asking the LPC to take a judgment on non-mandatory
‘affordable’ minimum wages in different sectors might be one way of raising the pressure on employers
who pay unnecessarily low wages, as well as shining a light on sectors of our economy that are dependent
on unsustainably low levels of pay.

Resolution Foundation Page 25
Appendix Figure 15: A ready-reckoner for the impact of different minimum wage levels for adults The percentile of the wage distribution that equates to different hourly levels of the minimum wage
Source: Butcher, Dickens and Manning (2011) from ASHE data Note: this refers to April 2010 the latest data available for analysis. The lowest point on the vertical axis is £5.80 per hour, the prevailing level of the NMW. The other horizontal line is at £7.60 the level recommended by the Minimum Income Standard.
All Adults
Aged 30+
London
5.50
6.00
6.50
7.00
7.50
8.00
8.50
9.00
9.50
0 2 4 6 8 10 12 14 16 18 20
Ho
url
y W
age
Percentile

Resolution Foundation Page 26
Bibliography
Butcher, Tim, Richard Dickens and Alan Manning (2011) “The Impact of the National Minimum Wage on
the Wage Distribution”, Research report for the Low Pay Commission, Low Pay Commission, University of
Sussex and London School of Economics
Butcher, Tim, “Still evidence-based? THe role of policy evaluation in recession and beyond: the case of the
National Minimum Wage”, National Institute Economic Review, No 219, January 2012
Dickens, Richard and Alan Manning (2004a) “Has The National Minimum Wage Reduced UK Wage
Inequality?”, Journal of the Royal Statistical Society Series A, 167, 613-626.
Dickens, R and Dolton, P (2011) “Using wage council data to identify the effect of recessions on the impact
of the minimum wage”, Research report for the Low Pay Commission, University of Sussex, Royal
Holloway and London School of Economics
Dickens, Richard and Draca, Mirko (2005), "The Employment Effects of the October 2003 Increase in the
National Minimum Wage," CEP Discussion Papers dp0693, Centre for Economic Performance, LSE
Dickens, Richard and Alan Manning (2004b) “Spikes and Spill-overs: The Impact of the National Minimum
Wage on the Wage Distribution in a Low-Wage Sector”, Economic Journal Conference Papers, 114, C95-
C101
Dickens, Richard, Riley, Rebecca and Wilkinson, David (2009) “The employment and hours of work effects
of the changing national minimum wage”,Report for the Low Pay Commission, Centre for Economic
Performance, London School of Economics and University of Sussex, National Institute of Economic and
Social Research
Dube, Arindrajit, T. William Lester and Michael Reich (2010) “Minimum Wage Effects Across State
Borders: Estimates Using Contiguous Counties”, Review of Economics and Statistics, October 2010.
Dube, Arindrajit, T. William Lester and Michael Reich (2011) “Do Frictions Matter in the Labor Market?
Accessions, Separations and Minimum Wage Effects”, IZA Discussion Paper.
Duranton, Gilles, Gobillon, Laurent and Overman, Henry G., (2011) “Assessing the Effects of Local
Taxation Using Microgeographic Data”, Economic Journal, 121, 1017-1046.
Experian Business Strategies (2007), Investigating the sectoral and regional effects of the 2003 and 2004
National Minimum Wage upratings, Research report for the Low Pay Commission
Hirsch, Donald and Rhys Moore (2011) “The Living Wage in the UK: Building on Success”,
http://www.minimumincomestandard.org/downloads/livingwage/The-Living-Wage-in-the-United-
Kingdom-May-2011.pdf
Hyslop, Dean and Steven Stillman (2007) “Youth minimum wage reform and the labour market in New
Zealand”, Labour Economics, 2007, 201-230.
Resolution Foundation Page 27
The National Minimum Wage, the reports of the Low Pay Commission Report (2000 – 2011)
Manning, Alan, Stephen Machin and Lupin Rahman (2003) “Where the Minimum Wage Bites Hard: The
Introduction of the UK National Minimum Wage to a Low Wage Sector”, Journal of the European
Economic Association, 1, 154-180.
Machin, Stephen J. and Wilson, Joan, (2004) “Minimum Wages in a Low-Wage Labour Market: Care
Homes in the UK” Economic Journal, 114, C102-C109.

Resolution Foundation Page 28

The Resolution Foundation The Resolution Foundation is an independent research and policy organisation. Our goal is to improve the lives of people with low to middle incomes by delivering change in areas where they are currently disadvantaged. We do this by: - undertaking research and economic analysis to understand the challenges facing people on a low to middle income; - developing practical and effective policy proposals; and - engaging with policy makers and stakeholders to influence decision-making and bring about change.
For more information on this Briefing Note contact: James Plunkett Secretary to the Commission on Living Standards [email protected] 020 3372 2956