Embed Size (px)
Citation preview
MINIMUM SIZE LIMITS FOR YELLOWPERCH (PERCA FLAVESCENS) IN
WESTERN LAKE ERIE
WILBUR L. HARTMANGreat Lakes Fishery LaboratoryU.S. Fish and Wildlife Service
1451 Green RoadAnn Arbor, Michigan 48105
STEPHEN J. NEPSZYOntario Fisheries Research Station
Ministry of Natural ResourcesR.R. #2
Wheatley, Ontario, Canada NOP 2P0
and
RUSSELL L. SCHOLLOhio Department of Natural Resources
Fountain Square, Building CColumbus. Ohio 432 15
TECHNICAL REPORT NO. 39
Great Lakes Fishery Commission1451 Green Road
Ann Arbor, Michigan 48105
March 1980
CONTENTS
Abstract . . . . . . . . . . . . . . . . . . . . . . . . . . . . . . . . . . . . . . . . . . . . . . . . . . . . . . 1
Background.. . . . . . . . . . . . . . . . . . . . . . . . . . . . . . . . . . . . . . . . . . . . . . . . . . 1
Analytical approach . . . . . . . . . . . . . . . . . . . . . . . . . . . . . . . . . . . . . . . . . . . 4Delineation of the resource . . . . . . . . . . . . . . . . . . . . . . . . . . . . . . . . 4Source of data . . . . . . . . . . . . . . . . . . . . . . . . . . . . . . . . . . . . . . . . . . . 4General approach.. . . . . . . . . . . . . . . . . . . . . . . . . . . . . . . . . . . . . . . . 4
Procedures and results . . . . . . . . . . . . . . . . . . . . . . . . . . 5Growth.. . . . . . . . . . . . . . . . . . . . . . . . . . . . . . . . . . . 5Mortality . . . . . . . . . . . . . . . . . . . . . . . . . . . . . . . . . . 5Yield.. . . . . . . . . . . . . . . . . . . . . . . . . . . . . . . . . . . . . 7Average stock weight . . . . . . . . . . . . . . . . . . . . . . . 20Abrosov indicator of spawning frequency . . . . . 21
Conclusions and recommendations . . . . . . . . . . . . . . . . . . . . . . . . . . . . . . 25Special considerations . . . . . . . . . . . . . . . . . . . . . . . . . . . . . . . . . . . . . . 30Protocol for evaluating response of the resource to
experimental management . . . . . . . . . . . . . . . . . . . . . . . . . . . . . . . . 30
Epilogue.. . . . . . . . . . . . . . . . . . . . . . . . . . . . . . . . . . . . . . . . . . . . . . . . . . . ..3 1
Acknowledgments . . . . . . . . . . . . . . . . . . . . . . . . . . . . . . . . . . . . . . . . . . . . . 3 1
References.. . . . . . . . . . . . . . . . . . . . . . . . . . . . . . . . . . . . . . . . . . . . . . . . . . ..3 1
MINIMUM SIZE LIMITS FOR YELLOW PERCH (PERCAFLAVESCENS) IN WESTERN LAKE ERIE1
Wilbur L. Hartman, Stephen J. Nepszy, and Russell L. Scholl
ABSTRACT
During the 1960’s yellow perch (Perca flavescens) of Lake Erie supported a commercialfishery that produced an average annual catch of 23 million pounds, as well as a modestsport fishery. Since 1969, the resource has seriously deteriorated. Commercial landingsamounted to only 6 million pounds in 1976, and included proportionally more immatureperch than in the 1960’s. Moreover, no strong year classes were produced between 1965 and1975. An interagency technical committee was appointed in 1975 by the Lake Erie Com-mittee of the Great Lakes Fishery Commission to develop an interim management strategythat would provide for greater protection of perch in western Lake Erie, where declineshave been the most severe. The committee first determined the age structure, growth andmortality rates, maturation schedule, and length-fecundity relationship for the population,and then applied Ricker-type equilibrium yield models to determine the effects of variousminimum length limits on yield, production, average stock weight, potential egg deposition,and the Abrosov spawning frequency indicator (average number of spawning opportunitiesper female). The committee recommended increasing the minimum length limit of 5.0 inchesto at least 8.5 inches. Theoretically, this change would increase the average stock weight by36% and potential egg deposition by 44%, without significantly decreasing yield. Abrosov’sspawning frequency indicator would rise from the existing 0.6 to about 1.2.
BACKGROUND
The yellow perch (Perca flavescens) was relatively unimportant inthe fisheries of Lake Erie during the first 40 years of this century. Lakewhitefish (Coregonus clupeaformis), lake herring (Coregonus artedii),and blue pike (Stizostedion vitreum glaucum) dominated commercialharvests during that era (Baldwin and Saalfeld 1962). But by the mid-1950’s, these species had virtually disappeared as a result of intensivefishing, environmental degradation, and possibly stress from the invasionand extensive proliferation of rainbow smelt (Osmerus mordax) (Hartman1973). The commercial fishing industry then focused its efforts on theabundant walleye (Stizostedion vitreum vitreum) and yellow perch. Sportfisheries for yellow perch did not become existent until after World WarII.
1 Contribution 552, Great Lakes Fishery Laboratory, U.S. Fish and Wildlife Service, AnnArbor, Michigan 48105.
I
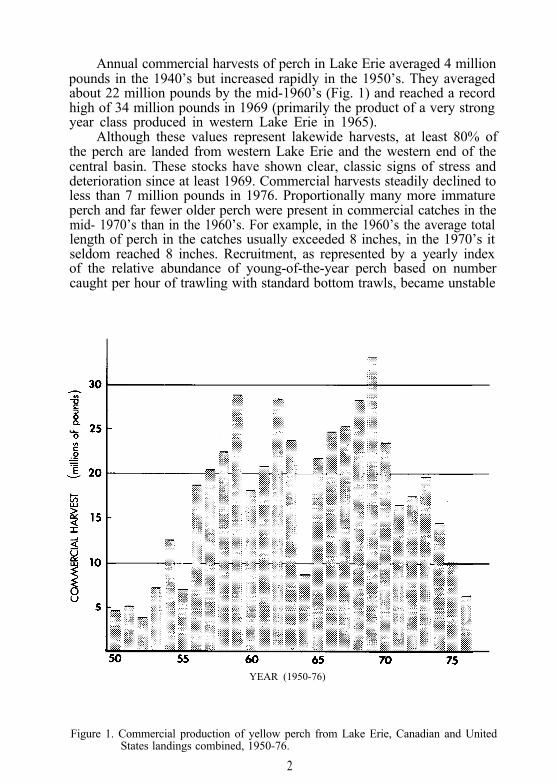
Annual commercial harvests of perch in Lake Erie averaged 4 millionpounds in the 1940’s but increased rapidly in the 1950’s. They averagedabout 22 million pounds by the mid-1960’s (Fig. 1) and reached a recordhigh of 34 million pounds in 1969 (primarily the product of a very strongyear class produced in western Lake Erie in 1965).
Although these values represent lakewide harvests, at least 80% ofthe perch are landed from western Lake Erie and the western end of thecentral basin. These stocks have shown clear, classic signs of stress anddeterioration since at least 1969. Commercial harvests steadily declined toless than 7 million pounds in 1976. Proportionally many more immatureperch and far fewer older perch were present in commercial catches in themid- 1970’s than in the 1960’s. For example, in the 1960’s the average totallength of perch in the catches usually exceeded 8 inches, in the 1970’s itseldom reached 8 inches. Recruitment, as represented by a yearly indexof the relative abundance of young-of-the-year perch based on numbercaught per hour of trawling with standard bottom trawls, became unstable
YEAR (1950-76)
Figure 1. Commercial production of yellow perch from Lake Erie, Canadian and UnitedStates landings combined, 1950-76.
2
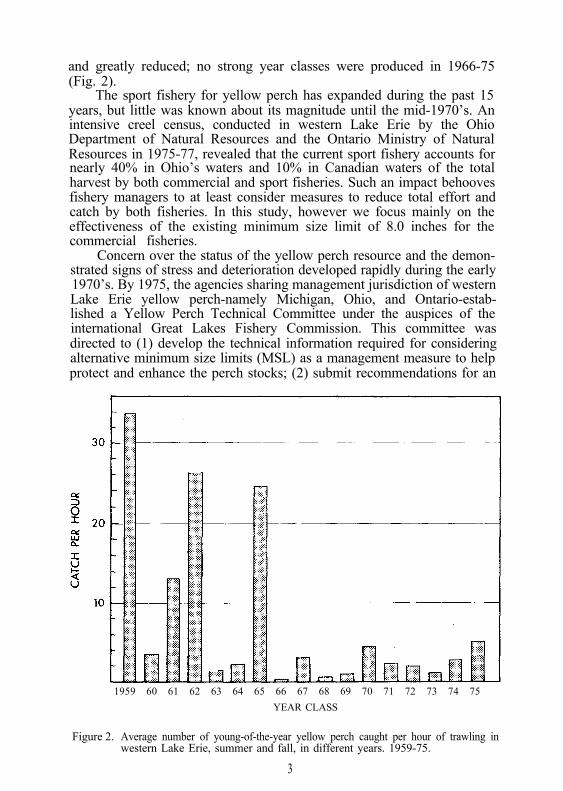
and greatly reduced; no strong year classes were produced in 1966-75(Fig. 2).
The sport fishery for yellow perch has expanded during the past 15years, but little was known about its magnitude until the mid-1970’s. Anintensive creel census, conducted in western Lake Erie by the OhioDepartment of Natural Resources and the Ontario Ministry of NaturalResources in 1975-77, revealed that the current sport fishery accounts fornearly 40% in Ohio’s waters and 10% in Canadian waters of the totalharvest by both commercial and sport fisheries. Such an impact behoovesfishery managers to at least consider measures to reduce total effort andcatch by both fisheries. In this study, however we focus mainly on theeffectiveness of the existing minimum size limit of 8.0 inches for thecommercial fisheries.
Concern over the status of the yellow perch resource and the demon-strated signs of stress and deterioration developed rapidly during the early1970’s. By 1975, the agencies sharing management jurisdiction of westernLake Erie yellow perch-namely Michigan, Ohio, and Ontario-estab-lished a Yellow Perch Technical Committee under the auspices of theinternational Great Lakes Fishery Commission. This committee wasdirected to (1) develop the technical information required for consideringalternative minimum size limits (MSL) as a management measure to helpprotect and enhance the perch stocks; (2) submit recommendations for an
1959 60 61 62 63 64 65 66 67 68 69 70 71 72 73 74 75
YEAR CLASS
Figure 2. Average number of young-of-the-year yellow perch caught per hour of trawling inwestern Lake Erie, summer and fall, in different years. 1959-75.
3
alternative MSL: and (3) recommend an assessment protocol for evaluat-ing the response of perch to such experimental management.
The choice of examining an indirect management strategy such as anincrease in MSL to reduce catch, rather than a direct strategy such as alimited quota system, was predicated on the urgency for an immediatemanagement option. But all agencies agreed that, as soon as possible,attention should be given to developing the scientific basis for implemen-ting and evaluating a direct management strategy (i.e., a limited quotasystem), in the event such a system is required to stabilize the decliningresource and to begin rebuilding it.
ANALYTICAL APPROACH
Delineation of the resource
The technical committee decided that the major portion of theresource showing signs of severe stress and the need for rehabilitationwas encompassed by the most westerly fishery statistical districts ME-1,OE-1, O-1, and 0-4 (Sandusky Bay) as described by Smith et al. (1961).The technical committee believed, however, that the methodologyemployed in this study and indeed the results, with some modificationsbased on different population characteristics, would also be applicable tomore easterly stocks of yellow perch in Lake Erie.
Source of data
Comparable data from State, Provincial, and Federal research andmanagement tiles, when available, were usually pooled. Otherwise, a dataset or display from a single agency was used as documentation when itwas accepted by all three agencies as being the most complete andreasonable representation of the particular parameters concerned.
General approachAfter establishing growth and mortality rates, based on the analysis
of pooled data, the committee used Ricker-type (Ricker 1975) equilibriumyield models to determine the effects of alternative MSL’s on yield, pro-duction, and average stock weight. Then, after establishing the fecundityrelation and the maturity schedule for females, we modified the equili-brium yield models to examine the effects of alternative MSL’s on poten-tial egg deposition. We also developed and evaluated Abrosov-typespawning frequency indicators (Abrosov 1967) for yellow perch fromwestern Lake Erie. Finally, on the basis of all these data and analyses, werecommended the most reasonable MSL for experimental management.
4
PROCEDURES AND RESULTS
Growth
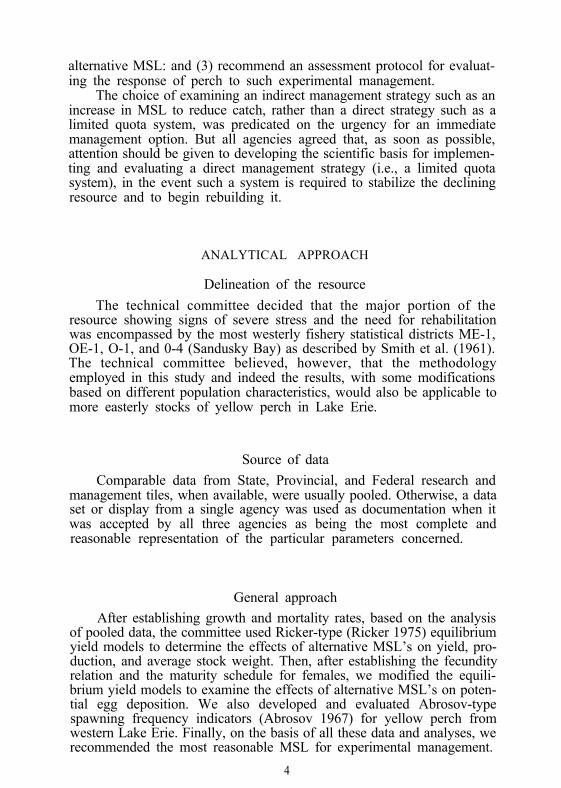
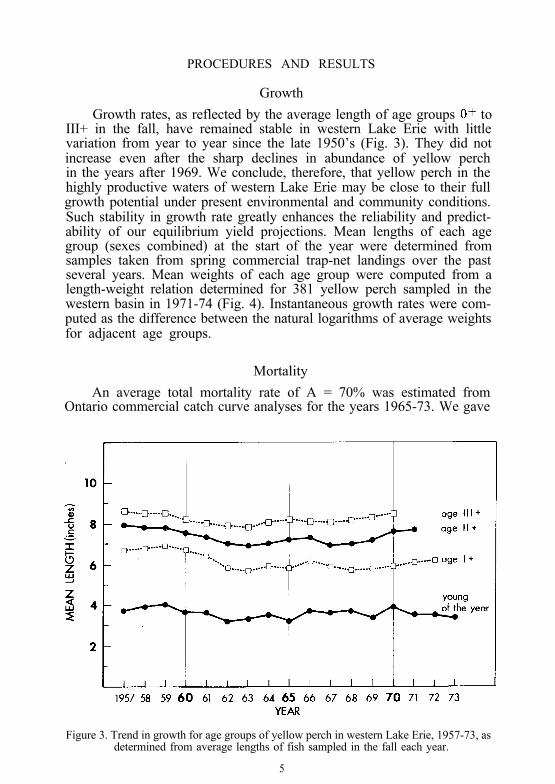
Growth rates, as reflected by the average length of age groups O+ toIII+ in the fall, have remained stable in western Lake Erie with littlevariation from year to year since the late 1950’s (Fig. 3). They did notincrease even after the sharp declines in abundance of yellow perchin the years after 1969. We conclude, therefore, that yellow perch in thehighly productive waters of western Lake Erie may be close to their fullgrowth potential under present environmental and community conditions.Such stability in growth rate greatly enhances the reliability and predict-ability of our equilibrium yield projections. Mean lengths of each agegroup (sexes combined) at the start of the year were determined fromsamples taken from spring commercial trap-net landings over the pastseveral years. Mean weights of each age group were computed from alength-weight relation determined for 381 yellow perch sampled in thewestern basin in 1971-74 (Fig. 4). Instantaneous growth rates were com-puted as the difference between the natural logarithms of average weightsfor adjacent age groups.
Mortality
An average total mortality rate of A = 70% was estimated fromOntario commercial catch curve analyses for the years 1965-73. We gave
Figure 3. Trend in growth for age groups of yellow perch in western Lake Erie, 1957-73, asdetermined from average lengths of fish sampled in the fall each year.
5
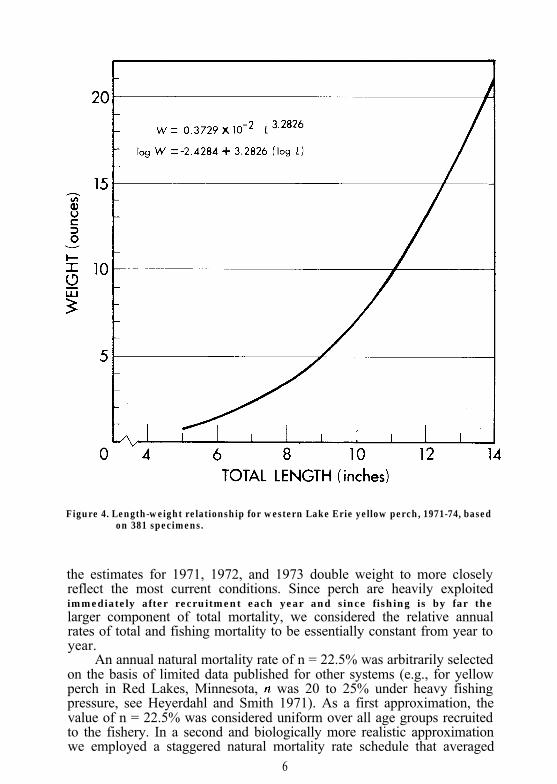
Figure 4. Length-weight relationship for western Lake Erie yellow perch, 1971-74, basedon 381 specimens.
the estimates for 1971, 1972, and 1973 double weight to more closelyreflect the most current conditions. Since perch are heavily exploitedimmediately after recruitment each year and since fishing is by far thelarger component of total mortality, we considered the relative annualrates of total and fishing mortality to be essentially constant from year toyear.
An annual natural mortality rate of n = 22.5% was arbitrarily selectedon the basis of limited data published for other systems (e.g., for yellowperch in Red Lakes, Minnesota, II was 20 to 25% under heavy fishingpressure, see Heyerdahl and Smith 1971). As a first approximation, thevalue of n = 22.5% was considered uniform over all age groups recruitedto the fishery. In a second and biologically more realistic approximationwe employed a staggered natural mortality rate schedule that averaged
6
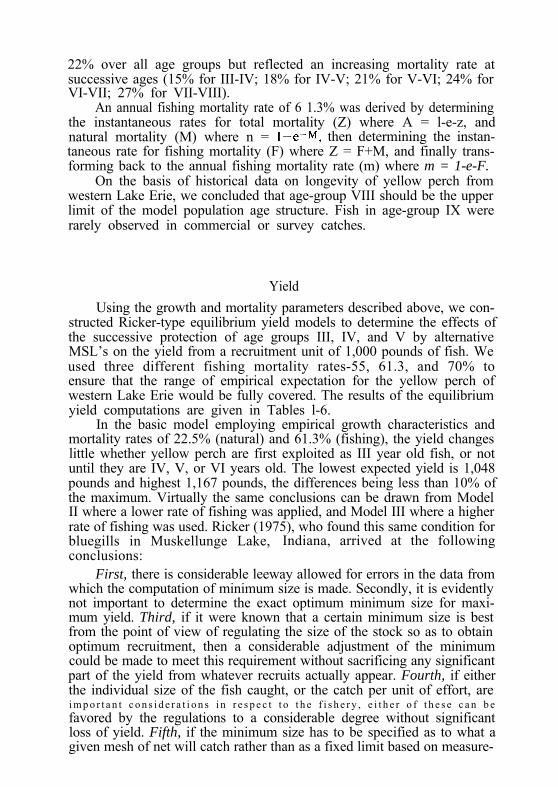
22% over all age groups but reflected an increasing mortality rate atsuccessive ages (15% for III-IV; 18% for IV-V; 21% for V-VI; 24% forVI-VII; 27% for VII-VIII).
An annual fishing mortality rate of 6 1.3% was derived by determiningthe instantaneous rates for total mortality (Z) where A = l-e-z, andnatural mortality (M) where n = I-e-M, then determining the instan-taneous rate for fishing mortality (F) where Z = F+M, and finally trans-forming back to the annual fishing mortality rate (m) where m = 1-e-F.
On the basis of historical data on longevity of yellow perch fromwestern Lake Erie, we concluded that age-group VIII should be the upperlimit of the model population age structure. Fish in age-group IX wererarely observed in commercial or survey catches.
Yield
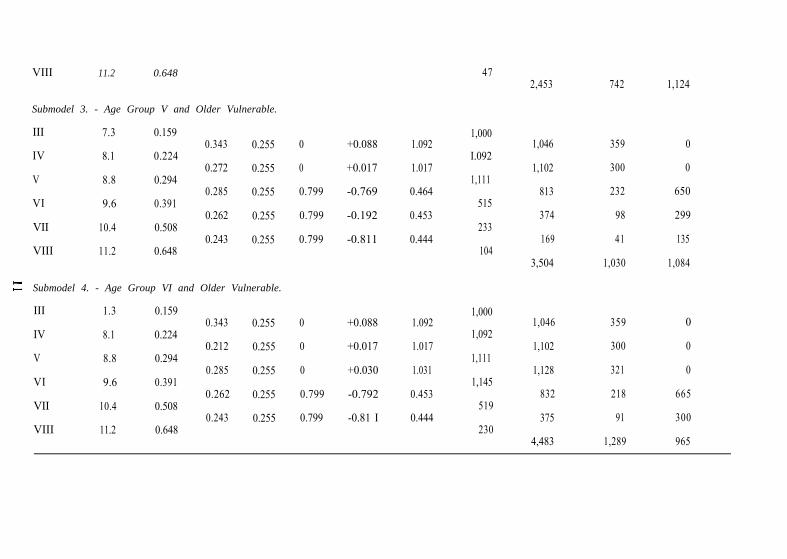
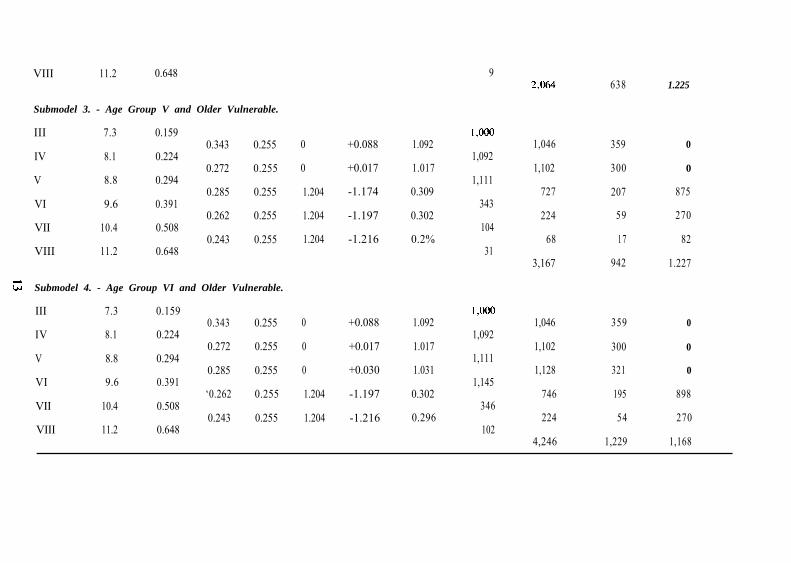
Using the growth and mortality parameters described above, we con-structed Ricker-type equilibrium yield models to determine the effects ofthe successive protection of age groups III, IV, and V by alternativeMSL’s on the yield from a recruitment unit of 1,000 pounds of fish. Weused three different fishing mortality rates-55, 61.3, and 70% toensure that the range of empirical expectation for the yellow perch ofwestern Lake Erie would be fully covered. The results of the equilibriumyield computations are given in Tables l-6.
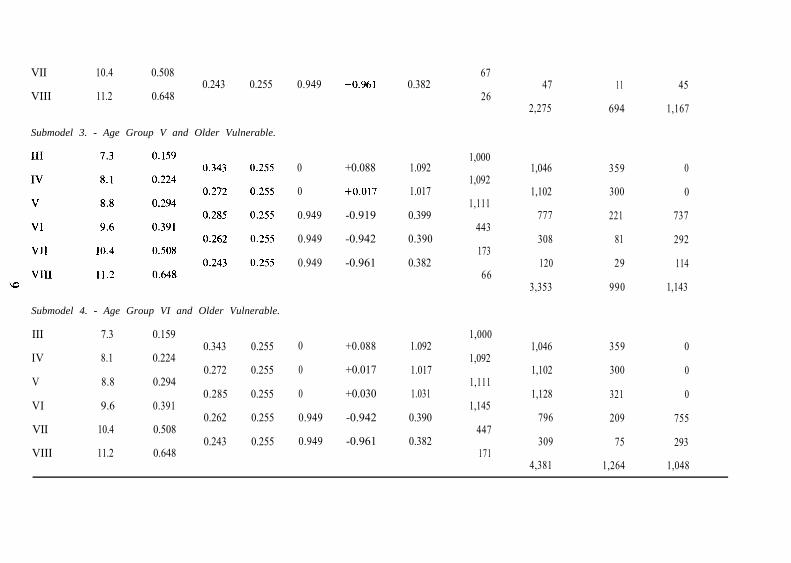
In the basic model employing empirical growth characteristics andmortality rates of 22.5% (natural) and 61.3% (fishing), the yield changeslittle whether yellow perch are first exploited as III year old fish, or notuntil they are IV, V, or VI years old. The lowest expected yield is 1,048pounds and highest 1,167 pounds, the differences being less than 10% ofthe maximum. Virtually the same conclusions can be drawn from ModelII where a lower rate of fishing was applied, and Model III where a higherrate of fishing was used. Ricker (1975), who found this same condition forbluegills in Muskellunge Lake, Indiana, arrived at the followingconclusions:
First, there is considerable leeway allowed for errors in the data fromwhich the computation of minimum size is made. Secondly, it is evidentlynot important to determine the exact optimum minimum size for maxi-mum yield. Third, if it were known that a certain minimum size is bestfrom the point of view of regulating the size of the stock so as to obtainoptimum recruitment, then a considerable adjustment of the minimumcould be made to meet this requirement without sacrificing any significantpart of the yield from whatever recruits actually appear. Fourth, if eitherthe individual size of the fish caught, or the catch per unit of effort, arei m p o r t a n t c o n s i d e r a t i o n s i n r e s p e c t t o t h e f i s h e r y , e i t h e r o f t h e s e c a n b efavored by the regulations to a considerable degree without significantloss of yield. Fifth, if the minimum size has to be specified as to what agiven mesh of net will catch rather than as a fixed limit based on measure-
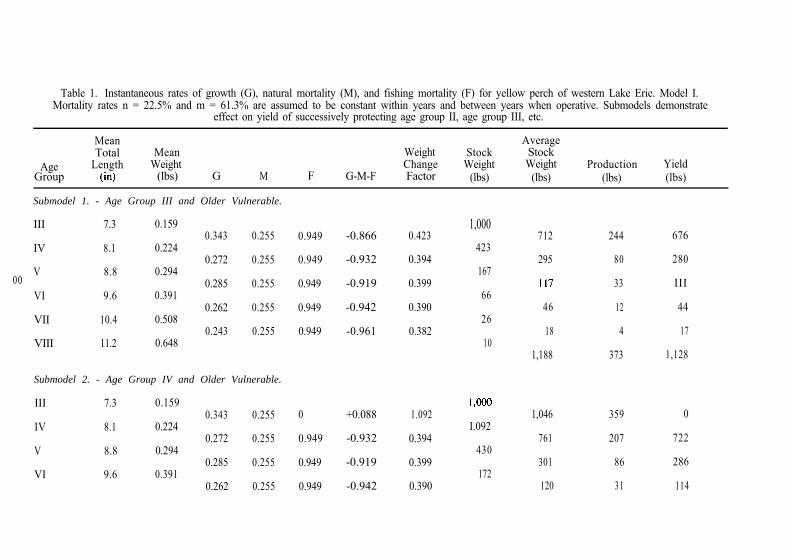
Table 1. Instantaneous rates of growth (G), natural mortality (M), and fishing mortality (F) for yellow perch of western Lake Erie. Model I.Mortality rates n = 22.5% and m = 61.3% are assumed to be constant within years and between years when operative. Submodels demonstrate
effect on yield of successively protecting age group II, age group III, etc.
MeanTotal Mean
Age Length WeightGroup 6”) (lbs) G M
Submodel 1. - Age Group III and Older Vulnerable.
AverageWeight Stock StockChange Weight Weight Production Yield
F G-M-F Factor (lbs) (lbs) (lbs) (lbs)
III 7.3 0.1590.343 0.255
IV 8.1 0.2240.272 0.255
V 8.8 0.29400 0.285 0.255
VI 9.6 0.3910.262 0.255
VII 10.4 0.5080.243 0.255
VIII 11.2 0.648
Submodel 2. - Age Group IV and Older Vulnerable.
III 7.3 0.1590.343 0.255
IV 8.1 0.2240.272 0.255
V 8.8 0.2940.285 0.255
VI 9.6 0.3910.262 0.255
0.949 -0.866 0.423
0.949 -0.932 0.394
0.949 -0.919 0.399
0.949 -0.942 0.390
0.949 -0.961 0.382
0 +0.088 1.092
0.949 -0.932 0.394
0.949 -0.919 0.399
0.949 -0.942 0.390
1,000
423
167
66
26
10
l,O@J
I.092
430
172
712 244 676
295 80 280
II7 33 III
46 12 44
18 4 17
1,188 373 1,128
1,046
761
301
120
359 0
207 722
86 286
31 114
VII 10.4 0.5080.243 0.255
VIII 11.2 0.648
Submodel 3. - Age Group V and Older Vulnerable.
Submodel 4. - Age Group VI and Older Vulnerable.
III 7.3 0.1590.343 0.255
IV 8.1 0.2240.272 0.255
V 8.8 0.2940.285 0.255
VI 9.6 0.3910.262 0.255
VII 10.4 0.5080.243 0.255
VIII 11.2 0.648
0.949
0
0
0.949
0.949
0.949
0
0
0
0.949
0.949
-O.%l 0.382
+0.088 1.092
-to.017 1.017
-0.919 0.399
-0.942 0.390
-0.961 0.382
+0.088 1.092
+0.017 1.017
+0.030 1.031
-0.942 0.390
-0.961 0.382
67
26
1,000
1,092
1,111
443
173
66
1,000
1,092
1,111
1,145
447
171
47 11
2,275 694
1,046 359 0
1,102 300 0
777 221 737
308 81 292
120 29 114
3,353 990 1,143
1,046 359 0
1,102 300 0
1,128 321 0
796 209 755
309 75 293
4,381 1,264 1,048
45
1,167
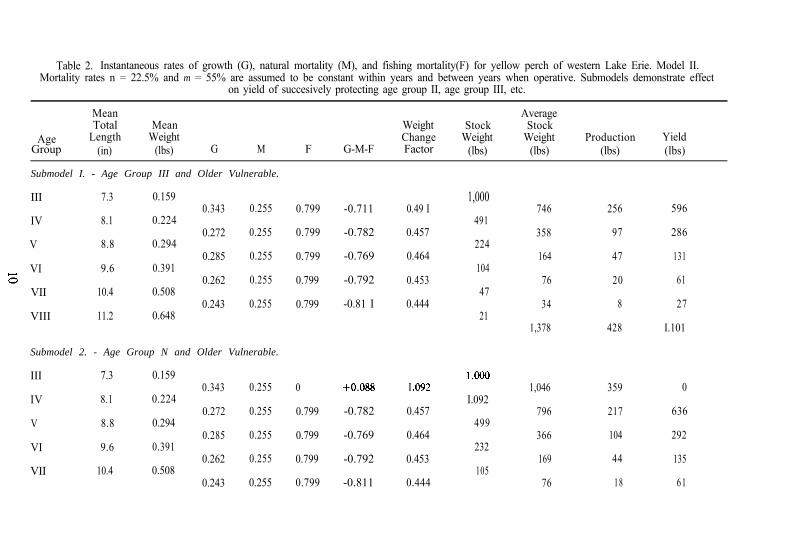
Table 2. Instantaneous rates of growth (G), natural mortality (M), and fishing mortality(F) for yellow perch of western Lake Erie. Model II.Mortality rates n = 22.5% and m = 55% are assumed to be constant within years and between years when operative. Submodels demonstrate effect
on yield of succesively protecting age group II, age group III, etc.
AgeGroup
MeanTotal
Length(in)
MeanWeight
(lbs)
AverageWeight Stock StockChange Weight Weight Production Yield
G M F G-M-F Factor (lbs) (lbs) (lbs) (lbs)
Submodel I. - Age Group III and Older Vulnerable.
III 7.3 0.1590.343 0.255
IV 8.1 0.2240.272 0.255
V 8.8 0.2940.285 0.255
VI 9.6 0.3910.262 0.255
VII 10.4 0.5080.243 0.255
VIII 11.2 0.648
Submodel 2. - Age Group N and Older Vulnerable.
III 7.3 0.1590.343 0.255
IV 8.1 0.2240.272 0.255
V 8.8 0.2940.285 0.255
VI 9.6 0.3910.262 0.255
VII 10.4 0.5080.243 0.255
0.799 -0.711
0.799 -0.782
0.799 -0.769
0.799 -0.792
0.799 -0.81 I
0 +o.osg I .092
0.799 -0.782 0.457
0.799 -0.769 0.464
0.799 -0.792 0.453
0.799 -0.811 0.444
0.49 I
0.457
0.464
0.453
0.444
1,000
491
224
104
47
21
l,ooo
I.092
499
232
105
746 256 596
358 97 286
164 47 131
76 20 61
34 8 27
1,378 428 I.101
1,046 359 0
796 217 636
366 104 292
169 44 135
76 18 61
VIII 11.2 0.648
Submodel 3. - Age Group V and Older Vulnerable.
III 7.3 0.1590.343 0.255
IV 8.1 0.2240.272 0.255
V 8.8 0.2940.285 0.255
VI 9.6 0.3910.262 0.255
VII 10.4 0.5080.243 0.255
VIII 11.2 0.648
Submodel 4. - Age Group VI and Older Vulnerable.
III 1.3 0.1590.343 0.255
IV 8.1 0.2240.212 0.255
V 8.8 0.2940.285 0.255
VI 9.6 0.3910.262 0.255
VII 10.4 0.5080.243 0.255
VIII 11.2 0.648
0
0
0.799
0.799
0.799
0
0
0
0.799
0.799
+0.088
+0.017
-0.769
-0.192
-0.811
1.092
1.017
0.464
0.453
0.444
+0.088 1.092
+0.017 1.017
+0.030 1.031
-0.792 0.453
-0.81 I 0.444
47
1,000
I.092
1,111
515
233
104
1,000
1,092
1,111
1,145
519
230
2,453 742 1,124
1,046 359 0
1,102 300 0
813 232 650
374 98 299
169 41 135
3,504 1,030 1,084
1,046 359 0
1,102 300 0
1,128 321 0
832 218 665
375 91 300
4,483 1,289 965
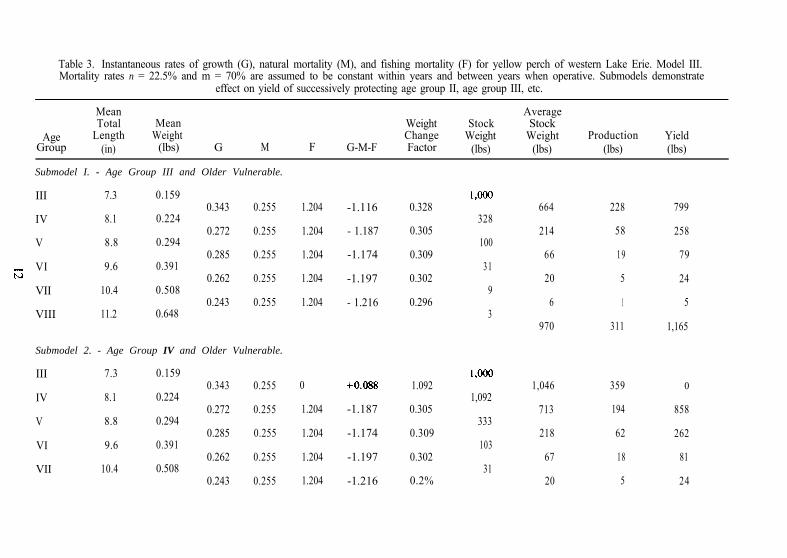
Table 3. Instantaneous rates of growth (G), natural mortality (M), and fishing mortality (F) for yellow perch of western Lake Erie. Model III.Mortality rates n = 22.5% and m = 70% are assumed to be constant within years and between years when operative. Submodels demonstrate
effect on yield of successively protecting age group II, age group III, etc.
MeanTotal Mean
Age Length WeightGroup (in) (lbs) G M
Submodel I. - Age Group III and Older Vulnerable.
AverageWeight Stock StockChange Weight Weight Production Yield
F G-M-F Factor (lbs) (lbs) (lbs) (lbs)
III 7.3 0.1590.343 0.255
IV 8.1 0.2240.272 0.255
V 8.8 0.2940.285 0.255
VI 9.6 0.3910.262 0.255
VII 10.4 0.5080.243 0.255
VIII 11.2 0.648
Submodel 2. - Age Group IV and Older Vulnerable.
III 7.3 0.1590.343 0.255
IV 8.1 0.2240.272 0.255
V 8.8 0.2940.285 0.255
VI 9.6 0.3910.262 0.255
VII 10.4 0.5080.243 0.255
1.204 -1.116 0.328
1.204 - 1.187 0.305
1.204 -1.174 0.309
1.204 -1.197 0.302
1.204 - 1.216 0.296
0
1.204
1.204
1.204
1.204
+o.oss 1.092
-1.187 0.305
-1.174 0.309
-1.197 0.302
-1.216 0.2%
1,~
328
100
31
9
3
1,c@o
1,092
333
103
31
664 228 799
214 58 258
66 19 79
20 5 24
6 1 5
970 311 1,165
1,046 359 0
713 194 858
218 62 262
67 18 81
20 5 24
VIII 11.2 0.648
Submodel 3. - Age Group V and Older Vulnerable.
III 7.3 0.1590.343 0.255
IV 8.1 0.2240.272 0.255
V 8.8 0.2940.285 0.255
VI 9.6 0.3910.262 0.255
VII 10.4 0.5080.243 0.255
VIII 11.2 0.648
Submodel 4. - Age Group VI and Older Vulnerable.
III 7.3 0.1590.343 0.255
IV 8.1 0.2240.272 0.255
V 8.8 0.2940.285 0.255
VI 9.6 0.391‘0.262 0.255
VII 10.4 0.5080.243 0.255
VIII 11.2 0.648
0 +0.088 1.092
0 +0.017 1.017
1.204 -1.174 0.309
1.204 -1.197 0.302
1.204 -1.216 0.2%
0 +0.088 1.092
0 +0.017 1.017
0 +0.030 1.031
1.204 -1.197 0.302
1.204 -1.216 0.296
9
l,oc@
1,092
1,111
343
104
31
1,ooo
1,092
1,111
1,145
346
102
1,046 359 0
1,102 300 0
727 207 875
224 59 270
68 17 82
3,167 942 1.227
1,046 359 0
1,102 300 0
1,128 321 0
746 195 898
224 54 270
4,246 1,229 1,168
638 1.225
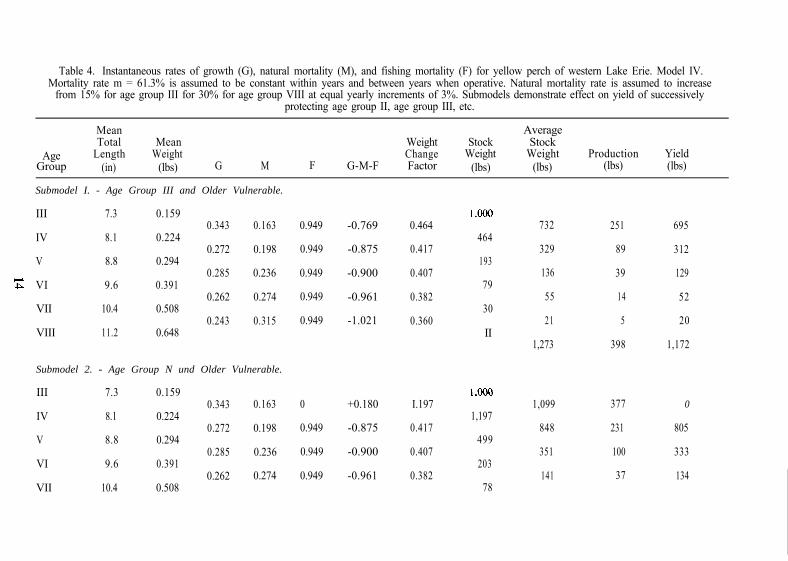
Table 4. Instantaneous rates of growth (G), natural mortality (M), and fishing mortality (F) for yellow perch of western Lake Erie. Model IV.Mortality rate m = 61.3% is assumed to be constant within years and between years when operative. Natural mortality rate is assumed to increase
from 15% for age group III for 30% for age group VIII at equal yearly increments of 3%. Submodels demonstrate effect on yield of successivelyprotecting age group II, age group III, etc.
AgeGroup
MeanTotal
Length(in)
MeanWeight
(lbs)
AverageWeight Stock StockChange Weight Weight Production Yield
G M F G-M-F Factor (lbs) (lbs) (lbs) (lbs)
Submodel I. - Age Group III and Older Vulnerable.
III 7.3 0.1590.343 0.163
IV 8.1 0.2240.272 0.198
V 8.8 0.2940.285 0.236
VI 9.6 0.3910.262 0.274
VII 10.4 0.5080.243 0.315
VIII 11.2 0.648
Submodel 2. - Age Group N und Older Vulnerable.
III 7.3 0.1590.343
IV 8.1 0.2240.272
V 8.8 0.2940.285
VI 9.6 0.3910.262
VII 10.4 0.508
0.163 0 +0.180 I.197
0.198 0.949 -0.875 0.417
0.236 0.949 -0.900 0.407
0.274 0.949 -0.961 0.382
0.949 -0.769 0.464
0.949 -0.875 0.417
0.949 -0.900 0.407
0.949 -0.961 0.382
0.949 -1.021 0.360
l,W
464
193
79
30
II
l,MM
1,197
499
203
78
732 251 695
329 89 312
136 39 129
55 14 52
21 5 20
1,273 398 1,172
1,099 377 0
848 231 805
351 100 333
141 37 134
0.243 0.315VIII 11.2 0.648
Submodel 3. - Age Group V and Older Vulnerable.
III 7.3 0.1590.343 0.163
IV 8.1 0.2240.272 0.198
V 8.8 0.2940.285 0.236
VI 9.6 0.3910.262 0.274
VII 10.4 0.5080.243 0.3 15
VIII 11.2 0.648
Submodel 4. - Age Group VI and Older Vulnerable
III 7.3 0.1590.343 0.163
IV 8.1 0.2240.272 0.198
V 8.8 0.2940.285 0.236
VI 9.6 0.3910.262 0.274
VII 10.4 0.5080.243 0.315
VIII 11.2 0.648
0.949
0
0
0.949
0.949
0.949
0
0
0
0.949
0.949
-1.021 0.360
+0.180 1.197
+0.074 1.076
-0.900 0.407
-O.%l 0.382
-1.021 0.360
+0.180 1.197
+0.074 1.076
+0.049 1.050
-0.96 I 0.382
- 1.021 0.360
28
1,ooo
1,197
1,288
524
200
72
1,000
1,197
1,288
1,352
517
186
53 13 50
2,492 758 1,322
1,099 377 0
1,243 339 0
906 258 860
362 9.5 344
136 33 129
3,746 1,102 1,333
1,099 377 0
1,243 339 0
1,320 376 0
935 245 887
352 86 334
4,949 1,423 1.221
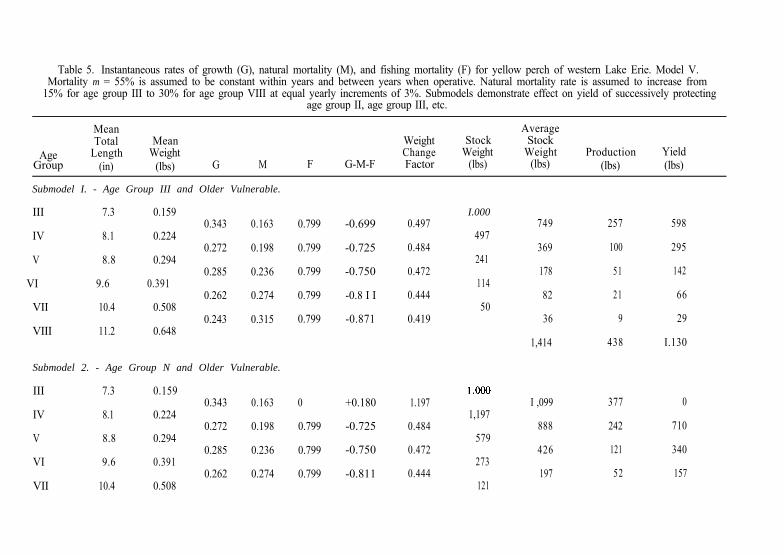
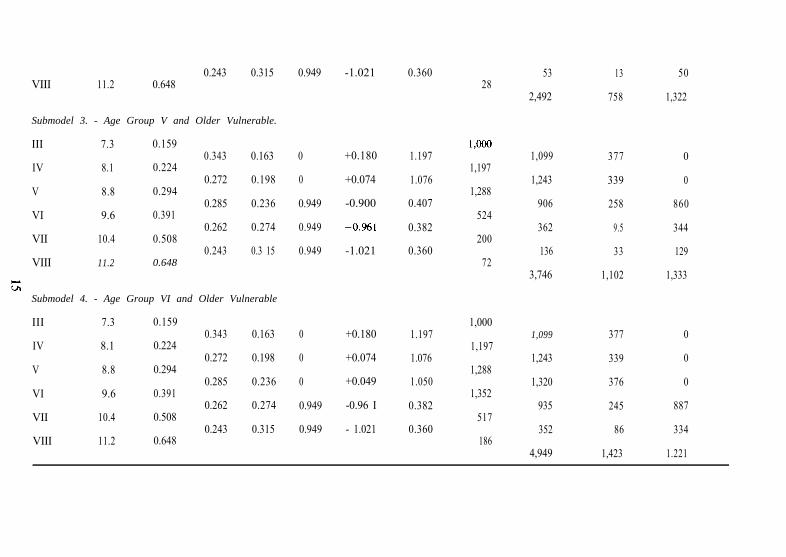
Table 5. Instantaneous rates of growth (G), natural mortality (M), and fishing mortality (F) for yellow perch of western Lake Erie. Model V.Mortality m = 55% is assumed to be constant within years and between years when operative. Natural mortality rate is assumed to increase from
15% for age group III to 30% for age group VIII at equal yearly increments of 3%. Submodels demonstrate effect on yield of successively protectingage group II, age group III, etc.
MeanTotal Mean
Age Length WeightGroup (in) (lbs) G M
Submodel I. - Age Group III and Older Vulnerable.
AverageWeight Stock StockChange Weight Weight Production Yield
F G-M-F Factor (lbs) (lbs) (lbs) (lbs)
III 7.3 0.1590.343 0.163
IV 8.1 0.2240.272 0.198
V 8.8 0.2940.285 0.236
VI 9.6 0.3910.262 0.274
VII 10.4 0.5080.243 0.315
VIII 11.2 0.648
Submodel 2. - Age Group N and Older Vulnerable.
III 7.3 0.1590.343 0.163
IV 8.1 0.2240.272 0.198
V 8.8 0.2940.285 0.236
VI 9.6 0.3910.262 0.274
VII 10.4 0.508
0.799 -0.699 0.497
0.799 -0.725 0.484
0.799 -0.750 0.472
0.799 -0.8 I I 0.444
0.799 -0.871 0.419
0 +0.180 1.197
0.799 -0.725 0.484
0.799 -0.750 0.472
0.799 -0.811 0.444
I.000
497
241
114
50
l,ooo
1,197
579
273
121
749 257 598
369 100 295
178 51 142
82 21 66
36 9 29
1,414 438 I.130
I ,099 377 0
888 242 710
426 121 340
197 52 157
0.243 0.315VIII 11.2 0.648
Submodel 3. - Age Group V and Older Vulnerable.
III 7.3 0.1590.343 0.163
IV 8.1 0.2240.272 0.198
V 8.8 0.2940.285 0.236
VI 9.6 0.3910.262 0.274
VII 10.4 0.5080.243 0.315
VIII 11.2 0.648
Submodel 4. - Age Group VI and Older Vulnerable
III 7.3 0.1590.343 0.163
IV 8.1 0.2240.272 0.198
V 8.8 0.2940.285 0.236
VI 9.6 0.3910.262 0.274
VII 10.4 0.5080.243 0.3 15
VIII 11.2 0.648
0.799
0
0
0.799
0.799
0.799
0
0
0
0.799
0.799
-0.87 I 0.419 86 21 69
2.696 813 1,276
+0.180 1.197
+0.074 1.076
-0.750 0.472
-0.811 0.444
-0.871 0.419
1,ooo
1,197
1,288
608
270
113
1,099 377 0
1,243 338 0
948 270 757
439 115 3.51
192 47 153
3,921 1,147 1,261
+0.180 1.197
+0.074 1.076
+0.049 1.050
-0.81 I 0.444
-0.871 0.419
l,C@O
1,197
1,288
1,352
600
252
1,099 377 0
1,243 338 0
1,320 376 0
976 256 780
426 104 340
5,064 1,451 1,120
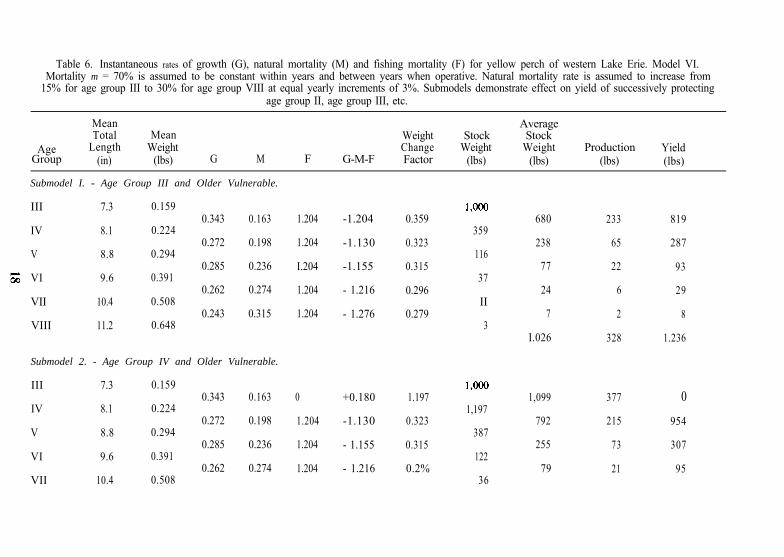
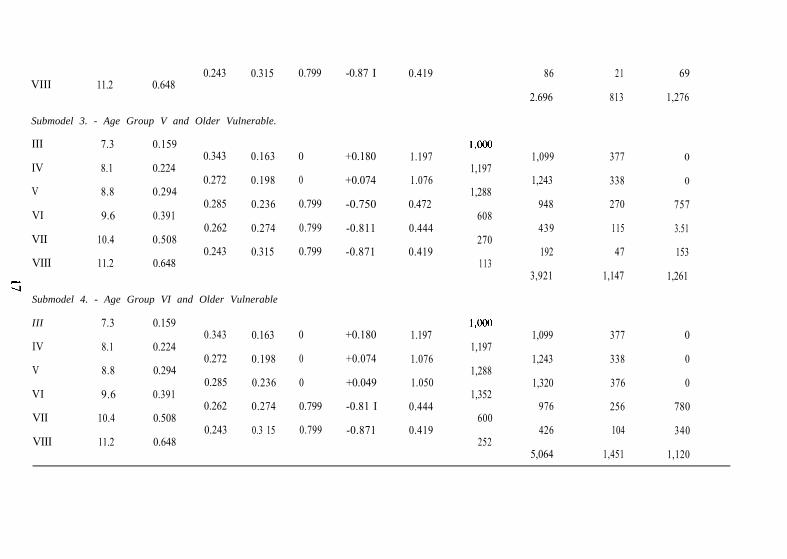
Table 6. Instantaneous rates of growth (G), natural mortality (M) and fishing mortality (F) for yellow perch of western Lake Erie. Model VI.Mortality m = 70% is assumed to be constant within years and between years when operative. Natural mortality rate is assumed to increase from
15% for age group III to 30% for age group VIII at equal yearly increments of 3%. Submodels demonstrate effect on yield of successively protectingage group II, age group III, etc.
MeanTotal Mean
Age Length WeightGroup (in) (lbs) G M
Submodel I. - Age Group III and Older Vulnerable.
AverageWeight Stock StockChange Weight Weight Production Yield
F G-M-F Factor (lbs) (lbs) (lbs) (lbs)
III 7.3 0.1590.343 0.163
IV 8.1 0.2240.272 0.198
V 8.8 0.2940.285 0.236
VI 9.6 0.3910.262 0.274
VII 10.4 0.5080.243 0.315
VIII 11.2 0.648
Submodel 2. - Age Group IV and Older Vulnerable.
III 7.3 0.1590.343 0.163
IV 8.1 0.2240.272 0.198
V 8.8 0.2940.285 0.236
VI 9.6 0.3910.262 0.274
VII 10.4 0.508
1.204 -1.204 0.359
1.204 -1.130 0.323
I.204 -1.155 0.315
1.204 - 1.216 0.296
1.204 - 1.276 0.279
0
1.204
1.204
1.204
+0.180 1.197
-1.130 0.323
- 1.155 0.315
- 1.216 0.2%
1,m
359
116
37
II
3
1,ooo
1,197
387
122
36
680 233 819
238 65 287
77 22 93
24 6 29
7 2 8
I.026 328 1.236
1,099 377 0
792 215 954
255 73 307
79 21 95
0.243 0.315VIII 11.2 0.648
Submodel 3. - Age Group V and Older Vulnerable.
III 7.3 0.1590.343 0.163
IV 8.1 0.2240.272 0.198
V 8.8 0.2940.285 0.236
VI 9.6 0.3910.262 0.274
VII 10.4 0.5080.243 0.315
VIII 11.2 0.648
Submodel 4. - Age Group VI and Older Vulnerable.
III 7.3 0.1590.343 0.163
IV 8.1 0.2240.272 0.198
V 8.8 0.2940.285 0.236
VI 9.6 0.3910.262 0.274
VII 10.4 0.5080.243 0.315
VIII 11.2 0.648
1.204 - 1.276 0.279
0 +0.180 1.197
0 +0.074 1.076
1.204 -1.155 0.315
1.204 -1.216 0.2%
1.204 - 1.276 0.279
0 +0.180 1.197
0 +0.074 1.076
0 +0.049 1.050
1.204 -1.216 0.296
1.204 -1.276 0.279
10
1,@)0
1,197
1,288
406
120
34
1,000
1,197
1,288
1,352
400
112
23 6 28
2,248 692 1,384
1,099 377 0
1,243 338 0
847 241 1,020
263 69 317
77 19 93
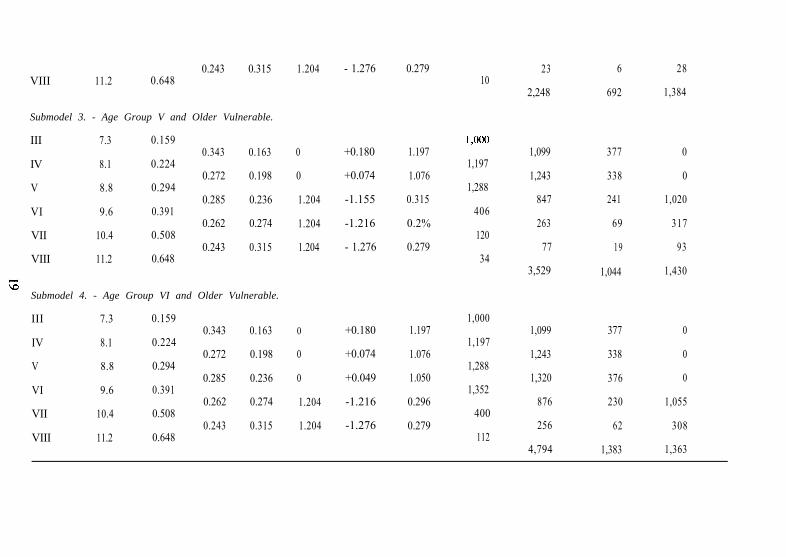
3,529 1,044 1,430
1,099 377 0
1,243 338 0
1,320 376 0
876 230 1,055
256 62 308
4,794 1,383 1,363
ment of individual fish, this will usually be almost as effective as a sharpcut-off size (though the fate of the rejected fish needs to be consideredwhether they survive or die). Finally, if it is desirable to have a uniformminimum standard apply to a number of bodies of water, or even todifferent kinds of fish, for which the optimum minima are different, thiswill be possible without any great sacrifice of yield, provided the optimaare not too diverse.
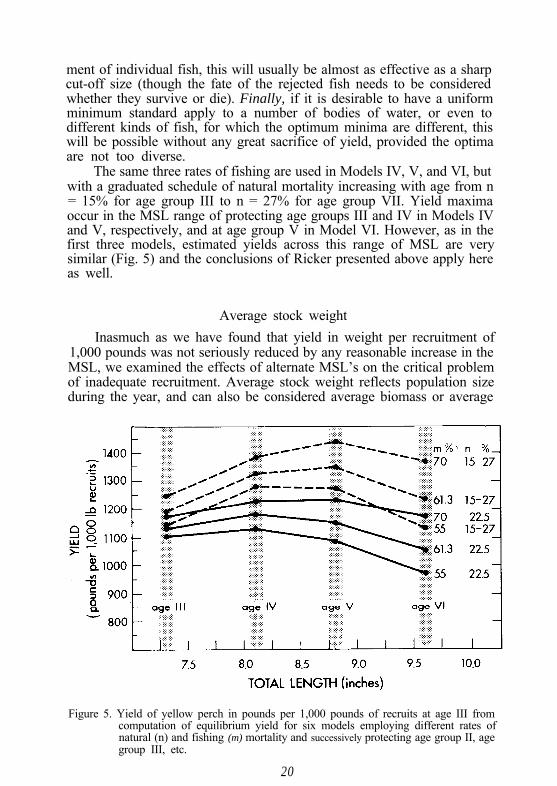
The same three rates of fishing are used in Models IV, V, and VI, butwith a graduated schedule of natural mortality increasing with age from n= 15% for age group III to n = 27% for age group VII. Yield maximaoccur in the MSL range of protecting age groups III and IV in Models IVand V, respectively, and at age group V in Model VI. However, as in thefirst three models, estimated yields across this range of MSL are verysimilar (Fig. 5) and the conclusions of Ricker presented above apply hereas well.
Average stock weight
Inasmuch as we have found that yield in weight per recruitment of1,000 pounds was not seriously reduced by any reasonable increase in theMSL, we examined the effects of alternate MSL’s on the critical problemof inadequate recruitment. Average stock weight reflects population sizeduring the year, and can also be considered average biomass or average
Figure 5. Yield of yellow perch in pounds per 1,000 pounds of recruits at age III fromcomputation of equilibrium yield for six models employing different rates ofnatural (n) and fishing (m) mortality and successively protecting age group II, agegroup III, etc.
20
standing stock. Average stock weights were totaled over all the yearsbetween age III and age VIII for all six models. Substantial increases intotal average stock weight occurred in each model as each successive agegroup was protected by an elevated MSL (Table 7). In Model I, forexample, with age group III protected, the total average stock weight wasnearly doubled to 2,275 pounds. With age group IV protected, the totalaverage stock weight increased another 1,000 pounds to 3,353 pounds.Finally, with age group V protected the total average stock weight in-creased to 4,381 pounds. The mean lengths of age groups III, IV, and Vare roughly 0.7 inch apart. Therefore, raising the present MSL of 8.0inches to 8.5 could increase biomass by about 50%, and raising it to 9.0inches could nearly double it, once the system stabilized. Yet, in all thesesubmodels there was virtually no change in yield per recruitment of 1,000pounds. Consequently, as more units of 1,000 pounds become availabletotal commercial production would increase correspondingly.
Production of yellow perch in weight was estimated in these modelsby multiplying average stock weight by the instantaneous growth rate (G).As stock weight increases through each model as age groups are sequen-tially protected by elevating the MSL, axiomatically natural productionalso increases. Theoretically, when production and yield are equal, thestanding biomass fluctuates around a value that remains fairly stablethrough the years.
Fecundity, maturity, and potential egg deposition
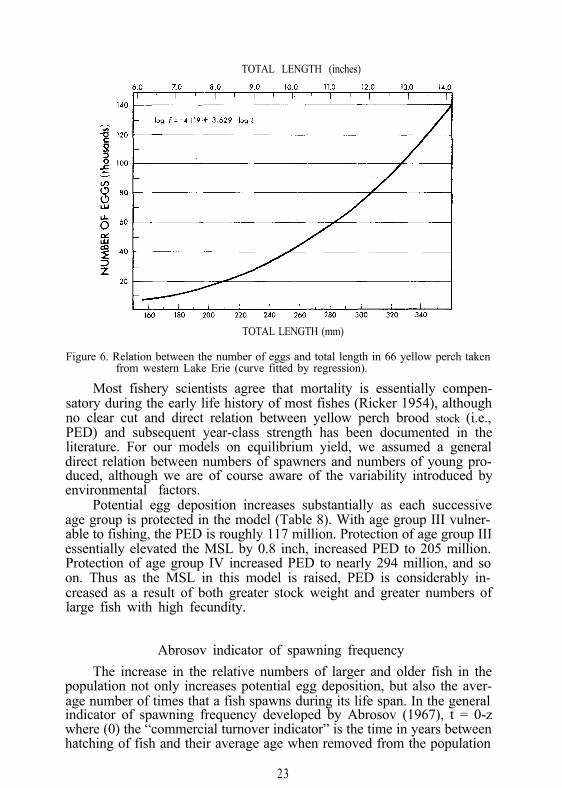
The relation between number of eggs and total length has been deter-mined for 66 yellow perch from the western basin of Lake Erie (HarryVan Meter, FWS unpublished data). The relation is expressed as log F =-4.119 + 3.629L. where F is the number of eggs and L is total length inmm (Fig. 6). Fish 8 inches (203 mm) long produced about 17,000 eggs, andthose 10 inches (254 mm) long produced about 38,300 eggs. Jumbo perchreaching 12 inches (305 mm) produced about 74,200 eggs.
The maturity schedule for male and female yellow perch from thewestern basin of Lake Erie was derived from a sample of 252 males and143 females sampled during the spring, 1960-66 (Harry Van Meter, FWSunpublished data). Males mature at a much smaller length than females,as expected (Fig. 7). In terms of total length, virtually all males maturebefore any females reach maturity.
The equilibrium yield Model I presented above was modified todemonstrate the effects of alternative MSL’s on potential egg deposition(PED). The unit of recruitment into age group III is set at 1,000 pounds.Mean weights were used to convert the stock weight into numbers offemales, and this number was adjusted into the numbers of maturefemales on the basis of the maturity schedule. The average egg contentper age group was then multiplied by the adjusted number of females toestimate PED. The PED was then summed over the life span of thatcohort to age group VIII.
21
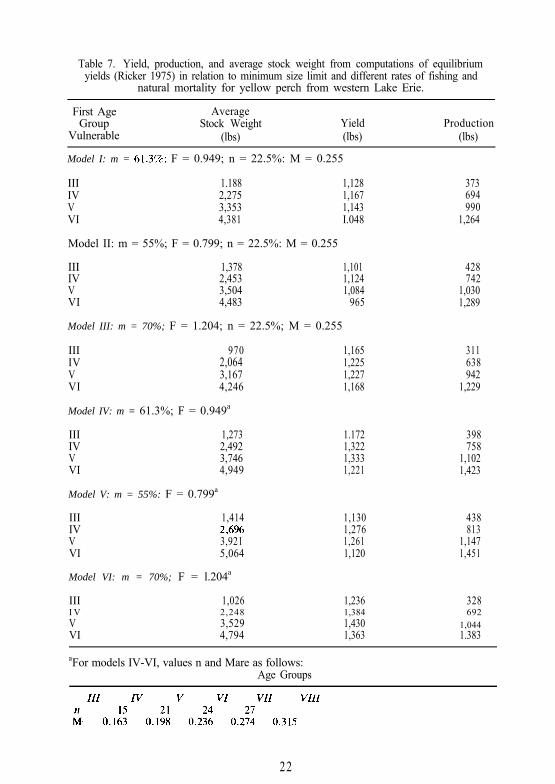
Table 7. Yield, production, and average stock weight from computations of equilibriumyields (Ricker 1975) in relation to minimum size limit and different rates of fishing and
natural mortality for yellow perch from western Lake Erie.
First AgeGroup
Vulnerable
AverageStock Weight
(lbs)Yield(lbs)
Production(lbs)
Model I: m = 61.37~; F = 0.949; n = 22.5%: M = 0.255
III 1.188 1,128IV 2,275 1,167V 3,353 1,143VI 4,381 I.048
Model II: m = 55%; F = 0.799; n = 22.5%: M = 0.255
373694990
1,264
III 1,378 1,101IV 2,453 1,124V 3,504 1,084VI 4,483 965
Model III: m = 70%; F = 1.204; n = 22.5%; M = 0.255
428742
1,0301,289
III 970IV 2,064V 3,167VI 4,246
Model IV: m = 61.3%; F = 0.949a
1,165 3111,225 6381,227 9421,168 1,229
III 1,273IV 2,492V 3,746VI 4,949
Model V: m = 55%: F = 0.799a
1.172 3981,322 7581,333 1,1021,221 1,423
III 1,414IV 2,6%V 3,921VI 5,064
Model VI: m = 70%; F = l.204a
1,130 4381,276 8131,261 1,1471,120 1,451
III 1,026 1,236 328I V 2,248 1,384 692V 3,529 1,430 1,044VI 4,794 1,363 1.383
aFor models IV-VI, values n and Mare as follows:Age Groups
22
TOTAL LENGTH (inches)
TOTAL LENGTH (mm)
Figure 6. Relation between the number of eggs and total length in 66 yellow perch takenfrom western Lake Erie (curve fitted by regression).
Most fishery scientists agree that mortality is essentially compen-satory during the early life history of most fishes (Ricker 1954), althoughno clear cut and direct relation between yellow perch brood stock (i.e.,PED) and subsequent year-class strength has been documented in theliterature. For our models on equilibrium yield, we assumed a generaldirect relation between numbers of spawners and numbers of young pro-duced, although we are of course aware of the variability introduced byenvironmental factors.
Potential egg deposition increases substantially as each successiveage group is protected in the model (Table 8). With age group III vulner-able to fishing, the PED is roughly 117 million. Protection of age group IIIessentially elevated the MSL by 0.8 inch, increased PED to 205 million.Protection of age group IV increased PED to nearly 294 million, and soon. Thus as the MSL in this model is raised, PED is considerably in-creased as a result of both greater stock weight and greater numbers oflarge fish with high fecundity.
Abrosov indicator of spawning frequency
The increase in the relative numbers of larger and older fish in thepopulation not only increases potential egg deposition, but also the aver-age number of times that a fish spawns during its life span. In the generalindicator of spawning frequency developed by Abrosov (1967), t = 0-zwhere (0) the “commercial turnover indicator” is the time in years betweenhatching of fish and their average age when removed from the population
23
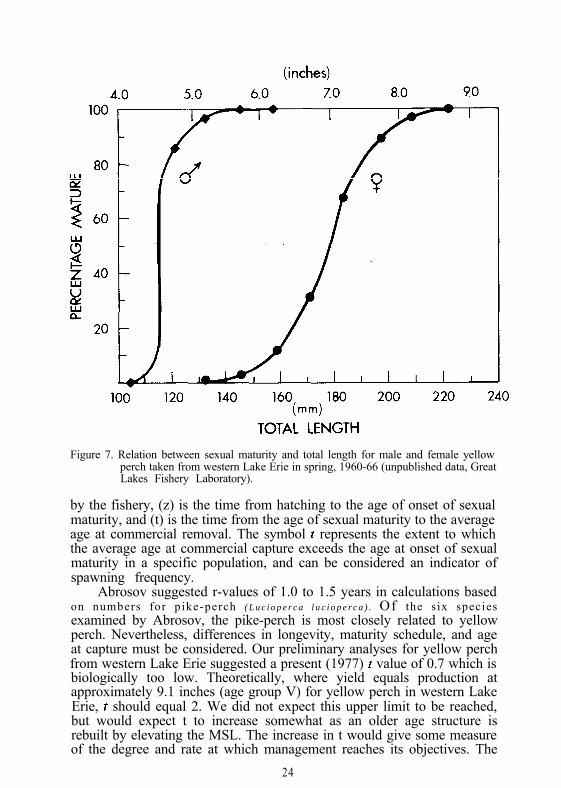
Figure 7. Relation between sexual maturity and total length for male and female yellowperch taken from western Lake Erie in spring, 1960-66 (unpublished data, GreatLakes Fishery Laboratory).
by the fishery, (z) is the time from hatching to the age of onset of sexualmaturity, and (t) is the time from the age of sexual maturity to the averageage at commercial removal. The symbol I represents the extent to whichthe average age at commercial capture exceeds the age at onset of sexualmaturity in a specific population, and can be considered an indicator ofspawning frequency.
Abrosov suggested r-values of 1.0 to 1.5 years in calculations basedon numbers for pike-perch ( L u c i o p e r c a l u c i o p e r c a ) . Of the six speciesexamined by Abrosov, the pike-perch is most closely related to yellowperch. Nevertheless, differences in longevity, maturity schedule, and ageat capture must be considered. Our preliminary analyses for yellow perchfrom western Lake Erie suggested a present (1977) r value of 0.7 which isbiologically too low. Theoretically, where yield equals production atapproximately 9.1 inches (age group V) for yellow perch in western LakeErie, c should equal 2. We did not expect this upper limit to be reached,but would expect t to increase somewhat as an older age structure isrebuilt by elevating the MSL. The increase in t would give some measureof the degree and rate at which management reaches its objectives. The
24
protection afforded yellow perch that would result in a t value of between1.1 and 1.5 years may be adequate to halt the present decline and permitthe resource to rebuild. This in essence would result theoretically fromprotection of age group V fish.
CONCLUSIONS AND RECOMMENDATIONS
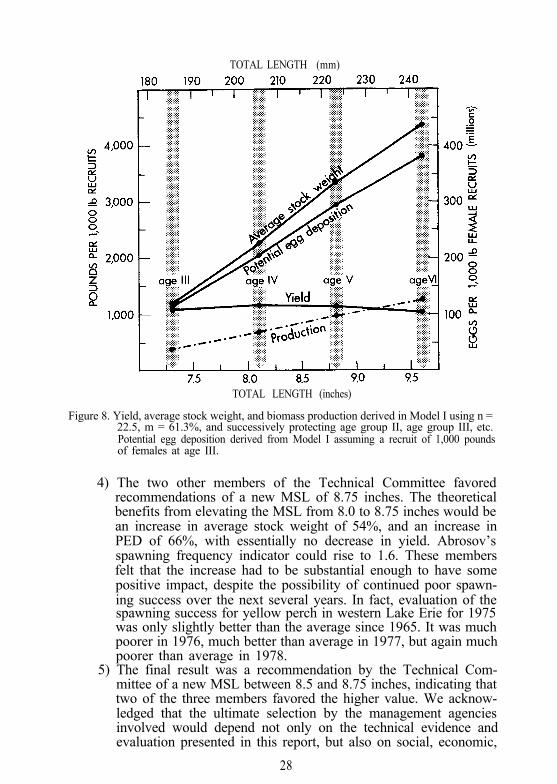
A synoptic picture of the effects on yield, average stock weight,biomass production, and potential egg deposition of protecting successiveage groups, based on Model I in our equilibrium yield analyses, is given inFigure 8. The slopes of the four plotted relations are most importantbecause they reflect incremental differences between different totallengths. Values for these characteristics of the model at total lengths of7.50, 7.75, 8.00, 8.25 (etc.) inches were estimated from Figure 8 anditemized in Table 9, along with other biological information.
On the basis of the data in Table 9 and Figure 8, and elsewhere in thisreport, we offer the following conclusions.
1) The current MSL of 8.0 inches for the U.S. and Canadian com-mercial fisheries on yellow perch in western Lake Erie is inade-quate to protect the declining resource under the current intensityof fishing: the potential for increased average stock weight andrecruitment must be substantially improved. We believe thatenvironmental conditions in western Lake Erie are still suitablefor the production of sizable year classes if brood stock is ade-quate and weather conditions are favorable during spawning andegg incubation periods.
2) The theoretical MSL at which production would equal yield isabout 9. I inches. An increase in MSL from 8.0 to 9.1 inches wouldincrease average stock weight by 76% and PED by 92%, with nomajor decrease in yield. However, natural mortalities in the olderage groups may be higher than we assumed in preparing ourmodel, and the length where production equals yield may besomewhat less than 9.1 inches. Consequently, an MSL of 9.1 wastreated as the upper limit during our considerations.
3) An MSL of 8.5 inches was considered the absolute minimumincrease that would be likely to have a sustained positive effect onthe declining resource. One member of the Technical Committeefavored this value. Increasing the limit from 8.0 to 8.5 incheswould increase average stock weight 36% and PED 44%, withessentially no decrease in yield. Abrosov’s spawning frequencyindicator (t) could rise from about 0.7 to 1.2. These potential bene-fits may be larger if the MSL of 8.5 inches is rigidly enforced,because in the past several years until 1976, especially inCanadian waters, the effective MSL has been slightly less than thestatutory 8.0 inches.
25
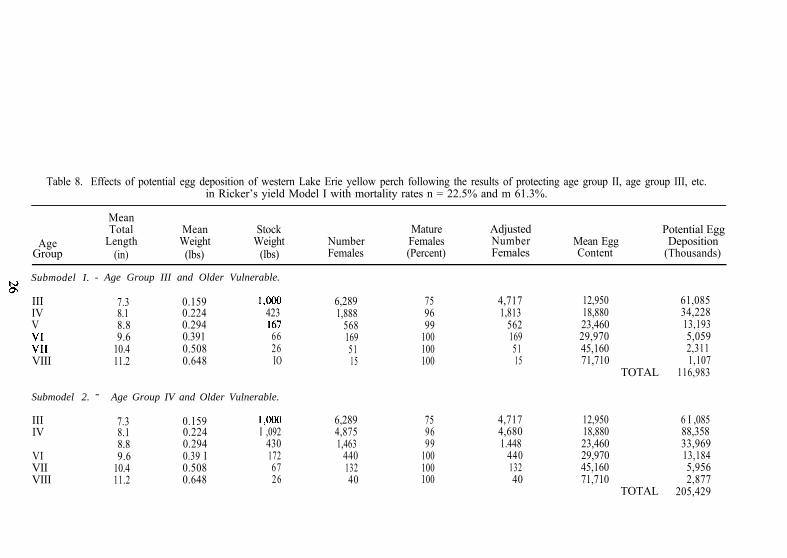
Table 8. Effects of potential egg deposition of western Lake Erie yellow perch following the results of protecting age group II, age group III, etc.in Ricker’s yield Model I with mortality rates n = 22.5% and m 61.3%.
AgeGroup
MeanTotal
Length(in)
MeanWeight(lbs)
StockWeight
(lbs)NumberFemales
MatureFemales(Percent)
AdjustedNumberFemales
Mean EggContent
Potential EggDeposition
(Thousands)
Submodel I. - Age Group III and Older Vulnerable.
IIIIVV
;I1VIII
7.3 0.159 l,ooO8.1 0.224 4238.8 0.294 1679.6 0.391 66
10.4 0.508 2611.2 0.648 IO
Submodel 2. - Age Group IV and Older Vulnerable.
IIIIV
VIVIIVIII
7.3 0.159 l,@JO 6,289 75 4,7178.1 0.224 I ,092 4,875 96 4,6808.8 0.294 430 1,463 99 1.4489.6 0.39 I 172 440 100 440
10.4 0.508 67 132 100 13211.2 0.648 26 40 100 40
6,289 75 4,717 12,950 61,0851,888 96 1,813 18,880 34,228
568 99 562 23,460 13,193169 100 169 29,970 5,05951 100 51 45,160 2,31115 100 15 71,710 1,107
TOTAL 116,983
12,950 6 I ,08518,880 88,35823,460 33,96929,970 13,18445,160 5,95671,710 2,877
TOTAL 205,429
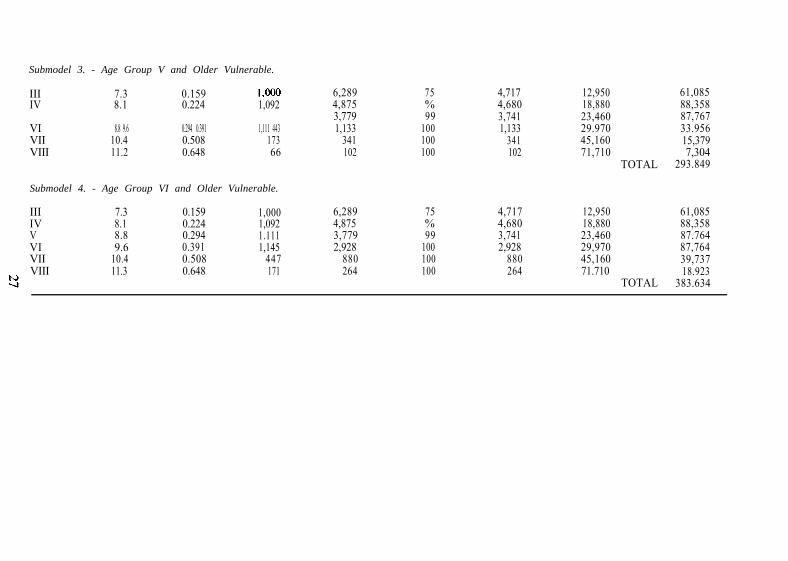
Submodel 3. - Age Group V and Older Vulnerable.
III 7.3 0.159 l,oooIV 8.1 0.224 1,092
VI 8.8 9.6 0.294 0.391 1,111 443VII 10.4 0.508 173VIII 11.2 0.648 66
Submodel 4. - Age Group VI and Older Vulnerable.
III 7.3 0.159 1,000IV 8.1 0.224 1,092V 8.8 0.294 1.111VI 9.6 0.391 1,145VII 10.4 0.508 447VIII 11.3 0.648 171
6,289 75 4,7174,875 % 4,6803,779 99 3,7411,133 100 1,133
341 100 341102 100 102
12,950 61,08518,880 88,35823,460 87,76729.970 33.95645,160 15,37971,710 7,304
TOTAL 293.849
6,289 75 4,717 12,9504,875 % 4,680 18,8803,779 99 3,741 23,4602,928 100 2,928 29,970
880 100 880 45,160 39,737264 100 264 71.710 18.923
TOTAL 383.634
61,08588,35887.76487,764
TOTAL LENGTH (mm)
TOTAL LENGTH (inches)
Figure 8. Yield, average stock weight, and biomass production derived in Model I using n =22.5, m = 61.3%, and successively protecting age group II, age group III, etc.Potential egg deposition derived from Model I assuming a recruit of 1,000 poundsof females at age III.
4) The two other members of the Technical Committee favoredrecommendations of a new MSL of 8.75 inches. The theoreticalbenefits from elevating the MSL from 8.0 to 8.75 inches would bean increase in average stock weight of 54%, and an increase inPED of 66%, with essentially no decrease in yield. Abrosov’sspawning frequency indicator could rise to 1.6. These membersfelt that the increase had to be substantial enough to have somepositive impact, despite the possibility of continued poor spawn-ing success over the next several years. In fact, evaluation of thespawning success for yellow perch in western Lake Erie for 1975was only slightly better than the average since 1965. It was muchpoorer in 1976, much better than average in 1977, but again muchpoorer than average in 1978.
5) The final result was a recommendation by the Technical Com-mittee of a new MSL between 8.5 and 8.75 inches, indicating thattwo of the three members favored the higher value. We acknow-ledged that the ultimate selection by the management agenciesinvolved would depend not only on the technical evidence andevaluation presented in this report, but also on social, economic,
28
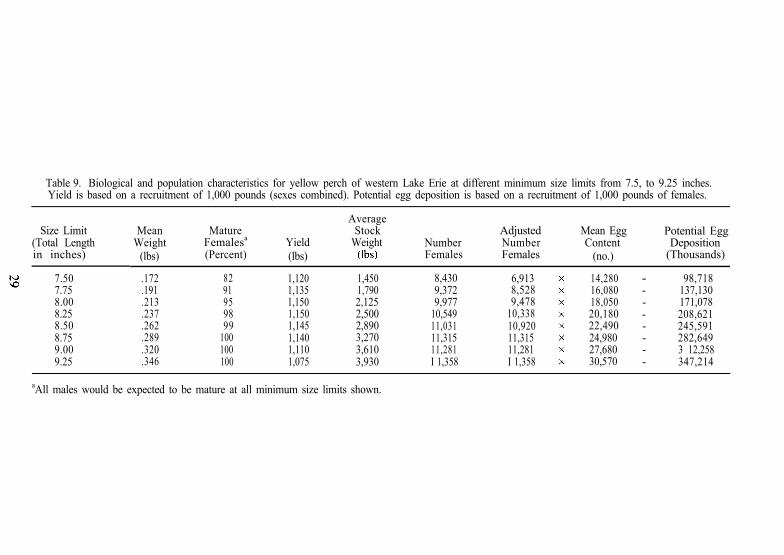
Table 9. Biological and population characteristics for yellow perch of western Lake Erie at different minimum size limits from 7.5, to 9.25 inches.Yield is based on a recruitment of 1,000 pounds (sexes combined). Potential egg deposition is based on a recruitment of 1,000 pounds of females.
Size Limit Mean(Total Lengthin inches)
Weight(lbs)
7.507.758.008.258.508.759.009.25
MatureFemalesa
(Percent)Yield(lbs)
AverageStock
WeightW)
NumberFemales
Adjusted Mean Egg Potential EggNumber Content DepositionFemales (no.) (Thousands)
.172
.191
.213
.237
.262
.289
.320
.346
82 1,120 1,450 8,430 6,91391 1,135 1,790 9,372 8,52895 1,150 2,125 9,977 9,47898 1,150 2,500 10,549 10,33899 1,145 2,890 11,031 10,920
100 1,140 3,270 11,315 11,315100 1,110 3,610 11,281 11,281100 1,075 3,930 I 1,358 I 1,358
14,280 - 98,71816,080 - 137,13018,050 - 171,07820,180 - 208,62122,490 - 245,59124,980 - 282,64927,680 - 3 12,25830,570 - 347,214
aAll males would be expected to be mature at all minimum size limits shown.
and political constraints within each agency. However because ofthe continued deterioration of the resource through 1976, westrongly emphasized the urgency of more protective regulations.
Special considerations
If the MSL is substantially elevated, temporary decreases in harvestmust not be mistaken for indications of long-term prospects. Change fromold to new conditions, based on predictions from the equilibrium yieldmodels and other evidence, will take at least 2 (if not 3) years for westernLake Erie yellow perch. This is the number of age groups vulnerable andavailable in significant numbers to the contemplated fishery. In otherwords, the age groups gaining protection by an increased MSL will take 2or 3 years to grow into the fishable stock. The process of increasing thebiomass and restoration of the more acceptable age structure will thenrequire 2 or 3 more years. Favorable or adverse environmental conditionsduring spawning may accelerate or delay the rehabilitation process eachyear.
The Technical Committee also recognized that the manner in which astandard MSL would be regulated would differ between fisheries andwould be the prerogative of the individual management agencies. Forexample, in a trapnet fishery, the regulation may be the actual MSL; butfor a gillnet fishery the regulation may stipulate the use of a minimummesh size that will effectively produce the same MSL.
The Technical Committee also suggested that the agencies considerfurther restrictions on exploitation by all user groups (including sportfisheries) until the resource has recovered to former levels of abundanceand exhibits a greater degree of stability than presently exists.
The Technical Committee also noted that statistical limits of varia-bility associated with the relation presented for length/weight, length/fecundity, and length/maturity were not displayed in the report. In all ofthese standards relationships, the raw empirical data points formed a tightand consistent pattern along each of the regression lines.
Protocol for evaluating response of the resourceto experimental management
The Committee became aware of the inadequacies of some of thehistorical biological data used to develop the basis for evaluating theeffects of different minimum size limits. The representatives of all threeagencies were convinced of the need for continuous collection of morenearly complete, more accurate, and more closely comparable data on thebiological and population characteristics of yellow perch and on the effortand catch characteristics of the fisheries. Consequently the TechnicalCommittee recommended the following guidelines to the managementagencies:
30
1) Maintain resource-wide catch statistics in pounds for sport andcommercial fisheries to determine yield levels and trends, andexamine sport and commercial catches for increases in averagefish size and the strengthening of older age groups in the popula-tion structure.
2) Maintain abundance indices for young-of-the-year and otheryoung fish to detect any relative increases in recruitment.
3) Monitor growth and mortality rates for changes. The results ofthis analysis of MSL were predicated on the instantaneous rate offishing mortality (F) remaining relatively stable over the years.Any substantial increases in F, caused possibly by a substantialincrease in fishing effort, could, to some extent, reduce the bene-fits of an increased MSL.
4) Annually reassess Abrosov’s spawning frequency indicator (t) fortrends.
5) Provide for periodic interagency evaluation of the effectiveness of, any new MSL, and readjustment if required.
EPILOGUE
Although the technical report and recommendation were accepted in1976 by all fishery agencies sharing jurisdiction over yellow perch inwestern Lake Erie-namely Ontario, Michigan, and Ohio-an elevatedMSL had not yet been imposed by early 1980. Although stricter enforce-ment of the existing MSL of 8.0 inches for commercial catches since 1976has resulted in a smaller percentage of sublegal fish in the catch and ahigher average size, overall the condition of the resource has not improvedand new management initiatives may ultimately be necessary. Theanalyses and recommendations of this Technical Committee should thenbe useful.
ACKNOWLEDGEMENTS
The Technical Committee acknowledges the assistance of the follow-ing scientific advisors in preparing this report: Mercer Patriarche,Michigan Department of Natural Resources; Harry Van Meter, U.S. Fishand Wildlife Service; Jerry Paine, Ontario Ministry of Natural Resources;and David Davies, Ohio Department of Natural Resources.
REFERENCES
A B R O S O V , V . N .1967. Determination of commercial turnover in natural bodies of water. Probl. of
Ichthyol. 9:482-489.BALDWIN, N. S., and R. W. SAALFELD.
1962. Commercial fish production in the Great Lakes 1867-1960 (plus mimeographed
31
supplement 1%1-68). Great Lakes Fish. Comm. Tech. Rep. 3. 166 pp. Supple-ment covering the years 1%168, 1970. 90 pp.
HARTMAN, W. L.1973. Effects of exploitation, environmental changes, and new species on the fish habi-
tats and resources of Lake Erie. Great Lakes Fish. Comm: Tech. Rep. 22.43 pp.HEYERDAHL, E. G., and L. L. SMITH. JR.
1971. Annual catch of yellow perch from Red Lakes, Minnesota, in relation to growthrate and fishing effort. Univ. Minn. Agric. Exp. Stn. Tech. Bull. 285. 51 pp.
RICKER, W. E.1954. Stock and recruitment. J. Fish. Res. Board Can. 11:559-623.1975. Computation and interpretation of biological statistics of fish populations. Bull.
Fish. Res. Board Can. 191. 382 pp.SMITH, S. H., J. J. BUETTNER, and R. HILE.
1961. Fishery statistical districts of the Great Lakes. Great Lakes Fish. Comm. Tech.Rep. 2. 24 pp.
32