Embed Size (px)
Citation preview
524 www.eymj.org
INTRODUCTION
Pedicle screw instrumented fusion is used as a safe and effec-tive treatment for adult lumbar spondylolisthesis and other spondylosis.1,2 However, it is associated with extensive blood
loss, a lengthy hospital stay, significant cost, and high reopera-tion rates.3,4 Standard instrumented fusion requires extensive tissue dissection to expose entry points that provide the later-al-to-medial orientation for optimal screw trajectory. Extensive injury to the back muscles during surgery has been shown to correlate with poor long-term outcomes.5,6
To overcome these problems, minimally invasive instrument-ed fusion through small, separate wounds without extensive tissue dissection has been introduced.7 This technique signifi-cantly reduces back muscle injury and blood loss, which leads to better trunk muscle performance and faster recovery and rehabilitation.8 However, the potential benefits of minimized tissue disruption, reduced blood loss, and shorter hospital stay must be weighed against the increased rate of neurological complications associated with this technique.9 Moreover, hard-ware-related complications and pseudarthrosis have been re-
Received: December 6, 2017 Revised: January 23, 2018Accepted: March 5, 2018Corresponding author: Dr. Yung Park, Department of Orthopedic Surgery, Nation-al Health Insurance Service Ilsan Hospital, 100 Ilsan-ro, Ilsandong-gu, Goyang 10444, Korea.Tel: 82-31-900-0270, Fax: 82-31-900-0343, E-mail: [email protected]
•The authors have no financial conflicts of interest.
© Copyright: Yonsei University College of Medicine 2018This is an Open Access article distributed under the terms of the Creative Com-mons Attribution Non-Commercial License (http://creativecommons.org/licenses/by-nc/4.0) which permits unrestricted non-commercial use, distribution, and repro-duction in any medium, provided the original work is properly cited.
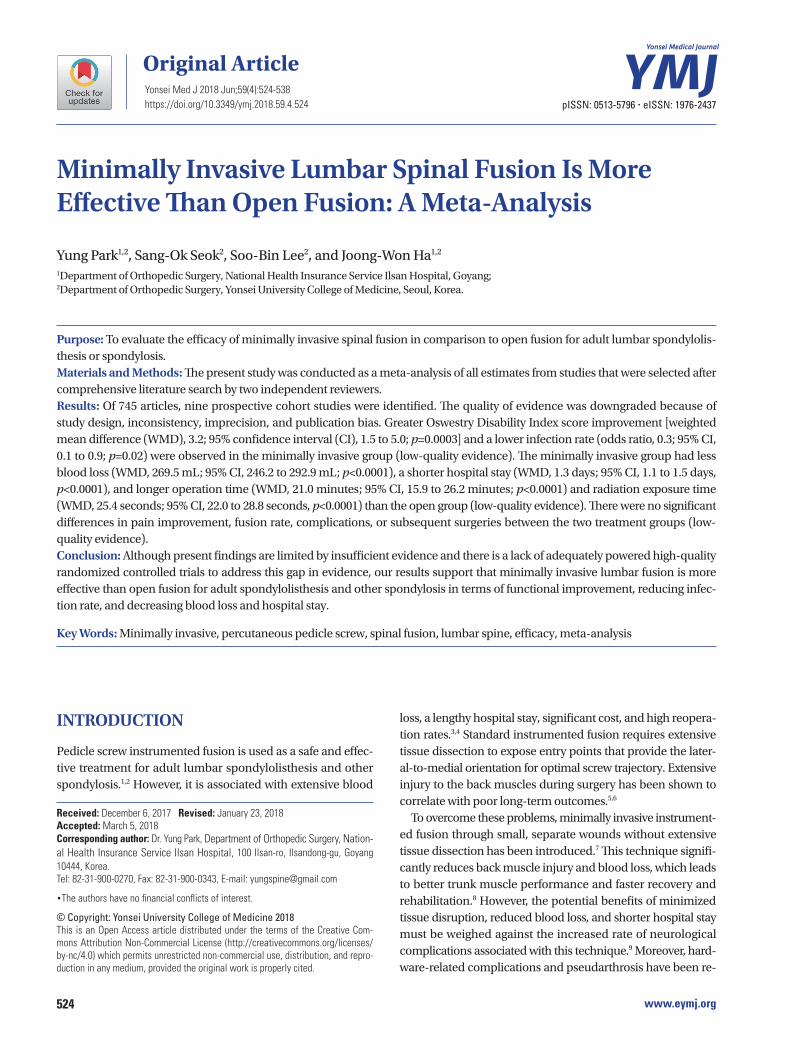
Minimally Invasive Lumbar Spinal Fusion Is More Effective Than Open Fusion: A Meta-Analysis
Yung Park1,2, Sang-Ok Seok2, Soo-Bin Lee2, and Joong-Won Ha1,2
1Department of Orthopedic Surgery, National Health Insurance Service Ilsan Hospital, Goyang; 2Department of Orthopedic Surgery, Yonsei University College of Medicine, Seoul, Korea.
Purpose: To evaluate the efficacy of minimally invasive spinal fusion in comparison to open fusion for adult lumbar spondylolis-thesis or spondylosis.Materials and Methods: The present study was conducted as a meta-analysis of all estimates from studies that were selected after comprehensive literature search by two independent reviewers. Results: Of 745 articles, nine prospective cohort studies were identified. The quality of evidence was downgraded because of study design, inconsistency, imprecision, and publication bias. Greater Oswestry Disability Index score improvement [weighted mean difference (WMD), 3.2; 95% confidence interval (CI), 1.5 to 5.0; p=0.0003] and a lower infection rate (odds ratio, 0.3; 95% CI, 0.1 to 0.9; p=0.02) were observed in the minimally invasive group (low-quality evidence). The minimally invasive group had less blood loss (WMD, 269.5 mL; 95% CI, 246.2 to 292.9 mL; p<0.0001), a shorter hospital stay (WMD, 1.3 days; 95% CI, 1.1 to 1.5 days, p<0.0001), and longer operation time (WMD, 21.0 minutes; 95% CI, 15.9 to 26.2 minutes; p<0.0001) and radiation exposure time (WMD, 25.4 seconds; 95% CI, 22.0 to 28.8 seconds, p<0.0001) than the open group (low-quality evidence). There were no significant differences in pain improvement, fusion rate, complications, or subsequent surgeries between the two treatment groups (low-quality evidence).Conclusion: Although present findings are limited by insufficient evidence and there is a lack of adequately powered high-quality randomized controlled trials to address this gap in evidence, our results support that minimally invasive lumbar fusion is more effective than open fusion for adult spondylolisthesis and other spondylosis in terms of functional improvement, reducing infec-tion rate, and decreasing blood loss and hospital stay.
Key Words: Minimally invasive, percutaneous pedicle screw, spinal fusion, lumbar spine, efficacy, meta-analysis
Original Article
pISSN: 0513-5796 · eISSN: 1976-2437Yonsei Med J 2018 Jun;59(4):524-538https://doi.org/10.3349/ymj.2018.59.4.524
525
Yung Park, et al.
https://doi.org/10.3349/ymj.2018.59.4.524
ported in recent studies.10,11
Evidence regarding the efficacy of minimally invasive lum-bar spinal fusion employing percutaneous pedicle screws ex-clusively for posterior augmentation has not been synthe-sized, while plenty of meta-analyses have explored mixed data from studies that utilized conventional pedicle screws for mini-open instrumentation as an alternative to percutaneous pedi-cle screws. The primary purpose of the current study was to in-vestigate the efficacy of minimally invasive instrumented fusion for adult lumbar spondylolisthesis and other spondylosis. We compared minimally invasive and open pedicle screw instru-mented lumbar fusion, especially with respect to 1) pain and functional improvements and fusion rate, 2) complications and subsequent surgeries, and 3) perioperative outcomes (blood loss, hospital stay, operation time, and radiation exposure time).
MATERIALS AND METHODS
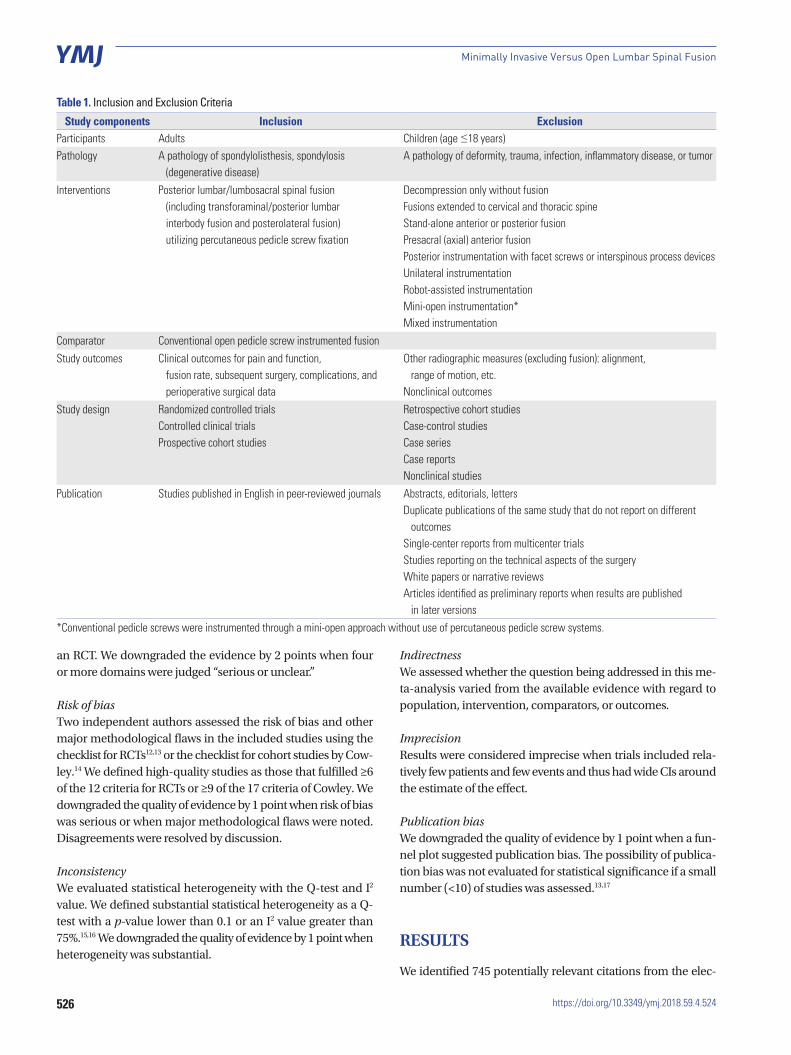
We conducted a thorough and comprehensive review of the literature according to the guidelines for performance and re-porting of systematic reviews and meta-analyses outlined in the Meta-analysis of Observational Studies in Epidemiology (MOOSE)12 and Preferred Reporting Items for Systematic Re-views and Meta-analyses (PRISMA).13 This study was exempt from Institutional Review Board review. We searched the litera-ture comparing minimally invasive lumbar spinal fusion with open fusion, including transforaminal lumbar interbody fu-sion (TLIF), posterior lumbar interbody fusion (PLIF), or pos-terolateral fusion (PLF), for the treatment of spondylolisthesis and other spondylosis. The literature searches were restricted to randomized controlled trials (RCTs), controlled clinical tri-als (or quasi-RCTs), and prospective cohort studies published in English. The searches were also limited to studies in which percutaneous pedicle screws were exclusively utilized for pos-terior spinal fixation in the intervention group. Studies with instrumented conventional pedicle screws instead of percuta-neous pedicle screws and a mini-open approach were exclud-ed. We also identified articles with overlapping populations and sought to determine the extent of overlap. In the case of substantial overlap (patients in one article were a subset of those in a larger study), the smaller study was excluded. Our detailed eligibility criteria are listed in Table 1.
For inclusion in the present analysis, studies must have re-ported the following primary outcomes: postoperative back pain and leg pain improvement measured via a visual analogue scale (VAS); functional improvement measured via Oswestry Disability Index (ODI) score; fusion rate; complications (neu-rological, hardware-related, and surgical-site complications); subsequent surgeries (revision, removal, reoperation, and sup-plemental fixation); and perioperative outcomes (blood loss, length of hospital stay, operation time, and radiation exposure time).
Literature search and study selectionTwo authors independently performed a comprehensive lit-erature search of PubMed, Embase, and the Cochrane Library database for relevant studies published up to December 2017 using derivatives of the following Medical Subject Headings (MeSH): percutaneous pedicle screw, minimally invasive fu-sion, minimally invasive arthrodesis, mini-open fusion, mini-open arthrodesis, minimal access fusion, and minimal access arthrodesis. The detailed search strategy is illustrated in Supple-mentary Table 1 (only online). The reference lists of included articles were also systematically checked to identify additional eligible articles.
One reviewer (SOS) screened titles and abstracts to deter-mine potential inclusion, with a 10% random sample of records independently screened by a second reviewer (SBL). Articles were double blind coded. Inclusion was subsequently con-firmed by a team of three reviewers (SOS, SBL, and JWH) who independently checked the full text of all retrieved articles. Uncertainties and disagreements were resolved through team discussion and/or contact with study authors.
Data extraction and analysisThe study reviewers then used a custom data extraction form to extract relevant study data in duplicate. Data elements extract-ed included methodology data to confirm study eligibility, study design, patient demographics, performed interventions, outcomes of interest, statistical methods, and study results. One reviewer (SOS) then entered extracted data into a spread-sheet (Microsoft Excel 2013, Microsoft Corp., Redmond, WA, USA) with the accuracy of data entry confirmed by the second reviewer (SBL).
We pooled data from each included study and performed meta-analyses (both fixed-effect and random-effects methods) using Comprehensive Meta-Analysis software package Ver-sion 2 (Biostat, Englewood, NJ, USA) and STATA Version 14.0 (Stata Corp., College Station, TX, USA). The odds ratio (OR) for the intervention group and the accompanying 95% confidence interval (CI) were calculated for dichotomous outcomes, and the weighted mean difference (WMD) and 95% CI were calcu-lated for continuous outcomes. We reported outcome measures according to the length of follow up: short (<1 year), interme-diate (1 to 5 years), and long-term (≥5 years). Pain and func-tional improvements were analyzed using data from baseline to last follow-up. Fusion rate, complications, and subsequent sur-geries were analyzed using data from the last follow-up visit.
The overall quality of evidence for each outcome was cate-gorized as high, moderate, low, or very low according to the Grading of Recommendations Assessment, Development and Evaluation (GRADE) protocol.12,13 Five specific domains were used for grading study quality: risk of bias, inconsistency, in-directness, imprecision, and publication bias. We downgraded the evidence by 1 point when fewer than three domains were judged “serious or unclear” or when the study design was not
526
Minimally Invasive Versus Open Lumbar Spinal Fusion
https://doi.org/10.3349/ymj.2018.59.4.524
an RCT. We downgraded the evidence by 2 points when four or more domains were judged “serious or unclear.”
Risk of biasTwo independent authors assessed the risk of bias and other major methodological flaws in the included studies using the checklist for RCTs12,13 or the checklist for cohort studies by Cow-ley.14 We defined high-quality studies as those that fulfilled ≥6 of the 12 criteria for RCTs or ≥9 of the 17 criteria of Cowley. We downgraded the quality of evidence by 1 point when risk of bias was serious or when major methodological flaws were noted. Disagreements were resolved by discussion.
InconsistencyWe evaluated statistical heterogeneity with the Q-test and I2 value. We defined substantial statistical heterogeneity as a Q-test with a p-value lower than 0.1 or an I2 value greater than 75%.15,16 We downgraded the quality of evidence by 1 point when heterogeneity was substantial.
IndirectnessWe assessed whether the question being addressed in this me-ta-analysis varied from the available evidence with regard to population, intervention, comparators, or outcomes.
ImprecisionResults were considered imprecise when trials included rela-tively few patients and few events and thus had wide CIs around the estimate of the effect.
Publication biasWe downgraded the quality of evidence by 1 point when a fun-nel plot suggested publication bias. The possibility of publica-tion bias was not evaluated for statistical significance if a small number (<10) of studies was assessed.13,17
RESULTS
We identified 745 potentially relevant citations from the elec-
Table 1. Inclusion and Exclusion Criteria
Study components Inclusion ExclusionParticipants Adults Children (age ≤18 years)Pathology A pathology of spondylolisthesis, spondylosis
(degenerative disease)A pathology of deformity, trauma, infection, inflammatory disease, or tumor
Interventions Posterior lumbar/lumbosacral spinal fusion (including transforaminal/posterior lumbar interbody fusion and posterolateral fusion) utilizing percutaneous pedicle screw fixation
Decompression only without fusionFusions extended to cervical and thoracic spineStand-alone anterior or posterior fusionPresacral (axial) anterior fusionPosterior instrumentation with facet screws or interspinous process devicesUnilateral instrumentationRobot-assisted instrumentationMini-open instrumentation*Mixed instrumentation
Comparator Conventional open pedicle screw instrumented fusion
Study outcomes Clinical outcomes for pain and function, fusion rate, subsequent surgery, complications, and perioperative surgical data
Other radiographic measures (excluding fusion): alignment, range of motion, etc.
Nonclinical outcomes
Study design Randomized controlled trialsControlled clinical trialsProspective cohort studies
Retrospective cohort studiesCase-control studiesCase seriesCase reportsNonclinical studies
Publication Studies published in English in peer-reviewed journals Abstracts, editorials, lettersDuplicate publications of the same study that do not report on different
outcomesSingle-center reports from multicenter trialsStudies reporting on the technical aspects of the surgeryWhite papers or narrative reviewsArticles identified as preliminary reports when results are published
in later versions
*Conventional pedicle screws were instrumented through a mini-open approach without use of percutaneous pedicle screw systems.
527
Yung Park, et al.
https://doi.org/10.3349/ymj.2018.59.4.524
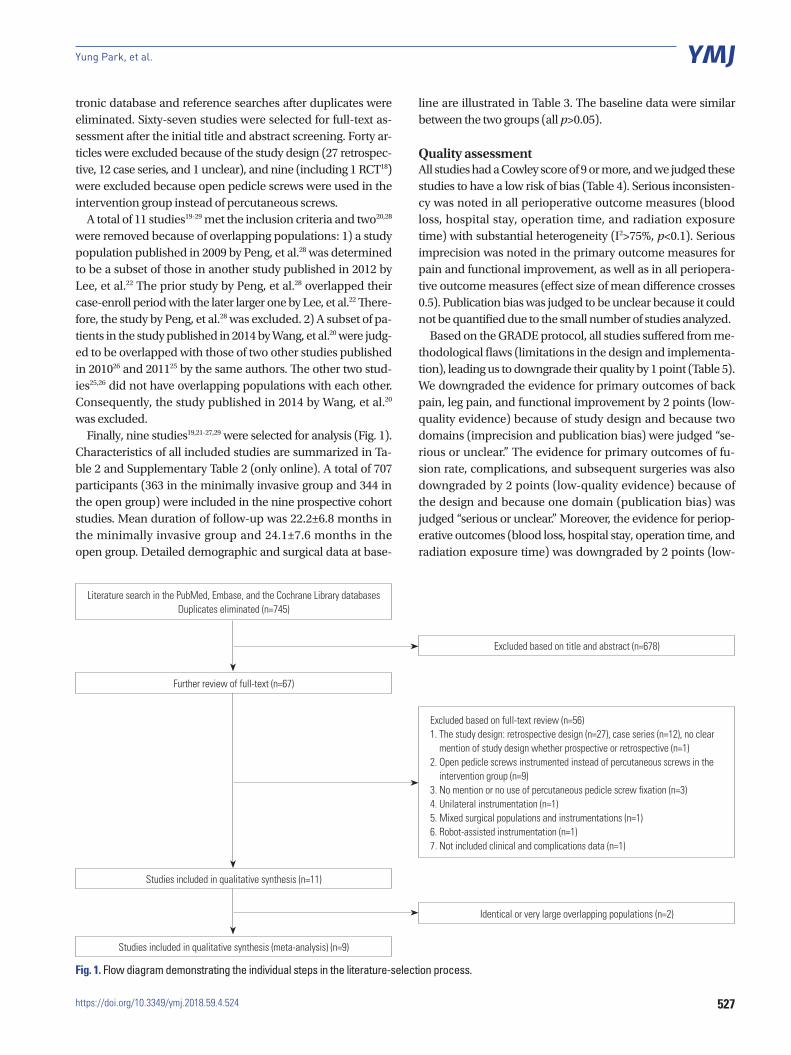
tronic database and reference searches after duplicates were eliminated. Sixty-seven studies were selected for full-text as-sessment after the initial title and abstract screening. Forty ar-ticles were excluded because of the study design (27 retrospec-tive, 12 case series, and 1 unclear), and nine (including 1 RCT18) were excluded because open pedicle screws were used in the intervention group instead of percutaneous screws.
A total of 11 studies19-29 met the inclusion criteria and two20,28 were removed because of overlapping populations: 1) a study population published in 2009 by Peng, et al.28 was determined to be a subset of those in another study published in 2012 by Lee, et al.22 The prior study by Peng, et al.28 overlapped their case-enroll period with the later larger one by Lee, et al.22 There-fore, the study by Peng, et al.28 was excluded. 2) A subset of pa-tients in the study published in 2014 by Wang, et al.20 were judg-ed to be overlapped with those of two other studies published in 201026 and 201125 by the same authors. The other two stud-ies25,26 did not have overlapping populations with each other. Consequently, the study published in 2014 by Wang, et al.20 was excluded.
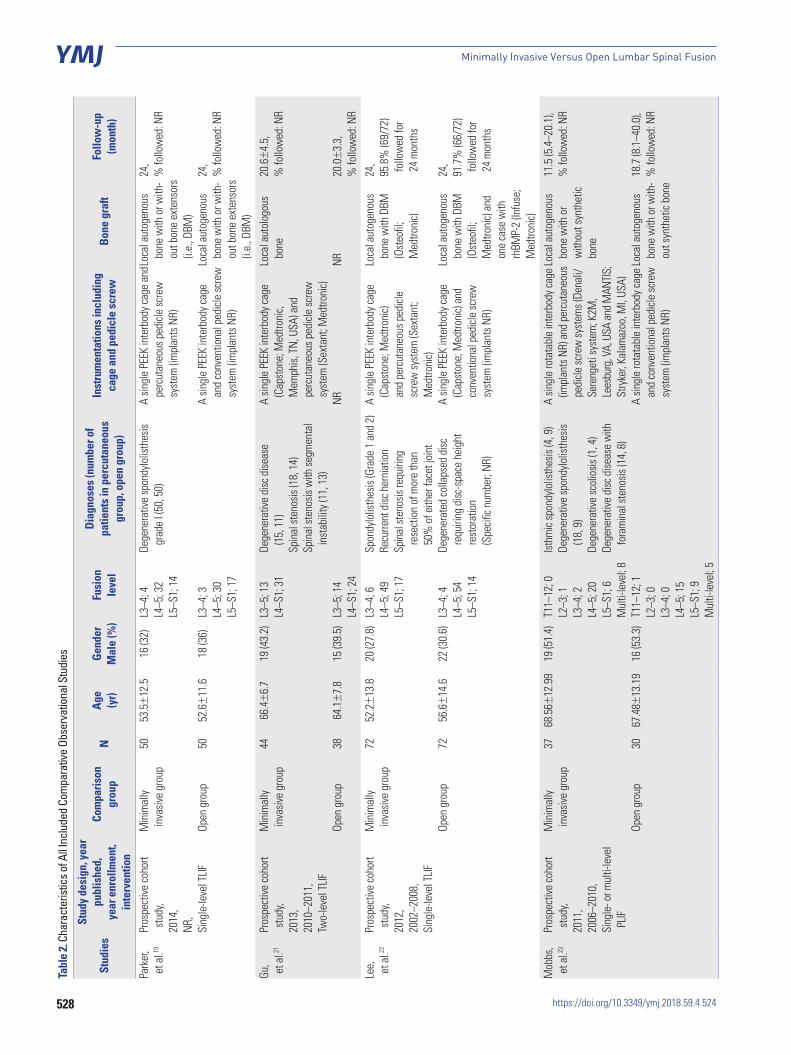
Finally, nine studies19,21-27,29 were selected for analysis (Fig. 1). Characteristics of all included studies are summarized in Ta-ble 2 and Supplementary Table 2 (only online). A total of 707 participants (363 in the minimally invasive group and 344 in the open group) were included in the nine prospective cohort studies. Mean duration of follow-up was 22.2±6.8 months in the minimally invasive group and 24.1±7.6 months in the open group. Detailed demographic and surgical data at base-
line are illustrated in Table 3. The baseline data were similar between the two groups (all p>0.05).
Quality assessmentAll studies had a Cowley score of 9 or more, and we judged these studies to have a low risk of bias (Table 4). Serious inconsisten-cy was noted in all perioperative outcome measures (blood loss, hospital stay, operation time, and radiation exposure time) with substantial heterogeneity (I2>75%, p<0.1). Serious imprecision was noted in the primary outcome measures for pain and functional improvement, as well as in all periopera-tive outcome measures (effect size of mean difference crosses 0.5). Publication bias was judged to be unclear because it could not be quantified due to the small number of studies analyzed.
Based on the GRADE protocol, all studies suffered from me-thodological flaws (limitations in the design and implementa-tion), leading us to downgrade their quality by 1 point (Table 5). We downgraded the evidence for primary outcomes of back pain, leg pain, and functional improvement by 2 points (low-quality evidence) because of study design and because two domains (imprecision and publication bias) were judged “se-rious or unclear.” The evidence for primary outcomes of fu-sion rate, complications, and subsequent surgeries was also downgraded by 2 points (low-quality evidence) because of the design and because one domain (publication bias) was judged “serious or unclear.” Moreover, the evidence for periop-erative outcomes (blood loss, hospital stay, operation time, and radiation exposure time) was downgraded by 2 points (low-
Literature search in the PubMed, Embase, and the Cochrane Library databases Duplicates eliminated (n=745)
Excluded based on title and abstract (n=678)
Identical or very large overlapping populations (n=2)
Excluded based on full-text review (n=56)1. The study design: retrospective design (n=27), case series (n=12), no clear
mention of study design whether prospective or retrospective (n=1)2. Open pedicle screws instrumented instead of percutaneous screws in the
intervention group (n=9)3. No mention or no use of percutaneous pedicle screw fixation (n=3)4. Unilateral instrumentation (n=1)5. Mixed surgical populations and instrumentations (n=1)6. Robot-assisted instrumentation (n=1)7. Not included clinical and complications data (n=1)
Studies included in qualitative synthesis (meta-analysis) (n=9)
Studies included in qualitative synthesis (n=11)
Fig. 1. Flow diagram demonstrating the individual steps in the literature-selection process.
Further review of full-text (n=67)
528
Minimally Invasive Versus Open Lumbar Spinal Fusion
https://doi.org/10.3349/ymj.2018.59.4.524
Tabl
e 2.
Char
acte
ristic
s of A
ll Inc
lude
d Co
mpa
rativ
e Ob
serv
atio
nal S
tudi
es
Stud
ies
Stud
y de
sign
, yea
r pu
blis
hed,
ye
ar e
nrol
lmen
t,in
terv
entio
n
Com
paris
on
grou
pN
Age
(yr)
Gend
er
Mal
e (%
)Fu
sion
leve
l
Diag
nose
s (n
umbe
r of
patie
nts
in p
ercu
tane
ous
grou
p, o
pen
grou
p)
Inst
rum
enta
tions
incl
udin
g ca
ge a
nd p
edic
le s
crew
Bone
gra
ftFo
llow
-up
(mon
th)
Park
er,
et a
l.19
Pros
pect
ive co
hort
s
tudy
, 20
14,
NR,
Sing
le-le
vel T
LIF
Min
imal
ly
inv
asive
gro
up
Open
gro
up
50 50
53.5
±12
.5
52.6
±11
.6
16 (3
2)
18 (3
6)
L3–4
; 4L4
–5; 3
2L5
–S1;
14
L3–4
; 3L4
–5; 3
0L5
–S1;
17
Dege
nera
tive
spon
dylo
listh
esis
gr
ade
I (50
, 50)
A sin
gle
PEEK
inte
rbod
y cag
e an
d pe
rcut
aneo
us p
edicl
e sc
rew
sy
stem
(im
plan
ts N
R)
A sin
gle
PEEK
inte
rbod
y cag
e an
d co
nven
tiona
l ped
icle
scre
w
syst
em (i
mpl
ants
NR)
Loca
l aut
ogen
ous
bone
with
or w
ith-
out b
one
exte
nsor
s (i.
e., D
BM)
Loca
l aut
ogen
ous
bone
with
or w
ith-
out b
one
exte
nsor
s (i.
e., D
BM)
24,
% fo
llow
ed: N
R
24,
% fo
llow
ed: N
R
Gu,
et a
l.21
Pros
pect
ive co
hort
s
tudy
, 20
13,
2010
–201
1,Tw
o-le
vel T
LIF
Min
imal
ly
inv
asive
gro
up
Open
gro
up
44 38
66.4
±6.
7
64.1
±7.
8
19 (4
3.2)
15 (3
9.5)
L3–5
; 13
L4–S
1; 3
1
L3–5
; 14
L4–S
1; 2
4
Dege
nera
tive
disc
dise
ase
(15,
11)
Spin
al st
enos
is (1
8, 1
4)Sp
inal
sten
osis
with
segm
enta
l in
stab
ility
(11,
13)
A sin
gle
PEEK
inte
rbod
y cag
e (C
apst
one;
Med
troni
c,
Mem
phis,
TN,
USA
) and
pe
rcut
aneo
us p
edicl
e sc
rew
sy
stem
(Sex
tant
; Med
troni
c)NR
Loca
l aut
olog
ous
bone
NR
20.6
±4.
5,
% fo
llow
ed: N
R
20.0
±3.
3,%
follo
wed
: NR
Lee,
e
t al.22
Pros
pect
ive co
hort
s
tudy
, 20
12,
2002
–200
8,Si
ngle
-leve
l TLIF
Min
imal
ly
inv
asive
gro
up
Open
gro
up
72 72
52.2
±13
.8
56.6
±14
.6
20 (2
7.8)
22 (3
0.6)
L3–4
; 6L4
–5; 4
9L5
–S1;
17
L3–4
; 4L4
–5; 5
4L5
–S1;
14
Spon
dylo
listh
esis
(Gra
de 1
and
2)
Recu
rrent
disc
her
niat
ion
Spin
al st
enos
is re
quiri
ng
rese
ctio
n of
mor
e th
an
50%
of e
ither
face
t joi
ntDe
gene
rate
d co
llaps
ed d
isc
requ
iring
disc
-spa
ce h
eigh
t re
stor
atio
n
(Spe
cific n
umbe
r; NR
)
A sin
gle
PEEK
inte
rbod
y cag
e (C
apst
one;
Med
troni
c)
and
perc
utan
eous
ped
icle
sc
rew
syst
em (S
exta
nt;
Med
troni
c)A
singl
e PE
EK in
terb
ody c
age
(Cap
ston
e; M
edtro
nic)
and
co
nven
tiona
l ped
icle
scre
w
syst
em (i
mpl
ants
NR)
Loca
l aut
ogen
ous
bone
with
DBM
(O
steo
fil;
Med
troni
c)
Loca
l aut
ogen
ous
bone
with
DBM
(O
steo
fil;
Med
troni
c) an
d
one
case
with
rh
BMP-
2 (In
fuse
; M
edtro
nic)
24,
95.8
% (6
9/72
) f
ollo
wed
for
24
mon
ths
24,
91.7
% (6
6/72
) f
ollo
wed
for
24
mon
ths
Mob
bs,
et a
l.23
Pros
pect
ive co
hort
s
tudy
,20
11,
2006
–201
0,Si
ngle
- or m
ulti-
leve
l P
LIF
Min
imal
ly
inv
asive
gro
up
Open
gro
up
37 30
68.5
6±12
.99
67.4
8±13
.19
19 (5
1.4)
16 (5
3.3)
T11–
12; 0
L2–3
; 1L3
–4; 2
L4–5
; 20
L5–S
1; 6
Mul
ti-le
vel;
8T1
1–12
; 1L2
–3; 0
L3–4
; 0L4
–5; 1
5L5
–S1;
9M
ulti-
leve
l; 5
Isthm
ic sp
ondy
lolis
thes
is (4
, 9)
Dege
nera
tive
spon
dylo
listh
esis
(1
8, 9
) De
gene
rativ
e sc
olio
sis (1
, 4)
Dege
nera
tive
disc
dise
ase
with
fo
ram
inal
sten
osis
(14,
8)
A sin
gle
rota
tabl
e in
terb
ody c
age
(impl
ants
NR)
and
per
cuta
neou
s pe
dicle
scre
w sy
stem
s (De
nali/
Sere
nget
i sys
tem
; K2M
, Le
esbu
rg, V
A, U
SA a
nd M
ANTI
S;
Stry
ker,
Kala
maz
oo, M
I, US
A)A
singl
e ro
tata
ble
inte
rbod
y cag
e an
d co
nven
tiona
l ped
icle
scre
w
syst
em (i
mpl
ants
NR)
Loca
l aut
ogen
ous
bone
with
or
with
out s
ynth
etic
bone
Loca
l aut
ogen
ous
bone
with
or w
ith-
out s
ynth
etic
bone
11.5
(5.4
–20.
1),
% fo
llow
ed: N
R
18.7
(8.1
–40.
0),
% fo
llow
ed: N
R

529
Yung Park, et al.
https://doi.org/10.3349/ymj.2018.59.4.524
Tabl
e 2.
Char
acte
ristic
s of A
ll Inc
lude
d Co
mpa
rativ
e Ob
serv
atio
nal S
tudi
es (c
ontin
ued)
Stud
ies
Stud
y de
sign
, yea
r pu
blis
hed,
ye
ar e
nrol
lmen
t,in
terv
entio
n
Com
paris
on
grou
pN
Age
(yr)
Gend
er
Mal
e (%
)Fu
sion
leve
lDi
agno
ses
(num
ber o
f pat
ient
s in
per
cuta
neou
s gr
oup,
ope
n gr
oup)
Inst
rum
enta
tions
incl
udin
g ca
ge a
nd p
edic
le s
crew
Bone
gra
ftFo
llow
-up
(mon
ths)
Kota
ni,
et a
l.24Pr
ospe
ctive
coho
rt
stu
dy,
2011
,20
05–N
R,Si
ngle
-leve
l PLF
Min
imal
ly in
vasiv
e gr
oup
Open
gro
up
43 37
63±
9
66±
9
14 (3
2.6)
12 (3
2.4)
L3–4
; 4L4
–5; 7
6(n
o sp
ecifi
c de
clara
tion
betw
een
grou
ps)De
gene
rativ
e sp
ondy
lolis
thes
is
(43,
37)
Perc
utan
eous
ped
icle
scre
w
syst
em (S
exta
nt; M
edtro
nic)
Conv
entio
nal p
olya
xial p
edicl
e sc
rew
and
rod
syst
em
(impl
ants
NR)
Auto
geno
us p
oste
rior
iliac
cres
t bon
eAu
toge
nous
pos
terio
r ili
ac cr
est b
one
32 (2
4–49
),%
follo
wed
: NR
40 (2
4–60
),%
follo
wed
: NR
Wan
g,
et a
l.25Pr
ospe
ctive
coho
rt
stu
dy,
2011
,20
06–2
008,
Sing
le- o
r tw
o-le
vel
TLIF
Min
imal
ly in
vasiv
e gr
oup
Open
gro
up
25 27
54.
8±10
.9
56.
2±13
.6
13 (5
2.0)
15 (5
5.6)
L3–4
; 2L4
–5; 1
1L5
–S1;
9Tw
o-le
vel;
3L3
–4; 2
L4–5
; 11
L5–S
1; 1
0Tw
o-le
vel;
4
Recu
rrent
disc
her
niat
ion
(7, 8
)Po
stsu
rgica
l for
amin
al st
enos
is
(10,
9)
Post
surg
ical s
egm
enta
l ins
tabi
lity
(5, 7
)Po
stsu
rgica
l spo
ndylo
listh
esis
grad
e 1
(3, 3
)
A sin
gle
PEEK
inte
rbod
y cag
e (O
IC; S
tryke
r) an
d
perc
utan
eous
ped
icle
scre
w
syst
em (S
exta
nt; M
edtro
nic)
A sin
gle
PEEK
inte
rbod
y cag
e (O
IC; S
tryke
r) an
d
conv
entio
nal p
edicl
e sc
rew
sy
stem
(im
plan
ts N
R)
Loca
l aut
ogen
ous
bone
with
or w
ithou
t au
toge
nous
ilia
c cr
est b
one
NR
Over
all,
27.5
(1
2–38
), %
follo
wed
: NR
Wan
g,
et a
l.26Pr
ospe
ctive
coho
rt
stu
dy,
2010
,20
06–2
008,
Sing
le-le
vel T
LIF
Min
imal
ly in
vasiv
e gr
oup
Open
gro
up
42 43
47.9
±8.
5
53.
2±10
.6
13 (3
0.1)
16 (3
7.2)
L3–4
; 3L4
–5; 2
1L5
–S1;
18
L3–4
; 3L4
–5; 2
3L5
–S1;
17
Dege
nera
tive
spon
dylo
listh
esis
(2
4, 2
2)
Isthm
ic sp
ondy
lolis
thes
is (1
8, 2
1)
A sin
gle
PEEK
inte
rbod
y cag
e (O
IC, S
tryke
r) an
d
perc
utan
eous
ped
icle
scre
w
syst
em (S
exta
nt; M
edtro
nic)
NR
Loca
l aut
ogen
ous
bone
NR
Over
all,
26.3
(1
3–35
), %
follo
wed
: NR
Schi
zas,
et a
l.27Pr
ospe
ctive
coho
rt
stu
dy,
2008
,NR
,Si
ngle
-leve
l TLIF
Min
imal
ly in
vasiv
e gr
oup
Open
gro
up
18 18
45.5
±NR
48.1
±NR
NR NR
L5–S
1; 1
2Ot
her l
evel
(sp
ecifi
c le
vel;N
R); 6
L5–S
1; 1
1Ot
her l
evel
(spe
cific
leve
l; NR
); 7
Isthm
ic sp
ondy
lolis
thes
is (1
5, 6
)De
gene
rativ
e di
sc d
iseas
e w
ith
fora
min
al st
enos
is (2
, 12)
Iatro
geni
c spo
ndylo
lysis
(1, 0
)
A sin
gle
PEEK
inte
rbod
y cag
e (M
edtro
nic)
and
perc
utan
eous
pe
dicle
scre
w sy
stem
[S
exta
nt (1
1 ca
ses);
M
edtro
nic a
nd V
iper
(7 ca
ses);
De
Puy S
pine
, USA
]NR
Loca
l aut
olog
ous
bone
with
au
toge
nous
ilia
c cr
est b
one
Loca
l aut
olog
ous
bone
with
au
toge
nous
ilia
c cr
est b
one
22,
% fo
llow
ed: N
R
24,
% fo
llow
ed: N
R
Park
and
H
a29Pr
ospe
ctive
coho
rt
stu
dy,
2007
,20
03–2
004,
Sing
le-le
vel P
LIF
Min
imal
ly in
vasiv
e gr
oup
Open
gro
up
32 29
62.1
±9.
6
59.0
±12
.2
8 (2
5)
13 (4
4.8)
L3–4
; 2L4
–5; 2
3L5
–S1;
7
L3–4
; 3L4
–5; 1
8L5
–S1;
8
Isthm
ic sp
ondy
lolis
thes
is (6
, 7)
Dege
nera
tive
spon
dylo
listh
esis
(7
, 5)
Lum
bar d
isc h
erni
atio
n (1
, 3)
Spin
al st
enos
is w
ith se
gmen
tal
inst
abili
ty (1
8, 1
4)
A sin
gle
PEEK
inte
rbod
y cag
e (Te
lam
on; M
edtro
nic)
and
perc
utan
eous
ped
icle
scre
w
syst
em (S
exta
nt; M
edtro
nic)
A sin
gle
PEEK
inte
rbod
y cag
e (Te
lam
on; M
edtro
nic)
and
co
nven
tiona
l ped
icle
scre
w
syst
em (i
mpl
ants
NR)
Loca
l aut
ogen
ous
bone
Loca
l aut
ogen
ous
bone
12,
% fo
llow
ed: N
R
12,
% fo
llow
ed: N
R
TLIF,
tran
sfor
amin
al lu
mba
r int
erbo
dy fu
sion;
PLIF
, pos
terio
r lum
bar i
nter
body
fusio
n; P
LF, p
oste
rola
tera
l fus
ion;
PEE
K, p
olye
ther
ethe
rket
one;
NR,
not
repo
rted;
DBM
, dem
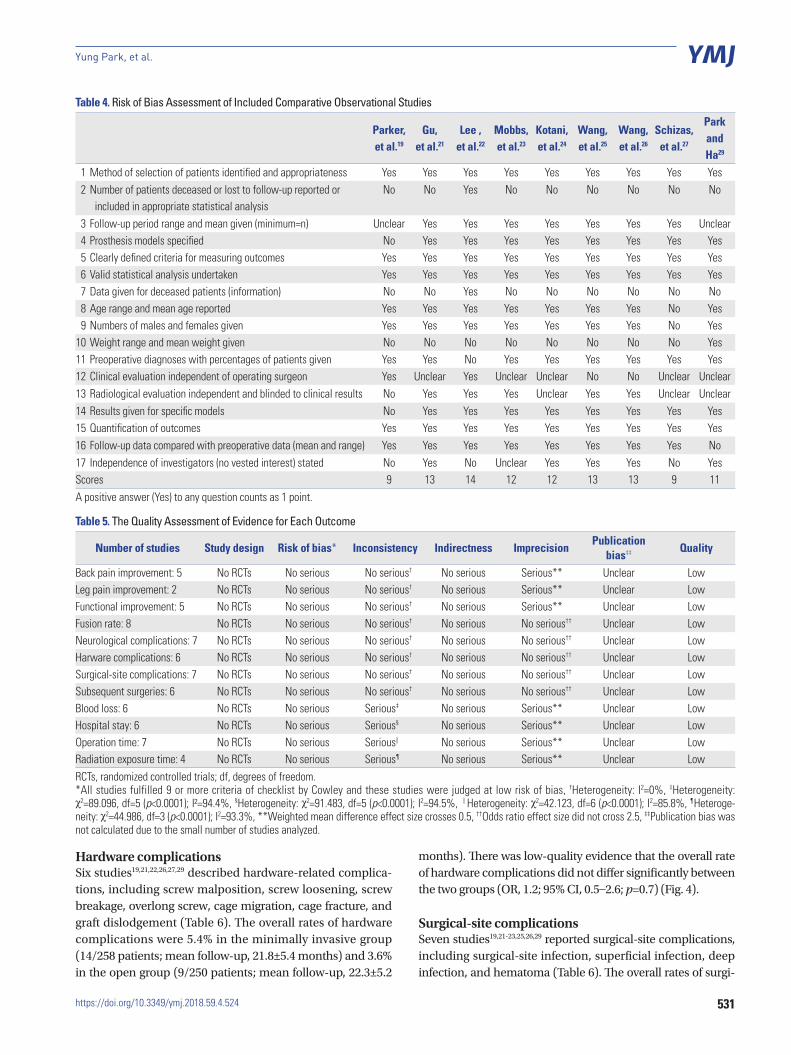
iner
alize
d bo
ne m
atrix
, and
rhBM
P-2,
reco
mbi
-na
nt h
uman
bon
e m
orph
ogen
etic
prot
ein-
2.
530
Minimally Invasive Versus Open Lumbar Spinal Fusion
https://doi.org/10.3349/ymj.2018.59.4.524
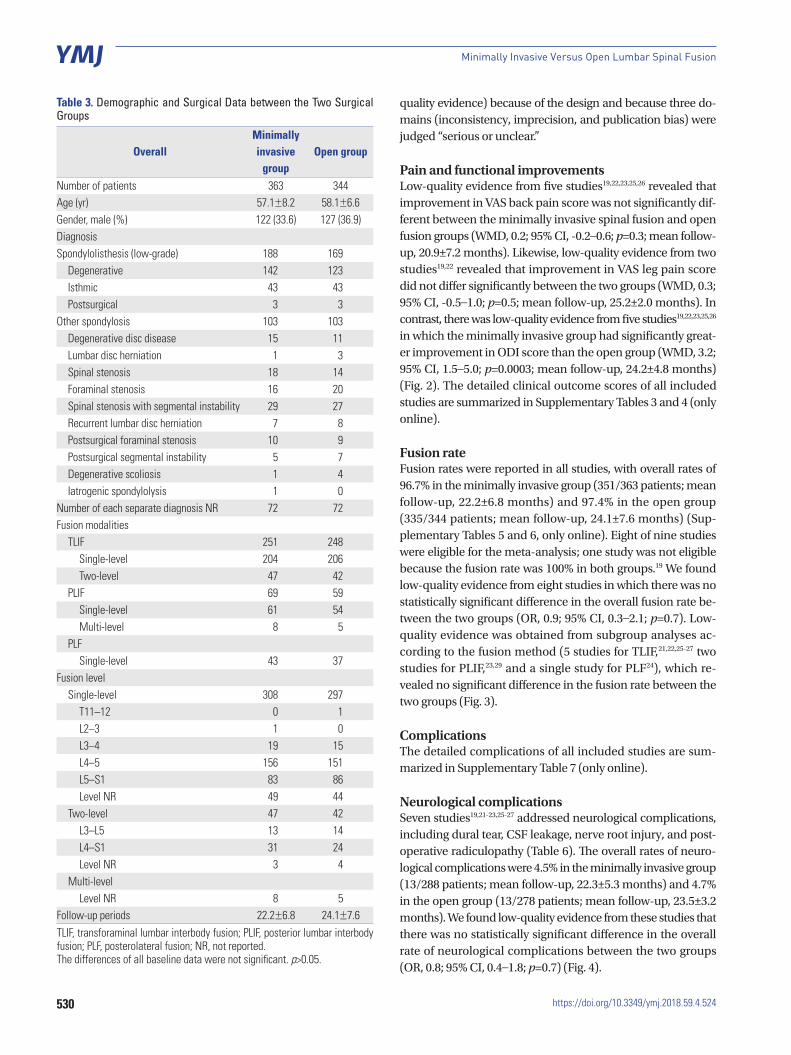
Table 3. Demographic and Surgical Data between the Two Surgical Groups
OverallMinimallyinvasive
groupOpen group
Number of patients 363 344Age (yr) 57.1±8.2 58.1±6.6Gender, male (%) 122 (33.6) 127 (36.9)DiagnosisSpondylolisthesis (low-grade) 188 169
Degenerative 142 123Isthmic 43 43Postsurgical 3 3
Other spondylosis 103 103Degenerative disc disease 15 11Lumbar disc herniation 1 3Spinal stenosis 18 14Foraminal stenosis 16 20Spinal stenosis with segmental instability 29 27Recurrent lumbar disc herniation 7 8Postsurgical foraminal stenosis 10 9Postsurgical segmental instability 5 7Degenerative scoliosis 1 4Iatrogenic spondylolysis 1 0
Number of each separate diagnosis NR 72 72Fusion modalities
TLIF 251 248Single-level 204 206Two-level 47 42
PLIF 69 59Single-level 61 54Multi-level 8 5
PLFSingle-level 43 37
Fusion levelSingle-level 308 297
T11–12 0 1L2–3 1 0L3–4 19 15L4–5 156 151L5–S1 83 86Level NR 49 44
Two-level 47 42L3–L5 13 14L4–S1 31 24Level NR 3 4
Multi-levelLevel NR 8 5
Follow-up periods 22.2±6.8 24.1±7.6TLIF, transforaminal lumbar interbody fusion; PLIF, posterior lumbar interbody fusion; PLF, posterolateral fusion; NR, not reported. The differences of all baseline data were not significant. p>0.05.
quality evidence) because of the design and because three do-mains (inconsistency, imprecision, and publication bias) were judged “serious or unclear.”
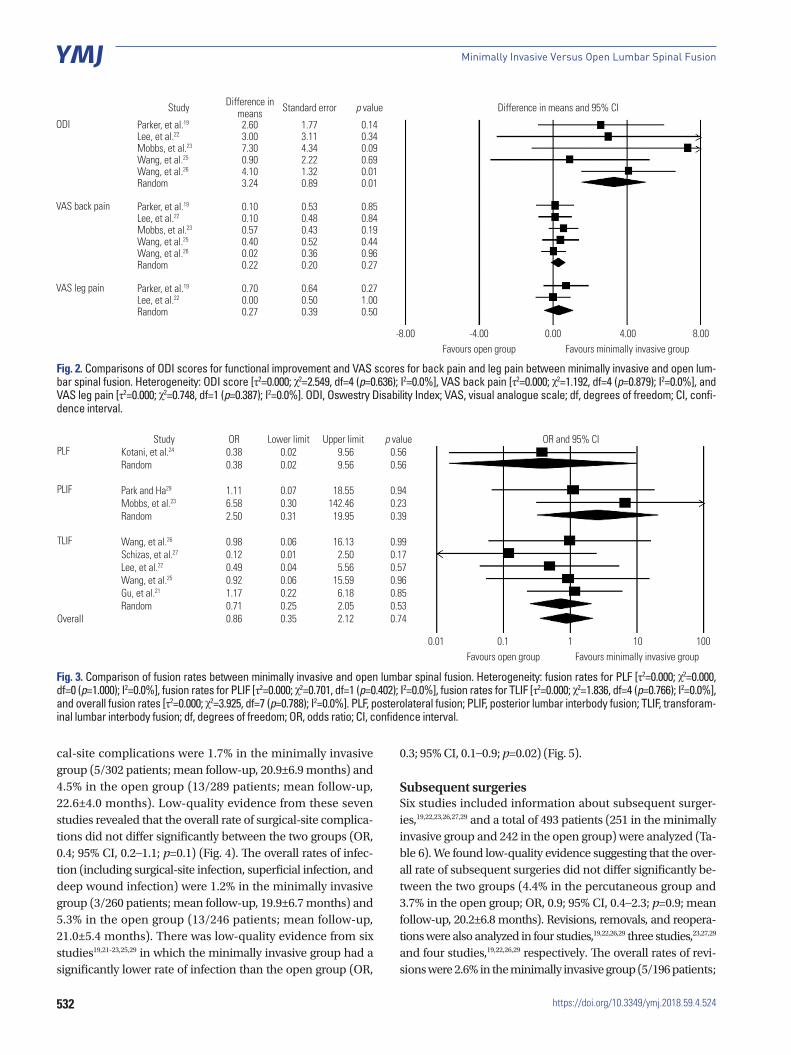
Pain and functional improvementsLow-quality evidence from five studies19,22,23,25,26 revealed that improvement in VAS back pain score was not significantly dif-ferent between the minimally invasive spinal fusion and open fusion groups (WMD, 0.2; 95% CI, -0.2–0.6; p=0.3; mean follow-up, 20.9±7.2 months). Likewise, low-quality evidence from two studies19,22 revealed that improvement in VAS leg pain score did not differ significantly between the two groups (WMD, 0.3; 95% CI, -0.5–1.0; p=0.5; mean follow-up, 25.2±2.0 months). In contrast, there was low-quality evidence from five studies19,22,23,25,26 in which the minimally invasive group had significantly great-er improvement in ODI score than the open group (WMD, 3.2; 95% CI, 1.5–5.0; p=0.0003; mean follow-up, 24.2±4.8 months) (Fig. 2). The detailed clinical outcome scores of all included studies are summarized in Supplementary Tables 3 and 4 (only online).
Fusion rateFusion rates were reported in all studies, with overall rates of 96.7% in the minimally invasive group (351/363 patients; mean follow-up, 22.2±6.8 months) and 97.4% in the open group (335/344 patients; mean follow-up, 24.1±7.6 months) (Sup-plementary Tables 5 and 6, only online). Eight of nine studies were eligible for the meta-analysis; one study was not eligible because the fusion rate was 100% in both groups.19 We found low-quality evidence from eight studies in which there was no statistically significant difference in the overall fusion rate be-tween the two groups (OR, 0.9; 95% CI, 0.3–2.1; p=0.7). Low-quality evidence was obtained from subgroup analyses ac-cording to the fusion method (5 studies for TLIF,21,22,25-27 two studies for PLIF,23,29 and a single study for PLF24), which re-vealed no significant difference in the fusion rate between the two groups (Fig. 3).
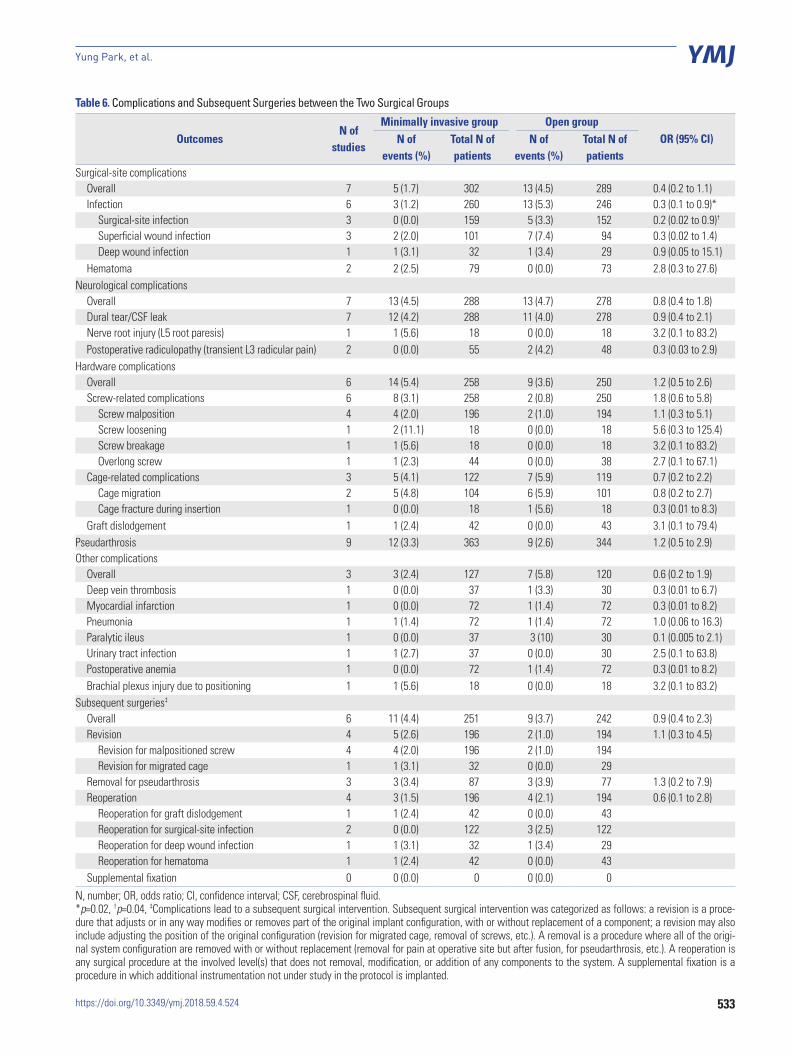
ComplicationsThe detailed complications of all included studies are sum-marized in Supplementary Table 7 (only online).
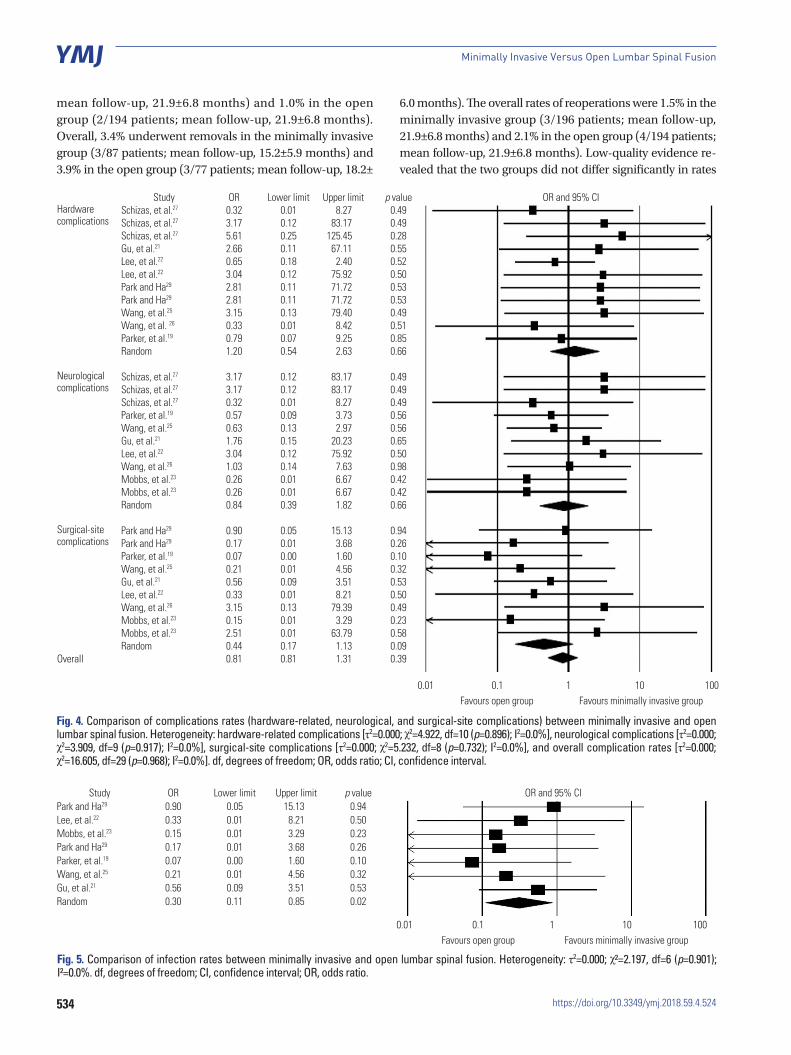
Neurological complicationsSeven studies19,21-23,25-27 addressed neurological complications, including dural tear, CSF leakage, nerve root injury, and post-operative radiculopathy (Table 6). The overall rates of neuro-logical complications were 4.5% in the minimally invasive group (13/288 patients; mean follow-up, 22.3±5.3 months) and 4.7% in the open group (13/278 patients; mean follow-up, 23.5±3.2 months). We found low-quality evidence from these studies that there was no statistically significant difference in the overall rate of neurological complications between the two groups (OR, 0.8; 95% CI, 0.4–1.8; p=0.7) (Fig. 4).
531
Yung Park, et al.
https://doi.org/10.3349/ymj.2018.59.4.524
Hardware complicationsSix studies19,21,22,26,27,29 described hardware-related complica-tions, including screw malposition, screw loosening, screw breakage, overlong screw, cage migration, cage fracture, and graft dislodgement (Table 6). The overall rates of hardware complications were 5.4% in the minimally invasive group (14/258 patients; mean follow-up, 21.8±5.4 months) and 3.6% in the open group (9/250 patients; mean follow-up, 22.3±5.2
months). There was low-quality evidence that the overall rate of hardware complications did not differ significantly between the two groups (OR, 1.2; 95% CI, 0.5–2.6; p=0.7) (Fig. 4).
Surgical-site complicationsSeven studies19,21-23,25,26,29 reported surgical-site complications, including surgical-site infection, superficial infection, deep infection, and hematoma (Table 6). The overall rates of surgi-
Table 4. Risk of Bias Assessment of Included Comparative Observational Studies
Parker, et al.19
Gu, et al.21
Lee ,et al.22
Mobbs, et al.23
Kotani, et al.24
Wang, et al.25
Wang, et al.26
Schizas, et al.27
Park andHa29
1 Method of selection of patients identified and appropriateness Yes Yes Yes Yes Yes Yes Yes Yes Yes2 Number of patients deceased or lost to follow-up reported or
included in appropriate statistical analysisNo No Yes No No No No No No
3 Follow-up period range and mean given (minimum=n) Unclear Yes Yes Yes Yes Yes Yes Yes Unclear4 Prosthesis models specified No Yes Yes Yes Yes Yes Yes Yes Yes5 Clearly defined criteria for measuring outcomes Yes Yes Yes Yes Yes Yes Yes Yes Yes6 Valid statistical analysis undertaken Yes Yes Yes Yes Yes Yes Yes Yes Yes7 Data given for deceased patients (information) No No Yes No No No No No No8 Age range and mean age reported Yes Yes Yes Yes Yes Yes Yes No Yes9 Numbers of males and females given Yes Yes Yes Yes Yes Yes Yes No Yes
10 Weight range and mean weight given No No No No No No No No Yes11 Preoperative diagnoses with percentages of patients given Yes Yes No Yes Yes Yes Yes Yes Yes12 Clinical evaluation independent of operating surgeon Yes Unclear Yes Unclear Unclear No No Unclear Unclear13 Radiological evaluation independent and blinded to clinical results No Yes Yes Yes Unclear Yes Yes Unclear Unclear14 Results given for specific models No Yes Yes Yes Yes Yes Yes Yes Yes15 Quantification of outcomes Yes Yes Yes Yes Yes Yes Yes Yes Yes16 Follow-up data compared with preoperative data (mean and range) Yes Yes Yes Yes Yes Yes Yes Yes No17 Independence of investigators (no vested interest) stated No Yes No Unclear Yes Yes Yes No YesScores 9 13 14 12 12 13 13 9 11A positive answer (Yes) to any question counts as 1 point.
Table 5. The Quality Assessment of Evidence for Each Outcome
Number of studies Study design Risk of bias* Inconsistency Indirectness ImprecisionPublication
bias‡‡ Quality
Back pain improvement: 5 No RCTs No serious No serious† No serious Serious** Unclear LowLeg pain improvement: 2 No RCTs No serious No serious† No serious Serious** Unclear LowFunctional improvement: 5 No RCTs No serious No serious† No serious Serious** Unclear LowFusion rate: 8 No RCTs No serious No serious† No serious No serious†† Unclear LowNeurological complications: 7 No RCTs No serious No serious† No serious No serious†† Unclear LowHarware complications: 6 No RCTs No serious No serious† No serious No serious†† Unclear LowSurgical-site complications: 7 No RCTs No serious No serious† No serious No serious†† Unclear LowSubsequent surgeries: 6 No RCTs No serious No serious† No serious No serious†† Unclear LowBlood loss: 6 No RCTs No serious Serious‡ No serious Serious** Unclear LowHospital stay: 6 No RCTs No serious Serious§ No serious Serious** Unclear LowOperation time: 7 No RCTs No serious Serious|| No serious Serious** Unclear LowRadiation exposure time: 4 No RCTs No serious Serious¶ No serious Serious** Unclear LowRCTs, randomized controlled trials; df, degrees of freedom.*All studies fulfilled 9 or more criteria of checklist by Cowley and these studies were judged at low risk of bias, †Heterogeneity: I2=0%, ‡Heterogeneity: χ2=89.096, df=5 (p<0.0001); I²=94.4%, §Heterogeneity: χ2=91.483, df=5 (p<0.0001); I2=94.5%, ∥Heterogeneity: χ2=42.123, df=6 (p<0.0001); I2=85.8%, ¶Heteroge-neity: χ2=44.986, df=3 (p<0.0001); I2=93.3%, **Weighted mean difference effect size crosses 0.5, ††Odds ratio effect size did not cross 2.5, ‡‡Publication bias was not calculated due to the small number of studies analyzed.
532
Minimally Invasive Versus Open Lumbar Spinal Fusion
https://doi.org/10.3349/ymj.2018.59.4.524
Study Difference in means Standard error p value Difference in means and 95% CI
ODI Parker, et al.19 2.60 1.77 0.14Lee, et al.22 3.00 3.11 0.34Mobbs, et al.23 7.30 4.34 0.09Wang, et al.25 0.90 2.22 0.69Wang, et al.26 4.10 1.32 0.01Random 3.24 0.89 0.01
VAS back pain Parker, et al.19 0.10 0.53 0.85Lee, et al.22 0.10 0.48 0.84Mobbs, et al.23 0.57 0.43 0.19Wang, et al.25 0.40 0.52 0.44Wang, et al.26 0.02 0.36 0.96Random 0.22 0.20 0.27
VAS leg pain Parker, et al.19 0.70 0.64 0.27Lee, et al.22 0.00 0.50 1.00Random 0.27 0.39 0.50
-8.00 -4.00Favours open group Favours minimally invasive group
0.00 4.00 8.00
Fig. 2. Comparisons of ODI scores for functional improvement and VAS scores for back pain and leg pain between minimally invasive and open lum-bar spinal fusion. Heterogeneity: ODI score [τ2=0.000; χ2=2.549, df=4 (p=0.636); I2=0.0%], VAS back pain [τ2=0.000; χ2=1.192, df=4 (p=0.879); I2=0.0%], and VAS leg pain [τ2=0.000; χ2=0.748, df=1 (p=0.387); I2=0.0%]. ODI, Oswestry Disability Index; VAS, visual analogue scale; df, degrees of freedom; CI, confi-dence interval.
cal-site complications were 1.7% in the minimally invasive group (5/302 patients; mean follow-up, 20.9±6.9 months) and 4.5% in the open group (13/289 patients; mean follow-up, 22.6±4.0 months). Low-quality evidence from these seven studies revealed that the overall rate of surgical-site complica-tions did not differ significantly between the two groups (OR, 0.4; 95% CI, 0.2–1.1; p=0.1) (Fig. 4). The overall rates of infec-tion (including surgical-site infection, superficial infection, and deep wound infection) were 1.2% in the minimally invasive group (3/260 patients; mean follow-up, 19.9±6.7 months) and 5.3% in the open group (13/246 patients; mean follow-up, 21.0±5.4 months). There was low-quality evidence from six studies19,21-23,25,29 in which the minimally invasive group had a significantly lower rate of infection than the open group (OR,
0.3; 95% CI, 0.1–0.9; p=0.02) (Fig. 5).
Subsequent surgeriesSix studies included information about subsequent surger-ies,19,22,23,26,27,29 and a total of 493 patients (251 in the minimally invasive group and 242 in the open group) were analyzed (Ta-ble 6). We found low-quality evidence suggesting that the over-all rate of subsequent surgeries did not differ significantly be-tween the two groups (4.4% in the percutaneous group and 3.7% in the open group; OR, 0.9; 95% CI, 0.4–2.3; p=0.9; mean follow-up, 20.2±6.8 months). Revisions, removals, and reopera-tions were also analyzed in four studies,19,22,26,29 three studies,23,27,29 and four studies,19,22,26,29 respectively. The overall rates of revi-sions were 2.6% in the minimally invasive group (5/196 patients;
Study OR Lower limit Upper limit p value OR and 95% CIPLF Kotani, et al.24 0.38 0.02 9.56 0.56
Random 0.38 0.02 9.56 0.56
PLIF Park and Ha29 1.11 0.07 18.55 0.94Mobbs, et al.23 6.58 0.30 142.46 0.23Random 2.50 0.31 19.95 0.39
TLIF Wang, et al.26 0.98 0.06 16.13 0.99Schizas, et al.27 0.12 0.01 2.50 0.17Lee, et al.22 0.49 0.04 5.56 0.57Wang, et al.25 0.92 0.06 15.59 0.96Gu, et al.21 1.17 0.22 6.18 0.85Random 0.71 0.25 2.05 0.53
Overall 0.86 0.35 2.12 0.74
0.01 0.1Favours open group Favours minimally invasive group
1 10 100
Fig. 3. Comparison of fusion rates between minimally invasive and open lumbar spinal fusion. Heterogeneity: fusion rates for PLF [τ2=0.000; χ2=0.000, df=0 (p=1.000); I2=0.0%], fusion rates for PLIF [τ2=0.000; χ2=0.701, df=1 (p=0.402); I2=0.0%], fusion rates for TLIF [τ2=0.000; χ2=1.836, df=4 (p=0.766); I2=0.0%], and overall fusion rates [τ2=0.000; χ2=3.925, df=7 (p=0.788); I2=0.0%]. PLF, posterolateral fusion; PLIF, posterior lumbar interbody fusion; TLIF, transforam-inal lumbar interbody fusion; df, degrees of freedom; OR, odds ratio; CI, confidence interval.
533
Yung Park, et al.
https://doi.org/10.3349/ymj.2018.59.4.524
Table 6. Complications and Subsequent Surgeries between the Two Surgical Groups
OutcomesN of
studies
Minimally invasive group Open groupOR (95% CI)N of
events (%)Total N of patients
N of events (%)
Total N of patients
Surgical-site complicationsOverall 7 5 (1.7) 302 13 (4.5) 289 0.4 (0.2 to 1.1)Infection 6 3 (1.2) 260 13 (5.3) 246 0.3 (0.1 to 0.9)*
Surgical-site infection 3 0 (0.0) 159 5 (3.3) 152 0.2 (0.02 to 0.9)†
Superficial wound infection 3 2 (2.0) 101 7 (7.4) 94 0.3 (0.02 to 1.4)Deep wound infection 1 1 (3.1) 32 1 (3.4) 29 0.9 (0.05 to 15.1)
Hematoma 2 2 (2.5) 79 0 (0.0) 73 2.8 (0.3 to 27.6)Neurological complications
Overall 7 13 (4.5) 288 13 (4.7) 278 0.8 (0.4 to 1.8)Dural tear/CSF leak 7 12 (4.2) 288 11 (4.0) 278 0.9 (0.4 to 2.1)Nerve root injury (L5 root paresis) 1 1 (5.6) 18 0 (0.0) 18 3.2 (0.1 to 83.2)Postoperative radiculopathy (transient L3 radicular pain) 2 0 (0.0) 55 2 (4.2) 48 0.3 (0.03 to 2.9)
Hardware complicationsOverall 6 14 (5.4) 258 9 (3.6) 250 1.2 (0.5 to 2.6)Screw-related complications 6 8 (3.1) 258 2 (0.8) 250 1.8 (0.6 to 5.8)
Screw malposition 4 4 (2.0) 196 2 (1.0) 194 1.1 (0.3 to 5.1)Screw loosening 1 2 (11.1) 18 0 (0.0) 18 5.6 (0.3 to 125.4)Screw breakage 1 1 (5.6) 18 0 (0.0) 18 3.2 (0.1 to 83.2)Overlong screw 1 1 (2.3) 44 0 (0.0) 38 2.7 (0.1 to 67.1)
Cage-related complications 3 5 (4.1) 122 7 (5.9) 119 0.7 (0.2 to 2.2)Cage migration 2 5 (4.8) 104 6 (5.9) 101 0.8 (0.2 to 2.7)Cage fracture during insertion 1 0 (0.0) 18 1 (5.6) 18 0.3 (0.01 to 8.3)
Graft dislodgement 1 1 (2.4) 42 0 (0.0) 43 3.1 (0.1 to 79.4)Pseudarthrosis 9 12 (3.3) 363 9 (2.6) 344 1.2 (0.5 to 2.9)Other complications
Overall 3 3 (2.4) 127 7 (5.8) 120 0.6 (0.2 to 1.9)Deep vein thrombosis 1 0 (0.0) 37 1 (3.3) 30 0.3 (0.01 to 6.7)Myocardial infarction 1 0 (0.0) 72 1 (1.4) 72 0.3 (0.01 to 8.2)Pneumonia 1 1 (1.4) 72 1 (1.4) 72 1.0 (0.06 to 16.3)Paralytic ileus 1 0 (0.0) 37 3 (10) 30 0.1 (0.005 to 2.1)Urinary tract infection 1 1 (2.7) 37 0 (0.0) 30 2.5 (0.1 to 63.8)Postoperative anemia 1 0 (0.0) 72 1 (1.4) 72 0.3 (0.01 to 8.2)Brachial plexus injury due to positioning 1 1 (5.6) 18 0 (0.0) 18 3.2 (0.1 to 83.2)
Subsequent surgeries‡
Overall 6 11 (4.4) 251 9 (3.7) 242 0.9 (0.4 to 2.3)Revision 4 5 (2.6) 196 2 (1.0) 194 1.1 (0.3 to 4.5)
Revision for malpositioned screw 4 4 (2.0) 196 2 (1.0) 194Revision for migrated cage 1 1 (3.1) 32 0 (0.0) 29
Removal for pseudarthrosis 3 3 (3.4) 87 3 (3.9) 77 1.3 (0.2 to 7.9)Reoperation 4 3 (1.5) 196 4 (2.1) 194 0.6 (0.1 to 2.8)
Reoperation for graft dislodgement 1 1 (2.4) 42 0 (0.0) 43Reoperation for surgical-site infection 2 0 (0.0) 122 3 (2.5) 122Reoperation for deep wound infection 1 1 (3.1) 32 1 (3.4) 29Reoperation for hematoma 1 1 (2.4) 42 0 (0.0) 43
Supplemental fixation 0 0 (0.0) 0 0 (0.0) 0
N, number; OR, odds ratio; CI, confidence interval; CSF, cerebrospinal fluid.*p=0.02, †p=0.04, ‡Complications lead to a subsequent surgical intervention. Subsequent surgical intervention was categorized as follows: a revision is a proce-dure that adjusts or in any way modifies or removes part of the original implant configuration, with or without replacement of a component; a revision may also include adjusting the position of the original configuration (revision for migrated cage, removal of screws, etc.). A removal is a procedure where all of the origi-nal system configuration are removed with or without replacement (removal for pain at operative site but after fusion, for pseudarthrosis, etc.). A reoperation is any surgical procedure at the involved level(s) that does not removal, modification, or addition of any components to the system. A supplemental fixation is a procedure in which additional instrumentation not under study in the protocol is implanted.
534
Minimally Invasive Versus Open Lumbar Spinal Fusion
https://doi.org/10.3349/ymj.2018.59.4.524
Study OR Lower limit Upper limit p value OR and 95% CIHardware complications
Schizas, et al.27 0.32 0.01 8.27 0.49Schizas, et al.27 3.17 0.12 83.17 0.49Schizas, et al.27 5.61 0.25 125.45 0.28Gu, et al.21 2.66 0.11 67.11 0.55Lee, et al.22 0.65 0.18 2.40 0.52Lee, et al.22 3.04 0.12 75.92 0.50Park and Ha29 2.81 0.11 71.72 0.53Park and Ha29 2.81 0.11 71.72 0.53Wang, et al.25 3.15 0.13 79.40 0.49Wang, et al. 26 0.33 0.01 8.42 0.51Parker, et al.19 0.79 0.07 9.25 0.85Random 1.20 0.54 2.63 0.66
Neurological complications
Schizas, et al.27 3.17 0.12 83.17 0.49Schizas, et al.27 3.17 0.12 83.17 0.49Schizas, et al.27 0.32 0.01 8.27 0.49Parker, et al.19 0.57 0.09 3.73 0.56Wang, et al.25 0.63 0.13 2.97 0.56Gu, et al.21 1.76 0.15 20.23 0.65Lee, et al.22 3.04 0.12 75.92 0.50Wang, et al.26 1.03 0.14 7.63 0.98Mobbs, et al.23 0.26 0.01 6.67 0.42Mobbs, et al.23 0.26 0.01 6.67 0.42Random 0.84 0.39 1.82 0.66
Surgical-site complications
Park and Ha29 0.90 0.05 15.13 0.94Park and Ha29 0.17 0.01 3.68 0.26Parker, et al.19 0.07 0.00 1.60 0.10Wang, et al.25 0.21 0.01 4.56 0.32Gu, et al.21 0.56 0.09 3.51 0.53Lee, et al.22 0.33 0.01 8.21 0.50Wang, et al.26 3.15 0.13 79.39 0.49Mobbs, et al.23 0.15 0.01 3.29 0.23Mobbs, et al.23 2.51 0.01 63.79 0.58Random 0.44 0.17 1.13 0.09
Overall 0.81 0.81 1.31 0.39
0.01 0.1Favours open group Favours minimally invasive group
1 10 100
Fig. 4. Comparison of complications rates (hardware-related, neurological, and surgical-site complications) between minimally invasive and open lumbar spinal fusion. Heterogeneity: hardware-related complications [τ2=0.000; χ2=4.922, df=10 (p=0.896); I2=0.0%], neurological complications [τ2=0.000; χ2=3.909, df=9 (p=0.917); I2=0.0%], surgical-site complications [τ2=0.000; χ2=5.232, df=8 (p=0.732); I2=0.0%], and overall complication rates [τ2=0.000; χ2=16.605, df=29 (p=0.968); I2=0.0%]. df, degrees of freedom; OR, odds ratio; CI, confidence interval.
Study OR Lower limit Upper limit p value OR and 95% CIPark and Ha29 0.90 0.05 15.13 0.94Lee, et al.22 0.33 0.01 8.21 0.50Mobbs, et al.23 0.15 0.01 3.29 0.23Park and Ha29 0.17 0.01 3.68 0.26Parker, et al.19 0.07 0.00 1.60 0.10Wang, et al.25 0.21 0.01 4.56 0.32Gu, et al.21 0.56 0.09 3.51 0.53Random 0.30 0.11 0.85 0.02
0.01 0.1Favours open group Favours minimally invasive group
1 10 100
Fig. 5. Comparison of infection rates between minimally invasive and open lumbar spinal fusion. Heterogeneity: τ2=0.000; χ²=2.197, df=6 (p=0.901); I²=0.0%. df, degrees of freedom; CI, confidence interval; OR, odds ratio.
mean follow-up, 21.9±6.8 months) and 1.0% in the open group (2/194 patients; mean follow-up, 21.9±6.8 months). Overall, 3.4% underwent removals in the minimally invasive group (3/87 patients; mean follow-up, 15.2±5.9 months) and 3.9% in the open group (3/77 patients; mean follow-up, 18.2±
6.0 months). The overall rates of reoperations were 1.5% in the minimally invasive group (3/196 patients; mean follow-up, 21.9±6.8 months) and 2.1% in the open group (4/194 patients; mean follow-up, 21.9±6.8 months). Low-quality evidence re-vealed that the two groups did not differ significantly in rates

535
Yung Park, et al.
https://doi.org/10.3349/ymj.2018.59.4.524
Study OR Lower limit Upper limit p value OR and 95% CIRemoval Mobbs, et al.23 0.15 0.01 3.29 0.23
Park and Ha29 2.81 0.11 71.72 0.53Schizas, et al.27 5.61 0.25 125.45 0.28Random 1.31 0.15 11.75 0.81
Reoperation Lee, et al.22 2.33 0.01 8.21 0.50Park and Ha29 0.90 0.05 15.13 0.94Parker, et al.19 0.07 0.00 1.60 0.10Wang, et al.26 5.37 0.25 115.27 0.28Random 0.60 0.11 3.45 0.57
Revision Lee, et al.22 3.04 0.12 75.92 0.50Park and Ha29 1.87 0.16 21.74 0.62Parker, et al.19 0.79 0.07 9.25 0.85Wang, et al.26 0.33 0.01 8.42 0.51Random 1.14 0.29 4.52 0.86
Overall 0.96 0.36 2.54 0.93
0.01 0.1Favours open group Favours minimally invasive group
1 10 100
Fig. 6. Comparison of subsequent surgery rates between minimally invasive and open lumbar spinal fusion. Heterogeneity: Removal [τ2=1.204; χ2=2.938, df=2 (p=0.230); I2=31.9%], reoperation [τ2=0.774; χ2=3.965, df=3 (p=0.265); I2=24.3%], revision [τ2=0.000; χ2=1.154, df=3 (p=0.764); I2=0.0%], overall subse-quent surgery rates [τ2=0.000; χ2=8.565, df=10 (p=0.574); I²=0.0%]. df, degrees of freedom; OR, odds ratio; CI, confidence interval.
Study Difference in means Standard error p value Difference in means and 95% CI
Blood loss Parker, et al.19 -150.00 17.68 0.000Gu, et al.21 -327.90 30.64 0.000Lee, et al.22 -396.80 64.06 0.000Wang, et al.26 -409.00 26.17 0.000Park and Ha29 -305.10 67.61 0.000Wang, et al.25 -261.00 34.28 0.000Fixed -269.53 11.92 0.000
-500.00 -250.00Favours open group Favours minimally invasive group
0.00 250.00 500.00
Fig. 7. Comparison of blood loss between minimally invasive and open lumbar spinal fusion. Heterogeneity: τ2=0.747; χ2=57.666, df=5 (p<0.0001); I2=91.3%. df, degrees of freedom; CI, confidence interval.
of revision (OR, 1.1; 95% CI, 0.3– 4.5; p=0.9), removal (OR, 1.3; 95% CI, 0.2–11.8; p=0.8), and reoperation (OR, 0.6; 95% CI, 0.1–3.5; p=0.6) (Fig. 6).
Perioperative outcomesThe detailed perioperative outcome data are summarized in Supplementary Tables 8, 9, and 10 (only online).
Blood lossSix studies19,21,22,25,26,29 reported estimated blood loss during surgery, with 265 patients in the minimally invasive group and 259 in the open group. Low-quality evidence indicated that the minimally invasive group had significantly less blood loss than the open group (WMD, 269.5 mL; 95% CI, 246.2–292.9 mL; p<0.0001) (Fig. 7).
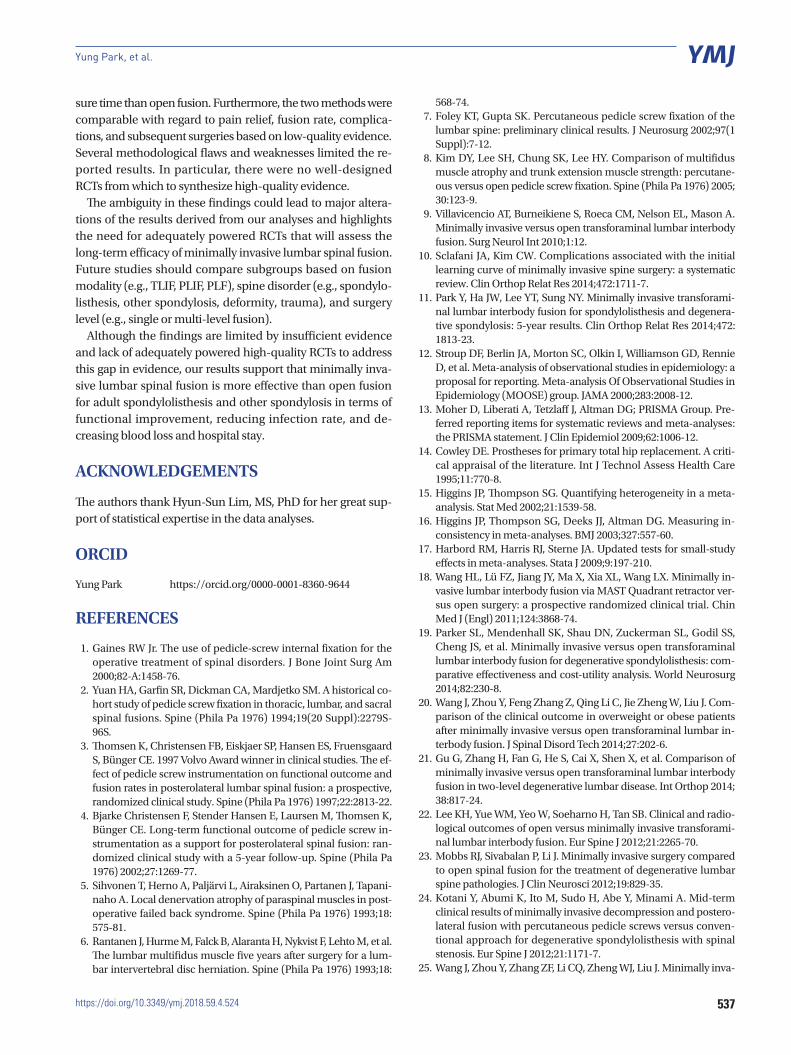
Hospital staySix studies19,21-23,26,29 reported length of hospital stay, with 277 patients in the minimally invasive group and 262 in the open group. Low-quality evidence suggested that the minimally in-
vasive group had a significantly shorter hospital stay than the open group (WMD, 1.3 days; 95% CI, 1.1–1.5 days; p<0.0001) (Fig. 8).
Operation timeSeven studies19,21,22,24-26,29 reported operation time, with 302 pa-tients in the minimally invasive group and 289 in the open group. There was low-quality evidence indicating that the minimally invasive group had a significantly longer operation time than the open group (WMD, 21.0 minutes; 95% CI, 15.9–26.2 minutes; p<0.0001) (Fig. 8).
Radiation exposure timeFour studies21,22,25,26 reported radiation exposure time, with 183 patients in the minimally invasive group and 180 in the open group. Low-quality evidence suggested that the minimally in-vasive group had a significantly longer radiation exposure time than the open group (WMD, 25.4 seconds; 95% CI, 22.0–28.8 seconds; p<0.0001) (Fig. 8).
536
Minimally Invasive Versus Open Lumbar Spinal Fusion
https://doi.org/10.3349/ymj.2018.59.4.524
DISCUSSION
This meta-analysis highlights low-quality evidence that indi-cates minimally invasive lumbar spinal fusion for the treat-ment of adult spondylolisthesis and spondylosis is more ef-fective than open fusion with regard to functional improvement and reduced infection rate in the intermediate term. The two fusion methods showed similar results in terms of pain relief, fusion rate, complications, and subsequent surgeries, although the evidence was low quality. In addition, we noted low-quality evidence indicating that minimally invasive fusion is associat-ed with decreased blood loss and length of hospital stay, but was less advantageous in terms of operation time and radia-tion exposure time than open fusion.
Although screw- or cage-related nerve root injuries and sec-ondary radiculopathies were reported, most studies indicated resolution of any neurological deficits and pain with subse-quent surgery. These complications also showed an equivalent incidence with open fusion. There were no reports of visceral or vascular injury associated with percutaneous pedicle screw instrumentation. Significant reduction of paraspinal muscle injury via minimally invasive surgery and subsequent preser-vation of trunk muscle performance are thought to result in greater functional improvement, a lower risk of infection, and better perioperative surgical outcomes (less blood loss, quicker recovery, and shorter hospital stay).
To our knowledge, this study is the first systematic review evaluating the efficacy of minimally invasive lumbar spinal fusion exclusively employing percutaneous pedicle screw in-strumentation. The strengths of our study include the exhaus-
tive search strategy, reproducible protocols, and strict adher-ence to systematic review methodology. The use of standardized and validated data collection and extraction tools limited bias and increased inter-rater reliability.
The major limitations of the present study are the lack of RCTs and the small number of included articles. These weak-nesses prevented synthesis of higher-quality evidence. In par-ticular, there were very few studies comparing multi-level in-strumented fusion in adult spondylosis patients. Overall, the quality of the evidence was “low” in our comparison of primary outcomes between minimally invasive fusion and open fu-sion. The magnitude of the effect sizes was small. All studies had attrition bias with no reported number of dropouts, and the mean follow-up duration was less than two years.
Another weakness was variation in the type of arthrodesis (e.g., TLIF, PLIF, or PLF) and bone graft material (e.g., local au-togenous bone, autogenous iliac crest bone, or synthetic bone extensor). Variation in preoperative diagnosis (e.g., spondylo-listhesis, other spondylosis, and mixed diagnoses) and fusion assessment methods was another drawback of this analysis. Computed tomography (CT) to evaluate screw placement was not routinely performed in all studies. The scarcity of CT im-aging data may have led to underestimation of screw malposi-tion, implant loosening, implant breakage, and pseudarthro-sis in the reviewed studies.
On intermediate-term follow-up, our results showed low-quality evidence that percutaneous pedicle screw instrument-ed fusion is more effective at improving ODI score, reducing infection rate, and decreasing blood loss and hospital stay, but less effective at reducing operation and radiation expo-
Study Difference in means Standard error p value Difference in means and 95% CI
Hospital stay Parker, et al.19 -1.00 0.10 0.00Gu, et al.21 -2.80 0.81 0.00Lee, et al.22 -3.60 0.53 0.00Mobbs, et al.23 -3.77 1.24 0.00Wang, et al.26 -4.00 0.70 0.00Park and Ha29 -5.50 0.66 0.00Fixed -1.28 0.10 0.00
Operation time Parker, et al.19 45.00 5.38 0.00Gu, et al.21 8.90 5.75 0.12Lee, et al.22 15.40 8.14 0.06Wang, et al.26 11.00 6.42 0.09Park and Ha29 42.90 8.21 0.00Wang, et al.25 4.00 8.72 0.65Kotani, et al.24 4.00 8.56 0.64Fixed 21.05 2.62 0.00
Radiation exposure time
Gu, et al.21 16.40 2.27 0.00Lee, et al.22 31.40 4.64 0.00Wang, et al.26 47.00 4.34 0.00Wang, et al.25 34.00 5.15 0.00Fixed 25.39 1.74 0.00
-60.00 -30.00Favours open group Favours minimally invasive group
0.00 30.00 60.00
Fig. 8. Comparison of hospital stay, operation time, and radiation exposure time between minimally invasive and open lumbar spinal fusion. Heteroge-neity: hospital stay [τ2=0.236; χ2=26.011, df=5 (p<0.0001); I2=80.8%], operation time [τ2=0.297; χ2=40.069, df=6 (p<0.0001); I2=85.0%], and radiation exposure time [τ2=0.240; χ2=14.309, df=3 (p=0.003); I2=79.0%]. df, degrees of freedom; CI, confidence interval.
537
Yung Park, et al.
https://doi.org/10.3349/ymj.2018.59.4.524
sure time than open fusion. Furthermore, the two methods were comparable with regard to pain relief, fusion rate, complica-tions, and subsequent surgeries based on low-quality evidence. Several methodological flaws and weaknesses limited the re-ported results. In particular, there were no well-designed RCTs from which to synthesize high-quality evidence.
The ambiguity in these findings could lead to major altera-tions of the results derived from our analyses and highlights the need for adequately powered RCTs that will assess the long-term efficacy of minimally invasive lumbar spinal fusion. Future studies should compare subgroups based on fusion modality (e.g., TLIF, PLIF, PLF), spine disorder (e.g., spondylo-listhesis, other spondylosis, deformity, trauma), and surgery level (e.g., single or multi-level fusion).
Although the findings are limited by insufficient evidence and lack of adequately powered high-quality RCTs to address this gap in evidence, our results support that minimally inva-sive lumbar spinal fusion is more effective than open fusion for adult spondylolisthesis and other spondylosis in terms of functional improvement, reducing infection rate, and de-creasing blood loss and hospital stay.
ACKNOWLEDGEMENTS
The authors thank Hyun-Sun Lim, MS, PhD for her great sup-port of statistical expertise in the data analyses.
ORCID
Yung Park https://orcid.org/0000-0001-8360-9644
REFERENCES
1. Gaines RW Jr. The use of pedicle-screw internal fixation for the operative treatment of spinal disorders. J Bone Joint Surg Am 2000;82-A:1458-76.
2. Yuan HA, Garfin SR, Dickman CA, Mardjetko SM. A historical co-hort study of pedicle screw fixation in thoracic, lumbar, and sacral spinal fusions. Spine (Phila Pa 1976) 1994;19(20 Suppl):2279S-96S.
3. Thomsen K, Christensen FB, Eiskjaer SP, Hansen ES, Fruensgaard S, Bünger CE. 1997 Volvo Award winner in clinical studies. The ef-fect of pedicle screw instrumentation on functional outcome and fusion rates in posterolateral lumbar spinal fusion: a prospective, randomized clinical study. Spine (Phila Pa 1976) 1997;22:2813-22.
4. Bjarke Christensen F, Stender Hansen E, Laursen M, Thomsen K, Bünger CE. Long-term functional outcome of pedicle screw in-strumentation as a support for posterolateral spinal fusion: ran-domized clinical study with a 5-year follow-up. Spine (Phila Pa 1976) 2002;27:1269-77.
5. Sihvonen T, Herno A, Paljärvi L, Airaksinen O, Partanen J, Tapani-naho A. Local denervation atrophy of paraspinal muscles in post-operative failed back syndrome. Spine (Phila Pa 1976) 1993;18: 575-81.
6. Rantanen J, Hurme M, Falck B, Alaranta H, Nykvist F, Lehto M, et al. The lumbar multifidus muscle five years after surgery for a lum-bar intervertebral disc herniation. Spine (Phila Pa 1976) 1993;18:
568-74.7. Foley KT, Gupta SK. Percutaneous pedicle screw fixation of the
lumbar spine: preliminary clinical results. J Neurosurg 2002;97(1 Suppl):7-12.
8. Kim DY, Lee SH, Chung SK, Lee HY. Comparison of multifidus muscle atrophy and trunk extension muscle strength: percutane-ous versus open pedicle screw fixation. Spine (Phila Pa 1976) 2005; 30:123-9.
9. Villavicencio AT, Burneikiene S, Roeca CM, Nelson EL, Mason A. Minimally invasive versus open transforaminal lumbar interbody fusion. Surg Neurol Int 2010;1:12.
10. Sclafani JA, Kim CW. Complications associated with the initial learning curve of minimally invasive spine surgery: a systematic review. Clin Orthop Relat Res 2014;472:1711-7.
11. Park Y, Ha JW, Lee YT, Sung NY. Minimally invasive transforami-nal lumbar interbody fusion for spondylolisthesis and degenera-tive spondylosis: 5-year results. Clin Orthop Relat Res 2014;472: 1813-23.
12. Stroup DF, Berlin JA, Morton SC, Olkin I, Williamson GD, Rennie D, et al. Meta-analysis of observational studies in epidemiology: a proposal for reporting. Meta-analysis Of Observational Studies in Epidemiology (MOOSE) group. JAMA 2000;283:2008-12.
13. Moher D, Liberati A, Tetzlaff J, Altman DG; PRISMA Group. Pre-ferred reporting items for systematic reviews and meta-analyses: the PRISMA statement. J Clin Epidemiol 2009;62:1006-12.
14. Cowley DE. Prostheses for primary total hip replacement. A criti-cal appraisal of the literature. Int J Technol Assess Health Care 1995;11:770-8.
15. Higgins JP, Thompson SG. Quantifying heterogeneity in a meta-analysis. Stat Med 2002;21:1539-58.
16. Higgins JP, Thompson SG, Deeks JJ, Altman DG. Measuring in-consistency in meta-analyses. BMJ 2003;327:557-60.
17. Harbord RM, Harris RJ, Sterne JA. Updated tests for small-study effects in meta-analyses. Stata J 2009;9:197-210.
18. Wang HL, Lü FZ, Jiang JY, Ma X, Xia XL, Wang LX. Minimally in-vasive lumbar interbody fusion via MAST Quadrant retractor ver-sus open surgery: a prospective randomized clinical trial. Chin Med J (Engl) 2011;124:3868-74.
19. Parker SL, Mendenhall SK, Shau DN, Zuckerman SL, Godil SS, Cheng JS, et al. Minimally invasive versus open transforaminal lumbar interbody fusion for degenerative spondylolisthesis: com-parative effectiveness and cost-utility analysis. World Neurosurg 2014;82:230-8.
20. Wang J, Zhou Y, Feng Zhang Z, Qing Li C, Jie Zheng W, Liu J. Com-parison of the clinical outcome in overweight or obese patients after minimally invasive versus open transforaminal lumbar in-terbody fusion. J Spinal Disord Tech 2014;27:202-6.
21. Gu G, Zhang H, Fan G, He S, Cai X, Shen X, et al. Comparison of minimally invasive versus open transforaminal lumbar interbody fusion in two-level degenerative lumbar disease. Int Orthop 2014; 38:817-24.
22. Lee KH, Yue WM, Yeo W, Soeharno H, Tan SB. Clinical and radio-logical outcomes of open versus minimally invasive transforami-nal lumbar interbody fusion. Eur Spine J 2012;21:2265-70.
23. Mobbs RJ, Sivabalan P, Li J. Minimally invasive surgery compared to open spinal fusion for the treatment of degenerative lumbar spine pathologies. J Clin Neurosci 2012;19:829-35.
24. Kotani Y, Abumi K, Ito M, Sudo H, Abe Y, Minami A. Mid-term clinical results of minimally invasive decompression and postero-lateral fusion with percutaneous pedicle screws versus conven-tional approach for degenerative spondylolisthesis with spinal stenosis. Eur Spine J 2012;21:1171-7.
25. Wang J, Zhou Y, Zhang ZF, Li CQ, Zheng WJ, Liu J. Minimally inva-
538
Minimally Invasive Versus Open Lumbar Spinal Fusion
https://doi.org/10.3349/ymj.2018.59.4.524
sive or open transforaminal lumbar interbody fusion as revision surgery for patients previously treated by open discectomy and decompression of the lumbar spine. Eur Spine J 2011;20:623-8.
26. Wang J, Zhou Y, Zhang ZF, Li CQ, Zheng WJ, Liu J. Comparison of one-level minimally invasive and open transforaminal lumbar interbody fusion in degenerative and isthmic spondylolisthesis grades 1 and 2. Eur Spine J 2010;19:1780-4.
27. Schizas C, Tzinieris N, Tsiridis E, Kosmopoulos V. Minimally inva-
sive versus open transforaminal lumbar interbody fusion: evalu-ating initial experience. Int Orthop 2009;33:1683-8.
28. Peng CW, Yue WM, Poh SY, Yeo W, Tan SB. Clinical and radiologi-cal outcomes of minimally invasive versus open transforaminal lumbar interbody fusion. Spine (Phila Pa 1976) 2009;34:1385-9.
29. Park Y, Ha JW. Comparison of one-level posterior lumbar inter-body fusion performed with a minimally invasive approach or a traditional open approach. Spine (Phila Pa 1976) 2007;32:537-43.