Embed Size (px)
Citation preview
Measurement 46 (2013) 3982–3987
Contents lists available at SciVerse ScienceDirect
Measurement
journal homepage: www.elsevier .com/ locate /measurement
Miniature fluorescent sensor for chloride ion concentrationdetermination based on modified Stern–Volmer Equation
0263-2241/$ - see front matter � 2013 Elsevier Ltd. All rights reserved.http://dx.doi.org/10.1016/j.measurement.2013.07.020
⇑ Corresponding author at: Department of Mechanical & MechatronicsEngineering, University of Waterloo, Waterloo, ON N2L3G1, Canada.
E-mail address: [email protected] (D. Li).
Junsheng Wang a, Yongxin Song b, Sun Jinyang b, Xudong Wu d, Yeqing Sun c, Xinxiang Pan b,Dongqing Li d,b,⇑a College of Information and Science Technology, Dalian Maritime University, Dalian 116026, Chinab College of Marine Engineering, Dalian Maritime University, Dalian 116026, Chinac College of Environmental Science and Engineering, Dalian Maritime University, Dalian 116026, Chinad Department of Mechanical & Mechatronics Engineering, University of Waterloo, Waterloo, ON N2L 3G1, Canada
a r t i c l e i n f o
Article history:Received 19 February 2013Received in revised form 6 July 2013Accepted 10 July 2013Available online 21 July 2013
Keywords:Chloride ion concentrationFluorescent sensorModified Stern–Volmer Equation
a b s t r a c t
Sweat test based on chloride ion selective electrode is the common method for the diagnosisof Cystic Fibrosis (CF). In our previous study, the possibility of using chloride ion sensitivefluorescent dye to determine the chloride ion concentration with a small volume of samplehas been explored. However, we found the conventional Stern–Volmer Equation is applica-ble only for large systems such as a fluorescent microscope with a large volume of sampleand dye solution; and it is not valid for portable devices using a small photo detector and asmall volume of sample and dye solution. Therefore, in this paper, extensive experimentswere performed by using a miniature fluorescent detection system; the effects of theparameters including the concentration and the volume of fluorescent dye solution, thecoefficient of Stern–Volmer plot, and the volume ratio of the fluorescent dye solution andthe chloride solution were studied; and a modified Stern–Volmer Equation was obtained.Using the modified Stern–Volmer correlation, the miniature fluorescent detection devicecan detect the chloride ion concentration correctly and rapidly.
� 2013 Elsevier Ltd. All rights reserved.
1. Introduction
Cystic Fibrosis (CF) is a genetic disease and has beenstudied for many years [1–10]. Sweat test is the most pop-ular method for diagnosis of Cystic Fibrosis. The patientswith CF have a higher chloride ion concentration (morethan 60 mM) in their sweat than the healthy people (lessthan 40 mM). Sweat test has been applied in the new-bornscreening for early diagnosis of CF [11–15]. However, theconventional sweat test method is based on chloride ionselective electrodes and has some disadvantages such astime consuming and the requirement of a large volumeof sweat sample. The conventional sweat test usually
needs at least 30 min to obtain an adequate amount ofsweat sample (minimum of 25 lL) from a patient [16]. Itis particularly difficult to obtain sufficient sweat samplesfrom new-borns.
Chloride ion indicator fluorescent dyes such as MQAE(N-(ethoxycarbonylmethyl)-6-methoxyquinolinium bromide),have a high sensitivity to chloride ion concentration. Theexcitation wavelength and emission wavelength of MQAEdye are 350 nm and 460 nm, respectively. When chlorideions bind with the indicator dye molecules, photo-quench-ing occurs and the fluorescent light intensity decreases.The higher the chloride concentration, the lower the inten-sity. Conventionally, the correlation between fluorescenceintensity and the chloride concentration is given by theStern–Volmer relation [17,18]. Therefore, using a fluores-cent indicator dye allows us to measure the chloride concen-tration in sweat samples accurately and quickly, more
J. Wang et al. / Measurement 46 (2013) 3982–3987 3983
importantly, with a much smaller amount of sweat sample.In our previously preliminary studies [19], we explored thepossibility of using a chloride ion indicator fluorescent dye,MQAE, to detect chloride ion concentration with a small vol-ume of the sample solution.
It should be noted that the Stern–Volmer relation wasestablished from the experimental data obtained by usinglarge fluorescent microscopes and large volumes of chloridesolutions and fluorescent dye solutions. The empiricalconstant in the Stern–Volmer relation may not be valid forportable devices with miniature optic detection gadgetand with a significantly smaller amount of testing liquids.Therefore, we performed extensive experimental studiesto examine the effects of a number of parameters on theStern–Volmer relation by using a miniature fluorescentdetection system. These parameters include the concentra-tion and the volume of the fluorescent dye solution, and thevolume ratio of the fluorescent dye solution to that of thechloride ion solution. The experimental data were analyzedand a modified Stern–Volmer relation was proposed. Thesuccessful determination of the chloride concentrationwas demonstrated by using this modified Stern–Volmerrelation.
2. Methods and materials
2.1. Analysis of Stern–Volmer correlation
In this study, the chloride ion concentration will bedetermined according to the fluorescence intensity of achloride ion indicator fluorescent dye, MQAE, and theStern–Volmer correlation, which is shown as the followingequation:
F ¼ F0
1þ KSV½Cl�� ð1Þ
Here, F is the fluorescence intensity in the presence ofchloride ions; F0 is the fluorescence intensity in the ab-sence of chloride ions; KSV is the coefficient of Stern–Vol-mer plot. [Cl�] is the concentration of chloride ion in thesolution [20,21].
As described shortly below, in the experimental system,the testing sample of a chloride ion solution and the MQAEsolution will be deposited on and contained by a smallpiece of filter paper placed on a glass slide; a LED lightsource provides the excitation light from the top; the emit-ting fluorescence is detected by a photodiode from below.On such a small piece of filter paper, and hence for such asmall volume of liquid, F0, the fluorescence intensity in theabsence of chloride ions, will be affected by the volume ofMQAE solution and the concentration of MQAE. Thatmeans that F0 is a function of these two parameters:
F0 ¼ f1ð½MQAE�;VMQAEÞ ð2ÞBecause the sample is a mixture of chloride ion solution
and MQAE solution, [Cl�] in Eq. (1) can be expressed by:
½Cl�� ¼½Cl��sample � VCl
VCl þ VMQAE¼ ½Cl��sample �
11þ VMQAE=VCl
¼ ½Cl��sample �1
1þ rmcð3Þ
where rmc ¼ VMQAE=VCl is the volume ratio of the MQAEsolution and the chloride solution. Therefore, combiningthe above Eqs. (1)–(3), we can obtain the followingequation:
F ¼ F0
1þ KSV½Cl��sample �1
1þ rmc
¼ f1ð½MQAE�; VMQAEÞ
1þ KSV½Cl��sample �1
1þ rmc
ð4Þ
Clearly, Eq. (4) provides the possibility of determiningthe chloride concentration [Cl�] from the measured fluo-rescent intensity F. To do so, however, one needs to findthe correlation F0 = f1 ([MQAE], VMQAE), and the parametersKSV and rmc for a miniature fluorescent detection systemwith small volumes of sample and reagent solutions.
2.2. Miniature detection system
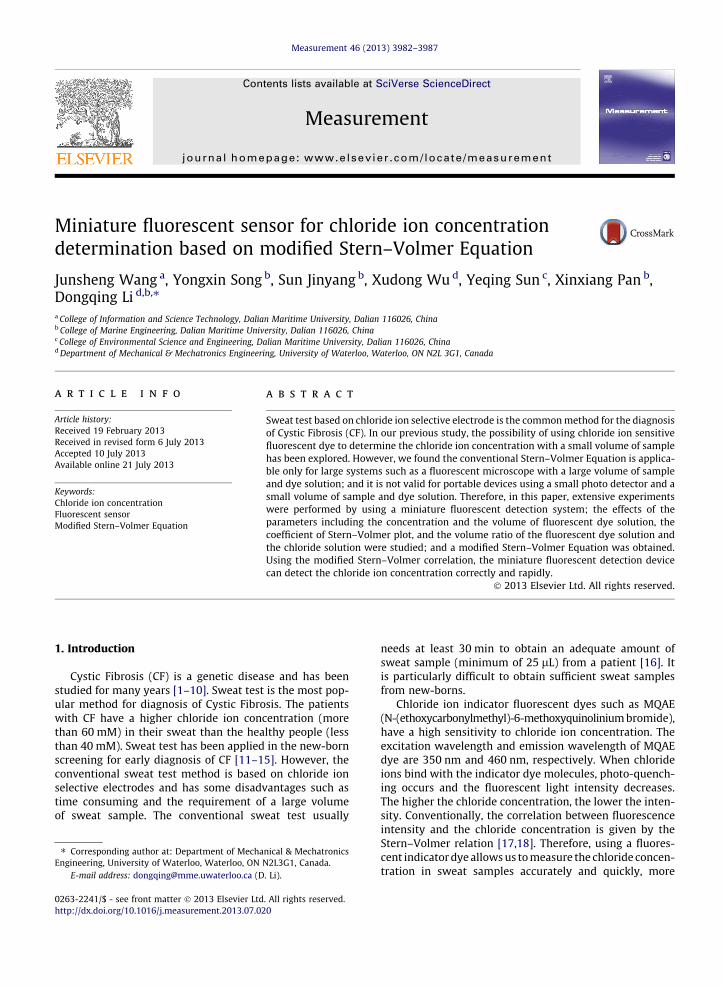
As mentioned above, chloride ion concentration can bedetermined by the fluorescence intensity of the mixture ofa chloride ion solution and a chloride indicator dye MQAEsolution. For the purpose of clinical point-of-testing appli-cations, a handheld fluorescence detection device wasdeveloped in this study, as shown in Fig. 1. The device iscomposed of a sample platform, a miniature fluorescentdetection system, and a data acquisition and processingsystem.
The sample platform includes a piece of filter paper anda thin glass slide. The filter paper is placed on the glassslide to hold the mixture of the MQAE solution and thechloride ion solution. By considering the need of signifi-cantly reducing the required amount of the (sweat) sampleand the easiness of conducting the tests, the size of the fil-ter paper is chosen to be 5 � 5 mm2. For each test, a newpiece of filter paper is used and placed on the glass slide.By design, the sample platform will align the center ofthe filter paper with excitation light source from the aboveand the photo-detector underneath. In the miniature opticdetection system, the excitation light source is provided bya LED (LZ1-00U605, LedEngin, San Jose, CA) with 350 nmexcitation wavelength as required for the MQAE dye. Aband pass filter is placed between the LED and the filter pa-per to block the unwanted light from the environment. Asmall photodiode (PD) (S8745-01, Hamamatsu, Bridgewa-ter, NJ), together with an emission band pass filter(460 nm), is used to detect the fluorescence intensity ofthe testing sample. The detected fluorescence intensity isconverted to photocurrent by the photo-detector, thenthrough current–voltage transformation, preamplifier,and differential amplifier, becomes a voltage output signalwhich is equivalent to the fluorescence intensity. The dataacquisition and processing is accomplished by a PDA (HP,iPAQ210) and a DAQ board (National Instrument USB-6009). A LabVIEW program in the PDA is designed to pro-cess data and display results.
In the test, a piece of 5 � 5 mm2 filter paper was placedon the center of the glass slide. Then the chloride solutionand the MQAE solution were dropped in sequence onto thefilter paper. The operator presses the button on the touch-able screen of the PDA to start the LabVIEW program, then
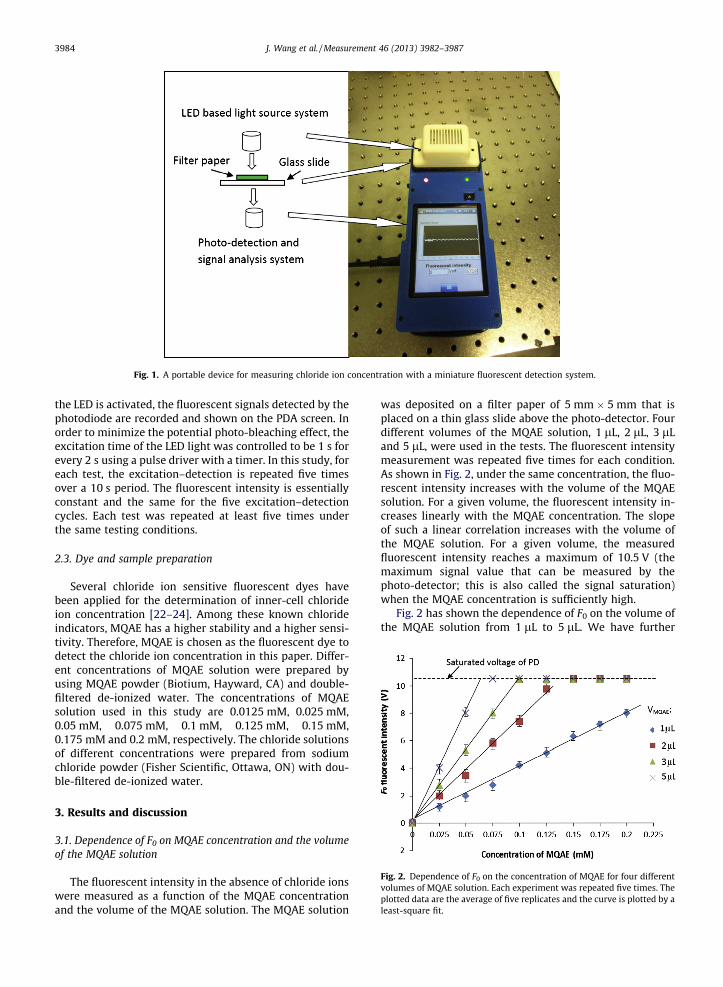
Fig. 1. A portable device for measuring chloride ion concentration with a miniature fluorescent detection system.
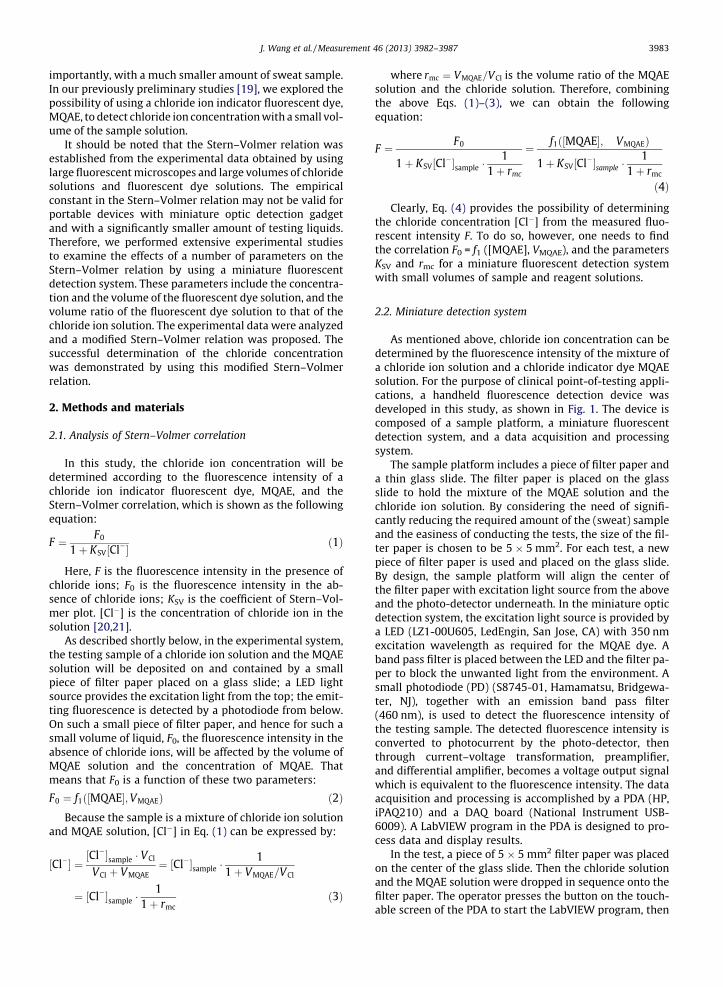
Fig. 2. Dependence of F0 on the concentration of MQAE for four differentvolumes of MQAE solution. Each experiment was repeated five times. Theplotted data are the average of five replicates and the curve is plotted by aleast-square fit.
3984 J. Wang et al. / Measurement 46 (2013) 3982–3987
the LED is activated, the fluorescent signals detected by thephotodiode are recorded and shown on the PDA screen. Inorder to minimize the potential photo-bleaching effect, theexcitation time of the LED light was controlled to be 1 s forevery 2 s using a pulse driver with a timer. In this study, foreach test, the excitation–detection is repeated five timesover a 10 s period. The fluorescent intensity is essentiallyconstant and the same for the five excitation–detectioncycles. Each test was repeated at least five times underthe same testing conditions.
2.3. Dye and sample preparation
Several chloride ion sensitive fluorescent dyes havebeen applied for the determination of inner-cell chlorideion concentration [22–24]. Among these known chlorideindicators, MQAE has a higher stability and a higher sensi-tivity. Therefore, MQAE is chosen as the fluorescent dye todetect the chloride ion concentration in this paper. Differ-ent concentrations of MQAE solution were prepared byusing MQAE powder (Biotium, Hayward, CA) and double-filtered de-ionized water. The concentrations of MQAEsolution used in this study are 0.0125 mM, 0.025 mM,0.05 mM, 0.075 mM, 0.1 mM, 0.125 mM, 0.15 mM,0.175 mM and 0.2 mM, respectively. The chloride solutionsof different concentrations were prepared from sodiumchloride powder (Fisher Scientific, Ottawa, ON) with dou-ble-filtered de-ionized water.
3. Results and discussion
3.1. Dependence of F0 on MQAE concentration and the volumeof the MQAE solution
The fluorescent intensity in the absence of chloride ionswere measured as a function of the MQAE concentrationand the volume of the MQAE solution. The MQAE solution
was deposited on a filter paper of 5 mm � 5 mm that isplaced on a thin glass slide above the photo-detector. Fourdifferent volumes of the MQAE solution, 1 lL, 2 lL, 3 lLand 5 lL, were used in the tests. The fluorescent intensitymeasurement was repeated five times for each condition.As shown in Fig. 2, under the same concentration, the fluo-rescent intensity increases with the volume of the MQAEsolution. For a given volume, the fluorescent intensity in-creases linearly with the MQAE concentration. The slopeof such a linear correlation increases with the volume ofthe MQAE solution. For a given volume, the measuredfluorescent intensity reaches a maximum of 10.5 V (themaximum signal value that can be measured by thephoto-detector; this is also called the signal saturation)when the MQAE concentration is sufficiently high.
Fig. 2 has shown the dependence of F0 on the volume ofthe MQAE solution from 1 lL to 5 lL. We have further
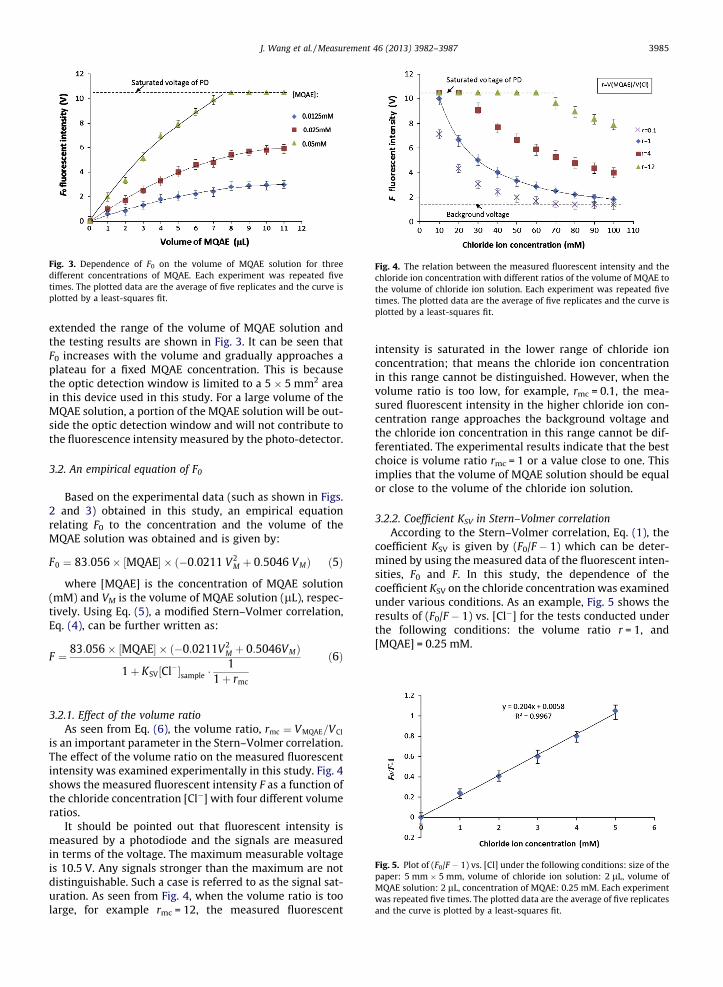
Fig. 3. Dependence of F0 on the volume of MQAE solution for threedifferent concentrations of MQAE. Each experiment was repeated fivetimes. The plotted data are the average of five replicates and the curve isplotted by a least-squares fit.
Fig. 4. The relation between the measured fluorescent intensity and thechloride ion concentration with different ratios of the volume of MQAE tothe volume of chloride ion solution. Each experiment was repeated fivetimes. The plotted data are the average of five replicates and the curve isplotted by a least-squares fit.
J. Wang et al. / Measurement 46 (2013) 3982–3987 3985
extended the range of the volume of MQAE solution andthe testing results are shown in Fig. 3. It can be seen thatF0 increases with the volume and gradually approaches aplateau for a fixed MQAE concentration. This is becausethe optic detection window is limited to a 5 � 5 mm2 areain this device used in this study. For a large volume of theMQAE solution, a portion of the MQAE solution will be out-side the optic detection window and will not contribute tothe fluorescence intensity measured by the photo-detector.
3.2. An empirical equation of F0
Based on the experimental data (such as shown in Figs.2 and 3) obtained in this study, an empirical equationrelating F0 to the concentration and the volume of theMQAE solution was obtained and is given by:
F0 ¼ 83:056� ½MQAE� � ð�0:0211 V2M þ 0:5046 VMÞ ð5Þ
where [MQAE] is the concentration of MQAE solution(mM) and VM is the volume of MQAE solution (lL), respec-tively. Using Eq. (5), a modified Stern–Volmer correlation,Eq. (4), can be further written as:
F ¼ 83:056� ½MQAE� � ð�0:0211V2M þ 0:5046VMÞ
1þ KSV½Cl��sample �1
1þ rmc
ð6Þ
Fig. 5. Plot of (F0/F � 1) vs. [Cl] under the following conditions: size of thepaper: 5 mm � 5 mm, volume of chloride ion solution: 2 lL, volume ofMQAE solution: 2 lL, concentration of MQAE: 0.25 mM. Each experimentwas repeated five times. The plotted data are the average of five replicatesand the curve is plotted by a least-squares fit.
3.2.1. Effect of the volume ratioAs seen from Eq. (6), the volume ratio, rmc ¼ VMQAE=VCl
is an important parameter in the Stern–Volmer correlation.The effect of the volume ratio on the measured fluorescentintensity was examined experimentally in this study. Fig. 4shows the measured fluorescent intensity F as a function ofthe chloride concentration [Cl�] with four different volumeratios.
It should be pointed out that fluorescent intensity ismeasured by a photodiode and the signals are measuredin terms of the voltage. The maximum measurable voltageis 10.5 V. Any signals stronger than the maximum are notdistinguishable. Such a case is referred to as the signal sat-uration. As seen from Fig. 4, when the volume ratio is toolarge, for example rmc = 12, the measured fluorescent
intensity is saturated in the lower range of chloride ionconcentration; that means the chloride ion concentrationin this range cannot be distinguished. However, when thevolume ratio is too low, for example, rmc = 0.1, the mea-sured fluorescent intensity in the higher chloride ion con-centration range approaches the background voltage andthe chloride ion concentration in this range cannot be dif-ferentiated. The experimental results indicate that the bestchoice is volume ratio rmc = 1 or a value close to one. Thisimplies that the volume of MQAE solution should be equalor close to the volume of the chloride ion solution.
3.2.2. Coefficient KSV in Stern–Volmer correlationAccording to the Stern–Volmer correlation, Eq. (1), the
coefficient KSV is given by (F0/F � 1) which can be deter-mined by using the measured data of the fluorescent inten-sities, F0 and F. In this study, the dependence of thecoefficient KSV on the chloride concentration was examinedunder various conditions. As an example, Fig. 5 shows theresults of (F0/F � 1) vs. [Cl�] for the tests conducted underthe following conditions: the volume ratio r = 1, and[MQAE] = 0.25 mM.
3986 J. Wang et al. / Measurement 46 (2013) 3982–3987
The results show an excellent linear correlationbetween (F0/F � 1) and [Cl�]. The coefficient KSV is equalto the slope of this line; in this case, the value is 204. Sucha value is very close to the value of KSV = 200 M�1 in theconventional Stern–Volmer correlation. This is true for alltests conducted in this study. Therefore, KSV = 200 M�1 willbe used in Eq. (6).
3.2.3. Verification of the modified Stern–Volmer correlationIn order to verify the modified Stern–Volmer correla-
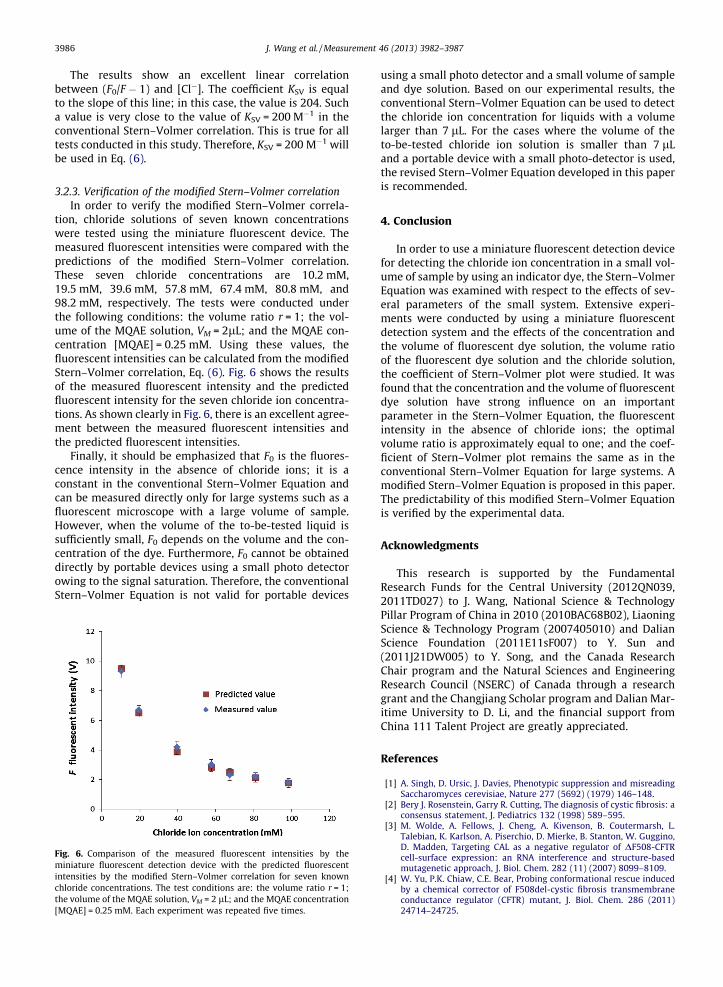
tion, chloride solutions of seven known concentrationswere tested using the miniature fluorescent device. Themeasured fluorescent intensities were compared with thepredictions of the modified Stern–Volmer correlation.These seven chloride concentrations are 10.2 mM,19.5 mM, 39.6 mM, 57.8 mM, 67.4 mM, 80.8 mM, and98.2 mM, respectively. The tests were conducted underthe following conditions: the volume ratio r = 1; the vol-ume of the MQAE solution, VM = 2lL; and the MQAE con-centration [MQAE] = 0.25 mM. Using these values, thefluorescent intensities can be calculated from the modifiedStern–Volmer correlation, Eq. (6). Fig. 6 shows the resultsof the measured fluorescent intensity and the predictedfluorescent intensity for the seven chloride ion concentra-tions. As shown clearly in Fig. 6, there is an excellent agree-ment between the measured fluorescent intensities andthe predicted fluorescent intensities.
Finally, it should be emphasized that F0 is the fluores-cence intensity in the absence of chloride ions; it is aconstant in the conventional Stern–Volmer Equation andcan be measured directly only for large systems such as afluorescent microscope with a large volume of sample.However, when the volume of the to-be-tested liquid issufficiently small, F0 depends on the volume and the con-centration of the dye. Furthermore, F0 cannot be obtaineddirectly by portable devices using a small photo detectorowing to the signal saturation. Therefore, the conventionalStern–Volmer Equation is not valid for portable devices
Fig. 6. Comparison of the measured fluorescent intensities by theminiature fluorescent detection device with the predicted fluorescentintensities by the modified Stern–Volmer correlation for seven knownchloride concentrations. The test conditions are: the volume ratio r = 1;the volume of the MQAE solution, VM = 2 lL; and the MQAE concentration[MQAE] = 0.25 mM. Each experiment was repeated five times.
using a small photo detector and a small volume of sampleand dye solution. Based on our experimental results, theconventional Stern–Volmer Equation can be used to detectthe chloride ion concentration for liquids with a volumelarger than 7 lL. For the cases where the volume of theto-be-tested chloride ion solution is smaller than 7 lLand a portable device with a small photo-detector is used,the revised Stern–Volmer Equation developed in this paperis recommended.
4. Conclusion
In order to use a miniature fluorescent detection devicefor detecting the chloride ion concentration in a small vol-ume of sample by using an indicator dye, the Stern–VolmerEquation was examined with respect to the effects of sev-eral parameters of the small system. Extensive experi-ments were conducted by using a miniature fluorescentdetection system and the effects of the concentration andthe volume of fluorescent dye solution, the volume ratioof the fluorescent dye solution and the chloride solution,the coefficient of Stern–Volmer plot were studied. It wasfound that the concentration and the volume of fluorescentdye solution have strong influence on an importantparameter in the Stern–Volmer Equation, the fluorescentintensity in the absence of chloride ions; the optimalvolume ratio is approximately equal to one; and the coef-ficient of Stern–Volmer plot remains the same as in theconventional Stern–Volmer Equation for large systems. Amodified Stern–Volmer Equation is proposed in this paper.The predictability of this modified Stern–Volmer Equationis verified by the experimental data.
Acknowledgments
This research is supported by the FundamentalResearch Funds for the Central University (2012QN039,2011TD027) to J. Wang, National Science & TechnologyPillar Program of China in 2010 (2010BAC68B02), LiaoningScience & Technology Program (2007405010) and DalianScience Foundation (2011E11sF007) to Y. Sun and(2011J21DW005) to Y. Song, and the Canada ResearchChair program and the Natural Sciences and EngineeringResearch Council (NSERC) of Canada through a researchgrant and the Changjiang Scholar program and Dalian Mar-itime University to D. Li, and the financial support fromChina 111 Talent Project are greatly appreciated.
References
[1] A. Singh, D. Ursic, J. Davies, Phenotypic suppression and misreadingSaccharomyces cerevisiae, Nature 277 (5692) (1979) 146–148.
[2] Bery J. Rosenstein, Garry R. Cutting, The diagnosis of cystic fibrosis: aconsensus statement, J. Pediatrics 132 (1998) 589–595.
[3] M. Wolde, A. Fellows, J. Cheng, A. Kivenson, B. Coutermarsh, L.Talebian, K. Karlson, A. Piserchio, D. Mierke, B. Stanton, W. Guggino,D. Madden, Targeting CAL as a negative regulator of DF508-CFTRcell-surface expression: an RNA interference and structure-basedmutagenetic approach, J. Biol. Chem. 282 (11) (2007) 8099–8109.
[4] W. Yu, P.K. Chiaw, C.E. Bear, Probing conformational rescue inducedby a chemical corrector of F508del-cystic fibrosis transmembraneconductance regulator (CFTR) mutant, J. Biol. Chem. 286 (2011)24714–24725.
J. Wang et al. / Measurement 46 (2013) 3982–3987 3987
[5] M.D. Amaral, K. Kunzelmann, Molecular targeting of CFTR as atherapeutic approach to cystic fibrosis, Trends Pharmacol. Sci. 28 (7)(2007) 334–341.
[6] M.E. Egan, M. Pearson, S.A. Weiner, et al., Curcumin, a majorconstituent of turmeric, corrects cystic fibrosis defects, Science 304(5670) (2004) 600–602.
[7] E. Kerem, S. Hirawat, S. Armoni, et al., Effectiveness of PTC124treatment of cystic fibrosis caused by nonsense mutations: aprospective Phase II trial, Lancet 372 (9640) (2008) 719–727.
[8] D.M. Hutt, D. Herman, A.P. Rodrigues, S. Noel, J.M. Pilewski, J.Matteson, B. Hoch, W. Kellner, J.W. Kelly, A. Schmidt, P.J. Thomas, Y.Matsumura, W.R. Skach, M. Gentzsch, J.R. Riordan, E.J. Sorscher, T.Okiyoneda, J.R. Yates, G.L. Lukacs, R.A. Frizze, G. Manning, J.M.Gottesfeld, W.E. Balch, Reduced histone deacetylase 7 activityrestores function to misfolded CFTR in cystic fibrosis (2010), Nat.Chem. Biol. 6 (1) (2010) 25–33.
[9] F. Van Goor, S. Hadida, P.D. Grootenhuis, B. Burton, D. Cao, T.Neuberger, A. Turnbull, A. Singh, J. Joubran, A. Hazlewood, J. Zhou, J.McCartney, V. Arumugam, C. Decker, J. Yang, C. Young, E.R. Olson, J.J.Wine, R.A. Frizzell, M. Ashlock, P. Negulescu, Rescue of CF airwayepithelial cell function in vitro by a CFTR potentiator, VX-770, Proc.Natl. Acad. Sci. USA 106 (44) (2009) 18825–18830.
[10] L. Linde, S. Boelz, M. Nissim-Rafinia, Y.S. Oren, M. Wilschanski, Y.Yaacov, D. Virgilis, G. Neu-Yilik, A.E. Kulozik, E. Kerem, B. Kerem,Nonsense-mediated mRNA decay affects nonsense transcript levelsand governs response of cystic fibrosis patients to gentamicin, J. Clin.Invest. 117 (3) (2007) 683–692.
[11] Lewis.E. Gibson, Robert.E. Cooke, A test for concentration ofelectrolytes in sweat in cystic fibrosis of the pancreas utilizingpilocarping by iontophoresis, Pediatrics 23 (1959) 545–549.
[12] Jose Luis Lezana, Mario H. Vargasc, Jose KaramBechara, Ruth S.Aldana, María E.Y. Furuya, Sweat conductivity and chloride titrationfor cystic fibrosis diagnosis in 3834 subjects, J. Cystic Fibrosis 2(2003) 1–7.
[13] Z. Servetnyk, G.M. Roomans, Chloride transport in NCL-SG3 sweatgland cells: channels involved, Exp. Mol. Pathol. 83 (2007) 47–53.
[14] P.M. Quinton, Chloride impermeability in cystic fibrosis, Nature 301(5899) (1983) 421–422.
[15] Isabelle Sermet-Gaudelus, Emanuelle Girodon, Dorota Sands,Nathalie Stremmler, Vera Vavrova, Clinical phenotype andgenotype of children with borderline sweat test and abnormalnasal epithelial chloride transport, Am. J. Respir. Crit. Care Med. 182(2010) 929–936.
[16] D. Hubert, D. Dusser, A. Bry, I. Fajac, Evaluation of a new tool formeasurement of sweat chloride concentration, J. Cyst. Fibrosis 8(2009) S5.
[17] M.S. Cartiera, E.C. Ferreira, C. Caputo, M.E. Egan, M.J. Caplan, W.M.Saltzman, Partial correction of cystic fibrosis defects with PLGAnanoparticles encapsulating curcumin, Mol. Pharm. 7 (1) (2010) 86–93.
[18] M.E. Egan, J. Glockner-Pagel, C. Ambrose, P.A. Cahill, L. Pappoe, N.Balamuth, E. Cho, S. Canny, C.A. Wagner, J. Geibel, M.J. Caplan,Calcium-pump inhibitors induce functional surface expression ofDF508-CFTR protein in cystic fibrosis epithelial cells, Nat. Med. 8 (5)(2002) 485–492.
[19] Wang Junsheng, Wu Xudong, Chon Chanhee, Tangja Ganska, LiDongqing, A novel device for quantitative measurement of chlorideconcentration by fluorescence indicator, Meas. Sci. Technol. 23(2012) 025701 (6pp) doi: http://dx.doi.org/10.1088/0957-0233/23/2/025701.
[20] C. Goubau, M. Wilschanski, V. Skalická, Phenotypic characterizationof patients with intermediate sweat chloride values: towardsvalidation of the European diagnostic algorithm for cystic fibrosis,Thorax 64 (2009) 683–691.
[21] M.S. Mehata, H.B. Tripathi, Fluorescence quenching of 6-methoxyquinoline: an indicator for sensing chloride ion inaqueous media, J. Lumin. 99 (2002) 47–52.
[22] A. Dragomir, C. Andersson, M.R. Aeslund, Assessment of chloridesecretion in human nasal epithelial cells by X-ray microanalysis, J.Microsc. 3 (2001) 277–284.
[23] Chris D. Geddes, Kathleen Apperson, Jan Karolin, David J.S. Birch,Chloride sensitive fluorescent indicators, Anal. Biochem. 293 (2001)60–66.
[24] Christian Barmeyer, Jeff Huaqing Ye, ShafikSidani, Characteristics ofrat downregulated in adenoma (rDRA) expressed in HEK 293 cells,Pflugers Arch. – Eur. J. Physiol. 454 (2007) 441–450.

![Approach for Substituted Heteroarene Synthesis Desulfonative … · 2019-03-14 · Stern-Volmer Studies Using HetAr Sulfone as Quencher [Sulfone]/M I 0 /I As is shown in the chart,](https://img.pdfslide.us/doc/110x75/5f6429468f126977bb11bd18/approach-for-substituted-heteroarene-synthesis-desulfonative-2019-03-14-stern-volmer.jpg)