Embed Size (px)
Citation preview
Appendix
B
Science with TI-Nspire Technology ©Vernier Software & Technology B - 1
Using DataQuest on a Handheld
This appendix gives an overview of using the Vernier DataQuest application on a TI-Nspire handheld. It includes information on accessing the common tools in the DataQuest Application.
DataQuest is included in TI-Nspire handheld software versions 3.0 and newer. If you have an older version of TI-Nspire software, you can get updates at education.ti.com.
The TI-Nspire Software
Access Menus
DataQuest can be used to collect, display, and analyze data. Most features can be accessed using the application menus. To access the menus, press b.
Access Context Menus
To access context menus, move the cursor over the object using the touchpad or arrow keys, and press /b. Meters, View details boxes, graphs, and the table all have contextual menus.
Open a New Document
To open a new document, press c then select New Document. Having only one TI-Nspire document opened when using DataQuest is recommended.
Add a Page or Problem
To add a new page or problem to your TI-Nspire document, press ~ (/c for clickpad handhelds) and choose Problem or Page from the Insert menu. For touchpad handhelds, you can also add a page by pressing /~.
Save a document
To save your TI-Nspire document, press ~ (/c for clickpad handhelds) and choose Save from the File menu or press /S.
Scratch Pad Calculator
The Scratch Pad Calculator is a built-in calculator that can be used to perform calculations while you are conducting an experiment. To use the Scratch Pad Calculator, press ». (On a click pad handheld, press c then select the Scratchpad Calculate option.)
Appendix B
B - 2 Science with TI-Nspire Technology
Start DataQuest
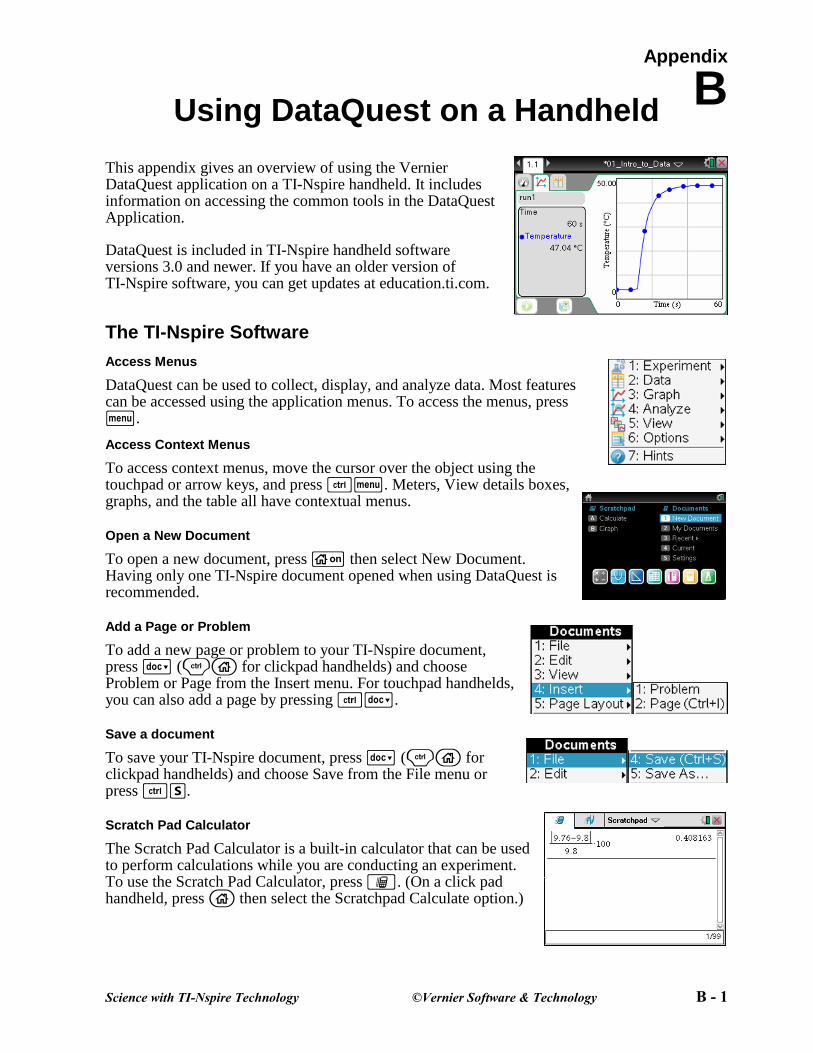
DataQuest should automatically start when you connect a TI-Nspire Lab Cradle, EasyLink interface, EasyTemp temperature probe, or Texas Instruments CBR 2™ motion detector to your handheld.
Manually Launch DataQuest
To start DataQuest manually, press c then select . You can also press ~ (/c for clickpad handhelds) and choose Vernier DataQuest from the Insert menu.
Views in DataQuest
There are three views in the DataQuest application: Meter, Graph, and Table. Click a tab to change views or press b then choose the desired view from the
View menu.
On the left side of the screen in each view, you will see the View details box. The Meter View details box shows the data-collection settings. The Graph View details box shows graph trace and analysis information. The Table View details box shows data set variable information.
Data Collection Settings
Change the Data-Collection Mode
1. Press b then choose Collection Mode from the Experiment menu.
2. Select the data-collection mode you want to use.
Note: Changing modes will require you to discard any collected data. To avoid losing data, save the current document and open a new document, or insert a new problem in the current document.
3. A dialog showing the data-collection settings for the mode you have selected will be displayed. Adjust the settings as desired for your experiment. Use e to move between entry lines.
4. When you are done setting up the data collection, select OK.
Change Data-Collection Settings
When you have already set up the data-collection mode and want to make changes to the settings, you can change the values you have entered.
1. Press b then choose Collection Setup from the Experiment menu.
2. Make the necessary changes and select OK.
Using DataQuest on a Handheld
Science with TI-Nspire Technology B - 3
Sensor Settings
Change Units
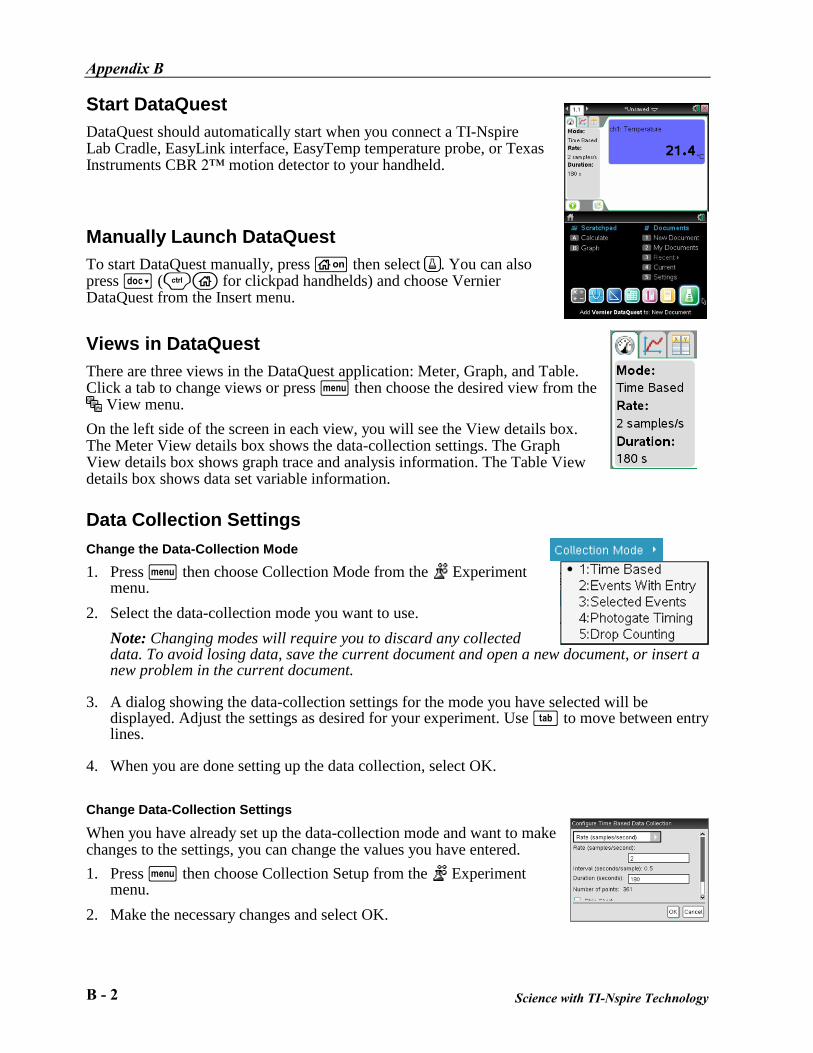
1. Press b then choose Set Up Sensors ► Change Units from the
Experiment menu.
2. Select the unit you want to use. The readings from the sensor and any collected data will be displayed in the new unit.
Calibrate a Sensor
Not all sensors can be calibrated. Check the sensor booklet for specific information about your sensor. For most experiments, the sensor’s stored calibration is recommended. In some instances, you may want to calibrate a sensor to get readings that are even more accurate.
1. Press b then choose Set Up Sensors ► Calibrate from the
Experiment menu. Select the appropriate calibration option for your situation:
Manual Entry – Use Manual Entry when you know the calibration equation and want to enter the coefficients directly.
Two Point – Use Two Point for most calibrations.
Single Point – Use Single Point when only one known calibration value is attainable (for example, calibrating a Barometer to match the current atmospheric pressure). Single Point calibration will only affect the intercept of the calibration equation.
2. Perform a live calibration (Two Point or Single Point).
a. Place the sensor in the desired calibration environment, enter the reference value, wait for the voltage readings to stabilize, and select Keep.
b. Two Point only – place the sensor in a second calibration environment, enter the reference value, wait for the voltage readings to stabilize, and select Keep.
3. Note the updated calibration equation, modify if necessary (Manual
Entry), and select OK.
Zero a Sensor
Not all sensors can be zeroed. Check the sensor booklet for specific information about your sensor.
To zero a sensor, press b then select Set Up Sensors ► Zero from the Experiment menu. Note: When you have more than one sensor you want to zero, select the All Sensors option.
Reverse a Sensor
Not all sensors can be reversed. Check the sensor booklet for specific information about your sensor.
Press b then choose Set Up Sensors ► Reverse from the Experiment menu. The sign of the sensor reading is changed as noted in the example.
Appendix B
B - 4 Science with TI-Nspire Technology
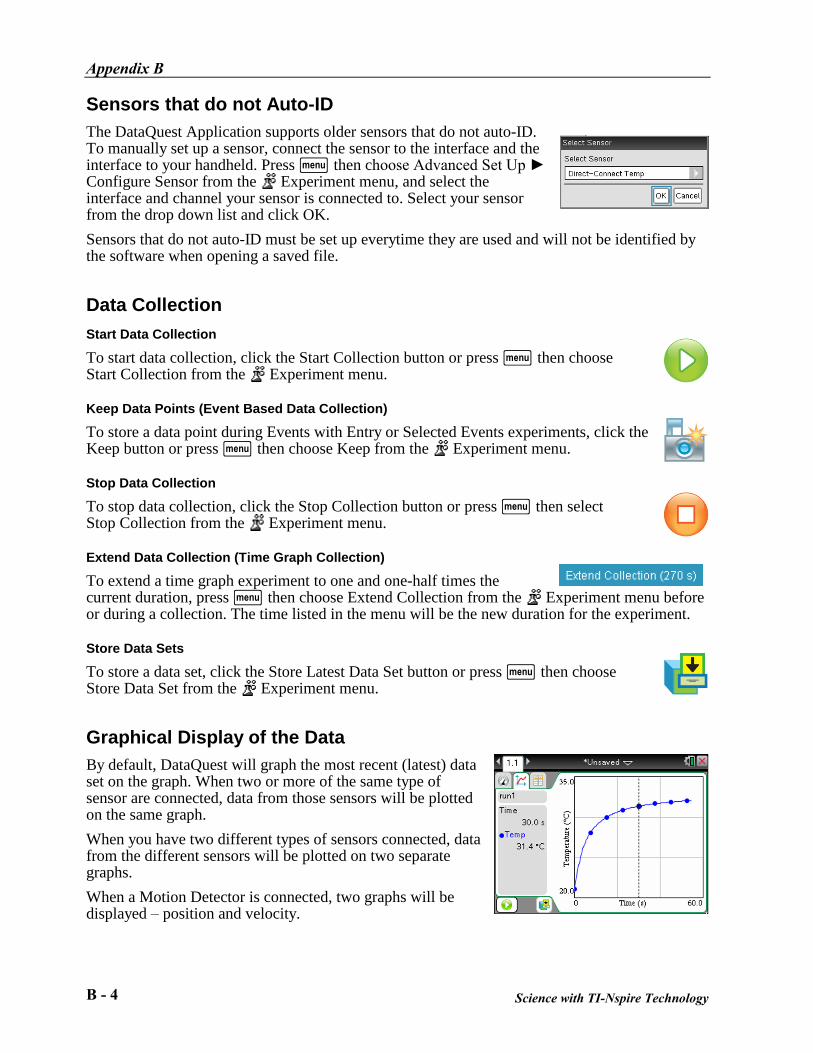
Sensors that do not Auto-ID
The DataQuest Application supports older sensors that do not auto-ID. To manually set up a sensor, connect the sensor to the interface and the interface to your handheld. Press b then choose Advanced Set Up ► Configure Sensor from the Experiment menu, and select the interface and channel your sensor is connected to. Select your sensor from the drop down list and click OK.
Sensors that do not auto-ID must be set up everytime they are used and will not be identified by the software when opening a saved file.
Data Collection
Start Data Collection
To start data collection, click the Start Collection button or press b then choose Start Collection from the Experiment menu.
Keep Data Points (Event Based Data Collection)
To store a data point during Events with Entry or Selected Events experiments, click the Keep button or press b then choose Keep from the Experiment menu.
Stop Data Collection
To stop data collection, click the Stop Collection button or press b then select Stop Collection from the Experiment menu.
Extend Data Collection (Time Graph Collection)
To extend a time graph experiment to one and one-half times the current duration, press b then choose Extend Collection from the Experiment menu before or during a collection. The time listed in the menu will be the new duration for the experiment.
Store Data Sets
To store a data set, click the Store Latest Data Set button or press b then choose Store Data Set from the Experiment menu.
Graphical Display of the Data
By default, DataQuest will graph the most recent (latest) data set on the graph. When two or more of the same type of sensor are connected, data from those sensors will be plotted on the same graph.
When you have two different types of sensors connected, data from the different sensors will be plotted on two separate graphs.
When a Motion Detector is connected, two graphs will be displayed – position and velocity.
Using DataQuest on a Handheld
Science with TI-Nspire Technology B - 5
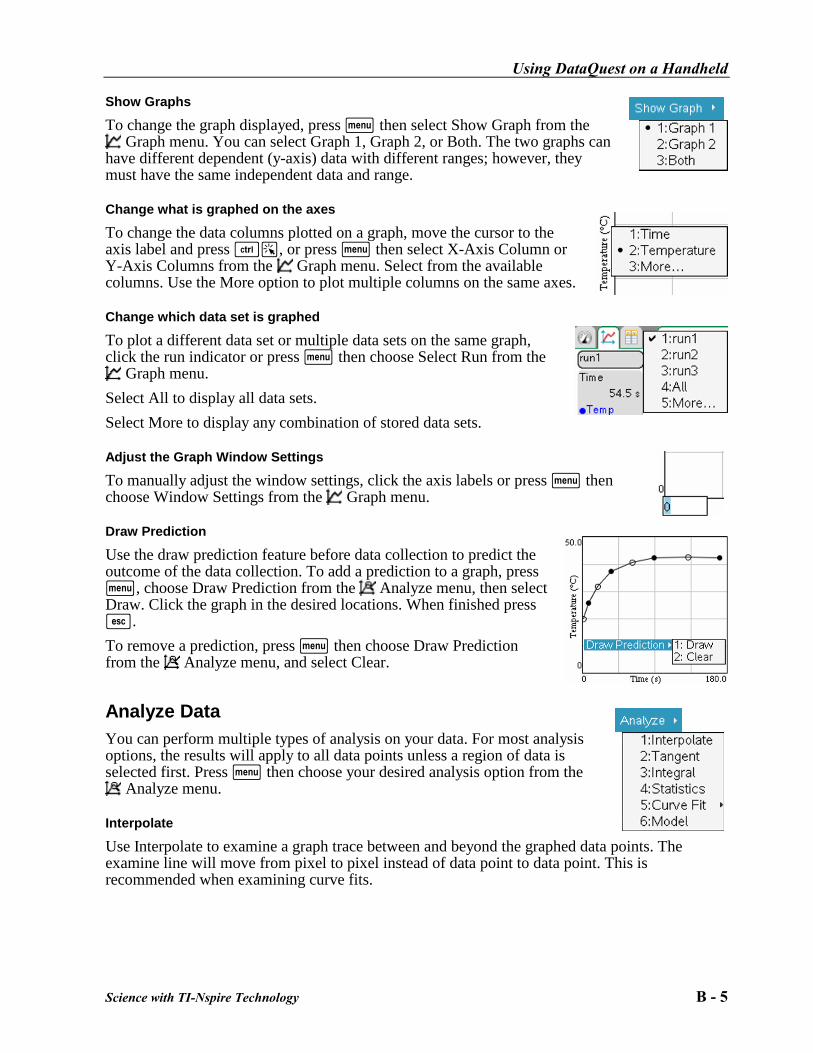
Show Graphs
To change the graph displayed, press b then select Show Graph from the
Graph menu. You can select Graph 1, Graph 2, or Both. The two graphs can have different dependent (y-axis) data with different ranges; however, they must have the same independent data and range.
Change what is graphed on the axes
To change the data columns plotted on a graph, move the cursor to the axis label and press /a, or press b then select X-Axis Column or Y-Axis Columns from the Graph menu. Select from the available columns. Use the More option to plot multiple columns on the same axes. Change which data set is graphed
To plot a different data set or multiple data sets on the same graph, click the run indicator or press b then choose Select Run from the
Graph menu.
Select All to display all data sets.
Select More to display any combination of stored data sets. Adjust the Graph Window Settings
To manually adjust the window settings, click the axis labels or press b then choose Window Settings from the Graph menu. Draw Prediction
Use the draw prediction feature before data collection to predict the outcome of the data collection. To add a prediction to a graph, press b, choose Draw Prediction from the Analyze menu, then select Draw. Click the graph in the desired locations. When finished press d.
To remove a prediction, press b then choose Draw Prediction from the Analyze menu, and select Clear.
Analyze Data
You can perform multiple types of analysis on your data. For most analysis options, the results will apply to all data points unless a region of data is selected first. Press b then choose your desired analysis option from the
Analyze menu. Interpolate
Use Interpolate to examine a graph trace between and beyond the graphed data points. The examine line will move from pixel to pixel instead of data point to data point. This is recommended when examining curve fits.
Appendix B
B - 6 Science with TI-Nspire Technology
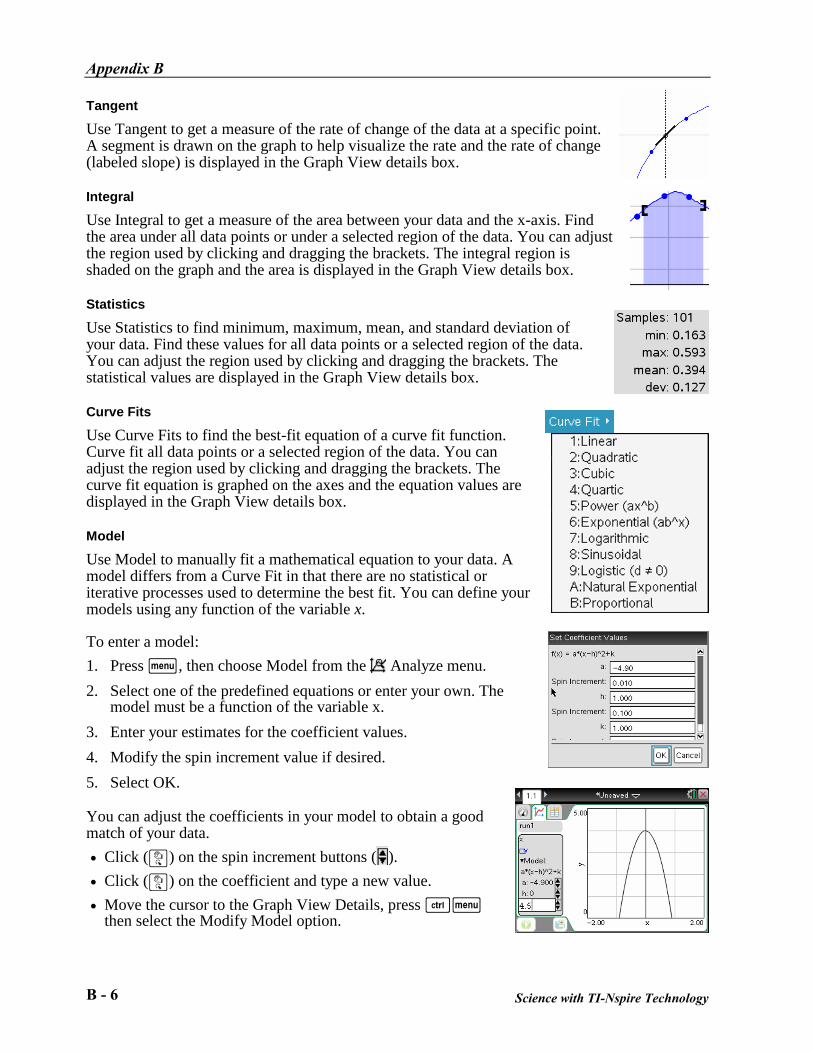
Tangent
Use Tangent to get a measure of the rate of change of the data at a specific point. A segment is drawn on the graph to help visualize the rate and the rate of change (labeled slope) is displayed in the Graph View details box.
Integral
Use Integral to get a measure of the area between your data and the x-axis. Find the area under all data points or under a selected region of the data. You can adjust the region used by clicking and dragging the brackets. The integral region is shaded on the graph and the area is displayed in the Graph View details box.
Statistics
Use Statistics to find minimum, maximum, mean, and standard deviation of your data. Find these values for all data points or a selected region of the data. You can adjust the region used by clicking and dragging the brackets. The statistical values are displayed in the Graph View details box.
Curve Fits
Use Curve Fits to find the best-fit equation of a curve fit function. Curve fit all data points or a selected region of the data. You can adjust the region used by clicking and dragging the brackets. The curve fit equation is graphed on the axes and the equation values are displayed in the Graph View details box.
Model
Use Model to manually fit a mathematical equation to your data. A model differs from a Curve Fit in that there are no statistical or iterative processes used to determine the best fit. You can define your models using any function of the variable x.
To enter a model:
1. Press b, then choose Model from the Analyze menu.
2. Select one of the predefined equations or enter your own. The model must be a function of the variable x.
3. Enter your estimates for the coefficient values.
4. Modify the spin increment value if desired.
5. Select OK.
You can adjust the coefficients in your model to obtain a good match of your data.
Click (x) on the spin increment buttons ( ).
Click (x) on the coefficient and type a new value.
Move the cursor to the Graph View Details, press /b then select the Modify Model option.
Using DataQuest on a Handheld
Science with TI-Nspire Technology B - 7
Remove an analysis feature from a graph
Use the remove option to remove an analysis (integral, statistics, curve fit, or model) from a graph. To do this, press b then choose Remove from the Analyse Menu. If there are more than one, the analysis options will be listed in the order in which they were created.
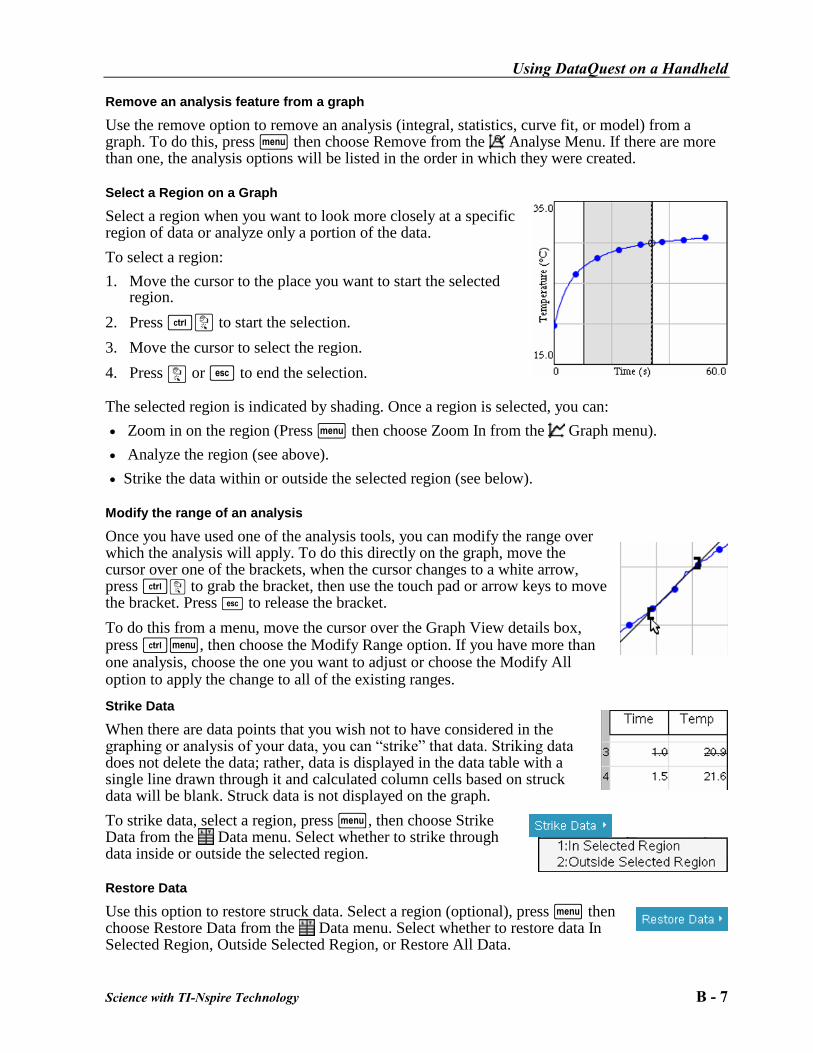
Select a Region on a Graph
Select a region when you want to look more closely at a specific region of data or analyze only a portion of the data.
To select a region:
1. Move the cursor to the place you want to start the selected region.
2. Press /x to start the selection.
3. Move the cursor to select the region.
4. Press x or d to end the selection.
The selected region is indicated by shading. Once a region is selected, you can:
Zoom in on the region (Press b then choose Zoom In from the Graph menu).
Analyze the region (see above).
Strike the data within or outside the selected region (see below). Modify the range of an analysis
Once you have used one of the analysis tools, you can modify the range over which the analysis will apply. To do this directly on the graph, move the cursor over one of the brackets, when the cursor changes to a white arrow, press /x to grab the bracket, then use the touch pad or arrow keys to move the bracket. Press d to release the bracket.
To do this from a menu, move the cursor over the Graph View details box, press /b, then choose the Modify Range option. If you have more than one analysis, choose the one you want to adjust or choose the Modify All option to apply the change to all of the existing ranges.
Strike Data
When there are data points that you wish not to have considered in the graphing or analysis of your data, you can “strike” that data. Striking data does not delete the data; rather, data is displayed in the data table with a single line drawn through it and calculated column cells based on struck data will be blank. Struck data is not displayed on the graph.
To strike data, select a region, press b, then choose Strike Data from the Data menu. Select whether to strike through data inside or outside the selected region.
Restore Data
Use this option to restore struck data. Select a region (optional), press b then choose Restore Data from the Data menu. Select whether to restore data In Selected Region, Outside Selected Region, or Restore All Data.
Appendix B
B - 8 Science with TI-Nspire Technology
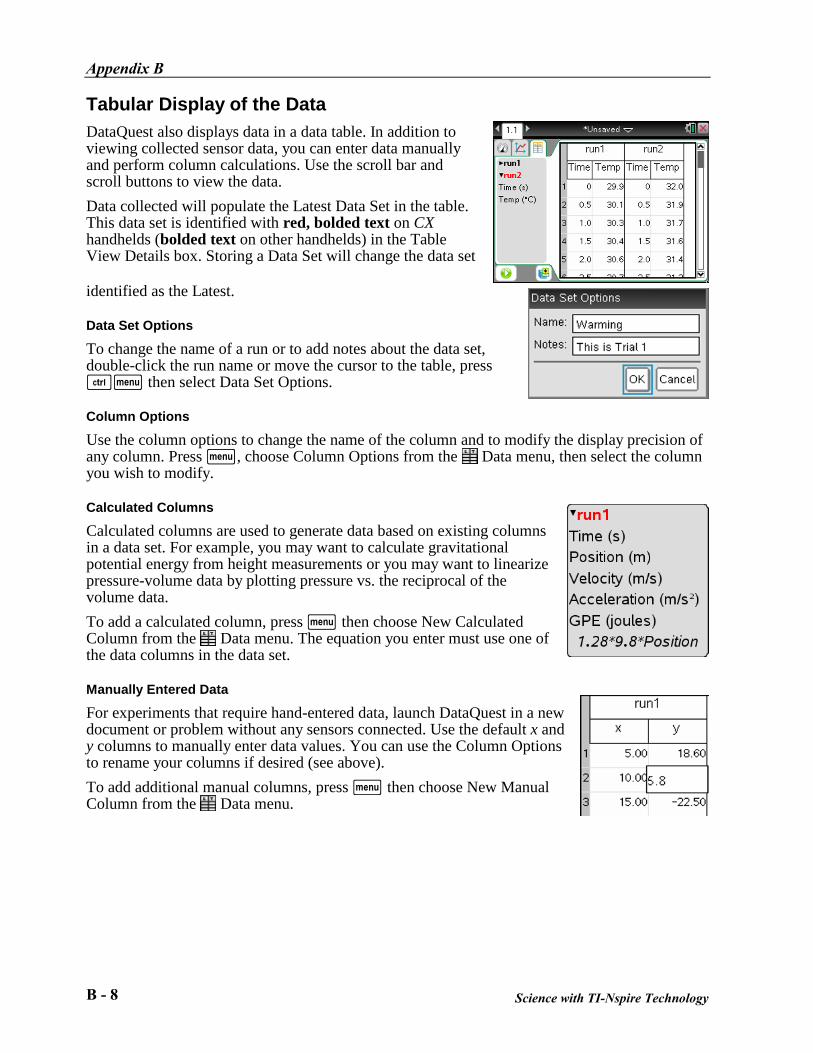
Tabular Display of the Data
DataQuest also displays data in a data table. In addition to viewing collected sensor data, you can enter data manually and perform column calculations. Use the scroll bar and scroll buttons to view the data.
Data collected will populate the Latest Data Set in the table. This data set is identified with red, bolded text on CX handhelds (bolded text on other handhelds) in the Table View Details box. Storing a Data Set will change the data set
identified as the Latest.
Data Set Options
To change the name of a run or to add notes about the data set, double-click the run name or move the cursor to the table, press /b then select Data Set Options.
Column Options
Use the column options to change the name of the column and to modify the display precision of any column. Press b, choose Column Options from the Data menu, then select the column you wish to modify.
Calculated Columns
Calculated columns are used to generate data based on existing columns in a data set. For example, you may want to calculate gravitational potential energy from height measurements or you may want to linearize pressure-volume data by plotting pressure vs. the reciprocal of the volume data.
To add a calculated column, press b then choose New Calculated Column from the Data menu. The equation you enter must use one of the data columns in the data set.
Manually Entered Data
For experiments that require hand-entered data, launch DataQuest in a new document or problem without any sensors connected. Use the default x and y columns to manually enter data values. You can use the Column Options to rename your columns if desired (see above).
To add additional manual columns, press b then choose New Manual Column from the Data menu.
Using DataQuest on a Handheld
Science with TI-Nspire Technology B - 9
DataQuest Options
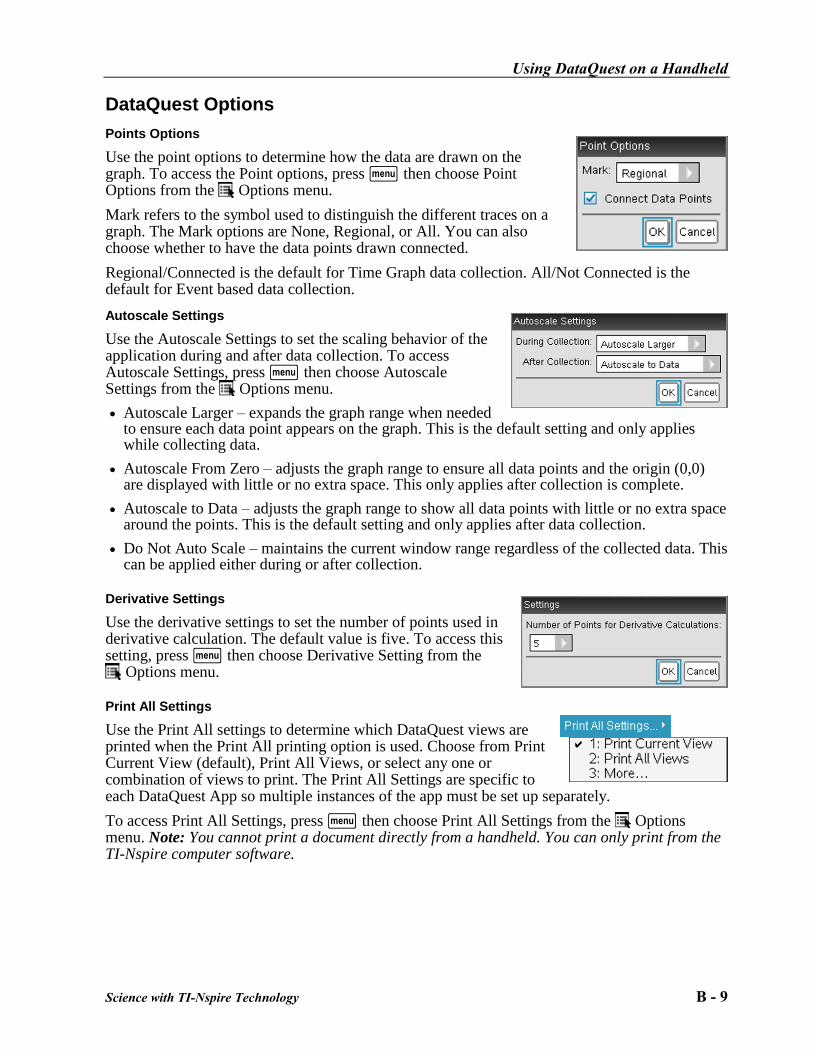
Points Options
Use the point options to determine how the data are drawn on the graph. To access the Point options, press b then choose Point Options from the Options menu.
Mark refers to the symbol used to distinguish the different traces on a graph. The Mark options are None, Regional, or All. You can also choose whether to have the data points drawn connected.
Regional/Connected is the default for Time Graph data collection. All/Not Connected is the default for Event based data collection.
Autoscale Settings
Use the Autoscale Settings to set the scaling behavior of the application during and after data collection. To access Autoscale Settings, press b then choose Autoscale Settings from the Options menu.
Autoscale Larger – expands the graph range when needed to ensure each data point appears on the graph. This is the default setting and only applies while collecting data.
Autoscale From Zero – adjusts the graph range to ensure all data points and the origin (0,0) are displayed with little or no extra space. This only applies after collection is complete.
Autoscale to Data – adjusts the graph range to show all data points with little or no extra space around the points. This is the default setting and only applies after data collection.
Do Not Auto Scale – maintains the current window range regardless of the collected data. This can be applied either during or after collection.
Derivative Settings
Use the derivative settings to set the number of points used in derivative calculation. The default value is five. To access this setting, press b then choose Derivative Setting from the
Options menu.
Print All Settings
Use the Print All settings to determine which DataQuest views are printed when the Print All printing option is used. Choose from Print Current View (default), Print All Views, or select any one or combination of views to print. The Print All Settings are specific to each DataQuest App so multiple instances of the app must be set up separately.
To access Print All Settings, press b then choose Print All Settings from the Options menu. Note: You cannot print a document directly from a handheld. You can only print from the TI-Nspire computer software.
Appendix B
B - 10 Science with TI-Nspire Technology
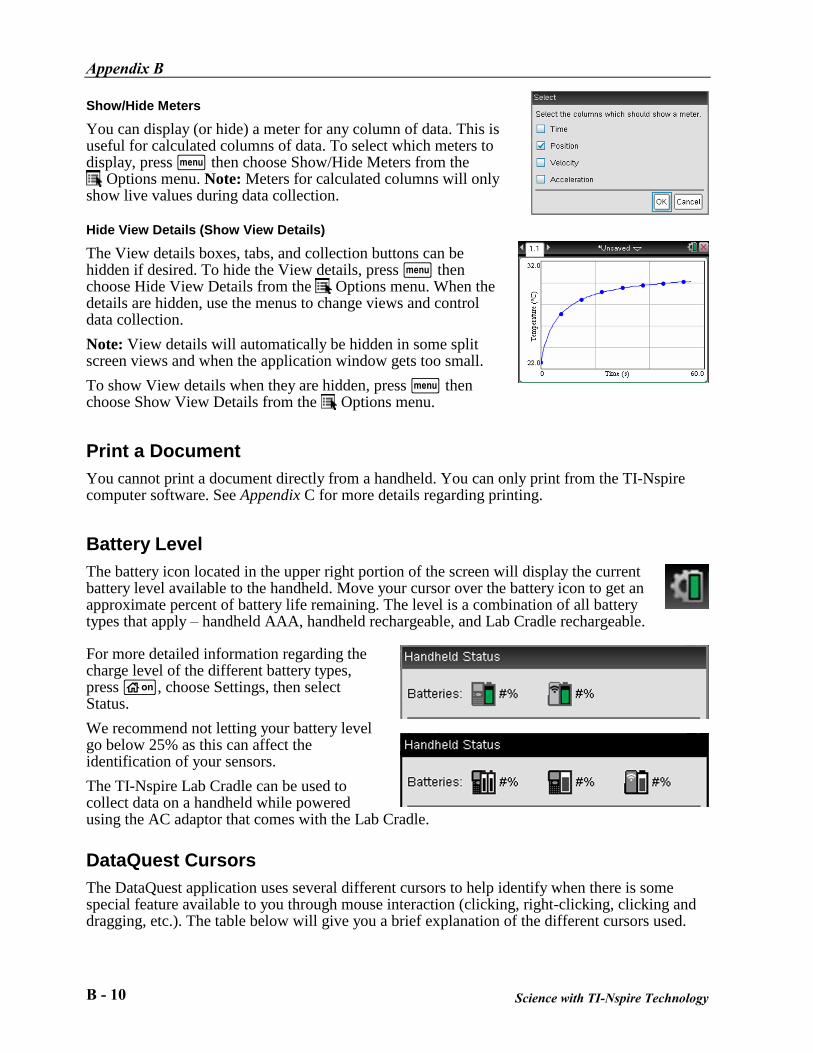
Show/Hide Meters
You can display (or hide) a meter for any column of data. This is useful for calculated columns of data. To select which meters to display, press b then choose Show/Hide Meters from the
Options menu. Note: Meters for calculated columns will only show live values during data collection.
Hide View Details (Show View Details)
The View details boxes, tabs, and collection buttons can be hidden if desired. To hide the View details, press b then choose Hide View Details from the Options menu. When the details are hidden, use the menus to change views and control data collection.
Note: View details will automatically be hidden in some split screen views and when the application window gets too small.
To show View details when they are hidden, press b then choose Show View Details from the Options menu.
Print a Document
You cannot print a document directly from a handheld. You can only print from the TI-Nspire computer software. See Appendix C for more details regarding printing.
Battery Level
The battery icon located in the upper right portion of the screen will display the current battery level available to the handheld. Move your cursor over the battery icon to get an approximate percent of battery life remaining. The level is a combination of all battery types that apply – handheld AAA, handheld rechargeable, and Lab Cradle rechargeable.
For more detailed information regarding the charge level of the different battery types, press c, choose Settings, then select Status.
We recommend not letting your battery level go below 25% as this can affect the identification of your sensors.
The TI-Nspire Lab Cradle can be used to collect data on a handheld while powered using the AC adaptor that comes with the Lab Cradle.
DataQuest Cursors
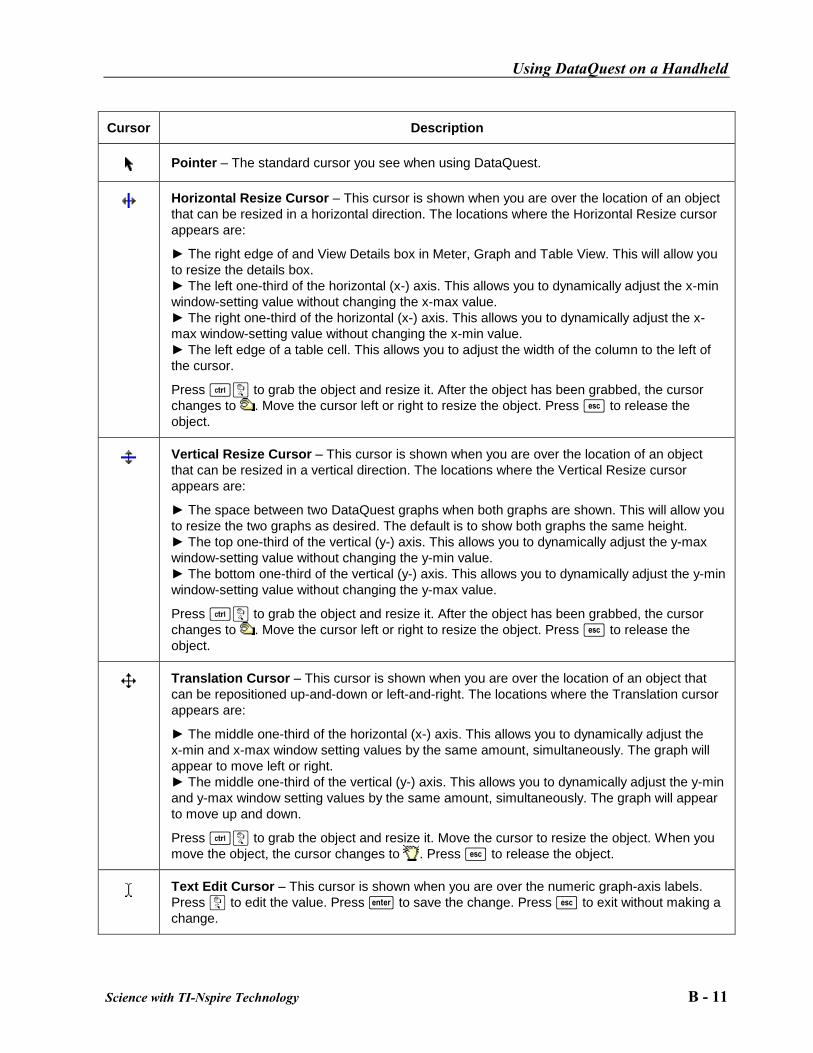
The DataQuest application uses several different cursors to help identify when there is some special feature available to you through mouse interaction (clicking, right-clicking, clicking and dragging, etc.). The table below will give you a brief explanation of the different cursors used.
Using DataQuest on a Handheld
Science with TI-Nspire Technology B - 11
Cursor
Description
Pointer – The standard cursor you see when using DataQuest.
Horizontal Resize Cursor – This cursor is shown when you are over the location of an object
that can be resized in a horizontal direction. The locations where the Horizontal Resize cursor
appears are: ► The right edge of and View Details box in Meter, Graph and Table View. This will allow you
to resize the details box.
► The left one-third of the horizontal (x-) axis. This allows you to dynamically adjust the x-min
window-setting value without changing the x-max value.
► The right one-third of the horizontal (x-) axis. This allows you to dynamically adjust the x-
max window-setting value without changing the x-min value.
► The left edge of a table cell. This allows you to adjust the width of the column to the left of
the cursor. Press /x to grab the object and resize it. After the object has been grabbed, the cursor
changes to . Move the cursor left or right to resize the object. Press d to release the
object.
Vertical Resize Cursor – This cursor is shown when you are over the location of an object
that can be resized in a vertical direction. The locations where the Vertical Resize cursor
appears are: ► The space between two DataQuest graphs when both graphs are shown. This will allow you
to resize the two graphs as desired. The default is to show both graphs the same height.
► The top one-third of the vertical (y-) axis. This allows you to dynamically adjust the y-max
window-setting value without changing the y-min value.
► The bottom one-third of the vertical (y-) axis. This allows you to dynamically adjust the y-min
window-setting value without changing the y-max value. Press /x to grab the object and resize it. After the object has been grabbed, the cursor
changes to . Move the cursor left or right to resize the object. Press d to release the
object.
Translation Cursor – This cursor is shown when you are over the location of an object that
can be repositioned up-and-down or left-and-right. The locations where the Translation cursor
appears are: ► The middle one-third of the horizontal (x-) axis. This allows you to dynamically adjust the
x-min and x-max window setting values by the same amount, simultaneously. The graph will
appear to move left or right.
► The middle one-third of the vertical (y-) axis. This allows you to dynamically adjust the y-min
and y-max window setting values by the same amount, simultaneously. The graph will appear
to move up and down. Press /x to grab the object and resize it. Move the cursor to resize the object. When you
move the object, the cursor changes to . Press d to release the object.
Text Edit Cursor – This cursor is shown when you are over the numeric graph-axis labels.
Press x to edit the value. Press · to save the change. Press d to exit without making a
change.
Appendix B
B - 12 Science with TI-Nspire Technology
Cursor
Description
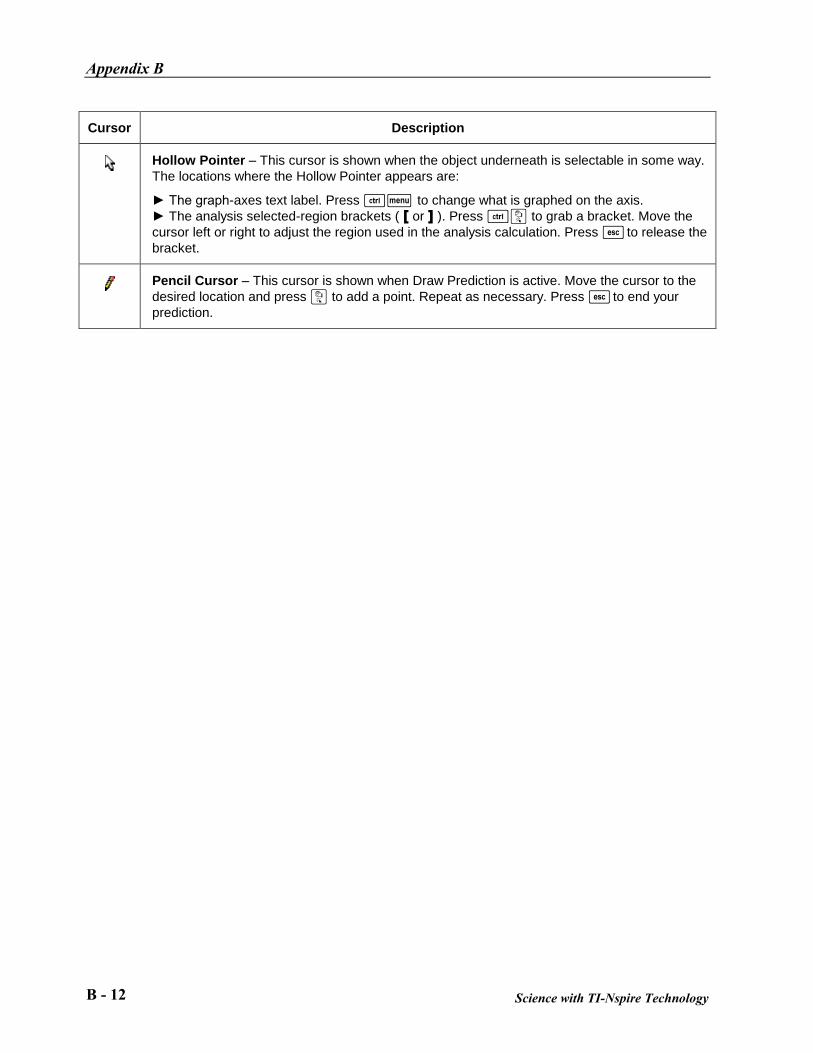
Hollow Pointer – This cursor is shown when the object underneath is selectable in some way.
The locations where the Hollow Pointer appears are: ► The graph-axes text label. Press /b to change what is graphed on the axis.
► The analysis selected-region brackets ( [ or ] ). Press /x to grab a bracket. Move the
cursor left or right to adjust the region used in the analysis calculation. Press d to release the
bracket.
Pencil Cursor – This cursor is shown when Draw Prediction is active. Move the cursor to the
desired location and press x to add a point. Repeat as necessary. Press d to end your
prediction.