Embed Size (px)
Citation preview

MINEWALL 2.0:LITERATURE REVIEW AND
CONCEPTUAL MODELS
MEND Project 1.15.2b
Mine Environment Neutral Drainage Program555 Booth Street,
Ottawa, Ontario, Canada K1A 0G1
September 1995

MINEWALL 2.0
LITERATURE REVIEW ANDCONCEPTUAL MODELS
Mine Environment Neutral Drainage Program555 Booth Street,
Ottawa, Ontario, Canada K1A 0G1

Latest Revision: September 22, 1995

MINEWALL 2.0: Literature Review and Conceptual Models i
TABLE OF CONTENTS
1. INTRODUCTION AND OBJECTIVES . . . . . . . . . . . . . . . . . . . . . . . . . . . . . . . . . . . . . . . . . . 1
2. PHYSICAL CONCEPTUAL MODELS . . . . . . . . . . . . . . . . . . . . . . . . . . . . . . . . . . . . . . . . . . 32.1 Open-Pit Mines . . . . . . . . . . . . . . . . . . . . . . . . . . . . . . . . . . . . . . . . . . . . . . . . . . . . . . 32.2 Underground Mines . . . . . . . . . . . . . . . . . . . . . . . . . . . . . . . . . . . . . . . . . . . . . . . . . . . 9
3. CHEMICAL CONCEPTUAL MODELS . . . . . . . . . . . . . . . . . . . . . . . . . . . . . . . . . . . . . . . . 153.1 Chemical Mass-Balance Equations . . . . . . . . . . . . . . . . . . . . . . . . . . . . . . . . . . . . . . 153.2 Effect of Mine Walls on Water Chemistry . . . . . . . . . . . . . . . . . . . . . . . . . . . . . . . . 173.3 Geochemical Evolution of Water Chemistry Within a Mine . . . . . . . . . . . . . . . . . . . 23
4. MINEWALL-BASED STUDIES . . . . . . . . . . . . . . . . . . . . . . . . . . . . . . . . . . . . . . . . . . . . . . 254.1 Equity Silver Mines . . . . . . . . . . . . . . . . . . . . . . . . . . . . . . . . . . . . . . . . . . . . . . . . . . 254.2 Noranda Mineral's Bell Mine . . . . . . . . . . . . . . . . . . . . . . . . . . . . . . . . . . . . . . . . . . . 284.3 BHP Minerals' Island Copper Mine . . . . . . . . . . . . . . . . . . . . . . . . . . . . . . . . . . . . . . 29
5. OTHER STUDIES NOT RELATED TO MINEWALL . . . . . . . . . . . . . . . . . . . . . . . . . . . . . 325.1 Compiled Data on Groundwater Drawdowns Near Pits . . . . . . . . . . . . . . . . . . . . . . 325.2 Compiled Information on Fractures and Their Effects on Groundwater . . . . . . . . . . 325.3 Rum Jungle, Australia . . . . . . . . . . . . . . . . . . . . . . . . . . . . . . . . . . . . . . . . . . . . . . . . 395.4 Compiled Data on Groundwater Chemistry Near Pit and Underground Mines . . . . 405.5 Research by The Ohio State University . . . . . . . . . . . . . . . . . . . . . . . . . . . . . . . . . . . 415.6 Solbec Pit, Quebec, Canada . . . . . . . . . . . . . . . . . . . . . . . . . . . . . . . . . . . . . . . . . . . . 435.7 Brunswick Mining No. 6 Minesite, New Brunswick, Canada . . . . . . . . . . . . . . . . . . 475.8 Midnite Mine, Washington, USA . . . . . . . . . . . . . . . . . . . . . . . . . . . . . . . . . . . . . . . 505.9 Bunker Hill Mine, Idaho, USA . . . . . . . . . . . . . . . . . . . . . . . . . . . . . . . . . . . . . . . . . 625.10 Berkeley Pit, Montana, USA . . . . . . . . . . . . . . . . . . . . . . . . . . . . . . . . . . . . . . . . . . 655.10 D Pit, Amok Minesite, Saskatchewan, Canada . . . . . . . . . . . . . . . . . . . . . . . . . . . . 665.11 Myra Falls Operations, British Columbia, Canada . . . . . . . . . . . . . . . . . . . . . . . . . 72
6. CONCLUSION . . . . . . . . . . . . . . . . . . . . . . . . . . . . . . . . . . . . . . . . . . . . . . . . . . . . . . . . . . . . 79
7. REFERENCES . . . . . . . . . . . . . . . . . . . . . . . . . . . . . . . . . . . . . . . . . . . . . . . . . . . . . . . . . . . . 80

MINEWALL 2.0: Literature Review and Conceptual Models ii
LIST OF TABLES
4-1. Unit-Area Production Rates from the MINEWALL Stations at Equity Silver Mines . . . . . 264-2. Partial Input Data for the Simulation of the Main Zone Pit at Equity Silver Mines . . . . . . 274-3. Average Production Rates for Bell Mine MINEWALL Stations . . . . . . . . . . . . . . . . . . . . . 304-4. Average Production Rates for MINEWALL Stations at Island Copper Mine . . . . . . . . . . . 31
5-1. Case Studies of Groundwater Flow to Pits . . . . . . . . . . . . . . . . . . . . . . . . . . . . . . . . . . . 33-345-2. Adjusted Rates of Acid Leaching and Flow Dependencies . . . . . . . . . . . . . . . . . . . . . . . . . 445-3. Conductance and pH with Depth from Pit 4, Midnite Mine . . . . . . . . . . . . . . . . . . . . . . . . 535-4. Pit 4 Water Chemistry with Depth, Midnite Mine . . . . . . . . . . . . . . . . . . . . . . . . . . . . . 54-555-5. Conductance and pH with Depth from Pit 3, Midnite Mine . . . . . . . . . . . . . . . . . . . . . . . . 565-6. Pit 3 Water Chemistry with Depth, Midnite Mine . . . . . . . . . . . . . . . . . . . . . . . . . . . . . 57-585-7. Conductance and pH with Depth from Retention Pond, Midnite Mine . . . . . . . . . . . . . . . . 595-8. Retention Pond Water Chemistry with Depth, Midnite Mine . . . . . . . . . . . . . . . . . . . . 60-615-9. Water Chemistry in the Flooding Berkeley Pit . . . . . . . . . . . . . . . . . . . . . . . . . . . . . . . . . . . 675-10. Depth-Specific Areas and Volumes for D Pit . . . . . . . . . . . . . . . . . . . . . . . . . . . . . . . . . . . 695-11. Chemical Analyses of Bottom and Suspended Sediment in D Pit . . . . . . . . . . . . . . . . . . . 70
LIST OF FIGURES
2-1. Conceptual MINEWALL Model of Water Movement In andNear Pit Walls During Operation . . . . . . . . . . . . . . . . . . . . . . . . . . . . . . . . . . . . . . . . . . . . 4
2-2. Conceptual MINEWALL Model of Pit Filling by NaturalProcesses During Closure . . . . . . . . . . . . . . . . . . . . . . . . . . . . . . . . . . . . . . . . . . . . . . . . . 6
2-3. Conceptual MINEWALL Model of Pit Filling by AssistedMethods During Closure . . . . . . . . . . . . . . . . . . . . . . . . . . . . . . . . . . . . . . . . . . . . . . . . . . 7
2-4. Conceptual MINEWALL Model of a Pit Filled to its Static Level . . . . . . . . . . . . . . . . . . . . 82-5. Conceptual Models for Underground Mines
Free Draining to Surface or a Shaft . . . . . . . . . . . . . . . . . . . . . . . . . . . . . . . . . . . . . . . . . 112-6. Conceptual Models for Underground Mines During Closure
with No Portal Plugging . . . . . . . . . . . . . . . . . . . . . . . . . . . . . . . . . . . . . . . . . . . . . . . . . . 122-7. Conceptual Models for Underground Mines During Closure
with Fully Plugged Portals . . . . . . . . . . . . . . . . . . . . . . . . . . . . . . . . . . . . . . . . . . . . . . . . 13
3-1. Schematic Diagram of Rock and Mineral Surfaces in Various Rock Types . . . . . . . . . . . . 183-2. Variation of Reaction Rates With Time as TIME . . . . . . . . . . . . . . . . . . . . . . . . . . . . 19FACTOR
3-3. Variation of Reaction Rates With Time as (10 ) . . . . . . . . . . . . . . . . . . . . . . . . . 20(FACTOR*TIME)
3-4. Variation of Reaction Rates With Time as 1/log (FACTOR*TIME) . . . . . . . . . . . . . . . . . 2010
3-5. Schematic Effect of Fracture Planes on Reactive Surface AreaPer Unit Area of Mine Wall . . . . . . . . . . . . . . . . . . . . . . . . . . . . . . . . . . . . . . . . . . . . . . . 22

MINEWALL 2.0: Literature Review and Conceptual Models iii
LIST OF FIGURES (continued)
5-1. Kinematic, Diffusion, and Residual Porosities from Fractures . . . . . . . . . . . . . . . . . . . . . . 325-2. Fracture Patterns in Closely Spaced Boreholes at the Stripa Project . . . . . . . . . . . . . . . . . . 355-3. Discrete Fracture Permeabilities at 15 m depth
at Canada's Underground Research Laboratory . . . . . . . . . . . . . . . . . . . . . . . . . . . . . . . . 365-4. Fracture Permeabilities at Colorado School of Mines' Experimental Mine . . . . . . . . . . . . . 375-5. Changes in Water Pressure within Selected Fractures at the Stripa Project, Sweden . . . . . 385-6. Predicted and Measured Head Losses During Mining
Through a Fracture Plane at the Underground Research Laboratory . . . . . . . . . . . . . . . . 395-7. Plan and Cross-section of the Solbec Pit . . . . . . . . . . . . . . . . . . . . . . . . . . . . . . . . . . . . . . . 465-8. Map of the Midnite Mine . . . . . . . . . . . . . . . . . . . . . . . . . . . . . . . . . . . . . . . . . . . . . . . . . . . 525-9. Vertical-Plane Schematic Map of a Portion of the Bunker Hill Mine . . . . . . . . . . . . . . . . . 635-10. Hydrographs of Flows in Underground Levels and Milo Creek, Bunker Hill Mine . . . . . 645-11. Temporal Trends of Sulfate in Groundwater Around D Pit . . . . . . . . . . . . . . . . . . . . . . . . 715-12. Composite Map of Upper Levels of the Lynx Underground, Myra Falls Operations . . . . 735-13. Monitoring Campaign for Flow and pH on Level 8, Myra Falls Operations . . . . . . . . . . . 745-14. Periodic Monitoring of Flow and pH at Weirs on Level 8, Myra Falls Operations . . . . . . 755-15. Non-visible Gain and Loss of Minewater Along Level 8
Mine Floor, Myra Falls Operations . . . . . . . . . . . . . . . . . . . . . . . . . . . . . . . . . . . 765-16. Monitoring of Flow and pH at Level 8 Portal, Myra Falls Operations . . . . . . . . . . . . . . . . 77

MINEWALL 2.0: Literature Review and Conceptual Models 1
1. INTRODUCTION AND OBJECTIVES
Minesites can consist of many components including the mine itself (pits and underground
workings), tailings impoundments, waste-rock dumps, ore stockpiles, plant sites, building
foundations, and roads. Any component can affect the chemistry of water flowing over, or through,
it by various geochemical processes. These processes include the leaching of metals and nonmetals
at neutral, acidic, and alkaline pH and the oxidation of sulfide minerals.
Case studies of water chemistry and geochemical processes in tailings impoundments are
generally available (e.g., Jambor and Blowes, 1994). Similar studies for mine-rock piles including
roads and foundations are less common, but still available (e.g., Morin et al., 1991). However,
geochemical investigations of pits and underground workings ("mines") are rarer.
In order to better understand and predict water chemistry in and around mines in Canada, the
Canadian Mine Environment Neutral Drainage (MEND) Program and the British Columbia Acid
Mine Drainage Task Force sponsored a project now known as MINEWALL 1.0 (Morin, 1990). That
study involved (1) a literature review, (2) a one-time geochemical assessment of the Main Zone Pit
at Equity Silver Mines (British Columbia), (3) the development of a rudimentary site-specific
computer program for predicting pit-water chemistry (MINEWALL 1.0), and (4) recommendations
for conducting pit-water assessments.
MEND and the Task Force decided to expand and refine MINEWALL, leading to
MINEWALL Version 2.0. This is one of four reports describing MINEWALL 2.0, which is both
a simple technique for predicting water chemistry in mines and a computer program to assist with
predictions for complex scenarios. MINEWALL 2.0 is based on literature reviews of relevant
theory, testwork, and past studies, some over 30 years old (summarized in Morth et al., 1972). As
a result, the technique and program were designed to be flexible and widely adaptable to many site-
specific conditions.

MINEWALL 2.0: Literature Review and Conceptual Models 2
The following sections of this report present data and observations gathered from published
and unpublished literature. As a result, many relevant physical, geochemical, and biological
principles are discussed. All of this information can be combined into generalized conceptual
models that define and summarize each important factor in the simulation of open-pit and
underground mines. To make the information easier to follow, the conceptual models are presented
first (Sections 2 and 3), followed by illustrative and supporting studies (Sections 4 and 5). In the
conceptual models, it is important to distinguish between Operation and Closure of a mine, because
the MINEWALL computer program uses specific definitions for them.
MINEWALL can estimate water chemistry continuously through the Operational and
Closure Phases of a mine. The Operational Phase encompasses the time from when a pit or
underground working approaches a relatively stagnant size or its fullest extent to the beginning of
Closure. Earlier stages of mining can be simulated by the computer program on a step-by-step basis,
rather than continuously. The Closure Phase extends from the end of Operation into the future. The
program can simulate up to 500 years of Operation (a mining company's greatest dream!) and
Closure at one time.
In addition to this Literature Review, there are three other related reports. The first is a User's
Manual for the computer program. In effect, this Literature Review describes the "why" behind the
technique and code, whereas the User's Manual is limited to the "how-to" of code operation.
However, for proper use of the computer program, the conceptual models in this document should
be well understood. This becomes even more critical for simulations of particularly unusual
minesites, at which several factors in the conceptual models must be (and can be) manipulated to fit
the sites.
The second related report is the Programmer's Notes and Source Code. That document
discusses some of the more technical aspects of MINEWALL's programming and contains a listing
of MINEWALL 2.0's roughly 24,000 lines of code. The third related report is the Application of
MINEWALL 2.0 to Three Minesites, which illustrates ways with which to simulate various

MINEWALL 2.0: Literature Review and Conceptual Models 3
conditions at a minesite.

MINEWALL 2.0: Literature Review and Conceptual Models 4
2. PHYSICAL CONCEPTUAL MODELS
2.1 Open-Pit Mines
Based on the review of pertinent literature and applicable hydrogeologic principles, a
conceptual model of surface-water and groundwater movement in and around an operating open pit
can be defined (Figure 2-1). This model includes precipitation with subsequent evaporation. Also,
any surface flow consists of runoff over the pit walls and benches, which is augmented by any seeps
discharging from the pit walls. The seeps, in fact, represent an interaction of groundwater (discussed
below) and runoff, and from a chemical perspective can be indicative of geochemical processes
operating behind the walls (Section 3).
Any precipitation infiltrating into the ground becomes unsaturated groundwater flow. Some
percentage of this unsaturated flow will eventually discharge from pit walls as seeps and thus be
accounted for as runoff. The remainder can be expected to eventually reach the water table and join
the regional saturated flow system which extends to the pit.
In addition to the aforementioned "inputs" of water, the important "outputs" during Operation
(see Section 1 for definition) are usually (1) active pumping of water (or gravity drainage for pits not
completely surrounded by walls in sloping terrain) and (2) evaporation. Without these factors, a
typical pit would begin to fill with water.
As with any conceptual model, there is a myriad of variations. For example, Figure 2-1
shows the water table joining the pit near its base whereas Lopaschuk (1979) reported a drawdown
of only 10 meters in a 90-150 meter deep pit (Section 5.1). This is easily handled by the
MINEWALL 2.0 computer program, because it requires only the input of groundwater inflow, not
the location of the water table. Additionally, Kipp et al. (1983) investigated pits located above the
water table so that no groundwater flow from the saturated zone reported to them, but pit water was
lost to the underlying unsaturated zone. MINEWALL 2.0 can easily handle this situation by using

MINEWALL 2.0: Literature Review and Conceptual Models 5
zero values for saturated groundwater flow and negative values

PIT BOTTOM
PITSUMP(S)
SATURATED GROUNDWATERFLOW TO PIT
PRECIPITATION
EVAPORATION
UNSATURATED FLOWTO THE WATER TABLE WATER PUMPED
FROM PITSUMP(S)
EVAPORATION
RUNOFF AND SURFACE WATER
SEEP
WATER TABLE
CONCEPTUAL MODEL OF AN OPEN-PIT MINE:OPERATIONAL PHASE
ORIGINAL LAND SURFACE
FIGURE 2-1. Conceptual MINEWALL Model of Water Movement In and Near Pit Walls During Operation.

MINEWALL 2.0: Literature Review and Conceptual Models 7
(water lost from the pit) for unsaturated flow, or vice versa. Other flows can even be "re-assigned":
pit pumping during a simulation, for example, can be used to account for evaporation of ponded
water while evaporation accounts only for water on exposed rock. The MINEWALL 2.0 program
has been coded in a flexible manner so that virtually any combination of site-specific factors can be
handled and simulated.
Upon cessation of mining and initiation of decommissioning (Closure - see definition in
Section 1), pit pumps may be turned off or gravity drainage may be halted. This causes the water
level in the pit to rise out of the sump(s), cover the pit bottom, and progressively submerge the pit
walls. As an example, Davis and Ashenberg (1989) reported that the water level in the large
Berkeley Pit in Montana was rising 22 meters a year and that total water storage was expected to
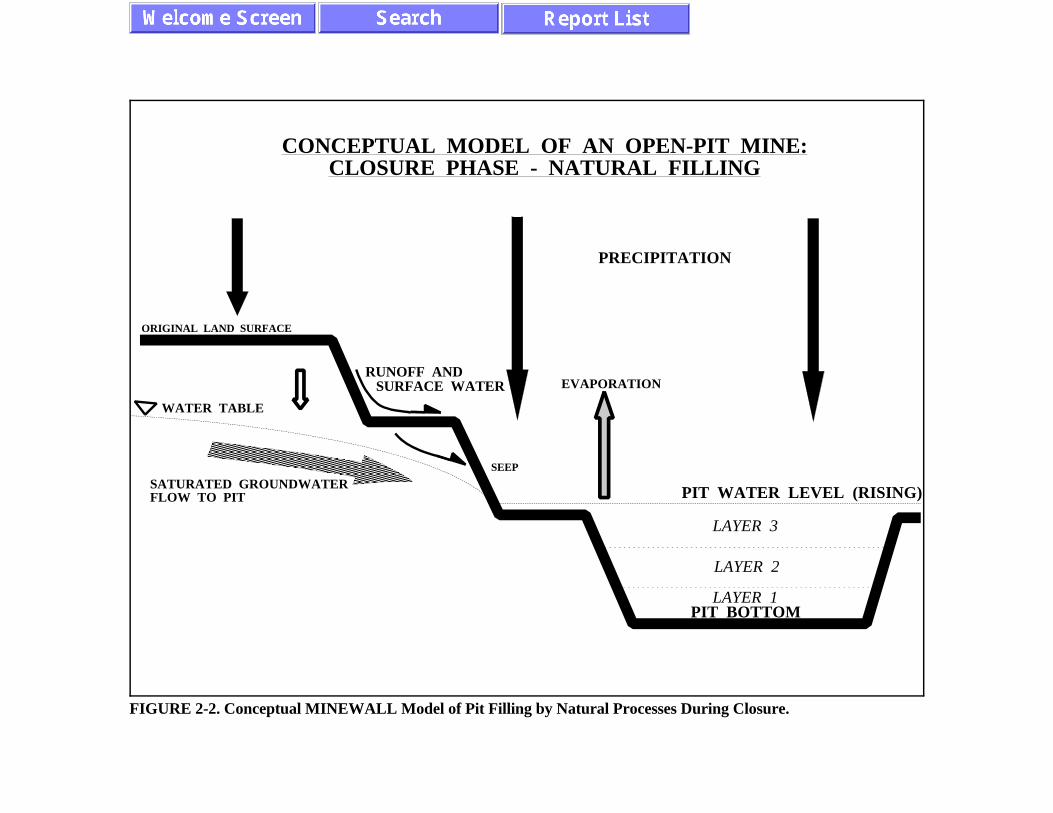
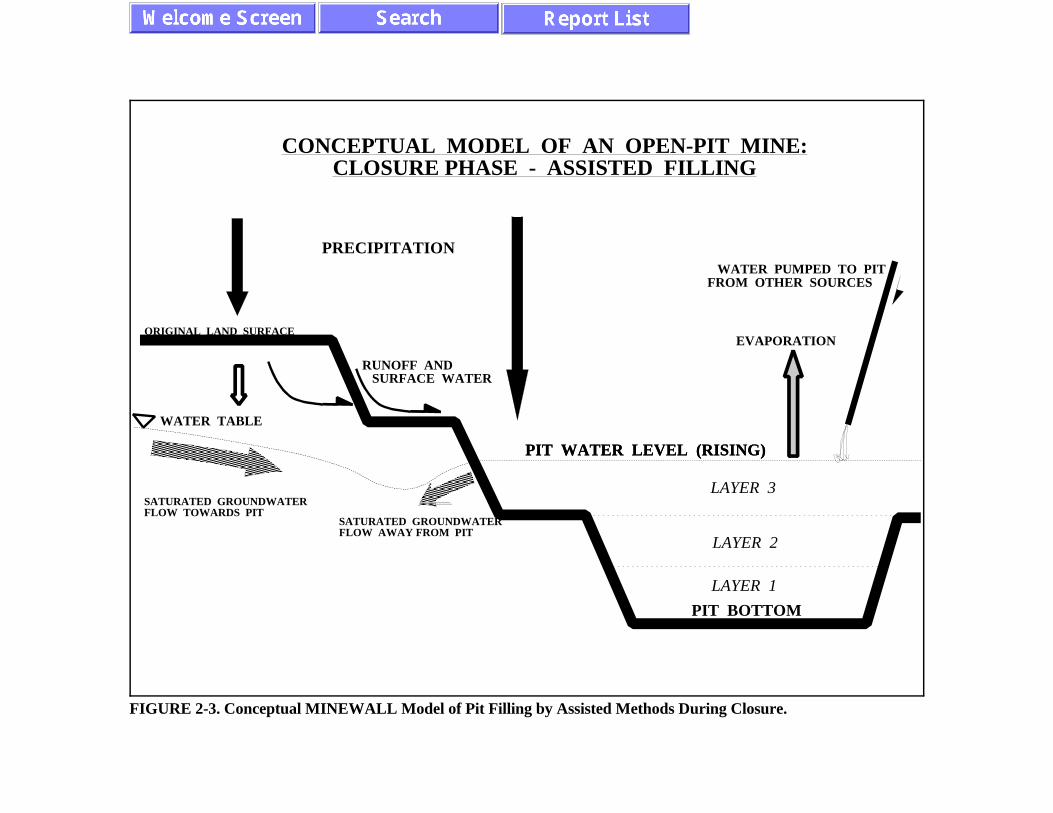
reach 5x10 m of acidic water. Such filling of a pit can be accomplished through natural processes8 3
(Figure 2-2) or enhanced by pumping of water into the pit (Figure 2-3). The "assisted" pumping of
Figure 2-3 may reflect the intent to quickly submerge the pit and any tailings/rock in it for water-
quality control or may reflect the intent for long-term storage of acidic or metal-laden water until
treatment can begin.
The primary difference between natural and assisted filling during Closure lies in the local
direction of groundwater movement near the pit. Because the quality of water contacting the wall
rock could be degraded, the direction of local groundwater movement would thus determine whether
this affected water would directly enter the pit or be temporarily carried away from the pit to a
temporary stagnant zone in the groundwater system (Figures 2-2 and 2-3). This temporary zone is
not explicitly considered by MINEWALL 2.0.
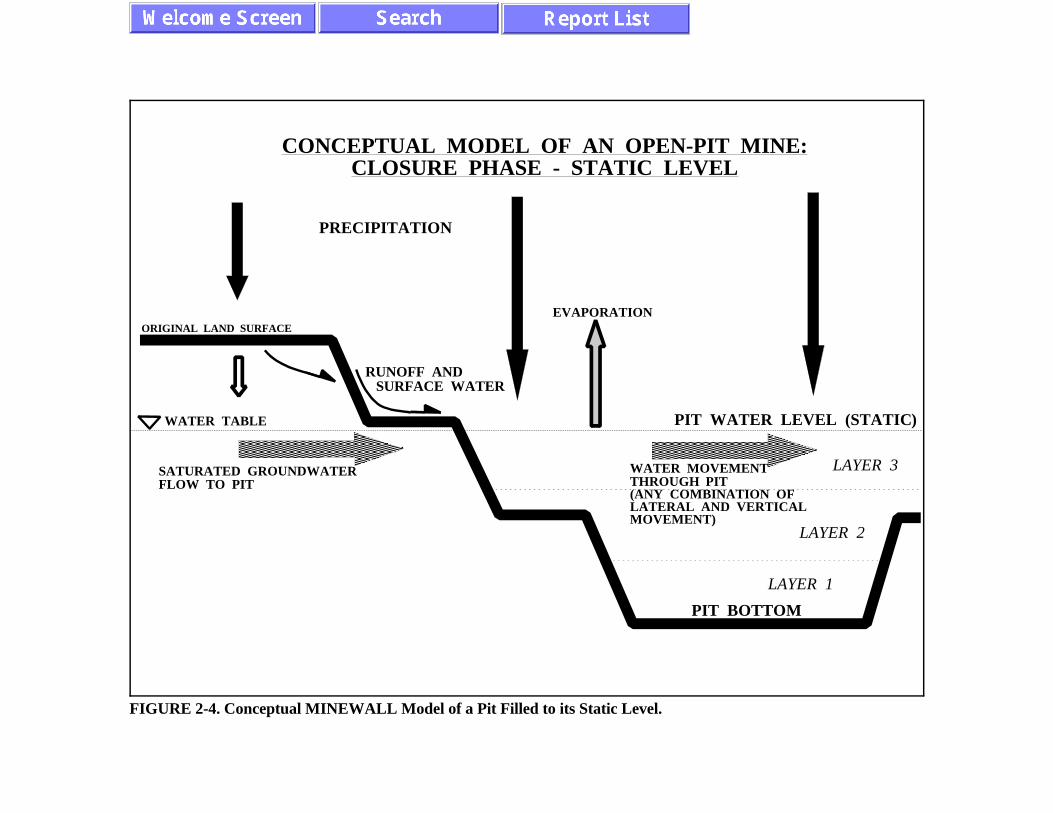
As the input of water continues, the water level rises until a "static" level is attained (Figure
2-4). At that point, the rate of water entering the pit is generally balanced with water leaving the pit,
and the water level remains relatively steady from year to year. However, "static" level is only meant
in a general sense and some season-to-season and year-to-year variations can be expected. As with
the Operational phase (Figure 2-1), there is likely a myriad
PIT BOTTOM
SATURATED GROUNDWATERFLOW TO PIT
PRECIPITATION
EVAPORATIONRUNOFF AND SURFACE WATER
SEEP
WATER TABLE
CONCEPTUAL MODEL OF AN OPEN-PIT MINE:CLOSURE PHASE - NATURAL FILLING
PIT WATER LEVEL (RISING)
ORIGINAL LAND SURFACE
LAYER 2
LAYER 3
LAYER 1
FIGURE 2-2. Conceptual MINEWALL Model of Pit Filling by Natural Processes During Closure.
PIT BOTTOM
SATURATED GROUNDWATERFLOW TOWARDS PIT
PRECIPITATION
EVAPORATION
PIT WATER LEVEL (RISING)
RUNOFF AND SURFACE WATER
WATER TABLE
CONCEPTUAL MODEL OF AN OPEN-PIT MINE:CLOSURE PHASE - ASSISTED FILLING
ORIGINAL LAND SURFACE
SATURATED GROUNDWATERFLOW AWAY FROM PIT
PIT WATER LEVEL (RISING)
WATER PUMPED TO PITFROM OTHER SOURCES
LAYER 2
LAYER 3
LAYER 1
FIGURE 2-3. Conceptual MINEWALL Model of Pit Filling by Assisted Methods During Closure.
PIT BOTTOM
SATURATED GROUNDWATERFLOW TO PIT
PRECIPITATION
EVAPORATION
RUNOFF AND SURFACE WATER
WATER TABLE
CONCEPTUAL MODEL OF AN OPEN-PIT MINE:CLOSURE PHASE - STATIC LEVEL
PIT WATER LEVEL (STATIC)
ORIGINAL LAND SURFACE
WATER MOVEMENTTHROUGH PIT(ANY COMBINATION OFLATERAL AND VERTICALMOVEMENT)
LAYER 1
LAYER 2
LAYER 3
FIGURE 2-4. Conceptual MINEWALL Model of a Pit Filled to its Static Level.

MINEWALL 2.0: Literature Review and Conceptual Models 11
of variations. For example, if pit-water chemistry is unacceptable for discharge, ongoing pumping
may be required to create an artificial static water level below the equilibrium static level so that no
pit water is lost to the groundwater system. The coding of the MINEWALL 2.0 program provides
sufficient flexibility to handle this scenario and virtually all site-specific combinations of factors for
Closure.
Although pit water can be thought of as one physical mass, the water can actually consist of
several layers, divided on the basis of chemical and/or thermal characteristics. The circulation of
water is sometimes limited to each layer or water may circulate freely among the layers. In fact, if
the pit water experiences physical "turnover" due to thermal instability, some or all layers may
occasionally mix together and thus be temporarily indistinguishable. This is discussed further in
Section 3.
For the MINEWALL computer program, the flows associated with all arrows of Figures 2-1
through 2-4 must be known or estimated for proper calculations and simulations. However, due to
mass-balance relationships (Section 3.1), the flow associated with one arrow can be estimated if all
other flows are known. In this situation, the MINEWALL 2.0 program can "fill in the blanks" for
a missing flow as explained in the User's Manual.
2.2 Underground Mines
The physical conceptual models of water movement through underground mines are both
simpler and more complex than those for open-pit mines (Section 2.1). They are simpler because
underground mines are not usually subjected to highly variable inputs of water, such as caused by
precipitation and snowmelt. This is not to say all underground mines have steady flows. For
example, mines with vertical openings to the surface or in highly fractured, shallow rock can have
significant variations (Section 5). In any case, MINEWALL 2.0 can handle both steady and variable
flows.

MINEWALL 2.0: Literature Review and Conceptual Models 12
On the other hand, the conceptual models are more complex than those for open-pit mines
because underground workings can be oriented in three dimensions with many hydraulic connections
between drifts and levels (Section 5). In some cases, each level can act as an independent system.
The MINEWALL 2.0 program handles this complexity by requiring the user to carefully design input
values in light of the mine's three dimensional complexity. For example, if an underground level is
free-draining through a portal and loses some water down a vertical pass, then this level can be
simulated separately from the remainder of the mine. MINEWALL will then estimate the chemistry
of water flowing through the portal and the pass. The underlying level of the mine can then be
simulated by using the flow and chemistry from the vertical pass as an input ("pumping") factor. On
the other hand, for levels that are all connected and drain to one shaft, then these levels and the shaft
can be combined in one MINEWALL simulation.
Based on the preceding information, the physical conceptual models of water movement in
underground mines can now be presented. The two basic types, or end points, of underground mines
from the perspective of water movement are (1) those that have portals through which minewater
can drain by gravity ("gravity-drained mines") and (2) those containing one or more vertical shafts
to which lateral levels are connected and to which water drains for pumping to the surface ("pumped
mines"; Figures 2-5 to 2-7). As with many physical and chemical factors, there is a myriad of
variations between these endpoints.
During Operation (see Section 1 for definition), the source of water entering gravity-drained
and pumped mines is primarily through the surrounding groundwater system (Figure 2-5). In some
cases, the local water table or piezometric surface may remain high and thus saturated groundwater
flow is the primary contributor. In other cases, the water table or piezometric surface may lie below,
or eventually fall below, the mine and thus unsaturated flow will provide most of the inflow. Other
potential sources of water include (1) surface water from access/ventilation/glory holes excavated
near or to the land surface, (2) long drillholes extending to either the surface, the saturated
groundwater zone, or isolated and pressurized fault/fracture systems, and (4) drainage from any
backfilled material (Brealey, 1965; Emrich and Merritt,

SATURATED GROUNDWATERFLOW TO DRIFT
WATER PUMPEDFROM SHAFT
SUMP(S)
EVAPOTRANSPIRATION
RUNOFF AND SURFACE WATER
SEEP
WATER TABLE
UNSATURATED FLOWTO THE WATER TABLE
PRECIPITATION
LAND SURFACE
DRIFT
DRIFT
DRIFT
DRIFT
DRIFT
CONCEPTUAL MODELSOF UNDERGROUND MINES:
OPERATIONAL PHASE
FIGURE 2-5. Conceptual Models for Underground Mines Free Draining to Surface or A Shaft.

SATURATED GROUNDWATERFLOW
EVAPOTRANSPIRATION
RUNOFF AND SURFACE WATER
SEEP
WATERTABLE
UNSATURATED FLOWTO THE WATER TABLE
PRECIPITATION
LAND SURFACE
DRIFT
DRIFT
DRIFT
DRIFT
DRIFT
CONCEPTUAL MODELSOF UNDERGROUND MINES:
CLOSURE PHASE - UNPLUGGED STATIC LEVEL
FIGURE 2-6. Conceptual Models for Underground Mines During Closure with No Portal Plugging.

SATURATED GROUNDWATERFLOW
EVAPOTRANSPIRATION
RUNOFF AND SURFACE WATER
SEEP
WATERTABLE
UNSATURATED FLOWTO THE WATER TABLE
PRECIPITATION
LAND SURFACE
DRIFT
DRIFT
DRIFT
DRIFT
DRIFT
CONCEPTUAL MODELSOF UNDERGROUND MINES:
CLOSURE PHASE - PLUGGED STATIC LEVEL
PLUG
PLUG
SATURATEDFLOW
FIGURE 2-7. Conceptual Models for Underground Mines During Closure with Fully Plugged Portals.

MINEWALL 2.0: Literature Review and Conceptual Models 16
1969; Williams et al., 1979; Trexler, 1979).
In many cases, the aforementioned classic concept of distinct and vertically stratified
unsaturated and saturated groundwater zones may not apply, especially in rock masses where
groundwater primarily flows through fractures (e.g., studies compiled in Hutt and Morin, 1994). In
these cases, fractures not connected, or poorly connected, to the main fracture system may, for
example, remain "saturated" even after the local water table has fallen due to mining. If mining
activity eventually intercepts such a fracture, the groundwater will quickly drain, appearing as
saturated flow, and little if any water will follow as "unsaturated" flow. Because of these and other
complexities, the differentiation of flow into distinct categories like saturated and unsaturated flow
may not be possible, and are not important for a MINEWALL simulation. All potential sources of
flow can, in fact, be grouped into one category of flow for convenience. Potential sources can be
unplugged drillholes, ventilation shafts, a pass from a higher level, and draining backfill. Similarly,
all potential losses of water can be simulated as one category if desired. Potential sinks can be a pass
extending to a deeper level and general loss of water into fractures on the mine floor which may then
contribute to chemical loadings on a deeper level.
During Closure (see Section 1 for definition), pumped mines will partially or fully fill with
groundwater through time (Figures 2-6 and 2-7), generally reflecting the pre-mining groundwater
level modified by any surficial changes in infiltration and runoff. Gravity-drained mines will not fill
unless naturally or artificially plugged. Although portal plugging has been reported to be generally
successful at limiting flow from the mine and raising the internal water level, there has reportedly
been less success from the chemical perspective. This is apparently because (1) the physical
limitation of water movement does not necessarily correlate with limitation of reaction rates and (2)
flooding of an underground mine can cause massive removal of accumulated soluble metals and
nonmetals (Section 3).
MINEWALL 2.0: Literature Review and Conceptual Models 17
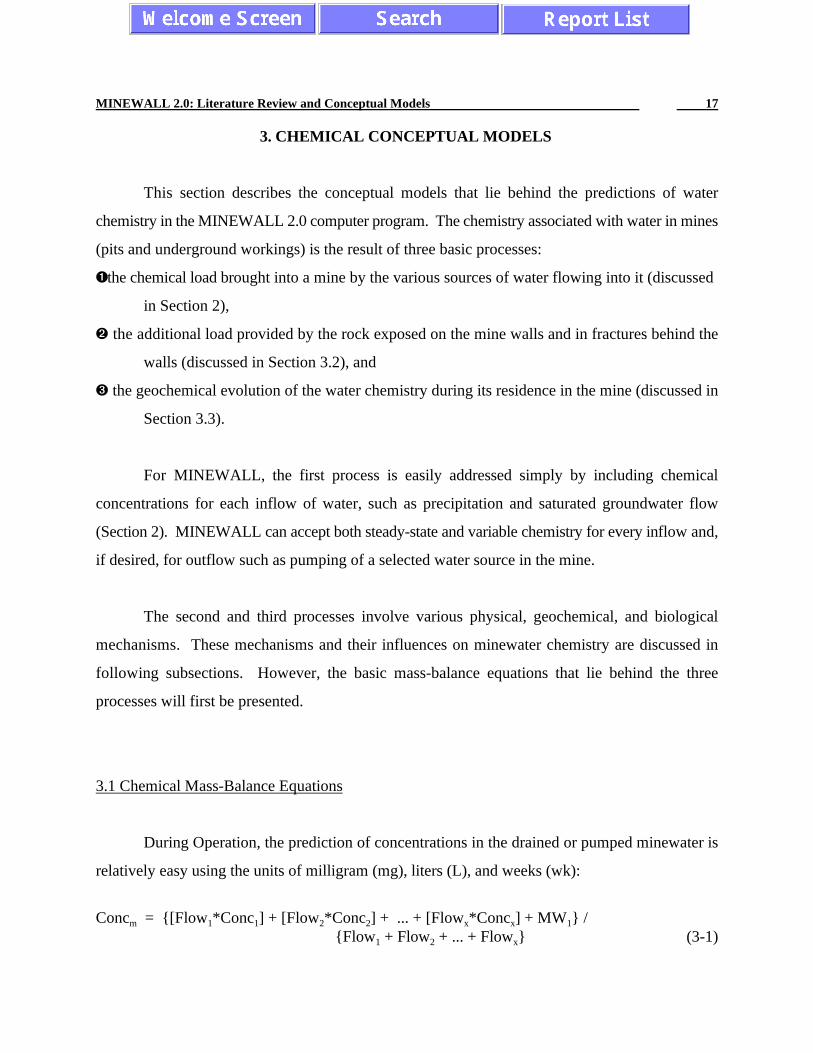
3. CHEMICAL CONCEPTUAL MODELS
This section describes the conceptual models that lie behind the predictions of water
chemistry in the MINEWALL 2.0 computer program. The chemistry associated with water in mines
(pits and underground workings) is the result of three basic processes:
the chemical load brought into a mine by the various sources of water flowing into it (discussed
in Section 2),
the additional load provided by the rock exposed on the mine walls and in fractures behind the
walls (discussed in Section 3.2), and
the geochemical evolution of the water chemistry during its residence in the mine (discussed in
Section 3.3).
For MINEWALL, the first process is easily addressed simply by including chemical
concentrations for each inflow of water, such as precipitation and saturated groundwater flow
(Section 2). MINEWALL can accept both steady-state and variable chemistry for every inflow and,
if desired, for outflow such as pumping of a selected water source in the mine.
The second and third processes involve various physical, geochemical, and biological
mechanisms. These mechanisms and their influences on minewater chemistry are discussed in
following subsections. However, the basic mass-balance equations that lie behind the three
processes will first be presented.
3.1 Chemical Mass-Balance Equations
During Operation, the prediction of concentrations in the drained or pumped minewater is
relatively easy using the units of milligram (mg), liters (L), and weeks (wk):
Conc = {[Flow *Conc ] + [Flow *Conc ] + ... + [Flow *Conc ] + MW } /m 1 1 2 2 x x 1
{Flow + Flow + ... + Flow } (3-1)1 2 x

MINEWALL 2.0: Literature Review and Conceptual Models 18
where Conc = concentration in pumped/drained mine water (mg/L);m
Flow = positive (inflow) or negative (outflow) flowrate suchx
as precipitation or groundwater (L/wk);Conc = concentration associated with Flow (mg/L); andx x
MW = loading (mg/wk) from occasional flushing of mine walls (Section 3.2).1
A negative value for Conc in Equation 3-1 indicates there is a net loss of water from the mine.m
During Closure, the prediction of concentrations in the water filling the mine is more difficult
due to the accumulation of mine water, additional contributions from the mine walls, and the
potential for flow reversals. With units of mg, L, and time steps of one week, the general equation
for predicting the concentrations in minewater during Closure is:
Conc = {[Conc *Evol *Volume ] + [Flow *Conc ] + [Flow *Conc ] + ... +m,t m,t-1 m,t-1 m,t-1 1 1 2 2
+ [Flow *Conc ] + MW + MW + MW } / Volume (3-2)x x 1 2 3 m,t
and Volume = Volume + Flow + Flow + ... + Flow (3-3)m,t m,t-1 1 2 2
where Conc = Closure concentration (mg/L) in ponded minewater at current week, tm,t
Conc = Closure concentration (mg/L) in ponded minewater at previous week, t-1m,t-1
Evol = factor representing evolution of minewater chemistry betweenm,t-1
times t-1 and t (see Section 3.3)Volume = volume of ponded mine water at current week (L)m,t
Volume = volume of ponded mine water from previous week (L)m,t-1
MW = loading (mg/wk) from occasional flushing of mine walls (Section 3.2)1
MW = loading (mg/wk) from major flushing of recently submerged2
mine walls (Section 3.2)MW = loading (mg/wk) from previously submerged mine walls (Section 3.2).3
All Flow and Conc in Equations 3-1 to 3-3 must be known for predictions of minewaterx x
chemistry. Most of this required information on flows and concentrations, such as for precipitation
and groundwater, often comes from routine monitoring of proposed, operating, and closed mines.
Also, concentrations in precipitation and evaporation are often negligible and can thus be ignored.
Furthermore, concentrations in runoff and unsaturated flow can be set to zero and their contributions
can be more easily estimated as part of MW . As a result, the most critical Conc is often forx x
groundwater flow, which can come from monitor wells at the minesite. Therefore, most of the data

MINEWALL 2.0: Literature Review and Conceptual Models 19
requirements for MINEWALL, except the MW factors (Section 3.2) and Evol (Section 3.3), canx m,t-1
be relatively easily obtained or estimated. Because Operating mines often monitor flow and
chemistry (Conc ) in mine drainage/pumpage, Equation 3-1 can sometimes be solved in reverse tom
obtain an unknown Conc or Flow .x x
Again, the primary unknown factors in Equations 3-1 to 3-3 are often the MW factors, whichx
reflect loadings from the rock surfaces on and behind the mine walls. These loadings are considered
to be release rates into the minewater, such as 300 mg Ca/week. These rates are determined by three
factors which are discussed in Section 3.2: (1) unit-surface-area production rates, (2) total reactive
rock-surface area in a mine, and (3) reaction-product retention and flushing. In other words, for one
week of time:
Release rate (MW , mg/wk) = {[Production rate (mg/m surface/wk)*Total rock surface (m )]x2 2
+ [Previously retained products (mg)]} * {%Flushed from surface/100%} (3-4)
3.2 Effect of Mine Walls on Water Chemistry
Since mine walls are composed of rock, they may contain minerals capable of releasing
metals and nonmetals to water passing over their surfaces. Geochemical processes such as metal
leaching and acid generation can occur on the surfaces, or outer boundaries, of rock particles and
fracture planes, as well as within grains or blocks of rock. Consequently, there are two localities
where the geochemical reactions take place: surficial and internal relative to the smallest divisible
particle or block at a site (Figure 3-1). The overall effects of surficial reactions are generally a
function of exposed surface area relative to the water volume, whereas the effects of internal
reactions are functions of exposed surface area, distance to the center of a grain, and the volume of
the grain relative to the water volume. Perhaps due to practicality and simplicity, surficial reactions
seem to be more often addressed in field-oriented studies (e.g., Morth et al., 1972), while internal
reactions appear more often in theory-oriented studies (e.g., Cathles, 1982).
In "soft-rock" mines such as bituminous coal, the rock is typically composed of indurated

SOLID BLOCK OF ROCK:
TYPICAL OF METAMORPHIC ANDIGNEOUS ROCK
INDURATED MINERAL GRAINS:
TYPICAL OF SEDIMENTARYROCK
SURFICIAL ACID GENERATIONAND METAL LEACHING
INTERNAL ACID GENERATIONAND METAL LEACHING
on surfacefaces of block
on eachgrain surface
within each grain
withinthe block
MINEWALL 2.0: Literature Review and Conceptual Models 20
FIGURE 3-1. Schematic Diagram of Rock and Mineral Surfaces in Various Rock Types.
mineral grains which can have elevated grain-surface areas per unit weight or rock (Figure 3-1). In
"hard-rock" mines such as silicified epithermal copper, the fracture surfaces along which the rock
has broken into blocks will provide the exposed area for minerals. This area will often be less per
unit weight than for soft rock. Therefore, soft-rock mines may have a greater impact on their water
chemistry per unit volume of material. However, there are other factors that can affect this ranking
as discussed below.
For the MINEWALL studies to date, only hard-rock mines have been examined and these
mines typically have relatively large blocks of rock separated by fractures. Consequently, the current
work focusses on surficial, rather than internal, reactions. These surficial reactions can be addressed
simply by isolating and monitoring portions of rock surfaces such as with MINEWALL Stations

DAYS SINCE EXPOSURE
RATE = DAYS
RATE = DAYS
RATE = DAYS
RATE = DAYS
RATE = DAYS
+0.01
0.00
-0.01
-0.10-0.10
-0.50
MINEWALL 2.0: Literature Review and Conceptual Models 21
FIGURE 3-2. Variation of Reaction Rates With Time as TIME .FACTOR
(Section 4).
A primary objective of MINEWALL monitoring and testwork (Section 4) is to obtain unit-
area reaction rates (Equation 3-4), such as 1.5 mg Cu/m of rock surface/wk (1.5 mg Cu m wk ).2 -2 -1
A second objective is to describe the manner in which the reactions rates change with time.
Literature on acidic drainage contains many reports on theoretical and empirical trends of rates
through time (e.g., Ferguson and Morin, 1991, contains a summary). On the basis of elapsed time
(e.g., DAYS), the variation in normalized rates (rate at DAY 0 = 1.0) can often be described through
equations of the form: DAYS , 10 , and 1/log (FACTOR*DAYS). Examples usingFACTOR (FACTORS*DAYS)10
various values for FACTOR are portrayed in Figures 3-2 to 3-4.

DAYS SINCE EXPOSURE
10
10
10
(-0.001 * DAYS)
(+0.001 * DAYS)
(0.000 * DAYS)
DAYS SINCE EXPOSURE
1/LOG10(50.0 * DAYS)
1/LOG10(0.5 * DAYS)
1/LOG10(1.0 * DAYS)
1/LOG10(2.0 * DAYS)
MINEWALL 2.0: Literature Review and Conceptual Models 22
FIGURE 3-3. Variation of Reaction Rate with Time as (10 ).(FACTOR * TIME)
FIGURE 3-4. Variation of Reaction Rate with Time as 1/log (FACTOR *10
TIME)

MINEWALL 2.0: Literature Review and Conceptual Models 23
After geochemical reaction rates are obtained for unit surface areas, the next major issue in
MINEWALL becomes the amount of rock surface that is reactive (Equation 3-4). A first impression
might be that the total reactive surface is equal to the exposed walls of a mine. However, the
fractures that are invariably present in mine walls naturally and induced by blasting and excavation
(Evans, 1987; Pusch, 1989; Toran and Bradbury, 1988) provide additional reactive surfaces. Morth
et al. (1972), for example, found reactive fracture surfaces that extended as far as 15 meters from
mine walls. Also, visual observations at Island Copper Mine in British Columbia (Section 4.3)
during a pushback of a pit wall revealed fractures oxidized as far back as 10 meters from the wall.
Consequently, the fracture surfaces behind the mine walls can provide a much greater reactive
surface than that indicated simply by the exposed walls. As a numerical example, a pit wall that has
(1) spacings for vertical and horizontal fractures of 1 meter and (2) oxidation occurring to 10 meters
behind the wall will have 41 m of reactive surface for each m of exposed wall (41:1; Figure 3-5).2 2
For the MINEWALL field studies (Section 4), the average estimated ratio varied from 27:1 to 161:1.
Any waste rock, ore rock, tailings, or backfill placed in the mine can add to this reactive surface area
and is handled in the MINEWALL program by labelling it as one or more additional "rock units".
For rock with on-going sulfide oxidation, acid generation, and metal leaching (Figures 3-2
to 3-4), the products of these reactions usually remain in a relatively soluble form on the rock
surfaces. These products will only be removed from the surfaces if water contacts and dissolves
them. This leads to the third and last factor in Equation 3-4 for estimating MW (Equations 3-1 andx
3-2).
For ease of calculations, MINEWALL assumes that during Operation of an open-pit mine
(Figure 2-1) certain percentages of the total reactive rock surfaces are flushed (1) regularly by
precipitation, condensation, etc., (2) periodically such as during snowmelt or a high-precipitation
month, and (3) not at all during Operation. During Closure (Figures 2-2 and 2-3), the latter, third
category can have a significant effect on water chemistry as pit-water levels rise and flush reaction
products accumulated over decades from flooded surfaces. Nevertheless, the first two categories
continue to play a role in pit-water chemistry if any pit walls remain exposed to air.

1 METER
10 m2
10 m2
1 m2
10 m2
10 m2
EXAMPLE OF THE EFFECT OF FRACTURE PLANESON REACTIVE SURFACE AREAS
PER UNIT AREA OF MINE WALL
2 METERS BY2 METERS OFPIT WALL
CONCLUSION: 1 m2 OF PIT WALLREPRESENTS 41 m2 OF REACTIVE SURFACE
FIGURE 3-5. Schematic Effect of Fracture Planes on Reactive Surface Area Per Unit Area of Mine Wall.

MINEWALL 2.0: Literature Review and Conceptual Models 25
For underground mines, the removal of reaction products is simulated the same as for pits.
To reconcile this approach with that of Morth et al. (1972), their terminology will be discussed in
light of MINEWALL's terminology. Morth et al. defined three types of reaction-product removal,
involving diffuse leaching, trickle leaching, and inundation leaching. These three processes are
direct parallels to the flushing of rock surfaces regularly, periodically, and not at all during
Operation. Diffuse leaching is synonymous with the "condensation leaching" defined by Morth et
al., but condensation is not necessarily the only cause for a slow, non-point-source leaching of
reaction products into minewater. Trickle leaching is a point-source removal of reaction products,
such as at a borehole or fracture through which a stream of water flows into the mine. Inundation
leaching implies full saturation and submergence of fractures, a portion of the mine, or even the
entire mine. Inundation leaching in an underground mine on a large scale is usually prevented during
Operation through active water control such as pumping, grouting, and bulkheads. However, during
Closure, inundation leaching will often prevail in a pumped mine (Section 2.2) when pumping
ceases. Such leaching may occur in a gravity-drained mine only when a plug is installed or wall
collapse creates a natural plug.
3.3 Geochemical Evolution of Water Chemistry Within a Mine
Once the chemical loadings from the inflows and mine walls have been added to the water,
the water chemistry may begin to evolve due to various physical, chemical, and biologic mechanisms
(greatly simplified as Evol in Equation 3-2). During Operation, this evolution is not consideredm,t-1
by the MINEWALL program, because the residence time in the mine is relatively short before it is
pumped or drained. However, the accumulation of water in an open-pit or underground mine during
Closure can provide sufficient residence time for geochemical evolution to become important. For
example, mineral precipitation/dissolution, controlled by equilibrium or kinetic processes, can
change concentrations in ponded water. Also, redox reactions can change concentrations of some
aqueous species through transformation to other ions. Sulfate-reducing bacteria, for example, can
reduce sulfur from sulfate (SO ) to sulfide (S ). MINEWALL 2.0 does not attempt to distinguish42- 2-

MINEWALL 2.0: Literature Review and Conceptual Models 26
among all the possible reactions and transformations, but provides an empirical approach for
simulating their time dependent effects.
In addition to reactions that can affect water chemistry throughout an entire water column,
there are also physical and chemical mechanisms that lead to chemical differences along a water
column (e.g., Figures 2-2 to 2-4). It is not the purpose of this document to be a primer on limnology,
but flooded pits and underground mines, as parallels to lakes, can become complex physically and
chemically in three dimensions. This complexity is often reduced to two dimensions in a vertical
plane in which horizontal masses of water are separated by near-horizontal contact zones (Wetzel,
1983). For example, "thermoclines" separate water layers with different temperature and
"chemoclines" separate those with different chemistries. Due to unstable thermal stratification that
can arise over an annual period, some or all of the water layers mix vertically ("turnover") and the
thermocline and chemoclines essentially disappear (Stevens et al., 1994). MINEWALL 2.0 does not
simulate stratification due to memory limitations, but its modular code is designed to allow the
addition of stratification at a later time.
When one or more of the deeper layers do not participate in turnover at any time, the
minewater is termed "meromictic". The concept of a meromictic pit with sulfate-reducing bacteria
(SRB) in the deepest, unmixed "monolimnion" has become a target of research in Canada (e.g.,
Horne, 1993). The objective of this research is to determine if fresh minewater can be fed to the
monolimnion without destabilizing it, allowing the sulfide generated by bacteria to precipitate metals
from the minewater.

MINEWALL 2.0: Literature Review and Conceptual Models 27
4. MINEWALL-BASED STUDIES
As part of MINEWALL 2.0 development, field studies were conducted at Noranda Mineral's
Bell Mine and BHP Canada's Island Copper Mine, two open-pit mines in British Columbia. Also,
the Main Zone Pit at Equity Silver Mines in British Columbia was characterized as part of
MINEWALL 1.0 studies (Morin, 1990). These three mines form the MINEWALL field database
at this time and are discussed in greater detail in the related document, Application of MINEWALL
2.0 to Three Minesites.
4.1 Equity Silver Mines
Equity Silver Mines, now closed, is located in central British Columbia and consisted of
several open pits, waste-rock dumps, and a tailings impoundment (Equity Silver Mines, 1989;
Patterson, 1990). The Main Zone Pit was the target of MINEWALL 1.0 studies (Morin, 1990).
At Equity Silver's Main Zone Pit, four MINEWALL Stations were established with an
additional Station located in the adjacent Southern Tail Pit in order to define unit-area reaction rates.
These stations were rinsed only once, so variations of reaction rates through time remain unknown.
Based on the single rinse event, unit-area reaction rates were calculated (Table 4-1) from chemical
analysis and volume of the rinse water, isolated area of each station, and the elapsed time since last
rinse (rainfall). Values of other relevant parameters were based on measured data or estimated from
related data (Morin, 1990) and some values are reproduced in Table 4-2 to illustrate the data required
for a MINEWALL simulation. This case study is discussed further in the companion MINEWALL
2.0 report, Application of MINEWALL 2.0 to Three Minesites, but some notable aspects of it are
discussed below.
The major parameter that could not be estimated or measured was the percentages of rock
surfaces that were flushed regularly, occasionally, or not during Operation (Section 3).

MINEWALL 2.0: Literature Review and Conceptual Models 28
Consequently, these percentages were obtained by calibrating MINEWALL 1.0 to Operational

MINEWALL 2.0: Literature Review and Conceptual Models 29
TABLE 4-1Unit-Area Production Rates
from the MINEWALL Stations at Equity Silver Mines 1
(rates in mg/m /wk)2
Parameter Nos. 1,4,5 Station Station4---------- Station ---------- Average of
No. 3 No. 22 3No. 1 No. 4 No. 5
Sulfate 49.9 48.3 133 77.1 539 204
Acidity 54.1 15.9 16.7 28.9 3.63 10.2
Alkalinity 26.4 6.99 73.3 35.6 24.0 8.82
Nitrate 0.330 0.111 0.833 0.425 3.18 0.801
Field pH 4.9 5.0 6.0 5.3 6.1 5.2
Aluminum 0.132 0.0731 0.0722 0.0924 0.0291 0.01315
Antimony 0.0144 0.0264 0.0122 0.0177 0.0109 0.0005
Arsenic 0.00180 0.000318 0.00111 0.00108 0.000182 0.000219
Cadmium 0.00421 0.0226 0.00611 0.0110 0.0327 0.000947
Copper 0.0601 2.35 0.0333 0.814 0.0327 0.00874
Iron 0.360 0.0953 <0.167 0.180 0.0272 0.02195
Zinc 0.721 3.88 0.777 1.79 2.80 1.50
based on data in Morin (1990); estimated time from last rinse (by precipitation) = 8 days1
the rates for Station 3 are based on the 8-day accumulation, but actual time from last2
flush is probably much greater
Station No. 2 is located in the Southern Tail Pit, now filled with waste rock3
Metal rates are for dissolved metals in units of mg/m /wk4 2
Reported rates are not significantly different from the Blank sample and thus actual rates5
are probably less than the reported values

TABLE 4-2Partial Input Data for the Simulation of the Main Zone Pit at Equity Silver Mines (Morin, 1990)
PARAMETER ROCK UNIT #1 ROCK UNIT #2 ROCK UNIT #3
Rock Type Gabbro Volcanics Volcanics
NNP from Acid-Base Accounting (t CaCO /1000 t) NNP > 0.0 -40 < NNP < 0.0 NNP < -403
Orientation on Pit Wall Vertical Vertical Vertical
Exposed Surface Area (m ) 315,000 234,000 214,0002
Sloping Walls - Percentage of Total Area 35% 35% 35%
Sloping Walls - Angle from Horizontal (degrees) 70 70 70
Exposed Acid-Generating Sulfur (g S/m ) 48 64 1442
Exposed Neutralization Potential (g CaCO /m ) 225 100 2532
Reactive Surface (m ) for Each m of Pit Wall 21 41 412 2
Fracture Flushed : - percentage flushed monthly 28% 28% 28%*
- percentage flushed once a year 2% 2% 2%
- percentage not flushed during Operation 70% 70% 70%
These best-fit values were obtained from calibration: see text.*

MINEWALL 2.0: Literature Review and Conceptual Models 31
conditions and adjusting the percentages until approximate matches to Operation water chemistry
were obtained. For example, an unreasonably high percentage of frequently flushed and yearly
flushed surfaces created anomalously low pH values in the pit sump, which had never been
measured. Conversely, an unreasonably low percentage created anomalous, continually alkaline pH
values, which did not mimic the periodic flushing of accumulated reaction products. The best-fit
calibration by MINEWALL 1.0 and 2.0 indicated that 70% of the rock surfaces were not being
flushed during Operation (Table 4-2).
After the calibration to Operational data, MINEWALL was then used in predictive mode for
Closure. The MINEWALL 1.0 simulations indicated there would be an initial flushing of
accumulated acidity, depressing pH to below 6.0, but the pH would afterwards recover and remain
alkaline. MINEWALL 2.0 gave the same prediction, except pH would not be initially depressed at
Closure. As a result, as the pit-water level continue to rise slowly, the estimated 70% of reactive
surfaces that had accumulated reaction products year after year were not flushed at a sufficient rate
to offset the alkalinity brought into the pit by saturated groundwater flow.
4.2 Noranda Mineral's Bell Mine
Bell Mine is located near Granisle in central British Columbia. This open-pit mine closed
in 1993 after operating for about twenty years and a formal Closure Plan was submitted in 1993 for
regulatory approval (Noranda Minerals Inc., 1993; McArthur and Gallinger, 1994). A portion of the
Closure plan involved an assessment of acidic drainage and metal leaching based on over 200 acid-

MINEWALL 2.0: Literature Review and Conceptual Models 32
base accounts, seven humidity cells, four sizes of leach testwork (1 kg to 30 t), and over 10 years of
monitoring data around the minesite (Morin and Hutt, 1993a and b; Morin et al., 1995). This
information played a key role in MINEWALL simulations.
As part of MINEWALL 2.0 studies, six MINEWALL Stations were established on various
rock types and underwent four rinses over a period of two months. Average rates from the
MINEWALL stations are provided in Table 4-3. Reactive rock-surface area in this pit was estimated
at 10,500,000 m , which represented a ratio of 27:1 of reactive surface to visible surface. This site2
and its MINEWALL simulation are discussed further in the companion report, Application of
MINEWALL 2.0 to Three Minesites.
4.3 BHP Minerals' Island Copper Mine
Island Copper Mine is located on the northern end of Vancouver Island, near Port Hardy,
British Columbia. This mine has operated since 1971 and is expected to close in 1995 or 1996
(Horne, 1993; Island Copper Mine, 1994).
Five MINEWALL Stations were created at the site and rinsed 16 times over 1.5 years.
Average rates from each station are compiled in Table 4-4. Reactive rock-surface area was estimated
at 244,000,000 m with a 161:1 ratio of reactive to visible surface. This minesite and its2
MINEWALL simulation are discussed further in the companion report, Application of MINEWALL
2.0 to Three Minesites.

MINEWALL 2.0: Literature Review and Conceptual Models 33
TABLE 4-3Average Production Rates for Bell Mine MINEWALL Stations (mg/m /wk)2
Parameter Station Station Station Station Station Station(mg/m /wk) BFP BFP2 BBFP TUFF QFP SED2
pH (units) 7.25 6.95 7.28 6.43 7.20 7.00
Particulates 878 1060 1250 3930 821 622
Alkalinity 85.5 276 252 21.4 118 62.6
Acidity 2.14 2.47 2.15 8.23 1.36 21.6
Sulfate 181 122 334 2670 200 195
Silicate <0.3 <1.0 <0.9 <0.6 <0.3 <0.8
Nitrate 0.407 0.00823 1.53 0.360 0.168 0.0807
Aluminum <0.06 <0.3 <0.2 <0.12 <0.06 <0.16
Cadmium <0.003 <0.014 <0.008 <0.006 <0.003 <0.008
Calcium 98.1 214 249 69.1 127 40.8
Copper 0.0086 0.0211 0.0244 0.308 0.0423 0.881
Magnesium 17.3 28.7 44.2 525 21.0 51.5
Manganese 0.0149 0.109 0.0346 2.10 0.0522 0.0384
Molyb. 0.240 <0.04 0.356 0.038 0.00828 <0.025
Potassium 1.97 <3.0 2.31 3.80 1.09 <3
Sodium 1.28 <3.0 2.45 4.18 1.21 <3
Strontium 0.929 0.840 1.46 0.563 1.45 0.344
Zinc 0.0061 0.00829 0.00712 0.0915 0.00219 0.0174

MINEWALL 2.0: Literature Review and Conceptual Models 34
TABLE 4-4Average Production Rates for MINEWALL Stations
at Island Copper Mine (mg/m /wk)2
Parameter Station 1 Station 2 Station 4 Station 5 Station 6(mg/m /wk)2
pH (pH units) 7.31 6.61 6.25 6.23 6.45
Alkalinity 25.3 9.95 4.82 5.66 16.9
Sulfate 79.8 70.7 8.90 42.1 187
Silicon 11.0 - 1.48 1.86 10.6
Aluminum 0.500 1.07 0.130 0.157 0.420
Cadmium <0.01 <0.01 <0.01 <0.01 <0.01
Calcium 51.2 32.0 9.23 23.1 75.2
Copper 0.0102 0.0191 0.00886 0.0143 0.0619
Magnesium 1.84 0.388 0.153 0.824 3.30
Zinc <0.1 <0.1 <0.1 0.11 0.170

KinematicPorosity
(Arbitrary FractureGroundwater
Flow Direction)
ResidualPorosity
(Closed Pores)
DiffusionPorosity
(Small Pores Connectedto Kinematic Fractures)
MINEWALL 2.0: Literature Review and Conceptual Models 35
FIGURE 5-1. Kinematic, Diffusion, andResidual Porosities from Fractures(Nordstrom et al., 1989).
5. OTHER STUDIES NOT RELATED TO MINEWALL
5.1 Compiled Data on Groundwater Drawdowns Near Pits
As depicted in Figure 2-1, the local groundwater level is drawn down around pits, generally
forming a "drawdown cone" and causing groundwater on a regional scale to be drawn towards and
into the pit. Additionally, most infiltration within the cone can be expected to eventually report to
the pit.
A compilation of data on the lateral extent and maximum depth of drawdown around pits of
various sizes is presented in Table 5-1. Maximum reported extent and depth of drawdown in the
Table is 50 km and 130 m, respectively, both from a coal mine in Australia after 22 years of pumping
at 68,000 m /day. The drawdown at each pit is unique, and reflects factors such as the width and3
depth of the pit, the pumping rate, the length of pumping, and complexities in the hydrogeologic
system including hydraulic boundaries such as rivers and relatively impermeable faults.
5.2 Compiled Information on Fractures and
Their Effects on Groundwater
As indicated in Equation 3.4 and
discussed in Section 3.2, fractures can play the
dominant role in determining total reactive
surface area as well as the rate of groundwater
inflow in a pit or underground mine. It is
therefore appropriate to highlight the near-
random occurrence, shape, orientation, and
surface of fractures (Figures 5-1 and 5-2) in
order to show that any resulting estimates of
minewater flow and

TABLE 5-1Case Studies of Groundwater Flow to Pits
Location Approximate Pit Lateral& Maximum Extent of Pumping Reference
Type of Drawdown Drawdown Elapsed Rate &Mining (m) (m) Time (m /d) Miscellaneous3
Area Depth (m ) (m)2
Faro Mine, Yukon 840,000 90 - 150 10 - 1-2 wks 2180 Lopaschuk,1979; 380 m /d from lateral- base metal & Ag drains, 1800 as inflow to pit
3
Whitewood, Alberta 110,000 20 - 40 20 1200 > 6 yrs 410 Sumer et al., 1987; recharge = 5% of 50- coal to cm/yr; dewater wells; model K = 10 -
685 5*10 m/s, Sy = 0.05, S = 0.001-6
-4
Twin Buttes, Arizona 1,170,000 230 90 300 1.3 yrs generally < Pentz, 1979; underground galleries with- base metal(?) 5 lateral drill holes for dewatering; K = 10-8
Shirley Basin, Wyoming 150,000 90 21 > 300 1 yr > 1440 Straskraba & Kissinger, 1982; dewater- uranium wells/lateral drains; K = 2*10 m/s, S =-5
0.00054
Southern Illinois - - > 24 > 300 - - Oertel & Hood, 1983; K < 10 m/s- coal
-7
Kentucky - - 10 & - < 1 - Kipp et al., 1983; pits opened in unsaturated- coal rise month zones above wells with positive and
of 1.5 negative effects on recharge
Haywood Pit, Scotland 225,000 71 45 - - 26,000 Norton, 1982; dewater wells- coal
Blindwells Pit, Scotland 1,200,000 60 30 < 1,000 2 yrs 35,000 Norton, 1982; area contains abandoned,- coal to flooded underground mines; water table
69,000 stable prior to pit mining; dewatering wells
Piaski, Poland - 124 > 100 8,000 - 560,000 Seweryn, 1982; dewater wells- coal

Location Approximate Pit Lateral& Maximum Extent of Pumping Reference
Type of Drawdown Drawdown Elapsed Rate &Mining (m) (m) Time (m /d) Miscellaneous3
Area Depth (m ) (m)2
Nyirad, Hungary 2 pits: 100 45,000 21 yrs 430,000 Bocker and Vizy, 1982; Paris, Karst- bauxite 5,000,000 > 100 limestone; K = 10 - 10 m/s, porosity = 2 -
2,500,000 > 100 4%; S = 0.00002; dewatering wells;-5 -4
recharge = 25% of 63 cm/yr
Queensland, Australia 10,000 27 25 > 2,000 7 yrs 1,400 Dudgeon, 1987- limestone
Victoria, Australia 3,000,000 - 130 50,000 22 yrs 68,000 Evans, 1987; aquifer K = 6*10 - 2*10- coal m/s, S = 0.00002 - 0.0003; K of aquitard =
-6 -4
10 m/s-11
South Australia 200,000 60 40 - 1 yr 17,300 Armstrong, 1982; aquifer K = 6 - 9*10- coal, trial pit m/s; aquitard K = 10 ; series of emergency
-5
-8
wells for water control
Neyveli, India 7,770,000 70 49 11,000 18 yrs 160,000 to Hofedank, 1979; Brealey, 1965;- coal 320,000 transmissivity = 0.01 m /s; dewatering wells2

340
345
350
MINE FLOOR
SCALE (m)
0 1 2
FRACTURES IN BOREHOLES
STRIPA PROJECT, SWEDEN
MINEWALL 2.0: Literature Review and Conceptual Models 38
FIGURE 5-2. Fracture Patterns in Closely Spaced Boreholes at the Stripa Project (adapted from Witherspoon et al., 1981).
chemistry carry a high degree of
uncertainty.
For example, Jakubick et al. (1989)
examined fracture occurrence perpendicular
to walls of underground workings (Figures
5-3 and 5-4), and found discrete fractures
with variable permeability (and thus
variable size, extent, and surface area). In
particular, Jakubick et al. were searching for
enhanced fracturing close to the minewalls,
but apparently did not find it.
Also, Witherspoon et al. (1981)
measured groundwater pressures in discrete
intervals of boreholes extending 30 m from
an underground working (Figure 5-5). The
boreholes contained packers that isolated
the fractured intervals, which had been free
draining for years. When flow from
Borehole R01 was blocked, pressures in
some intervals of other boreholes increased.
This was taken as an indication of the
strength of hydraulic connection (Figure 5-
1) between the intervals.
Many of the studies mentioned in
this section on fractures were conducted

AECL - URL
Granite - Borehole 1
Distance From Wall (m)0 1 2 3 4 5 6 7 8 9 10 11 12 13 14 15
0
1
2
3
4
5
6
7
AECL - URL
Granite - Borehole 2
Distance From Wall (m)0 1 2 3 4 5 6 7 8 9 10 11 12 13 14 15
0
1
2
3
4
5
6
7
AECL - URL
Granite - Borehole 5
Distance From Wall (m)0 1 2 3 4 5 6 7 8 9 10 11 12 13 14 15
0
1
2
3
4
5
6
7
AECL - URL
Granite - Borehole 6
Distance From Wall (m)0 1 2 3 4 5 6 7 8 9 10 11 12 13 14 15
0
1
2
3
4
5
6
7
FIGURE 5-3. Discrete Fracture Permeabilities at 15 m depth at Canada's Underground ResearchLaboratory (adapted from Jakubick et al., 1989).

Colorado School of Mines
Granitic Gneiss - Borehole RUW-2
Distance From Wall (m)0 1 2 3 4 5 6
0
1
2
3
4
5
6
7
8
Colorado School of Mines
Granitic Gneiss - Borehole RUE-2
Distance From Wall (m)0 1 2 3 4 5 6
0
1
2
3
4
5
6
7
8
Colorado School of Mines
Granitic Gneiss - Borehole RDU-2
Distance From Wall (m)0 1 2 3 4 5 6
0
1
2
3
4
5
6
7
8
Colorado School of Mines
Granitic Gneiss - Borehole RHE-2
Distance From Wall (m)0 1 2 3 4 5 6
0
1
2
3
4
5
6
7
8
FIGURE 5-4. Fracture Permeabilities at Colorado School of Mines' Experimental Mine(adapted from Jakubick et al., 1989).

TUNNEL
BOREHOLE R01 R02
R03
R04R05
BOREHOLE R03STRIPA PROJECT, SWEDEN
DISTANCE FROM WALL (m)3-5 m 5-10 m 10-13 m 13-20 m 20-21 m 21-30 m
0
0.2
0.4
0.6
0.8
1
1.2
LegendAfter packing borehole R01 Prior to packing borehole R01
BOREHOLE R05STRIPA PROJECT, SWEDEN
DISTANCE FROM WALL (m)3-5 m 5-10 m 10-14 m 14-20 m 20-26 m 26-30 m
0
0.1875
0.375
0.5625
0.75
0.9375
1.125
1.3125
1.5
LegendAfter packing borehole R01 Prior to packing borehole R01
FIGURE 5-5. Changes in Water Pressure within Selected Fractures at the Stripa Project, Sweden(adapted from Witherspoon et al., 1981).

OC1 N1 N2 R1 R2 S1 S20
10
20
30
40
50
60
70
80
Additional Head Drop From Slash
Head Drop From Pilot Tunnel
Total Head Drop From Pilot & Slash
Borehole Number
Canada Underground Research Laboratories
Head Drop During Mining Through a Fracture Plane
MINEWALL 2.0: Literature Review and Conceptual Models 42
FIGURE 5-6. Predicted and Measured HeadLosses During Mining Through aFracture Plane at URL (Lang, 1989).
for the safe disposal of high-level nuclear
waste. When this and other information
was assembled into a computer program,
predictions were made on the changes in
fracture characteristics and the movement
of groundwater as an underground working
is extended during mining. When an
extension in Canada's Underground
Research Laboratory was modelled
beginning with a pilot tunnel and then
expanded (Lang, 1989), the discrepancies
between model-predicted and actual
pressure loss was notable (Figure 5-5).
This indicated that "the models used for
predicting the hydrogeologic response did
poorly". No doubt a similar conclusion can be drawn on the ability to define and predict other
aspects of fractures, including reactive surface area. As a result, a clear recognition of uncertainty
should be built into every MINEWALL simulation.
5.3 Rum Jungle, Australia
Flooding of pits, particularly the Whites and Intermediate Pits, were reported at the closed
Rum Jungle uranium mine in Australia (Goodman et al., 1981; Northern Territory Department of
Mines and Energy, 1986; Water Resources Division, 1986; Henkel and Alcock, 1986 and 1987).
Whites Pit has a lateral area of 10.5 ha, a maximum depth of 50 m, and a volume of 2,700,000 m .3
This pit flooded to its equilibrium static level (Figure 2-4) with the assistance of diverted river water
(Figure 2-3) and at that time had a pH of 4.75 and a sulfate concentration of 180 mg/L. However,
unneutralized tailings and treatment raffinate were dumped into the pit through the 1960's so that by

MINEWALL 2.0: Literature Review and Conceptual Models 43
1974 pH had fallen to 2.4 and sulfate increased to 9000 mg/L. The annual flow of water through
Whites Pit was estimated at 19,000,000 m , but did not include subsurface inflow and outflow.3
The upper 15 m of pit water was found to have thermoclines and chemoclines.
Consequently, treatment of pit water involved pumping of the deeper, denser acidic water and
returning the less dense treated water to the top. Although some mixing of the two layers hindered
initial treatment efforts, eventually most of the acidic water was treated, pH stabilized at 6.0, and
sulfate stabilized at 200 mg/L. Water chemistry varied noticeably over a year, improving when the
flow of pH-neutral surface water into the pit increased and worsening when evaporation and
groundwater inflow (which was found to be acidic) increased.
The Intermediate Pit has a lateral area of 4 ha, a maximum depth of 78 m, and a volume of
1,100,000 m . Like Whites Pit, this pit also flooded to equilibrium level within a year and in 19743
pH was 3.5 with sulfate at 2000 mg/L. The annual flow of water through the Intermediate Pit was
estimated at 18,000,000 m , but did not include subsurface inflow and outflow.3
Unlike Whites Pit, the Intermediate Pit did not contain significant chemoclines and
thermoclines, but the reasons for this are not given. Therefore, a different treatment system was
designed whereby lime was applied to the top of the pit-water column and the settled sludge
removed. As a result, pH increased to 5.9 and sulfate fell to 200 mg/L. Like Whites Pit, pit-water
chemistry varied noticeably through the year.
5.4 Compiled Data on Groundwater Chemistry Near Pit and Underground Mines
As a parallel to physical effects (Sections 5.1), McCurry and Rauch (1986) and O'Steen and
Rauch (1983) evaluated over 100 groundwater samples from wells near pit and underground mines
in West Virginia, USA. Although drawdown should prevent the migration of any contaminated
water from a mine, these researchers found impacts by pits as far away as 460 m laterally and 30 m

MINEWALL 2.0: Literature Review and Conceptual Models 44
vertically based on sulfate concentrations. The concentrations were found to decrease exponentially
with distance from the pits. However, because even upgradient wells showed impacts, the cause of
increasing sulfate may not be migration from pits, but the exposure of fresh rock to air in the
drawdown cone (e.g., Figure 2-1). Water-chemistry effects of underground mines were less than
those from pits.
5.5 Research by The Ohio State University (Morth et al., 1972)
Through the 1960's and 1970's, many graduate degrees were awarded by the Department of
Geology at The Ohio University based on studies of acidic drainage from underground mines. Many
of these studies are summarized by Morth et al. (1972), which is the earliest integrated physical,
chemical, and biological study of acidic drainage identified in this literature review. Although some
equations in this report may be erroneous based on dimensional analysis, it was the cornerstone of
the MINEWALL conceptual models for underground mines and contributed significantly to the
conceptual models for pits. Morth et al. was virtually "lost" to researchers, since it was discovered
by chance on a library shelf during the MINEWALL 1.0 study and did not appear in any computer-
based searches of databases.
In addition to opposing some views on acid generation still held today, Morth et al. (1972)
report on field and laboratory tests involving the occasional rinsing of exposed coal. The field tests
involved the isolation of a face of coal in the mine by cutting channels 15-30 cm deep around the
selected face and filling the channels with polyurethane foam. This is similar to the MINEWALL
Stations (Section 4), but MINEWALL Stations involve only the isolation directly on the face, since
small channels are difficult to cut in hard rock and may cause fracturing on the face. The laboratory
tests were similar to today's kinetic tests known as "humidity cells".
Rates from the field tests, based on rinses every 4-8 weeks, were 140-5250 mg acidity/m /wk,2
which are higher than those from the MINEWALL studies (Tables 4-1 to 4-3) possibly because the

MINEWALL 2.0: Literature Review and Conceptual Models 45
coal was more porous (Figure 3-1). Laboratory rates, based on condensation leaching of reaction
products on coal blocks 1x2x4 inches, were 21-56 mg acidity/m /wk, 9-16 mg sulfate/m /wk, and2 2
13-51 mg iron/m /wk. The lower rates from the laboratory testwork may have represented the2
retention of some reaction products on grain surfaces from incomplete condensation leaching.
Based on cores into the mine walls, Morth et al. indicated that sulfide oxidation was
occurring at distances of up to 15 m from the walls. An equation was developed for calculating the
rate of acid generation in a porous block of coal, although dimensional analysis suggests the equation
contain errors. The equation was normalized to 1 g of pyritic material at 60-mesh grain size which
was found to consume 25 g O /hr/g at 25 C. This equation was later adapted under MINEWALL2
1.0 to two impermeable blocks of rock separated by an oxygen-limited fracture with a fracture trace
(length exposed on the wall) of L meters and unlimited depth into the wall:
RATE = 2 {R/F - (R/F * exp(-F * L))} (5-1)where RATE = rate of acid generation in one fracture (mg SO /day)4
R = maximum oxidation rate under atmospheric oxygen (mg SO /m /day)42
F = (K/D)1/2
K = reaction rate (1/day; = 2.0x10 /V, Morth et al.)-6
V = gas volume in fracture exposed to 1 g of pyrite (m )3
D = 0.6 * DADA = normal oxygen diffusivity in air in appropriate unitsL = length of fracture trace on mine wall (m)
Equation 5-1 has not been tested or verified, and thus is not used in MINEWALL. Additionally,
Equation 5-1 does not include other effects, such as barometric pumping of oxygen into the fracture,
and may therefore underestimate rates.
Morth et al. identified three primary mechanisms for water movement and leaching:
unsaturated flushing of rock surfaces by trickling water,
saturated flushing of channels by inundation of the channel, temporarily halting oxidation, and
migration of acidic condensation, originating from moist air in the mine and the hygroscopic
nature of concentrated acidic solutions around pyrite.

MINEWALL 2.0: Literature Review and Conceptual Models 46
Based on the three mechanisms, simulations were performed on the small McDaniels Mine
test drift (12-14 m long), on large-diameter holes near the McDaniels Mine known as Auger Holes
1, 3, 4, 5, and 6, and on the Decker Mine with an acid output in 1964 of 76,000 kg/yr. For
MINEWALL 1.0, the raw data from Morth et al. was normalized to time and the reported surface
area "providing water", yielding the unit-area rates in Table 5-2. The rates for acidity production are
similar to those measured in the aforementioned field tests, supporting their validity. However, these
rates are notably higher than those measured in the less-porous MINEWALL studies of Section 4,
presumably due to less reactive surface within a 1 m block of rock.3
Morth et al. concluded that hundreds of kilograms of acidity could be stored within the walls
of small mines like the McDaniels (one drift of 12-14 m length). These stored reaction products can
then be released slowly through time or released quickly upon flooding, which could be mistaken
for ongoing acid generation.
5.6 Solubec Pit, Quebec, Canada
The Solbec Copper-Zinc-Lead Mine in Quebec was operated from 1962 to 1970 with a total
of 1.5x10 metric tonnes (mt) extracted through underground cut-and-fill. An additional 4.0x10 mt6 5
was removed from a pit in 1964 and 1965 (Figure 5-1). The mill continued operation with ore from
the nearby Cupra, Weedon, and Clinton Mines until 1977, processing a total of 4.9x10 mt. In 1988,6
276,000 m of sulfide-bearing waste rock and mine wastes, mostly of sand to cobble size, was placed3
into the dewatered open pit. A till dyke installed around the pit perimeter allowed the pit-water level
to be raised to 1.5 m above the backfilled rock after a 5-cm layer of non-dolomitic limestone was
placed as a cap.

MINEWALL 2.0: Literature Review and Conceptual Models 47
TABLE 5-2Adjusted Rates of Acid Leaching and Flow Dependencies
(raw data from Morth et al., 1972 normalized to surface area and time)
McDaniels Decker ----------------- Auger Hole ------------------
#3No. 1 No. 3 No. 4 No. 5 No. 6
Surface area 736 574 438 338 94 632 255,000providing (m )2
Trickle leaching, 770 630 770 880 1040 2190 -mg acid/m /wk2
Inundation, 77 710 990 886 550 360 -mg acid/m /wk2
Condensation, 390 180 31 84 250 190 -mg acid/m /wk2
Minimum flows below which:
- inundation 10.9 5.3 3.6 6.3 0 4.0 31removed no acidity(L/m /wk)2
- trickle leach 5.4 3.9 1.8 2.4 0 2.9 3.6removed no acidity(L/m /wk)2
- condensation leaching was determined to be independent of flowrate

MINEWALL 2.0: Literature Review and Conceptual Models 48
Ross et al. (1994) described a study of the physical and chemical hydrogeology of the
backfilled Solbec pit (Figure 5-7). This study showed that groundwater was flowing laterally
through the backfilled rock and that elevated concentrations of acidity and metals were found
downgradient of the pit. The elevated concentrations were attributed to two mechanisms: (1)
flushing of accumulated acidity and metals from the backfilled rock and (2) slow oxidation in the
submerged rock. Data over the short time since backfilling could not reveal the relative contribution
of these two mechanisms to the downgradient chemistry. From the MINEWALL perspective, there
may also be contributions from the pit walls as well as the mine workings beneath the pit.
The pit walls and floor exposed chloritic schist and sericite. "Since the rock was extracted
using dynamite, it is highly probable that the pit walls and the floor have fractured" (Ross et al.,
1994). Drillholes revealed that up to 6 m of fine material had accumulated in the pit prior to
backfilling. A small proportion of this material was attributed to deposition of 1x10 m of mine4 3
wastes into the pit in the last stages of milling.
The underground workings were at least 10 m below the pit floor. Some shafts extended
from the pit floor into the workings, but these shafts may have been filled and covered with till
before placement of waste rock. Other shafts extended from ground surface around the pit to the
workings.
Ross et al. (1994) drilled five boreholes: two inside the pit and three around the pit perimeter
(Figure 5-7). Multilevel piezometers were placed in four of the five holes. Groundwater flow was
found to be generally lateral from north to south, with some variable vertical gradients along the
flowpaths. Based on hydraulic conductivities of 1x10 to 1x10 m/s in the surrounding fractured-6 -7
bedrock, maximum porosity of 0.01, and hydraulic gradient of 0.03, the average linear groundwater
velocity was estimated at 10-95 m/yr. Total volume of groundwater flow was estimated at 1.2x10⁴
m /yr. The effect of the underground workings on groundwater movement could not be determined.3

16+00' N
14+00' N
12+00' N
10+00' N
0 30
METERS
PiezometerF-4
PiezometerF-1Piezometer
F-2
PiezometerF-3
PiezometerF-5
SOLBEC PIT
DYKE
GENERALDIRECTION OFGROUNDWATERFLOW
(FILLED WITH WASTEROCK AND MINE WASTES)
Outflowfrom Pit
SOLBEC MINESITE, QUEBEC
PLAN VIEW
NorthShaft
SouthShaft
CROSS-SECTION
DEPTH(m)0
25
50
PiezometerF-1
PiezometerF-2
UNDERGROUND DRIFT
GENERAL DIRECTION OF
GROUNDWATERFLOW WATER
COVER
BEDROCK
WASTE ROCK
MINEWASTE &WALL COLLAPSE
MINEWALL 2.0: Literature Review and Conceptual Models 49
FIGURE 5-7. Plan and Cross-section of the Solbec Pit (adapted from Rosset al., 1994).

MINEWALL 2.0: Literature Review and Conceptual Models 50
An electromagnetic survey indicated groundwater contamination extended 120-160 m south
from the pit perimeter, which was consistent with piezometer samples to the east of the pit.
Porewater in the submerged waste rock contained more than 1 mg/L dissolved oxygen and thus
ongoing oxidation of sulfide minerals was considered a possible source of the groundwater
contamination. Also, since the waste rock was known to be a source of acidic drainage and leached
metals prior to placement in the pit, the simple flushing of accumulated reaction products could
account for the downgradient contamination. Further monitoring was recommended to distinguish
between the two causes.
Ross et al. (1994) provided little water-chemistry data. However, bar charts that are
presented for a few parameters suggest the concentrations are regulated by chemical equilibrium.
As a result, the calculation of reaction rates and further chemical evaluations are not possible from
data in the reference.
5.7 Brunswick Mining No. 6 Minesite, New Brunswick, Canada
The No. 6 Minesite, located approximately 27 km southwest of Bathurst, New Brunswick,
began operating in 1966 and closed in November, 1983 (St-Arnaud and Aiken, 1991). Ore
containing zinc, lead, copper, and silver was mined from a pit with limited underground workings,
to a total of 1.21x10 tonnes.7
Approximately 3.0x10 m of waste rock and waste sulfides from the operation were placed6 3
in the North, East, and Pyrite Waste Dumps. An additional 2.1x10 m was used for roads and5 3
foundations and lesser amounts were placed in the South waste pad. Roughly 8x10 m of tailings4 3
from a pilot-scale operation are also located on the site.
The geology of the minesite is dominated by coarse-grained, quartz-rich meta-gabbro of
Ordovician age. The orebody contained massive interlayered sulfide beds consisting mostly of

MINEWALL 2.0: Literature Review and Conceptual Models 51
pyrite, pyrrhotite, chalcopyrite, galena, and sphalerite. Local faulting was identified with up to 30
m of displacement which also brecciated the nearby sulfide beds up to a width of 1 m. Overburden
covering the rock is predominantly compact sandy silty basal till.
Maximum depth of the No. 6 Pit was 185.4 m and lateral surface area at the overflow
elevation of 2581.7 m was estimated at 11.1 ha. The underground workings joined the south side
of the pit near the base. Total volume of the pit excluding the workings was set at 8.5x10 m . The6 3
pit was approximately 50 m below its overflow elevation, but expected to reach it by the Year 2000.
Identified or suspected sources of acidic drainage at the site were: mine walls, the waste-rock
dumps and pads, the pyrite dump, the tailings pond, acid-water holding and settling ponds, a natural
on-site pond, roads, and building foundations. Acidic drainage from the site was treated seasonally
with lime and a average of 3.7x10 m of treated water was annually discharged into the pit for5 3
settling of precipitants. Additionally, high-pyrite acidic waste rock was dumped into the southeast
corner of the flooded pit.
St-Arnaud and Aiken (1991) reported on a hydrogeologic study of the minesite, involving
36 monitoring wells and a few samples of pit water. Most groundwater was expected in the more
fractured, shallow bedrock, which had hydraulic conductivities between 10 and 10 m/s with a-4 -7
mean (presumably geometric) of 1.27x10 m/s. Vertical hydraulic gradients were negligible so-5
lateral flow was expected to dominate at calculated average velocities of 100-1000 m/yr.
Groundwater levels in the wells indicated drawdown caused groundwater within 100-200 m
of the pit to move into it. However, the shape of the drawdown cone shows marked anisotropy with
relatively steep hydraulic gradients to the north and west of the pit. When the pit is filled,
groundwater is expected to migrate southward through the pit area towards a brook over 500 m
away.
The rate of groundwater flow into the pit was calculated through the "equivalent well
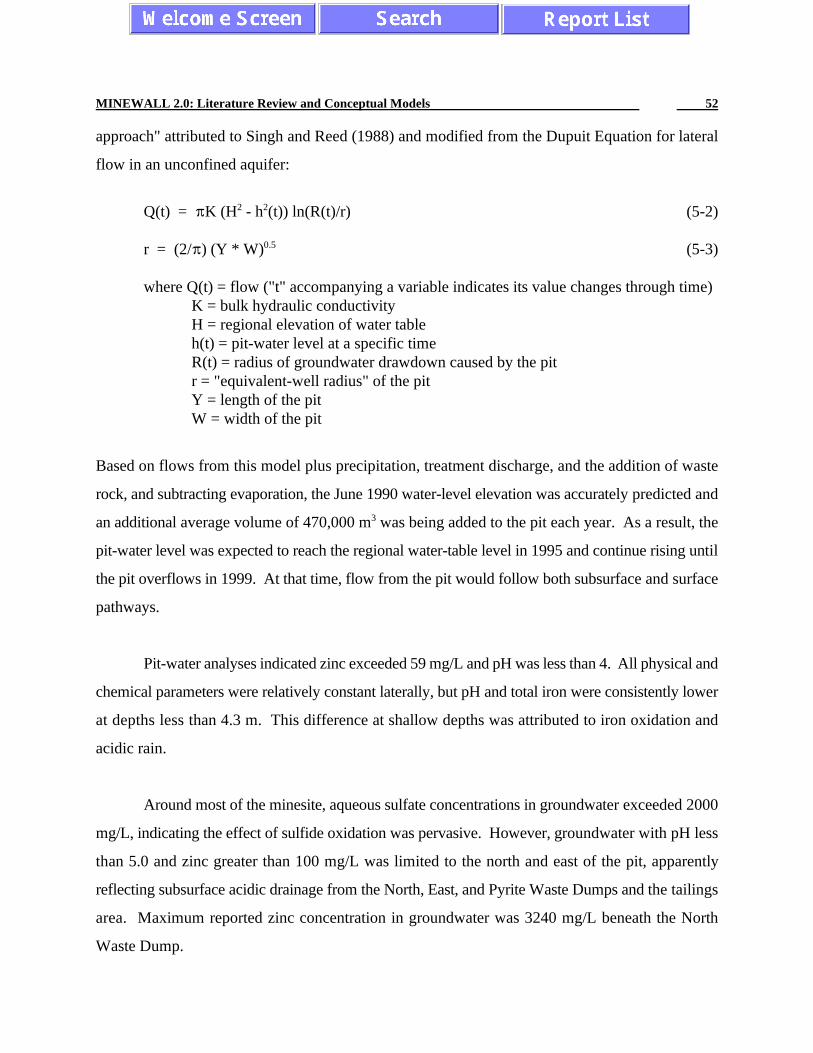
MINEWALL 2.0: Literature Review and Conceptual Models 52
approach" attributed to Singh and Reed (1988) and modified from the Dupuit Equation for lateral
flow in an unconfined aquifer:
Q(t) = K (H - h (t)) ln(R(t)/r) (5-2)2 2
r = (2/ ) (Y * W) (5-3)0.5
where Q(t) = flow ("t" accompanying a variable indicates its value changes through time)K = bulk hydraulic conductivityH = regional elevation of water tableh(t) = pit-water level at a specific timeR(t) = radius of groundwater drawdown caused by the pitr = "equivalent-well radius" of the pitY = length of the pitW = width of the pit
Based on flows from this model plus precipitation, treatment discharge, and the addition of waste
rock, and subtracting evaporation, the June 1990 water-level elevation was accurately predicted and
an additional average volume of 470,000 m was being added to the pit each year. As a result, the3
pit-water level was expected to reach the regional water-table level in 1995 and continue rising until
the pit overflows in 1999. At that time, flow from the pit would follow both subsurface and surface
pathways.
Pit-water analyses indicated zinc exceeded 59 mg/L and pH was less than 4. All physical and
chemical parameters were relatively constant laterally, but pH and total iron were consistently lower
at depths less than 4.3 m. This difference at shallow depths was attributed to iron oxidation and
acidic rain.
Around most of the minesite, aqueous sulfate concentrations in groundwater exceeded 2000
mg/L, indicating the effect of sulfide oxidation was pervasive. However, groundwater with pH less
than 5.0 and zinc greater than 100 mg/L was limited to the north and east of the pit, apparently
reflecting subsurface acidic drainage from the North, East, and Pyrite Waste Dumps and the tailings
area. Maximum reported zinc concentration in groundwater was 3240 mg/L beneath the North
Waste Dump.

MINEWALL 2.0: Literature Review and Conceptual Models 53
5.8 Midnite Mine, Washington, USA
This inactive uranium mine is located on the Spokane Indian Reservation, approximately 40
miles northwest of Spokane, Washington. The minesite has approximately 130 ha of disturbed land
at a altitude of roughly 850 m. Uranium was discovered at the site in 1954, and mining was carried
out between 1956 to 1982 except for a shutdown period from 1962 to 1969. The site contains two
pits (Pit 4 and the larger Pit 3), one ore stockpile, and two waste-rock dumps (Figure 5-8).
In 1978, a yellow-white precipitant was noted in a creek bed draining the site, extending
several hundred meters below the mine boundary. This precipitant was found to contain aluminum-
bearing minerals, gypsum, and 3-6% uranium oxide, which was taken as evidence of significant
metal leaching. A retention pond and dam was constructed and water from this pond and Pit 4 was
occasionally pumped to Pit 3. A small flow of surface water with total dissolved solids of
approximately 6,000 mg/L still bypassed the dam.
Sumioka (1991) reports on a detailed physical and chemical study of the hydrogeology and
hydrology of the minesite. The site has warm, dry summers and clear, cold winters with snow.
Average precipitation at a nearby town was 49 cm/yr over a 29 year period. The mine is mostly
limited to one topographic basin which is drained by three small streams that converge.
The geology of the area consists of Precambrian metasedimentary phyllites and calc-silicate
hornfels. This rock has been intruded by Cretaceous porphyritic quartz monzonite in portions of the
minesite. Quaternary alluvium covers the rock in places. Uranium ore is located at contacts between
the metasedimentary and granitic rock. Near the surface, uranium occurs as autunite and meta-
autunite, whereas at greater depth it occurs as uraninite and coffinite as is associated with pyrite and
marcasite.
Pit 3 is located near the center of the minesite. It has a maximum depth of approximately
170 m, a lateral area of 3.6 ha at full water level, and an estimated volume of 4.4x10 m . Pit 4 at5 3

MINEWALL 2.0: Literature Review and Conceptual Models 54
the north end of the site has a maximum depth of roughly 140 m, a lateral area of 2.4 ha at full water
level, and an estimated volume of 1.8x10 m . The southern rim of Pit 4 was raised 12-15 m with5 3
fill in 1982 to prevent overflow of the pit. The retention pond below these pits has a maximum
depth of 9 m, a surface area of 0.4 ha, and a volume of 1.8x10 m .4 3
Most of the study conducted by Sumioka (1991) focussed on site-wide water balance and
downstream water chemistry. However, there were chemical analyses of the water columns in Pits
3 and 4, and in the retention pond (Tables 5-3 to 5-8).
In Pit 4 (Tables 5-3 and 5-4), conductance and pH (~7) are generally steady through time and
depth. However, with increasing depth, temperature and dissolved oxygen clearly decrease, while
total dissolved solids, Ra, and U increase. These trends indicate a relatively stable water column226
with chemoclines and thermoclines (Section 3.3), and more reducing conditions mobilizing uranium
with depth.
In contrast to Pit 4, Pit 3 (Tables 5-5 and 5-6) shows relatively few or minor trends of any
parameters through time and depth. The measured pH remains around 4.5. As a result, Pit 3 appears
to remain well mixed with little stratification.
The retention pond (Tables 5-7 and 5-8) shows some decrease of dissolved oxygen and
increase of suspended solids with depth. However, most parameters remain generally steady with
pH around 3.6.

0 500METERS
N
MIDNITE URANIUM MINE
PIT 4
PIT 3
EAST DRAIN
CENTRAL
WEST DRAIN
ORESTOCKPILE
PROTOREPILE
WASTE
RETENTIONDAM
MINESITE
BOUNDARY
WASTE DUMP
PILE
POND
DRAIN
MINEWALL 2.0: Literature Review and Conceptual Models 55
FIGURE 5-8. Map of the Midnite Mine (adapted from Sumioka, 1991).
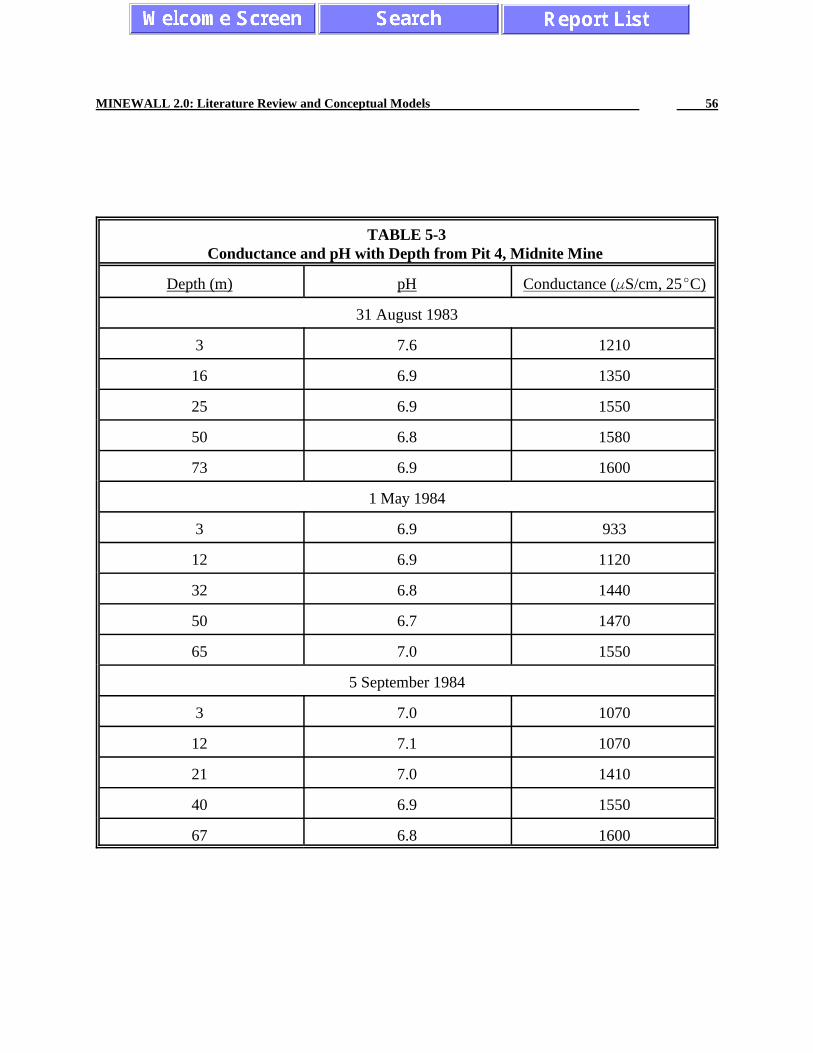
MINEWALL 2.0: Literature Review and Conceptual Models 56
TABLE 5-3Conductance and pH with Depth from Pit 4, Midnite Mine
Depth (m) pH Conductance ( S/cm, 25 C)
31 August 1983
3 7.6 1210
16 6.9 1350
25 6.9 1550
50 6.8 1580
73 6.9 1600
1 May 1984
3 6.9 933
12 6.9 1120
32 6.8 1440
50 6.7 1470
65 7.0 1550
5 September 1984
3 7.0 1070
12 7.1 1070
21 7.0 1410
40 6.9 1550
67 6.8 1600
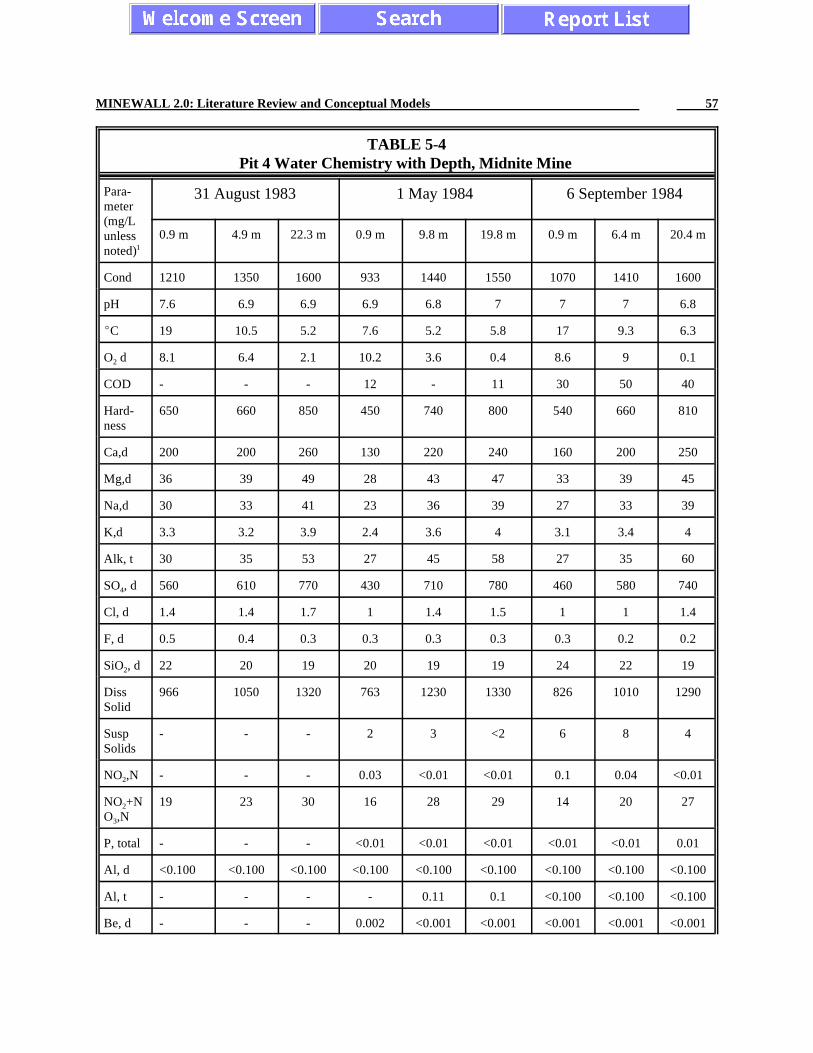
MINEWALL 2.0: Literature Review and Conceptual Models 57
TABLE 5-4Pit 4 Water Chemistry with Depth, Midnite Mine
Para-meter(mg/Lunlessnoted)1
31 August 1983 1 May 1984 6 September 1984
0.9 m 4.9 m 22.3 m 0.9 m 9.8 m 19.8 m 0.9 m 6.4 m 20.4 m
Cond 1210 1350 1600 933 1440 1550 1070 1410 1600
pH 7.6 6.9 6.9 6.9 6.8 7 7 7 6.8
C 19 10.5 5.2 7.6 5.2 5.8 17 9.3 6.3
O d 8.1 6.4 2.1 10.2 3.6 0.4 8.6 9 0.12
COD - - - 12 - 11 30 50 40
Hard- 650 660 850 450 740 800 540 660 810ness
Ca,d 200 200 260 130 220 240 160 200 250
Mg,d 36 39 49 28 43 47 33 39 45
Na,d 30 33 41 23 36 39 27 33 39
K,d 3.3 3.2 3.9 2.4 3.6 4 3.1 3.4 4
Alk, t 30 35 53 27 45 58 27 35 60
SO , d 560 610 770 430 710 780 460 580 7404
Cl, d 1.4 1.4 1.7 1 1.4 1.5 1 1 1.4
F, d 0.5 0.4 0.3 0.3 0.3 0.3 0.3 0.2 0.2
SiO , d 22 20 19 20 19 19 24 22 192
Diss 966 1050 1320 763 1230 1330 826 1010 1290Solid
Susp - - - 2 3 <2 6 8 4Solids
NO ,N - - - 0.03 <0.01 <0.01 0.1 0.04 <0.012
NO +N 19 23 30 16 28 29 14 20 272O ,N3
P, total - - - <0.01 <0.01 <0.01 <0.01 <0.01 0.01
Al, d <0.100 <0.100 <0.100 <0.100 <0.100 <0.100 <0.100 <0.100 <0.100
Al, t - - - - 0.11 0.1 <0.100 <0.100 <0.100
Be, d - - - 0.002 <0.001 <0.001 <0.001 <0.001 <0.001

MINEWALL 2.0: Literature Review and Conceptual Models 58
Para-meter(mg/Lunlessnoted)1
31 August 1983 1 May 1984 6 September 1984
0.9 m 4.9 m 22.3 m 0.9 m 9.8 m 19.8 m 0.9 m 6.4 m 20.4 m
Cd, d 0.001 <0.001 <0.001 <0.001 <0.001 <0.001 <0.001 <0.001 <0.001
Cd, t - - - <0.001 <0.001 <0.001 0.034 0.007 0.003
Cu, d 0.001 0.001 <0.001 <0.002 <0.001 <0.001 0.001 <0.001 <0.001
Cu, t - - - 0.004 0.005 0.004 0.005 0.004 0.003
Fe, d <0.003 <0.003 0.003 0.004 0.055 0.021 <0.003 <0.003 <0.003
Fe, t - - - 0.05 0.06 0.07 0.03 0.04 0.03
Mn, d 1.3 2.9 3 1.9 3 3.3 1.2 2.4 3.1
Mn, t - - - 2.1 2.9 3.2 1.7 2.4 3.1
Ni, d 0.061 0.085 0.082 0.057 0.067 0.063 0.038 0.052 0.058
Ni, t - - - 0.075 0.09 0.084 0.056 0.058 0.051
Sr, d 0.7 0.78 1 5 8.8 9.6 0.59 0.79 0.95
Zn, d 0.023 0.05 0.05 0.046 0.055 0.042 0.016 0.03 0.045
Zn, t - - - 0.06 0.05 0.04 0.03 0.03 0.03
Ra,d 1.7 5.2 8.3 7 7.5 6.5 1 2.6 6.7226
pCi/L
U, diss 3.9 6.2 8.4 4.3 10 8 1.7 5 8.6
Conductivity in S/cm; "d" = dissolved; "t" = total; hardness and alkalinity as CaCO13
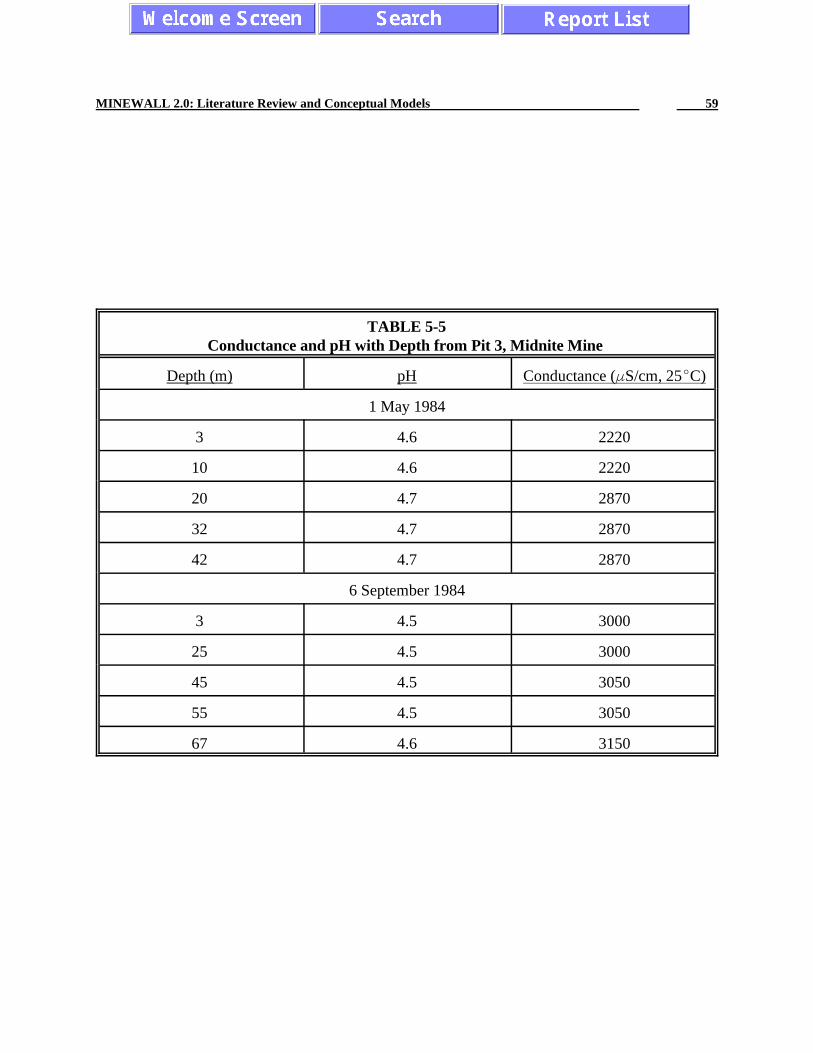
MINEWALL 2.0: Literature Review and Conceptual Models 59
TABLE 5-5Conductance and pH with Depth from Pit 3, Midnite Mine
Depth (m) pH Conductance ( S/cm, 25 C)
1 May 1984
3 4.6 2220
10 4.6 2220
20 4.7 2870
32 4.7 2870
42 4.7 2870
6 September 1984
3 4.5 3000
25 4.5 3000
45 4.5 3050
55 4.5 3050
67 4.6 3150

MINEWALL 2.0: Literature Review and Conceptual Models 60
TABLE 5-6Pit 3 Water Chemistry with Depth, Midnite Mine
Parameter (mg/L unlessnoted)
1 May 1984 6 September 1984
0.9 m 6.1 m 12.8 m 0.9 m 13.7 m 20.4 m
Cond, S/cm, 25 C 2220 2870 2870 3000 3050 3150
pH 4.6 4.7 4.7 4.5 4.5 4.6
Temp, C 7.4 7.9 6.8 17.3 14.1 11.9
Oxygen, diss 10.5 9.6 9.8 8.4 8.2 4.8
COD 82 - 83 140 140 140
Hardness, CaCO 1100 1300 1300 1300 1100 16003
Acidity, total, CaCO - - - 2.5 2.5 2.03
Ca, diss 240 270 270 290 250 370
Mg, diss 130 150 150 130 110 170
Na, diss 59 160 160 120 120 130
K, diss 2.6 3.0 3.2 3.3 3.1 3.3
Alkalinity, total, CaCO <1 <1 <1 - - -3
SO , diss 1500 1800 1900 2000 2200 22004
Cl, diss 3.3 5.4 5.4 3.8 4.0 4.0
F, diss 1.2 1.1 1.1 1.4 1.5 1.6
SiO , diss 23 20 19 22 20 172
Dissolved Solids 2330 2870 2910 3050 3110 3150
Suspended Solids 12 3 7 1 1 1
NO as N <0.01 <0.01 <0.01 <0.01 <0.01 <0.012
NO +NO as N 7.7 8.9 8.7 7.7 7.0 8.02 3
P, total, as P <0.01 0.01 0.01 <0.01 <0.01 <0.01
Al, diss 30 - 20 35 41 40
Al, total 31 - 20 30 36 31
Be, diss 0.02 0.01 0.02 0.03 0.03 0.02
Cd, diss 0.040 0.041 0.022 0.100 0.100 0.100
Cd, total 0.043 0.042 0.039 0.050 0.060 0.060
Cu, diss 0.21 0.15 0.15 - 0.30 0.30
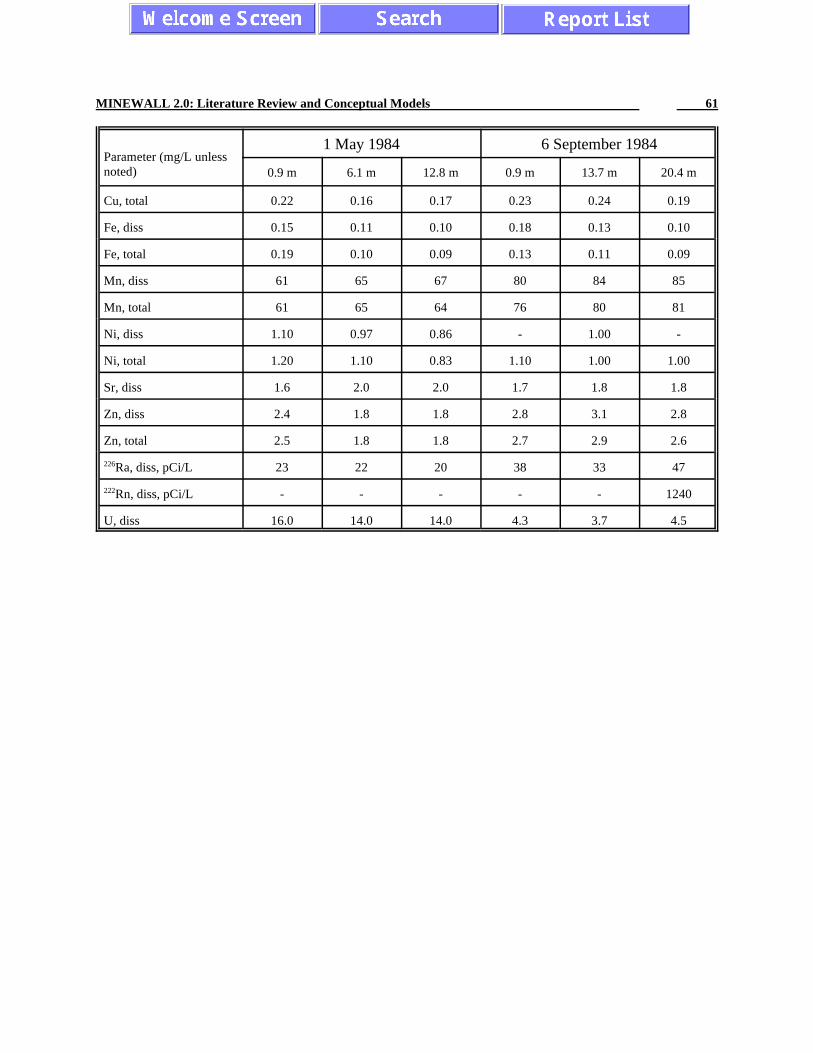
MINEWALL 2.0: Literature Review and Conceptual Models 61
Parameter (mg/L unlessnoted)
1 May 1984 6 September 1984
0.9 m 6.1 m 12.8 m 0.9 m 13.7 m 20.4 m
Cu, total 0.22 0.16 0.17 0.23 0.24 0.19
Fe, diss 0.15 0.11 0.10 0.18 0.13 0.10
Fe, total 0.19 0.10 0.09 0.13 0.11 0.09
Mn, diss 61 65 67 80 84 85
Mn, total 61 65 64 76 80 81
Ni, diss 1.10 0.97 0.86 - 1.00 -
Ni, total 1.20 1.10 0.83 1.10 1.00 1.00
Sr, diss 1.6 2.0 2.0 1.7 1.8 1.8
Zn, diss 2.4 1.8 1.8 2.8 3.1 2.8
Zn, total 2.5 1.8 1.8 2.7 2.9 2.6
Ra, diss, pCi/L 23 22 20 38 33 47226
Rn, diss, pCi/L - - - - - 1240222
U, diss 16.0 14.0 14.0 4.3 3.7 4.5

MINEWALL 2.0: Literature Review and Conceptual Models 62
TABLE 5-7Conductance and pH with Depth from Retention Pond, Midnite Mine
Depth (m) pH Conductance ( S/cm, 25 C)
2 May 1984
3 3.7 7130
8 3.5 8630
12 3.8 9630
5 September 1984
3 3.6 8600
7 3.7 8700
11 3.7 9200

MINEWALL 2.0: Literature Review and Conceptual Models 63
TABLE 5-8Retention Pond Water Chemistry with Depth, Midnite Mine
Parameter (mg/L unless noted)1 May 1984 6 September 1984
0.9 m 3.7 m 0.9 m 3.4 m
Cond, S/cm, 25 C 7130 9630 8600 9200
pH 3.7 3.8 3.6 3.7
Temp, C 11.2 12.9 19.5 19.5
Oxygen, diss 13.0 0.8 11.6 0.5
COD 670 850 - -
Hardness, CaCO 4400 5700 5600 58003
Acidity, total, CaCO 76 96 41 413
Ca, diss 440 480 590 490
Mg, diss 810 1100 1000 1100
Na, diss 37 72 45 50
K, diss 4.4 4.3 4.9 4.0
Alkalinity, total, CaCO <1 <1 - -3
SO , diss 8000 10000 10000 120004
Cl, diss 4.4 5.6 2.8 2.8
F, diss 11 12 <0.1 <0.1
SiO , diss 84 91 99 792
Dissolved Solids 12300 15600 15200 15700
Suspended Solids 21 41 18 26
NO as N <0.1 <0.1 <0.01 <0.012
NO +NO as N 4.3 2.4 9.7 7.02 3
P, total, as P 0.01 0.01 0.01 0.01
Al, diss 490 710 510 470
Al, total 540 720 660 640
Be, diss 0.18 0.24 0.11 0.13
Cd, diss <0.001 - 0.500 0.500
Cd, total <0.001 0.550 0.450 0.500
Cu, diss 0.002 3.300 3.300 3.500

MINEWALL 2.0: Literature Review and Conceptual Models 64
Parameter (mg/L unless noted)1 May 1984 6 September 1984
0.9 m 3.7 m 0.9 m 3.4 m
Cu, total 2.800 3.500 7.000 7.000
Fe, diss 4.3 4.8 3.2 4.5
Fe, total 4.7 5.9 3.1 4.5
Mn, diss 500 630 630 640
Mn, total 530 650 600 610
Ni, diss 0.056 - 11.0 11.0
Ni, total 9.90 7.80 25.0 18.0
Sr, diss 0.95 0.93 0.92 0.89
Zn, diss 26.0 33.0 33.0 34.0
Zn, total 28.0 34.0 32.0 34.0
Ra, diss, pCi/L 55 48 63 61226
U, diss 160.0 180.0 160.0 180.0
MINEWALL 2.0: Literature Review and Conceptual Models 65
5.9 Bunker Hill Mine, Idaho, USA
The underground Bunker Hill Lead-Zinc Mine is located near Kellogg and the Coeur d'Alene
River in northern Idaho. Mining began in 1885 and, by 1979, included over 240 km of workings to
depths of approximately 1.6 km, representing roughly 180 km of rock. The yearly rate of new3
drifting and drilling were roughly 6 km and 18 km, respectively. The rock is highly faulted and
fractured metamorphic quartzites with interbedded argillites.
Annual precipitation in the area was approximately 0.76 m, mostly as snow. Discharge from
the mine was 0.17 m /s at an average pH of 3.3 (Trexler et al., 1974) and 0.13-0.16 m /s at pH 4.0-3 3
4.7 with minimum of 3.3 (Trexler, 1979). The sources of this flow were: surface-water inflow
through fractures and faults (69.1%), groundwater inflow (19.0%), and drainage of sand backfill
(11.9%).
Portions of the underground workings have been backfilled with sand since 1961 and with
rock from drifting prior to 1961. Some of the drift rock contained elevated levels of lead, zinc, and
pyrite, which contributed to acidic drainage and metal leaching from the upper levels.
Trexler et al. (1974) graphically reported more than 400 pH measurements on a simplified
two-dimensional vertical profile of the mine (Figure 5-9). This showed that acidic pH was
encountered most often in the upper levels and near the No. 2 Shaft, although at least one acidic pH
was found on most levels.
The availability of water to flush reaction products of acid generation and metal leaching was
identified as the major control on water chemistry. Accordingly, reclamation activities focussed on
identification and elimination of surface-water access to the workings.
The main drainage pathways for the mine are the Cherry Ditch which drains the upper levels
and the Kellogg Tunnel. Hydrographs for the Ditch and Tunnel, and for Milo Creek which drains

MINEWALL 2.0: Literature Review and Conceptual Models 66
a portion of the land surface above the mine, showed a close correlation (Figure

45
6
789
LAND SURFACE
CHERRY RAISE
9
101112131415161718192021222324
2526272829
30
31
GORDON RAISE
AUXILLARY RAISE
-2000 FT. MSL
+3196 FT. MSL
NO. 3 SHAFTNO. 2 SHAFT
NO. 1 SHAFT
KELLOGG TUNNEL
NOTE: Levels above 4 Levelhave portals that open to thesurface; some of these levelsalso have raises that connectthem to lower levels.
BUNKER HILL MINESIMPLIFIED 2-D VERTICAL CROSS-SECTION
WITH pH MEASUREMENTS ON MINE FLOORS
3 < pH < 4.5
4.5 < pH < 6
0 < pH < 3
6 < pH < 8
MINEWALL 2.0: Literature Review and Conceptual Models 67
FIGURE 5-9. Vertical-Plane Schematic Map of a Portion of the Bunker HillMine (adapted from Trexler et al., 1974).

Bunker Hill MineFlows from Underground Levels and Milo Creek
LegendMilo Creek Kellogg Tunnel Cherry Ditch 10 Level17 Level 25 Level 27 Level
MonthOct 72 Nov Dec Jan 73 Feb Mar Apr May Jun Jul Aug Sep0
50
100
150
200
FIGURE 5-10. Hydrographs of Flows in Underground Levels and Milo Creek, Bunker Hill Mine(adapted from Trexler et al., 1974; Trexler, 1979).

MINEWALL 2.0: Literature Review and Conceptual Models 69
5-10), although variations were more pronounced in Milo Creek. General, but more subdued,
correlations were noted for deeper levels. The correlations indicated the underground flow was
hydraulically connected to surface water with the connection decreasing with depth. Potential
connections were then identified: (1) fractures between the surface and the upper workings due to
surface subsidence, (2) faults between the surface and the upper workings, and (3) a drift and stope
on 4 level extending close to surface.
The subsided "Caving Area", measuring 60 m in diameter and 12 m deep, apparently
received water from tributaries of Milo Creek. During winter months, a "vapor cloud" of mine air
could be seen issuing from this area. A dye tracer test in the tributaries through the Caving Area then
showed that creek water reached 4 level within 15 minutes and 5 level in 30 minutes. Continuous
flow monitoring in January 1973 indicated that at least 99% of drainage water was caught by the
depression and surrounding fractures.
In another portion of Milo Creek, constant dye-release tests in May and July 1973 indicated
that creek water was lost into fractures and a fault zone. Losses ranged from 29-76% of streamflow
(0.028-0.093 m /s). In the adjacent Deadwood Creek, dye tracer tests showed that creek water3
required 12-36 hours to flow to 9 level, located 370 m below and 610 m laterally away from the
creek.
5.10 Berkeley Pit, Montana, USA
This pit is located in southwestern Montana and is reportedly the second largest pit in the
USA (Davis and Ashenberg, 1989). It has a maximum depth of 542 m with lateral dimensions of
1.8 km by 1.4 km. The lower 38 m had been filled to a flat surface due to the collapse of wall
material. Underground workings are connected to the pit.
In 1987, the lower 340 m of the pit had been flooded and the water level was rising 22 m/yr

MINEWALL 2.0: Literature Review and Conceptual Models 70
due to inflow of groundwater and surface waters (David and Ashenberg, 1989). Total inflow was
estimated at 28,700 m /day including an estimated loss to evaporation of 300 m /day. 3 3
Depth-specific samples from the 130 m water column indicated many parameters generally
increased with depth including pH (~3), suspended solids, conductance, aluminum, calcium, total
and ferrous iron, and sulfate (e.g., Table 5-9). On the other hand, dissolved oxygen and Eh decreased
with depth. This indicated the presence of chemoclines and a thermocline, and the development of
reducing conditions.
Due to metal leaching, concentrations of cadmium, copper, and zinc reached concentrations
of 1.9, 214, and 500 mg/L, respectively. Concentrations of iron, calcium, aluminum, potassium, and
sulfate were apparently regulated by mineral solubility of ferric hydroxide, gypsum, jurbanite, and
jarosite. The presence of reduced sulfur (sulfide), which may lower metal concentrations through
precipitation of relatively insoluble sulfide minerals, was not mentioned and thus the pit may not be
meromictic (Section 3.3) or sufficiently reducing.
Changes in appearance and chemistry of the shallowest pit water was noted seasonally. For
example, formation of ice cover resulted in the reduction of ferric iron to ferrous iron, with the
reverse reaction occurring during summer months. Below a depth of 30 m, water chemistry was
relatively steady.
5.11 D Pit, Amok Minesite, Saskatchewan, Canada
The Amok uranium mine is located near Cluff Lake in northwestern Saskatchewan. One
relatively small, shallow orebody at Amok was named "D", and mining of it began in April of 1980
(Saskatchewan Environment, 1990 and 1993). Excavation of the pit was temporarily halted in
October of that year and began again in May 1981. By September 1981, mining was completed after
removal of approximately 107,800 tonnes of ore grading roughly 7% U O . The final pit had a3 8
lateral extent of 200 meters by 90 meters with a maximum depth of 23 meters.

MINEWALL 2.0: Literature Review and Conceptual Models 71

MINEWALL 2.0: Literature Review and Conceptual Models 72
TABLE 5-9Water Chemistry in the Flooding Berkeley Pit
(from Davis and Ashenberg, 1989)
Depth (m) pH Eh (V) Fe (mg/L) Fe (mg/L) Total Fe (mg/L)2+ 3+
0 2.76 0.82 0.25 196 196
1 2.72 0.72 60 142 202
3 2.84 0.64 262 14 276
15 2.95 0.57 622 28 650
31 3.08 0.50 900 10 910
66 3.15 0.46 938 - 854
100 3.15 0.47 944 14 958
130 3.14 0.46 962 24 986
Dewatering of D Pit continued until November 1982, when filling began. However, during
the spring of the following year, a nearby creek overflowed and filled D Pit in 24 hours. A berm was
later built to prevent creek water from entering the pit. Monitoring of the flooded pit began in 1983.
Results through 1988 are reported by Saskatchewan Environment (1990) and partial results through
1992 are reported by Saskatchewan Environment (1993).
D pit lies in a faulted metamorphic zone which reportedly contains uraninite, selenides, gold,
tellurides, nickel-sulfur arsenides, jordiste, minor pyrite, and chalcopyrite. The north wall of D Pit
above water level exposes 10 meters of rock composed of garnet-rich aluminous gneiss with seven
fault zones. The dominant fault zone is F-1 which contains a one-meter thickness of clays, slightly
mineralized breccias, and gersdorffite and is assumed to extend to the base of the pit. F-1 has been
identified as a source of metals for pit water.
A portion of the east side of the pit is covered with dumped waste rock, which has also been
identified as a source of metals to pit water. On the south and west sides, no rock is exposed above

MINEWALL 2.0: Literature Review and Conceptual Models 73
the water level. Iron precipitant on the overburden in the southeast wall indicates groundwater is
entering the pit there and apparently exiting through the southwestern wall of overburden.
The cold, boreal climate at Cluff Lake produces cool, short summers and long, cold winters
with relatively dry subhumid moisture. Mean monthly temperatures are usually below zero from
November to April. Total annual precipitation is approximately 400 mm. Evaporation occurs
primarily from May through September, and potential evaporation exceeds total precipitation based
on data from an evaporation pan. The average precipitation and evaporation represent about 3.8%
and 6.5% of the pit volume, respectively.
Ice cover usually appears around October 20-30 and open water usually appears around April
17 to May 9. Snowmelt from the surrounding watershed causes a volume of water exceeding 1000
m to flow into the pit, causing the pit to overflow.3
All surface water and groundwater around D Pit is generally westward towards Cluff Lake.
Most of the groundwater is believed to move through the shallow overburden due to its elevated
hydraulic conductivity (1 to 5 x 10 m/s) over the fractured bedrock (2 x 10 to less than 2 x 10⁻⁴ -7 -9
m/s). The relationship between groundwater and pit water is discussed in more detail later in this
section.
Based on mine surveys, pit volumes and lateral areas were determined for specific depth
intervals (Table 5-10). At the overflow elevation of 332.5 m, the pit contained an estimated 177,400
m . 3
Monitoring of pit-water chemistry commenced in March 1986 at five sampling locations.
At each location, depth-specific samples were collected at five-meter intervals. The depth-specific
monitoring ceased in December 1988 and was replaced by periodic sampling of the top of the water
column. Beginning in March 1992, depth-specific sampling was again initiated.

MINEWALL 2.0: Literature Review and Conceptual Models 74
TABLE 5-10Depth-Specific Areas and Volumes for D Pit
(from Saskatchewan Environment, 1993)
Elevation Depth Area Volume Cumulative Percent of (masl) (m) (m ) (m ) Volume (m ) Total Volume2 3 3
332.5 0.0 16,565 8,081 177,383 4.6%
332.0 0.5 15,561 36,190 169,302 20.4
329.5 3.0 13,191 56,482 133,112 31.8
324.5 8.0 9,402 40,589 76,629 22.9
319.5 13.0 6,833 24,867 36,040 14.0
314.5 18.0 3,113 10,412 11,172 5.9
309.5 23.0 1,051 632 760 0.4
In addition to pit water, samples were also collected of runoff from the nearby waste rock into the
pit, the nearby Boulder Creek, groundwater located 500 m upgradient and 400 m downgradient of
the pit, water and rock within the F1 fault, and pit-bottom sediment.
Some of the conclusions reached by Saskatchewan Environment, based on the pit-water
chemistry, were as follows. First, a thermocline formed during early spring and summer. As winter
approached an ice cover forms and the thermal gradient approaches equilibrium across the water
column. Second, major ions, metals and radionuclides concentrated at depth after spring runoff and
rainstorm events. Third, the sources of the contaminants were likely seepage from the waste rock
dump and dissolution of materials in the faults and wall rock along the north side of the pit. Another
potential source that required further study was the possible resuspension of bottom sediments into
the water column due to spring and fall turnover.
A sample of bottom sediments obtained with an Eckman dredge showed that the sediment
was predominately composed of silicon, aluminum, and iron (Table 5-11). Under the assumptions
that silicon occurs as silicon dioxide (quartz or an amorphous phase), and aluminum and iron occur
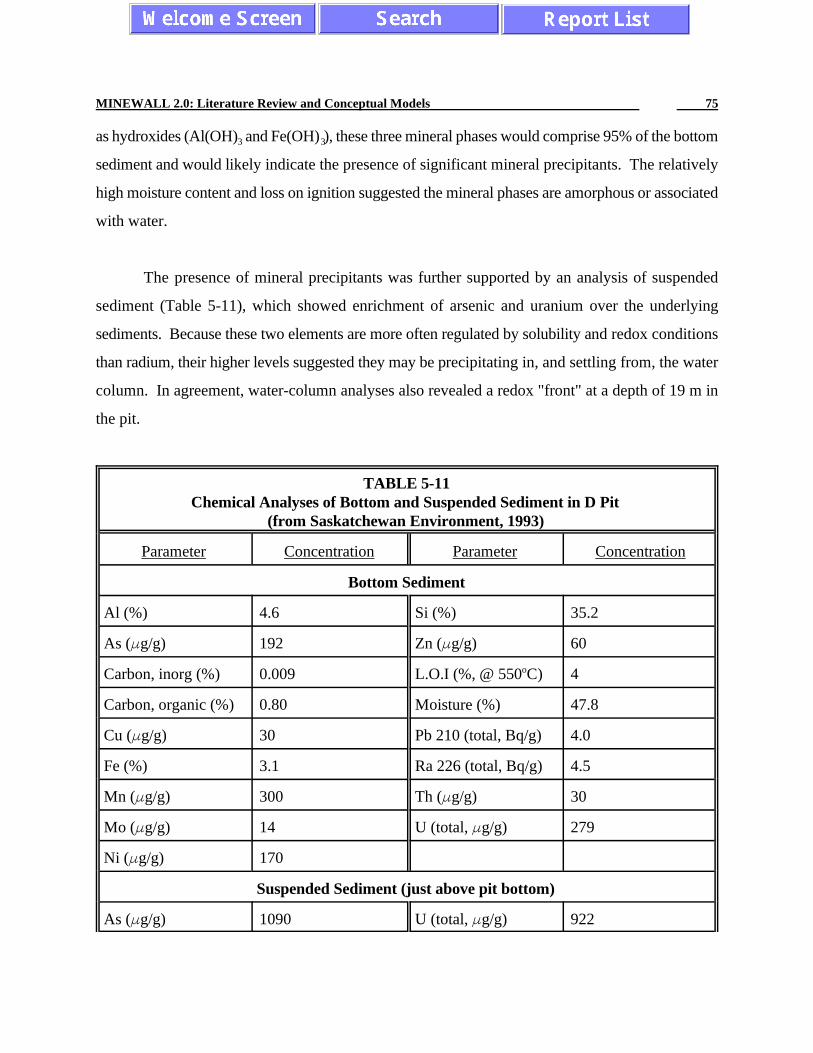
MINEWALL 2.0: Literature Review and Conceptual Models 75
as hydroxides (Al(OH) and Fe(OH) ), these three mineral phases would comprise 95% of the bottom3 3
sediment and would likely indicate the presence of significant mineral precipitants. The relatively
high moisture content and loss on ignition suggested the mineral phases are amorphous or associated
with water.
The presence of mineral precipitants was further supported by an analysis of suspended
sediment (Table 5-11), which showed enrichment of arsenic and uranium over the underlying
sediments. Because these two elements are more often regulated by solubility and redox conditions
than radium, their higher levels suggested they may be precipitating in, and settling from, the water
column. In agreement, water-column analyses also revealed a redox "front" at a depth of 19 m in
the pit.
TABLE 5-11Chemical Analyses of Bottom and Suspended Sediment in D Pit
(from Saskatchewan Environment, 1993)
Parameter Concentration Parameter Concentration
Bottom Sediment
Al (%) 4.6 Si (%) 35.2
As ( g/g) 192 Zn ( g/g) 60
Carbon, inorg (%) 0.009 L.O.I (%, @ 550 C) 4o
Carbon, organic (%) 0.80 Moisture (%) 47.8
Cu ( g/g) 30 Pb 210 (total, Bq/g) 4.0
Fe (%) 3.1 Ra 226 (total, Bq/g) 4.5
Mn ( g/g) 300 Th ( g/g) 30
Mo ( g/g) 14 U (total, g/g) 279
Ni ( g/g) 170
Suspended Sediment (just above pit bottom)
As ( g/g) 1090 U (total, g/g) 922

D PIT STUDYSULFATE CONCENTRATIONS IN GROUNDWATER THROUGH TIME
DATE (YEAR)78 80 82 84 86 88 90
0
10
20
30
40
50
60
70
80Legend
UpstreamUpstreamPerimeterPerimeter
MINEWALL 2.0: Literature Review and Conceptual Models 76
FIGURE 5-11. Temporal Trend of Sulfate inGroundwater Around D Pit (500 mUpgradient and Pit Perimeter).
Ra 226 (total, Bq/g) 7.0
Prior and during mining of D Pit, piezometers were installed about 500 m upgradient of D
Pit, on the southwest perimeter, and 400 m downstream. The two piezometers on the southwest
perimeter were likely located in the water-table drawdown caused by excavation and pumping of the
pit during mining (Section 5.1). As a result, these two piezometers probably reflected the chemistry
of groundwater drawn into the pit until it filled in April of 1983.
A comparison of sulfate concentrations between the upstream and perimeter piezometers
show the effect of mining (Figure 5-11). Shortly after the pit flooded in April 1983, the sulfate
concentrations began decreasing to background values. The source of the sulfate could be Boulder
Creek, since the two piezometers lie between the creek and the pit, or oxidation of sulfide-bearing
minerals. However, because Boulder Creek reportedly carried less than 10 mg/L of sulfate, the more
likely source was mineral dissolution. Interestingly, this impact on water chemistry occurred outside
the pit perimeter and thus either groundwater was still migrating away from the pit during mining
or, more likely, the drawdown of the water table and the resulting entry of oxygen reached several
meters beyond the pit perimeter. This was also noted in Section 5.4 of this review.

MINEWALL 2.0: Literature Review and Conceptual Models 77
There was a 1-2 year delay in the decrease of sulfate in the farther perimeter piezometer
(roughly 10 m from the pit edge) relative to the closer piezometer on the pit edge. Additionally, two
of three piezometers located 400 m downgradient of the pit showed a peak and then a decrease in
sulfate about 3 years after the pit-edge piezometer. With the reported land-surface gradient, the
highest reported hydraulic conductivities for the overburden, and an assumed porosity of 0.3, the
downgradient piezometers should respond to non-retarded species about 4 years after the pit-edge
piezometer, in agreement with the observed time. Thus, these downgradient piezometers were
apparently installed in overburden. However, the 1-2 year delay in the perimeter piezometer
suggested it was completed in a strata of relatively low permeability of about 2-5 x 10 m/s. This-5
range was less than overburden, but greater than rock.
5.11 Myra Falls Operations, British Columbia, Canada
As part of closure planning, Northwest Geochem (1992) conducted a detailed hydrogeologic
assessment of the upper levels of the Lynx Underground at the Myra Falls Operations (Figure 5-12).
Each of eight upper levels were examined once to measure pH and estimate flow from stopes,
drillholes, fractures, and along the mine floor (e.g., Figure 5-13), similar to work at the Bunker Hill
Mine (Section 5.9).
On selected levels, weirs were installed on the mine floor and periodically monitored for flow
and water chemistry (Figure 5-14). This allowed mass-balance calculations along the length of the
mine floor to locate specific areas of diffuse (non-apparent) gain and loss of water (Figure 5-15).
Based on the diffuse gains of water on several levels, a bulk hydraulic conductivity of 1x10 m/s was-6
calculated for the rock under an assumed hydraulic gradient of 1.0. Within 100 m of the portals,
inside the perimeter of the pit that lies above the workings, diffuse gains suggested that hydraulic
conductivity increased by one order of magnitude.
Interestingly, this study highlighted the potential for erroneous interpretations based solely

MINEWALL 2.0: Literature Review and Conceptual Models 78
on flow and chemistry at a portal (Figure 5-16). The Level 8 Portal suggested that, as flow increased
during early winter months, there was a flushing of accumulated acidity from the level and pH then
recovered as flow increased. In reality, most of the flow originating on Level 8 was pH-neutral
through the period, but each of two stopes bottoming on Level 8 were generating flows at volumes
equivalent to those monitored at the portal. In other words, flow was twice as great on portions of
Level 8 than indicated by portal flow. The loss of flow between the stopes and the portal was
primarily down a raise that connected to the lower Level 9 just before

FIGURE 5-12. Composite Map of Upper Levels of the Lynx Underground, Myra Falls Operations.

FIGURE 5-13. Monitoring Campaign for Flow and pH on Level 8, Myra Falls Operations.

FIGURE 5-14. Periodic Monitoring of Flow and pH at Weirs on Level 8, Myra Falls Operations.

MINEWALL 2.0: Literature Review and Conceptual Models 82
FIGURE 5-15. Non-visible Gain and Loss of Minewater Along Level 8 Mine Floor, MyraFalls Operations.

MINEWALL 2.0: Literature Review and Conceptual Models 83
FIGURE 5-16. Monitoring of Flow and pH at Level 8 Portal, Myra Falls Operations.

MINEWALL 2.0: Literature Review and Conceptual Models 84
the portal. The acidic water from Stope Y mixed with, and overwhelmed, the pH-neutral water as
it flowed towards the portal.
As portal flow and each stope flow continued to increase towards 1500 L/minute in
December (Figure 5-16), most of the acidic flow from Stope Y (pH 2.33) reversed and poured down
a raise further back in the level, causing pH to rise at the portal. This hydraulic behavior could not
have been deduced from the portal data alone.
Based on water and chemical balances, and of spatial distributions of minewater pH on
various levels, Northwest Geochem concluded that there were two primary causes of acidic drainage
from the workings. First, stagnation of water on a level allows it to accumulate acidity and
eventually become acidic. The most acidic pH was measured on an abandoned level with no visible
flow. Second, there was a zone of rock with a lateral extent of roughly 10,000 m that was often2
associated with depressed pH, even in moving water. This zone extended diagonally downwards
from one level to the next. The aforementioned acidic Stope Y was located in this zone. Such a
zone may also exist at the Bunker Hill Mine based on the pattern of pH < 3 in Figure 5-9.

MINEWALL 2.0: Literature Review and Conceptual Models 85
6. CONCLUSION
This report, entitled Literature Review and Conceptual Models, is one of four documents
describing the MINEWALL 2.0 technique and computer program for predicting water chemistry in
pits and underground workings ("mines"). These predictions can be made for both Operational and
Closure Phases of a mine.
Based on case studies and general theory, conceptual models of water movement through
mines were developed in Section 2. The conceptual models for chemistry associated with flow were
then developed in Section 3. Simplified equations for predicting minewater chemistry were
developed in Section 3.1, and complicating factors were clarified in Sections 3.2 and 3.3. Flexibility
was emphasized in all conceptual models so that the models, the technique, and the computer
program could be adapted to virtually any minesite.
Although the conceptual models were based on many decades of previous work, they were
presented first so that various lessons learned from previous work would be more obvious as they
were presented in Sections 4 and 5. In particular, Section 4 briefly described three field studies
closely adhering to the MINEWALL technique. These studies were discussed in the companion
report, Application of MINEWALL 2.0 to Three Minesites. Section 5 described many studies, but
none contain all information to perform a reasonably detailed simulation with MINEWALL.
In addition to this Literature Review, there are three other related reports. These are (1) the
User's Manual for the computer program, (2) the Programmer's Notes and Source Code, and (3)
Application of MINEWALL 2.0 to Three Minesites. These reports should be consulted for
additional details not presented in this document.

MINEWALL 2.0: Literature Review and Conceptual Models 86
7. REFERENCES
Armstrong, D. 1982. Problems associated with the rapid dewatering of a multilayered aquifer andmining of a trial coal pit at Bowmans, South Australia. IN: Proceedings of the FirstInternational Mine Water Congress of the International Mine Water Association, April 19-24, Budapest, Hungary, Section B, p. 354-372.
Bocker, T., and B. Vizy. 1982. Protection against underground waters of bauxite mining at Nyirad,Hungary, and its impact on the environment. IN: Proceedings of the First International MineWater Congress of the International Mine Water Association, April 19-24, Budapest,Hungary, Section C, p. 5-26.
Brealey, S.C. 1965. Groundwater control in opencast mining. IN: Opencast Mining, Quarrying,and Alluvial Mining, p.309-415. The Institution of Mining and Metallurgy, London.
Cathles, L.M. 1982. Acid Mine Drainage. Earth and Mineral Sciences, 51, p.37-41.
Davis, A., and D. Ashenberg. 1989. The aqueous geochemistry of the Berkeley Pit, Montana.Applied Geochemistry, 4, p.23-36.
Dudgeon, C.R. 1986. A study of the effects of mining on a groundwater flow regime. IN:Proceedings of the International Conference on Groundwater Systems under Stress, May 11-16, Brisbane, Australia, p.419-429.
Emrich, G.H., and G.L. Merritt. 1969. Effects of mine drainage on ground water. Ground Water,7, p.27-32.
Equity Silver Mines Ltd. 1989. Assessment of Acid Mine Drainage Control Measures andResultant Impact on Streams Draining the Equity Silver Minesite, 1988. AnnualReclamation Report, 1988.
Evans, R.S. 1987. A regional groundwater model for open cut coal winning in the Latrobe Valley,Victoria. IN: Proceedings of the International Conference on Groundwater Systems underStress, May 11-16, Brisbane, Australia, p.555-564.
Ferguson, K.D., and K.A. Morin. 1991. The prediction of acid rock drainage - Lessons from thedatabase. IN: Proceedings of the Second International Conference on the Abatement ofAcidic Drainage, Montreal, Quebec, September 16-18, Volume 3, p.85-106.
Goodman, A.E., A.M. Khalid, and B.J. Ralph. 1981. Microbial Ecology of Rum Jungle. II:Environmental Study of Two Flooded Opencuts and Smaller Associated Water Bodies.Australian Atomic Energy Commission Establishment, Report AAEC/E-527.

MINEWALL 2.0: Literature Review and Conceptual Models 87
Henkel, C.H.R.F., and J.F. Alcock. 1988. Rum Jungle Mine Rehabilitation Project: Whites OpenCut and Intermediate Open Cut Water Quality, 1986-1987. Power and Water AuthorityReport 97/1988, Northern Territory, Australia.
Hofedank, R.H. 1979. Computation of and experience on lignite opencast mine drainage. IN: G.O.Argall, Jr., and C.O. Brawner, eds., Mine Drainage: Proceedings of the First InternationalMine Drainage Symposium, Denver, May, p.383-408. Miller Freeman Publications Inc., SanFrancisco.
Horne, I.A. 1993. The development of a closure plan for Island Copper Mine. IN: Proceedings ofthe 17th Annual Mine Reclamation Symposium, Port Hardy, British Columbia, May 4-7,p.99-107. Mining Association of British Columbia.
Hutt, N.M., and K.A. Morin. 1994. Assessment of the Underground Disposal of Tailings. AECBReport 5.147.1.
Island Copper Mine. 1994. Closure Plan.
Jakubick, A.T., R. Klein, M.N. Gray, L.D. Keil. 1989. Characteristics of the excavation responsezone as applied to shaft sealing. IN: Proceedings of an NEA Workshop on ExcavationResponse in Geological Repositories for Radioactive Waste, Winnipeg, April 26-28, p.157-174. Atomic Energy of Canada Limited.
Jambor, J.L., and D.W. Blowes, eds. 1994. The Environmental Geochemistry of Sulfide Mine-Wastes. Mineralogical Association of Canada, Nepean, Ontario, Volume 22, May. 438 p.
Kipp, J.A., F.W. Lawrence, and J.S. Dinger. 1983. A conceptual model of ground-water flow inthe eastern Kentucky coal field. IN: D.H. Graves and R.W. DeVore, eds., Proceedings of the1983 Symposium on Surface Mining, Hydrology, Sedimentology, and Reclamation,University of Kentucky, November 27-December 2, p.543-548.
Lang, P.A. 1989. Room 209 excavation response test in the underground research laboratory. IN:Proceedings of an NEA Workshop on Excavation Response in Geological Repositories forRadioactive Waste, Winnipeg, April 26-28, p.295-329. Atomic Energy of Canada Limited.
Lopaschuk, R.S. 1979. Drainage control and mine dewatering at Faro open pit mine. IN: G.O.Argall, Jr., and C.O. Brawner, eds., Mine Drainage: Proceedings of the First InternationalMine Drainage Symposium, Denver, May, p.233-257. Miller Freeman Publications Inc., SanFrancisco.
McArthur, D.R., and R. Gallinger. 1994. Bell Mine Closure Plan. IN: Proceedings of theEighteenth Annual British Columbia Mine Reclamation Symposium, April 11-14, Vernon,British Columbia, p.118-133.

MINEWALL 2.0: Literature Review and Conceptual Models 88
McCurry, G.N., and H.W. Rauch. 1986. Characterization of ground water contamination associatedwith coal mines in West Virginia. IN: Proceedings of the Sixth National Symposium andExposition on Aquifer Restoration and Ground Water Monitoring, National Water WellAssociation, May 19-22, The Ohio State University, p.669-685.
Morin, K.A. 1990. Acid Drainage from Mine Walls: The Main Zone Pit at Equity Silver Mines.Report for the British Columbia Acid Mine Drainage Task Force and the Mine EnvironmentNeutral Drainage (MEND) Program.
Morin, K.A., and N.M. Hutt. 1994. An empirical technique for predicting the chemistry of waterseeping from mine-rock piles. IN: Proceedings of the Third International Conference on theAbatement of Acidic Drainage, Pittsburgh, Pennsylvania, USA, April 24-29, Volume 1,p.12-19.
Morin, K.A., and N.M. Hutt. 1993a. Mine Rock and Tailings Geochemistry and Prediction ofWater Chemistry. Support Document E, Bell 92 Closure Plan. 384 p.
Morin, K.A., and N.M Hutt. 1993b. The use of routine monitoring data for assessment andprediction of water chemistry. IN: Proceedings of the 17th Annual Mine ReclamationSymposium, Port Hardy, British Columbia, May 4-7, p.191-201. Mining Association ofBritish Columbia.
Morin, K.A., N.M. Hutt, and R. McArthur. 1995. Statistical assessment of past water chemistry topredict future chemistry at Noranda Minerals' Bell Mine. IN: Proceedings of Mining and theEnvironment, Sudbury, Ontario, May 28 - June 1.
Morin, K.A., I.A. Horne, and D. Riehm. 1994a. High-frequency geochemical monitoring of toeseepage from mine-rock dumps, BHP Minerals' Island Copper Mine, British Columbia. IN:Proceedings of the Third International Conference on the Abatement of Acidic Drainage,Pittsburgh, Pennsylvania, USA, April 24-29, Volume 1, p.346-354.
Morin, K.A., E. Gerencher, C.E. Jones, and D.E. Konasewich. 1991. Critical Literature Review ofAcid Drainage from Waste Rock. MEND Report 1.11.1, CANMET, Natural ResourcesCanada, Ottawa.
Morth, A.H., E.E. Smith, and K.S. Shumate. 1972. Pyrite Systems: A Mathematical Model.Contract Report for the U.S. Environmental Protection Agency, EPA-R2-72-002.
Noranda Minerals Inc. 1993. Closure Plan: Summary and ten Support Documents
Nordstrom, D.K., T. Olsson, L. Carlsson, and P. Fritz. 1989. Introduction to the hydrogeochemicalinvestigations within the international Stripa Project. Geochimica et Cosmochimica Acta,53, pp.1717-1726.

MINEWALL 2.0: Literature Review and Conceptual Models 89
Northern Territory Department of Mines and Energy (Australia). 1986. The Rum JungleRehabilitation Project: Final Project Report.
Northwest Geochem. 1992. Physical and Chemical Hydrogeology of the Lynx Area of the WestminMyra Falls Operations. Report submitted to British Columbia Government as part of ClosurePlanning.
Norton, P.J. 1982. Advance dewatering and control of groundwater in surface coal mining. IN:Proceedings of the First International Mine Water Congress of the International Mine WaterAssociation, April 19-24, Budapest, Hungary, Section B, p. 517-530.
Oertel, A.O., and W.C. Hood. 1983. Changes in ground water quality associated with castoverburden in southwest Perry County, Illinois. IN: D.H. Graves and R.W. DeVore, eds.,Proceedings of the 1983 Symposium on Surface Mining, Hydrology, Sedimentology, andReclamation, University of Kentucky, November 27 - December 2, p.73-79.
O'Steen, W.N., and H.W. Rauch. 1983. Effects of coal mining on ground-water quality in WestVirginia. IN: D.H. Graves and R.W. DeVore, eds., Proceedings of the 1983 Symposium onSurface Mining, Hydrology, Sedimentology, and Reclamation, University of Kentucky,November 27-December 2, p.355-363.
Patterson, R.J. 1990. Mine closure at Equity Silver Mines Ltd. IN: Acid Mine Drainage -Designing for Closure, Geological Association of Canada/Mineralogical Association ofCanada Conference, Vancouver, British Columbia, May 16-18, p.441-449.
Pentz, D.L. 1979. Case examples of open pit drainage. IN: G.O. Argall, Jr., and C.O. Brawner,eds., Mine Drainage: Proceedings of the First International Mine Drainage Symposium,Denver, Colorado, May, p.324-341. Miller Freeman Publications Inc., San Francisco.
Pusch, R. 1989. Alteration of the hydraulic conductivity of rock by tunnel excavation. InternationalJournal of Rock Mechanics and Mining Sciences & Geomechanical Abstracts, 26, p. 79-83.
Ross, A., S. Matte, and F. Belle-Isle. 1994. Monitoring the Solbec Pit: first year observations.Preprint for the Third International Conference on the Abatement of Acidic Drainage,Pittsburgh, Pennsylvania, USA, April 24-29.
Saskatchewan Environment and Resource Management. 1993. Environmental Monitoring of theFlooded D-Pit at Cluff Lake, Saskatchewan. Government report.
Saskatchewan Environment and Public Safety. 1990. Environmental Monitoring of the Flooded"D" Pit at Cluff Lake, Saskatchewan. Government report.
Seweryn, L. 1982. Large open-pit drainage system and its effect on environment. IN: Proceedingsof the First International Mine Water Congress of the International Mine Water Association,

MINEWALL 2.0: Literature Review and Conceptual Models 90
April 19-24, Budapest, Hungary, Section C, p. 115-128.
Singh, R.N., and S.M. Reed. 1988. Mathematical modelling for estimation of minewater inflow toa surface mining operation. International Journal of Mine Water, v. 7, no. 3, September, p.1-34.
St-Arnaud, L.C., and S.R. Aiken. 1991. Hydrogeology and geochemistry of the Brunswick MiningNo. 6 Open Pit Mine Site. IN: Proceedings of the Second International Conference on theAbatement of Acidic Drainage, Montreal, Quebec, September 16-18, Tome 1, p.400-420.
Stevens, C., G. Lawrence, C. Rogers, and P. Hamblin. 1994. Modeling the thermal stratificationof water filled mine pits. IN: Proceedings of the Eighteenth Annual British Columbia MineReclamation Symposium, Vernon, British Columbia, April 11-14, p. 109-117.
Straskraba, V., and L.E. Kissinger. 1982. Dewatering of the Jenkins open pit uranium mine. IN:Proceedings of the First International Mine Water Congress of the International Mine WaterAssociation, April 19-24, Budapest, Hungary, Section B, p. 559-577.
Sumer, S.M., J.J. Elton, and J.A. Tapics. 1987. Dewatering optimization using a groundwater flowmodel at the Whitewood open-pit coal mine, Alberta. IN: Geotechnique in ResourceDevelopment, Preprint Volume, 40th Canadian Geotechnical Conference, October 19-21,Regina, p.79-87.
Sumioka, S.S. 1991. Quality of Water in an Inactive Uranium Mine and Its Effects on the Qualityof Water in Blue Creek, Stevens County, Washington, 1984-1985. U.S. Geological SurveyWater-Resources Investigations Report 89-4110. 62 p.
Toran, L., and K.R. Bradbury. 1988. Ground-water flow model of drawdown and recovery near anunderground mine. Ground Water, 26, p.724-733.
Trexler, B.D., Jr., D.R. Ralston, W. Renison, and R.E. Williams. 1974. The hydrology of an acidmine problem. IN: Water Resources Related to Mining, Proceedings No. 18, AmericanWater Resources Association, June 1974, p.32-40.
Trexler, B.D., Jr. 1979. Hydrogeology of a lead-zinc mine. IN: G.O. Argall, Jr., and C.O. Brawner,eds., Mine Drainage: Proceedings of the First International Mine Drainage Symposium,Denver, Colorado, USA, May 1979, p.552-570.
Water Resources Division. 1986. Rum Jungle Mine Rehabilitation: The Treatment of Whites andthe Intermediate Open Cut Waters. Water Resources Division Report No. 7/1986,Department of Mines and Energy, Northern Territory, Australia.
Williams, R.E., J. Baldwin, and D.R. Ralston. 1979. Coping with mine drainage regulations. IN:G.O. Argall, Jr., and C.O. Brawner, eds., Mine Drainage: Proceedings of the First

MINEWALL 2.0: Literature Review and Conceptual Models 91
International Mine Drainage Symposium, Denver, Colorado, May, p.185-218. MillerFreeman Publications Inc., San Francisco.
Wetzel, R.G. 1983. Limnology. Saunders. 743 p.
Witherspoon, P.A., N.G. Cook, and J.E. Gale. 1981. Geologic storage of radioactive waste: Fieldstudies in Sweden. Science, 211, February 27 1981, pp. 894-900.