Embed Size (px)
Citation preview

Mineralogy and
Cation-Exchange Capacity
of Sediments from
Selected Streams
GEOLOGICAL SURVEY PROFESSIONAL PAPER 433-D
Prepared in cooperation with the ' J, &^
U.S. Atomic Energy Commission
Mineralogy and
Cation-Exchange Capacity
of Sediments from
Selected StreamsBy VANCE C. KENNEDY
TRANSPORT OF RADIONUCLIDES BY STREAMS
GEOLOGICAL SURVEY PROFESSIONAL PAPER 433-D
Prepared in cooperation with the
U.S. Atomic Energy Commission
UNITED STATES GOVERNMENT PRINTING OFFICE, WASHINGTON : 1965
UNITED STATES DEPARTMENT OF THE INTERIOR
STEWART L. UDALL, Secretary
GEOLOGICAL SURVEY
Thomas B. Nolan, Director
For sale by the Superintendent of Documents, U.S. Government Printing Office Washington, D.C. 20402 - Price 25 cents (paper cover)
CONTENTS
Abstract _ _-------______--_______Introduction. _____________________
Purpose and significance of study Plan of study_____ _ _________Previous work _ __ _ __________Acknowledgments __ --------_-
Methods of analysis __ -_-------_-__Sample treatment __ _ __________Exchange capacity. . ____________Mineralogy ____________________
Silt.
Characteristics of the stream waters and stream basins studied__________________________________________
Mineralogy and exchange capacity of stream sediments. _ Discussion of data-_----_--_--_-____________________
Variation in composition and exchange capacity of stream sediments________________
PageDl
112224444466
12
Discussion of data ContinuedVariation in composition and exchange capacity of
stream sediments Continued Page Clay. __--__ _______-_- __-_ - D12
Streams east of the Mississippi River. _ 12 Streams west of the Mississippi River, ex
clusive of California and Oregon._______ 15Streams in California and Oregon.___ __ 15 Amorphous material.____________------_ 16Organic carbon_______--_-_-----_--_--_- 16
Silt. ____________--_-------_-------------- 16Sand_______-_--__ -_- --_------_-- 19
Exchange-capacity variation with grain size withinthe silt-sand range____________ _____ ___ 22
Effect of dispersing agents on exchange capacity ofsand and silt_____--_---_-_----__------------- 22
Effect of exchange capacity of sediments on com position of stream water_______ _____________ 22
Suspended sediment-_________-__------_-_-_- 23Bed sediment________-____-_--_----__------ 25
Conclusions..-_---------------------_-------------- 26References cited_____-________-_--__-_-----___------ 27
ILLUSTRATIONS
FIGURES 1-3. Maps of the conterminous United States showing:
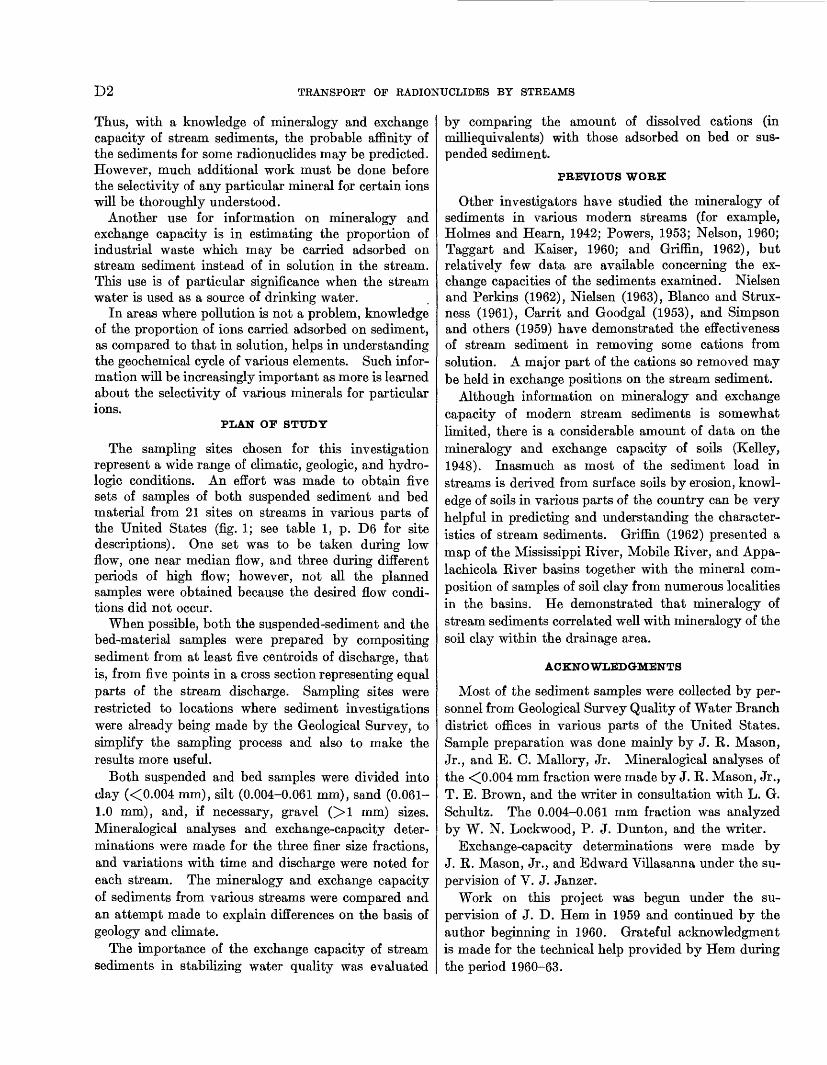
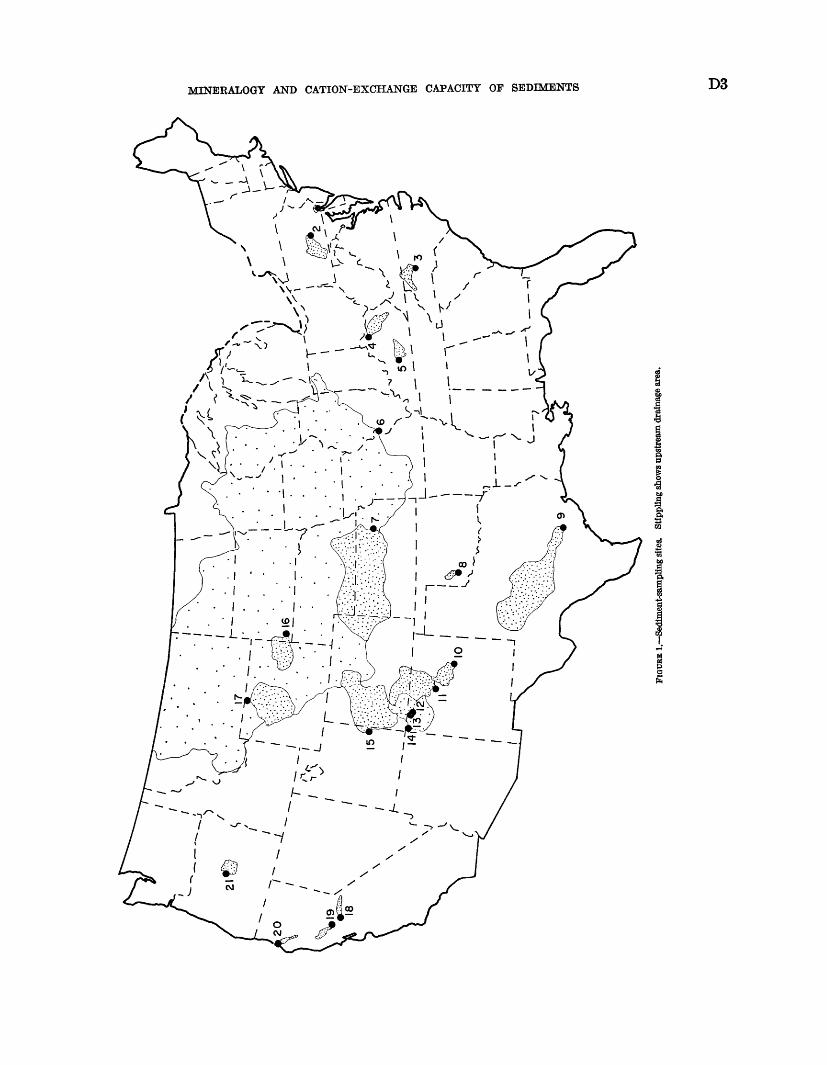
1. Sediment-sampling sites__2. Mineralogy of stream clays._______
Page
D3 10
Page3. Cation-exchange capacity of stream
sand, silt, and clay_.__ __ Dll4. Graph showing cation-exchange
capacity of magnetic fractions of stream sand________________-__ 19
TABLES
rr, ^TABLE 1. Climate of stream basins studied.. __ ___ __ __ _ _ __ _ ____ _ _____ ___ ___ _ ______________ ___ D6
2. Physical and chemical quality of water in streams studied___ __ _ _ ____ ________ _ ... ___ __-__ __ --_ 63. Drainage area and discharge of streams studied... ____ __ __ __ __ _ _ __ _ _ __ ___ _ __ _ _ ___ 74. Geology and topography of stream basins studied____________ __ _______ _ _..__ ___ ._ __ ----- _ ----- 75. Soils within the stream basins studied _ __-___________________.._..________________-___---------_------ 96. Mineralogy and cation-exchange capacity of stream clays __ __ _ ____ _ __ _ _ _ _ __ _______ ___ -- 137. Mineralogy and cation-exchange capacity of stream silts ___ _______ __ ____ _ __ _ _______ _ __.- _ _ _ 178. Comparison of clay minerals in silt fraction as estimated from X-ray and exchange-capacity data ___ _____._-_ 199. Mineralogy and cation-exchange capacity of stream sands __ _ _____-_- _ ______ _ _ __ __ _ ----- _ --- 20
10. Variation of exchange capacity with grain size in some samples of bed sand and silt __ _____ ___ ----- _ 221 1 . Exchange capacities of sand and silt before and after chemical an d mechanical dispersion ___________ 2312. Ratio of cations adsorbed on suspended sediment to cations dissolved in a unit volume of solution __ _ -_._-___ 2413. Thickness of bed sand, silt, or clay required to make adsorbed cations equal to cations dissolved in water above
the streambed __ -----------_-_________._________ _ _ ___ _ __________________---------_ 26ill

TRANSPORT OF RADIONUCLIDES BY STREAMS
MINERALOGY AND CATION-EXCHANGE CAPACITY OF SEDIMENTS FROM SELECTEDSTREAMS
By VANCE C. KENNEDY
ABSTRACT
The mineralogy and cation-exchange capacity (CEC) of sedi ments from 21 streams were determined as part of a continuing investigation of the effect of sediments on the chemical composi tion of stream water. The sediments studied were taken from streams throughout the United States, and represent a great variety of geologic and climatic environments.
Illite, kaolinite, vermiculite, aluminum-interlay ere d clay minerals, and quartz comprise most of the clay-size fraction (<0.004 mm) from five streams in the eastern United States. In streams of central and west-central United States, the clay- size fraction consists mainly of montmorillonite, vermiculite, and mixed-layer clay along with some illite, kaolinite, quartz, feld spars, and carbonates but little, if any, aluminum-inter layered clay minerals. The mineralogy of stream clay in California and Oregon varies widely, probably because of the great range in geologic and climatic conditions.
Sand and silt reflect the lithology of the rocks, as modified by weathering, in each drainage basin. Rock fragments are thoroughly broken down in areas of intense weathering, and stream sand tends to be relatively free of fine-grained rock frag ments. In areas where rocks are fine grained and weathering is less intense, fine-grained rock fragments are important constituents of the stream silt and sand.
The cation-exchange capacity of clay-size fractions in the streams studied ranged from 14 to 28 meq per 100 g in the eastern United States, 25 to 65 meq per 100 g in the central and west-central United States, and 18 to 65 meq per 100 g in California and Oregon. The higher exchange capacities are characteristic of samples containing high proportions of montmorillonite and (or) vermiculite.
Clay minerals as part of multimineralic grains apparently are responsible for most of the exchange capacity of sand and silt. The CEC of sand ranges from about 0.3 to 13 meq per 100 g, and of silt from about 4 to 30 meq per 100 g.
Cation-exchange capacity commonly increases as grain size decreases, but this relation is not true for many stream sands and silts that contain important percentages of rock fragments. Instead, a minimum CEC is measured in the fine-sand to coarse- silt range where the fewest clay aggregates occur.
The ratio of cations adsorbed on suspended sediment to cations in solution is usually greatest when the concentration of sus pended sediment is highest. This ratio reaches a maximum of 0.8 in the eastern streams studied but may be 3 or more in some
western streams. Under such conditions, the adsorbed cations help stabilize the chemical composition of the water and also constitute a significant part of the cations in transport.
Cations adsorbed on bed sediments may equal or exceed cations in solution above the bed in streams which are less than about 1 foot in depth. In such streams, the exchange capacity of bed sediments also may be an important factor in stabilizing the chemical composition of stream water.
INTRODUCTION
PURPOSE AND SIGNIFICANCE OF STUDY
Sediment is known to affect the chemical composition of stream waters in various ways. Some minerals will dissolve, some may cause precipitation of certain dissolved ions, and others, because of their exchange capacity, may help stabilize the composition of stream water. In 1959 the U.S. Geological Survey, on behalf of the U.S. Atomic Energy Commission, began a recon naissance study of the mineralogy and exchange capacity of modern stream sediments in the United States. The purpose of the investigation was to learn something about the range of mineralogy and exchange capacity and to obtain a better understanding of why mineralogy and exchange capacity vary as they do. Such information permits prediction of conditions in streams not examined and an intelligent selection of factors to be studied first in any investigation of a new area.
Information on range of mineralogy and exchange capacity can be used in estimating the possible uptake by sediments of radioactive ions dissolved in stream water. For example, stream sediments having a high exchange capacity can generally be expected to remove more radioactive ions (such as those discharged as low-level waste from atomic power plants) than those having a low exchange capacity. Some minerals tend to be selective in the ions which they adsorb from solution. The clay mineral illite is an example; it is highly selective for cesium (Tamura and Jacobs, 1960).
Dl
D2 TRANSPORT OF RADIONUCLIDES BY STREAMS
Thus, with a knowledge of mineralogy and exchange capacity of stream sediments, the probable affinity of the sediments for some radionuclides may be predicted. However, much additional work must be done before the selectivity of any particular mineral for certain ions will be thoroughly understood.
Another use for information on mineralogy and exchange capacity is in estimating the proportion of industrial waste which may be carried adsorbed on stream sediment instead of in solution in the stream. This use is of particular significance when the stream water is used as a source of drinking water.
In areas where pollution is not a problem, knowledge of the proportion of ions carried adsorbed on sediment, as compared to that in solution, helps in understanding the geochemical cycle of various elements. Such infor mation will be increasingly important as more is learned about the selectivity of various minerals for particular ions.
PLAN OF STUDY
The sampling sites chosen for this investigation represent a wide range of climatic, geologic, and hydro- logic conditions. An effort was made to obtain five sets of samples of both suspended sediment and bed material from 21 sites on streams in various parts of the United States (fig. 1; see table 1, p. D6 for site descriptions). One set was to be taken during low flow, one near median flow, and three during different periods of high flow; however, not all the planned samples were obtained because the desired flow condi tions did not occur.
When possible, both the suspended-sediment and the bed-material samples were prepared by compositing sediment from at least five centroids of discharge, that is, from five points in a cross section representing equal parts of the stream discharge. Sampling sites were restricted to locations where sediment investigations were already being made by the Geological Survey, to simplify the sampling process and also to make the results more useful.
Both suspended and bed samples were divided into day «0.004 mm), silt (0.004-0.061 mm), sand (0.061- 1.0 mm), and, if necessary, gravel (>1 mm) sizes. Mineralogical analyses and exchange-capacity deter minations were made for the three finer size fractions, and variations with time and discharge were noted for each stream. The mineralogy and exchange capacity of sediments from various streams were compared and an attempt made to explain differences on the basis of geology and climate.
The importance of the exchange capacity of stream sediments in stabilizing water quality was evaluated
by comparing the amount of dissolved cations (in milliequivalents) with those adsorbed on bed or sus pended sediment.
PREVIOUS WORK
Other investigators have studied the mineralogy of sediments in various modern streams (for example, Holmes and Hearn, 1942; Powers, 1953; Nelson, 1960; Taggart and Kaiser, 1960; and Griffin, 1962), but relatively few data are available concerning the ex change capacities of the sediments examined. Nielsen and Perkins (1962), Nielsen (1963), Blanco and Strux- ness (1961), Carrit and Goodgal (1953), and Simpson and others (1959) have demonstrated the effectiveness of stream sediment in removing some cations from solution. A major part of the cations so removed may be held in exchange positions on the stream sediment.
Although information on mineralogy and exchange capacity of modern stream sediments is somewhat limited, there is a considerable amount of data on the mineralogy and exchange capacity of soils (Kelley, 1948). Inasmuch as most of the sediment load in streams is derived from surface soils by erosion, knowl edge of soils in various parts of the country can be very helpful in predicting and understanding the character istics of stream sediments. Griffin (1962) presented a map of the Mississippi River, Mobile River, and Appa- lachicola River basins together with the mineral com position of samples of soil clay from numerous localities in the basins. He demonstrated that mineralogy of stream sediments correlated well with mineralogy of the soil clay within the drainage area.
ACKNOWLEDGMENTS
Most of the sediment samples were collected by per sonnel from Geological Survey Quality of Water Branch district offices in various parts of the United States. Sample preparation was done mainly by J. R. Mason, Jr., and E. C. Mallory, Jr. Mineralogical analyses of the <0.004 mm fraction were made by J. R. Mason, Jr., T. E. Brown, and the writer in consultation with L. G. Schultz. The 0.004-0.061 mm fraction was analyzed by W. N. Lockwood, P. J. Dunton, and the writer.
Exchange-capacity determinations were made by J. R. Mason, Jr., and Edward Villasanna under the su pervision of V. J. Janzer.
Work on this project was begun under the su pervision of J. D. Hem in 1959 and continued by the author beginning in 1960. Grateful acknowledgment is made for the technical help provided by Hem during the period 1960-63.
MINERALOGY AND CATION-EXCHANGE CAPACITY OF SEDIMENTS D3
D4 TRANSPORT OF RADIONUCLIDES BY STREAMS
METHODS OF ANALYSIS
SAMPLE TREATMENT
Suspended and bed samples were divided into clay, silt, sand, and gravel fractions. With few exceptions, the sediment was kept wet from the time of collection until separated into various size fractions. If size separations could not be made shortly after receipt in the laboratory, the sediment was stored at about 15°C. The separation into gravel, sand, and silt- plus-clay fractions was made by wet sieving in tap water. After filtering, the moist silt-plus-clay fraction was placed in distilled water and the mixture was shaken violently by hand. This mixture was then centrifuged to settle the >0.004 mm material. Suspended mate rial was siphoned off and the procedure repeated until virtually all material finer than 0.004 mm had been removed. Each size fraction was air dried and stored until mineralogical analyses and exchange-capacity determinations could be made.
EXCHANGE CAPACITY
Exchange-capacity determinations were made by using a slightly modified version of the radioactive- cesium method described by Beetem and others (1962). In essence, the method consists of shaking the sample three times for at least 4 hours in successive aliquots of a 0.5^ solution of cesium chloride, which contains radioactive cesium. This treatment is presumed to saturate the cation-exchange sites with cesium. The sample is washed repeatedly with ethyl alcohol until the washings give no visible precipitate when silver nitrate is added. The radioactivity of the salt-free sample is measured in a well-type gamma scintillation counter, and the amount of cesium adsorbed on the sample is calculated.
Because a part of the cesium may become fixed by illite or vermiculite present in the sample (Barshad, 1950; Tamura and Jacobs, 1960), the cation-exchange capacity measured by the radioactive-cesium method may differ somewhat from that determined by using other cations. Comparison of the cesium method with the ammonium and manganese methods (Beetem and others, 1962) suggests that the cesium-exchange capaci ties may be a few percent higher than those measured by the other two methods.
Many of the samples available for exchange-capacity determinations were less than the optimum amount. As a result, the precision of the analyses was approxi mately ±10 percent.
MINERALOGYCLAY
The mineralogy of the clay-size fraction was deter mined by X-ray diffraction methods. A Norelco wide- range goniometer and nickel-filtered copper radiation were used at a scanning speed of 2° per minute. Fluo- rite was used as an internal standard in a randomly oriented powder to determine the quartz content. Ori ented mounts were prepared on porous tiles which were X-rayed after air drying, after glycollation, after heat ing to 300°C, and after heating to 550°C.
The following criteria were used in identifying the clay minerals present on the oriented mounts. A peak on the diffractometer pattern at about 10 A, which remained after air drying, glycollation, and heating, was considered evidence of the presence of illite. A peak near 14 A in the air-dried sample which moved to about 17 A on glycollation and collapsed to 10 A on heating to 300°C indicated montmorillonite. A peak near 14 A in the air-dried sample which did not move on glycollation but collapsed on heating indicated ver miculite. A peak near 14 A after heating to 550°C was considered indicative of chlorite. A peak at 7 A which collapsed on heating at 550°C indicated kao- linite, unless chlorite was present; the 002 reflection of chlorite can also give a 7-A peak which disappears at 550°C. If chlorite was present, the sample was warmed in QN HC1 at 60°C overnight to remove it (Schultz, 1964, p. 8), and any residual 7-A peak was interpreted as kaolinite. The removal of chlorite by acid treat ment was shown by the absence of a 14-A peak on heating at 550°C.
Mixed layering is indicated by intermediate spacing of the peaks on the diffractometer patterns. Thus, montmorillonite-illite interlayering may produce a separate peak between 10 and 14 A which shifts toward a greater interlayer spacing on glycollation. Com monly, in stream sediments, mixed layering causes a broadening of the 14-A peak for the air-dried sample, and of the 17-A peak on glycollation. Chlorite-illite interlayering can cause a peak between 10 and 14 A or broaden the 10-A or 14-A peaks, but the peaks do not shift appreciably on glycollation or heating.
Aluminum-interlayered clays, or "dioctahedral ver miculite" (described by Brown, 1953; Kich and Oben- shain, 1955; and Tamura, 1958), occur in many streams in the eastern United States and can be distinguished from the minerals discussed above. The rather broad peak produced on the X-ray diffraction pattern by the oriented and air-dried mineral indicates an interlayer spacing of approximately 14 A. This peak does not move on glycollation, but on heating it gradually shifts toward 10 A. Complete collapse to 10 A may not occur, even at 550°C.
MINERALOGY AND CATION-EXCHANGE CAPACITY OF SEDIMENTS D5
Available evidence indicates that the aluminum- interlayered clays may consist of either montmorillonite or vermiculite (Rich, 1960; Sawhney, 1960; Tamura, 1957; Dixon and Jackson, 1959) which has aluminum precipitated in variable quantities in the interlayer space.
Although many of the samples of stream clay were rather poorly crystallized (as indicated by the X-ray diffraction patterns) and commonly contained three to four different clay minerals, an effort was made to estimate the proportion of each clay mineral present. The area of the 10-A peak after glycollation was taken as a reference and was assumed to represent the amount of illite present. The area of the 7-A peak was divided by a factor which ranged from 1 to 2 depending upon the ratio of height to area of the 7-A peak. This ratio is taken as a measure of the degree of crystallinity of the kaolinite (Schultz, 1960, p. 221). When the 7-A peak area was thus corrected, the following equa tion was used to determine the ratio of kaolmite-plus- chlorite to illite:
7-A peak area10-A peak area (glycollated)
Kaolinite -f- chlorite = illite
The relative amounts of chlorite and kaolinite con tributing to the 7-A peak were calculated by using the following equation:
[ 7-A peak height (air dried) _____^ 2/3X14-Apeak height (550°C) Chlorite ~~ 2/3X 14-A peak height (550°C)
The ratio of the 001 peak height to the 002 peak height of chlorite varies depending upon the composi tion of the chlorite. However, for simplicity, the 002 peak height of air-dried chlorite has been considered to be two-thirds the 001 peak height after heating to 550°C.
The proportion of combined montmorillonite, vermic ulite, and mixed-layer clay not containing chlorite was estimated by noting the increase in the 10-A peak area when the oriented clay was heated from the glycollated condition to 300°C. Most montmorillonitic stream clays appeared to contain a significant amount of mixed-layered material, as indicated by the absence of higher order peaks and by the broadening of both the 14-A peak in the air-dried material and the 17-A peak after glycollation.
The proportions of montmorillonite, vermiculite, and mixed-layer clays, excluding chlorite, were estimated on the assumption that the 17-A peak of an oriented, glycol-treated montmorillonite sample is 4-5 times as high as the 10-A peak of the montmorillonite in the same slide after heat treatment (Schultz, 1964, p. 8).
773-593^-65 2
If the 10-A peak after heat treatment increased by more than the height of the 17-A peak divided by 4.5, mixed-layer clay was assumed to be present. The amount of mixed-layer clay was obtained by subtract ing the estimated montmorillonite from the proportion of combined montmorillonite, vermiculite, and mixed- layer clay, exclusive of chlorite, determined as described above. Any vermiculite would, thus, be labeled "mixed-layer" clay.
The content of aluminum-interlayered clays was determined by using the diffraction pattern obtained after heating the oriented specimen to 300°C. The area under the curve in the 11- to 12-A region which did not appear to be a part of the 10-A peak was measured and assumed to represent the proportion of the aluminum-interlayered clays. Any mixed-layer chlorite-illite in this region would be classified as aluminum-interlayered clay. No correction factor was used in comparing this 11- to 12-A area with the 10-A illite peak.
The proportion of vermiculite in the clay-size fraction was difficult to estimate by the method described above because of the presence of aluminum-interlayered clay and (or) mixed-layer clay. After completion of most of the mineralogic analyses, an attempt was made to evaluate the amount of vermiculite present by using other techniques. One sample from each stream was soaked in IN MgCl2 for at least 2 hours and then ex posed to glycerol vapor at 70 °C for at least 4 hours. A separate aliquot of the clay was soaked in IN KC1 solution for at least 2 hours. The K-saturated clays and the glycerolated Mg-saturated clays were then mounted on glass slides for X-ray analysis. The vermiculite present was evaluated on the assumption that Mg-saturated vermiculite should not expand beyond about 14.5 A when treated with glycerol and should collapse to about 10.3 A on potassium saturation (Brown, 1961, p. 315-316; Barshad, 1948; Walker, 1958). Aluminum-interlayered clays should retain an interlayer spacing of about 14-A under potassium saturation (Hathaway, 1955).
The composition of the total clay-size sample was calculated by subtracting the percentage of quartz, feldspar, carbonates, organic matter (estimated by doubling the organic carbon), amorphous material, and other nonclay minerals from 100 percent and then di viding the remaining percentage among the various clay minerals as described above. Even though an effort was made to correct for some variations in the diffracting characteristics of different clay minerals, the results are still only semiquantitative. The data for the nonclay minerals are more precise and are considered more accurate than those for the clay minerals. This

D6 TRANSPORT OF RADIONUCLIDES BY STREAMS
conclusion is reflected in the manner in which the data are presented.
The percentage of quartz, feldspar, carbonates, and other nonclay minerals was estimated by using synthetic standards. Organic carbon was determined as the difference between total carbon and carbonate carbon. Total carbon was determined by pyrometric combustion in an induction-type furnace, and carbonate carbon by the gas evolution method described by Kader and Gri- maldi (1961). Analyses for amorphous silica and alumina were made by the method of Hashimoto and Jackson (1960), as modified by E. C. Mallory, Jr. (written commun.). The "amorphous silica and alu mina" determined may include solution products of very fine-grained clay and poorly crystalline material as well as amorphous alumino-silicate, free silica, free alumina, and gibbsite. Hence, the figure given can be considered as an upper limit on the truly amorphousmaterial present.
SII/T
A representative portion weighing about 1 g was ground mechanically for one-half hour under alcohol. Approximately 450 mg of the ground material was mixed in exactly a 9:1 ratio with about 50 mg of fine-grained synthetic anhydrite, which formed the internal standard during X-ray diffraction analysis. Curves showing the intensity of the major anhydrite peak versus peak in tensities of various common minerals present in known standards were used in determining the mineral com position of the stream silts.
SAND
Stream sand was separated from gravel and silt by wet sieving and then stored dry. A representative split was mounted in plastic and a thin section prepared. After staining potassium-bearing minerals with sodium cobaltinitrite (Gabriel and Cox, 1929; Kosenblum, 1956), the area of the slide occupied by each mineral species was determined petrographically by using a click counter. The volume percentage so determined was corrected to weight percentage by using appropriate specific gravities of each sediment constituent.
TABLE 1. Climate of stream basins studied [Range is given if precipitation or temperature varies widely within the basin.
Weather information is from U.S. Weather Bureau data (1960; 1962) unless other wise indicated]
Stream
No.(fig. 1)
NameSampling location
Approximate average annual
precipitation within the
basin (inches)
Approximate mean annual temperature within the basin (°F)
Eastern United States
1
2 345
Brandywine Creek.
Yadkin River. .Licking River ......
At Wilmington, Del. .....
At Yadkin College, N.C.. At McKinneysburg, Ky. .
144
4147->55
46 47
53
50 50-58
57 57
Central United States
6 7 8 9
10 11
12 13 14 15 16 17
Colorado River ....
Rio Grande River-
San Juan River .... Animas River ...... San Juan River __ Colorado River. ... Cheyenne River ... Big Horn River.
At St. Louis, Mo. .........At Wamego, Kans. ___
At Santa Rosa, N. Mex _ At Otowi Bridge near San
Ildefonso, N. Mex. At Bloomfield, N. Mex... At Fannington, N. Mex.. At Shiprock, N. Mex.....
Near Hot Springs, S. Dak.
<10->40 15-30
25 16-40
14 <8->28
<10->28 <10->28 <8->28 <8->40
<16-24 <8->48
36->55 54 61
60-70 50-58 35-57
36-50 36-50 36-50 34-55
46 40-47
Western United States
18 19 20 21
Cosumnes River ...
Crooked River .. ...
At McConnel, Calif ....... At Yolo, Calif.. _____
16->56 16->32 40-64 8-12
48-62 59 52 46
CHARACTERISTICS OF THE STREAM WATERS STREAM BASINS STUDIED
AND
Considerable knowledge of geology, topography, soil development, climate, vegetation, streamflow variation, and man's activities in a stream basin is needed to understand why sediment carried by the stream is com posed of particular minerals, or why the sediment has a certain exchange capacity. Some of the available information about the streams investigated in this study is summarized in tables 1-5.
i Olmsted and Hely, 1962, p. A-2.
TABLE 2. Physical and chemical quality of water in streamsstudied
tAll published water-quality data were obtained from "Quality of surface waters of the United States," a series of U.S. Geol. Survey Water-Supply Papers. Range of dissolved cations was calculated from chemical analyses of water, or estimated from specific-conductance measurements]
Stream
No. (fig. 1)
Name
Range of mean daily suspended sediment concentra tion (ppm)
Period of suspended sedi
ment record considered
Range of dissolved cations
(meq per 1)
Eastern United States
1 2 3 4 5
Yadkin River... __ __
1-1,550 1-1,130 1-2,970 1-4,230
i 1-3, 180
1946-58 1944-53; 1953-58 1951-58 1952-58 _ _ ..1951-59. _ ........
0.70-2.2 .75-4.7 .25-1.3 .90-3.9
* . 58-51
Central United States
6 7 8 9
10 11 12
1314 15 16 17
Colorado River, Tex ......
San Juan River, Bloom- field.
San Juan River, Shiprock Colorado River, Utah .....
35-6, 420 87-8, 660 15-8,080 12-11,600 13-13,800 18-42, 600
58-101, 000
1-36, 100 8-86,000
13-66, 300 <10-55, 000 <5-33,000
1948-57 1956-58 __ . .......1958-61 _____ 1957-63. ______1959-60. __ . ......1948-57. ...........1955-57 ............
1950-57- _____ .1950-57 ____ .1930-52; 1953-57. 1946-58- - .._1946-58
2. 2-18. 5 11.5-41 * 1.5-7. 6 1 2. 3-20
1.7-14 1. 1-27
1.7-22.5 2.0-40+ 3.0-49 7.8-45 4.6-21
Western United States
18 19 20 21
1 8-1, 310 i 7-6, 130 U-4,560 12-1,020
1956-60- _ ... _ .Jan.-Mar. 1959 .... 1957-60 1959-60 _ . ...
10.57-1.2 »2.3-7 1.97-3.3 1.90-2.0
1 Wholly or in part from unpublished data supplied by U.S. Geol. Survey Quality of Water Branch oflices.
2 Oil-field brines flowing into the river beginning in August 1958 greatly increased the concentration of dissolved cations above the normal maximum of about 5.2 meq per 1 (Krieger and Hendrickson, 1960).
> Chemical quality of water at Columbus has been assumed to be similar to that at Wharton, Tex., for which numerous chemical analyses are available.

MINERALOGY AND CATION-EXCHANGE CAPACITY OF SEDIMENTS D7
TABLE 3. Drainage area and discharge of streams studied
[Hydrologic data were obtained from "Surface Water Supply of the United States," a series of U.S. Geol. Survey Water-Supply Papers]
Stream
No. (flg.l)
Name
Drainage area
(sq mi)
Average dis
charge (cfs)
Range of discharge
(cfs)
Average runoff
(inches)
Period of record prior to 1960 Reservoirs and diversions upstream at time of sampling
Eastern United States
12 3 4 5
Juniata River _________Yadkin River.
Green River __________
314 3,3542,280 2,326 1,673
466 4,320 2,896 2,972 2,581
30-17,800 241-209,000 177-94, 300 3. 8-54, 100 39-87, 000
20.2 17.5 20.3 17.4 21
1946-60 1899-1960 _
1924-25; 1938-60 1915-22; 1927-31;
1937-60.
Central United States
67
8 9
10 11
12
1314 15 16 17
Elk Creek __________Colorado River, Tex _____
Rio Grande River ______
San Juan River, Bloomfield
Animas River ___ ___San Juan River, Shiprock. .... Colorado River, Utah .. _....
701,000 55,240
549 41,070
2,650 14, 300
5,410
1,360 12,900 24,100 8,710
15, 765
174,700 4,785
66.5 3,410
153 1,596
1,645
968 2,403 8,057
273 2,255
18,000-1,019,000 73-400,000
0-22,400 93-190, 000
2.7-55,200 60-24, 400
50-20,500
2. 4-25, 000 8-80, 000
558-76,800 2.8-114,000 28-2, 890
3.41.2
1.6 1.1
.78 1.82
4.12
9.62.53 4.54 .42
1.94
1904-08; 1949-60. 1916-60
1912-24; 1928-60 1895-1905; 1909-60
1910-11; 1927-31; 1956-60.
1904-05; 1912-60 1926-60- _1911-60 __ 1946-58 1Q98_fifl
Numerous reservoirs in the Missouri River basin. Many small diversions; Kirwin, Kanopolis, Webster, and
Cedar Bluffs Reservoirs.
Many diversions above dam for irrigation. Flow largely regulated by Lake Travis and Buchanan Reservoir above Austin.
Diversions upstream for irrigating about 12,000 acres. Flow partly regulated by El Vado, Reservoir on Rio Chama
which contributes about 40 percent of flow. Diversions to irrigate 694,000 acres.
Diversions for irrigation of about 52,000 acres above station.
Diversions for irrigation of about 30,000 acres upstream. Many diversions for irrigation. Numerous low dams upstream. Some diversion for irrigation. Boysen Reservoir on Wind River affects flow.
Western United States
18 19
20 21
730 1,137
485 2,160
580 518
1,574 330
0-54, 000 0-41,400
16-77, 800 4-7, 550
10.8 6.2
44 2.14
1941-60- _ ....1903-60 . __
1940-60
Diversions for irrigation of about 2,100 acres upstream. Flow controlled by Clear Lake and by diversions for irriga
tion of 30,000 acres. Diversion for city of Eureka. Many diversions for irrigation.
TABLE 4. Geology and topography of stream basins studied
[Most topographic information from Fenneman (1946)]
Stream
No. (flg.D
NameGeology Topographic province and section Topography
Eastern United States
1
2
4
5
Brandywine Creek. ...
Yadkin River..... ....
Mainly schist and gneiss and lesser quartzite, phyltite, limestone, dolomite, gabbro, anortho- site, and quartz monzonite (Wolman, 1955).
Folded limestone, dolomite, quartzite, sandstone, and shale.
Mica gneiss, granite, diorite, gabbro, mica schist, and lesser areas of hornblende gneiss and schist, quartzite, marble, claystone, sandstone and conglomerate (North Carolina Dept. Conserv. Devel., 1961).
Mostly shale, limestone, and limy shale; some sandstone, siltstone, and conglomerate (Hall and Palmquist, 1960a, 1960b; Kentucky Geol. Survey, 1954).
Mostly siltstone, shale, limestone; a little sand stone (Kentucky Geol. Survey, 1954).
Upland section of the Piedmont province-
Middle section of the Valley and Ridge province.
River heads in the southern section of the Blue Ridge province, but much of the basin lies in the upland section of the Piedmont province.
River rises in Kanawha section of Appa lachian Plateau province and flows through Lexington plain of Interior Low Plateaus.
Highland Rim section of Interior Low Plateaus.
Dissected upland of mature topography and moderate relief.
Even-crested ridges predominate over valleys, Drainage pattern is trellislike.
Subdued mountains.
Mature plateau of strong relief.
Young to mature plateau of moderate relief. Karst topography in lower part of drainage basin.
Central United States
Mississippi River__
Kansas River.
Elk Creek__.
Various types of igneous and metamorphic rocks near the headwaters. Widespread limestone, shale, and sandstone in the main part of the basin (U.S. Geol. Survey, 1932).
Shale and sandstone and lesser areas of calcareous deposits (Kansas State Geol. Survey, 1937).
Shale, sandstone, gypsum, and a little dolomite (Miser, 1954).
Mostly in Central Lowlands and Great Plains provinces, but the Missouri River heads in the Rocky Mountains.
High Plains and Plains Border sections of Great Plains province.
Osage Plains section of the Central Low lands.
Ranges from mountainous near the head waters of the Missouri River to plains in various stages of erosion.
Submature to mature plateau and atemature to old plains.
Old scarped plains beveling faintly inclinedstrata. Main streams are entrenched.
D8 TRANSPORT OF RADIONUCLIDES BY STREAMS
TABLE 4. Geology and topography of stream basins studied Continued
Stream
No.(fig.l)
NameGeology Topographic province and section Topography
Central United States Continued
9 Colorado River, Tex_
10
12
13
14
16
17
Pecos River.
Rio Grande River.....
San Juan River, Bloomfleld.
Animas River.
San Juan Eiver, Shiprock.
Colorado River, Utah-
Cheyenne River-
Big Horn River -
Above Austin, Tex., rocks are mainly limestone and dolomite and some granite, gneiss, schist, sandstone, and shale. Below Austin, sand stone, greensand, lignitic beds, shale, and marl containing tuff occur (U.S. Geol. Survey, 1937; Folk and others, 1961).
Shale, sandstone, and some limestone, gypsum, granite, schist, and quartzite (U.S. Geol. Sur vey, 1928).
Rhyolite, andesite, basalt, quartz latite, tufl, alluvium, and small areas of limestone, sand stone, shale, and gypsum (U.S. Geol. Survey, 1928, 1935).
Mainly shale and sandstone; smaller areas of con glomerate, coaly beds, tuff, andesite, rhyolite, and quartz latite (U.S. Geol. Survey, 1928, 1935).
Sandstone and shale in lower basin but granite, schist, gneiss, slate, quartzite, limestone, dolo mite, sandstone, and shale in upper basin (U.S. Geol. Survey, 1928,1935).
Includes Animas Eiver drainage, San Juan River drainage above Bloomfleld, and additional large areas of shale and sandstone (U.S. Geol. Survey, 1928,1935).
Large areas of sandstone and shale; some andesite, basalt, latite, tuff, rhyolite, gneiss, greenstone, schist, granite, and a little limestone and dolo mite (U.S. Geol. Survey, 1935).
Mainly shale and sandstone; smaller areas of con glomerate and limestone. Much of the shale is carbonaceous and some is bentonitic (U.S. Geol. Survey, 1951; Love and others, 1955).
Mostly shale, sandstone, siltstone, and lesser dolomite, limestone, conglomerate, pyroclastics, granite, and inetasediments. Some shale is bentonitic; other is phosphatic (Love and others, 1955).
Upper drainage is in Edwards Plateau and Central Texas section of Great Plains province. Lower drainage is in Coastal Plain.
River heads in Southern Rocky Moun tains province but lies mostly in Pecos section of Great Plains province.
Mainly in Southern Rocky Mountains province. Lower pa~t in Navajosection of Colorado Plateaus province.
River heads in Southern Rocky Moun tains province with most of the area in the Navajo section of the Colorado Plateaus province.
Similar to San Juan River at Bloomfleld.
Mainly in Navajo section of Colorado Plateaus province but heads in the Southern Rocky Mountains province.
River heads in Southern Rocky Moun tains province, but part of the drainage is in the Uinta Basin and Canyon Lands section of the Colorado Plateaus prov ince.
Missouri Plateau section of Central Low lands province. Part of area is hi Black Hills section.
Mainly Middle Rocky Mountains prov ince, but partly in the Wyoming Basin province.
Upper drainage ranges from young to old plateaus having various amounts of relief. Streams are entrenched in the rolling to level Coastal Plain.
Mostly late mature to old plains heading in complex mountains and mature block mountains of gently tilted strata.
Complex mountains and intermontane basins. Smaller area of young plateaus.
Largely young plateaus.
Do.
Do.
Complex mountains of great relief and young to mature plateaus.
Old plateau, terrace lands, local badlands, isolated mountains, few maturely dis sected domed mountains.
Complex mountains, intennontane basins; some low mountains and elevated plains.
Western United States
19
20
21
Cosumnes River.
Cache Creek-
Mad River.
Crooked River.
Granite, andesite, metasediments; lesser areas of basic metaigneous rocks and ultramafic intru- sives. Lower basin contains sedimentary rocks, mainly sandstone and shale (Jenkins, 1938).
Silty and feldspathic sandstone, shale, altered lava, serpentine, tuff, mafic and ultramafic rocks; some limestone and conglomerate (Jen- kins, 1938; Anderson, 1936; Kirby, 1943).
Information sparse. .Arkosic sandstone and in ter bedded volcanics, shale, conglomerate, chert; some schist, slate, and mafic and ultramafic in- trusives. Chlorite is common constituent in the rocks (Manning and Ogle, 1950).
Largely basalt, andesite and lesser tuff, and rhyo lite flows (Wilkinson and Alien, 1939).
Stream heads in the Sierra Nevada sec tion of Cascade-Sierra Mountains prov ince and flows into the California Trough section of the Pacific Border province.
California Coast Ranges section of Pacific Border province.
.do-
Walla Walla Plateau section of Columbia Plateaus province.
Alpine peaks, great relief, grading into fluviatile plain.
Parallel ranges and valleys on folded and faulted sedimentary, metamorphic, and igneous rocks.
Do.
Rolling plateau having young incised valleys.
In table 1 the approximate average annual precipita tion and approximate mean annual temperature are given for each basin. In areas which are both warm and moist, such as the Yadkin River basin, weathering is relatively rapid. Where either precipitation or tem peratures are low, chemical reactions are slowed and weathering rates are also slow. Inasmuch as weather ing intensity helps determine the mineralogy of soils, one must know something about the climate of an area if he is to understand why certain minerals are found in the soil-erosion products carried by streams.
The concentration of suspended sediment and of dis solved solids tends to be rather low in areas of high rain fall and high in areas of low rainfall. This can be seen
from examination of table 2, and by reference to a report by Rainwater (1962). In the eastern United States, the moisture encourages vegetative cover, and the soil is thus protected from erosion. More water is available than necessary to leach out easily soluble salts from the soil; therefore, the concentration of dissolved solids in stream waters is low. In the arid Southwest, vegetative cover is sparse and occasional intense thunderstorms erode large amounts of soil. This erosion results in high suspended-sediment concentrations. Salts in soil solutions are concentrated by evaporation during the long dry periods and are later leached by rainwater to give large concentrations of dissolved salts.
MINERALOGY AND CATION-EXCHANGE CAPACITY OF SEDIMENTS D9
TABLE 5. Soils within the stream basins studied
[Clay minerals reported are those found in soils within a stream basin or in soils outside the basin but representing a soil series present in the basin]
Stream
No. (iig.D
NameSoil description Clay minerals reported
Brandywine Creek.
Juniata River__.
Yadkin River___
Licking River______
Green River.._____
Mississippi River. Kansas River.....
Elk Creek............
Colorado River, Tex.
Pecos River________. Rio Grande River____. San Juan River, Bloomfield. Animas River_______. San Juan River, Shiprock.. Colorado River, Utah__. Cheyenne River._____.
Big Horn River .
Cosumnes River.
Cache Creek. _.
Mad River_____
Crooked River.
Mostly deep, well-drained silt loam and lesser areas of shallow to deepgravelly silt loam (Olmsted and Hely, 1962).
Thin and poorly developed on steep slopes and ridge crest's, but moderatelywell developed in the broader valleys.
Deep to moderately deep, well-drained clay loam to sandy loam and lesserareas of stony and shallow loam and clay loam (Lee, 1955).
Well drained and medium textured (Winsor and Bailey, 1960)______.
Mostly fine textured and well drained (Winsor and Bailey, 1960)_____.
Wide variety of soil types and drainage conditions. ____________. Wide range in soil type, drainage, and development. Deep, well-drained
soils formed on loess are common in the western part of the basin (McBeeand others, 1961).
Shallow to moderately deep soil ranging from silt loam to fine sand (Gokeand others, 1941; Goke and Hollopeter, 1931).
Wide range in soil type and drainage development..____________.
Data not available.Wide range in soil types. Detailed information not available.
Do. Do. Do. Do.
Large areas of well-drained loam and clay loam and smaller areas of rough, stony badlands (R. C. Kronenberger, U.S. Dept. Agriculture, written commun., 1963).
Surface is largely rough, stony, broken land. Desert, sierozem, and arid brown soils are common at lower elevations (R. C. Kronenberger, U.S. Dept. Agriculture, written commun., 1963).
Well-drained, shallow to deep soils ranging from loamy sands to clay loam(W. M. Johnson, U.S. Dept. Apiculture, written commun., 1963).
Well-drained, shallow to deep soils ranging from clay loam to gravelly loam (W. M. Johnson, U.S. Dept. Agriculture, written commun., 1963).
Well-drained soils ranging from shallow, gravelly loam to deep, silty, clayloam.
Soils data not available.
Kaolinite, illite, chlorite, vermiculite (Kunkle, 1963).
Kaolinite abundant; some vermiculite (M. J. Edwards, U.S. Dept. Agriculture, written commun., 1963).
Kaolinite (M. J. Edwards, U.S. Dept. Agriculture, written commun., 1963).
Kaolinite, vermiculite, mica, and slight montmorillonite (M. J. Edwards, U.S. Dept. Agriculture, written com mun., 1963).
Montmorillonite, illite, kaolinite (Griffin, 1962).Illite, kaolinite, and montmorillonite (Badgleyand Crump-
ton, 1964; Griffin, 1962).
Montmorillonite and illite (J. R. Coover, U.S. Dept. Agriculture, written commun., 1963).
Kaolinite, mica, montmorillonite, and vermiculite (IsaacBarshad and Esther Perry, written commun., 1959).
Vermiculite, montmorillonite, kaolinite, and lesser mica(Isaac Barshad and Esther Perry, written commun.,1959).
Chlorite, vermiculite, kaolinite, mica (Isaac Barshad andEsther Perry, written commun., 1959).
Table 3 shows the great range in area of the stream basins studied and also indicates runoff characteristics. Information regarding reservoirs and diversions are given because they affect both the discharge ancl chemi cal nature of the streams. Reservoirs tend to reduce variations in discharge and chemical composition of stream water, whereas diversions for irrigation com monly result in reduced flow and increased dissolved salt concentrations.
Comparison of average runoff from table 3 with aver age precipitation (table 1) is helpful in indicating the percentage of precipitation available for removing dis solved salts and sediment from a basin.
The geology and topography of the stream basins studied is described in table 4. The information is necessary in understanding what type of material is being weathered and in estimating the potential energy available for mechanical weathering and transportation of sediment.
Because soils are the source of almost all of the sedi ment transported by streams, an understanding of their characteristics is necessary in predicting the mineralogy and size distribution in stream sediments. Table 5 summarizes some of the available data on soil develop ment and mineralogy for the basins which were studied.
MINERALOGY AND EXCHANGE CAPACITY OF STREAM SEDIMENTS
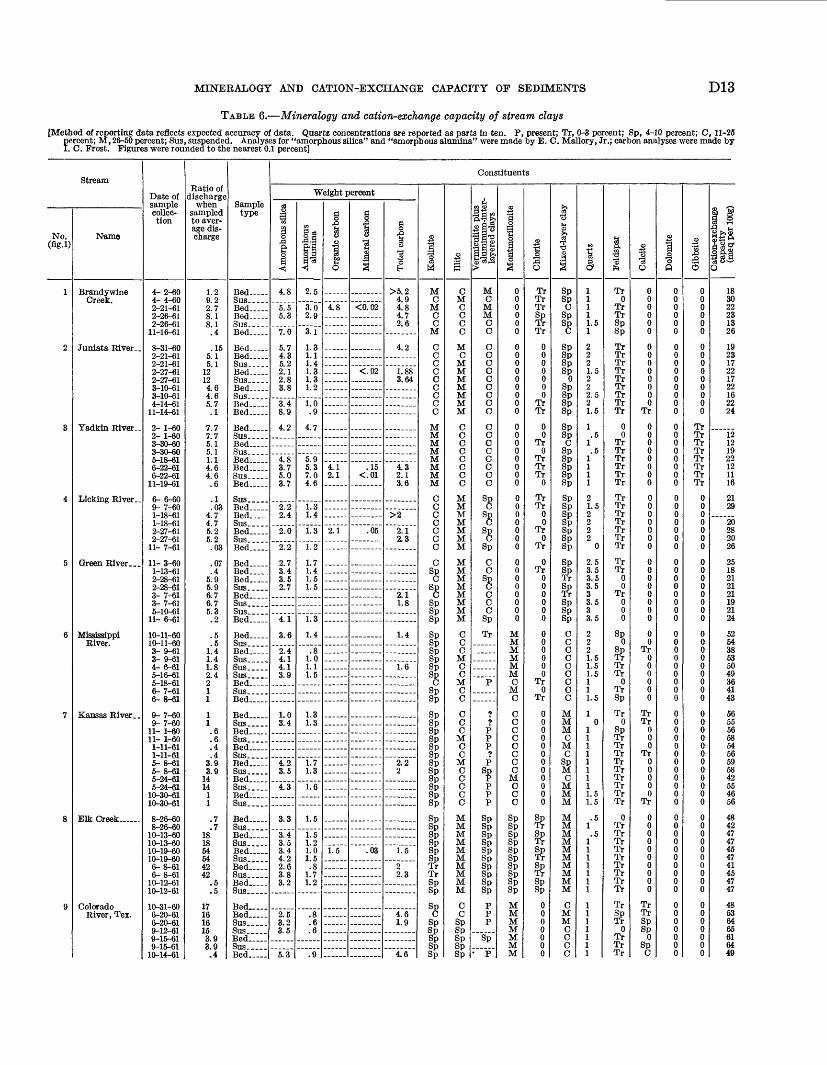
The data on the mineral constituents and exchange capacity of sediments from the 21 streams studied are summarized in tables 6-8. To better visualize the geo graphic distribution of clay minerals in the sediments, a map showing sampling locations and proportions of various constituents of the clay fraction is presented in figure 2. Similarly, the exchange capacities of the sand, silt, and clay fractions are shown as bar graphs on figure 3.
DISCUSSION OF DATA
Surface soil is the source of much of the material transported in solid form by a stream. However, where gullying is prevalent, appreciable amounts of the sub soil may be eroded.
Jackson (1959, p. 133) pointed out that the relative abundance of minerals in soils varies with five principal factors: (1) The characteristics of the minerals in the parent material, (2) the time of weathering, (3) the climate, (4) the relief, and (5) the biota. The first three factors are completely independent, but the relief will be determined largely by the first three factors. The biotic factor, in turn, will be significantly affected by the other four factors.
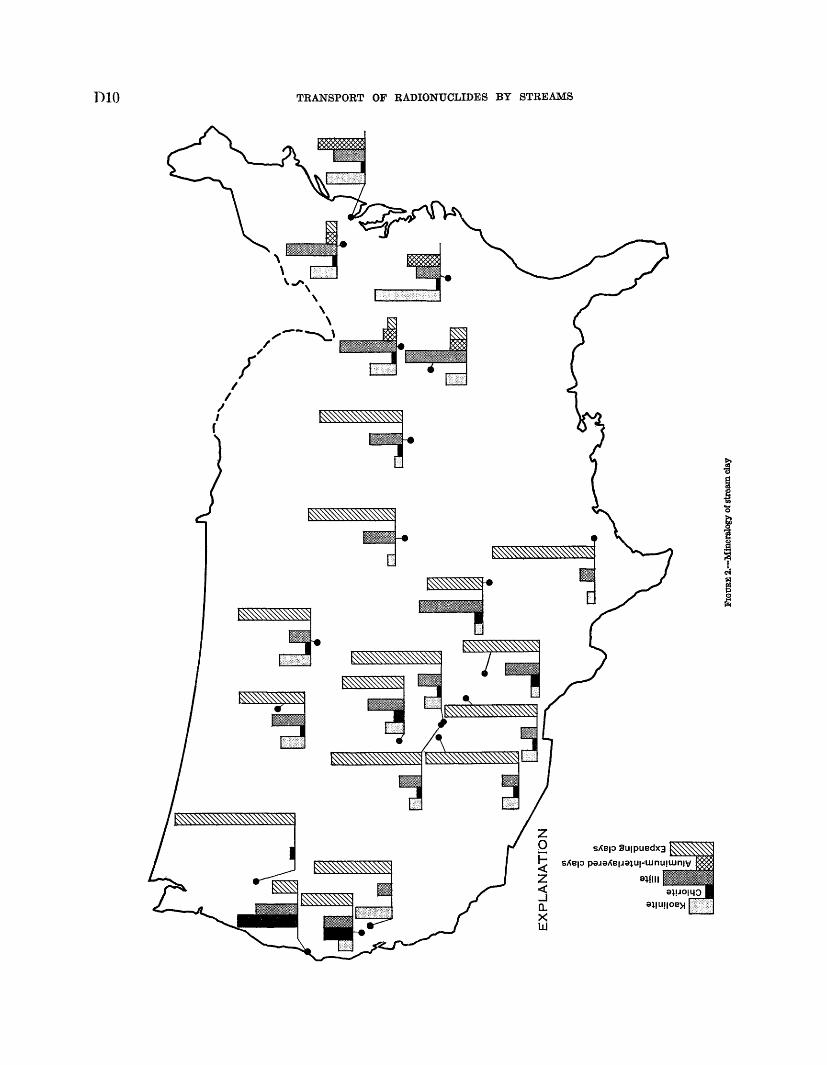
Kaolinite
llljte
Aluminum-interlayered clays
Expanding clays
SHV3HJLS JL3iO J-HOdSJSCVHI,oia
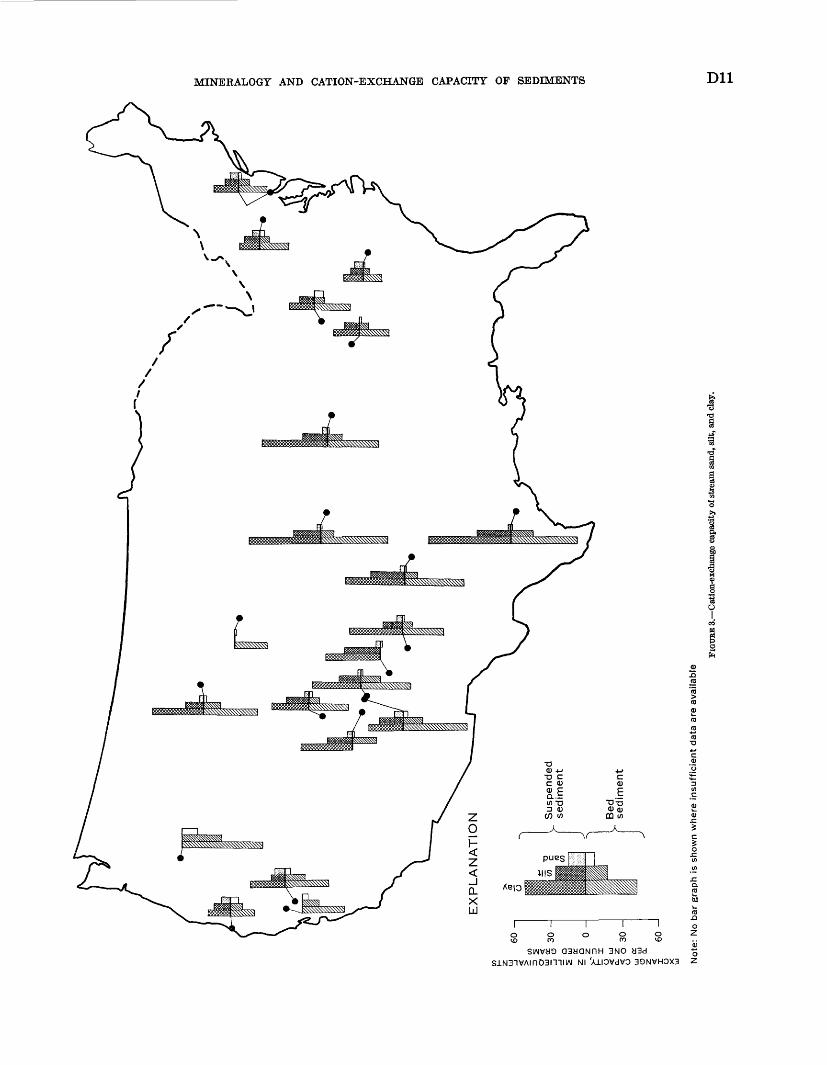
EXCHANGE CAPACITY, IN MILLIEQUIVALENTS PER ONE HUNDRED GRAMS
lid£0 iuovavo aoKVHOxa-NOii-vo QNV
D12 TRANSPORT OF RADIONUCLIDES BY STREAMS
Fine-grained minerals in the soil profile have large surface areas per unit weight and, hence, are more likely to approach equilibrium with their environment than are coarse-grained minerals.
Keller (1956, p. 2695-2704) pointed out that each of the major clay minerals tends to be stable in a charac teristic environment. Thus, kaolin minerals are rela tively stable under the oxidizing and acidic leaching conditions of the warm, humid southeastern United States (Ross, 1943), but montmorillonite is stable in the arid western United States where the soil solutions are alkaline and have a high concentration of salts. It is not surprising, therefore, that high exchange- capacity clay minerals are more common in soils of the West than in the Southeast (Keller, 1955, p. 71; Albrecht, 1947).
Walker (1949) has shown that mica in the soil is leached during weathering to yield an altered mineral having an interlayer spacing of about 10A. In clay- size material, such a mineral would probably be considered illite. Inasmuch as Van Houton (1953) found illite in soils from many parts of the United States, it is at least moderately stable in several different soil environments.
VARIATION IN COMPOSITION AND EXCHANGE CAPACITY OP STREAM SEDIMENTS
Because the streams sampled were so selected that a wide range in the factors influencing soil mineralogy would be represented, considerable variation in min eralogy can be expected. When only a limited amount of sample was available, either mineralogy or exchange capacity was determined first and other tests were performed if material remained.
C:LAY
Information about the composition and exchange capacity of the clay fraction is summarized in table 6. The data are reported according to the expected precision of the results.
STREAMS EAST OF THE MISSISSIPPI RIVER
Samples of clay carried by five streams east of the Mississippi River contain kaolinite, illite, and alu- minum-interlayered clay as the main clay minerals. The Yadkin River clay contains more kaolinite and less illite than the others and has a significantly lower exchange capacity.
Some data are available regarding the clay miner alogy of soils within the drainage basins studied. KunHe (1963, p. 108-111) reported widely varying amounts of kaolinite, illite, and chlorite or chloritelike clays, and low concentrations of vermiculite in a few
surface soils in the Brandywine Creek drainage. It seems probable that Kunkle's "chloritelike" clays include those referred to as aluminum-interlayered clay in this report.
Recent studies of soils in several eastern Pennsylvania counties (Johnson and others, 1963) have shown that illite, kaolinite, vermiculite, and "dioctahedral chlorite" (includes the aluminum-interlayered clay of this report) commonly occur in surface soils there. Although none of the counties studied are within the Juniata River basin, the studies may indicate the general suite of clay minerals to be expected in Juniata River sediments.
The clay mineralogy of soils in the North Carolina Piedmont has been studied by several investigators. Coleman and others (1950) reported that kaolinite was the dominant clay mineral and vermiculite, illite, gibbsite, poorly crystalline material, and hematite occurred in subordinate amounts. Weed and Nelson (1962) found kaolinite and an aluminum-interlayered clay mineral as dominant constituents in some repre sentative North Carolina soils. M. J. Edwards (U.S. Dept. of Agriculture, written commun., 1963) reported kaolinite as the dominant clay mineral in surface soils of the type found in the Yadkin River drainage basin. Vermiculite is a minor constituent.
Some soils in the Licking River basin contain abun dant kaolinite. Vermiculite, kaolinite, illite, and a little montmorillonite are found in soils of the Green River basin (M. J. Edwards, U.S. Dept. of Agriculture, written commun., 1963). Griffin (1962, p. 743) found kaolinite and illite to be important clay minerals in the Ohio River drainage. Johns and Grim (1958, p. 198;) reported that illitic and chloritic sediments weather to form "vermiculitic and montmorillonitic (at least, expanding) minerals" in areas drained by the Ohio River.
The data in table 6 (p. Dl3) show that the clay min eralogy of stream sediments studied from the eastern United States agrees rather well with what is known about the clay mineralogy of the surface soils. The method of analysis used in this study for most of the clay samples makes detection of small to moderate amounts of vermiculite difficult when significant amounts of aluminum-interlayered clay, mixed-layer montmorillonite-illite, or chlorite are also present. However, specific tests for vermiculite were performed on one sample from each stream in this area. They indicate that the 14-A clay mineral (exclusive of chlorite) in Brandywine Creek and the Yadkin River is almost entirely an aluminum-interlayered clay, whereas that in the Juniata, Licking, and Green Rivers is one-third to one-half vermiculite and the rest alu minum-interlayered clay.
MINERALOGY AND CATION-EXCHANGE CAPACITY OF SEDIMENTS D13
TABLE 6. Mineralogy and cation-exchange capacity of stream claysTr, 0-3 percent; Sp, 4-10 percent; C, 11-25 Mallory, Jr.; carbon analyses were made by
Stream
No. (flg.D
1
2
3
4
5
6
7
8
9
Name
Brandywine Creek.
Juniata River..
Yadkin River..
Licking River..
Green River _
Mississippi River.
Kansas River..
Elk Creek __
Colorado River, Tex.
Date of sample collec tion
4-2-60 4- 4-60 2-21-61 2-26-61 2-26-61
11-16-61
8-31-60 2-21-61 2-21-61 2-27-61 2-27-61 3-10-61 3-10-61 4-14-61
11-14-61
2- 1-60 2- 1-60 3-30-60 3-30-60 5-18-61 6-22-61 6-22-61
11-19-61
6- 6-60 9- 7-60 1-18-611-18-61 2-27-61 2-27-61
11- 7-61
11- 3-60 1-13-61 2-28-61 2-28-61 3- 7-61 3- 7-61 5-10-61
11- 6-61
10-11-60 10-11-60 3- 9-61 3- 9-61 4- 6-61 5-16-61 5-18-61 6-7-61 6-8-61
9- 7-60 9- 7-60
11- 1-60 11- 1-60 1-11-61 1-11-61 5- 8-61 5-8-61 5-24-61 5-24-61
10-30-61 10-30-61
8-26-60 8-26-60
10-13-60 10-13-60 10-19-60 10-19-60 6-8-61 6- 8-61
10-12-61 10-12-61
10-31-60 6-20-61 6-20-61 9-12-61 9-15-61 9-15-61
10_14_61
Ratio of discharge
when sampled to aver age dis charge
1.2 9.2 2.7 8.1 8.1 .4
.15 5.1 5.1
12 12 4.6 4.6 5.7 .1
7.7 7.7 5.1 5.1 1.1 4.6 4.6 .6
.1
.03 4.7 4.7 5.2 5.2 .03
.07
.4 5.9 5.9 6.7 6.7 5.3 .2
.5
.5 1.4 1.4 1.8 2.4 2 1 1
1 1 .6 .6 .4 .4
3.9 3.9
14 14
1 1
.7
.7 18 18 54 54 42 42
.5
.5
17 16 16 15 3.9 3.9 .4
Sample type
Bed
Bed .. Bed ..
Bed-
Bed Bed... ..
Bed ..
Bed
Bed Bed
Bed.....
Bed-
Bed . Bed Sus. _ .Bed-
Bed Bed
Bed-
Bed-...
Bed-Bed Bed-
Bed
Bed-
Bed
Bed-
Bed
Bed -
Bed
Bed
Bed Sus __ .Bed-
Bed Sus.....Bed-
Bed
Bed
Bed. _ .
Bed Sus .....Bed-
Bed _ ..Bed _ - Sus .....
Bed-
Bed. __
Constituents
Weight percent
1 1!< }4.8
5.5 5.3
7.0
5.7 4.3 5.2 2.1 2.8 3.8
3.4 8.9
4.2
4.8 3.7 5.0 3.7
2.2 2.4
2.0
2.2
2.73.43.52.7
4.1
3.6
2 A
4.1 4.13 Q
1.0 3.4
4.23.5
4.3
3.3
3.43.53.4 4.22.63.8 3.2
2.5 3.2 3.5
5.3
** S§ 3 <
2.5
3.0 2.9
3.1
1.3 1.1 1.4 1.3 1.3 1.2
1.0 .9
4.7
5.9 5.37.0 4.6
1.3 1.4
1.3
1.2
1.71.41.5 1.5
1.3
1.4
.81.0 1.1 1.5
1.3 1.3
1.71.3
1.6
1.5
1.51.21.0 1.5.8
1.7 1.2
.8
.6
.6
.9
a
s4.8
4.1 2.1
2.1
1.5
§,0
1
%
<0.02
<.02
.15 <.01
.05
.03
........
§,0
a1
>5.2 4.9 4.8 4.7 2.6
4.2
1.88 3.64
4.3 2.1 3.6
>2
2.1 2.3
2.11.8
1.4
1.6
2.2 2
1.5
2 2.3
4.6 1.9
4.6
S
!M
M C
M C C
M
C C C C C Cc c c
M M M M M M M M
C C C C C C C
CScp8filp lpSp
ip lpSpip lp*&SPSp
lp !plp SPiplp SPIPIP SPlpSp
lplp SPif?Tr
I? sc-£p lpSpSpSo
1 P
C M C C C C
M C
M M M M M M M
C C C C C C C C
M M M M M M M
M M M M M M M M
C C C
M C C
M C C
C C C
M C C
M C Cc c c
M M M M M M M M M M
C Clp lpSplpSo
g|p^r-
£t3 *i! " =
1'S 0£CD
%
M C M M C C
C C C Cc c c c cc c c c c c c cs« SJ ss
Sp
ccs«c c c
Sp
Tr
P
? ?
P P P ?
Ps?P P P
lp lplpSp Splp lpSplpSp
p p p
"Sp"
:-- p-
S
1
1S
0 0 0 0 0 0
0 0 0 0 0 0 0 0 0
0 0 0 0 0 0 0 0
0 0 0 0 0 0 0
0 0 0 0 0 0 0 0
M M M M M M C
M C
C C C C C C C C
M C C C
SPlp SPSplplp SPlp lpSp
M M M M M M M
-S I
1
Tr Tr Tr
1?Tr
0 0 0 0 0 0 0
Tr Tr
0 0
Tr 0
Tr Tr Tr
0
Tr Tr
0 0
Tr 0
Tr
0 Tr
0 0 0 0 0 0
0 0 0 0 0 0
Tr 0
Tr
0 0 0 0 0 0 0 0 0 0 0 0
1? 1?1? 1? IS
0 0 0 0 0 0 0
c?t.
1 osIPSpcIP Sc-
pIPSpoIP lpIPSp
lpSpc
SP SPIPSp Sp
SP SPIP§pSp Sp Sp
IP1?T?ipSp
c c c c c c c c cM M M C
M C
Sp M C
M M M
M M M M M M M M M M
C M M C C C C
«
&
1 11 1 1.5 1
2 2 2 1.5 2 2 2.5 2 1.5
1 .5
1 .5
1 1 1 1
2 1.5 2 2 2 2
0
2.5 3.5 3.5 3.5 3 3.5 3 3.5
2 2 2 1.5 1.5 1.5 1 1 1.5
10
1 1 1 1 1 1 1 1 1.5 1.5
.5 1 .5
1 1 1 1 1 1 1
1 1 1 1 1 1 1
1
1
Tr 0
Tr TrSp Sp
Tr Tr Tr Tr Tr Tr Tr Tr Tr
0 0
Tr Tr Tr Tr Tr Tr
Tr Tr Tr Tr Tr Tr Tr
Tr Tr
0 0
Tr 0 0 0
8§ i?Tr Tr
0 TrSp
Tr 0
!?Tr Tr Tr Tr Tr Tr Tr Tr
0 Tr Tr Tr Tr Tr Tr Tr Tr Tr
Tr
8?0
Tr Tr Tr
1O
0 0 0 0 0 0
0 0 0 0 0 0 0 0
Tr
0 0 0 0 0 0 0 0
0 0 0 0 0 0 0
0 0 0 0 0 0 0 0
0 0
Tr 0 0 0 0 0 0
Tr Tr
0 0 0
Tr 0 0 0 0 0
Tr
0 0 0 0 0 0 0 0 0 0
Tr Trlp Sp
0 Sp
C
f"3 fi
0 0 0 0 0 0
0 0 0 0 0 0 0 0 0
0 0 0 0 0 0 0 0
0 0 0 0 0 0 0
0 0 0 0 0 0 0 0
0 0 0 0 0 0 0 0 0
0 0 0 0 0 0 0 0 0 0 0 0
0 0 0 0 0 0 0 0 0 0
0 0 0 0 0 0 0
-S %,0'6
0 0 0 0 0 0
0 0 0 0 0 0 0 0 0
Tr Tr Tr Tr Tr Tr Tr Tr
0 0 0 0 0 0 0
0 0 0 0 0 0 0 0
0 0 0 0 0 0 0 0 0
0 0 0 0 0 0 0 0 0 0 0 0
0 0 0 0 0 0 0 0 0 0
0 0 0 0 0 0 0
03 *-H
8£&illIII
18 30 22 23 13 26
19 2317 22 17 22 16 22 24
12 12 19 22 12 11 16
21 29
20 28 20 26
25 18 21 21 21 19 21 24
52 54 38 53 50 49 36 41 43
5655 56 58 54 56 59 58 42 55 46 56
48 42 47 47 45 47 41 45 47 47
48 53 64 65 61 64 49
D14 TRANSPORT OF RADIONUCLIDES BY STREAMS
TABLE 6. Mineralogy and cation-exchange capacity of stream clays Continued
Stream
No. (flg.D
10
11
12
13
14
15
16
17
18
19
20
21
Name
Pecoa Kiver __
Kio Grande Kiver.
San Juan Eiver, Bloomfield.
Animas River..
San Juan Eiver, Ship- rock.
Colorado River, Utah.
Cheyenne Eiver.
Big Horn River.
Cosumnes Eiver.
Cache Creek. ..
Mad River .....
Crooked River.
Date of sample collec tion
10-12-60 5-29-61 8-11-61 8-12-61 9-19-61 9-19-61
10-11-61
4-25-61 6-21-61
12-10-59 4-9-61 7-12-617-12-61
10-10-61 10-10-61
5-26-61 6-8-61
10-10-61 10-10-61 10-10-61
6-8-61 10-10-61 10-10-61
11-3-60 5-26-61 5-26-61 6-2-61 6- 6-61 6-6-61 6-18-61 6-18-61 4-10-62
8-31-60
9- 1-60 9-12-61 9-12-61
12-14-60 3-7-62 4-12-62
12-27-60 4-14-62
10-19-60 12- 2-60 12- 2-60 6-8-61 6-8-61 4-16-62
11-16-60 3-29-61 5- 1-61 5-3-61 4-18-62
Ratio of discharge
when sampled to aver age dis charge
.2 1.2 .3 .3
7.8 7.8 .7
1.8 .6
.2 2.3 .4 .4
1.8 1.8
3.5 2.3.8 .8 .8
1.9 1.4 1.4
.3 2.2 2.2 2.5 1.4 1.4 1.3 1.3 .9
.05
.3 1.1 1.1
.05 6.9 1.6
.01 <.01
.02 5.5 5.5 .3 .3
1
.2 1.7 .9 .9
6
Sample type
Bed.....
Bed Bed
Bed
Sus......Bed
Bed.... .
Bed.... .
Bed
Bed Bed
Sus .....Bed.....
Bed-
Bed.....
Bed.. ...
Bed Bed
Bed Bed- Bed.....
Bed Bed.. ...
Bed-Bed..
Bed Sus _ ..Bed.. ...
Bed- Bed _ -Bed Bed Bed __
Constituents
Weight percent
8i
!2.61.82.62.5 2.9
2.2.8
1.92.2
1.91.6
1.82.0
1.82.0
1.4
1.8
1.7
1.81.0
3.7
2.0
5.4
1.1
10.2 19.2
18.2
i-911 a'3
1.1.7.8
1.0 1.0
.81.3
.7
.5
.8
.6
.7
.7
.5
.7
.5
.6
.5
.7
.4
2.0
.7
.7
1.3
1.6 1.4
1.1
I
_o
!
.86
1.0
2.7
2.8
|
3
1
.07
<.02
<.02
<.02
|
3
1
>lt
1.6
1.1 1.3
.5
.7
2.3 3.12.7
1.1
2.5.7 .7
.93
1
1.7
2.4
2.7
2.8
3
CScp§p lpip1Sc-
88 gpScp c
gp §p lp lpSp
clpSp
c c8«
8Sc c
Sp
c
c c c
M M M
880 0 0 0 0 0
0 0 0 0 0
IM C C Cc c c
Scp
c c c c c cc88c
Sp
cTr Sp
M C C
M M M C
M C
C
Cc cc8Sc c
M M C C
M M
0 0 0 0 0
i!<%£ a-?!a>a5^ g O
S-TJ 03 <D w» i >
% c c c c c
p pp p cp p p p
p p
Sp
p p p p p p c p p0
p p pp c pp
Sp
""Sp"
Tr P P 0 P
1
1 S
Sp§p gp lp lpSp Sp
M M
CSc- c c
Sp
cM Cc
M
M M M
C C
M C C Cc c c
Sp
c c cc
Tr C
C C
0 0 0 0 0 0
M M M M M
1O
!???Sp
1?
0Tr
Tr Tr Tr Tr Tr Tr
Tr Tr Tr Tr Tr
Tr 0 0
gp lp lpSPlp
PI?Tr
0 Tr Tr
0 0 0
C C
M M M M M M
Tr Tr
0 0 0
11
|
8SC Cc c cc cc
M M M M C
C C
M M C
CM M
C Cc c c c c c c
M
M MM
C C C
c ccs«c c c
M M M M M
«
0?
1.52 1.5 1 1.51 1
1 1.5
1.5 1.5 1.6 2 1.5 1.5
1 2 1.5 1.5 1.5
1.5 1.5 1
1.5 2 2 1.5 1.5 2 1.5 1.5 1
3
1.5 2 1.5
.5
.5
.5
1.5 .5
11 1 2 1 1
.5
.5
.5
.5
.5
I% <o to
Tr Tr Tr Tr
i?0
Tr Tr
gp lp
T?
T?
Tr Tr Tr
0 Tr
0 Tr Tr
Tr Tr Tr
0 Tr
0 Tr Tr Tr
Tr
Tr 0
Tr
Tr 0
Tr
f,p Sp
Sp8S"Sp"
Sp Sp§p1?
1o0 0 0 0 0 0
Tr
0 0
0 0 0 0 0 0
0 0 0
Tr 0
0 0 0
S08fi
Triplp Sp
Tr
0 0 0
0 0 0
0 0
0 0 0 0 0 0
0 0 0 0 0
1"3 ft
0 0 0 0 0 0 0
0 0
0 0 0 0 0 0
0 0 0 0 0
00 0
Tr Tr Tr Tr Tr Tr
0
f?Tr
0 0 0
0 0 0
0 0
0 0 0 0 0 0
0 0 0 0 0
3
ft'6
0 0 0 0 0 0 0
0 0
0 0 0 0 0 0
0 0 0 0 0
0 0 0
0 0 0 0 0 0 0 0 0
0
0 0 0
0 0 0
0 0
0 0 0 0 0 0
0 0 0 0 0
!.£&oa$
sSS o
23 42 39 34 40 45 43
46 49
45 36 42 34 40 40
24 23 37 37 61
3758 61
3232 36 30 27 27 35 26 32
25
41 43 40
39 44 28
32 36
28 13 17 15 18 22
69 66
"59
65
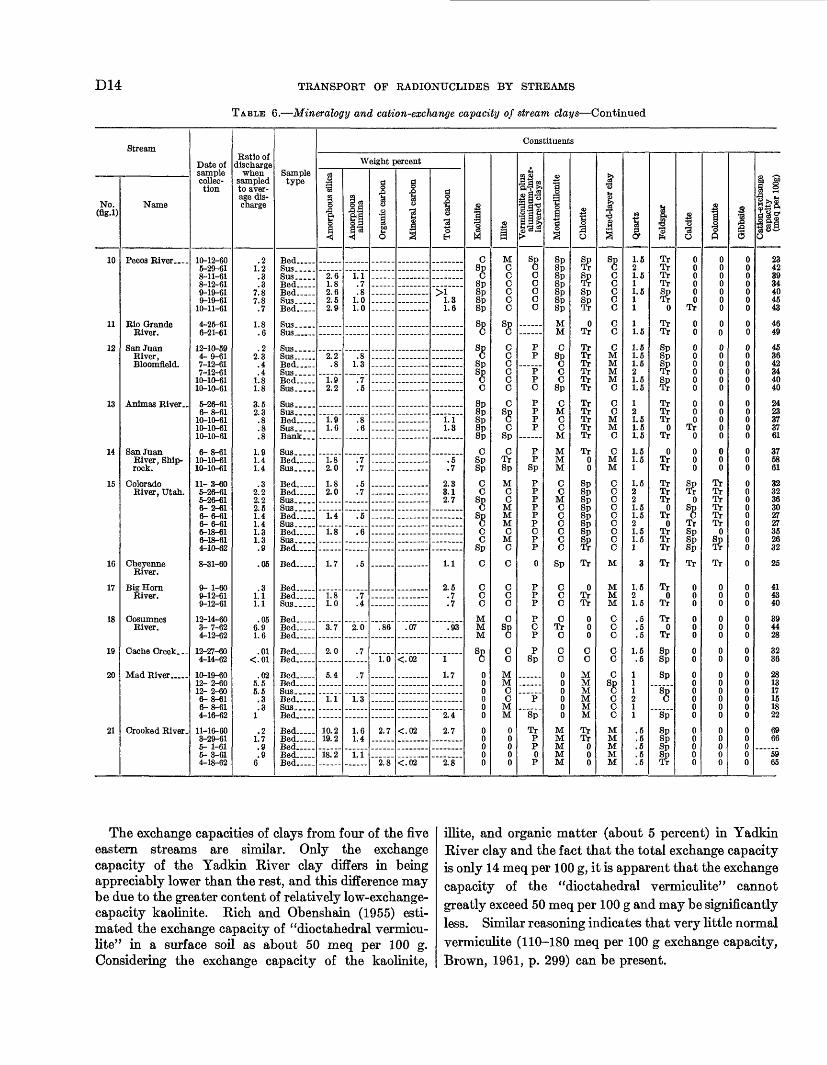
The exchange capacities of clays from four of the five eastern streams are similar. Only the exchange capacity of the Yadkin River clay differs in being appreciably lower than the rest, and this difference may be due to the greater content of relatively low-exchange- capacity kaolinite. Rich and Obenshain (1955) esti mated the exchange capacity of "dioctahedral vermicu- lite" in a surface soil as about 50 meq per 100 g. Considering the exchange capacity of the kaolinite,
illite, and organic matter (about 5 percent) in Yadkin River clay and the fact that the total exchange capacity is only 14 meq per 100 g, it is apparent that the exchange capacity of the "dioctahedral vermiculite" cannot greatly exceed 50 meq per 100 g and may be significantly less. Similar reasoning indicates that very little normal vermiculite (110-180 meq per 100 g exchange capacity, Brown, 1961, p. 299) can be present.
MINERALOGY AND CATION-EXCHANGE CAPACITY OF SEDIMENTS D15
STREAMS WEST OF THE MISSISSIFPI RIVER, EXCLUSIVE OF CALIFORNIA AND OREGON
Keller (1955, p. 68-71) points out that the soils at the longitude of Utah-Nevada are largely lithosols high in partially weathered rock fragments. As one goes eastward, the rate of soil formation increases, and in the central United States, for example, from Kansas to the Mississippi River, large amounts of three-layer high- cation-exchange types of clay are present.
In the Rocky Mountain States and High Plains region the climate commonly is cool and arid, warm and arid, or, at the higher elevations, cool and moderately humid. In this area, chemical weathering is less im portant than in warm moist areas, and mechanical weathering is more important.
There is little detailed information available concern ing the clay mineralogy of surface soils in the particular drainage basins studied within this area. However, montmorillonite and illite are important constituents of soils in the Colorado River basin above Columbus, Tex. (J. R. Coover, U.S. Dept. of Agriculture, written commun., 1963.) Kunze and others (1955) reported the presence of illite and kaolinite in two soil profiles in the upper part of the Colorado River basin in Texas. They found that montmorillonite dominates the <C2/i fraction of a soil from the lower Colorado River basin upstream from Columbus. Fagg (1957) found abun dant montmorillonite and lesser amounts of illite and kaolinite in Recent sediments of Matagorda Bay. An important part of the sediments in Matagorda Bay are probably carried in by the Colorado River.
In the Kansas River basin, two soil profiles were examined by W. A. Badgley and C. F. Crumpton (1964, p. 71-73) and found to contain montmorillonite, illite, and kaolinite.
Griffin (1962, p. 743) reported that the montmoril lonite and illite groups of clays were dominant in the Mississippi River basin above St. Louis, Mo. Johns and Grim (1958, p. 198) also point out that soils of the Missouri River basin contain much montmorillonite.
Specific tests indicate that little, if any, aluminum- interlayered clay is present in sediments from streams west of the Mississippi River and east of California and Oregon. Some vermiculite is apparently present either as a separate component or in mixed-layer clay con taining illite or montmorillonite,
The exchange capacities of stream clays in this area are distinctly higher than those of stream clays east of the Mississippi River. This difference apparently is a result of the presence of significant percentages of montmorillonite, mixed-layer clay and some vermiculite.
STREAMS IN CALIFORNIA AND OREGON
Climate and geology vary greatly in the stream basins studied in California and Oregon. Barshad and Perry (written commun., 1959) determined the mineralogy of clays in soils from various parts of California. If one assumes their data can be used for a particular soil series beyond the immediate area of sampling, then, on the basis of soils series distribution described by W. M. Johnson, U.S. Dept. of Agriculture (written commun., 1963), some statements can be made regarding the clay mineralogy of soils within the stream basins studied.
Kaolinite, lesser quantities of montmorillonite and mica, and some vermiculite are probably present in soils of the Cosumnes River basin. In the Cache Creek basin above Yolo, major amounts of vermiculite, moderate amounts of kaolinite, and moderate to negligi ble amounts of mica and montmorillonite may occur. Little is known about the clay mineralogy of the soils in the Mad River basin, but plentiful chlorite is known to be present in at least some of the soils there.
Very little, if any, amminum-interlayered clay ap pears to be present in these streams, although the presence of chlorite in clays from Cache Creek and the Mad River make determinations of aluminum-inter- layered clay difficult.
The average exchange capacity of 37 meq per 100 g for clay from the Cosumnes River reflects the presence of low-exchange-capacity kaolinite mixed with vermicu lite and vermiculite-illite mixed-layer clays. The ex change capacity of clay from Cache Creek is similar to that of Cosumnes River clay but results mainly from a mixture of chlorite and illite with montmorillonite, vermiculite, and mixed-layer clays. Vermiculite can not be a large proportion of the clay minerals in either stream, for its high exchange capacity (110-180 meq per 100 g, Brown, 1961, p. 299) would cause the overall exchange capacity to be greater than that observed.
Because chlorite and illite comprise most of the clay minerals in the Mad River, the average exchange capacity is only about 18 meq per 100 g.
In the Crooked River of Oregon, the stream clay appears to be mainly montmorillonite and mixed- layered material, which is probably montmorillonite- illite. The high exchange capacity, 60-70 meq per 100 g, indicates that the mixed-layer clays contain a large proportion of montmorillonite. The fact that the clay-size fraction contains a high amount of amorphous silica but relatively little amorphous alumina shows that the amorphous silica determined was not obtained from solution of fine-grained or poorly crystalline clay minerals, for then both amorphous alumina and silica would have been above average.
D16 TRANSPORT OF RADIONUCLIDES BY STREAMS
AMORPHOUS MATERIAL
The truly amorphous material in stream clay is difficult to evaluate, especially when it is present as only a few percent of a sample. The method of analysis used may result in solution of gibbsite, some poorly crystalline material, and a little of the very fine grained clay minerals as well as truly amorphous alumina, silica, and alumino-silicates.
The weighted average of "amorphous silica" was about 3.6 percent, and of "amorphous alumina" about 1.3 percent. The above-average amount of silica in the Crooked River in Oregon may be related to the weathering of volcanic tuff and basaltic rocks. The alumina reported for Yadkin River clay is probably due, in part, to the presence of gibbsite. In general, there appears to be a tendency for the amount of "amorphous material" determined by this method to increase with increased weathering intensity (E. C. Mallory, Jr., written commun.).
ORGANIC CARBON
The organic material in stream sediments may be important in the removal of certain elements from solu tion, and may explain a significant proportion of the exchange capacity. A measure of the organic material present can be obtained from an organic- carbon analysis, although the ratio of organic material to organic carbon is not known accurately for modern stream sediments. If the ratio of organic material to organic carbon in surface soils reported by Broadbent (1953, p. 175-176) can be extrapolated to stream sedi ments, a value of 1.9 may be suitable.
In the present study, organic carbon was determined by difference between total carbon and mineral carbon. Sufficient sample often was not available for both analyses, and only total carbon was then determined. X-ray data were then used to indicate the amount of carbonate present; however, 1-2 percent carbonate could easily be missed by X-ray techniques.
The weighted-average organic-carbon content of the stream clays was about 2.2 percent; this value corre sponds to about 4.2 percent organic matter. Streams east of the Mississippi River carried sediment containing significantly more organic carbon than the average for all streams studied.
SILT
The silt fraction of stream sediments may contain both shale fragments and clay-mineral aggregates formed by flocculation of clay-size particles. The repeated violent shaking of the silt-clay mixture in distilled water prior to separation of the <0.004-mm fraction was intended to disperse the flocculated aggre gates but not to break down well-cemented rock frag
ments. As a result, many of the silt fractions still con tained significant amounts of clay after size separa tion. This clay was reflected in the X-ray analyses as well as in the exchange capacities determined.
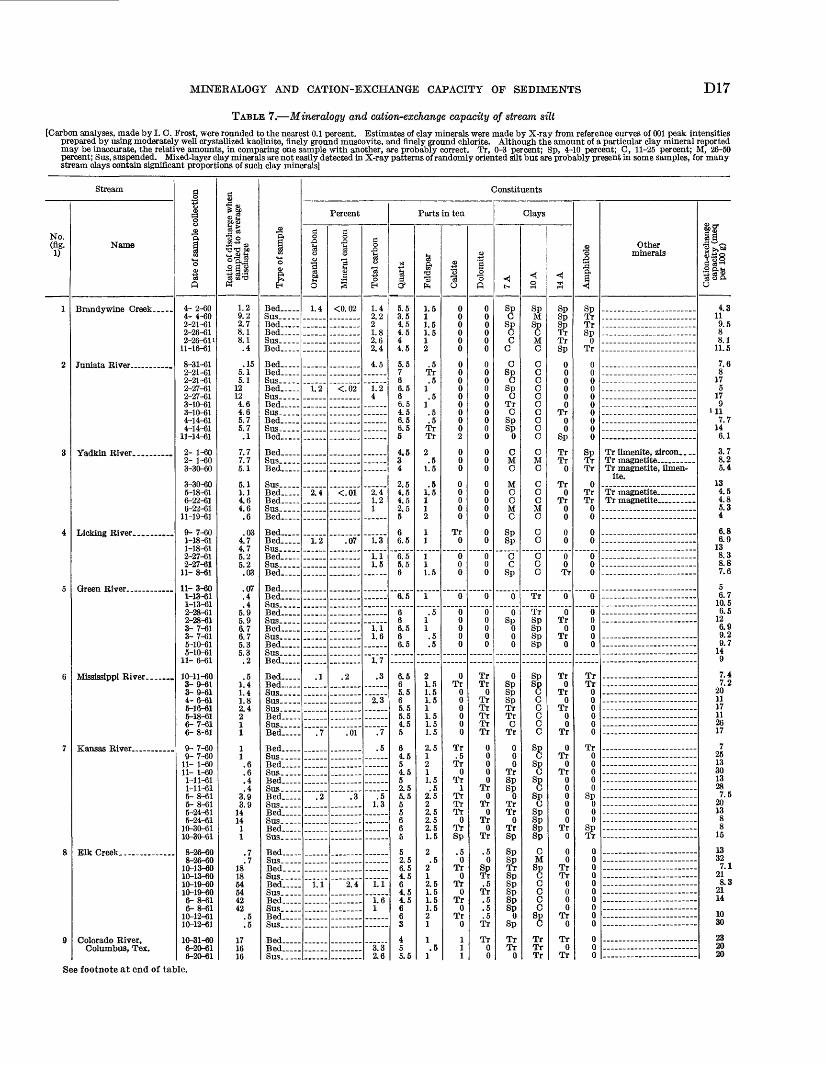
The mineral composition and exchange capacity of stream silt are summarized in table 7. The total amount of clay minerals in a sample was obtained by subtracting from 100 percent the amount of nonclay material estimated from X-ray data to be present.
An approximate check on the clay content can be obtained if three assumptions are made: (1) that the exchange capacity of the nonclay minerals in the silt and clay sizes is very small compared to that of the clay minerals, (2) that the exchange capacity of clay minerals in the clay fraction is the same per unit weight as that of clay minerals in the silt fraction, and (3) that virtually all the nonclay minerals were detected by X-ray methods. The calculation is made by using the following equation:
whereE.
£'s=exchange capacity of silt fraction, £'c =exchange capacity of clay fraction, a=fraction of silt fraction composed of clay
minerals,
and
6=fraction of clay-size material composed of clay minerals.
A few such calculations were made and the results are shown in table 8 (p. D19).
In general, the data show fairly good agreement between the percentage of clay minerals estimated from X-ray analyses of silt and the percentage of clay minerals calculated from exchange-capacity information. The notable exceptions are the samples from the Crooked River. The anomalous data from the Crooked River may be due mainly to the presence of amorphous material. The Crooked River sand contains 10-15 percent volcanic glass and the clay 10-20 percent amorphous silica and alumina. It seems reasonable to assume that there may be 10-20 percent amorphous material in the silt fractions also. Because clay minerals in the silt are estimated by subtracting quartz, feldspar, and organic material from 100 percent, any amorphous material will be called "clay." If 20 percent amorphous material were assumed to be present in the Crooked River silts, much of the discrepancy between the estimates of clay minerals in silt made by X-ray methods and those made from exchange-capacity data would be removed.
MINERALOGY AND CATION-EXCHANGE CAPACITY OF SEDIMENTS D17
TABLE 7. Mineralogy and cation-exchange capacity of stream silt[Carbon analyses, made by I. C. Frost, were rounded to the nearest 0.1 percent. Estimates of clay minerals were made by X-ray from reference curves of 001 peak intensities
prepared by using moderately well crystallized kaolinite, finely ground muscovite, and finely ground chlorite. Although the amount of a particular clay mineral reported may be inaccurate, the relative amounts, in comparing one sample with another, are probably correct. Tr, 0-3 percent; Sp, 4-10 percent; C, 11-25 percent; M, 26-50 percent; Sus, suspended. Mixed-layer clay minerals are not easily detected to X-ray patterns of randomly oriented silt but are probably present in some samples, for many stream clays contain significant proportions of such clay minerals]
Stream
No. (fig.
1
2
3
4
5
6
7
8
9
Name
Yadldn River.. ..
TTlTr r't.ooV
Colorado River, Columbus, Tex.
Date of sample collection
4- 2-60 4-4-60 2-21-61 2-26-61 2-26-611
11-16-61
8-31-61 2-21-61 2-21-61
2-27-61 3-10-61 3-10-61 4-14-61 4-14-61
11-14-61
2- 1-60 2- 1-60 3-30-60
3-30-60 5-18-61 6-22-61 6-22-61
11-19-61
9-7-60 1-18-61 1-18-61 2-27-61 2-27-61
11-8-61
11-3-60 1-13-61 1-13-61 2-28-61 2-28-61 3- 7-61 3- 7-61 5-10-61 5-10-61
11-6-61
10-11-60 3-9-61 3-9-61 4-6-61 5-16-61 5-18-61 6- 7-61 6-8-61
9- 7-60 9- 7-60
11- 1-60 11- 1-601-11-611-11-61 5- 8-61 5-8-61 5-24-61 5-24-61
10-30-61 10-30-61
8-26-60 8-26-60
10-13-60 10-13-60 10-19-60 10-19-60 6- 8-61 6-8-61
10-12-61 10-12-61
10-31-60 6-20-61 6-20-61
Ratio of discharge when sampled to average
discharge
1.2 9 2 2.7 8.1 8.1 .4
.15 5.1 5.1
12 12 4.6 4.6 5.7 5.7 .1
7.7 7.7 5.1
5.1 1.1 4.6 4.6 .6
.03 4.7 4.7 5.2 5.2 .03
.07
.4
.4 5.9 5.9 6.7 6.7 5.3 5.3 .2
.5 1.4 1.4 1.8 2.4 2 1 1
1 1 .6 .6 .4 .4
3.9 3.9
14 14
1 1
.7
.7 18 18 54 54 42 42
.5
.5
17 16 16
5 a,
o
EH
Bed Sus .....Bed Bed Sus. ....Bed
Bed-Bed Sus.....Bed
Bed Sus- ...Bed. .
Bed-
Bed-
Bed-
Bed Bed Sus- .Bed-
Bed. ....Bed
Bed -Sus. ....Rod
Bed-Bed
Bed
Bed.....
Bed _
"Rarfl
Bed _ Bed-
Bed.
Bed-
Bed.. ...
Bed-
Bed
Bed "RaH
"RaH
Bed. ....
Bed....
Bed Sus.. Bed
Bed Sus _ -
Bed. ....BedSus.. ...
Constituents
Percent
§
101M
O
1.4
1.2
2.4
1.2
.1
.7
.2
1.1
ao,0
§3
<0.02
<.02
<.01
.07
.2
.01
.3
2.4
ao,0
"3"o EH
1.4 2.2 2 1.8 2.6 2.4
4.5
1.24
2.4 1.2 1
1.3
1.1 1.5
1.1 1.6
1.7
.3
2.3
.7
.5
.5 1.3
1.1
1.6 1
3.3 2.6
Parts in ten
SI
i £
5.5 3.5 4.5 4.5 4 4.5
5.5 7 6 6.5 6 6.5 4.5 6.5 6.5 5
4.5 34
2.5 4.5 4.5 2.5 5
6 6.5
6.5 5.5 6
6.5
6 6 6.5 6 6.5
6.5 6 5.5 6 5.5 5.5 4.5 5
6 4.5 5 4.5 5 2.5 5.5 5 5 6 6 5
5 2.5 6.5 4.5 6 4.5 4.5 6 6 3
4 5 5.5
T3"3 f*«
1.5 1 1.5 1.5 1 2
.5 Tr .5
1 .5
1 .5 .5
Tr Tr
2 .5
1.5
.5 1.5 1 12
1 1
1 11.5
1
.5 1 1 .5 .5
2 1.5 1.5 1.5 1 1.5 1.5 1.5
2.5 1 2 1 1.5 .5
2.5 2 2.5 2.5 2.5 1.5
2 .5
2 1 2.5 1.5 1.5 1.5 2 1
1.5
1
S1 0
0 0 0 0 0 0
0 0 0 0 0 0 0 0 0 2
0 0 0
0 0 0 0 0
Tr 0
0 0 0
0
0 0 0 0 0
0 Tr
0 0 0 0 0 0
Tr .5 Tr
0 Tr
1 Tr Tr Tr
0 Tr Sp
.5 0
Tr 0
Tr 0
Tr 0
Tr 0
1 1 1
.2
_0"o
Q
0 0 0 0 0 0
0 0 0 0 0 0 0 0 0 0
0 0 0
0 0 0 0 0
0 0
0 0 0
0
0 0 0 0 0
Tr Tr
0 Tr Tr Tr Tr Tr
0 0 0 0 0
Tr 0
Tr 0
Tr 0
Tr
.5 0
9.5 Tr.5 .5 .5 Tr
Tr 0 0
Clays
< t~
*Sp Cc
cc
Spc Sc-
Tr C
§P Sp
0
cM C
M C C M C
Sp Sp
c cSp
0
0Spo
0 0
0 Sp Sp Sp Tr Tr C
Tr
0 0 0
Tr Sp Sp
0 Tr Tr
0 Tr Sp
Sp Sp Tr Sp|P |Plp Sp
0Sp
Tr Tr
0
<0
Sp MScPM C
C Cc c c c c c c ccMC
c c cMC
C C
Cc c
Tr
Tr Sp Sp Sp Sp
|PScp c c c c c
S8 8«Spcsfi
SpIP IPSp
cMs«Cc c css
Tr Tr Tr
<S
Sp Sp
1? Tr Sp
0 0 0 0 0 0
Tr 0 0
Sp
Tr Tr
0
Tr 0
Tr 0 0
0 0
0 0 Tr
0
0 Tr
0 Tr
0
Tr 0
Tr 0
Tr 0 0
Tr
0 Tr
0 Tr
0 0 0 0 0 0
Tr 0
0 0
Tr Tr
0 0 0 0
Tr 0
Tr 0
Tr
1S a a
STrSp
0 Tr
0 0 0 0 0 0 0 0 0 0
1?Tr
0 Tr Tr
0 0
0 0
0 0 0
0
0 0 0 0 0
Tr Tr
0 0 0 0 0 0
Tr 0 0 0 0 0
Sp 0 0 0
Sp Tr
0 0 0 0 0 0 0 0 0 0
0 0 0
Other minerals
Tr ilmenite, zircon.. ..
Tr magnetite, ilmen ite.
Tr magnetite .
IX"Si§ 2 °S"§ § a 0
4.3 11 9.5 8 8.1
11.5
7.6 8
17 5
17 9
ill 7.7
14 6.1
3.78.2 5.4
134.5 4.8 5.3 4
6.8 6.9
13 8.3 8.8 7.6
5 6.7
10.5 6.5
12 6.9 9.2 9.7
14 9
7.47.2
20 11 17 11 26 17
7 25 13 30 13 28 7.5
20 13 8 8
15
13 32 7.1
21 8.3
21 14
10 30
23 20 20
See footnote at end of table.
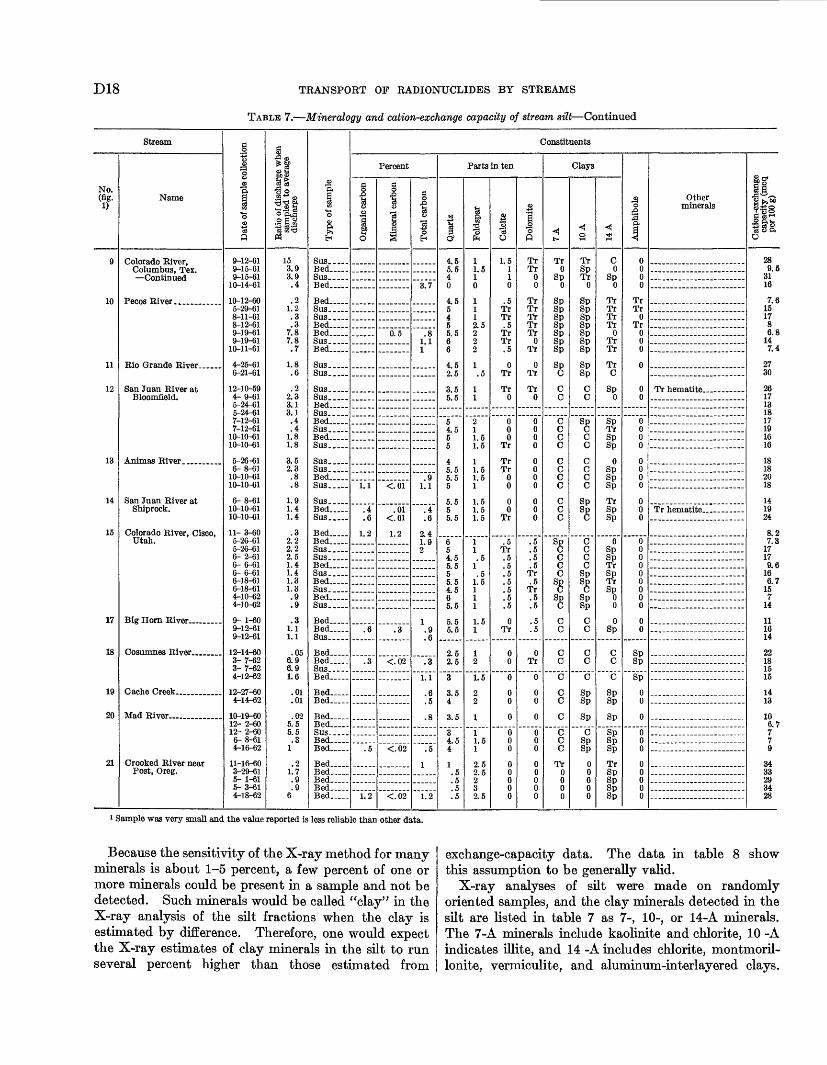
D18 TRANSPORT OF RADIONUCLIDES BY STREAMS
TABLE 7. Mineralogy and cation-exchange capacity of stream silt Continued
Stream
No. (J.
9
10
11
12
13
14
15
17
18
19
20
21
Name
Colorado Eiver, Columbus, Tex.
Peeos Eiver_ _____
San Juan River at Bloomfield.
Animas River. .........
San Juan River at Shiprock.
Colorado River. Cisco, Utah.
Big Horn River .........
Cosumnes River ........
Cache Creek. _____
Mad River .___. __
Crooked River near Post, Oreg.
Date of sample collection
9-12-61 9-15-61 9-15-61
10-14-61
10-12-60 5-29-61 8-11-61 8-12-61 9-19-61 9-19-61
10-11-61
4-25-61 6-21-61
12-10-59 4- 9-61 5-24-61 5-24-61 7-12-61 7-12-61
10-10-61 10-10-61
5-26-61 6- 8-61
10-10-61 10-10-61
6-8-61 10-10-61 10-10-61
11-3-60 5-26-61 5-26-61 6-2-61 6-6-61 6- 6-61 6-18-61 6-18-61 4-10-62 4-10-62
9- 1-60 9-12-61 9-12-61
12-14-60 3-7-62 3-7-62 4-12-62
12-27-60 4-14-62
10-19-60 12- 2-60 12- 2-60 6-8-61 4-16-62
11-16-60 3-29-61 5- 1-61 5-3-61 4-18-62
Ratio of discharge when sampled to average
discharge
15 3.9 3.9.4
2 l!2 .3 .3
7.8 7.8 .7
1.8 .6
2 2! 3 3.1 3.1.4 .4
1.8 1.8
3.5 2.3.8 .8
1.9 1.4 1.4
.32.2 2.2 2.5 1.4 1.4 1.3 1.3 .9 .9
.31.1 1.1
.05 6.9 6.9 1.6
.01
.01
.02 5.5 5.5 .3
1
.2 1.7 .9 .9
6
ID "ft
"3
Sus. ....Bed
Bed.....
Bed ..Sus. ....Sus .....Bed Bed. ....Sus. ....Bed.....
Sus. ....Sus .....
Sus.. Sus. ....Bed Sus.. ...Bed Sus .....Bed.....Sus. ....
Sus. ....Sus .....Bed _ ..
Sus. ....Bed Sus. ....
Bed.....Bed Sus.._ Sus._ Bed. ....Sus. ....Bed.....Sus. ....Bed.. ...Sus. ....
Bed.....Bed Sus. ....
Bed-Bed.....Sus __ .Bed-
Bed. .Bed-...
Bed-Bed.-...
Bed-Bed
Bed.....Bed. .Bed-Bed Bed
Constituents
Percent
g xs
o
0
1.1
.4
.6
1.2
.6
.3
.5
1.2
§1 o
0.5
<.01
.01 <.01
1.2
.3
<.02
<.02
<.02
§ xs
"oH
3.7
.8 1.1 1
.9 1.1
.4
.6
2.41.9 2
1.9 .6
.3
1.1
.6
.5
.8
.5
1
1.2
Parts in ten
0"
4.5 5.5 4 0
4.5 5 4 5 5.5 6 6
4.5 2.5
3.5 5.5
5 4.5 5 5
4 5.5 5.5 5
5.5 5 5.5
6 5 4.5 5.5 5 5.5 4.5 6 5.5
5.5 5.5
2.5 2.5
3
3.54
3.5
34.5 4
1 .5 .5 .5 .5
2«3 fr
11.5 1 0
11 1 2.5 2 2 2
1.5
1 1
2 1 1.5 1.5
1 1.5 1.5 1
1.5 1.5 1.5
1 1 .5
1 .5
1.5 1 1 1
1.5 1
12
1.5
2 2
1
1 1.5 1
2.5 2.5 2 3 2.5
I"c3
O
1.511 0
.5 Tr Tr .5 Tr Tr .5
0 Tr
Tr 0
6 0 0
Tr
Tr Tr
0 0
0 0
Tr
.5 Tr .5 .5 .5 .5 .5 .5 .5
0 Tr
0 0
0
0 0
0
0 0 0
0 0 0 0 0
sI"3 P
Tr Tr
0 0
Tr Tr Tr Tr Tr
0 Tr
0 Tr
Tr 0
0 0 0 0
0 0 0 0
0 0 0
.5
.5
.5
.5 Tr .5
Tr .5 .5
.5
.5
0 Tr
0
0 0
0
0 0 0
0 0 0 0 0
Clays
< t-
Tr 0
Sp 0
Sp Sp§p £pSpi8«c c
c c c cc c c cc c c
s«c cc
Spc
Spcc c
c ccc ccc cc
Tr 0 0 0 0
< s
Tr
1? 0
Sp Sp§pSp Sp Sp Sp
Sp Sp
c c
s«c cc c c c
SpScP
c c c c£p
Spc£p
Sp
c c
c cc
gpSp
Sp
cSpSp
0 0 0 0 0
< s
c0
Sp 0
Tr Tr Tr Tr
0 Tr Tr
Tr C
Sp 0
1? i
0gp £pSp
Tr Sp Sp
0 Sp
1?
T? Sp
0 0
0 Sp
c cc
Sp Sp
Sp
Sp Sp Sp
Tr Sp§P SpSp
.ao fi
1 1
0 0 0 0
Tr Tr
0 Tr
0 0 0
0
0 0
0 0 0 0
0 0 0 0
0 0 0
0 0 0 0 0 0 0 0 0
0 0
SpSp
Sp
0 0
0
0 0 0
0 0 0 0 0
Other minerals
Tr hematite. ..........
Tr hematite ____ .
I*
1*-S5
IPIII O
28 9.5
31 16
7.6 15 17 8 6.8
14 7.4
27 30
26 17 13 18 17 19 16 16
18 18 20 18
14 19 24
8.2 7.3
17 17 9.6
16 6.7
15 7
14
11 16 14
22 18 15 15
14 13
106.7 7 7 9
34 33 29 3428
i Sample was very small and the value reported is less reliable than other data.
Because the sensitivity of the X-ray method for many minerals is about 1-5 percent, a few percent of one or more minerals could be present in a sample and not be detected. Such minerals would be called "clay" in the X-ray analysis of the silt fractions when the clay is estimated by difference. Therefore, one would expect the X-ray estimates of clay minerals in the silt to run several percent higher than those estimated from
exchange-capacity data. The data in table 8 show this assumption to be generally valid.
X-ray analyses of silt were made on randomly oriented samples, and the clay minerals detected in the silt are listed in table 7 as 7-, 10-, or 14-A minerals. The 7-A minerals include kaolinite and chlorite, 10 -A indicates illite, and 14 -A includes chlorite, montmoril- lonite, vermiculite, and aluminum-interlayered clays.
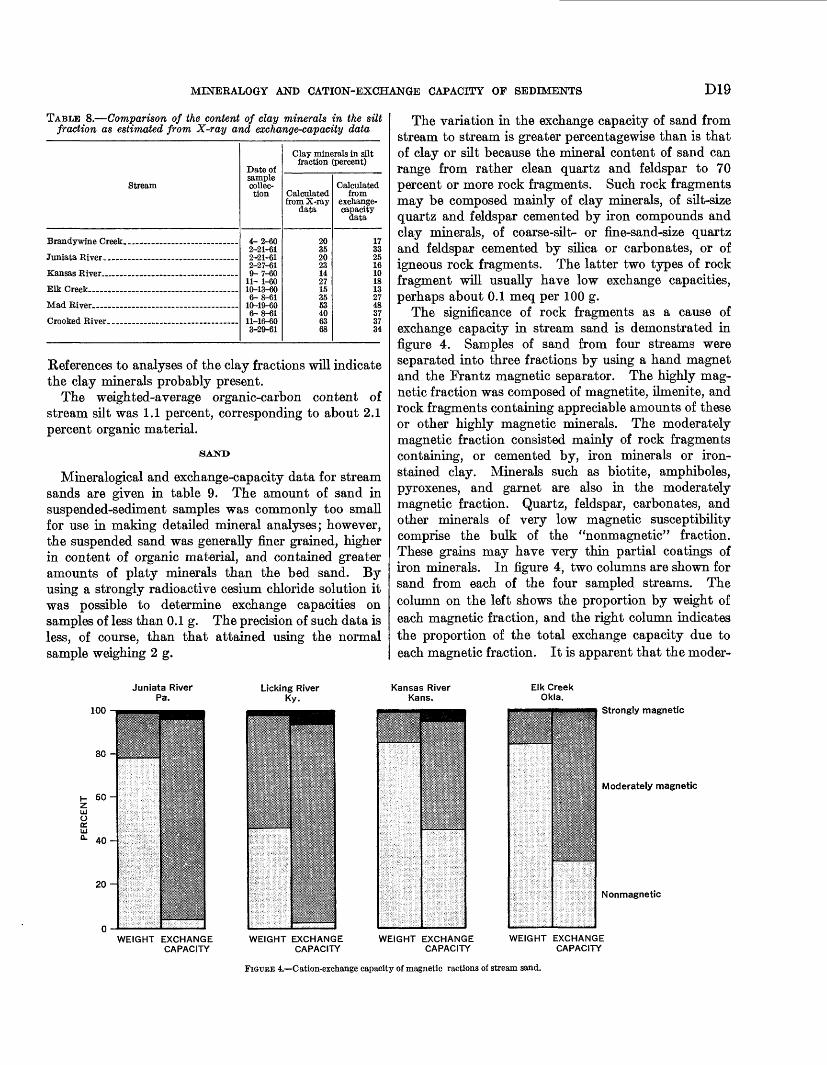
MINERALOGY AND CATION-EXCHANGE CAPACITY OF SEDIMENTS D19
TABLE 8. Comparison of the content of clay minerals in the silt fraction as estimated from X-ray and exchange-capacity data
Stream
Elk Creek .
Date of sample collec tion
4-2-60 2-21-61 2-21-61 2-27-61 9-7-60
11- 1-60 10-13-60 6-8-61
10-19-60 6-8-61
11-16-60 3-29-61
Clay minerals in silt fraction (percent)
Calculated from X-ray
data
20 35 20 23 14 27 15 35 63 40 63 68
Calculated from
exchange- capacity
data
17 33 25 16 10 18 13 27 48 37 37 34
References to analyses of the clay fractions will indicate the clay minerals probably present.
The weighted-average organic-carbon content of stream silt was 1.1 percent, corresponding to about 2.1 percent organic material.
Mineralogical and exchange-capacity data for stream sands are given in table 9. The amount of sand in suspended-sediment samples was commonly too small for use in making detailed mineral analyses; however, the suspended sand was generally finer grained, higher in content of organic material, and contained greater amounts of platy minerals than the bed sand. By using a strongly radioactive cesium chloride solution it was possible to determine exchange capacities on samples of less than 0.1 g. The precision of such data is less, of course, than that attained using the normal sample weighing 2 g.
The variation in the exchange capacity of sand from stream to stream is greater percentagewise than is that of clay or silt because the mineral content of sand can range from rather clean quartz and feldspar to 70 percent or more rock fragments. Such rock fragments may be composed mainly of clay minerals, of silt-size quartz and feldspar cemented by iron compounds and clay minerals, of coarse-silt- or fine-sand-size quartz and feldspar cemented by silica or carbonates, or of igneous rock fragments. The latter two types of rock fragment will usually have low exchange capacities, perhaps about 0.1 meq per 100 g.
The significance of rock fragments as a cause of exchange capacity in stream sand is demonstrated in figure 4. Samples of sand from four streams were separated into three fractions by using a hand magnet and the Frantz magnetic separator. The highly mag netic fraction was composed of magnetite, ilmenite, and rock fragments containing appreciable amounts of these or other highly magnetic minerals. The moderately magnetic fraction consisted mainly of rock fragments containing, or cemented by, iron minerals or iron- stained clay. Minerals such as biotite, amphiboles, pyroxenes, and garnet are also in the moderately magnetic fraction. Quartz, feldspar, carbonates, and other minerals of very low magnetic susceptibility comprise the bulk of the "nonmagnetic" fraction. These grains may have very thin partial coatings of iron minerals. In figure 4, two columns are shown for sand from each of the four sampled streams. The column on the left shows the proportion by weight of each magnetic fraction, and the right column indicates the proportion of the total exchange capacity due to each magnetic fraction. It is apparent that the moder-
Juniata River Pa.
Licking River Ky.
Kansas River Kans.
Strongly magnetic
Moderately magnetic
Nonmagnetic
WEIGHT EXCHANGE CAPACITY
WEIGHT EXCHANGE CAPACITY
WEIGHT EXCHANGE CAPACITY
WEIGHT EXCHANGE CAPACITY
FIGUEE 4. Cation-exchange capacity of magnetic ractions of stream sand.
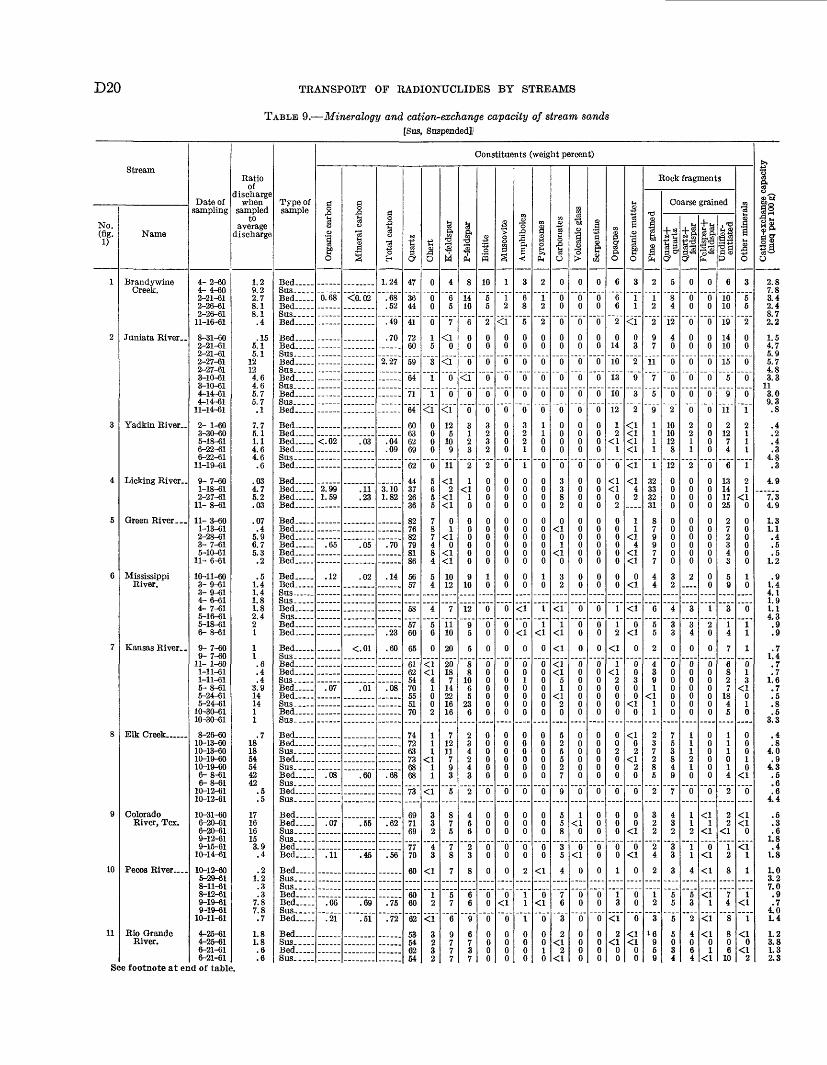
D20 TRANSPORT OF RADIONUCLIDES BY STREAMS
TABLE 9. Mineralogy and cation-exchange capacity of stream sands [Sus, Suspended]]
Stream
No. (fig. 1)
1
2
3
4
5
6
7
8
9
10
11
S«
Name
Brandywine Creek.
Juniata River..
Yadkin River-
Licking River-
Green River _
Mississippi River.
Kansas River..
Elk Creek ......
Colorado River, Tex.
Pecos River ....
Rio Grande River.
>e footnote at er
Date of sampling
4-2-60 4- 4-60 2-21-61 2-26-61 2-26-61
11-16-61
8-31-60 2-21-61 2-21-61 2-27-61 2-27-61 3-10-61 3-10-61 4-14-61 4-14-61
11-14-61
2- 1-60 3-30-60 5-18-61 6-22-61 6-22-61
11-19-61
9-7-60 1-18-61 2-27-61
11- 8-61
11-3-60 1-13-61 2-28-61 3- 7-61 5-10-61
11- 6-61
10-11-603 ft. fll
3-9-61 4-6-61 4- 7-61 5-16-61 5-18-61 6- 8-61
9-7-60 9- 7-60
11- 1-60 1-11-61 1-11-61 5-8-61 5-24-61 5-24-61
10-30-61 10-30-61
8-26-60 10-13-60 10-13-60 10-19-60 10-19-60 6-8-61 6-8-61
10-12-61 10-12-61
10-31-60 6-20-61 6-20-61 9-12-61 9-15-61
10-14-61
10-12-60 5-29-61 8-11-61 8-12-61 9-19-61 9-19-31
10-11-61
4-25-61 4-25-61 6-21-61 6-21-61
id of table
Ratio of
discharge when
sampled to
average discharge
1.2 9.2 2.7 8.1 8.1 .4
.15 5.1 5.1
12 12 4.6 4.6 5.7 5.7 .1
7.7 5.1 1.1 4.6 46 .6
.03 4.7 5.2 .03
.07 .4
5.9 6.7 5.3 .2
.5 1.4 1.4 1.8 1.8 2.4 2 1
1 1.6 .4 .4
3.9 14 14 1 1
.7 18 18 54 54 42 42
.5
.5
17 16 16 15 3.9 .4
.2 1.2 .3 .3
7.8 7.8 .7
1.8 1.8 .6 .6
.
Type of sample
Bed-
Bed.. Bed-
Bed
Bed Bed-
Bed Sus- Bed Sus-...Bed Sus---Bed- _
Bed. ....Bed Bed Bed. ....Sus ~Bed
Bed Bed.. ... Bed- Bed.
Bed ..Bed. ....Bed-Bed. .... Bed-Bed..
Bed- Bed
Sus Bed Sus Bed-Bed.. _
Bed ,Sus Bed-Bed .Sus. ....Bed- Bed
Bed. _ .Sus .
Bed .Bed Sus- Bed Sus. ....Bed Sus.. Bed Sus
Bed- Bed Sus-. Sus... .Bed-Bed
Bed .Sus. ....Sus- Bed-Bed Sus.- Bed-
Bed Sus- Bed.. ...Sus. ....
Constituents (weight percent)
!o o
0
0.68
<.02
2.99 1.59
.65
.12
.07
.08
.07
.11
.06
.21
g &
1
1
<0.02
.03
.11
.23
.05
.02
<.01
.01
.60
.55
.45
.69
.51
§J3
a"oEH
1.24
.68
.52
.49
.70
2.27
.04
.09
3.10 1.82
.70
.14
.23
.60
.08
.68
.62
.56
.75
.72
«
<§
47
36 44
41
72 60
59
64
71
64
60 63 62 69
62
44 37 26 36
82 76 82 79 81 86
5657
58
57 60
65
61 62 54 70 55 51 70
74 72 63 73 68 68
73
69 71 69
77 70
60
60 60
62
53 54 62 54
tf£0
0
0 0
0
15
3
1
1
<1
0 0 0 0
0
5 6 5 5
7 8 7 4 8 4
5 4
4
5 6
0
<1 <1
4 1 0 0 2
1 1 1
<11 1
<1
3 32
4 3
<1
12
<1
3 2 32
£ 13M
4
6 5
7
<10
<1
0
0
<112
5 10
9
11
<1 2
<1 <1
0 1
<10<1 <1
10 12
7
11 10
20
20 18
7 14 22 16 16
7 12 11 7 9 3
5
8 7 5
7 8
7
57
6
97 7 7
-12PH
8
14 10
6
0 0
0
<1
0
0
3 1 2 3
2
1 <1
1 0
0 0 0 0 0 0
9 10
12
9 5
5
8 8
10 6 5
23 6
2 3 4 2 4 3
2
4 5 6
2 3
8
6 6
9
67 37
!«10
5 5
2
0 0
0
0
0
0
32 3 2
2
0 0 0 0
0 0 0 0 0 0
1 0
0
0 0
0
0 0 0 0 0 0 0
0 0 0 0 0 0
0
0 0 0
0 0
0
0 0
0
0 0 0 0
3 > s3s112
<10 0
0
0
0
0
0 0 0 0
0
0 0 0 0
0 0 0 0 0 0
0 0
0
0 0
0
0 0 0 0 0 0 0
0 0 0 0 0 0
0
0 0 0
0 0
0
0<10
0 0 0 0
m31a <<
3
6 8
5
0 0
0
0
0
0
32 2110 0 0 0
0 0 0 0 0 0
0 0
<10<10
0 010 0 0 0
0 0 0 0 0 0
0
0 0 0
0 0
2
1 110 0 0 0
aIfcPH
2
12
2
0 0
0
0
0
0
110 0
0
0 0 0 0
0 0 0 0 0 0
10
11
<10
0 0 0 0 0 0 0
0 0 0 0 0 0
0
0 0 0
0 0
<1
0<1
0
0 010
1o,0£o
0
0 0
0
0 0
0
0
0
0
0 0 0 0
0
3 38 2
0<101
<10
32
<11
<1<1<1 <1
51
<12 0
5 2 5 5 2 7
9
5 5 8
35
4
7 6
3
2 <1
2 <1
"M o
1
0
0 0
0
0 0
0
0
0
0
0 0 0 0
0
0 0 0 0
0 0 0 0 0 0
0 0
0
0 0
0
0 0 0 0 0 0 0
0 0 0 0 0 0
0
1 <1
0
0<1
0
0 0
0
0 0 0 0
I"5
§<o DQ
0
0 0
0
0 0
0
0
0
0
0 0 0 0
0
0 0 0 0
0 0 0 0 0 0
0 0
0
0 0
0
0 0 0 0 0 0 0
0 0 0 0 0 0
0
0 0 0
0 0
0
0 0
0
0 0 0 0
01
!fto
6
6 6
2
0 14
10
13
10
12
12<110
<1 <102
0 0 0 0 0 0
0 0
112
<11 <12 0 0 0 0
0 0 2 0 0 0
0
0 0 0
0 0
1
13
<12
<10 0
1_o
s>0
3
1 1
<10 3
2
9
3
2
<1 <1<1 <1
<1
<14 2
1 1
<1 4
<1 <1
0 <1
<1
0<10
0 0 3 0 0
<1 0
<10 2
<12 0
0
0 0
<1
0<10
0 0
0
<1<1
0 0
Rock fragments
o
ft
2
12
2
97
11
7
5
9
1 1 1 1
1
32 33 32 31
8 7 9 97 7
4 4
6
5 5
2
4 3 9 1
<1 1 1
2 37 2 8 5
2
32 2
2 4
2
12
316
9 5 9
Coarse grained
-)-«^ "H
It<y
5
8 4
12
4 0
0
0
0
2
10 10 12 8
12
0 0 0 0
0 0 0 0 0 0
32
4
3 3
0
0 0 0 0 0 0 0
7 5 3 8 4 9
7
4 32
3 3
3
5 5
5
5 0 3 4
« &
Isc?
0
0 0
0
0 0
0
0
0
0
2 2 1 1
2
0 0 0 0
0 0 0 0 0 0
2
3
34
0
0 0 0 0 0 0 0
1 112 10
0
1 12
1 1
4
5 3
2
4 0 6 4
iS3 § §Su®*- ft
0
0 0
0
0 0
0
0
0
0
0 00 0
0
0 0 0 0
0 0 0 0 0 0
0 0
12 0
0
0 0 0 0 0 0 0
0 0 0 0 0 0
0
<1 1
<10<1
<1
<11
<1<1
01 <1
"& IH tosi 3SPi 0p
6
10 10
19
14 10
15
5
9
11
2 12
7 4
6
13 1417 25
2 7 2 3 4 3
5 9
3
14
7
68 2 7
18 4 5
1 1 1 0 1 4
2
2 2
<1
12
8
7 4
8
8 0 6
10
1
lH
1
O
3
5 5
2
0 0
0
0
0
1
2 1 1 1
1
2 1
<1 0
0 0 0 0 0 0
10
0
1 11013
<1010
0 0 010<10
<1 <10
<1 11
1 <1
1 <1
0<12
Cation-exchange capacity
(meq per 100 g)
2.8 7.8 3.4 2.4 8.7 2.2
1.5 4.7 5.9 5.7 4.8 3.3
11 3.0 9.3 .8
.4
.2
.4
.3 4.8 .3
49
7.34.9
1.3 1.1.4 .5 .5
1.2
.9 1.4 41 1.9 1.1 4.3 .9 .9
.7 1.4 .7 .7
1.6 .7 .5 .8 .5
3.3
.4
.8 4.0 .9
43 .5 .6 .6
44
.5
.3
.6 1.8 .4
1.8
1.0 3.2 7.0 .9 .7
4.0 1.4
1.2 3.8 1.3 2.3

MINERALOGY AND CATION-EXCHANGE CAPACITY OF SEDIMENTS
TABLE 9. Mineralogy and cation-exchange capacity of stream sands Continued
D21
Stream
No. (fig. 1)
12
13
14
15
16
17
18
19
20
21
Name
San Juan Eiver Bloomfield.
Animas Eiver..
San Juan River Ship- rock.
Colorado Eiver, Utah.
Cheyenne Eiver.
Big Horn Eiver.
Cosumnes Eiver.
Cache Creek. _.
Mad Eiver.....
Crooked Eiver .
Date of sampling
12-10-59 4-9-61 5-24-61 5-24-61 6-8-61 7-12-61
10-10-61 10-10-61
5-26-61 6- 8-61
10-10-61 10-10-61 10-10-61
5-26-61 6-8-61 6-8-61
10-10-61 10-10-61
11- 3-60 5-26-61 5-26-61 6- 2-61 6-2-61 6- 6-61 6- 6-61 6-18-61 6-18-61 4-10-62 4-10-62
8-31-60
9- 1-60 9-12-61 9-12-61
12-14-60 3-7-62 3-7-62 4-12-62
12-27-60 4-14-62
10-19-60 12-2-60 12-2-60 6-8-61 4-16-62
11-16-60 3-29-61 5- 1-61 5- 3-61 4-18-32 4-18-62
Ratio of
discharge when
sampled to
average discharge
.2 2.3 3.1 3.11.7 .4
1.8 1.8
3.52.3 .8 .8 .8
2.8 1.9 1.9 1.4 1.4
.32.2 2.2 2.5 2.5 1.4 1.4 1.3 1.3 .9 .9
.05
.3 1.1 1.1
.05 6.9 6.9 1.6
.01 <01
.02 5.5 5.5 .3
1
.2 1.7 .9 .9
6 6
Type of sample
Sus __Sus. _ .Bed. ....
Bed __ .Bed. ....Bed Sus. __
Sus.....Bed. _ .Sus. ....
Bed Sus. ....Bed.....
Bed..... Bed
Bed.....Sus.. Bed.....
Bed Sus.. Bed. ....Sus .....
Bed
Bed- Bed Sus
Bed-Bed
Bed -
Bed _ Bed-
Bed - Bed-
Bed Bed
Bed- Bed Bed-Bed Bed-
Constituents (weight percent)
1.2
O
.16
.09
.64
.11
.11
.08
.17
.12
.10
.07
.22
.24
.25
.35
Mineral carbon
.02
.01
.60
.36
.12
.13
.06
<.01
<.01 .05
.01
.03
.01
.01
Total carbon
.18
.10
.98
1.24 .47
.23
.21
.23
.12
.10
.12
.23
.27
.26
.36
SJ
<§
41
32 3438 49
42 47
48
51
58 49
38
48
56
52
48
46 44
37 43
35
15 6
9
4
1 1
1 <1
B £ o
i
<ii i
i i
ii
<i8
3
3
2
2
5
5 5
0 0
<1
1 2
5
3
12
1 1
K-feldspar
16
16 20 17 12
12 9
15
16
7 6
10
7
9
4
18
8 9
9 4
7
2 <1
0
0
<10
01
P-feldspar
7
6 6 9
23
8 15
6
7
6 3
11
5
5
2
7
11 14
12 11
16
6 2
8
3
3329
24 21
!«
0
0<1<1
0
1 1
0
0
<1 <1
0
0
0
1
0
10
4 4
3
<1 <1
<1
<1
<10
0 0
Muscovite
0
0 0 0 0
0 0
0
0
0 0
0
0
0
0
0
0 0
0 0
<10 0
0
0
0 0
0 0
Ampbiboles
0
0 0 0 0
0 0
0
0
0 0
<10
0
<1
>1
<10
1 110 0
0
0
32
2 1
i s&
PM
0
0 0 0 0
0 0
0
0
010
0
<1<1
0
<1 <1
<10
10 0
1
3
4 3
4 1
Carbonates
0
0 0 1 0
<1 <1
<1
1
7 1
2
2
3
4
1
2 2
0 0
0
0 0
<1
1
0110
"So _o
"o >
0
0 0 0 0
0 0
0
0
0 0
0
0
0
0
0
0 0
0 0
0
0 0
2
3
10 15
8 13
"8
at 02
0
0 0 0 0
0 0
0
0
0 0
0
0
0
0
0
0 0
0 0
0
5 9
0
0
0 0
0 0
o>O1 C3fto
0
0 0 0 0
0 0
0
0
21
<112
1
0
<10
2 0
0
12
0
0
7 2
1 <1
Ui
5ts 0
_o
0
<1
<10 01
<18
0
<1
2 <1
<1
<1
2
<1
0
0 0
0 0
<10 0
<1
0
1 <1
01
Eock fragments
a
£
2
36 9 4
108
3
2
5 8
7
10
7
9
5
7 8
5 9
9
24 25
23
25
19 18
17 38
Coarse grained
**ll13 &
15
22 14 9 1
10 1
10
8
1 3
2
3
1
3
7
2 4
54
3
9 6
4
6
0 0
0 0
Quart z+ feldspar
9
11 11 8 3
8 1
8
7
07
10
4
1
2
3
3 3
37
6
<1 <1
2
2
0 0
0 0
Feldspar+ feldspar
1
3 1 2
<1
10
1
1
0110
0
<1
2
0 0
2 3
3
0 0
0
0
0 0
0 0
Undiffer- entiated
8
6 6 6 6
6 6
7
5
9 12
15
16
11
18
4
15 10
16 13
15
3547
41
45
2127
4122
I 0
O
0
12 0 0
12
<1
1
0 0
0
111
<1
<1 <1
4 1
1
2 1
4
5
0 0
0 0
Cation-exchange capacity
(meq per 100 g)
2.2 1.2 1.1 2.3 .9
1.4 1.3 3.4
4.9 5.6 3.5 9.48.2
4.0 .9
1.6 1.4 3.1
4.2 1.2 2.5 1.2 2.0 1.3 4.1 2.4 5.3 2.9 5.4
1.5
2.2 1.3 3.6
2.1 3.7 7.9 2.9
2.9 4.5
6.0 5.8 7.0 4.8 7.7
9.1 12.0 17.0 12.0 15.0 18.4
1 Pumice fragments are common in coarse sand from the Eio Grande Eiver. Most of the pumice is at least partly devitrifled, and it has been counted as fine-grained rock fragments.
ately magnetic, or rock-fragment fraction, is responsible for much of the exchange capacity of the stream sand.
Table 9 shows that the exchange capacity of sand is related to the content of fine-grained rock fragments. The coarse-grained fragments contain relatively little clay. When consideration is also given to the kinds of clay minerals present (table 6, p. D13), the variation in exchange capacity of the sands is largely explained. For example, Yadkin River bed sand contains 4-5 percent fine-grained rock fragments, and any clay minerals present are likely to have rather low exchange
capacities. Hence, the overall exchange capacity of Yadkin River sand is about 0.3 meq per 100 g.
The Kansas River bed sand contains about 2 percent fine-grained rock fragments, but the clay present prob ably is montmorillonitic in part. Therefore, the ex change capacity of the sand is higher than the Yadkin River sand, about 0.7 meq per 100 g.
Crooked River bed sand contains 40-60 percent rock fragments (many of which are somewhat argillized or weathered igneous rocks), and 10-15 percent volcanic

D22 TRANSPORT OF RADIONUCLIDES BY ST'REAMS
glass which is commonly partly devitrified. Crooked River clay contains even more montmorillonite than the Kansas River clay. Thus, the exchange capacity of Crooked River bed sand is 9-17 meq per 100 g.
Mad River sand contains 70-80 percent rock frag ments, but the clay minerals in the Mad River are mainly chlorite and illite and lesser amounts of ex panding clay. Thus, the clay in the rock fragments can be expected to have only moderate exchange capacity. The overall exchange capacity of the Mad River sand, as a result, is 5-8 meq per 100 g.
EXCHANGE-CAPACITY VARIATION WITH GRAIN SIZE WITHIN THE SILT-SAND RANGE
Sand and silt from five streams and sand from six streams were separated into various size fractions as shown in table 10. The exchange capacity of each fraction was determined in order to establish the variation of exchange capacity with grain size.
In most of the streams the CEC (cation-exchange capacity) is low in the medium and coarse sizes but increases in the finer sizes. In 5 of the 14 streams, the CEC of the medium and coarse sand is higher than that of the fine sand and coarse silt because of the presence of numerous fine-grained rock fragments. In three of the streams, the CEC does not change appre ciably with increasing grain size in the medium and coarse sand sizes. This lack of change is believed due to an increase in rock fragments with increasing grain size, which compensates for the normal decrease in surface area and CEC with increasing grain size.
EFFECT OF DISPERSING AGENTS ON EXCHANGE CAPACITY OF SAND AND SILT
The method of size separation used in this study was intended to preserve the size distribution found in the streams as much as practicable. The intent was to separate only those grains which had flocculated
either in the stream or while in storage. A comparison was made, however, between the exchange capacity of sand and silt treated as described above and that of separate fractions of sand and silt which stood over night in a sodium hexametaphosphate dispersing solu tion, and then were agitated for 10 minutes by an air jet (Chu and Davidson, 1953). The dispersed silt and clay were removed from the sand and the dispersed clay from the silt prior to measuring the CEC. Results of the comparison are presented in table 11.
It should be noted that many published size analyses represent chemically and mechanically dispersed material.
The exchange capacity of both sand and silt de creases significantly as a result of the dispersion, but the percentage change varies greatly. In 4 of the 53 samples, an apparent increase in exchange capacity occurred; the reason for this is not known. The average decrease in exchange capacity of the sand is approximately 25 percent and of the silt about 40 percent. These percentages are probably an indication of the amount of high-exchange-capacity material re moved by the dispersing agent from the mineral-grain surfaces.
EFFECT OF EXCHANGE CAPACITY OF SEDIMENTS ON COMPOSITION OF STREAM WATER
Cations held adsorbed on stream sediments form a reservoir which helps stabilize the chemical composition of stream water. The effectiveness of this stabilizing action will depend on many factors, some of which are: (1) the ratio of adsorbed to dissolved cations in a sediment-water system, (2) the selectivity of the sedi ment for specifications, (3) the degree of "fixation" of cations, (4) the time of sediment-water contact, and (5) the opportunity for thorough mixing of sediment and water.
TABLE 10. Variation of exchange capacity with grain size in some samples of bed sand and silt
Stream
Brandywine Creek __________ _ _Junlata River ____________Yadkin River _ . ________ . ...Licking River _______ ...Mississippi River __________ .Kansas River ____________ _ ..Elk Creek ____ . ____ ........Colorado River, Tex ________ ...San Juan River, Shiprock ...........Colorado River, Utah _______ . . . .Cosumnes River __________ . . ...Cache Creek ___________ .Mad River .. ____________ ...Crooked River _____________ ..
Date of sample collec tion
2-26-61 4-14-61 6-22-61 2-27-61
10-11-60 5-8-61
10-13-60 6-20-61
10-10-61 5-26-61
12-14-60 4-14-62
10-19-60 3-29-61
Exchange capacity (meq per 100 g)
Size range (mm)
1-0.5
2.4 8.0 .8
10.2 .8 .7
1.3 .4 .9
1.8 1.9 2.7 6.3iai
0.5-0.25
2.4 6.5 .4
8.6 1.0 .8 .7 .4
1.4 1.7 2.9 4.4 7.5
12.6
0.25-0.125
2.2 2.2 .8
7.6 3.2 1.2 .6 .9
2.7 1.8 3.7 7.9 8.1
11.3
0.125-0.062
2.6 2.9 1.6 9.32.7 1.9 2.0 2.2 5.4 5.9 6.5
10.4 7.7
17.3
0.062-0.031
4.7 2.3
8.6
4.7
20.1
0.031-0.0155
5.7 10.7
6.5
8.6
37.8
0.0155-0.0078
10.4 12.6
10.4
21.3
42.2
0.0078-0.004
14.1 10.8
14.6
27.6
48.1
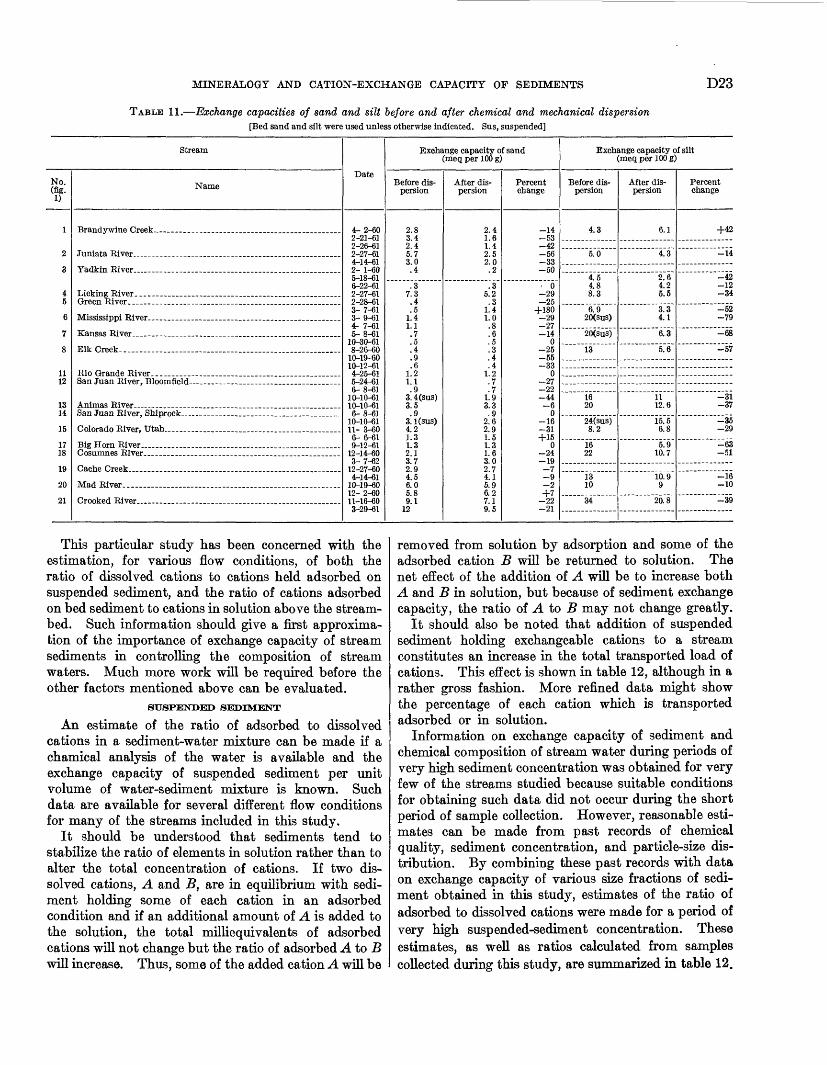
MINERALOGY AND CATION-EXCHANGE CAPACITY OF SEDIMENTS D23
TABLE 11. Exchange capacities of sand and silt before and after chemical and mechanical dispersion [Bed sand and silt were used unless otherwise indicated. Sus, suspended]
Stream
No. (fig. 1)
1
2
3
4 5
6
7
8
11 12
1314
15
1718
19
20
21
Name
Juniata River. ______ ______ ____________ _
YadkinRlver _-- _______ ________
Kansas River ____ _______ _____ _. . _________
Elk Creek-.. __ .. _ __ __ ... __ _____ . _ ___ _ __ ..
Colorado River, Utah. _________ _________ _______
Big Horn River.. ___ - _ _______ ___ _ _ _. - - _ ___
Crooked River ___________ __________________
Date
4-2-60 2-21-61 2-26-61 2-27-61 4-14-61 2- 1-60 5-18-61 6-22-61 2-27-61 2-28-61 3- 7-61 3- 9-61 4- 7-61 5-8-61
10-30-61 8-26-60
10-19-60 10-12-61 4-25-61 5-24-61 6-8-61
10-10-61 10-10-61 6- 8-61
10-10-61 11- 3-60 6- 6-61 9-12-61
12-14-60 3-7-62
12-27-60 4-14-61
10-19-60 12- 2-60 11-16-60 3-29-61
Exchange capacity of sand (meq per 100 g)
Before dis persion
2.8 3.4 2.4 5.7 3.0 .4
.3 7.3 .4 .5
1.4 1.1 .7 .5 .4 .9 .6
1.2 1.1 .9
3. 4 (sus) 3.5 .9
3.1 (sus) 4.2 1.3 1.3 2.1 3.7 2.9 4.5 6.0 5.8 9.1
12
After dis persion
2.4 1.6 1.4 2.5 2.0 .2
.35.2 .3
1.4 1.0 .8 .6 .5 .3 .4 .4
1.2 .7 .7
1.9 3.3 .9
2.6 2.9 1.5 1.3 1.6 3.0 2.7 4.1 5.9 6.2 7.1 9.5
Percent change
-14 -53 -42 -56 -33 -50
0 -29 -25
+180 -29 -27 -14
0 -25 -55 -33
0 -27 -22 _ 44-6
0 -16 -31+15o-24 -19 -7 -9 -2 +7
-22 -21
Exchange capacity of silt (meq per 100 g)
Before dis persion
4.3
5.0
4.5 4.8 8.3
6 9 20(sus)
20(sus)
13
16 20
24(sus) 8.2
1622
13 10
34
After dis persion
6.1
4.3
2.6 4.2 5.5
3.3 4.1
6.3
5.6
11 12.6
15.5 6.8
5.9 10.7
10.9 9
20.8
Percent change
+42
-14
-42 -12 -34
-52 -79
-68
-57
-31 -37
-35-29
-63-51
-16 -10
-39
This particular study has been concerned with the estimation, for various flow conditions, of both the ratio of dissolved cations to cations held adsorbed on suspended sediment, and the ratio of cations adsorbed on bed sediment to cations in solution above the stream- bed. Such information should give a first approxima tion of the importance of exchange capacity of stream sediments in controlling the composition of stream waters. Much more work will be required before the other factors mentioned above can be evaluated.
SUSPENDED SEDIMENT
An estimate of the ratio of adsorbed to dissolved cations in a sediment-water mixture can be made if a chamical analysis of the water is available and the exchange capacity of suspended sediment per unit volume of water-sediment mixture is known. Such data are available for several different flow conditions for many of the streams included in this study.
It should be understood that sediments tend to stabilize the ratio of elements in solution rather than to alter the total concentration of cations. If two dis solved cations, A and B, are in equilibrium with sedi ment holding some of each cation in an adsorbed condition and if an additional amount of A is added to the solution, the total milliequivalents of adsorbed cations will not change but the ratio of adsorbed A to B will increase. Thus, some of the added cation A will be
removed from solution by adsorption and some of the adsorbed cation B will be returned to solution. The net effect of the addition of A will be to increase both A and B in solution, but because of sediment exchange capacity, the ratio of A to B may not change greatly.
It should also be noted that addition of suspended sediment holding exchangeable cations to a stream constitutes an increase in the total transported load of cations. This effect is shown in table 12, although in a rather gross fashion. More refined data might show the percentage of each cation which is transported adsorbed or in solution.
Information on exchange capacity of sediment and chemical composition of stream water during periods of very high sediment concentration was obtained for very few of the streams studied because suitable conditions for obtaining such data did not occur during the short period of sample collection. However, reasonable esti mates can be made from past records of chemical quality, sediment concentration, and particle-size dis tribution. By combining these past records with data on exchange capacity of various size fractions of sedi ment obtained in this study, estimates of the ratio of adsorbed to dissolved cations were made for a period of very high suspended-sediment concentration. These estimates, as well as ratios calculated from samples collected during this study, are summarized in table 12.
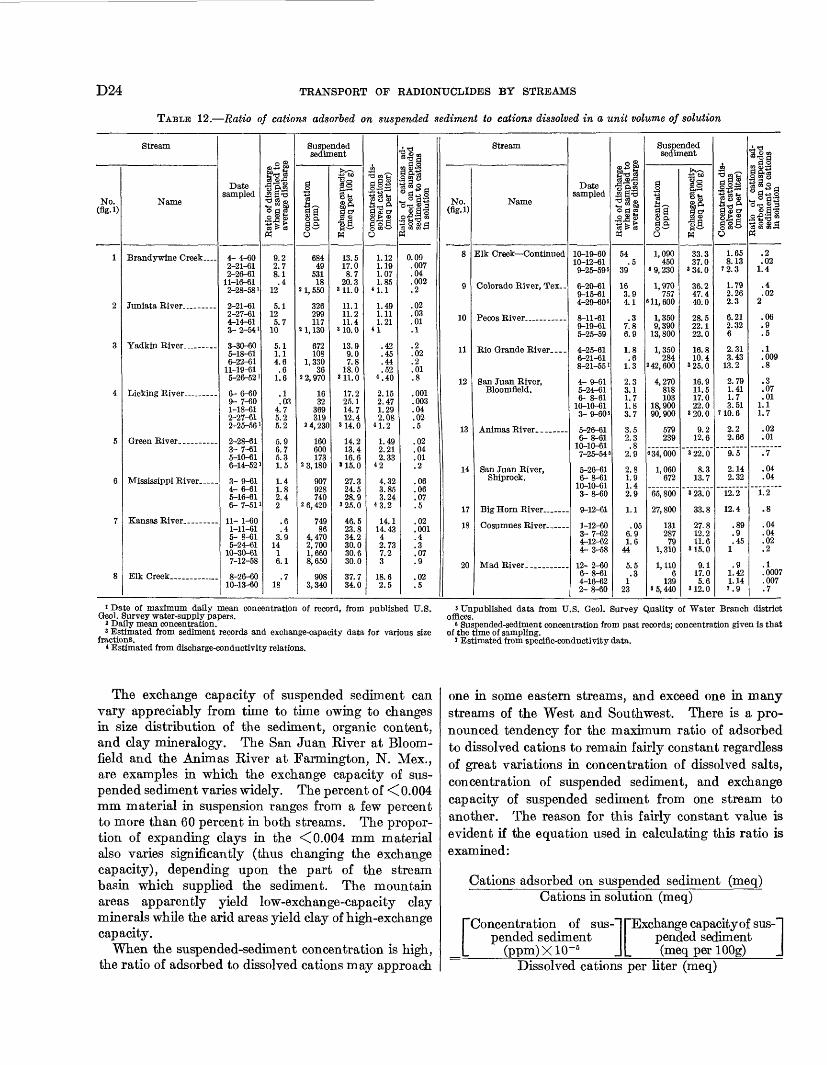
D24 TRANSPORT OF RADIONUCLIDES BY STREAMS
TABLE 12. Ratio of cations adsorbed on suspended sediment to cations dissolved in a unit volume of solution
Stream
No. (fig.l)
1
2
3
4
5
6
7
8
Name
Brandywine Creek ....
Yadkin River-
Green River. __ ..
Mississippi River.
Kansas River __ .
Elk Creek ____ ....
Date sampled
4- 4-60 2-21-61 2-26-61
11-16-612-28-58'
2-21-612-27-61 4-14-61 3-2-54'
3-30-60 5-18-61 6-22-61
11-19-615-26-52 1
6-6-60 9- 7-60 1-18-61 2-27-612-25-56 1
2-28-613- 7-61 5-10-616-14-52
3- 9-61 4- 6-61 5-16-616- 7-51
11- 1-60 1-11-61 5- 8-61 5-24-61
10-30-617-12-58
8-26-60 10-13-60
§£fatio of discha
when sample average disch
«
9.2 2.7 8.1.4
12
5.112 5.7
10
5.1 1.1 4.6 .6
1.6
.1
.03 4.7 5.25.2
5.96.7 5.31.5
1.4 1.8 2.42
.6
.4 3.9
14 16.1
.7 18
Suspendedsediment
oncentration
(ppm)
0
684 49
53118
2 1, 550
326299 117
2 1, 130
672 108
1,330 36
2 2, 970
16 32
369 319
2 4, 230
160600 173
2 3, 180
907 928 740
2 6, 420
749 86
4,470 2,700 1,6608,650
908 3,340
£"56
xchangecapac (meq per 100
H
13.5 17.08.7
20.3811.0
11.111.2 11.4
810.0
13.9 9.07.8
18.0311.0
17.2 25.1 14.7 12.4
314.0
14.213.4 16.6
»15.0
27.324.5 28.9
825.0
46.5 23.8 34.2 30.0 30.630.0
37.7 34.0
.S3 ^
oncentration solved cation (meq per lite
0
1.12 1.19 1.071.85
1.491.11 1.21
U
.42
.45
.44
.524.40
2.15 2.47 1.29 2.08
41.2
1.492.21 2.33
42
4.32 3.85 3.24
43.2
14.1 14.43
4 2.73 7.23
18.6 2.5
a ® »
i Matio of cati sorbed on su sediment to c
in solution
M
0.09 .007 .04.002 .2
.02
.03
.01
.1
.2
.02
.2
.01
.8
.001
.003
.04
.02
.5
.02
.04
.01
.2
.06
.06
.07
.5
.02
.001
.4
.3
.07
.9
.02
.5
Stream
No.
8
9
10
11
12
13
14
17
18
20
Name
Elk Creek Continued
Colorado River, Tex..
Rio Grande River....
San Juan River,Bloomfleld.
San Juan River,Shiprock.
Date sampled
10-19-60 10-12-61 9-25-595
6-20-61 9-15-614-29-605
8-11-61 9-19-61 5-25-59
4-25-61 6-21-61 8-21-55 1
4-9-615-24-61 6- 8-61
10-10-61 3- 9-605
5-26-616-8-61
10-10-617-25-545
5-26-616-8-61
10-10-61 3-8-60
9-12-61
1-12-60 3- 7-62 4-12-62 4-3-58
12- 2-606-8-61 4-16-62 2- 8-60
oSS Sf«8
atio of discha when sample average disci:
M
54 .5
39
16 3.94.1
.37.8 6.9
1.8 .6
1.3
2.33.11.7 1.8 3.7
3.52.3
2.9
2.81.9 1.4 2.9
1.1
.05 6.9 1.6
44
5.5.3
1 23
Suspendedsediment
oncentration
(ppm)
O
1,090 450
« 9, 230
1,970 757
«11,600
1,350 9,390
13, 800
1,350 284
242,600
4,270818 103
18, 900 90, 900
579239
634,000
1,060672
65, 800
27, 800
131 287
79 1,310
1,1106
139 6 5, 440
>S8
xchangecapac (meq per 100
H
33.3 37.0
834.0
36.2 47.440.0
28.5 22.1 22.0
16.8 10.4
325.0
16.911.5 17.0 22.0
820.0
9 212.6
322.0
8.313.7
323.0
33.8
27.8 12.2 11.6
815.0
9.117.0 5.6
312.0
I M ~
oncentration solved cation (meq per lite
O
1.65 8.13
'2.3
1.79 2.262.3
6.21 2.32 6
2.31 3.43
13.2
2.791.41 1.7 3.51
'10.6
2.22.66
9.5
2.142.32
12.2
12.4
.89
.9
.45 1
.91.42 1.14 '.9
01 '"' S
atio of cati sorbed on su sediment to < in solution
«
.2
.02 1.4
.4
.022
.06
.9
.5
.1
.009
.8
.3
.07
.01 1.1 1.7
.02
.01
.7
.04
.04
1.2
.8
.04
.04
.02
.2
.1
.0007
.007
.7
1 Date of maximum daily mean concentration of record, from published U.S. Geol. Survey water-supply papers.
2 Daily mean concentration.3 Estimated from sediment records and exchange-capacity data for various size
fractions.4 Estimated from discharge-conductivity relations.
s Unpublished data from U.S. Geol. Survey Quality of Water Branch district
« Suspended-sediment concentration from past records; concentration given is that of the time of sampling. ' Estimated from specific-conductivity data.
The exchange capacity of suspended sediment can vary appreciably from time to time owing to changes in size distribution of the sediment, organic content, and clay mineralogy. The San Juan River at Bloom- field and the Animas River at Farmington, N. Mex., are examples in which the exchange capacity of sus pended sediment varies widely. The percent of <C0.004 mm material in suspension ranges from a few percent to more than 60 percent in both streams. The propor tion of expanding clays in the <0.004 mm material also varies significantly (thus changing the exchange capacity), depending upon the part of the stream basin which supplied the sediment. The mountain areas apparently yield low-exchange-capacity clay minerals while the arid areas yield clay of high-exchange capacity.
When the suspended-sediment concentration is high, the ratio of adsorbed to dissolved cations may approach
one in some eastern streams, and exceed one in many streams of the West and Southwest. There is a pro nounced tendency for the maximum ratio of adsorbed to dissolved cations to remain fairly constant regardless of great variations in concentration of dissolved salts, concentration of suspended sediment, and exchange capacity of suspended sediment from one stream to another. The reason for this fairly constant value is evident if the equation used in calculating this ratio is examined:
Cations adsorbed on suspended sediment (meq) Cations in solution (meq)
["Concentration of sus-~pended sediment
L (ppm)XlO-5
"Exchange capacity of sus pended sediment (meq per 1 OOg)
Dissolved cations per liter (meq)
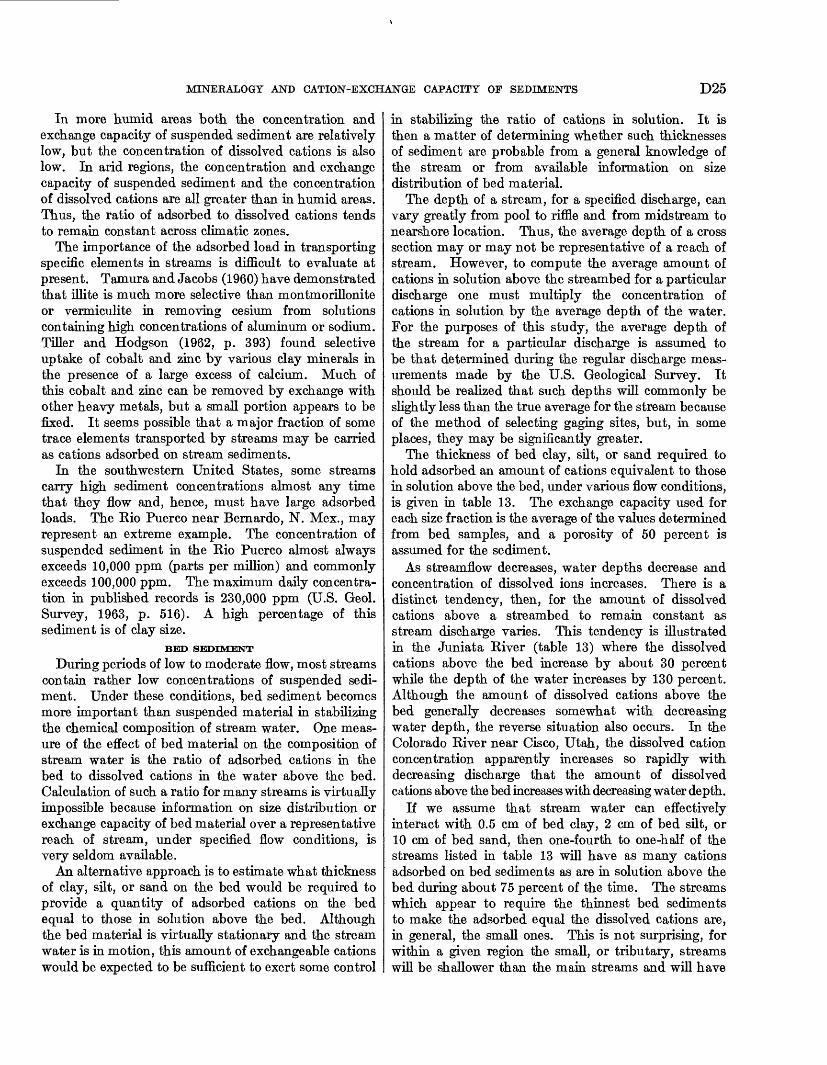
MINERALOGY AND CATION-EXCHANGE CAPACITY OF SEDIMENTS D25
In more humid areas both the concentration and exchange capacity of suspended sediment are relatively low, but the concentration of dissolved cations is also low. In arid regions, the concentration and exchange capacity of suspended sediment and the concentration of dissolved cations are all greater than in humid areas. Thus, the ratio of adsorbed to dissolved cations tends to remain constant across climatic zones.
The importance of the adsorbed load in transporting specific elements in streams is difficult to evaluate at present. Tamura and Jacobs (1960) have demonstrated that illite is much more selective than montmorillonite or vermiculite in removing cesium from solutions containing high concentrations of aluminum or sodium. Tiller and Hodgson (1962, p. 393) found selective uptake of cobalt and zinc by various clay minerals in the presence of a large excess of calcium. Much of this cobalt and zinc can be removed by exchange with other heavy metals, but a small portion appears to be fixed. It seems possible that a major fraction of some trace elements transported by streams may be carried as cations adsorbed on stream sediments.
In the southwestern United States, some streams carry high sediment concentrations almost any time that they flow and, hence, must have large adsorbed loads. The Rio Puerco near Bernardo, N. Mex., may represent an extreme example. The concentration of suspended sediment in the Rio Puerco almost always exceeds 10,000 ppm (parts per million) and commonly exceeds 100,000 ppm. The maximum daily concentra tion in published records is 230,000 ppm (U.S. Geol. Survey, 1963, p. 516). A high percentage of this sediment is of clay size.
BED SEDIMENT
During periods of low to moderate flow, most streams contain rather low concentrations of suspended sedi ment. Under these conditions, bed sediment becomes more important than suspended material in stabilizing the chemical composition of stream water. One meas ure of the effect of bed material on the composition of stream water is the ratio of adsorbed cations in the bed to dissolved cations in the water above the bed. Calculation of such a ratio for many streams is virtually impossible because information on size distribution or exchange capacity of bed material over a representative reach of stream, under specified flow conditions, is very seldom available.
An alternative approach is to estimate what thickness of clay, silt, or sand on the bed would be required to provide a quantity of adsorbed cations on the bed equal to those in solution above the bed. Although the bed material is virtually stationary and the stream water is in motion, this amount of exchangeable cations would be expected to be sufficient to exert some control
in stabilizing the ratio of cations in solution. It is then a matter of determining whether such thicknesses of sediment are probable from a general knowledge of the stream or from available information on size distribution of bed material.
The depth of a stream, for a specified discharge, can vary greatly from pool to riffle and from midstream to nearshore location. Thus, the average depth of a cross section may or may not be representative of a reach of stream. However, to compute the average amount of cations in solution above the streambed for a particular discharge one must multiply the concentration of cations in solution by the average depth of the water. For the purposes of this study, the average depth of the stream for a particular discharge is assumed to be that determined during the regular discharge meas urements made by the U.S. Geological Survey. It should be realized that such depths will commonly be slightly less than the true average for the stream because of the method of selecting gaging sites, but, in some places, they may be significantly greater.
The thickness of bed clay, silt, or sand required to hold adsorbed an amount of cations equivalent to those in solution above the bed, under various flow conditions, is given in table 13. The exchange capacity used for each size fraction is the average of the values determined from bed samples, and a porosity of 50 percent is assumed for the sediment.
As streamflow decreases, water depths decrease and concentration of dissolved ions increases. There is a distinct tendency, then, for the amount of dissolved cations above a streambed to remain constant as stream discharge varies. This tendency is illustrated in the Juniata River (table 13) where the dissolved cations above the bed increase by about 30 percent while the depth of the water increases by 130 percent. Although the amount of dissolved cations above the bed generally decreases somewhat with decreasing water depth, the reverse situation also occurs. In the Colorado River near Cisco, Utah, the dissolved cation concentration apparently increases so rapidly with decreasing discharge that the amount of dissolved cations above the bed increases with decreasing water depth.
If we assume that stream water can effectively interact with 0.5 cm of bed clay, 2 cm of bed silt, or 10 cm of bed sand, then one-fourth to one-half of the streams listed in table 13 will have as many cations adsorbed on bed sediments as are in solution above the bed during about 75 percent of the time. The streams which appear to require the thinnest bed sediments to make the adsorbed equal the dissolved cations are, in general, the small ones. This is not surprising, for within a given region the small, or tributary, streams will be shallower than the main streams and will have
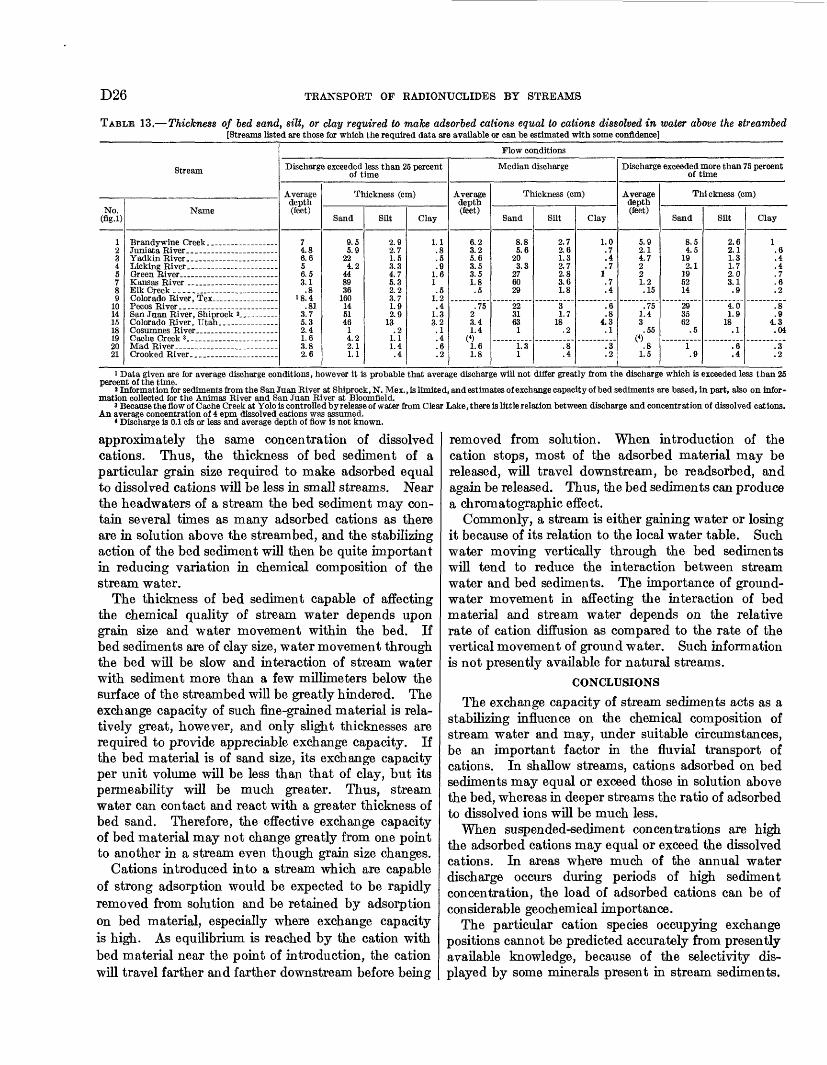
D26 TRANSPORT OF RADIONUCLIDES BY STREAMS
TABLE 13. Thickness of bed sand, silt, or clay required to make adsorbed cations equal to cations dissolved in water above the streambed [Streams listed are those for which the required data are available or can be estimated with some confidence]
Stream
No. (flg.l)
1 2 3 4 5 7 8 9
10 14 15 18 19 20 21
Name
Elk Creek __ ....... ..... .
Colorado River, Utah.. ____ _
Flow conditions
Discharge exceeded less than 25 percent of time
Average depth (feet)
7 4.8 6.6 5 6.5 3.1 .8
18.4 .81
3.7 5.3 2.4 1.6 3.8 2.6
Thickness (cm)
Sand
9.5 5.9
22 4.2
44 89 36
160 14 51 46
1 4.2 2.1 1.1
Silt
2.9 2.7 1.5 3.3 4.7 5.3 2.2 3.7 1.9 2.9
13 .2
1.1 1.4 .4
Clay
1.1 .8 .5 .9
1.6 1 .5
1.2 .4
1.3 3.2 .1 .4 .6 .2
Median discharge
Average depth (feet)
6.2 3.2 5.6 3.5 3.5 1.8 .5
.75 2 3.4 1.4
(4) 1.6 1.8
Thickness (cm)
Sand
8.8 5.6
20 3.3
27 60 29
22 31 63
1
1.31
Silt
2.7 2.6 1.3 2.7 2.8 3.6 1.8
3 1.7
18 .2
.8
.4
Clay
1.0.7 .4.7
1 .7 .4
.6
.8 4.3 .1
.3
.2
Discharge exceeded more than 75 percent of time
Average depth (feet)
5.9 2.1 4.7 2 2 1.2 .15
.75 1.4 3 .55"..
1.5
Thickness (cm)
Sand
8.5 4.5
19 2.1
19 52 14
29 35 62
.5
1 .9
Silt
2.6 2.1 1.3 1.7 2.0 3.1 .9
4.0 1.9
18 .1
.6
.4
Clay
1 .6.4 .4 .7 .6 .2
.8
.9 4.3 .04
.3
.2
1 Data given are for average discharge conditions, however it is probable that average discharge will not difler greatly from the discharge which is exceeded less than 25 percent of the time.
* Information for sediments from the San Juan River at Shiprock.N. Mex., is limited, and estimates of exchange capacity of bed sediments are based, in part, also on infor mation collected for the Animas River and San Juan River at Bloomfleld.
3 Because the flow of Cache Creek at Yolo is controlled by release of water from Clear Lake, there is little relation between discharge and concentration of dissolved cations. An average concentration of 4 epm dissolved cations was assumed.
4 Discharge is 0.1 cfs or less and average depth of flow is not known.
approximately the same concentration of dissolved cations. Thus, the thickness of bed sediment of a particular grain size required to make adsorbed equal to dissolved cations will be less in small streams. Near the headwaters of a stream the bed sediment may con tain several times as many adsorbed cations as there are in solution above the streambed, and the stabilizing action of the bed sediment will then be quite important in reducing variation in chemical composition of the stream water.
The thickness of bed sediment capable of affecting the chemical quality of stream water depends upon grain size and water movement within the bed. If bed sediments are of clay size, water movement through the bed will be slow and interaction of stream water with sediment more than a few millimeters below the surface of the streambed will be greatly hindered. The exchange capacity of such fine-grained material is rela tively great, however, and only slight thicknesses are required to provide appreciable exchange capacity. If the bed material is of sand size, its exchange capacity per unit volume will be less than that of clay, but its permeability will be much greater. Thus, stream water can contact and react with a greater thickness of bed sand. Therefore, the effective exchange capacity of bed material may not change greatly from one point to another in a stream even though grain size changes.
Cations introduced into a stream which are capable of strong adsorption would be expected to be rapidly removed from solution and be retained by adsorption on bed material, especially where exchange capacity is high. As equilibrium is reached by the cation with bed material near the point of introduction, the cation will travel farther and farther downstream before being
removed from solution. When introduction of the cation stops, most of the adsorbed material may be released, will travel downstream, be readsorbed, and again be released. Thus, the bed sediments can produce a chromatographic effect.
Commonly, a stream is either gaining water or losing it because of its relation to the local water table. Such water moving vertically through the bed sediments will tend to reduce the interaction between stream water and bed sediments. The importance of ground- water movement in affecting the interaction of bed material and stream water depends on the relative rate of cation diffusion as compared to the rate of the vertical movement of ground water. Such information is not presently available for natural streams.
CONCLUSIONS
The exchange capacity of stream sediments acts as a stabilizing influence on the chemical composition of stream water and may, under suitable circumstances, be an important factor in the fluvial transport of cations. In shallow streams, cations adsorbed on bed sediments may equal or exceed those in solution above the bed, whereas in deeper streams the ratio of adsorbed to dissolved ions will be much less.
When suspended-sediment concentrations are high the adsorbed cations may equal or exceed the dissolved cations. In areas where much of the annual water discharge occurs during periods of high sediment concentration, the load of adsorbed cations can be of considerable geochemical importance.
The particular cation species occupying exchange positions cannot be predicted accurately from presently available knowledge, because of the selectivity dis played by some minerals present in stream sediments.
MINERALOGY AND CATION-EXCHANGE CAPACITY OF SEDIMENTS D27
Much of the information regarding the fraction of a specific cation held adsorbed or in solution must be obtained from experimental work.
Cesium is an element that is known to be selectively sorbed by illite. Inasmuch as illite is present in many of the streams studied, it is probable that most cesium entering a stream will be removed from solution by the sediments.
Amorphous alumina and silica usually comprise not more than a few percent and organic material com monly 2-8 percent of the stream clays. If stream organic matter is similar to soil organic matter in chemical reactivity, it may be highly selective in removing elements from solution. The effect of the amorphous material on dissolved cations is not known.
In summary, results of this study have shown that the mineralogy and exchange capacity of stream sedi ments must be considered in understanding the chem istry of stream waters. Much work remains, however, before accurate predictions can be made regarding the fraction of a particular cation which is in solution or adsorbed.
REFERENCES CITED
Albrecht, W. A., 1947, Our teeth and our soils: Annals of Den tistry, v. 6, p. 199-213.
Anderson, C. A., 1936, Volcanic history of the Clear Lake area:Geol. Soc. America Bull., v. 47, p. 629-664.
Badgley, W. A., and Crumpton, C. F., 1964, Clay mineralogy, in Bell, E. L., and others, Soil survey of Logan County, Kansas: U.S. Dept. Agriculture, Dec. 1959, no. 35, p. 71-73.
Barshad, Isaac, 1948, Vermiculite and its relation to biotite as revealed by base exchange reactions, X-ray analyses, differ ential thermal curves, and water content: Am. Mineralogist, v. 33, no. 11-12, p. 655-678.
1950, The effect of interlayer cations on the expansion ofthe mica type of crystal lattice: Am. Mineralogist, v. 35,p. 225-238.
Beetem, W. A., Janzer, V. J., and Wahlberg, J. S., 1962, Use ofcesium-137 in the determination of cation exchange capacity:U.S. Geol. Survey Bull. 1140-B, p. 1-8.
Blanco, R. E., and Struxness, E. G., 1961, Waste treatment anddisposal progress report for April and May 1961: U.S.Atomic Energy Comm. Kept. CF-61-7-3, Oak Ridge, Tenn.,Oak Ridge Natl. Lab.
Broadbent, F. E., 1953, The soil organic fraction, in Norman,A. G., Advances in Agronomy: New York, v. 5, p. 175-176.
Brown, G., 1953, The dioctahedral analogue of vermiculite: ClayMinerals Bull., v. 2, p. 54-70.
1961, The X-ray identification and crystal structures of clay minerals: Mineralog. Soc., London, 544 p.
Burbank, W. S., Levering, T. S., Goddard, E. N., and Eckel, E. B., 1935, Geologic map of Colorado: U.S. Geol. Survey, scale, 1:500,000.
Carrit, D. E., and Goodgal, S. H., 1953, The sorptive and zeolitic properties of natural water-borne silts, with relation to their capacities to remove, transport, concentrate, and regenerate radioactive waste components in natural waters: U.S. Atomic Energy Comm. NYO-4591, 97 p.
Chu, T. Y., and Davidson, D. T., 1953, Simplified air-jet dis persion apparatus for mechanical analysis of soils: Highway Research Board Proc., v. 32, p. 541-547.
Coleman, N. T., Jackson, M. L., and Mehlich, A., 1950, Mineral composition of the clay fraction II, of several coastal plain, piedmont, and mountain soils of North Carolina: Soil Sci. Soc. America Proc., v. 14, p. 81-85.
Darton, N. H., 1928, Geologic map of New Mexico: U.S. Geol. Survey, scale 1:2,500,000.
1951, Geologic map of South Dakota: U.S. Geol. Survey,scale, 1:500,000.
Darton, N. H., Stephenson, L. W., and Gardner, J. A., 1937,Geologic map of Texas: U.S. Geol. Survey, scale 1:500,000.
Dixon, J. B. and Jackson, M. L., 1959, Dissolution of interlayersfrom intergradient soil clays after preheating at 400°C:Science, v. 129, p. 1616-17.
Fagg, D. B., 1957, A geologic study of Matagorda Bay, Texas:Texas Agr. Mech. College, M. S. thesis, 170 p.
Fenneman, N. M., and Johnson, D. W., 1946, Physical divisionsof the United States: U.S. Geol. Survey map.
Folk, R. L., Hayes, M. O., Brown, T. E., Eargle, D. H., Weeks,A. D., Barnes, V. E., and Claybaugh, S. E., 1961, Fieldexcursion Central Texas: Austin, Texas Univ. Bur. Econ.Geology, Guidebook 3.
Gabriel, A., and Cox, E. P., 1929, A staining method for thequantitative determination of certain rock minerals: Am.Mineralogist, v. 14, no. 8, p. 290-292.
Goke, A. W., and Hollopeter, C. A., 1931, Soil survey of KiowaCounty, Oklahoma: U.S. Dept. Agriculture, ser. 1931, no. 14,39 p.
Goke, A. W., Hollopeter, C. A., and Fisher, C. F., 1941, Soilsurvey of Washita County, Oklahoma: U.S. Dept. Agri culture, ser. 1935, no. 17, 44 p.
Griffin, G. M., 1962, Regional clay-mineral facies Productsof weathering intensity and current distribution in thenortheastern Gulf of Mexico: Geol. Soc. America Bull.,v. 73, no. 6, p. 737-768.
Hall, F. R., and Palmquist, W. N., Jr., 1960a, Availabilityof ground water in Boone, Campbell, Grant, Kenton, andPendleton Counties, Ky.: U.S. Geol Survey Hydrol. Inv.Atlas HA-15.
1960b, Availability of ground water in Bath, Fleming, and Montgomery Counties, Ky.: U.S. Geol. Survey Hydrol. Inv. Atlas HA-18.
Hashimoto, I., and Jackson, M. L., 1960, Rapid dissolution of allophane and kaolinite-halloysite after dehydration, in Clays and clay minerals: 7th Natl. Conf. Clays and Clay Minerals, 1958, Proc.; New York, Pergamon Press, p. 102-113.
Hathaway, J. C., 1955, Studies of some vermiculite-type clay minerals, in Clays and clay minerals: Natl. Acad. Sci.- Natl. Research Council Pub. 395, p. 74-86.
Holmes, R. S., and Hearn, W. E., 1942, Chemical and physical properties of some of the important alluvial soils of the Mississippi drainage basin: U.S. Dept. Agriculture Tech. 833, p. 70-71.
Jackson, M. L., 1959, Frequency distribution of clay minerals in major great soil groups as related to factors of soil for mation, in Clays and clay minerals: 6th Natl. Conf. Clays and Clay Minerals, 1957, Proc.; New York, Pergamon Press, p. 133-143.
Jenkins, O. P., 1938, Geologic map of California: California Dept. Natural Resources, Div. Geology, San Francisco, Calif.
Johns, W. D., and Grim, R. E., 1958, Clay mineral composition of recent sediments from the Mississippi River delta: Jour. Sed. Petrology, v. 28, p. 186-199.
Johnson, L. J., Matelski, R. P., and Engle, C. F., 1963, Clay mineral characterization of modal soil profiles in several Pennsylvania counties: Soil Sci. Soc. America Proc., v. 27, p. 568-572.

D28 TRANSPORT OF RADIONUCLIDES BY STREAMS
Kansas State Geological Survey, 1937, Geologic map of Kansas:Lawrence, Kansas Univ.
Keller, W. D., 1955, The principles of weathering: Columbia,Mo., Lucas Bros., 88 p.
1956, Clay minerals as influenced by environments oftheir formation: Am. Assoc. Petroleum Geologists Bull.,v. 40, p. 2689-2710.
Kelley, W. P., 1948, Cation exchange in soils: New York,Reinhold Publishing Corp., 144 p.
Kentucky Geological Survey, 1954, Geologic map of Kentucky:Lexington, Ky.
Kirby, J. M., 1943, Rumsey Hills area, in Geologic formationsand economic development of the oil and gas fields ofCalifornia: California Div. Mines Bull. 118, p. 6\)1.
Krieger, R. A., and Hendrickson, G. E., 1960, Effects ofGreensburg oilfield brines on the streams, wells, and springsof the upper Green River basin, Kentucky: Kentucky Geol.Survey Rept. Inv. 2, 36 p.
Kunkle, W. M., 1963, Soil survey of Chester and DelawareCounties, Pennsylvania: U.S. Dept. Agriculture, ser. 1959,no. 19, p. 109-113.
Kunze, G. W., Templin, E. H., and Page, J. B., 1955, The claymineral composition of representative soils from five geo logical regions of Texas, in Clays and clay minerals: Natl.Acad. Sci.-Natl. Research Council Pub. 395, p. 373-383.
North Carolina Department of Conservation and Development,1961, Geologic map of North Carolina: Scale 1:500,000.
Olmsted, F. H., and Hely, A. G., 1962, Relation between groundwater and surface water in Brandy wine Creek basin, Pa.:U.S. Geol. Survey Prof. Paper 417-A, p. 1-21.
Powers, M. C., 1953, Clay diagenesis in the Chesapeake Bayarea, in Clays and clay minerals: Natl. Acad. Sci.-Natl.Research Council, Pub. 327, p. 68-80.
Rader, L. F., Jr., and Grimaldi, F. S., 1961, Chemical analysesfor selected minor elements in Pierre shale: U.S. Geol.Survey Prof. Paper 391-A, p. 33-37.
Rainwater, F. H., 1962, Composition of rivers of the contermi nous United States: U.S. Geol. Survey Hydrol. Inv. AtlasHA-61, 3 pis.
Rich, C. I. and Obenshain, S. S., 1955, Chemical and claymineral properties of a red-yellow podzolic soil derived frommuscovite schist: Soil Sci. Soc. America Proc., v. 19, p.334-339.
Rich, C. I., 1960, Aluminum in interlayers of vermiculite: SoilSci. Soc. Amer. Proc., v. 24, p. 26-32.
Rosenblum, S., 1956, Improved techniques for staining potashfeldspars: Am. Mineralogist, v. 41, nos. 7 and 8, p. 662-664.
Ross, C. S., 1943, Clays and soils in relation to geologic processes:Wash. Acad. Sci. Jour., v. 33, p. 225-235.
Lee, W. D., 1955, The soils of North Carolina: Raleigh, NorthCarolina Agriculture Expt. Sta. Tech. Bull. 115, 187 p.
Love, J. D., Weitz, J. L., and Hose, R. K., 1955, Geologic map ofWyoming: U.S. Geol. Survey, scale 1:500,000.
Manning, G. A., and Ogle, B. A., 1950, Geology of the Blue Lakequadrangle: California Div. Mines Bull. 148, pi. 1, 1:62,500.
McBee, C, W., Fleming, E. L., Sallee, K. H., and Hamilton,V. L., 1961, Soil survey of Greeley County, Kansas: U.S.Dept. Agriculture Soil Cons. Service, ser. 1958, no. 12, p. 3-8,23-26.
Miser, H. D., 1954, Geologic map of Oklahoma: Norman, Okla homa Geol. Survey.
Nelson, B. W., 1960, Clay mineralogy of the bottom sediments,Rappahannock River, Virginia, in Clays and clay minerals:7th Natl. Conf. Clays and Clay Minerals, 1958, Proc.: NewYork, Pergamon Press, p. 135-147.
Nielsen, J. M., 1963, Behavior of radionuclides in the Columbia River, in Transport of radionuclides in fresh water systems: U.S. Atomic Energy Comm. Rept. TID-7664, p. 91-112, Office Tech. Services, Dept. Commerce, Washington, D.C., 20242.
Nielsen, J. M., and Perkins, R. W., 1962, The removal of radio- isotopes from the Columbia River by natural processes [abs.]: Jour. Geophys. Research, v. 67, no. 9, p. 3584.
Sawhney, B. L., 1960, Weathering and aluminum interlayers in a soil catena: Hollis-Charlton-Sutton-Leicester: Soil Sci. Soc. Amer. Proc., v. 24, p. 221-226.
Schultz, L. G. 1960, Quantitative X-ray determinations of some aluminous clay minerals in rocks, in Clays and clay minerals: 7th Natl. Conf. Clays and Clay Minerals, 1958, Proc.: New York, Pergamon Press, p. 210-224.
1964, Quantitative interpretation of mineralogical com position from X-ray and chemical data for the Pierre shale: U.S. Geol. Survey Prof. Paper 391-C, p. 1-31.
Simpson, E. S., Beetem, W. A., Ruggles, F. H., Jr., and others, 1959, Hydrologic and tracer studies in Mohawk River at Knolls Atomic Power Laboratory: U.S. Atomic Energy Comm. Research and Devel. Rept. SO-45, Washington Office Tech. Services, Dept. Commerce.
Stose, G. W., and Ljungstedt, O. A., compilers, 1932, Geologic map of the United States: U.S. Geol. Survey, scale, 1:2,- 500,000.
Taggart, M. S., Jr., and Kaiser, A. D., Jr., 1960, Clay mineralogy of Mississippi River deltaic sediments: Geol. Soc. America Bull., v. 71, no. 5, p. 521-530.
Tamura, Tsuneo, 1957, Identification of the 14 A clay mineral component: Am. Mineralogist, v. 42, p. 107-110.
1958, Identification of clay minerals from acid soils: Jour. Soil Sci., v. 9, no. 1, p. 141-147.
Tamura, Tsuneo, and Jacobs, D. G., 1960, Structural implica tions in cesium sorption: Health Physics, v. 2 p. 391-398.
Tiller, K. G., and Hodgson, J. F., 1962, The specific sorption of cobalt and zinc by layer silicates, in Clays and clay minerals: 9th Natl. Conf. Clays and Clay Minerals, 1960, Proc.: New York, Pergamon Press, p. 393-403.
U.S. Geological Survey, 1963, Quality of surface waters of the United States, 1958, pts. 7 and 8: U.S. Geol. Survey Water- Supply Paper 1573, p. 516.
U.S. Weather Bureau, 1960, Mean annual total precipitation: Natl. Atlas United States, 1 map sheet, scale 1 :10,000,000.
1962, Decennial census of United States climate: Clima tology of the United States, no. 81-4 to 81-42.
Van Houton, F. B., 1953, Clay minerals in sedimentary rocks and derived soils: Am. Jour. Sci., v. 251, p. 61-82.
Walker, G. F., 1949, The decomposition of biotite in the soil: Mineralog. Mag., v. 28, p. 693-703.
1958, Reactions of expanding-lattice minerals withglycerol and ethylene glycol: Clay Minerals Bull. 3, p.302-313.
Weed, S. B., and Nelson, L, A., 1962, Occurrence of chlorite-likeintergrade clay minerals in coastal plain, piedmont, andmountain soils of North Carolina: Soil Sci. Soc. AmericaProc., v. 26, p. 393-398.
Wilkinson, W. D., and Alien, J. E., 1939, Geologic map of RoundMountain quadrangle: Oregon Dept. Geology and MineralIndustries, scale 1 : 96,000.
Winsor, J. H., and Bailey, H. H., 1960, A key to Kentuckysoils: Kentucky Univ. Agr. Expt. Sta., Misc. Pub. 204, 35 p.
Wolman, M. G., 1955, The natural channel of BrandywineCreek, Pennsylvania: U.S. Geol. Survey Prof. Paper 271,56 p.