Embed Size (px)
Citation preview

ArticleRev Bras Cienc Solo 2019;43:e0190065
1https://doi.org/10.1590/18069657rbcs20190065
* Corresponding author: E-mail: [email protected]
Received: May 8, 2019Approved: July 17, 2019
How to cite: Silva Filho LA, Ker JC, Fontes MPF, Camêlo DL, Corrêa MM, Cavalcante LCD, Guimarães LM. Mineralogical evolution of magnetic Rhodic Oxisols under different lithological influences in Brazil. Rev Bras Cienc Solo. 2019;43:e0190065. https://doi.org/10.1590/18069657rbcs20190065
Copyright: This is an open-access article distributed under the terms of the Creative Commons Attribution License, which permits unrestricted use, distribution, and reproduction in any medium, provided that the original author and source are credited.
Mineralogical Evolution of Magnetic Rhodic Oxisols under Different Lithological Influences in BrazilLuiz Aníbal Silva Filho(1) , João Carlos Ker(2) , Maurício Paulo Ferreira Fontes(2) , Danilo de Lima Camêlo(3)* , Marcelo Metri Corrêa(4) , Luis Carlos Duarte Cavalcante(5) and Luciano de Moura Guimarães(6)
(1) Universidade Federal de Viçosa, Departamento de Solo, Programa de Pós-Graduação em Solos e Nutrição de Plantas, Viçosa, Minas Gerais, Brasil.
(2) Universidade Federal de Viçosa, Departamento de Solo, Viçosa, Minas Gerais, Brasil.(3) Universidade Federal do Espírito Santo, Departamento de Agronomia, Alegre, Espírito Santo, Brasil.(4) Universidade Federal Rural de Pernambuco, Unidade Acadêmica de Garanhuns, Garanhuns, Pernambuco, Brasil.(5) Universidade Federal do Piauí, Centro de Ciências da Natureza, Teresina, Piauí, Brasil.(6) Universidade Federal de Viçosa, Departamento de Física, Viçosa, Minas Gerais, Brasil.
ABSTRACT: Ferrimagnetic Fe-oxides are important soil components, which are present in most of the agricultural soils of Brazil. Distinction, origin, and assessment of the influence of these minerals on magnetism and geochemistry is a challenge for mineralogists. This study aimed to characterize mineralogically Fe-rich Rhodic Oxisols (Latossolos Vermelhos) originating from several mafic rocks in Brazil, and assess the implications on their magnetic and geochemical properties. We present results on magnetic measurements, chemical dissolutions, X-ray diffractometry, Rietveld refinement, Raman, and Mössbauer spectroscopies of Fe-rich Rhodic Oxisols originating from several mafic rocks. They show that magnetite is inherited from the parent material, and its oxidation leads to the formation of maghemite. In the coarse fractions (sand and silt), magnetite and maghemite coexist and are interstratified with hematite, confirmed by Raman spectroscopy. This limited the distinction between magnetite and maghemite by Mössbauer spectroscopy. Maghemite represents the only ferrimagnetic Fe oxide in the clay fraction. The influence of both ferrimagnetic minerals, magnetite and maghemite, on magnetic susceptibility and total content of trace elements is determined by the pedogenic development, even among highly weathered soils. In general, the coarse fractions contribute with most of the total trace element contents, while the clay fraction contributes to trace elements availability and magnetic susceptibility of soils.
Keywords: magnetite, maghemite, trace elements, mafic rocks, Raman spectroscopy.
Division – Soil Processes and Properties | Commission – Soil Mineralogy

Silva Filho et al. Mineralogical evolution of magnetic Rhodic Oxisols under different...
2Rev Bras Cienc Solo 2019;43:e0190065
INTRODUCTIONIron-rich Rhodic Oxisols (Latossolos Vermelhos) are of great interest worldwide due to their potential for agricultural use with technological management. In Brazil, these soils occur mainly in the central-western, southeastern, and southern regions and are generally derived from mafic rocks, such as basalt, gabbro, diabase, tuffite, and itabirite. Rhodic Oxisols exhibit strong magnetic attraction due to high contents of ferrimagnetic Fe oxides (maghemite and magnetite) (Costa et al., 1999, 2014; Camêlo et al., 2018; Poggere et al., 2018). These minerals have often been used in studies on pedogenesis (Silva et al., 2017; Camêlo et al., 2018) for stratification of environments (Ramos et al., 2017) and soil fertility (Costa et al., 2018) in Brazil and elsewhere in the world.
There are two main processes for the genesis of magnetite and maghemite in soils: the formation of maghemite through aerial oxidation of magnetite inherited from the parent material (lithogenic) (Fontes and Weed, 1991; Camêlo et al., 2018) and the neoformation of maghemite and magnetite from pedogenic Fe oxides in reducing environments under high temperatures (500-1,000 °C). This last process is common in areas under fire events, where magnetic expression is higher in soil surface horizons (Schwertmann and Fechter, 1984; Sousa et al., 2018). Magnetite can also originate from the process of biogenic mineralization (Maher, 1998; Savian et al., 2017) and maghemite from dehydration and structural rearrangement of ferrihydrite (Barrón and Torrent, 2002; Jiang et al., 2018).
In soils originating from mafic rocks, maghemite usually originates from aerial oxidation of magnetite inherited from the parent material (Fontes and Weed, 1991; Camêlo et al., 2018). Therefore, several authors have reported on magnetite predominance in the coarse fractions (sand and silt) and maghemite in the clay fraction (Costa et al., 1999; Carvalho Filho et al., 2015; Camêlo et al., 2018; Poggere et al., 2018) of Fe-rich Rhodic Oxisols in Brazil. However, it is known that both minerals can display distinct soil size fractions or occur in all of them (Causevic et al., 2004; Maxbauer et al., 2016; Silva et al., 2017; Costa et al., 2018).
Authors have also reported on the difficulty to distinguish magnetite and maghemite by conventional techniques, such as X-ray diffractometry, due to the similarity of the atomic planes of both minerals (Fontes et al., 2000; Camêlo et al., 2018), as well as Mössbauer spectroscopy, because of differing degrees of magnetite oxidation in soils (Singer et al., 1995). On the other hand, Raman spectroscopy is considered a fast and accurate tool for the identification of these minerals in soils (Hanesch, 2009; Sousa et al., 2018); nevertheless, it is still little used on magnetic Rhodic Oxisols.
As magnetite and maghemite can have different stability degrees (Sidhu et al., 1980), influencing magnetic susceptibility, and reserve of trace elements in soils (Camêlo et al., 2018), we believe that accurate differentiation of these minerals allows a better understanding of pedological, magnetic, and geochemical aspects of soils with direct implications on agricultural and environmental management. Therefore, this study aimed to characterize mineralogically Fe-rich Rhodic Oxisols originating from several mafic rocks in Brazil, and assess the implications on their magnetic and geochemical properties.
MATERIALS AND METHODS
Soil sampling and characterization procedures
We collected Bw horizons samples of 12 Fe-rich Rhodic Oxisols (Latossolos Vermelhos) originating from mafic rocks (8 basalt, 2 tuffite, 1 diabase, and 1 itabirite) in Brazil at the layer of 0.80-1.00 m (Figure 1). The samples were air-dried, gently crumbled, and sieved through 2 mm mesh to obtain the air-dried fine earth fraction (ADFE). For the taxonomic classification of soils, we determined particle size composition, particle density, pH(H2O and KCl 1 mol L-1), exchangeable Ca and Mg, Na, K, and P extracted with Mehlich-1, exchangeable Al, and potential acidity (H+Al) in ADFE (Teixeira et al., 2017).

Silva Filho et al. Mineralogical evolution of magnetic Rhodic Oxisols under different...
3Rev Bras Cienc Solo 2019;43:e0190065
The ADFE was submitted to dispersion with NaOH 0.1 mol L-1 and mechanical shaking at slow speed (50 rpm) for 16 h to separate the sand fraction (2-0.05 mm) by sieving and silt (0.05-0.002 mm) and clay (<0.002 mm) fractions by sedimentation, according to the Stokes’ law (Jackson, 1979). The sand magnetic fraction (SMF) was separated by a manual permanent magnet and subjected to successive washes with distilled water. All fractions were dried in a forced air circulation oven at 45 °C.
Mineralogical analyses
Soil SSS SiBCS Parent material LocalizationGeographic coordinates
Elevation Latitude (S) Longitude (W)
m
LV1 Rhodic Hapludox Latossolo Vermelho Acriférrico típico Tuffite Tiros - MG 19°10’46’’ 45°58’35” 1,135
LV2 Rhodic Acrudox Latossolo Vermelho Perférrico típico Itabirite Nova Lima - MG 20°4’03” 43°58’45” 1,383
LV3 Rhodic Hapludox Latossolo Vermelho Distroférrico típico Diabase Piracicaba - SP 22°40’00” 47°35’00” 580
LV4 Rhodic Hapludox Latossolo Vermelho Distroférrico típico Basalt Ribeirão Preto - SP 21°11’ 47°93’ 550
LV5 Rhodic Hapludox Latossolo Vermelho Distroférrico típico Basalt Capinópolis - MG 18°41’05” 49°34’51” 564
LV6 Rhodic Hapludox Latossolo Vermelho Acriférrico típico Basalt Uberlândia - MG 18°53’03” 48°06’37” 888
LV7 Rhodic Acrudox Latossolo Vermelho Perférrico típico Tuffite Patos de Minas - MG 18°42’30” 46°27’11” 893
LV8 Rhodic Hapludox Latossolo Vermelho Eutroférrico típico Basalt Ibiporã - PR 23°16’49” 51°01’51” 406
LV9 Rhodic Hapludox Latossolo Vermelho Distroférrico típico Basalt Maringá - PR 23°21’ 52°03’ 450
LV10 Rhodic Hapludox Latossolo Vermelho Distroférrico típico Basalt Palotina - PR 24°20’ 53°50’ 320
LV11 Rhodic Hapludox Latossolo Vermelho Distroférrico típico Basalt Dourados - MS 22°14’ 54°49’ 430
LV12 Rhodic Acrudox Latossolo Vermelho Distrófico típico Basalt São Miguel das Missões - RS 29°03’ 53°50’ 465
Fe-rich Rhodic Oxisols
Soil sampling site
0 435 870km
Descriptive legend
60°0’0”W 40°0’0”W
10°0
’0”s
30°0
’0”s
Geographic Coordinate SystemDatum: WGS 1987
Source: IBGE/EMBRAPA
N
RR
AM
AC
RO
PA
AP
MT
MACE
PI
TO
BA
GO DF
RNPB
PEAL
SE
ESMG
SP
PR
RS
LV11
LV5
LV7
RJ
SC
LV2LV1LV6
LV3
LV4
LV12
LV10LV8LV9
Figure 1. Distribution map of Rhodic Oxisols in Brazil with geographic coordinates, parent rock materials and classification according to the Soil Taxonomy (Soil Survey Staff, 2014) and Brazilian Soil Classification System – SiBCS (Santos et al., 2018).

Silva Filho et al. Mineralogical evolution of magnetic Rhodic Oxisols under different...
4Rev Bras Cienc Solo 2019;43:e0190065
X-ray diffraction
Minerals in the sand, silt, and clay fractions were analyzed by X-ray diffractometry (XRD) in an equipment X’PERT PRO PANALYTICAL model with CoKα radiation and graphite monochromator operated at 40 kV and 40 mA, and scanning from 4 to 70 °2θ, at 0.02 °2θ/3s steps. The sand and silt fractions were randomly oriented on excavated slides (powder), while the clay fraction was oriented by smear.
Iron oxides were concentrated in the clay fraction after treatment with an alkaline solution (NaOH 5 mol L-1) (Norrish and Taylor, 1961). The concentrates were then macerated in an agate mortar with 10 % NaCl (internal standard), randomly oriented, and analyzed in an equipment SHIMADZU XRD model 6100 with CuKα radiation and graphite monochromator, operated at 40 kV and 40 mA, and scanning from 15 to 70 °2θ, at 0.02 °2θ/5s steps.
The contents and crystallographic parameters of Fe oxides were determined through Rietveld refinement of XRD patterns, using software RIETICA 4.2 (Hunter and Howard, 2000) and crystallographic database of MINCRYST. The refinement consisted of a polynomial function to the baseline, the peaks were set through the pseudo-Voigt model and the angle parameters of Bragg U, V, and W to calculate the width at half height (WHH), where WHH = (Utan2θ + Vtanθ + W)1/2 (Caglioti et al., 1958). The refinement quality was evaluated by the Rexp index (Young, 1995), where values up to 20 are considered acceptable (Poggere et al., 2018).
The mean crystal size (MCS) was calculated from WHH of XRD peaks 110 and 111 of goethite (Gt), 104, 110, and 012 of hematite (Hm) and 220 and 400 of maghemite (Mh) using equation 1, proposed by Scherrer (Klug and Alexander, 1974), with WHH correction established by equation 2 (Melo et al., 2001).
MCS(hkl) = (K × λ × 57.3) / (WHH(hkl) × cosθ) Eq. 1
In which:
K = constant (0.9)
λ = wavelength of radiation CuKα
57.3 = conversion factor of degrees to radians
WHH(hkl) = diffraction studied (at °2θ) corrected by equation 2, as follows:
Y = 1.0005 – 4.3335 × X2 + 4.9618 × X2.5 – 1.6277 × X3 (Melo et al., 2001) Eq. 2
In which:
Y = β/B; and X = b/B; being,
B = WHH diffraction studied (at °2θ)
b = WHH of internal pattern (NaCl) (at °2θ)
β = WHH(hkl) corrected
Isomorphic substitution of Fe by Al (IS) in the Gt structure (Equation 3), Hm (Equation 4), and Mh (Equation 5) were estimated by regression between the unit cell volume and IS degree [Al/(Fe + Al), mol mol-1] (Vergard’s law). Thus:
ISGt = 17.30 - 5.72 × c0, being c0 = (1/d2111 - 1/d2
110)0.5 (Schulze, 1984) Eq. 3

Silva Filho et al. Mineralogical evolution of magnetic Rhodic Oxisols under different...
5Rev Bras Cienc Solo 2019;43:e0190065
ISHm = 31.09 - 6.17 × a0, being a0 = 2 × d110 (Schwertmann et al., 1979) Eq. 4
ISMh = (0.8343 - a0)/2.22 × 10-4 Eq. 5
In which a0 was obtained from Rietveld refinement (Schwertmann and Fechter, 1984, adapted).
Raman spectroscopy
The surface of SMF grains was photographed using an optical microscope and then the Raman spectra were obtained in selected regions using an equipment MicroRaman InVia Renishaw model equipped with diode laser for excitation at 785 nm. After equipment calibration with Si internal pattern, the Raman spectra were obtained with objective lens 50 x (long) and laser power of 0.08 mW, with spatial resolution in the sample of approximately 1 µm. The spectra underwent adjustment of the baseline and deconvolution in Lorentzian with the aid of software Peakfit 4.12. The RRUFF project database, Bersani et al. (1999), Gasparov et al. (2000), and Chamritski and Burns (2005) were used to identify vibrational modes in the Raman spectra.
57Fe Mössbauer spectroscopy
The Mössbauer spectra of sand and clay fractions were obtained at room temperature (approximately 298 K) using a conventional Mössbauer spectrometer in gamma-ray transmission geometry, with a constant acceleration of a source of 57Co in Rh matrix and approximately 50 mCi of activity. The isomeric dislocations were offset in relation to αFe at room temperature, using a calibration standard of Doppler speed range. The data were adjusted using a least-squares algorithm via software WinNormos™ for Igor™ Pro 6.1.
Magnetic analyses
Volumetric magnetic susceptibility (κ, dimensionless) at low (κlf) (0.47 kHz) and high frequency (κhf) (4.70 kHz) were determined in the ADFE and in different particle size fractions using the MS2 Bartington system coupled to the MS2B sensor. The magnetic susceptibility per unit of mass (χlf, 10-8 m3 kg-1) and frequency dependent on magnetic susceptibility (χfd, %) were calculated by equations 6 and 7, respectively (Dearing, 1999):
χlf = (10 × κlf) / m [m = mass (g)] Eq. 6
χfd = 100 × (κlf – κhf) / κlf Eq. 7
The χlf values of the ADFE were also estimated by the sum of products of sand, silt, and clay contents and their respective χlf values according to equation 8:
χlf(ADFEest) = ∑ [content of particle size fraction (g kg-1) × χlf / 1000] Eq. 8
Geochemical analyses
Iron, Al, Ti, and Si contents in the ADFE were extracted by sulfuric digestion procedure (Teixeira et al., 2017). Iron contents associated with iron oxides were also determined in the clay fraction after five extractions with sodium citrate-bicarbonate-dithionite (Fed) (Mehra and Jackson, 1960), and only one extraction with acid ammonium oxalate (Feo) (McKeague and Day, 1966). Iron contents extracted from clay fraction with H2SO4 1.8 mol L-1 (Fesulf) (Schwertmann and Fechter, 1984) were related to the time when clay fraction residues reached χlf <10 % of the value before extraction. This is an adaptation of the method proposed by Schwertmann and Fechter (1984), as performed by Poggere et al. (2018). The elements obtained by extractors were quantified by atomic absorption spectrometry.
Silva Filho et al. Mineralogical evolution of magnetic Rhodic Oxisols under different...
6Rev Bras Cienc Solo 2019;43:e0190065
Trace elements (TE) Co, Cu, Ni, V, Zn, Mn, and Cr were extracted from the ADFE fractions, sand, silt, clay, and SMF with ternary mixture of strong acids (nitric, perchloric, and hydrofluoric) (Teixeira et al., 2017) and quantified by inductively coupled plasma optical emission spectrometry (ICP-OES). The TE values were also estimated by the sum of products of sand, silt, and clay contents and their respective TE contents, as shown in equation 9.
TE(ADFEest) = ∑ [content of particle size (g kg-1) × TE/1000] Eq. 9
RESULTS
Mineralogical characteristics of soils
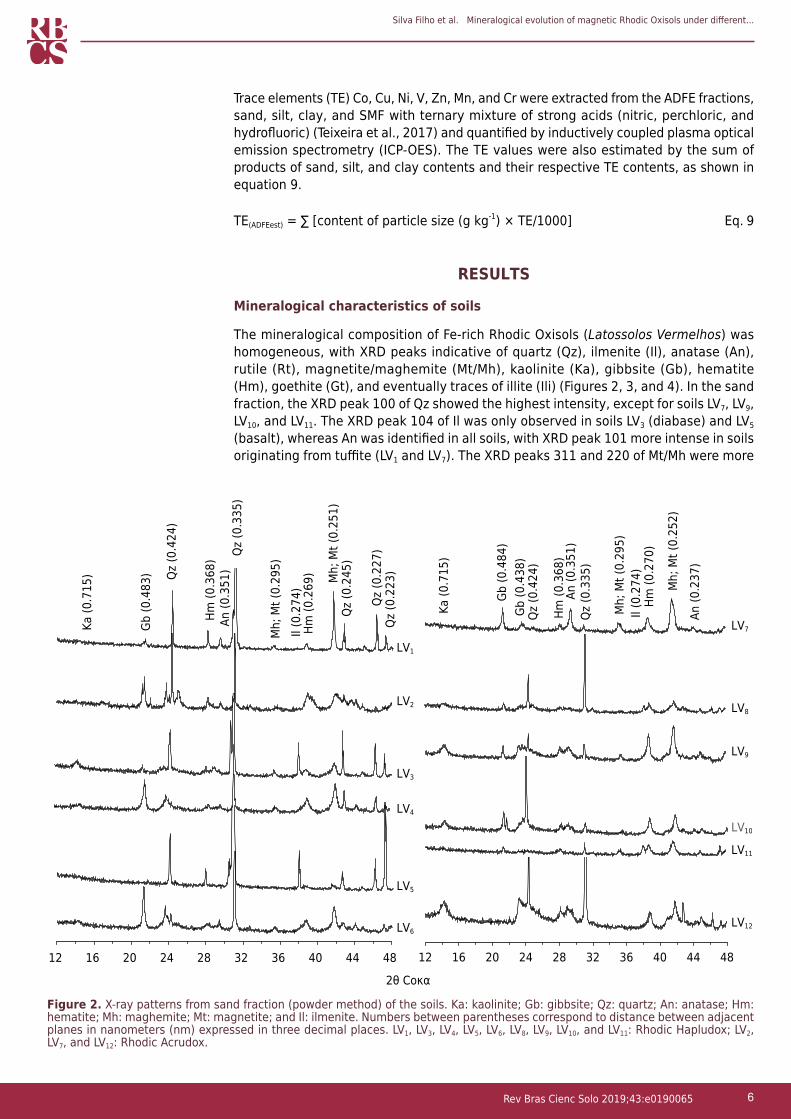
The mineralogical composition of Fe-rich Rhodic Oxisols (Latossolos Vermelhos) was homogeneous, with XRD peaks indicative of quartz (Qz), ilmenite (Il), anatase (An), rutile (Rt), magnetite/maghemite (Mt/Mh), kaolinite (Ka), gibbsite (Gb), hematite (Hm), goethite (Gt), and eventually traces of illite (Ili) (Figures 2, 3, and 4). In the sand fraction, the XRD peak 100 of Qz showed the highest intensity, except for soils LV7, LV9, LV10, and LV11. The XRD peak 104 of Il was only observed in soils LV3 (diabase) and LV5 (basalt), whereas An was identified in all soils, with XRD peak 101 more intense in soils originating from tuffite (LV1 and LV7). The XRD peaks 311 and 220 of Mt/Mh were more
Hm (0
.269
)
Qz
(0.2
23)
Qz
(0.2
27)
Qz
(0.2
45)
An (0
.351
)Hm
(0.3
68) Q
z (0
.335
)
Qz
(0.4
24)
Gb (0
.483
) Mh;
Mt (
0.25
1)
Mh;
Mt (
0.29
5)
Ka
(0.7
15)
2θ Coκα
48444036322824201612
Mh;
Mt (
0.25
2)
Hm (0
.270
)Il
(0.2
74)
Mh;
Mt (
0.29
5)
Qz
(0.3
35)
An (0
.351
)Hm
(0.3
68)
Qz
(0.4
24)
Gb (0
.438
)Gb
(0.4
84)
Ka
(0.7
15)
An (0
.237
)
48444036322824201612
Il (0
.274
)
LV6
LV5
LV4
LV3
LV2
LV1
LV12
LV11
LV10
LV9
LV8
LV7
Figure 2. X-ray patterns from sand fraction (powder method) of the soils. Ka: kaolinite; Gb: gibbsite; Qz: quartz; An: anatase; Hm: hematite; Mh: maghemite; Mt: magnetite; and Il: ilmenite. Numbers between parentheses correspond to distance between adjacent planes in nanometers (nm) expressed in three decimal places. LV1, LV3, LV4, LV5, LV6, LV8, LV9, LV10, and LV11: Rhodic Hapludox; LV2, LV7, and LV12: Rhodic Acrudox.
Silva Filho et al. Mineralogical evolution of magnetic Rhodic Oxisols under different...
7Rev Bras Cienc Solo 2019;43:e0190065
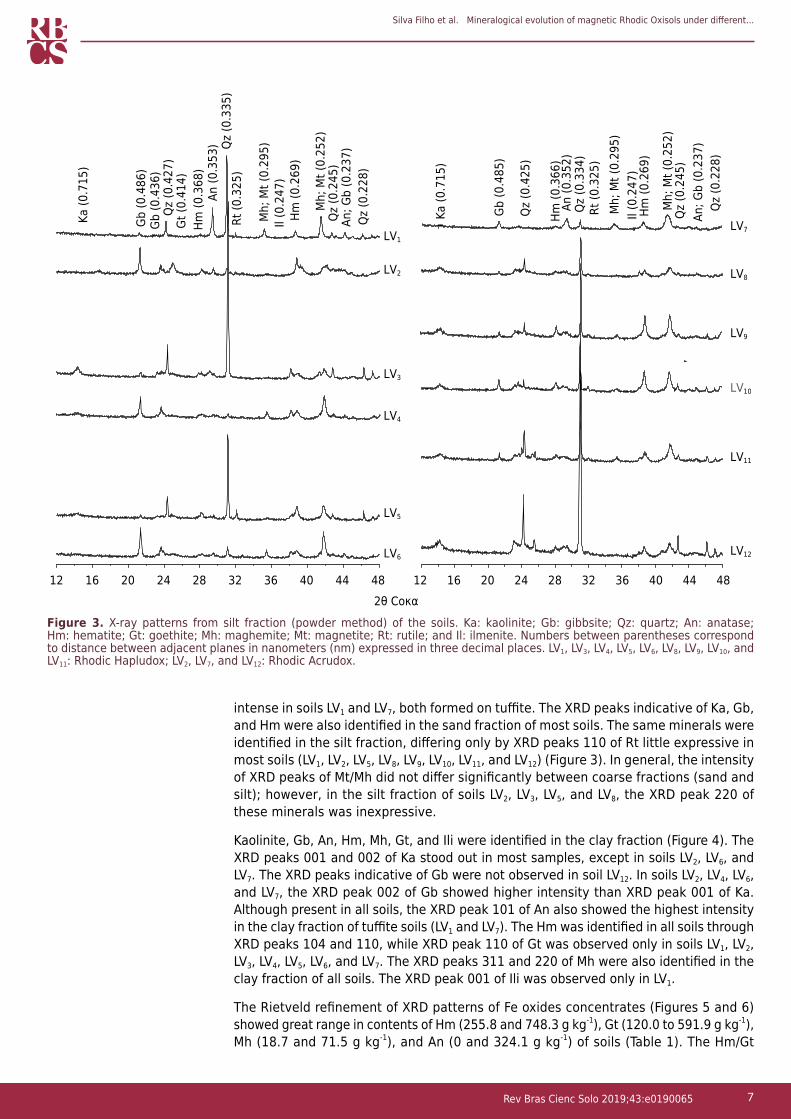
intense in soils LV1 and LV7, both formed on tuffite. The XRD peaks indicative of Ka, Gb, and Hm were also identified in the sand fraction of most soils. The same minerals were identified in the silt fraction, differing only by XRD peaks 110 of Rt little expressive in most soils (LV1, LV2, LV5, LV8, LV9, LV10, LV11, and LV12) (Figure 3). In general, the intensity of XRD peaks of Mt/Mh did not differ significantly between coarse fractions (sand and silt); however, in the silt fraction of soils LV2, LV3, LV5, and LV8, the XRD peak 220 of these minerals was inexpressive.
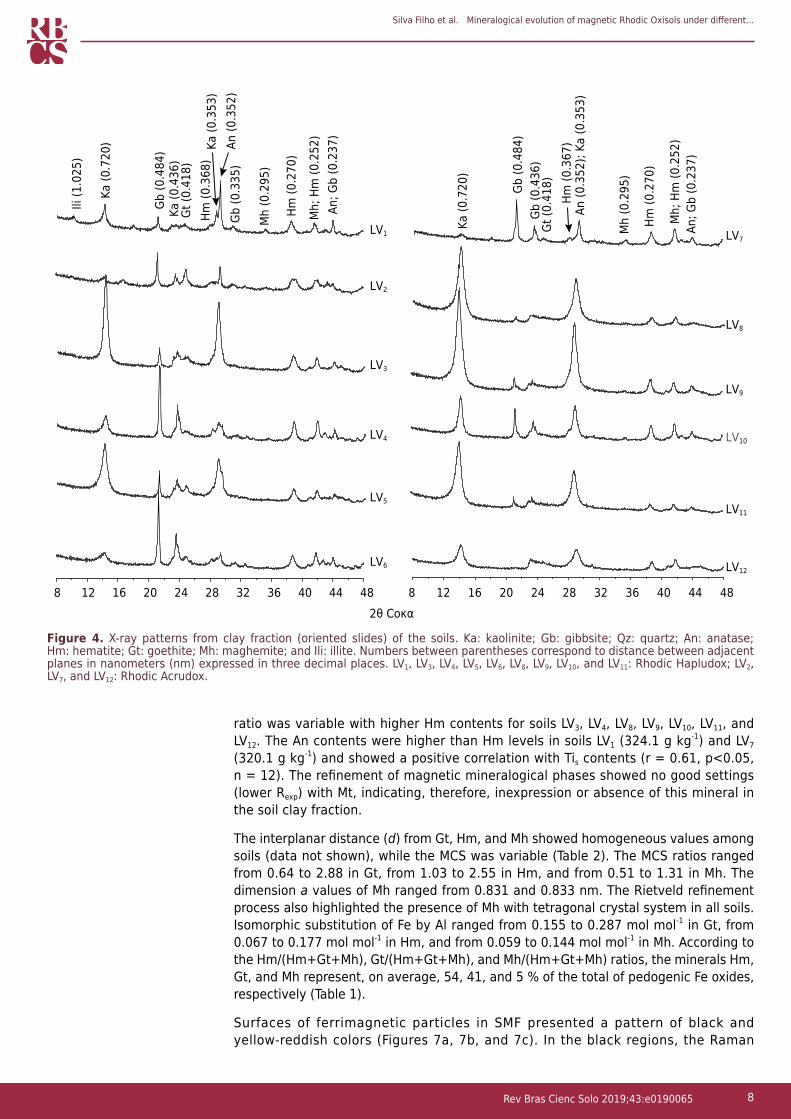
Kaolinite, Gb, An, Hm, Mh, Gt, and Ili were identified in the clay fraction (Figure 4). The XRD peaks 001 and 002 of Ka stood out in most samples, except in soils LV2, LV6, and LV7. The XRD peaks indicative of Gb were not observed in soil LV12. In soils LV2, LV4, LV6, and LV7, the XRD peak 002 of Gb showed higher intensity than XRD peak 001 of Ka. Although present in all soils, the XRD peak 101 of An also showed the highest intensity in the clay fraction of tuffite soils (LV1 and LV7). The Hm was identified in all soils through XRD peaks 104 and 110, while XRD peak 110 of Gt was observed only in soils LV1, LV2, LV3, LV4, LV5, LV6, and LV7. The XRD peaks 311 and 220 of Mh were also identified in the clay fraction of all soils. The XRD peak 001 of Ili was observed only in LV1.
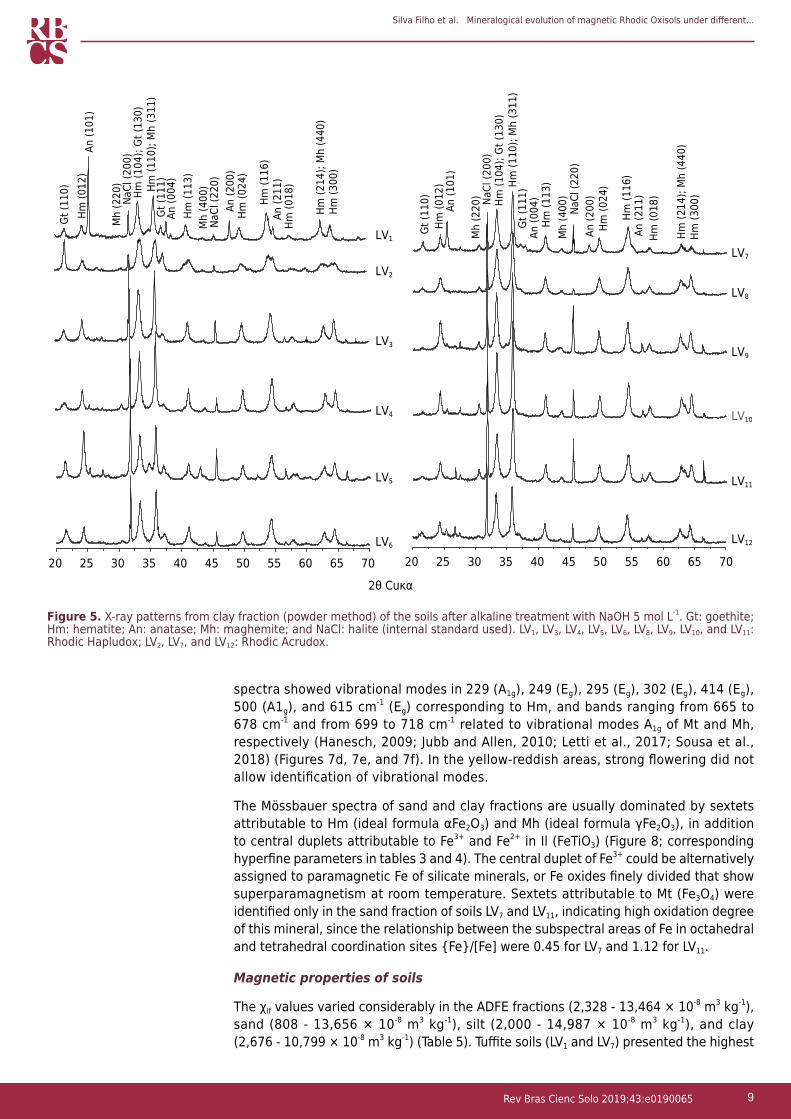
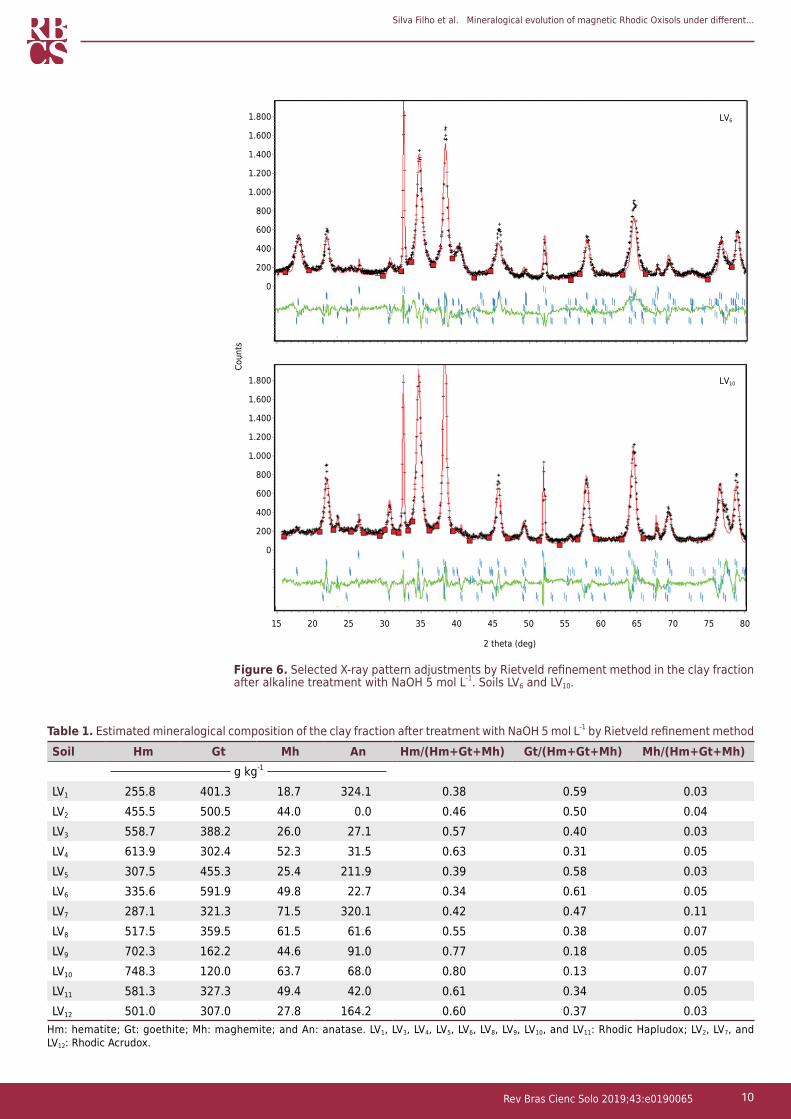
The Rietveld refinement of XRD patterns of Fe oxides concentrates (Figures 5 and 6) showed great range in contents of Hm (255.8 and 748.3 g kg-1), Gt (120.0 to 591.9 g kg-1), Mh (18.7 and 71.5 g kg-1), and An (0 and 324.1 g kg-1) of soils (Table 1). The Hm/Gt
2θ Coκα48444036322824201612 48444036322824201612
Il (0
.247
)
Gb (0
.436
)Q
z (0
.427
)
Gb (0
.486
)
Qz
(0.2
45)
Hm (0
.269
)
Mh;
Mt (
0.29
5)Qz
(0.3
35)
An (0
.353
)Hm
(0.3
68)
Ka
(0.7
15)
Qz
(0.2
28)
An; G
b (0
.237
)
Mh;
Mt (
0.25
2)
Rt (0
.325
)
Gt (0
.414
)
Hm (0
.366
)
Il (0
.247
)Hm
(0.2
69)
Mh;
Mt (
0.29
5)Rt
(0.3
25)
Qz
(0.2
28)
An; G
b (0
.237
)Q
z (0
.245
)M
h; M
t (0.
252)
Qz
(0.4
25)
Gb (0
.485
)
Ka
(0.7
15)
An (0
.352
)Q
z (0
.334
)
LV6
LV5
LV4
LV3
LV2
LV1
LV12
LV11
LV10
LV9
LV8
LV7
Figure 3. X-ray patterns from silt fraction (powder method) of the soils. Ka: kaolinite; Gb: gibbsite; Qz: quartz; An: anatase; Hm: hematite; Gt: goethite; Mh: maghemite; Mt: magnetite; Rt: rutile; and Il: ilmenite. Numbers between parentheses correspond to distance between adjacent planes in nanometers (nm) expressed in three decimal places. LV1, LV3, LV4, LV5, LV6, LV8, LV9, LV10, and LV11: Rhodic Hapludox; LV2, LV7, and LV12: Rhodic Acrudox.
Silva Filho et al. Mineralogical evolution of magnetic Rhodic Oxisols under different...
8Rev Bras Cienc Solo 2019;43:e0190065
ratio was variable with higher Hm contents for soils LV3, LV4, LV8, LV9, LV10, LV11, and LV12. The An contents were higher than Hm levels in soils LV1 (324.1 g kg-1) and LV7 (320.1 g kg-1) and showed a positive correlation with Tis contents (r = 0.61, p<0.05, n = 12). The refinement of magnetic mineralogical phases showed no good settings (lower Rexp) with Mt, indicating, therefore, inexpression or absence of this mineral in the soil clay fraction.
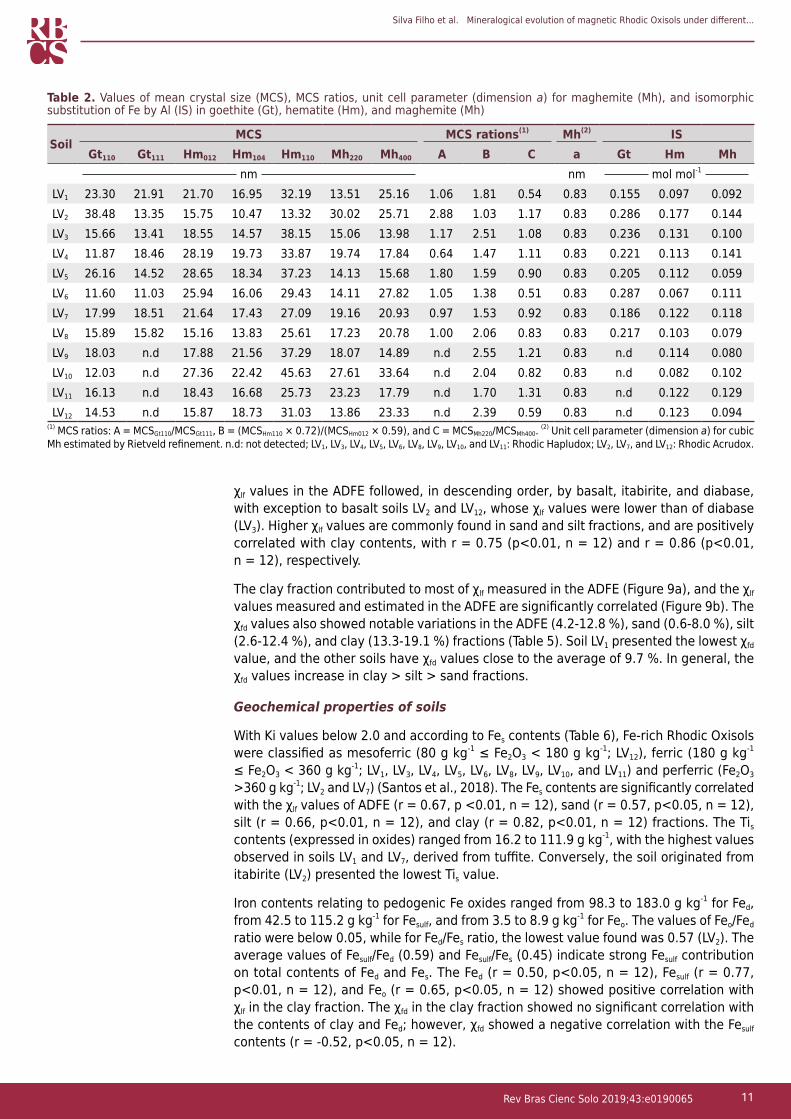
The interplanar distance (d) from Gt, Hm, and Mh showed homogeneous values among soils (data not shown), while the MCS was variable (Table 2). The MCS ratios ranged from 0.64 to 2.88 in Gt, from 1.03 to 2.55 in Hm, and from 0.51 to 1.31 in Mh. The dimension a values of Mh ranged from 0.831 and 0.833 nm. The Rietveld refinement process also highlighted the presence of Mh with tetragonal crystal system in all soils. Isomorphic substitution of Fe by Al ranged from 0.155 to 0.287 mol mol-1 in Gt, from 0.067 to 0.177 mol mol-1 in Hm, and from 0.059 to 0.144 mol mol-1 in Mh. According to the Hm/(Hm+Gt+Mh), Gt/(Hm+Gt+Mh), and Mh/(Hm+Gt+Mh) ratios, the minerals Hm, Gt, and Mh represent, on average, 54, 41, and 5 % of the total of pedogenic Fe oxides, respectively (Table 1).
Surfaces of ferrimagnetic particles in SMF presented a pattern of black and yellow-reddish colors (Figures 7a, 7b, and 7c). In the black regions, the Raman
2θ Coκα48444036322824201612 48444036322824201612
LV6
LV5
LV4
LV3
LV2
LV1
LV12
LV11
LV10
8 8
LV9
LV8
LV7Gb
(0.3
35)
Ka
(0.4
36)
Ka
(0.3
53)
Ka
(0.7
20)
Ili (1
.025
)
An; G
b (0
.237
)M
h; H
m (0
.252
)
Hm (0
.270
)
Mh
(0.2
95)
Hm (0
.368
)
An (0
.352
)
Gt (0
.418
)
Gb (0
.484
)
Gt (0
.418
) H
m (0
.367
)
An; G
b (0
.237
)M
h; H
m (0
.252
)
Mh
(0.2
95)
Hm (0
.270
)
Gb (0
.484
)
Ka
(0.7
20)
An (0
.352
); Ka
(0.3
53)
Gb (0
.436
)
Figure 4. X-ray patterns from clay fraction (oriented slides) of the soils. Ka: kaolinite; Gb: gibbsite; Qz: quartz; An: anatase; Hm: hematite; Gt: goethite; Mh: maghemite; and Ili: illite. Numbers between parentheses correspond to distance between adjacent planes in nanometers (nm) expressed in three decimal places. LV1, LV3, LV4, LV5, LV6, LV8, LV9, LV10, and LV11: Rhodic Hapludox; LV2, LV7, and LV12: Rhodic Acrudox.
Silva Filho et al. Mineralogical evolution of magnetic Rhodic Oxisols under different...
9Rev Bras Cienc Solo 2019;43:e0190065
spectra showed vibrational modes in 229 (A1g), 249 (Eg), 295 (Eg), 302 (Eg), 414 (Eg), 500 (A1g), and 615 cm-1 (Eg) corresponding to Hm, and bands ranging from 665 to 678 cm-1 and from 699 to 718 cm-1 related to vibrational modes A1g of Mt and Mh, respectively (Hanesch, 2009; Jubb and Allen, 2010; Letti et al., 2017; Sousa et al., 2018) (Figures 7d, 7e, and 7f). In the yellow-reddish areas, strong flowering did not allow identification of vibrational modes.
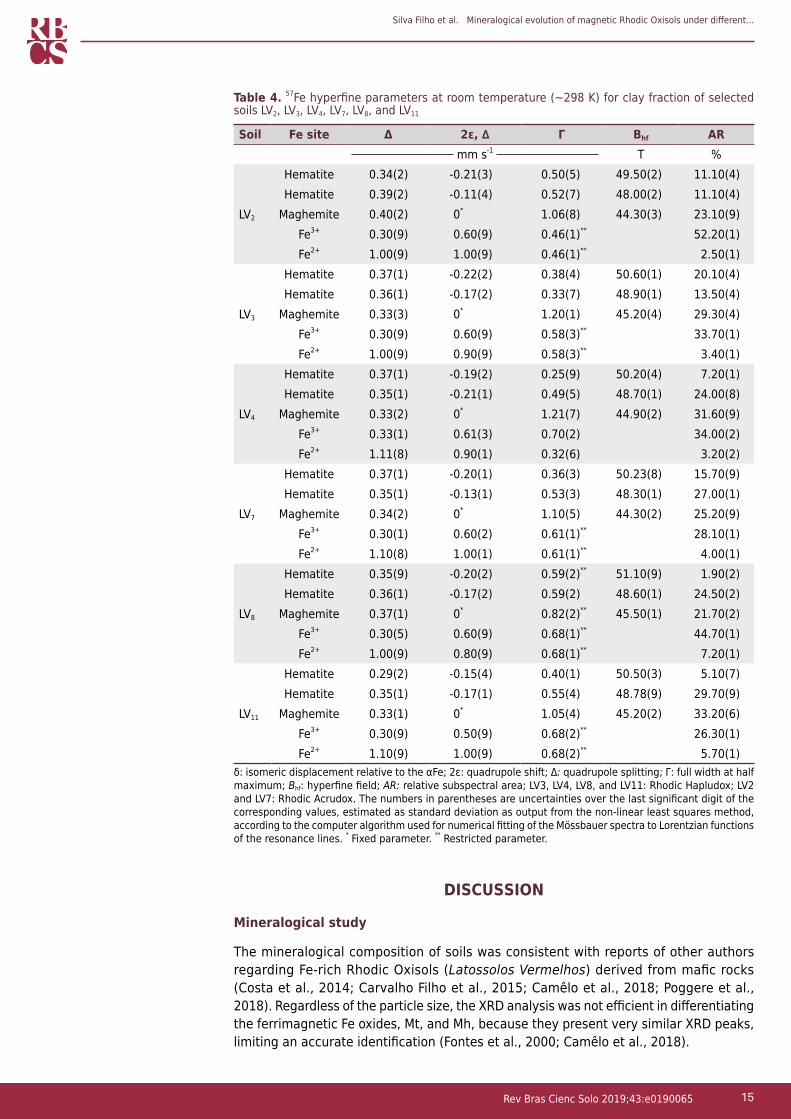
The Mössbauer spectra of sand and clay fractions are usually dominated by sextets attributable to Hm (ideal formula αFe2O3) and Mh (ideal formula γFe2O3), in addition to central duplets attributable to Fe3+ and Fe2+ in Il (FeTiO3) (Figure 8; corresponding hyperfine parameters in tables 3 and 4). The central duplet of Fe3+ could be alternatively assigned to paramagnetic Fe of silicate minerals, or Fe oxides finely divided that show superparamagnetism at room temperature. Sextets attributable to Mt (Fe3O4) were identified only in the sand fraction of soils LV7 and LV11, indicating high oxidation degree of this mineral, since the relationship between the subspectral areas of Fe in octahedral and tetrahedral coordination sites {Fe}/[Fe] were 0.45 for LV7 and 1.12 for LV11.
Magnetic properties of soils
The χlf values varied considerably in the ADFE fractions (2,328 - 13,464 × 10-8 m3 kg-1), sand (808 - 13,656 × 10-8 m3 kg-1), silt (2,000 - 14,987 × 10-8 m3 kg-1), and clay (2,676 - 10,799 × 10-8 m3 kg-1) (Table 5). Tuffite soils (LV1 and LV7) presented the highest
20
An (0
04)
Mh
(400
)
Hm (0
18)
An (2
11)
An (2
00)
Mh
(220
)
Hm (1
13)
Hm (0
12)
Hm (3
00)
Hm (2
14);
Mh
(440
)
Hm (0
24)
Hm (1
16)
Gt (1
11)
Gt (1
10)
An (1
01)
Hm (1
10);
Mh
(311
)Hm
(104
); Gt
(130
)
NaCl
(220
)
NaCl
(200
)
20
Gt (1
10)
NaCl
(220
)
Hm (3
00)
Hm (2
14);
Mh
(440
)
Hm (0
18)
An (2
11)
Hm (1
16)
Hm (0
24)
An (2
00)
Mh
(400
)Hm
(113
)An
(004
)Gt
(111
)Hm (1
10);
Mh
(311
)Hm
(104
); Gt
(130
)Na
Cl (2
00)
Mh
(220
)
An (1
01)
Hm (0
12)
7065605550454035302570656055504540353025
2θ Cuκα
LV6
LV5
LV4
LV3
LV2
LV1
LV12
LV11
LV10
LV9
LV8
LV7
Figure 5. X-ray patterns from clay fraction (powder method) of the soils after alkaline treatment with NaOH 5 mol L-1. Gt: goethite; Hm: hematite; An: anatase; Mh: maghemite; and NaCl: halite (internal standard used). LV1, LV3, LV4, LV5, LV6, LV8, LV9, LV10, and LV11: Rhodic Hapludox; LV2, LV7, and LV12: Rhodic Acrudox.
Silva Filho et al. Mineralogical evolution of magnetic Rhodic Oxisols under different...
10Rev Bras Cienc Solo 2019;43:e0190065
LV6
LV10
15 20 25 30 35 40 45 50 55 60 65 70 75 80
2 theta (deg)
0
200
400
600
800
1.000
1.200
1.400
1.600
1.800
Coun
ts
0
200
400
600
800
1.000
1.200
1.400
1.600
1.800
Figure 6. Selected X-ray pattern adjustments by Rietveld refinement method in the clay fraction after alkaline treatment with NaOH 5 mol L-1. Soils LV6 and LV10.
Table 1. Estimated mineralogical composition of the clay fraction after treatment with NaOH 5 mol L-1 by Rietveld refinement method Soil Hm Gt Mh An Hm/(Hm+Gt+Mh) Gt/(Hm+Gt+Mh) Mh/(Hm+Gt+Mh)
g kg-1
LV1 255.8 401.3 18.7 324.1 0.38 0.59 0.03LV2 455.5 500.5 44.0 0.0 0.46 0.50 0.04LV3 558.7 388.2 26.0 27.1 0.57 0.40 0.03LV4 613.9 302.4 52.3 31.5 0.63 0.31 0.05LV5 307.5 455.3 25.4 211.9 0.39 0.58 0.03LV6 335.6 591.9 49.8 22.7 0.34 0.61 0.05LV7 287.1 321.3 71.5 320.1 0.42 0.47 0.11LV8 517.5 359.5 61.5 61.6 0.55 0.38 0.07LV9 702.3 162.2 44.6 91.0 0.77 0.18 0.05LV10 748.3 120.0 63.7 68.0 0.80 0.13 0.07LV11 581.3 327.3 49.4 42.0 0.61 0.34 0.05LV12 501.0 307.0 27.8 164.2 0.60 0.37 0.03
Hm: hematite; Gt: goethite; Mh: maghemite; and An: anatase. LV1, LV3, LV4, LV5, LV6, LV8, LV9, LV10, and LV11: Rhodic Hapludox; LV2, LV7, and LV12: Rhodic Acrudox.
Silva Filho et al. Mineralogical evolution of magnetic Rhodic Oxisols under different...
11Rev Bras Cienc Solo 2019;43:e0190065
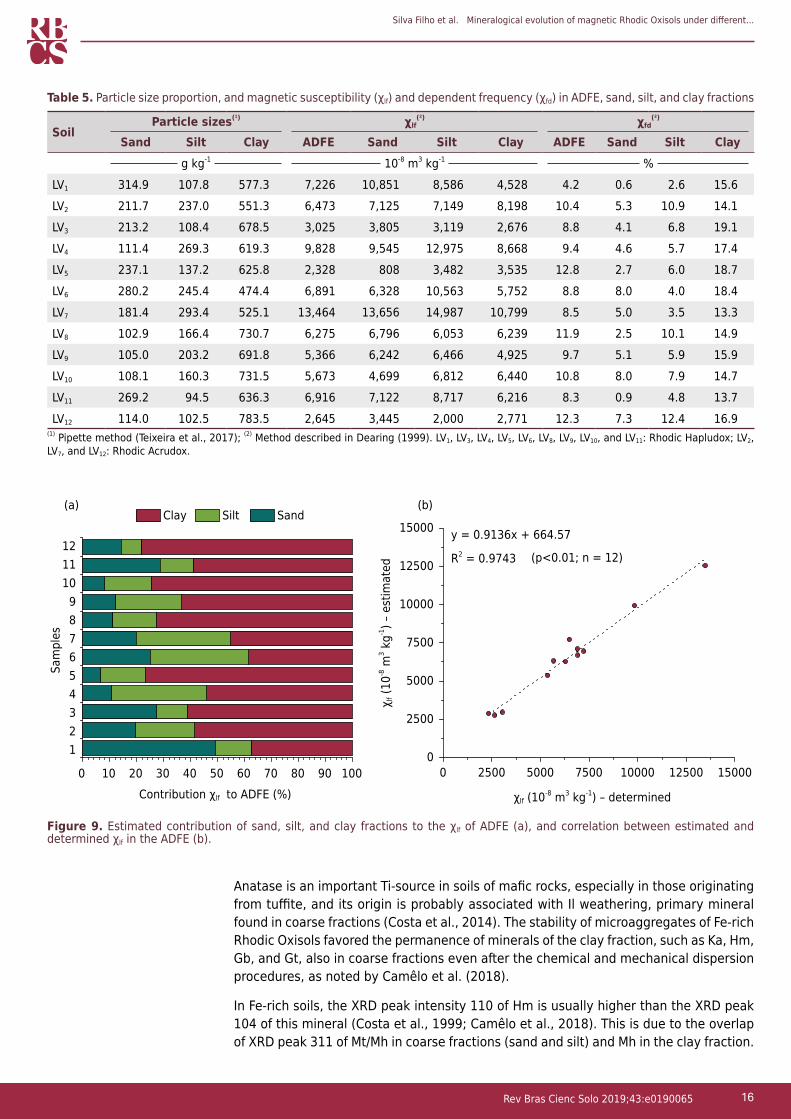
χlf values in the ADFE followed, in descending order, by basalt, itabirite, and diabase, with exception to basalt soils LV2 and LV12, whose χlf values were lower than of diabase (LV3). Higher χlf values are commonly found in sand and silt fractions, and are positively correlated with clay contents, with r = 0.75 (p<0.01, n = 12) and r = 0.86 (p<0.01, n = 12), respectively.
The clay fraction contributed to most of χlf measured in the ADFE (Figure 9a), and the χlf values measured and estimated in the ADFE are significantly correlated (Figure 9b). The χfd values also showed notable variations in the ADFE (4.2-12.8 %), sand (0.6-8.0 %), silt (2.6-12.4 %), and clay (13.3-19.1 %) fractions (Table 5). Soil LV1 presented the lowest χfd value, and the other soils have χfd values close to the average of 9.7 %. In general, the χfd values increase in clay > silt > sand fractions.
Geochemical properties of soils
With Ki values below 2.0 and according to Fes contents (Table 6), Fe-rich Rhodic Oxisols were classified as mesoferric (80 g kg-1 ≤ Fe2O3 < 180 g kg-1; LV12), ferric (180 g kg-1 ≤ Fe2O3 < 360 g kg-1; LV1, LV3, LV4, LV5, LV6, LV8, LV9, LV10, and LV11) and perferric (Fe2O3 >360 g kg-1; LV2 and LV7) (Santos et al., 2018). The Fes contents are significantly correlated with the χlf values of ADFE (r = 0.67, p <0.01, n = 12), sand (r = 0.57, p<0.05, n = 12), silt (r = 0.66, p<0.01, n = 12), and clay (r = 0.82, p<0.01, n = 12) fractions. The Tis contents (expressed in oxides) ranged from 16.2 to 111.9 g kg-1, with the highest values observed in soils LV1 and LV7, derived from tuffite. Conversely, the soil originated from itabirite (LV2) presented the lowest Tis value.
Iron contents relating to pedogenic Fe oxides ranged from 98.3 to 183.0 g kg-1 for Fed, from 42.5 to 115.2 g kg-1 for Fesulf, and from 3.5 to 8.9 g kg-1 for Feo. The values of Feo/Fed ratio were below 0.05, while for Fed/Fes ratio, the lowest value found was 0.57 (LV2). The average values of Fesulf/Fed (0.59) and Fesulf/Fes (0.45) indicate strong Fesulf contribution on total contents of Fed and Fes. The Fed (r = 0.50, p<0.05, n = 12), Fesulf (r = 0.77, p<0.01, n = 12), and Feo (r = 0.65, p<0.05, n = 12) showed positive correlation with χlf in the clay fraction. The χfd in the clay fraction showed no significant correlation with the contents of clay and Fed; however, χfd showed a negative correlation with the Fesulf contents (r = -0.52, p<0.05, n = 12).
Table 2. Values of mean crystal size (MCS), MCS ratios, unit cell parameter (dimension a) for maghemite (Mh), and isomorphic substitution of Fe by Al (IS) in goethite (Gt), hematite (Hm), and maghemite (Mh)
SoilMCS MCS rations(1) Mh(2) IS
Gt110 Gt111 Hm012 Hm104 Hm110 Mh220 Mh400 A B C a Gt Hm Mhnm nm mol mol-1
LV1 23.30 21.91 21.70 16.95 32.19 13.51 25.16 1.06 1.81 0.54 0.83 0.155 0.097 0.092LV2 38.48 13.35 15.75 10.47 13.32 30.02 25.71 2.88 1.03 1.17 0.83 0.286 0.177 0.144LV3 15.66 13.41 18.55 14.57 38.15 15.06 13.98 1.17 2.51 1.08 0.83 0.236 0.131 0.100LV4 11.87 18.46 28.19 19.73 33.87 19.74 17.84 0.64 1.47 1.11 0.83 0.221 0.113 0.141LV5 26.16 14.52 28.65 18.34 37.23 14.13 15.68 1.80 1.59 0.90 0.83 0.205 0.112 0.059LV6 11.60 11.03 25.94 16.06 29.43 14.11 27.82 1.05 1.38 0.51 0.83 0.287 0.067 0.111LV7 17.99 18.51 21.64 17.43 27.09 19.16 20.93 0.97 1.53 0.92 0.83 0.186 0.122 0.118LV8 15.89 15.82 15.16 13.83 25.61 17.23 20.78 1.00 2.06 0.83 0.83 0.217 0.103 0.079LV9 18.03 n.d 17.88 21.56 37.29 18.07 14.89 n.d 2.55 1.21 0.83 n.d 0.114 0.080LV10 12.03 n.d 27.36 22.42 45.63 27.61 33.64 n.d 2.04 0.82 0.83 n.d 0.082 0.102LV11 16.13 n.d 18.43 16.68 25.73 23.23 17.79 n.d 1.70 1.31 0.83 n.d 0.122 0.129LV12 14.53 n.d 15.87 18.73 31.03 13.86 23.33 n.d 2.39 0.59 0.83 n.d 0.123 0.094
(1) MCS ratios: A = MCSGt110/MCSGt111, B = (MCSHm110 × 0.72)/(MCSHm012 × 0.59), and C = MCSMh220/MCSMh400. (2) Unit cell parameter (dimension a) for cubic Mh estimated by Rietveld refinement. n.d: not detected; LV1, LV3, LV4, LV5, LV6, LV8, LV9, LV10, and LV11: Rhodic Hapludox; LV2, LV7, and LV12: Rhodic Acrudox.

Silva Filho et al. Mineralogical evolution of magnetic Rhodic Oxisols under different...
12Rev Bras Cienc Solo 2019;43:e0190065
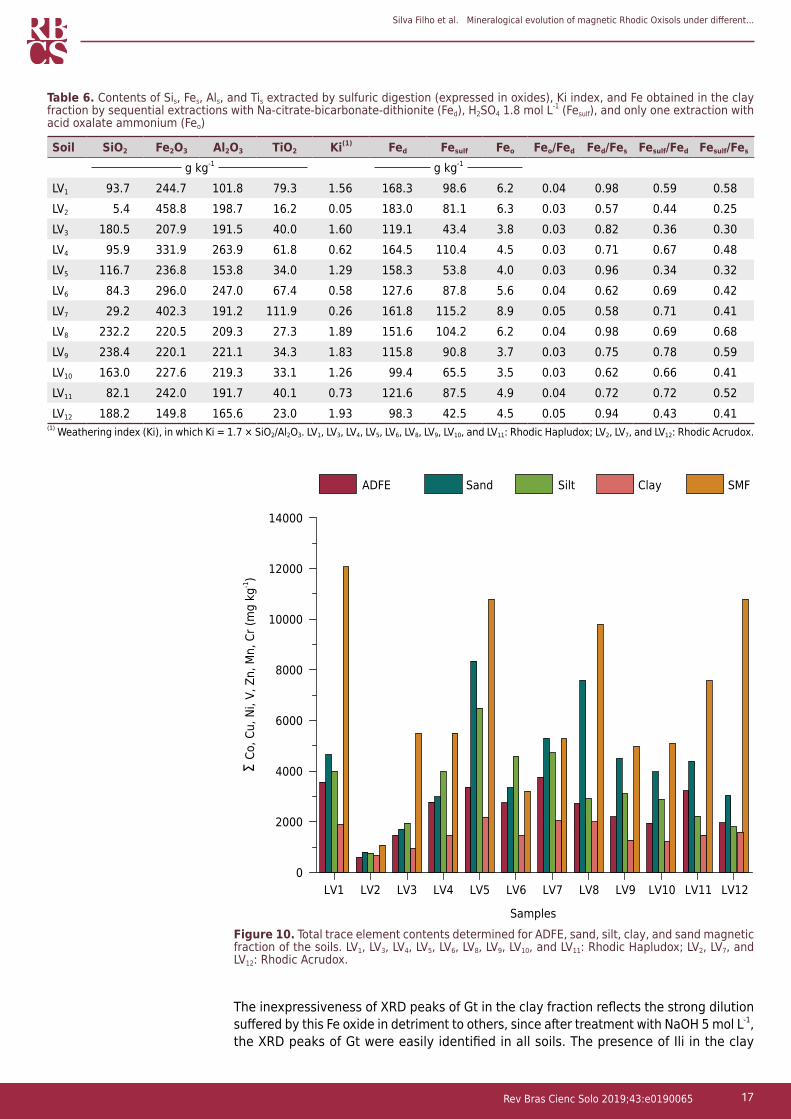
The total contents of trace elements (TE) showed wide variations in all studied fractions (Figure 10). The highest TE contents were found in coarse fractions, mainly in the SMF fraction, followed by sand and silt fractions. Soils LV1 (12,060 mg kg-1, tuffite),
0
10000
20000
30000
40000
50000
60000
(a)
Spectra ajustedHematiteMagnetiteMaghemiteSpectra observed
LV1
665
718
0
10000
20000
30000
40000
50000
60000
LV2
705
672
Ram
an In
tens
ity (u
.a)
2000
1000
2000
3000
4000
5000
6000
LV8
699
678
Wavenumber (cm-1)
800700600500400300
(d)
(b) (e)
(c) (f)
50 μm
50 μm
50 μm
1000 1050 1100 1150 1200 1250 1300
-14900
-14950
-15000
-15050
-15100
-15150
5950 6000 6050 6100 6150 6200 6250-4950
-5000
-5050
-5100
-5150
-5200
700 750 800 850 900 950 1000250
200
150
100
50
0
Figure 7. Particle surfaces of the sand magnetic fraction in selected soils LV1 (a), LV2 (b), and LV8 (c) (scale of image = 50 µm) and their respective Raman spectra (d, e, and f). The white arrows indicate collection sites of Raman spectra (black color). These image patterns (a, b, and c) and Raman spectra (d, e, and f) are found in all soils.

Silva Filho et al. Mineralogical evolution of magnetic Rhodic Oxisols under different...
13Rev Bras Cienc Solo 2019;43:e0190065
Figure 8. Mössbauer spectra of the sand and clay fractions in selected soils LV2, LV3, LV4, LV7, LV8, and LV11.
0.87
0.90
0.93
0.96
0.99
0.87
0.90
0.93
0.96
0.99
0.96
0.98
1.00
0.98
0.99
1.00
0.94
0.96
0.98
1.00
0.94
0.96
0.98
1.00
0.94
0.96
0.98
1.00
0.92
0.94
0.96
0.98
1.00
0.94
0.96
0.98
1.00
0.950.960.970.980.991.00
0.97
0.98
0.99
1.00
-120.95
0.96
0.97
0.98
0.99
1.00
Sand Clay
LV2
LV3
LV4
Rela
tive
tran
smis
sion
Relative transmission
LV7
LV8
LV11
Doppler velocity (ν/mm s-1)
121086420-2-4-6-8-10-12 121086420-2-4-6-8-10
LV2
LV3
LV4
LV7
LV8
LV11

Silva Filho et al. Mineralogical evolution of magnetic Rhodic Oxisols under different...
14Rev Bras Cienc Solo 2019;43:e0190065
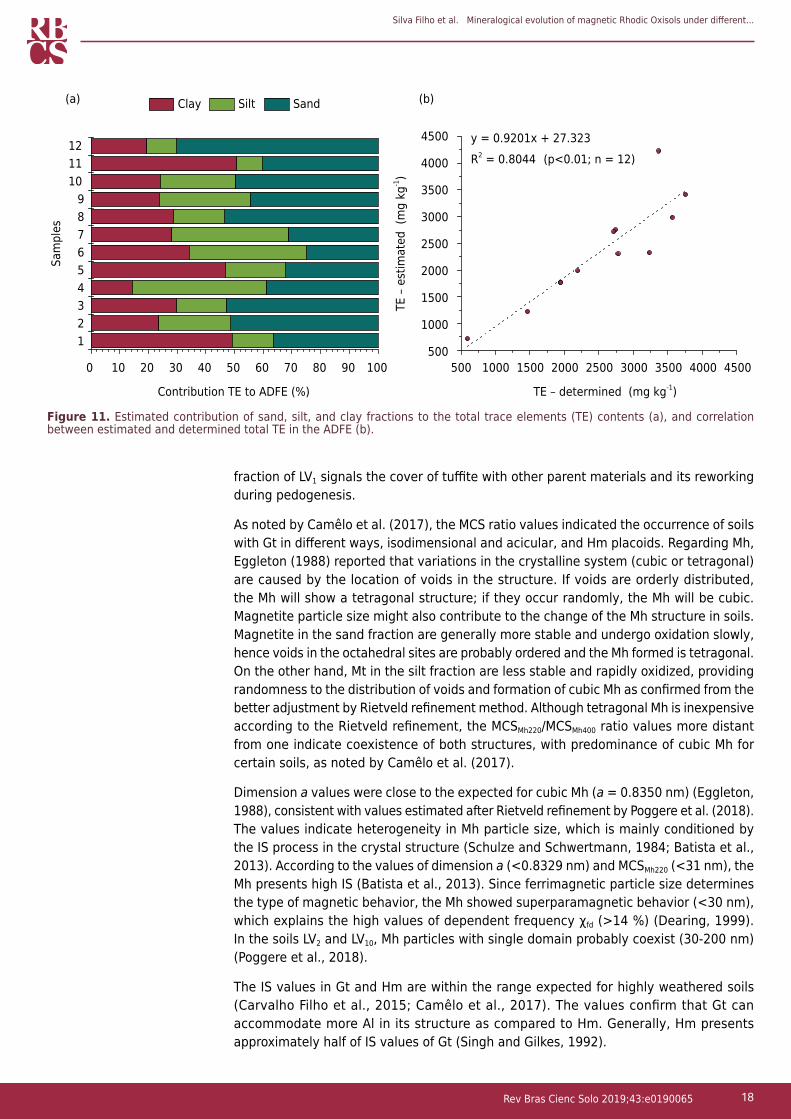
LV12 (10,784 mg kg-1, basalt), and LV5 (10,777 mg kg-1, basalt) showed the highest TE contents in SMF. The total TE contents in the ADFE showed significant correlation with the Tis contents (r = 0.69, p<0.05, n = 12) and not significant with the Fes contents (r = -0.10, p<0.05, n = 12). However, when we exclude the itabirite soil (LV2), this correlation with Fes becomes significant (r = 0.61, p<0.05, n = 11). Similarly, TE contents in the ADFE are significantly correlated with the χlf values in ADFE (r = 0.58, p<0.05, n = 11), sand (r = 0.56, p<0.05, n = 11), silt (r = 0.58, p<0.05, n = 11), and clay (r = 0.50, p<0.05, n = 11) fractions. In addition, TE contents in the clay fraction also showed significant correlation with those in coarse fractions, sand (r = 0.87, p<0.01, n = 12), silt (r = 0.74, p<0.01, n = 12), and SMF (r = 0.73, p<0.01, n = 12). In soils LV1, LV4, LV5, LV6, LV7, LV9, and LV11, TE are predominantly from sand and silt fractions (Figures 11a and 11b).
Table 3. 57Fe hyperfine parameters at room temperature (~298 K) for sand fraction of selected soils LV2, LV3, LV4, LV7, LV8, and LV11
Soil Fe site Δ 2ε, ∆ Γ Bhf ARmm s-1 T %
LV2
Hematite 0.35(1) -0.13(1) 0.67(2)** 50.60(1) 10.20(4)Hematite 0.33(1) -0.15(1) 0.67(2)** 48.50(1) 23.50(4)
Maghemite 0.34(1) 0* 0.67(2)** 45.09(3) 14.30(2)Fe3+ 0.34(1) 0.57(1) 0.49(1) 52.00(1)
LV3
Hematite 0.36(1) -0.14(1) 0.39(3) 50.29(8) 20.80(4)Hematite 0.34(1) -0.10(1) 0.50(3) 48.42(8) 27.10(5)
Maghemite 0.31(1) 0* 0.97(8) 44.60(3) 15.10(3)Fe3+ 0.38(1) 0.66(2) 0.63(2) 22.90(1)Fe2+ 0.99(1) 0.80(1) 0.42(2) 14.10(1)
LV4
Hematite 0.36(1) -0.21(1) 0.37(2) 50.44(5) 15.40(5)Hematite 0.35(1) -0.10(1) 0.57(4) 48.45(7) 29.70(9)
Maghemite 0.31(1) 0* 1.12(5) 45.30(3) 27.90(9)Fe3+ 0.30(9) 0.60(9) 0.62(2)** 23.00(1)Fe2+ 0.90(9) 0.80(9) 0.62(2)** 4.00(1)
LV7
Hematite 0.34(1) -0.12(1) 0.39(2) 50.28(4) 21.10(6)Hematite 0.36(1) -0.12(1) 0.55(2) 48.24(4) 37.70(9)
Maghemite 0.38(1) 0* 0.94(4) 44.40(1) 23.30(6)Fe3+ 0.34(1) 0.60(1) 0.70(2) 15.70(1)Fe2+ 1.12(2) 0.90(3) 0.38(4) 2.20(1)
LV8
Hematite 0.37(1) -0.19(1) 0.27(7) 51.10(2) 8.30(9)Hematite 0.32(1) -0.11(1) 0.72(2)** 48.80(2) 43.40(9)
Maghemite 0.39(1) 0* 0.72(2)** 45.25(6) 16.90(2)Fe3+ 0.33(1) 0.66(3) 0.74(3) 22.80(2)Fe2+ 1.06(2) 0.79(4) 0.44(4) 8.60(2)
LV11
Hematite 0.37(1) -0.19(1) 0.35(2) 51.06(3) 23.90(3)Magnetite 0.31(1) 0* 0.48(3) 48.71(6) 24.70(4)
0.60(1) 0* 0.72(3) 45.32(7) 27.60(3)Fe3+ 0.38(2) 0.66(3) 0.50(4) 8.70(1)Fe2+ 1.00(1) 0.79(2) 0.56(3) 15.10(1)
δ: isomeric displacement relative to the αFe; 2ε: quadrupole shift; Δ: quadrupole splitting; Γ: full width at half maximum; Bhf: hyperfine field; AR: relative subspectral area; LV3, LV4, LV8, and LV11: Rhodic Hapludox; LV2 and LV7: Rhodic Acrudox. The numbers in parentheses are uncertainties over the last significant digit of the corresponding values, estimated as standard deviation as output from the non-linear least squares method, according to the computer algorithm used for numerical fitting of the Mössbauer spectra to Lorentzian functions of the resonance lines. * Fixed parameter. ** Restricted parameter.
Silva Filho et al. Mineralogical evolution of magnetic Rhodic Oxisols under different...
15Rev Bras Cienc Solo 2019;43:e0190065
DISCUSSION
Mineralogical study
The mineralogical composition of soils was consistent with reports of other authors regarding Fe-rich Rhodic Oxisols (Latossolos Vermelhos) derived from mafic rocks (Costa et al., 2014; Carvalho Filho et al., 2015; Camêlo et al., 2018; Poggere et al., 2018). Regardless of the particle size, the XRD analysis was not efficient in differentiating the ferrimagnetic Fe oxides, Mt, and Mh, because they present very similar XRD peaks, limiting an accurate identification (Fontes et al., 2000; Camêlo et al., 2018).
Table 4. 57Fe hyperfine parameters at room temperature (~298 K) for clay fraction of selected soils LV2, LV3, LV4, LV7, LV8, and LV11
Soil Fe site Δ 2ε, ∆ Γ Bhf ARmm s-1 T %
LV2
Hematite 0.34(2) -0.21(3) 0.50(5) 49.50(2) 11.10(4)Hematite 0.39(2) -0.11(4) 0.52(7) 48.00(2) 11.10(4)
Maghemite 0.40(2) 0* 1.06(8) 44.30(3) 23.10(9)Fe3+ 0.30(9) 0.60(9) 0.46(1)** 52.20(1)Fe2+ 1.00(9) 1.00(9) 0.46(1)** 2.50(1)
LV3
Hematite 0.37(1) -0.22(2) 0.38(4) 50.60(1) 20.10(4)Hematite 0.36(1) -0.17(2) 0.33(7) 48.90(1) 13.50(4)
Maghemite 0.33(3) 0* 1.20(1) 45.20(4) 29.30(4)Fe3+ 0.30(9) 0.60(9) 0.58(3)** 33.70(1)Fe2+ 1.00(9) 0.90(9) 0.58(3)** 3.40(1)
LV4
Hematite 0.37(1) -0.19(2) 0.25(9) 50.20(4) 7.20(1)Hematite 0.35(1) -0.21(1) 0.49(5) 48.70(1) 24.00(8)
Maghemite 0.33(2) 0* 1.21(7) 44.90(2) 31.60(9)Fe3+ 0.33(1) 0.61(3) 0.70(2) 34.00(2)Fe2+ 1.11(8) 0.90(1) 0.32(6) 3.20(2)
LV7
Hematite 0.37(1) -0.20(1) 0.36(3) 50.23(8) 15.70(9)Hematite 0.35(1) -0.13(1) 0.53(3) 48.30(1) 27.00(1)
Maghemite 0.34(2) 0* 1.10(5) 44.30(2) 25.20(9)Fe3+ 0.30(1) 0.60(2) 0.61(1)** 28.10(1)Fe2+ 1.10(8) 1.00(1) 0.61(1)** 4.00(1)
LV8
Hematite 0.35(9) -0.20(2) 0.59(2)** 51.10(9) 1.90(2)Hematite 0.36(1) -0.17(2) 0.59(2) 48.60(1) 24.50(2)
Maghemite 0.37(1) 0* 0.82(2)** 45.50(1) 21.70(2)Fe3+ 0.30(5) 0.60(9) 0.68(1)** 44.70(1)Fe2+ 1.00(9) 0.80(9) 0.68(1)** 7.20(1)
LV11
Hematite 0.29(2) -0.15(4) 0.40(1) 50.50(3) 5.10(7)Hematite 0.35(1) -0.17(1) 0.55(4) 48.78(9) 29.70(9)
Maghemite 0.33(1) 0* 1.05(4) 45.20(2) 33.20(6)Fe3+ 0.30(9) 0.50(9) 0.68(2)** 26.30(1)Fe2+ 1.10(9) 1.00(9) 0.68(2)** 5.70(1)
δ: isomeric displacement relative to the αFe; 2ε: quadrupole shift; Δ: quadrupole splitting; Γ: full width at half maximum; Bhf: hyperfine field; AR: relative subspectral area; LV3, LV4, LV8, and LV11: Rhodic Hapludox; LV2 and LV7: Rhodic Acrudox. The numbers in parentheses are uncertainties over the last significant digit of the corresponding values, estimated as standard deviation as output from the non-linear least squares method, according to the computer algorithm used for numerical fitting of the Mössbauer spectra to Lorentzian functions of the resonance lines. * Fixed parameter. ** Restricted parameter.
Silva Filho et al. Mineralogical evolution of magnetic Rhodic Oxisols under different...
16Rev Bras Cienc Solo 2019;43:e0190065
Anatase is an important Ti-source in soils of mafic rocks, especially in those originating from tuffite, and its origin is probably associated with Il weathering, primary mineral found in coarse fractions (Costa et al., 2014). The stability of microaggregates of Fe-rich Rhodic Oxisols favored the permanence of minerals of the clay fraction, such as Ka, Hm, Gb, and Gt, also in coarse fractions even after the chemical and mechanical dispersion procedures, as noted by Camêlo et al. (2018).
In Fe-rich soils, the XRD peak intensity 110 of Hm is usually higher than the XRD peak 104 of this mineral (Costa et al., 1999; Camêlo et al., 2018). This is due to the overlap of XRD peak 311 of Mt/Mh in coarse fractions (sand and silt) and Mh in the clay fraction.
Table 5. Particle size proportion, and magnetic susceptibility (χlf) and dependent frequency (χfd) in ADFE, sand, silt, and clay fractions
SoilParticle sizes(¹) χlf
(²) χfd(²)
Sand Silt Clay ADFE Sand Silt Clay ADFE Sand Silt Clayg kg-1 10-8 m3 kg-1 %
LV1 314.9 107.8 577.3 7,226 10,851 8,586 4,528 4.2 0.6 2.6 15.6LV2 211.7 237.0 551.3 6,473 7,125 7,149 8,198 10.4 5.3 10.9 14.1LV3 213.2 108.4 678.5 3,025 3,805 3,119 2,676 8.8 4.1 6.8 19.1LV4 111.4 269.3 619.3 9,828 9,545 12,975 8,668 9.4 4.6 5.7 17.4LV5 237.1 137.2 625.8 2,328 808 3,482 3,535 12.8 2.7 6.0 18.7LV6 280.2 245.4 474.4 6,891 6,328 10,563 5,752 8.8 8.0 4.0 18.4LV7 181.4 293.4 525.1 13,464 13,656 14,987 10,799 8.5 5.0 3.5 13.3LV8 102.9 166.4 730.7 6,275 6,796 6,053 6,239 11.9 2.5 10.1 14.9LV9 105.0 203.2 691.8 5,366 6,242 6,466 4,925 9.7 5.1 5.9 15.9LV10 108.1 160.3 731.5 5,673 4,699 6,812 6,440 10.8 8.0 7.9 14.7LV11 269.2 94.5 636.3 6,916 7,122 8,717 6,216 8.3 0.9 4.8 13.7LV12 114.0 102.5 783.5 2,645 3,445 2,000 2,771 12.3 7.3 12.4 16.9
(1) Pipette method (Teixeira et al., 2017); (2) Method described in Dearing (1999). LV1, LV3, LV4, LV5, LV6, LV8, LV9, LV10, and LV11: Rhodic Hapludox; LV2, LV7, and LV12: Rhodic Acrudox.
123456789
101112
0Contribution χlf to ADFE (%)
Sam
ples
Clay Silt Sand
00
2500
5000
7500
10000
12500
15000
(b)
y = 0.9136x + 664.57
R2 = 0.9743 (p<0.01; n = 12)
χ lf (1
0-8 m
3 kg-1
) – e
stim
ated
χlf (10-8 m3 kg-1) – determined
150001250010000750050002500100908070605040302010
(a)
Figure 9. Estimated contribution of sand, silt, and clay fractions to the χlf of ADFE (a), and correlation between estimated and determined χlf in the ADFE (b).
Silva Filho et al. Mineralogical evolution of magnetic Rhodic Oxisols under different...
17Rev Bras Cienc Solo 2019;43:e0190065
The inexpressiveness of XRD peaks of Gt in the clay fraction reflects the strong dilution suffered by this Fe oxide in detriment to others, since after treatment with NaOH 5 mol L-1, the XRD peaks of Gt were easily identified in all soils. The presence of Ili in the clay
Table 6. Contents of Sis, Fes, Als, and Tis extracted by sulfuric digestion (expressed in oxides), Ki index, and Fe obtained in the clay fraction by sequential extractions with Na-citrate-bicarbonate-dithionite (Fed), H2SO4 1.8 mol L-1 (Fesulf), and only one extraction with acid oxalate ammonium (Feo)
Soil SiO2 Fe2O3 Al2O3 TiO2 Ki(1) Fed Fesulf Feo Feo/Fed Fed/Fes Fesulf/Fed Fesulf/Fes
g kg-1 g kg-1
LV1 93.7 244.7 101.8 79.3 1.56 168.3 98.6 6.2 0.04 0.98 0.59 0.58LV2 5.4 458.8 198.7 16.2 0.05 183.0 81.1 6.3 0.03 0.57 0.44 0.25LV3 180.5 207.9 191.5 40.0 1.60 119.1 43.4 3.8 0.03 0.82 0.36 0.30LV4 95.9 331.9 263.9 61.8 0.62 164.5 110.4 4.5 0.03 0.71 0.67 0.48LV5 116.7 236.8 153.8 34.0 1.29 158.3 53.8 4.0 0.03 0.96 0.34 0.32LV6 84.3 296.0 247.0 67.4 0.58 127.6 87.8 5.6 0.04 0.62 0.69 0.42LV7 29.2 402.3 191.2 111.9 0.26 161.8 115.2 8.9 0.05 0.58 0.71 0.41LV8 232.2 220.5 209.3 27.3 1.89 151.6 104.2 6.2 0.04 0.98 0.69 0.68LV9 238.4 220.1 221.1 34.3 1.83 115.8 90.8 3.7 0.03 0.75 0.78 0.59LV10 163.0 227.6 219.3 33.1 1.26 99.4 65.5 3.5 0.03 0.62 0.66 0.41LV11 82.1 242.0 191.7 40.1 0.73 121.6 87.5 4.9 0.04 0.72 0.72 0.52LV12 188.2 149.8 165.6 23.0 1.93 98.3 42.5 4.5 0.05 0.94 0.43 0.41
(1) Weathering index (Ki), in which Ki = 1.7 × SiO2/Al2O3. LV1, LV3, LV4, LV5, LV6, LV8, LV9, LV10, and LV11: Rhodic Hapludox; LV2, LV7, and LV12: Rhodic Acrudox.
LV10
2000
4000
6000
8000
10000
12000
14000
Σ Co
, Cu,
Ni,
V, Z
n, M
n, C
r (m
g kg
-1)
Samples
ADFE Sand Silt SMFClay
LV12LV11LV10LV9LV8LV7LV6LV5LV4LV3LV2
Figure 10. Total trace element contents determined for ADFE, sand, silt, clay, and sand magnetic fraction of the soils. LV1, LV3, LV4, LV5, LV6, LV8, LV9, LV10, and LV11: Rhodic Hapludox; LV2, LV7, and LV12: Rhodic Acrudox.
Silva Filho et al. Mineralogical evolution of magnetic Rhodic Oxisols under different...
18Rev Bras Cienc Solo 2019;43:e0190065
fraction of LV1 signals the cover of tuffite with other parent materials and its reworking during pedogenesis.
As noted by Camêlo et al. (2017), the MCS ratio values indicated the occurrence of soils with Gt in different ways, isodimensional and acicular, and Hm placoids. Regarding Mh, Eggleton (1988) reported that variations in the crystalline system (cubic or tetragonal) are caused by the location of voids in the structure. If voids are orderly distributed, the Mh will show a tetragonal structure; if they occur randomly, the Mh will be cubic. Magnetite particle size might also contribute to the change of the Mh structure in soils. Magnetite in the sand fraction are generally more stable and undergo oxidation slowly, hence voids in the octahedral sites are probably ordered and the Mh formed is tetragonal. On the other hand, Mt in the silt fraction are less stable and rapidly oxidized, providing randomness to the distribution of voids and formation of cubic Mh as confirmed from the better adjustment by Rietveld refinement method. Although tetragonal Mh is inexpensive according to the Rietveld refinement, the MCSMh220/MCSMh400 ratio values more distant from one indicate coexistence of both structures, with predominance of cubic Mh for certain soils, as noted by Camêlo et al. (2017).
Dimension a values were close to the expected for cubic Mh (a = 0.8350 nm) (Eggleton, 1988), consistent with values estimated after Rietveld refinement by Poggere et al. (2018). The values indicate heterogeneity in Mh particle size, which is mainly conditioned by the IS process in the crystal structure (Schulze and Schwertmann, 1984; Batista et al., 2013). According to the values of dimension a (<0.8329 nm) and MCSMh220 (<31 nm), the Mh presents high IS (Batista et al., 2013). Since ferrimagnetic particle size determines the type of magnetic behavior, the Mh showed superparamagnetic behavior (<30 nm), which explains the high values of dependent frequency χfd (>14 %) (Dearing, 1999). In the soils LV2 and LV10, Mh particles with single domain probably coexist (30-200 nm) (Poggere et al., 2018).
The IS values in Gt and Hm are within the range expected for highly weathered soils (Carvalho Filho et al., 2015; Camêlo et al., 2017). The values confirm that Gt can accommodate more Al in its structure as compared to Hm. Generally, Hm presents approximately half of IS values of Gt (Singh and Gilkes, 1992).
123456789
101112
Contribution TE to ADFE (%)
Sam
ples
500500
1000
1500
2000
2500
3000
3500
4000
4500 y = 0.9201x + 27.323
R2 = 0.8044 (p<0.01; n = 12)
TE –
est
imat
ed (
mg
kg-1)
TE – determined (mg kg-1)
Clay Silt Sand (b)(a)
0 100908070605040302010 45004000350030002500200015001000
Figure 11. Estimated contribution of sand, silt, and clay fractions to the total trace elements (TE) contents (a), and correlation between estimated and determined total TE in the ADFE (b).

Silva Filho et al. Mineralogical evolution of magnetic Rhodic Oxisols under different...
19Rev Bras Cienc Solo 2019;43:e0190065
The quantitative analysis of minerals in the clay fraction is consistent with the results obtained by other authors (Carvalho Filho et al., 2015; Camêlo et al., 2017; Poggere et al., 2018). Our study, similar to Poggere et al. (2018), did not identify Mt in the clay fraction of Rhodic Oxisols originating from mafic rocks. The Mh contents did not exceed the other pedogenic Fe oxides, although some studies have reported higher contents for Hm and Gt of Fe-rich Rhodic Oxisols (Carvalho Filho et al., 2015; Camêlo et al., 2017).
The SMF showed weathering features in ferrimagnetic particles and coexistence of Mt, Mh, and Hm in a single grain. Thus, Mt particles probably inherited from the parent material are transformed into Mh and Hm progressively via aerial oxidation during the weathering of soils (Fontes and Weed, 1991). The change of Mt-Mh-Hm phases by thermal induction can be disregarded because the Raman spectra were obtained with less laser power than required to induce this phenomenon (Jubb and Allen, 2010; Sousa et al., 2018). In contrast, the Mössbauer spectra indicated that Mh is the only ferrimagnetic Fe oxide in the sand fraction of most soils, with the exception of LV7 and LV11, where highly oxidized Mt traces, {Fe}/[Fe] lower than 1.88 (Vandenberghe et al., 2000), were identified. Silva et al. (2017) also observed only Mh in Oxisols with spontaneous magnetism investigated by the Mössbauer spectroscopy.
According to Singer et al. (1995), the Mössbauer spectroscopy is inefficient to differentiate highly oxidized ferrimagnetic particles in soils. This limitation is related with the interstratification process, which allows the coexistence of Mt, Mh, and Hm in a single ferrimagnetic particle. Possibly, the use of Mössbauer spectroscopy in γ-rays transmission and conversion electrons enables a more detailed observation of the oxidation surface layer in ferrimagnetic particles of the sand fraction. A residual fraction of Mt would remain protected in internal part of magnetic grains, and the oxidized external layer is primarily composed by Mh. The use of two Mössbauer geometries should be highly suitable to solve this matter.
Magnetic study
The χlf values are consistent with those observed by other authors for Fe-rich Oxisols Rhodic in Brazil derived from mafic rocks (Costa et al., 1999; Ramos et al., 2017; Camêlo et al., 2018). Their variations are mainly related to the type of parent material (Lu, 2000; Camêlo et al., 2018) and pedogenesis (Hanesch et al., 2007; Lu et al., 2008; Camêlo et al., 2018), as well as pedoenvironmental conditions (Lu, 2000; Poggere et al., 2018; Camêlo et al., 2018).
Iron-rich Rhodic Oxisols originating from tuffite, itabirite, basalt, and diabase, with expressive χlf, are common due to the abundance of ferrimagnetic Fe oxides inherited from these rocks during the weathering (Costa et al., 1999; Lu, 2000; Oliveira et al., 2000; Costa et al., 2014; Camêlo et al., 2018). The LV7 (tuffite) showed χlf prominently above all other soils. Due to its high chemical and mineralogical heterogeneity (Fabris et al., 1997), tuffite can originate soils with high χlf reaching much higher values than those on other mafic rocks, as also noted by Camêlo et al. (2018). On the other hand, the range of χlf values for Fe-rich Rhodic Oxisols indicates that generalizations between the magnetic properties and the parent material type of soils should be avoided because of the variable ferrimagnetic mineral contents in mafic rocks and addition of diamagnetic mineral components to the soil during pedogenesis (Costa et al., 2014; Ramos et al., 2017; Camêlo et al., 2018).
In Fe-rich Rhodic Oxisols, high χlf values in coarse fractions (sand and silt) are certainly caused by the predominance of ferrimagnetic lithogenic particles (Costa et al., 1999; Camêlo et al., 2018). However, we observed that the clay fraction contributes, proportionally, with most χlf in soils, as its value results from proportion and specific magnetic behavior of minerals (Dearing, 1999). Therefore, the clay fraction in most soils contributes to more than 50 % of the χlf value in the ADFE and thus is mainly responsible for magnetic
Silva Filho et al. Mineralogical evolution of magnetic Rhodic Oxisols under different...
20Rev Bras Cienc Solo 2019;43:e0190065
properties of the studied soils. Conversely, Camêlo et al. (2018) stated that coarse fractions still exert a dominant influence on magnetic properties of some Fe-rich Rhodic Oxisols developed from mafic rocks in Minas Gerais, Brazil. The soils in our work possibly have a higher degree of pedogenetic development in terms of ferrimagnetic Fe oxides.
The χfd values in sand and silt fractions show a mixture of ferrimagnetic particles with different magnetic behavior (Dearing, 1999). The particle sizes in these fractions (0.053-2 mm) indicates predominance of multidomain (MD) ferrimagnetic particles, although χfd of up to 12.4 % in the silt fraction (LV12) was found. We believe that high-stability of microaggregates, common in Fe-rich Rhodic Oxisols (Camêlo et al., 2018), are responsible for the presence of particles with different types of magnetic behavior in coarse fractions. In the clay fraction, the χfd values (>13.3 %) suggest that more than 75 % of ferrimagnetic particles display superparamagnetic (SP) behavior (Dearing, 1999).
Poggere et al. (2018), in addition to highlighting dominance of SP particles, also detected single-domain particles (SD), pseudo-simples domain (SPD), and MD in soils. According to Peters and Dekkers (2003), Mh and Hm aggregates in Fe-rich Rhodic Oxisols can affect the manifestation of magnetic behavior of particles; similarly, the disturbances in the structure of the ferrimagnetic mineral, such as IS in Mh or even an increase of fine antiferromagnetic particles (Nedelkoski et al., 2017). Heterogeneity in the magnetic behavior of ferrimagnetic particles in the clay fraction (Poggere et al., 2018) and conversion of Mh into Hm (Jiang et al., 2018) assures χfd from being an indicator of pedogenesis to soils derived from mafic rocks.
Geochemical study
The low values of Ki index associated with high Fes contents confirmed the mafic nature of the soil’s parent materials (Carvalho Filho et al., 2015; Camêlo et al., 2017; Poggere et al., 2018). In Oxisols, pedogenic Fe oxides are dominantly crystalline (Feo/Fed ≤0.06) (Camêlo et al., 2017; Poggere et al., 2018). These authors also highlight Fed/Fes values lower than 0.8, as observed in LV2, LV4, LV6, LV7, LV9, LV10, and LV11. Due to the presence of lithogenic Fe phases, which would be Fe-source in sand and silt fractions, and high IS in pedogenic Fe oxides, especially in Gt, low Fed/Fes ratios can be observed.
Several authors have used the Fesulf content to estimate Fe originating from Mh in soils (Schwertmann and Fechter, 1984; Costa et al., 1999; Camêlo et al., 2017; Poggere et al., 2018). The Fesulf/Fed and Fesulf/Fes ratio values indicate that Mh is the main pedogenic Fe oxide of soils, in contrast to Mh contents estimated through the Rietveld refinement. These results reflect the contribution of other mineral phases, such as Hm and Gt, on Fesulf content, as reported by Camêlo et al. (2017) and Poggere et al. (2018), even when the dissolution time is set according to χlf. Thus, significant correlations between the Fe contents (Fes, Fed, Feo, and Fesulf) and χlf are related to the strong influence of the parent material (Lu, 2000; Hanesch et al., 2007; Camêlo et al., 2018). On the other hand, correlation between Tis contents and χlf values can indicate both the occurrence of Ti-magnetic phases and the efficiency of this element in distinguishing magnetic soils on basic rocks (Fabris et al., 1997; Camêlo et al., 2017).
The total TE contents in Fe-rich Rhodic Oxisols are directly associated to ferrimagnetic Fe oxides; the proportion and magnetic behavior of these minerals reflect the influence of the parent material and pedogenesis (Oliveira et al., 2000; Costa et al., 2014; Camêlo et al., 2018). Tuffite, basalt, and diabase originated soils richer in TE compared to the itabirite soil (LV2), it is consequence of a bedrock formed through metamorphism of sediments rich in Fe and quartz in a poor ionic environment (Costa et al., 2014; Camêlo et al., 2018). The contrast of total TE contents in tuffite and basalt soils was also observed by Camêlo et al. (2018), and demonstrates that the distribution of these elements in the parent material, especially in tuffite, is heterogeneous and influenced by pedoenvironmental conditions (Marques et al., 2004).

Silva Filho et al. Mineralogical evolution of magnetic Rhodic Oxisols under different...
21Rev Bras Cienc Solo 2019;43:e0190065
The highest total TE values found in SMF, sand, and silt reflect the predominant lithogenic influence on Fe oxides, and in the clay fraction, the lowest values indicate the domain of pedogenic phases (Oliveira et al., 2000; Camêlo et al., 2018). The decrease in particle size leads to losses of these elements in mineral structure during the transformation processes. In addition, the neoformation of secondary minerals occurs in a poorer ionic environment than that in primary basic rocks (Camêlo et al., 2018). Although lithogenic Fe oxides have higher TE amounts in their structure, it does not mean that sand and silt fractions represent the largest compartments of these elements in the soil. Estimated total TE contents in the ADFE showed that in LV2, LV3, LV8, LV10, and LV12, the clay fraction can contribute with total TE values greater than 50 % (Figures 9a and 9b). Magnetite tends to contribute most of the total TE contents in magnetic Rhodic Oxisols (Camêlo et al., 2018); however, the availability of these elements in the soil solution seems to be controlled by superparamagnetic maghemite, since the smaller particle size would increase its instability (Liu et al., 2010), and possibly its dissolution rate. In contrast, Camêlo et al. (2018) stress that Fe-rich Rhodic Oxisols can have their geochemical attributes still controlled by the parent material, because certain TE seem to be correlated with magnetic minerals, especially those found in coarse fractions. Thus, the authors point out natural replacement of some TE in equilibrium reactions of the soil solution during plant development could be more effective in soils with higher concentrations of magnetic particles in coarse fractions (Camêlo et al., 2018).
CONCLUSIONSIn Brazilian Fe-rich Rhodic Oxisols originating from mafic rocks, magnetite occurs only in coarse fractions (sand and silt), and as pedogenesis advances, magnetite suffers a reduction of particle size and progressive aerial oxidation, transforming into maghemite and hematite, which concentrate in the clay fraction. Magnetite particles in the silt and sand fractions are highly oxidized (not stoichiometric), characterized by magnetite-maghemite-hematite interstratification. In addition, magnetic susceptibility of these soils can be controlled by both multidomain (magnetite) and superparamagnetic (maghemite) particles, depending on the weathering degree of the ferrimagnetic lithogenic particles. Although the sand and silt fractions generally contain most of the total trace element contents, clay fraction can control the availability of these elements in the soil solution, since the solubility of superparamagnetic maghemites is probably greater than multidomain magnetites in Fe-rich Rhodic Oxisols. We highlight the need for future researches on procedures for efficient dispersion and separation of the granulometric fractions in these soils since it is a problem frequently reported by other authors.
ACKNOWLEDGEMENTSThe authors would like to thank the Coordination for the Improvement of Higher Level Personnel (CAPES) - Finance Code 001 - and the National Council for Scientific and Technological Development (CNPq) for the financial support. The authors acknowledge José Domingos Ardisson (Center for the Development of Nuclear Technology) and José Domingos Fabris (Universidade Federal de Minas Gerais) for helping with acquisition and interpretation of Mössbauer results. The authors also thank Antonio Carlos Saraiva da Costa (Universidade de Maringá), Ricardo Simão Diniz Dalmolin (Universidade Federal de Santa Maria), and Walder Antonio Gomes de Albuquerque Nunes (Embrapa Agropecuária Oeste) for soil sampling.
AUTHOR CONTRIBUTIONSConceptualization: Luiz Aníbal da Silva Filho, João Carlos Ker, Maurício Paulo Ferreira Fontes, and Danilo de Lima Camêlo.
Silva Filho et al. Mineralogical evolution of magnetic Rhodic Oxisols under different...
22Rev Bras Cienc Solo 2019;43:e0190065
Validation: Luiz Aníbal da Silva Filho, João Carlos Ker, Maurício Paulo Ferreira Fontes, Danilo de Lima Camêlo, Marcelo Metri Corrêa, Luiz Carlos Duarte Cavalcante, and Luciano de Moura Guimarães.
Formal Analysis: Luiz Aníbal da Silva Filho, Marcelo Metri Corrêa, Luiz Carlos Duarte Cavalcante, and Luciano de Moura Guimarães.
Investigation: Luiz Aníbal da Silva Filho, Danilo de Lima Camêlo, Marcelo Metri Corrêa, Luiz Carlos Duarte Cavalcante, and Luciano de Moura Guimarães.
Data Curation: Luiz Aníbal da Silva Filho, Luiz Carlos Duarte Cavalcante, and Luciano de Moura Guimarães.
Writing – Original Draft: Luiz Aníbal da Silva Filho.
Writing – Review and Editing: João Carlos Ker, Maurício Paulo Ferreira Fontes, Danilo de Lima Camêlo, Marcelo Metri Corrêa, Luiz Carlos Duarte Cavalcante, and Luciano de Moura Guimarães.
Visualization: Luiz Aníbal da Silva Filho, João Carlos Ker, Maurício Paulo Ferreira Fontes, Danilo de Lima Camêlo, Marcelo Metri Corrêa, Luiz Carlos Duarte Cavalcante, and Luciano de Moura Guimarães.
Supervision: Luiz Aníbal da Silva Filho, João Carlos Ker, Maurício Paulo Ferreira Fontes, and Danilo de Lima Camêlo.
Project Administration: Luiz Aníbal da Silva Filho, João Carlos Ker, Maurício Paulo Ferreira Fontes, and Danilo de Lima Camêlo.
REFERENCESBarrón V, Torrent J. Evidence for a simple pathway to maghemite in Earth and Mars soils. Geochim Cosmochim Ac. 2002;66:2801-6. https://doi.org/10.1016/S0016-7037(02)00876-1
Batista MA, Costa ACS, Bigham JM, Paesano Junior A, Berndt G, Inoue TT, Nonaka AG. Structural and magnetic characterization of maghemites prepared from Al-substituted magnetites. Rev Bras Cienc Solo. 2013;37:1569-75. https://doi.org/10.1590/S0100-06832013000600013
Bersani D, Lottici PP, Montenero A. Micro-Raman investigation of iron oxide films and powders produced by sol-gel syntheses. J Raman Spectrosc. 1999;30:355-60. https://doi.org/10.1002/(SICI)1097-4555(199905)30:5<355::AID-JRS398>3.0.CO;2-C
Caglioti G, Paoletti A, Ricci FP. Choice of collimators for a crystal spectrometer for neutron diffraction. Nucl Instrum Methods. 1958;3:223-8. https://doi.org/10.1016/0369-643X(58)90029-X
Camêlo DL, Ker JC, Fontes MPF, Corrêa MM, Costa ACS, Melo VF. Pedogenic iron oxides in iron-rich Oxisols developed from mafic rocks. Rev Bras Cienc Solo. 2017;41:e0160379. https://doi.org/10.1590/18069657rbcs20160379
Camêlo DL, Ker JC, Fontes MPF, Costa ACS, Corrêa MM, Leopold M. Mineralogy, magnetic susceptibility and geochemistry of Fe-rich Oxisols developed from several parent materials. Sci Agric. 2018;75:410-9. https://doi.org/10.1590/1678-992x-2017-0087
Carvalho Filho A, Inda AV, Fink JR, Curi N. Iron oxides in soils of different lithological origins in Ferriferous Quadrilateral (Minas Gerais, Brazil). Appl Clay Sci. 2015;118:1-7. https://doi.org/10.1016/j.clay.2015.08.037
Causevic H, Morrás H, Mijovilovich A, Saragovi C. Evidences of the stability of magnetite in soil from Northeastern Argentina by Mössbauer spectroscopy and magnetization measurements. Physica B. 2004;354:373-6. https://doi.org/10.1016/j.physb.2004.09.081
Chamritski I, Burns G. Infrared and Raman active phonons of magnetite, maghemite, and hematite: a computer simulation and spectroscopic study. J Phys Chem B. 2005;109:4965-8. https://doi.org/10.1021/jp048748h
Silva Filho et al. Mineralogical evolution of magnetic Rhodic Oxisols under different...
23Rev Bras Cienc Solo 2019;43:e0190065
Costa ACS, Bigham JM, Rhoton FE, Traina SJ. Quantification and characterization of maghemite in soils derived from volcanic rocks in southern Brazil. Clay Clay Miner. 1999;47:466-73. https://doi.org/10.1346/CCMN.1999.0470408
Costa RV, Silva AC, Fabris JD, Barbosa MS, Barral UM, Vial DAO. Minerais ferruginosos e fertilidade natural de solos magnéticos do Vale do Jequitinhonha, Minas Gerais. Rev Bras Cienc Agrar. 2018;13:e5517. https://doi.org/10.5039/agraria.v13i2a5517
Costa SAD, Ker JC, Simões DFF, Fontes MPF, Fabris JD, Andrade FV. Pedogenesis and classification of Latosols developed from itabirites in the region of Quadrilátero Ferrífero, MG. Rev Bras Cienc Solo. 2014;38:359-71. https://doi.org/10.1590/S0100-06832014000200001
Dearing JA. Environmental magnetic susceptibility: using the Bartington MS2 system. 2nd ed. Kenilworth: Chi Publishing; 1999.
Eggleton RA. The application of micro-beam methods to iron minerals in sols. In: Stucki JW, Goodman BA, Schwertmann U, editors. Iron in soils and clay minerals. Dordrecht: D. Reidel Publishing Company; 1988. p. 165-202.
Fabris JD, Jesus Filho MF, Coey JMD, Mussel WN, Goulart AT. Iron-rich spinels from Brazilian soils. Hyperfine Interact. 1997;110:23-32.
Fontes MPF, Oliveira TS, Costa LM, Campos AAG. Magnetic separation and evaluation of magnetization of Brazilian soils from different parent materials. Geoderma. 2000;96:81-99. https://doi.org/10.1016/S0016-7061(00)00005-7
Fontes MPF, Weed SB. Iron oxides in selected Brazilian Oxisols: I. Mineralogy. Soil Sci Am J. 1991;55:1143-9. https://doi.org/10.2136/sssaj1991.03615995005500040040x
Gasparov LV, Tanner DB, Romero DB, Berger H, Margaritondo G, Forró L. Infrared and Raman studies of the Verwey transition in magnetite. Phys Rev B: Condens Matter Mater Phys. 2000;62:7939-44. https://doi.org/10.1103/PhysRevB.62.7939
Hanesch M. Raman spectroscopy of iron oxides and (oxy)hydroxides at low laser power and possible applications in environmental magnetic studies. Geophys J Int. 2009;177:941-8. https://doi.org/10.1111/j.1365-246X.2009.04122.x
Hanesch M, Rantitsch G, Hemetsberger S, Scholger R. Lithological and pedological influences on the magnetic susceptibility of soil: their consideration in magnetic pollution mapping. Sci Total Environ. 2007;382:351-63. https://doi.org/10.1016/j.scitotenv.2007.04.007
Hunter BA, Howard CJA. Computer program for Rietveld analysis of X-ray and neutron power diffraction patterns. Sydney: Australian Nuclear Science and Technology Organization Publishing; 2000.
Jackson ML. Soil chemical analysis - advanced course: A manual of methods useful for instruction and research in soil chemistry, physical chemistry of soils, soil fertility, and soil genesis. 2nd ed. Madison: USA Department of Soil Science University of Wisconsin; 1979.
Jiang Z, Liu Q, Roberts AP, Barrón V, Torrent J, Zhang Q. A new model for transformation of ferrihydrite to hematite in soils and sediments. Geology. 2018;46:987-90. https://doi.org/10.1130/G45386.1
Jubb AM, Allen HC. Vibrational spectroscopic characterization of hematite, maghemite, and magnetite thin films produced by vapor deposition. ACS Appl Mater Interfaces. 2010;2:2804-12. https://doi.org/10.1021/am1004943
Klug HP, Alexander LE. X-ray diffraction procedures for polycrystalline and amorphous materials. 2nd ed. New York: John Wiley and Sons; 1974.
Letti CJ, Paterno LG, Pereira-da-Silva MA, Morais PC, Soler MAG. The role of Polymer films on the oxidation of magnetite nanoparticles. J Solid State Chem. 2017;246:57-64. https://doi.org/10.1016/j.jssc.2016.10.027
Liu XM, Shaw J, Jiang JZ, Bloemendal J, Hesse P, Rolph T, Mao XG. Analysis on variety and characteristics of maghemite. Sci China Earth Sci. 2010;53:1153-62. https://doi.org/10.1007/s11430-010-0030-2
Lu S. Lithological factors affecting magnetic susceptibility of subtropical soils, Zhejiang Province, China. Catena. 2000;40:359-73. https://doi.org/10.1016/S0341-8162(00)00092-8
Silva Filho et al. Mineralogical evolution of magnetic Rhodic Oxisols under different...
24Rev Bras Cienc Solo 2019;43:e0190065
Lu S-G, Xue Q-F, Zhu L, Yu J-Y. Mineral magnetic properties of weathering sequence of soils derived from basalt in Eastern China. Catena. 2008;73:23-33. https://doi.org/10.1016/j.catena.2007.08.004
Maher BA. Magnetite biomineralization in termites. P Roy Soc B-Biol Sci. 1998;265:733-7. https://doi.org/10.1098/rspb.1998.0354
Marques JJ, Schulze DG, Curi N, Mertzman SA. Trace element geochemistry in Brazilian Cerrado soils. Geoderma. 2008;119:179-95. https://doi.org/10.1016/j.geoderma.2003.10.003
Maxbauer DP, Feinberg JM, Fox DL. Magnetic mineral assemblages in soil and paleosols as the basis for paleoprecipitation proxies: A review of magnetic methods and challenges. Earth-Sci Rev. 2016;155:28-48. https://doi.org/10.1016/j.earscirev.2016.01.014
McKeague JA, Day JH. Dithionite and oxalate - extractable Fe and Al as aids in differentiating various classes of soils. Can J Soil Sci. 1966;46:13-22. https://doi.org/10.4141/cjss66-003
Mehra OP, Jackson ML. Iron oxides removal from soils and clays by a dithionite-citrate-bicarbonate system buffered with bicarbonate sodium. Clay Clay Miner. 1960;7:317-27.
Melo VF, Fontes MPF, Novais RF, Singh B, Schaefer CEGR. Características dos óxidos de ferro e de alumínio de diferentes classes de solos. Rev Bras Cienc Solo. 2001;25:19-32. https://doi.org/10.1590/S0100-06832001000100003
Nedelkoski Z, Kepaptsoglou D, Lari L, Wen T, Booth RA, Oberdick SD, Galindo PL, Ramasse QM, Evans RFL, Majetich S, Lazarov VK. Origin of reduced magnetization and domain formation in small magnetite nanoparticles. Sci Rep. 2017;7:45997. https://doi.org/10.1038/srep45997
Norrish K, Taylor M. The isomorphous replacement of iron by aluminum in soil goethites. J Soil Sci. 1961;12:294-306. https://doi.org/10.1111/j.1365-2389.1961.tb00919.x
Oliveira TS, Fontes MPF, Costa LM, Horn AH. Relationship between magnetization and trace elements content of Brazilian soils from different parent materials. Soil Sci. 2000;165:825-34. https://doi.org/10.1097/00010694-200010000-00007
Peters C, Dekkers MJ. Selected room temperature magnetic parameters as a function of mineralogy, concentration and grain size. Phys Chem Earth. 2003;28:659-67. https://doi.org/10.1016/S1474-7065(03)00120-7
Poggere GC, Inda AV, Barrón V, Kämpf N, Brito ADB, Barbosa JZ, Curi N. Maghemite quantification and magnetic signature of Brazilian soils with contrasting parent materials. Appl Clay Sci. 2018;161:385-94. https://doi.org/10.1016/j.clay.2018.05.014
Ramos PV, Dalmolin RSD, Junior JM, Siqueira DS, Almeida JA, Moura-Bueno JM. Magnetic susceptibility of soil to differentiate soil environments in Southern Brazil. Rev Bras Cienc Solo. 2017;41:e0160189. https://doi.org/10.1590/18069657rbcs20160189
Santos HG, Jacomine PKT, Anjos LHC, Oliveira VA, Lumbreras JF, Coelho MR, Almeida JA, Araújo Filho JC, Oliveira JB, Cunha TJF. Sistema brasileiro de classificação de solos. 5a. ed. rev. ampl. Brasília, DF: Embrapa; 2018.
Savian JF, Ernesto M, Alves OC, Berquó TS. Magnetic properties of a soil from Southeastern Brazil in the presence of magnetic biomineralization by social insects. Geoderma. 2017;295:98-106. https://doi.org/10.1016/j.geoderma.2017.02.005
Schulze DG. The influence of aluminium on iron oxides. VIII. Unit-cell dimensions of Al-substituted goethites and estimation of Al from them. Clay Clay Miner. 1984;32:36-44. https://doi.org/10.1346/CCMN.1984.0320105
Schulze DG, Schwertmann U. The influence of aluminium on iron oxides. X. Properties of Al-substituted goethites. Clay Miner. 1984;19:521-39. https://doi.org/10.1180/claymin.1984.019.4.02
Schwertmann U, Fechter H. The influence of aluminum on iron oxides: XI. Aluminum-substituted maghemite in soils and its formation. Soil Sci Soc Am J. 1984;48:1462-3. https://doi.org/10.2136/sssaj1984.03615995004800060054x
Schwertmann U, Fitzpatrick RW, Taylor RM, Lewis DG. The influence of aluminium on iron oxides. Part II. Preparation and properties of Al-substituted hematites. Clay Clay Miner. 1979;27:105-12. https://doi.org/10.1346/CCMN.1979.0270205
Silva Filho et al. Mineralogical evolution of magnetic Rhodic Oxisols under different...
25Rev Bras Cienc Solo 2019;43:e0190065
Sidhu PS, Gilkes RJ, Posner AM. The behavior of Co, Ni, Zn, Cu, Mn and Cr in magnetite during alteration to maghemite and hematite. Soil Sci Soc Am J. 1980;44:135-8. https://doi.org/10.2136/sssaj1980.03615995004400010028x
Silva AC, Souza S, Fabris JD, Barbosa MS, Barral UM, Costa RV. Chemical-mineralogical characterization of magnetic materials from magnetic soil of the southern Espinhaço Mountain Chain and of the Upper Jequitinhonha Valley, state of Minas Gerais, Brazil. Rev Bras Cienc Solo. 2017;41:e0160274. https://doi.org/10.1590/18069657rbcs20160274
Singer MJ, Bower LH, Verosub KL, Fine P, TenPas J. Mössbauer spectroscopic evidence for citrate-bicarbonate-dithionite extraction of maghemite from soils. Clay Clay Miner. 1995;43:1-7. https://doi.org/10.1346/CCMN.1995.0430101
Singh B, Gilkes RJ. Properties and distribution of iron oxides and their association with minor elements in the soils of south-western Australia. J Soil Sci. 1992;43:77-98. https://doi.org/10.1111/j.1365-2389.1992.tb00121.x
Soil Survey Staff. Keys to soil taxonomy. 12th ed. Washington, DC: United States Department of Agriculture, Natural Resources Conservation Service; 2014.
Sousa DV, Ker JC, Schaefer CER, Rodet MJ, Guimarães LM, Felix JF. Magnetite originating from bonfires in a Brazilian prehistoric Anthrosol: a micro-Raman approach. Catena. 2018;171:552-64. https://doi.org/10.1016/j.catena.2018.07.036
Teixeira PC, Donagemma GK, Fontana A, Teixeira WG. Manual de métodos de análise de solo. 3. ed. rev e ampl. Brasília, DF: Embrapa; 2017.
Vandenberghe RE, Barrero CA, Costa GM, Van San E, De Grave E. Mössbauer characterization of iron oxides and (oxy)hydroxides: the present state of the art. Hyperfine Interact. 2000;126:247-59. https://doi.org/10.1023/A:1012603603203
Young RA. The Rietveld Method. New York: Oxford University Press Inc.; 1995.