Embed Size (px)
Citation preview

RUNGE L IMITED abn 17 010 672 321
MINERAL RESOURCE ESTIMATE TRANSVAAL PROJECT
SOUTHERN CROSS, WESTERN AUSTRALIA
St Barbara Limited
August, 2008

Mineral Resource Estimate Transvaal Project
Southern Cross, Western Australia
Project Team: Robert Williams James Potter Nick Snow
Runge Limited St Barbara Limited Transvaal Resource Report
Page ii
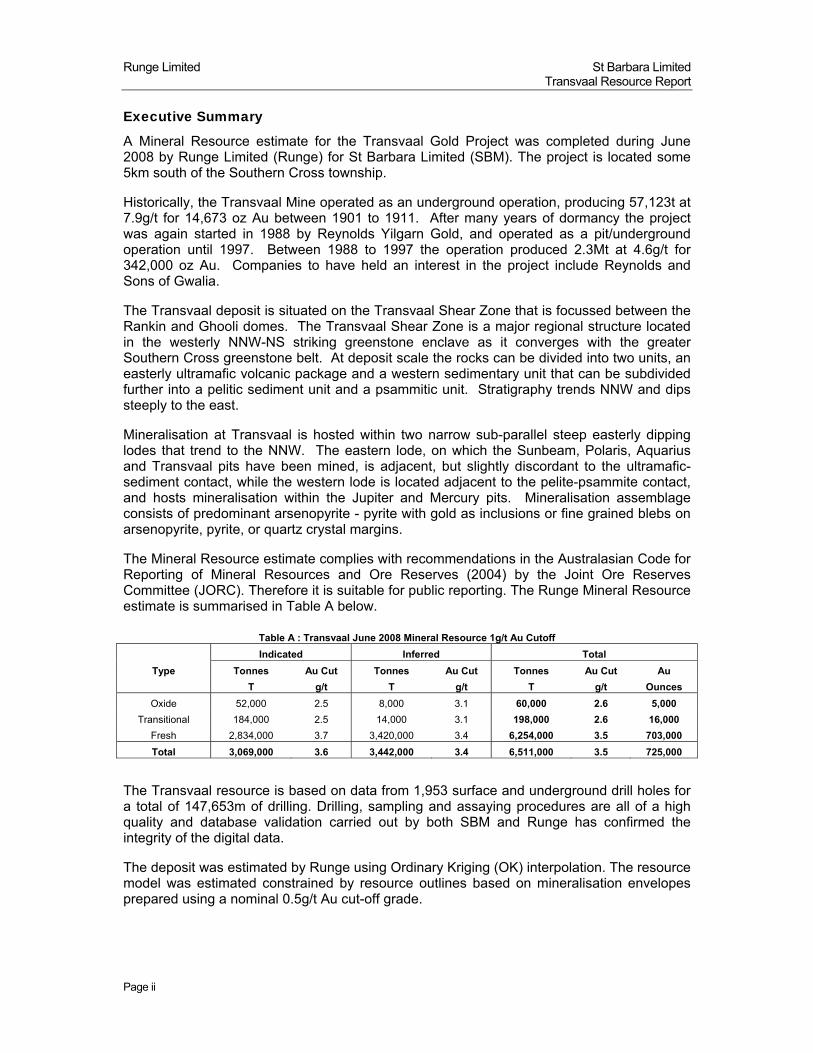
Executive Summary
A Mineral Resource estimate for the Transvaal Gold Project was completed during June 2008 by Runge Limited (Runge) for St Barbara Limited (SBM). The project is located some 5km south of the Southern Cross township.
Historically, the Transvaal Mine operated as an underground operation, producing 57,123t at 7.9g/t for 14,673 oz Au between 1901 to 1911. After many years of dormancy the project was again started in 1988 by Reynolds Yilgarn Gold, and operated as a pit/underground operation until 1997. Between 1988 to 1997 the operation produced 2.3Mt at 4.6g/t for 342,000 oz Au. Companies to have held an interest in the project include Reynolds and Sons of Gwalia.
The Transvaal deposit is situated on the Transvaal Shear Zone that is focussed between the Rankin and Ghooli domes. The Transvaal Shear Zone is a major regional structure located in the westerly NNW-NS striking greenstone enclave as it converges with the greater Southern Cross greenstone belt. At deposit scale the rocks can be divided into two units, an easterly ultramafic volcanic package and a western sedimentary unit that can be subdivided further into a pelitic sediment unit and a psammitic unit. Stratigraphy trends NNW and dips steeply to the east.
Mineralisation at Transvaal is hosted within two narrow sub-parallel steep easterly dipping lodes that trend to the NNW. The eastern lode, on which the Sunbeam, Polaris, Aquarius and Transvaal pits have been mined, is adjacent, but slightly discordant to the ultramafic-sediment contact, while the western lode is located adjacent to the pelite-psammite contact, and hosts mineralisation within the Jupiter and Mercury pits. Mineralisation assemblage consists of predominant arsenopyrite - pyrite with gold as inclusions or fine grained blebs on arsenopyrite, pyrite, or quartz crystal margins.
The Mineral Resource estimate complies with recommendations in the Australasian Code for Reporting of Mineral Resources and Ore Reserves (2004) by the Joint Ore Reserves Committee (JORC). Therefore it is suitable for public reporting. The Runge Mineral Resource estimate is summarised in Table A below.
Table A : Transvaal June 2008 Mineral Resource 1g/t Au Cutoff
Indicated Inferred Total
Type Tonnes Au Cut Tonnes Au Cut Tonnes Au Cut Au
T g/t T g/t T g/t Ounces
Oxide 52,000 2.5 8,000 3.1 60,000 2.6 5,000
Transitional 184,000 2.5 14,000 3.1 198,000 2.6 16,000
Fresh 2,834,000 3.7 3,420,000 3.4 6,254,000 3.5 703,000
Total 3,069,000 3.6 3,442,000 3.4 6,511,000 3.5 725,000
The Transvaal resource is based on data from 1,953 surface and underground drill holes for a total of 147,653m of drilling. Drilling, sampling and assaying procedures are all of a high quality and database validation carried out by both SBM and Runge has confirmed the integrity of the digital data.
The deposit was estimated by Runge using Ordinary Kriging (OK) interpolation. The resource model was estimated constrained by resource outlines based on mineralisation envelopes prepared using a nominal 0.5g/t Au cut-off grade.

Runge Limited St Barbara Limited Transvaal Resource Report
Page iii
The block dimensions used in the model were 5m EW by 20m NS by 10m vertical with sub-cells of 1.25m by 5m by 2.5m. The resource was estimated using a various high grade cuts for the different domains.
The resource was classified as Indicated and Inferred Mineral Resource. The Indicated portion of the resource was defined where the drill spacing was less than 30m by 30m and lode continuity was good. The Inferred Resource included areas of the resource where sampling was coarser than 30m by 30m.
The resource model is undiluted, so appropriate dilution needs to be incorporated in any evaluation of the deposit.
Robert Williams Consultant Geologist

Runge Limited St Barbara Limited Transvaal Resource Report
Page iv
Resource Statement and Parameters
Transvaal June 2008 Mineral Resource 1g/t Au Cutoff
Indicated Inferred Total
Type Tonnes Au Cut Tonnes Au Cut Tonnes Au Cut Au
T g/t T g/t T g/t Ounces
Oxide 52,000 2.5 8,000 3.1 60,000 2.6 5,000
Transitional 184,000 2.5 14,000 3.1 198,000 2.6 16,000
Fresh 2,834,000 3.7 3,420,000 3.4 6,254,000 3.5 703,000
Total 3,069,000 3.6 3,442,000 3.4 6,511,000 3.5 725,000
The resource estimate was completed using the following parameters:
• The Transvaal resource area extends over a strike length of 2,200m from 8,400mN to 10,600mN, and covers a vertical extent of 700m from -300mRL to 400mRL.
• The Transvaal resource is based on data from 1,953 surface and underground drill holes for a total of 147,653m of drilling. Holes were drilled at variable spacings, averaging around 20m spacing in shallower regions of the project and upwards of 40m in deeper portions of the resource.
• Drillhole collars appear to have been accurately surveyed in local grid by Mine surveyors.
• All SBM drill holes have been down hole surveyed using either Eastman camera, Electronic Multishot, or Gyro instruments.
• Numerous site visits have been conducted by Robert Williams (Runge) to review the quality of the historical data and procedures used to collect the new information.
• Sample preparation procedures are documented in this report. Sample preparation and eventual analysis has been shared between SGS of Kalgoorlie, KalAssay and UltraTrace.
• All three laboratories used the Fire Assay technique with a 40g or 50g charge. Both KalAssay and SGS used a flame AAS finish, while Ultratrace adopted an ICP-OES finish for the analysis. Assay technique from earlier pre-SBM drilling is assumed to be a mix of Fire assay and Aqua Regia.
• Comprehensive QAQC was carried out by SBM and Runge. The results indicate that sampling and assaying is reliable. The results from QAQC work carried out on earlier drilling prior to 2007 is not available.
• Database verification within the area covered by this resource has been ongoing and completed by SBM and Runge. Spurious data related to any holes in the database has contributed to the hole/s being omitted from/included in the resource.
• The mineralisation wireframe was constructed using cross sectional interpretation based on a 0.5g/t Au cut-off grade. A minimum down hole length of 3m was used with no edge dilution. Generally up to 3-4m of internal dilution was included. Resource outlines were generally extrapolated to half the distance of the nearest drillhole.

Runge Limited St Barbara Limited Transvaal Resource Report
Page v
• Samples within the wireframes were composited to even 1.0m intervals based on analysis of the sample lengths in the database. Various single high grade cuts were used for each lode.
• The Surpac block dimensions used in the model were 5m EW by 20m NS by 10m vertical with sub-cells of 1.25m by 5m by 2.5m.
• Ordinary Kriging (OK) interpolation with an oriented ellipsoid search was used to estimate gold. A first pass search radius set to slightly exceed the total range of the experimental variogram was used for all wireframe objects. It was doubled for the second pass, and remained the same for the third pass. Greater than 98% of the blocks were filled in the first two passes. A third pass was used to fill any unestimated blocks.
• Bulk density values of up to 3.10t/m3 was used for Fresh material. Density values were supplied to Runge by SBM and were based on historical and recent testwork.
• The deposit was classified as Indicated and Inferred Mineral Resource. The Indicated portion of the resource was defined where the drill spacing was generally less than 30m by 30m. The Inferred portion included areas of the resource where sampling was greater than 30m by 30m and small isolated pods of mineralisation outside the main mineralised zones.

Runge Limited St Barbara Limited Transvaal Resource Report
Page vi
IMPORTANT INFORMATION ABOUT THIS DOCUMENT Confidentiality This document and all information contained herein are confidential and intended for St Barbara Limited (SBM) use only. It shall not be disclosed, in part or full, to any third party, without Runge Limited’s (Runge) prior written consent to the form and context of the disclosure and the identity of the person(s) to whom it is to be disclosed. Limited purpose and context of Information
The opinions expressed in this document are addressed only to SBM for its benefit with respect to this project. Runge accepts no liability whatsoever for any loss or damage (including consequential or economic loss or damage) arising as a result of reliance on the information presented herein for any party other than SBM.
Responsibility
Runge has exercised reasonable care in accordance with standards normally exercised within our profession in the completion of this document.
Runge has relied on information provided by SBM. Although Runge has exercised reasonable care in reviewing this data, Runge makes no representation or warranty with respect to the accuracy or veracity of the data that it has relied upon.
Currency of Information This document has been prepared as at the date stated on the cover page. Given the nature of this document and the opinions expressed within, developments after the date of this document are likely. This document takes no account of such potential future developments. Therefore Runge recommends that SBM seek advice from Runge in the future to ascertain whether any such events have occurred or updated information has become available and should be considered.
Runge Limited St Barbara Limited Transvaal Resource Report
Page vii
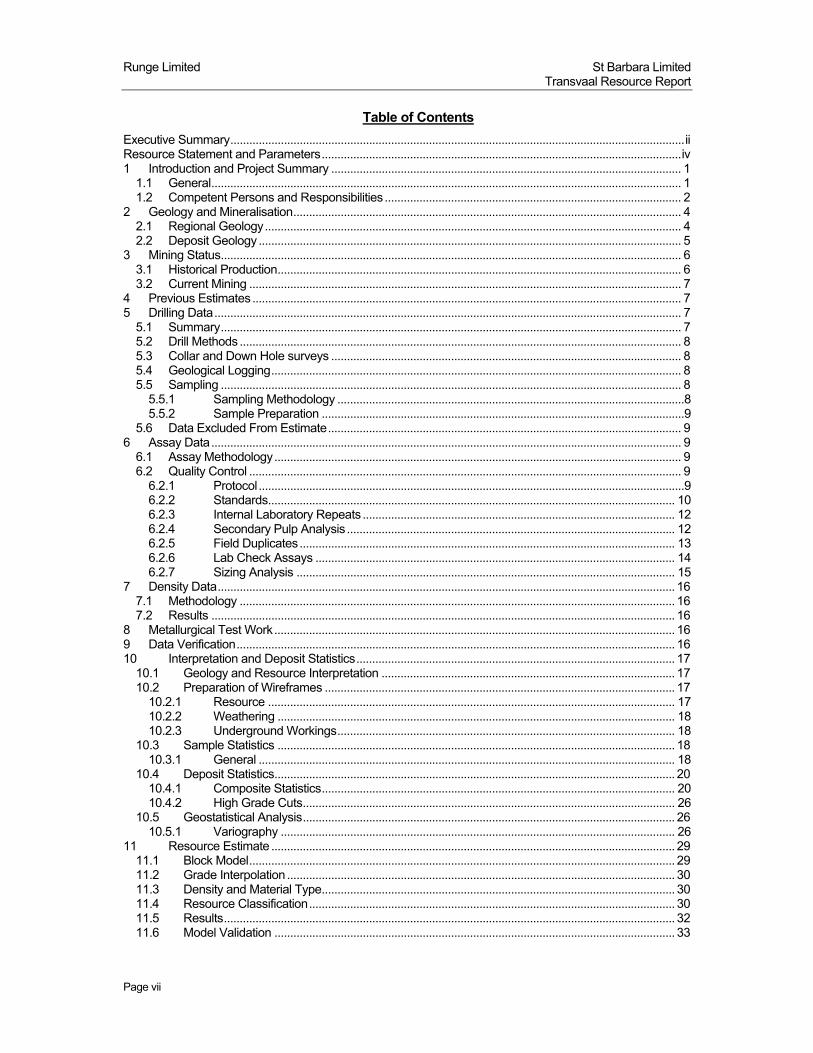
Table of Contents
Executive Summary ................................................................................................................................................ ii Resource Statement and Parameters .................................................................................................................. iv 1 Introduction and Project Summary ............................................................................................................... 1
1.1 General ..................................................................................................................................................... 1 1.2 Competent Persons and Responsibilities .............................................................................................. 2
2 Geology and Mineralisation ........................................................................................................................... 4 2.1 Regional Geology .................................................................................................................................... 4 2.2 Deposit Geology ...................................................................................................................................... 5
3 Mining Status .................................................................................................................................................. 6 3.1 Historical Production ................................................................................................................................ 6 3.2 Current Mining ......................................................................................................................................... 7
4 Previous Estimates ........................................................................................................................................ 7 5 Drilling Data .................................................................................................................................................... 7
5.1 Summary .................................................................................................................................................. 7 5.2 Drill Methods ............................................................................................................................................ 8 5.3 Collar and Down Hole surveys ............................................................................................................... 8 5.4 Geological Logging .................................................................................................................................. 8 5.5 Sampling .................................................................................................................................................. 8
5.5.1 Sampling Methodology .............................................................................................................. 8 5.5.2 Sample Preparation ................................................................................................................... 9
5.6 Data Excluded From Estimate ................................................................................................................ 9 6 Assay Data ..................................................................................................................................................... 9
6.1 Assay Methodology ................................................................................................................................. 9 6.2 Quality Control ......................................................................................................................................... 9
6.2.1 Protocol ....................................................................................................................................... 9 6.2.2 Standards................................................................................................................................. 10 6.2.3 Internal Laboratory Repeats ................................................................................................... 12 6.2.4 Secondary Pulp Analysis ........................................................................................................ 12 6.2.5 Field Duplicates ....................................................................................................................... 13 6.2.6 Lab Check Assays .................................................................................................................. 14 6.2.7 Sizing Analysis ........................................................................................................................ 15
7 Density Data ................................................................................................................................................. 16 7.1 Methodology .......................................................................................................................................... 16 7.2 Results ................................................................................................................................................... 16
8 Metallurgical Test Work ............................................................................................................................... 16 9 Data Verification ........................................................................................................................................... 16 10 Interpretation and Deposit Statistics ..................................................................................................... 17
10.1 Geology and Resource Interpretation ............................................................................................. 17 10.2 Preparation of Wireframes ............................................................................................................... 17
10.2.1 Resource ................................................................................................................................. 17 10.2.2 Weathering .............................................................................................................................. 18 10.2.3 Underground Workings ........................................................................................................... 18
10.3 Sample Statistics .............................................................................................................................. 18 10.3.1 General .................................................................................................................................... 18
10.4 Deposit Statistics ............................................................................................................................... 20 10.4.1 Composite Statistics ................................................................................................................ 20 10.4.2 High Grade Cuts ...................................................................................................................... 26
10.5 Geostatistical Analysis ...................................................................................................................... 26 10.5.1 Variography ............................................................................................................................. 26
11 Resource Estimate ................................................................................................................................ 29 11.1 Block Model ....................................................................................................................................... 29 11.2 Grade Interpolation ........................................................................................................................... 30 11.3 Density and Material Type ................................................................................................................ 30 11.4 Resource Classification .................................................................................................................... 30 11.5 Results ............................................................................................................................................... 32 11.6 Model Validation ............................................................................................................................... 33

Runge Limited St Barbara Limited Transvaal Resource Report
Page viii
12 Reconciliation ......................................................................................................................................... 35 12.1 Mining ................................................................................................................................................ 35
13 Risk and Opportunities .......................................................................................................................... 35 14 Conclusion and Recommendations ..................................................................................................... 36 15 References ............................................................................................................................................. 37
Table of Figures
Figure 1-1 Transvaal Location ............................................................................................................................................... 1 Figure 1-2 Transvaal Gold Project – All Resource Drilling and Open Pits ....................................................................... 2 Figure 2-1 Regional Geology of the Southern Cross Greenstone Belt ................................................................................ 4 Figure 2-2 Transvaal Mine Layout ........................................................................................................................................ 6 Figure 6-1 Transvaal Drilling Campaign Standard Analysis ............................................................................................ 11 Figure 6-2 Scatter Plot of Internal Lab Repeats .................................................................................................................. 12 Figure 6-3 Transvaal Secondary Pulp Analysis .................................................................................................................. 13 Figure 6-4 Transvaal QAQC Duplicate Analysis ................................................................................................................. 14 Figure 6-5 Transvaal Sizing Analysis .................................................................................................................................. 15 Figure 10-1 Oblique View of the Transvaal Resource Wireframes (Looking NW) ........................................................... 17 Figure 10-2 Sample Length Histogram Within the Resource Wireframes ........................................................................ 19 Figure 10-3 Omnidirectional Variograms for Object1 (L) and Object 3 (R) .................................................................... 27 Figure 11-1 Resource Classification Transvaal Western Lodes- Indicated (green); Inferred (red); Mined out areas in blue (View looking NW). ........................................................................................................................................................ 31 Figure 11-2 Resource Classification Transvaal Eastern Lodes- Indicated (green); Inferred (red); Mined out areas in blue (View looking NW). ........................................................................................................................................................ 31 Figure 11-3 Transvaal Mineral Resource (10m Bench Breakdown) ................................................................................. 32 Figure 11-4 Transvaal Mineral Resource Grade-Tonnage Curve .................................................................................... 32 Figure 11-5 Sunbeam/Polaris (Fresh) Mineral Resource Validation Plot by Northing ................................................... 33 Figure 11-6 Sunbeam/Polaris (Fresh) Mineral Resource Validation Plot by Elevation .................................................. 33 Figure 11-7 Mercury (Fresh) Mineral Resource Validation Plot by Northing ................................................................. 34 Figure 11-8 Mercury (Fresh) Mineral Resource Validation Plot by Elevation ................................................................ 34

Runge Limited St Barbara Limited Transvaal Resource Report
Page ix
Index of tables
Table 4-1 Transvaal Resource Estimate – 2003. ................................................................................................................... 7 Table 5-1 Summary of Drilling ............................................................................................................................................... 8 Table 6-1 Tabulated Standard Results of the Transvaal Drilling Campaign .................................................................... 10 Table 6-2 Summary of Internal Laboratory Repeats ........................................................................................................... 12 Table 7-1 Bulk Density Data Using the Air Pycnometer Method – Fresh Material ......................................................... 16 Table 10-1 Wireframe Object Number, Lode Name and Model Attribute Relationship ................................................... 18 Table 10-2 Transvaal Regolith Wireframes and Database Coding ................................................................................... 18 Table 10-3 Informing Composite Files for all Domains in the Transvaal Estimate ......................................................... 20 Table 10-4 Basic Statistics for all Upper Saprolite Composites in the Transvaal Estimate ............................................. 21 Table 10-5 Basic Statistics for all Lower Saprolite Composites in the Transvaal Estimate ............................................. 22 Table 10-6 Basic Statistics for all Saprock Composites in the Transvaal Estimate .......................................................... 23 Table 10-7 Basic Statistics for all Fresh Composites in the Transvaal Estimate .............................................................. 24 Table 10-8 Basic Statistics for Entire Object Composites in the Transvaal Estimate ....................................................... 25 Table 10-9 Transvaal Variogram Parameter Domain and Object Relationship ............................................................. 26 Table 10-10 Kriging Parameters for Various Domains ..................................................................................................... 28 Table 11-1 Block Model Parameters .................................................................................................................................... 29 Table 11-2 Interpolation parameters ................................................................................................................................... 30 Table 11-3 Transvaal Resource Estimate June 2008 (1g/t Au Cut Off) ............................................................................. 32 Table 11-4 Transvaal Mineral Resource Composite and Global Resource Grade Comparison ..................................... 35
List of Appendices
Appendix 1: Transvaal June 2008 Resource Tables Appendix 2: Transvaal June 2008 Resource Validation Tables Appendix 3: Statistics and Log Probability Plots Appendix 4: Transvaal June 2008 Variography Appendix 5: Bulk Density Testwork Appendix 6: List of Omitted Holes Appendix 7: Surpac String File Descriptions

Runge Limited St Barbara Limited Transvaal Resource Report
Page 1 March 2008
1 Introduction and Project Summary
1.1 General
Runge Limited (Runge) was contracted by St Barbara Limited (SBM) to update the resource estimate for the Transvaal Gold Project as part of the study into potential open pit/underground mining of the Transvaal lodes. The project is located within the Southern Cross greenstone belt, just 5km south of the Southern Cross township and 30km north-west of SBM’s Marvel Loch operation Figure 1-1.
Figure 1-1 Transvaal Location
The Transvaal Project lies within a single mining lease, M77/225 and comprises a system of near north-south striking parallel lodes (Jupiter, Mercury, Sunbeam, Polaris, Aquarius and Transvaal respectively). SBM is the tenement holder and operator. Other companies to have held an interest in the project include Newmont Pty Ltd, Boomalli Ltd, Kia Ora Gold Corporation NL, Reynolds Yilgarn Gold Operations (formerly Mawson Pacific Limited), and Sons of Gwalia.
Runge Limited St Barbara Limited Transvaal Resource Report
Page 2 August 2008
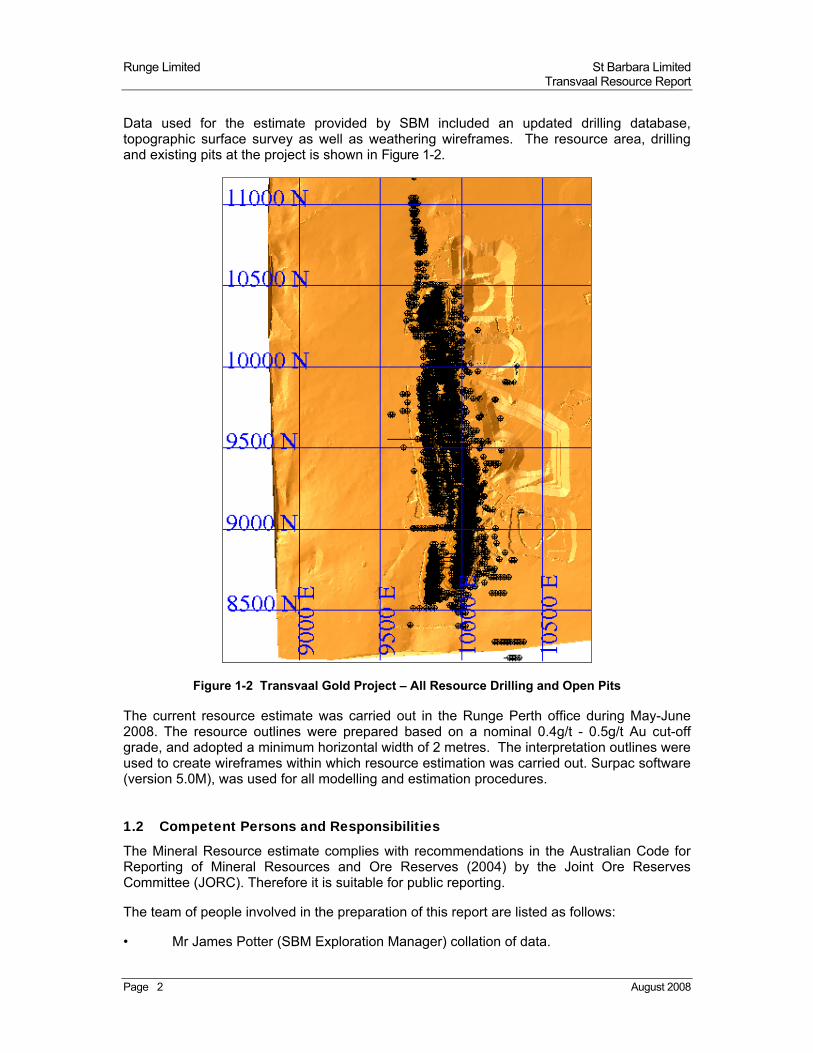
Data used for the estimate provided by SBM included an updated drilling database, topographic surface survey as well as weathering wireframes. The resource area, drilling and existing pits at the project is shown in Figure 1-2.
Figure 1-2 Transvaal Gold Project – All Resource Drilling and Open Pits
The current resource estimate was carried out in the Runge Perth office during May-June 2008. The resource outlines were prepared based on a nominal 0.4g/t - 0.5g/t Au cut-off grade, and adopted a minimum horizontal width of 2 metres. The interpretation outlines were used to create wireframes within which resource estimation was carried out. Surpac software (version 5.0M), was used for all modelling and estimation procedures.
1.2 Competent Persons and Responsibilities
The Mineral Resource estimate complies with recommendations in the Australian Code for Reporting of Mineral Resources and Ore Reserves (2004) by the Joint Ore Reserves Committee (JORC). Therefore it is suitable for public reporting.
The team of people involved in the preparation of this report are listed as follows:
• Mr James Potter (SBM Exploration Manager) collation of data.

Runge Limited St Barbara Limited Transvaal Resource Report
Page 3 August 2008
• Mr Robert Williams (Runge Consultant) responsible for mineralisation interpretation, wireframing, statistical analysis, Mineral Resource estimation, classification and reporting.
• Mr Nick Snow (SBM Senior Exploration Geologist) assistance with interpretation of ultramafic and sediment lithology’s, and provision of weathering wireframes.
• Mr Ben Bartlett (SBM Resource Manager) statistical review and Competent Person for the Transvaal estimate.

Runge Limited St Barbara Limited Transvaal Resource Report
Page 4 August 2008
2 Geology and Mineralisation 2.1 Regional Geology
The Transvaal gold deposit is located within the Southern Cross Province of the Archean Yilgarn Craton. The Southern Cross greenstone belt is a narrow, elongate NW trending package of rocks that extends some 300km from Jackson in the north, to Hatters Hill in the south (Figure 2-1).
Figure 2-1 Regional Geology of the Southern Cross Greenstone Belt
The stratigraphy of the belt has been divided into two sequences, the lower consisting of a basal quartzose sandstone, overlain by dominant metakomatiite and metabasalt rocks with thin interflow layers of quartz-biotite schist, quartz-grunerite banded iron formation and metagabbro sills; and an upper greywacke sequence composed mainly of pelitic metasediments. The rocks likely formed as part of a platform style Archean basin into which the volcano-sedimentary sequences were deposited (Gee et al., 1981), before domal uplift of granitic intrusions and simultaneous regional deformation squeezed the rocks into the current configuration.
Deformation is due to compression between granitoid dome intrusions, and dextral transpressional movement. Progressive deformation has produced a range of tight to open
Runge Limited St Barbara Limited Transvaal Resource Report
Page 5 August 2008
folds, layer parallel ductile shear zones, and brittle faults. The Transvaal deposit is situated on the Transvaal Shear Zone that is focussed between the Rankin and Ghooli domes.
Metamorphic grade in the belt ranges from upper greenschist near the centre of the thicker portions of the belt, to granulite to amphibolite near the granite-greenstone belt contacts.
2.2 Deposit Geology
The Transvaal deposit is situated within the Transvaal Shear Zone, a narrow shear zone located in the westerly NNW-NS striking greenstone enclave as it converges with the greater Southern Cross greenstone belt. The Transvaal Shear Zone is a major regional structure which is defined by a broad zone of deformation, and is geochemically anomalous for elevated gold, arsenic and antimony signatures.
At deposit scale the rocks can be divided into three units, an eastern mafic volcanic package, a central ultramafic volcanic package and finally a western sedimentary unit that can be subdivided further into a pelitic sediment unit and a psammitic unit. Stratigraphy trends NNW and dips steeply to the east, although vertical dips and steep westerly dips have also been recorded. Mafic assemblages are generally actinolite-plagioclase-chlorite dominant, whilst ultramafic assemlages are commonly tremolite dominated, with minor amounts of talc, carbonate, chlorite and magnetite in the fine to medium grained rock. Localised anthophyllite-cummingtonite alteration has been recorded and is a possible indicator of early magnesian alteration. Pelitic sediments are typically fine grained dark grey rocks with compositional and grain size layering on centimetre scale and a well developed layer parallel cleavage, that are composed of biotite-quartz-andalusite-cordierite-garnet. Wilde (1989), noted an increase in biotite, pyrrhotite and quartz in wall rocks proximal to lode positions. Psammites are generally quartz dominant with associated biotite.
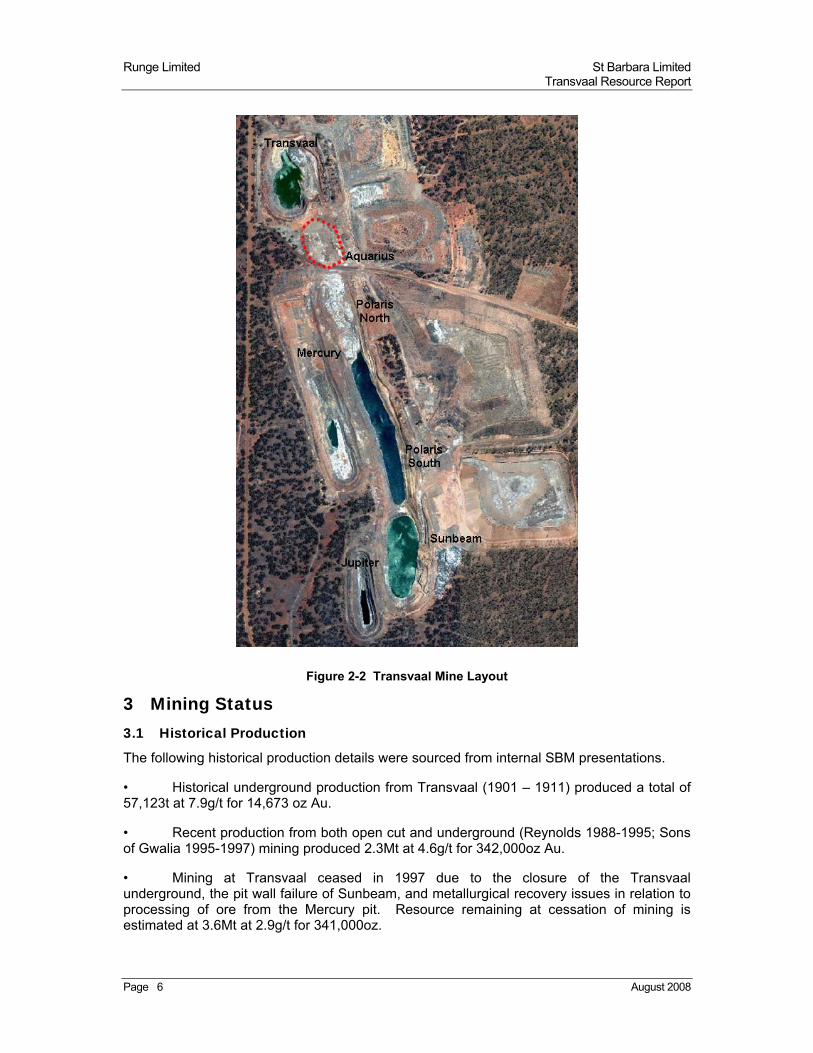
Mineralisation at Transvaal is hosted within two narrow sub-parallel steep easterly dipping lodes that trend to the NNW. The eastern lode, on which the Sunbeam, Polaris, Aquarius and Transvaal pits have been mined, is adjacent, but slightly discordant to the ultramafic-sediment contact, while the western lode is located adjacent to the pelite-psammite contact, and hosts mineralisation within the Jupiter and Mercury pits (Figure 2-2).
Mineralisation assemblage consists of predominant arsenopyrite - pyrite with gold as inclusions or fine grained blebs on arsenopyrite, pyrite, or quartz crystal margins.
Runge Limited St Barbara Limited Transvaal Resource Report
Page 6 August 2008
Figure 2-2 Transvaal Mine Layout
3 Mining Status 3.1 Historical Production
The following historical production details were sourced from internal SBM presentations.
• Historical underground production from Transvaal (1901 – 1911) produced a total of 57,123t at 7.9g/t for 14,673 oz Au.
• Recent production from both open cut and underground (Reynolds 1988-1995; Sons of Gwalia 1995-1997) mining produced 2.3Mt at 4.6g/t for 342,000oz Au.
• Mining at Transvaal ceased in 1997 due to the closure of the Transvaal underground, the pit wall failure of Sunbeam, and metallurgical recovery issues in relation to processing of ore from the Mercury pit. Resource remaining at cessation of mining is estimated at 3.6Mt at 2.9g/t for 341,000oz.

Runge Limited St Barbara Limited Transvaal Resource Report
Page 7 August 2008
3.2 Current Mining
Mining is currently not in progress at the Transvaal project.
4 Previous Estimates The latest resource estimate details sourced for the Transvaal project report an Inferred Mineral resource of 3.4Mt at 2.3g/t for 248,700 oz (Smith 2003). The estimate was derived from importing into Surpac, and re-blocking an earlier 1997 Snowden Mining Industry Consultants, MIK model of Transvaal. This was done as part of an internal scoping study for a preliminary pit optimisation, in order to guide further resource development drilling around the pit, and as such was not completed to JORC classification. The above estimate was reported with two other categories “Strategic Inventory1” and “Strategic Inventory2”. Full details of the estimate are displayed in table.
Mineral ResourceClassification Tonnes Grade Oz
Inferred 3,432,000 2.3 248,700 Strategic Inventory1 2,766,000 2.0 176,100 Strategic Inventory2 2,422,000 1.8 142,300
Table 4-1 Transvaal Resource Estimate – 2003.
5 Drilling Data 5.1 Summary
The drilling database containing all drill holes in the Transvaal Project was prepared by and provided to Runge by James Potter (SBM - Southern Cross Exploration Manager). The database was loaded into Surpac mining software version 5.0M.
The Transvaal database contains a number of generations of drilling dating back as far as 1951 when Great Western Consolidated NL operated the mine, and as such a lot of information regarding assay technique, sample method, QAQC has been either lost or was unrecorded.
The notes regarding sampling procedure, surveys, geological logging and sample preparation in this section of the report relate to recent drilling completed by SBM in late 2007 to mid 2008

Runge Limited St Barbara Limited Transvaal Resource Report
Page 8 August 2008
5.2 Drill Methods
The database contained both recent and historical records for 6,917 drill holes in the resource area. A total of 1,953 holes were included in the resource estimate for a total of 11,173 intersection metres within the mineralised envelopes.
A summary of the drilling data within the resource area is shown in Table 5-1.
Hole Type
In Project In Resource
Drill Holes Drill Holes Intersection
Number Metres Number Metres Metres
Core 430 76,555 292 57,773 1,487
GRC 998 14,303 416 9,459 1,861
RC 4,139 235,852 1,239 78,487 7,783
RC/DD 15 5,350 6 1,934 42
RAB 1,237 36,405 - - -
AC 54 3,466 - - -
Sludge 44 560 - - -
Total 6,917 372,491 1,953 147,653 11,173
Table 5-1 Summary of Drilling
5.3 Collar and Down Hole surveys
SBM drill hole collars were accurately surveyed by Marvel Loch mine surveyors using an RTK total station unit, and then adjusted for the SX_NVLG grid conversion.
Downhole surveying of the Transvaal drilling campaigns was conducted by Ausmines and Down Hole Surveys. Ausmines utilised an electronic multishot tool on all RC drillholes drilled in the campaign. Surveying of diamond drillholes was conducted by Down Hole Surveys using a north seeking gyroscope within the drill string.
5.4 Geological Logging
All holes were logged in accordance with the SBM geological procedures.
5.5 Sampling
5.5.1 Sampling Methodology
Individual single metre composite samples were produced from RC holes at time of drilling. As well as the single metre composites, four metre composite samples that were collected by spear sampling the bulk reject sample bag. The four metre composite samples were submitted for analysis. Where 4m composite samples assayed higher than 0.2g/t, the single metre composite sample was retrieved from the field and submitted to the laboratory for analysis.
There were very few wet samples in the Transvaal program. The general procedure for wet samples was to take a 4m “wet” composite initially and if the composite returned >0.2ppm Au value, the bulk reject samples were left to dry and then re-split through a 3 tier splitter. The sample was broken up prior to splitting.

Runge Limited St Barbara Limited Transvaal Resource Report
Page 9 August 2008
All diamond holes drilled as part of the “TVDD” series were logged, cut and sampled onsite by SBM personnel.
Duplicate sampling was conducted by splitting the bulk reject bag through a 3 tier riffle splitter to derive a 1/8th split and then submitted to the laboratory for analysis.
5.5.2 Sample Preparation
Sample preparation for the Transvaal drilling campaign was completed predominantly by SGS Kalgoorlie Laboratories, with minor involvement from KalAssay and Ultratrace Laboratories in Perth.
Sample preparation process was similar in all three laboratories where material submitted by SBM underwent initial crushing to achieve particle size <10mm and was followed by complete pulverisation of the whole sample in an LM5 Ringmill. Approximately 500g of pulped material, for subsequent assaying, was placed in analytical envelopes. In some cases a second pulp of similar weight was extracted for purposes of analysis to test homogeneity of the grind. The remaining sample pulp in the LM5 was scooped back into the same calico bag from which the sample was originally delivered and the bowl then vacuum cleaned.
5.6 Data Excluded From Estimate
All RAB, AC and sludge holes were immediately excluded from use in the estimate. During the interpretation stage an extra 124 holes (RC and DDH) were excluded from the resource estimate, generally due to conflicting information, unsampled zones or questionable survey data. Some holes were excluded as they were drilled down dip of mineralisation. These holes have been flagged “no”, in the collar table field ‘res_incl_flag’. A full list of the omitted holes is displayed in Appendix 6.
6 Assay Data
6.1 Assay Methodology
Analysis of the Transvaal drilling samples was was completed predominantly by SGS Kalgoorlie Laboratories, with minor involvement from KalAssay and Ultratrace Laboratories in Perth. All analyses for gold utilised fire assay with a 40g charge and an ICP-OES finish to a detection limit of 0.01ppm. All three laboratories tested grind size by way of either wet screen or laser particle analyser.
6.2 Quality Control
6.2.1 Protocol
The QAQC protocols implemented for the Transvaal drilling program (SBM) included a minimum of:
• Insertion of certified standard samples at a rate at least one per drillhole to assess assay accuracy of the laboratory.
• Re-numbered sample pulp residues re-submitted to an umpire laboratory for checking of the initial assay.
• Laboratory repeats were performed at a frequency of 1 per 25 samples.
• Secondary pulps were collected from the bowl of the LM5 at a frequency of approximately 1 in every 30 samples (for SGS only). These secondary pulps were assayed and

Runge Limited St Barbara Limited Transvaal Resource Report
Page 10 August 2008
reported. Assessment of the gold assay for the original pulp, and the secondary pulp, provides an insight into homogeneity of the pulverised sample.
• Field duplicate samples were not taken at the time of drilling, rather upon the return of assays of the original samples. The SBM geologist would prepare a list of downhole zones that would require re-splitting, to achieve a duplicate sample which was compared to the original sample.
• Grindsize analysis was conducted on the pulps at a frequency of 1 in 30 samples.
The following is a summary of the data as supplied to Runge.
6.2.2 Standards
All standards and blanks were reviewed prior to data entry of the results into the database by SBM staff.
In total 199 standard samples representing 10 different standards were analysed during the Transvaal drilling campaign. Runge has reviewed the standards and tabulated the results in Table 6-1. Graphical presentation is displayed in Figure 6-1.
Certified Standard Summary SBM Standard Data Summary
Standard Au Value Std Deviation Au - 2SD Au + 2SD No. Samples Minimum Maximum Mean Std Deviation
G301-3 0.85 0.05 0.75 0.95 1 2.04 2.04 2.04 -
G305-1 0.21 0.01 0.18 0.24 16 0.18 0.25 0.20 0.02
G306-1 0.41 0.03 0.35 0.47 22 0.33 2.92 0.51 0.54
G900-2C 1.48 0.06 1.36 1.60 46 0.02 3.42 1.45 0.38
G900-5 3.21 0.13 2.95 3.47 36 0.01 3.73 2.97 0.67
G901-9 0.69 0.04 0.61 0.77 26 0.63 0.75 0.70 0.03
G904-3 13.66 0.62 12.42 14.90 3 11.90 13.50 12.93 0.90
G905-7 3.91 0.14 3.63 4.19 1 4.38 4.38 4.38 -
G996-7C 5.99 0.39 5.21 6.77 22 2.95 6.93 5.74 0.87
G997-1 0.41 0.04 0.33 0.49 26 0.31 0.48 0.40 0.04
Table 6-1 Tabulated Standard Results of the Transvaal Drilling Campaign
Assessment of the standards indicate the majority of those analysed plot within the expected +/- 2 standard deviations grade range. It is suspected that some of those standards that have plotted outside the expected grade range maybe a result of misclassification of the standard.

Runge Limited St Barbara Limited Transvaal Resource Report
Page 11 August 2008
Transvaal Gold Project: All Standards
0
2
4
6
8
10
12
14
16
Assayed Standard
Au
Ass
ay (
g/t
)
Figure 6-1 Transvaal Drilling Campaign Standard Analysis

Runge Limited St Barbara Limited Transvaal Resource Report
Page 12 August 2008
6.2.3 Internal Laboratory Repeats
The results of 215 internal laboratory repeats from the Transvaal drilling campaign are shown below in Table 6-2, and Figure 6-2. Both indicate an acceptable correlation at all Au grade ranges tested.
Au range Count Ave Au Orig. Ave Au-Rp1
0-0.7 170 0.05 0.06
0.7-1.0 3 0.86 0.88
1.0-5.0 21 2.84 2.89
5.0-10.0 10 6.43 7.41
>10 11 20.51 20.95
Total 215 1.68 1.76
Table 6-2 Summary of Internal Laboratory Repeats
Transvaal Gold Project: Repeats Analysis
y = x
0
10
20
30
40
50
60
70
0 10 20 30 40 50 60 70
Au Original (g/t Au)
Au
Rep
eat
(g/t
Au
)
Figure 6-2 Scatter Plot of Internal Lab Repeats
6.2.4 Secondary Pulp Analysis
The practice of taking a secondary pulp (at a frequency of one per 25 samples), from the pulverised sample is a procedure adopted by SGS laboratories to assess the homogeneity of the pulp. Secondary pulps were taken for 273 samples and the assays returned were compared with the assay from the primary pulp.
Figure 6-3 indicates a fair correlation between assays for the primary pulp and secondary pulp, which would suggest the pulverisation process being performed by SGS is suitable for the Transvaal samples.

Runge Limited St Barbara Limited Transvaal Resource Report
Page 13 August 2008
Transvaal Gold Project: Secondary Pulp Analysis
y = x
0
5
10
15
20
25
0 5 10 15 20 25
Original Pulp: Au Original
Sec
on
dar
y P
ulp
Figure 6-3 Transvaal Secondary Pulp Analysis
6.2.5 Field Duplicates
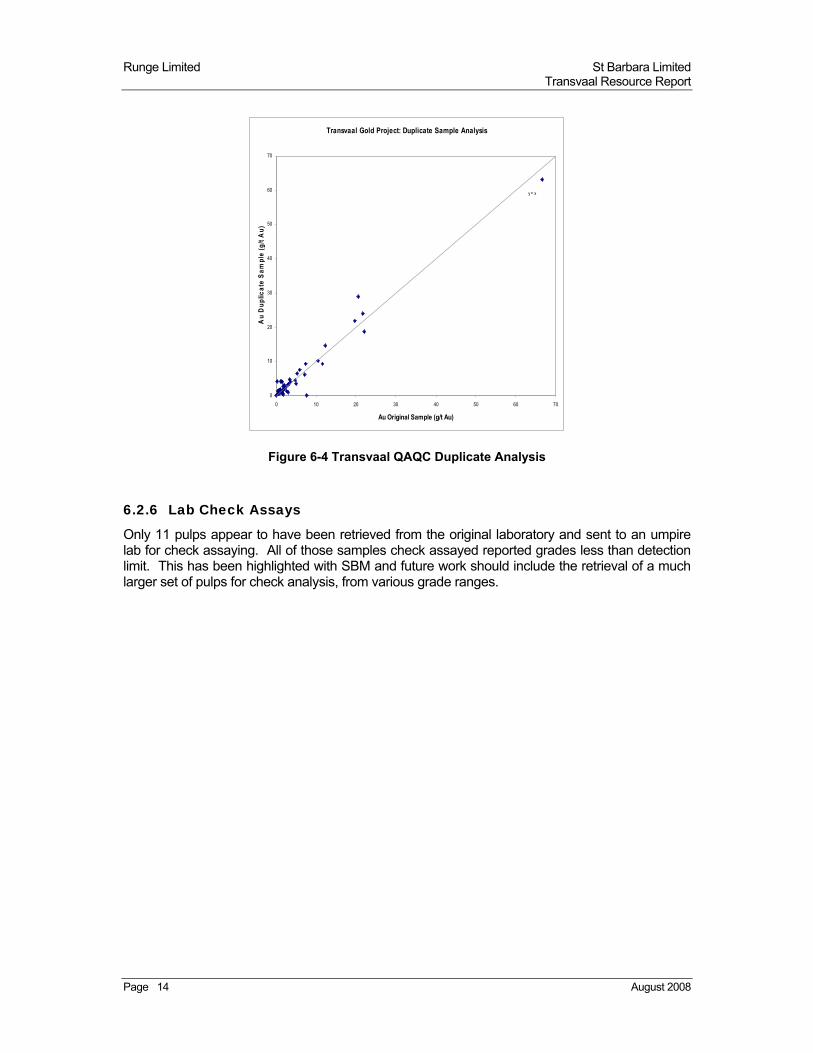
SBM collected 44 duplicate RC samples by resplitting the original bulk reject bag through a 3 tier riffle splitter. These duplicate samples were then submitted for analysis. Results of the duplicate assay were then plotted against the original assay. Figure 6-4 shows the scatter of the original assay – duplicate assay data postings.
The data initially supplied to Runge contained 5 spurious data postings derived from TVRC0031 and TVDD0009 drillholes. Runge requested the 5 samples to be resplit from the bulk reject sample and be re-submitted to the laboratory. The 5 new assays showed much better correlation than the original resplits, and Runge assumes there was a possible mix up of samples during the first resplit campaign.
Runge Limited St Barbara Limited Transvaal Resource Report
Page 14 August 2008
Transvaal Gold Project: Duplicate Sample Analysis
y = x
0
10
20
30
40
50
60
70
0 10 20 30 40 50 60 70
Au Original Sample (g/t Au)
Au
Du
plic
ate
Sa
mp
le (
g/t
Au
)
Figure 6-4 Transvaal QAQC Duplicate Analysis
6.2.6 Lab Check Assays
Only 11 pulps appear to have been retrieved from the original laboratory and sent to an umpire lab for check assaying. All of those samples check assayed reported grades less than detection limit. This has been highlighted with SBM and future work should include the retrieval of a much larger set of pulps for check analysis, from various grade ranges.

Runge Limited St Barbara Limited Transvaal Resource Report
Page 15 August 2008
6.2.7 Sizing Analysis
The results of 111 grind size tests indicate grind size has been within the targeted 90%-100% passing 75 micron size. All of the 111 samples tested exceeded the 90% passing 75 micron benchmark. The lack of any very bad grind size results is of interest to Runge, and it is recommended that a check of the reported grind size be completed by an umpire laboratory.
Results of the grind size analysis for the Transvaal campaign drilling are shown below in Figure 6-5.
Transvaal Gold Project: Sizing Analysis
80
90
100
Sample
% P
assi
ng
75
mic
ron
Figure 6-5 Transvaal Sizing Analysis

Runge Limited St Barbara Limited Transvaal Resource Report
Page 16 August 2008
7 Density Data 7.1 Methodology
Densities used in the Transvaal model were compiled by SBM from a number of sources, including;
historical reports outlining what bulk densities had been used previously. classical bulk density determinations of grab samples taken in the pit. classical bulk density determinations of drill core samples. moisture content and pycnometer determinations of weathered waste rock from
diamond drilling (SGS labs). Pycnometer determinations from diamond drilling of the eastern lode system
(AMMTEC labs).
7.2 Results
Results of the SBM testwork has been tabulated in Table 7-1 below.
Type Lithology Bulk Density (t/m3) Source
Was
te
Cover 1.77 classical method Upper Saprolite UM 2.1 Reynolds Lower Saprolite UM 2.6 Reynolds Saprock UM 2.83 classical method + pycnometer Fresh UM 2.95 classical method + pycnometer Upper Saprolite Sed 1.77 classical method Lower Saprolite Sed 1.77 classical method Saprock Sed 2.4 classical method Fresh Sed 2.8 classical method
Min
eral
ised
Cover 1.77 classical method Upper Saprolite 2.2 Reynolds Lower Saprolite 2.2 Reynolds Saprock 2.7 Reynolds Fresh 3.1 pycnometer
Table 7-1 Bulk Density Data Using the Air Pycnometer Method – Fresh Material
Full details of the SBM bulk density study are outlined in Appendix 5.
8 Metallurgical Test Work No test work results were reviewed by Runge.
9 Data Verification Database verification and validation has been a constant process carried out by both Runge and SBM. Discussion between James Potter and Runge concluded with a number of holes being excluded from the dataset to be used in the estimation. Whilst onsite, the collars from the latest Transvaal drilling campaign were observed in the field and positions verified with the SBM database.

Runge Limited St Barbara Limited Transvaal Resource Report
Page 17 August 2008
10 Interpretation and Deposit Statistics 10.1 Geology and Resource Interpretation
Runge constructed mineralised envelopes using a 0.4 - 0.50g/t Au cut-off. These were used to provide overall geometry to mineralised zones. A minimum down hole length of 3m was used with no edge dilution. Generally up to 3-4m of internal dilution was included in the intersections if required, however in some cases, larger areas of low grade mineralisation were included to provide continuity to interpretations.
Resource outlines were generally extrapolated to half the distance of the nearest drillhole.
10.2 Preparation of Wireframes
10.2.1 Resource
Interpreted sectional outlines were manually triangulated to form wireframes as shown in Figure 10-1. In total 15 separate objects numbered 1-15, were constructed across the project area. The object number is recorded in the block model attribute “pod”. The objects representing each lode are shown in Table 10-1.
Figure 10-1 Oblique View of the Transvaal Resource Wireframes (Looking NW)
North

Runge Limited St Barbara Limited Transvaal Resource Report
Page 18 August 2008
Object No. Lode Name Attribute: Pod
1 Jupiter 1
2 Jupiter HW 2
3 Mercury 3
4 Sunbeam FW 4
5 Sunbeam / Polaris 5
6 Polaris FW minor 6
7 Polaris FW 7
8 Aquarius FW 8
9 Aquarius / Transvaal HW 9
10 Transvaal 10
11 Transvaal HW 11
12 Polaris HW 12
13 Polaris HW2 13
14 Transvaal FW 14
15 Polaris HW3 15
Table 10-1 Wireframe Object Number, Lode Name and Model Attribute Relationship
To form ends to the wireframe, the end section strings were copied to a position midway to the next section or 10m and adjusted to match the dip, strike and plunge of the zone. The wireframed objects were validated using Surpac software and set as solids.
10.2.2 Weathering
Weathering wireframes (botr1.dtm, bous1.dtm, boco1.dtm & tofr1.dtm) were supplied by SBM. These wireframes have not been snapped to drillholes by Runge.
10.2.3 Underground Workings
SBM supplied Runge with closure plans of the Transvaal workings, which were digitised and wireframed.
10.3 Sample Statistics
10.3.1 General
The wireframes of the mineralised zones were used to code the database to allow identification of the resource intersections. Coding of the database also occurred on a basis of regolith, with all regolith intercepts written to the ox_zone field of the ox_zone table within the database. Table 10-2 indicates the spatial location and the corresponding code that was assigned to the ox_zone table of the database.
Geological Domain Database Code (ox_zone) Comment
Colluvium oxupsap Below natural surface and above bous dtm’s
Upper Saprolite
Lower Saprolite oxlowsap Below bous and above boco dtm’s
Transitional oxsaprock Below boco and above tofr dtm’s
Fresh fresh Below tofr dtm
Table 10-2 Transvaal Regolith Wireframes and Database Coding

Runge Limited St Barbara Limited Transvaal Resource Report
Page 19 August 2008
Surpac software was then used to extract downhole composites based on both the res_zone and ox_zone codes from the database. All holes were composited to 1m on a basis of a sample length analysis, the results of which are displayed in Figure 10-2
Histogram of Sample Lengths in Resource
0
2000
4000
6000
8000
10000
12000
14000
0.2 0.4 0.6 0.8 1 1.5 2 3 4 >4
Sample Length (m)
Fre
qu
ency
Figure 10-2 Sample Length Histogram Within the Resource Wireframes
The minimum composite length was set to 40% (40cm), and composites were checked for spatial correlation within the objects, the location of the rejected composites, and zero composite values.

Runge Limited St Barbara Limited Transvaal Resource Report
Page 20 August 2008
10.4 Deposit Statistics 10.4.1 Composite Statistics The composite sample data for each resource zone was imported into GeoAccess software for analysis. Where number of records permitted, the composite file informing the interpolation was restricted by regolith domain, although for objects with few records it was decided to interpolate using composites extracted purely by object without regard for regolith.
Table 10-3 outlines the informing composite files used in the interpolation of the model, while statistics for upper saprolite, lower saprolite, saprock, fresh and entire object composite files are contained in Table 10-4 to Table 10-8.
Object Upper Sap Lower Sap Saprock Fresh
1 cut_comp_upper_sap cut_comp_lower_sap cut_comp_saprock cut_comp_fresh
2 Entire Object (cut_comp)
3 cut_comp_upper_sap cut_comp_lower_sap cut_comp_saprock cut_comp_fresh
4 cut_comp_upper_sap cut_comp_lower_sap cut_comp_saprock cut_comp_fresh
5 cut_comp_upper_sap cut_comp_lower_sap cut_comp_saprock cut_comp_fresh
6 Entire Object (cut_comp)
7 cut_comp_loup_sap cut_comp_lower_sap cut_comp_saprock cut_comp_fresh
8 cut_comp_lower_sap cut_comp_saprock cut_comp_fresh
9 cut_comp_upper_sap cut_comp_lower_sap cut_comp_saprock cut_comp_fresh
10 cut_comp_loup_sap cut_comp_lower_sap cut_comp_saprock cut_comp_fresh
11 cut_comp_lower_sap cut_comp_saprock cut_comp_fresh
12 cut_comp_upper_sap cut_comp_lower_sap cut_comp_saprock
13 Entire Object (cut_comp)
14 Entire Object (cut_comp)
15 Entire Object (cut_comp)
Table 10-3 Informing Composite Files for all Domains in the Transvaal Estimate

Runge Limited St Barbara Limited Transvaal Resource Report
Page 21 August 2008
Parameter Wireframe Object Number
1 3 4 5 7 9 10 12
Number 82 46 27 216 9 30 5 78
Minimum 0.06 0.005 0.005 0.005 0.32 0.04 0.08 0.2
Maximum 14.20 16.00 3.74 23.00 40.50 9.40 3.62 60.00
Mean 2.20 2.47 0.90 2.24 6.60 2.40 2.02 3.72
Median 1.50 0.94 0.65 1.15 2.58 1.40 1.57 1.14
Std Dev 2.28 3.39 0.86 3.44 12.79 2.28 1.61 7.87
Variance 5.21 11.51 0.74 11.83 163.59 5.22 2.59 61.88
Coeff Var 1.04 1.37 0.95 1.54 1.94 0.95 0.80 2.11
Percentiles
10 0.54 0.11 0.03 0.33 0.32 0.52 0.08 0.40
20 0.72 0.34 0.14 0.50 0.74 0.80 0.08 0.52
30 0.89 0.66 0.35 0.68 1.35 0.90 0.31 0.67
40 1.18 0.76 0.51 0.87 2.03 1.18 0.54 0.92
50 1.50 0.94 0.65 1.15 2.58 1.40 1.57 1.14
60 1.84 1.43 0.86 1.54 2.82 1.96 2.60 1.74
70 2.28 2.04 1.16 2.10 2.88 2.86 2.93 2.37
80 2.84 3.29 1.40 2.66 3.46 3.60 3.25 4.22
90 5.17 7.51 1.89 4.79 8.73 4.94 3.44 8.86
95 6.24 9.40 2.28 8.26 24.62 7.16 3.53 13.20
97.5 7.29 10.19 2.78 13.40 32.56 8.77 3.57 19.71
99 10.15 13.38 3.36 19.89 37.32 9.15 3.60 33.09
Cut Statistics
Top Cut Grade 100 100 100 100 35 100 100 26
No. Samples Cut 0 0 0 0 1 0 0 1
Cut Mean 2.20 2.47 0.90 2.24 5.99 2.40 2.02 3.24
Table 10-4 Basic Statistics for all Upper Saprolite Composites in the Transvaal Estimate

Runge Limited St Barbara Limited Transvaal Resource Report
Page 22 August 2008
Parameter Wireframe Object Number
1 3 4 5 7 8 9 10 11 12
Number 98 195 98 1655 154 27 414 459 18 61
Minimum 0.005 0.05 0.005 0.005 0.005 0.48 0.04 0.01 0.12 0.02
Maximum 48.50 29.20 36.00 305.00 111.00 5.60 152.00 52.82 24.80 33.70
Mean 2.87 3.78 3.56 3.25 6.90 1.67 4.26 3.95 5.01 2.43
Median 1.17 1.36 1.24 1.46 2.48 1.31 1.62 1.37 0.78 0.79
Std Dev 5.88 5.20 6.56 9.14 13.04 1.25 10.23 7.69 8.33 5.45
Variance 34.54 27.03 43.02 83.51 170.08 1.55 104.59 59.05 69.31 29.70
Coeff Var 2.05 1.38 1.84 2.82 1.89 0.75 2.40 1.95 1.66 2.25
Percentiles
10 0.25 0.36 0.31 0.39 0.48 0.60 0.39 0.24 0.24 0.23
20 0.46 0.60 0.55 0.62 0.67 0.77 0.60 0.50 0.53 0.52
30 0.70 0.79 0.71 0.84 0.90 0.80 0.80 0.71 0.63 0.60
40 0.97 1.06 0.94 1.12 1.44 0.99 1.13 1.00 0.71 0.69
50 1.17 1.36 1.24 1.46 2.48 1.31 1.62 1.37 0.78 0.79
60 1.61 2.06 1.89 1.93 4.17 1.49 2.19 1.96 0.80 1.03
70 1.98 3.26 2.59 2.69 6.14 1.91 3.13 2.88 1.02 1.38
80 3.77 6.23 4.08 3.93 9.80 2.00 5.21 4.26 7.65 2.16
90 6.04 10.85 7.31 7.22 15.76 3.42 8.89 9.04 18.98 2.73
95 7.67 14.68 14.40 11.00 25.55 4.10 16.79 15.87 20.57 12.48
97.5 15.46 17.53 27.15 15.57 30.99 4.63 23.83 31.75 22.69 18.16
99 25.08 25.02 35.31 22.38 61.26 5.21 34.33 44.44 23.95 26.69
Cut Statistics
Top Cut Grade 25 100 25 35 35 100 35 40 100 15
No. Samples Cut 1 0 3 9 3 0 5 6 0 2
Cut Mean 2.73 3.78 3.36 3.03 6.20 1.67 3.88 3.84 5.01 2.08
Table 10-5 Basic Statistics for all Lower Saprolite Composites in the Transvaal Estimate

Runge Limited St Barbara Limited Transvaal Resource Report
Page 23 August 2008
Parameter Wireframe Object Number
1 3 4 5 7 8 9 10 11 12
Number 189 145 576 1538 120 58 339 371 89 36
Minimum 0.005 0.02 0.005 0.005 0.03 0.02 0.04 0.076 0.005 0.201
Maximum 22.07 60.30 62.00 155.00 39.30 10.30 46.84 56.06 65.00 25.50
Mean 2.13 5.67 4.45 3.09 7.54 1.81 2.30 4.48 4.19 2.04
Median 1.27 2.33 1.43 1.50 3.41 1.01 0.96 1.45 0.92 1.08
Std Dev 2.85 8.25 7.40 7.23 9.55 2.20 4.16 8.45 9.84 4.15
Variance 8.10 68.09 54.74 52.25 91.28 4.83 17.31 71.42 96.87 17.24
Coeff Var 1.34 1.46 1.70 2.34 1.27 1.22 1.81 1.89 2.35 2.04
Percentiles
10 0.01 0.40 0.44 0.40 0.55 0.16 0.32 0.35 0.15 0.46
20 0.38 0.70 0.60 0.61 0.78 0.55 0.48 0.58 0.45 0.56
30 0.67 1.13 0.80 0.84 1.21 0.71 0.59 0.73 0.61 0.64
40 0.90 1.50 1.01 1.12 1.80 0.86 0.74 1.02 0.70 0.91
50 1.27 2.33 1.43 1.50 3.41 1.01 0.96 1.45 0.92 1.08
60 1.65 3.91 2.07 1.90 4.68 1.18 1.22 2.02 1.44 1.20
70 2.10 5.81 3.08 2.55 7.89 1.59 1.80 2.76 1.93 1.56
80 3.32 9.35 5.79 3.74 13.40 2.66 2.63 4.27 3.08 2.23
90 4.81 15.40 11.54 6.10 22.10 3.98 4.94 11.77 10.61 2.97
95 7.27 21.28 20.12 9.81 28.90 6.11 8.99 23.57 18.93 3.80
97.5 8.82 26.69 27.84 15.85 31.60 8.63 13.11 30.81 27.05 7.05
99 11.90 33.73 36.94 25.43 38.44 10.08 17.05 44.47 52.72 18.12
Cut Statistics
Top Cut Grade 100 30 40 30 100 100 26 30 30 100
No. Samples Cut 0 2 4 10 0 0 1 11 2 0
Cut Mean 2.13 5.59 4.39 2.84 7.54 1.81 2.25 4.15 3.65 2.04
Table 10-6 Basic Statistics for all Saprock Composites in the Transvaal Estimate
Runge Limited St Barbara Limited Transvaal Resource Report
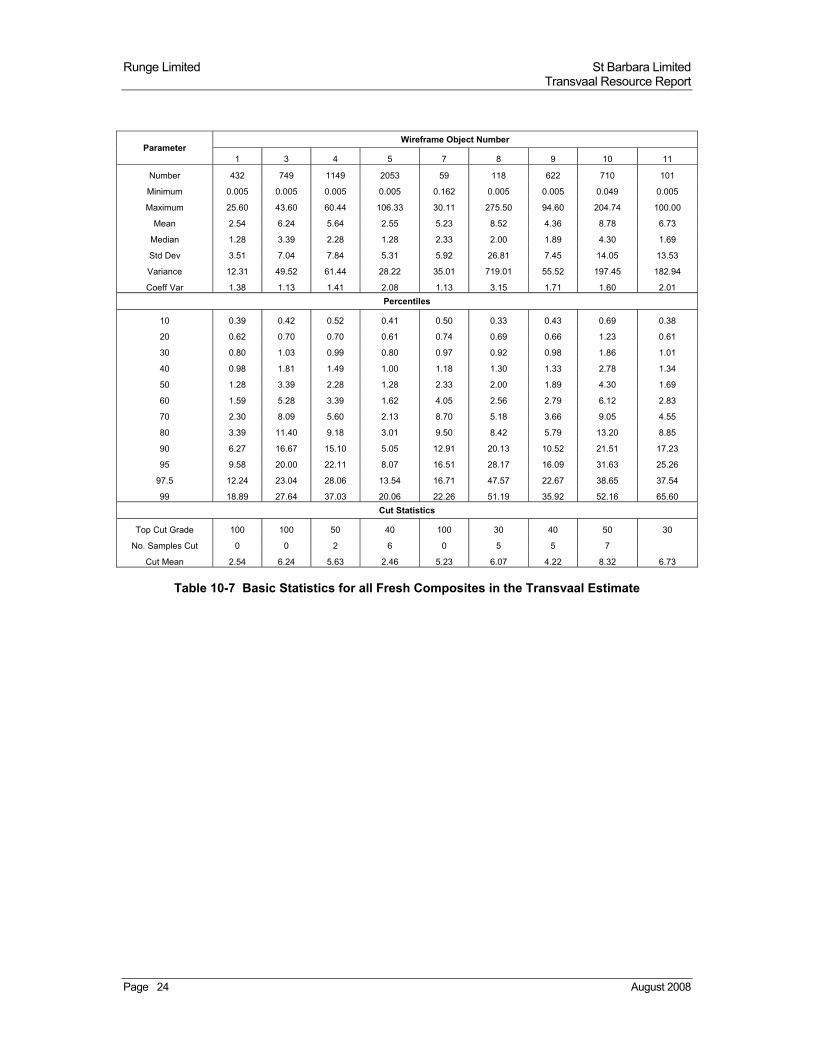
Page 24 August 2008
Parameter Wireframe Object Number
1 3 4 5 7 8 9 10 11
Number 432 749 1149 2053 59 118 622 710 101
Minimum 0.005 0.005 0.005 0.005 0.162 0.005 0.005 0.049 0.005
Maximum 25.60 43.60 60.44 106.33 30.11 275.50 94.60 204.74 100.00
Mean 2.54 6.24 5.64 2.55 5.23 8.52 4.36 8.78 6.73
Median 1.28 3.39 2.28 1.28 2.33 2.00 1.89 4.30 1.69
Std Dev 3.51 7.04 7.84 5.31 5.92 26.81 7.45 14.05 13.53
Variance 12.31 49.52 61.44 28.22 35.01 719.01 55.52 197.45 182.94
Coeff Var 1.38 1.13 1.41 2.08 1.13 3.15 1.71 1.60 2.01
Percentiles
10 0.39 0.42 0.52 0.41 0.50 0.33 0.43 0.69 0.38
20 0.62 0.70 0.70 0.61 0.74 0.69 0.66 1.23 0.61
30 0.80 1.03 0.99 0.80 0.97 0.92 0.98 1.86 1.01
40 0.98 1.81 1.49 1.00 1.18 1.30 1.33 2.78 1.34
50 1.28 3.39 2.28 1.28 2.33 2.00 1.89 4.30 1.69
60 1.59 5.28 3.39 1.62 4.05 2.56 2.79 6.12 2.83
70 2.30 8.09 5.60 2.13 8.70 5.18 3.66 9.05 4.55
80 3.39 11.40 9.18 3.01 9.50 8.42 5.79 13.20 8.85
90 6.27 16.67 15.10 5.05 12.91 20.13 10.52 21.51 17.23
95 9.58 20.00 22.11 8.07 16.51 28.17 16.09 31.63 25.26
97.5 12.24 23.04 28.06 13.54 16.71 47.57 22.67 38.65 37.54
99 18.89 27.64 37.03 20.06 22.26 51.19 35.92 52.16 65.60
Cut Statistics
Top Cut Grade 100 100 50 40 100 30 40 50 30
No. Samples Cut 0 0 2 6 0 5 5 7
Cut Mean 2.54 6.24 5.63 2.46 5.23 6.07 4.22 8.32 6.73
Table 10-7 Basic Statistics for all Fresh Composites in the Transvaal Estimate

Runge Limited St Barbara Limited Transvaal Resource Report
Page 25 August 2008
Parameter Wireframe Object Number
2 6 13 14 15
Number 30 135 96 32 178
Minimum 0.005 0.005 0.06 0.28 0.005
Maximum 10.30 35.50 81.00 30.80 20.90
Mean 2.43 3.14 4.33 5.64 1.59
Median 1.76 1.38 0.86 2.04 0.97
Std Dev 2.39 4.90 12.13 7.43 2.17
Variance 5.72 24.00 147.14 55.21 4.73
Coeff Var 0.99 1.56 2.80 1.32 1.37
Percentiles
10 0.34 0.38 0.22 0.45 0.29
20 0.50 0.60 0.48 0.68 0.49
30 0.74 0.83 0.62 1.28 0.60
40 1.40 1.10 0.70 1.80 0.76
50 1.76 1.38 0.86 2.04 0.97
60 2.30 1.90 1.05 2.39 1.19
70 2.59 2.66 1.88 4.94 1.55
80 3.46 4.22 2.76 8.38 2.04
90 5.01 6.96 6.50 16.02 3.04
95 7.11 11.80 20.82 19.48 5.24
97.5 8.88 17.68 47.48 23.76 7.26
99 9.73 22.51 57.00 27.98 9.71
Cut Statistics
Top Cut Grade 100 25 20 20 100
No. Samples Cut 0 1 5 2 0
Cut Mean 2.43 3.06 2.68 5.24 1.59
Table 10-8 Basic Statistics for Entire Object Composites in the Transvaal Estimate

Runge Limited St Barbara Limited Transvaal Resource Report
Page 26 August 2008
10.4.2 High Grade Cuts
To assist in the selection of an appropriate high grade cut, the composite data was imported into GeoAccess software and log-probability plots were generated.
Top cuts used, and the associated uncut and cut means for the estimate are displayed in Table 10-4 to Table 10-8, while all log probability plots are located in Appendix 4.
10.5 Geostatistical Analysis
10.5.1 Variography
Assessment of the basic statistics in Table 10-4 to Table 10-8 highlighted the need to treat regolith boundaries as hard boundaries. Objects 1, 3 and 10 were selected to study the spatial continuity of grade in the Fresh and combined upper/lower Saprolite domains, as the increased number of records supplied more robust variograms.
Due to a subtle change in strike of the Transvaal lodes, it was decided to split the records for object 5 into a southern domain and northern domain that were separated at 9,100N.
Variogram parameters for object 1(Jupiter) was applied to objects 4, 5sth (8500N-9100N) and 7, while object 3 (Mercury) parameters were applied to objects 5nth (9100N-10700N), 9 and 11. Parameters for object 10 (Transvaal) were also used for the nearby object 8 (Table 10-9).
Object Comment
1 Parameters obtained from combined saprolite domain and from fresh domain
2 Parameters derived from object 1 combined saprolite domain.
3 Parameters obtained from combined saprolite domain and from fresh domain
4 Upper and lower saprolite domains from obj1 combined sap; saprock and fresh domain from object 1 fresh
5sth Upper and lower saprolite domains from obj1 combined sap; saprock and fresh domain from object 1 fresh
5nth Upper and lower saprolite domains from obj3 combined sap; saprock and fresh domain from object 3 fresh
6 Parameters derived from object 1 combined saprolite domain.
7 Upper and lower saprolite domains from obj1 combined sap; saprock and fresh domain from object 1 fresh
8 Upper and lower saprolite domains from obj10 combined sap; saprock and fresh domain from object 10 fresh
9 Upper and lower saprolite domains from obj3 combined sap; saprock and fresh domain from object 3 fresh
10 Parameters obtained from combined saprolite domain and from fresh domain
11 Upper and lower saprolite domains from obj3 combined sap; saprock and fresh domain from object 3 fresh
12 Upper and lower saprolite domains from obj3 combined sap; saprock and fresh domain from object 3 fresh
13 Parameters derived from object 3 combined saprolite domain.
14 Saprolite parameters derived form object 10 combined sap; fresh parameters from object 10 fresh.
15 Parameters derived from object 3 combined saprolite domain.
Table 10-9 Transvaal Variogram Parameter Domain and Object Relationship
All variography was completed using Surpac software (Version 6.0.2). Variogram analysis was completed for the element Gold (Au) using the uncut composites.
To determine the nugget variance of the data, an omnidirectional variogram with a 1m lag was used, reflecting the down hole composite spacing. This resulted in a relatively well-structured variograms, with maximum ranges up to 9m for the second structure.
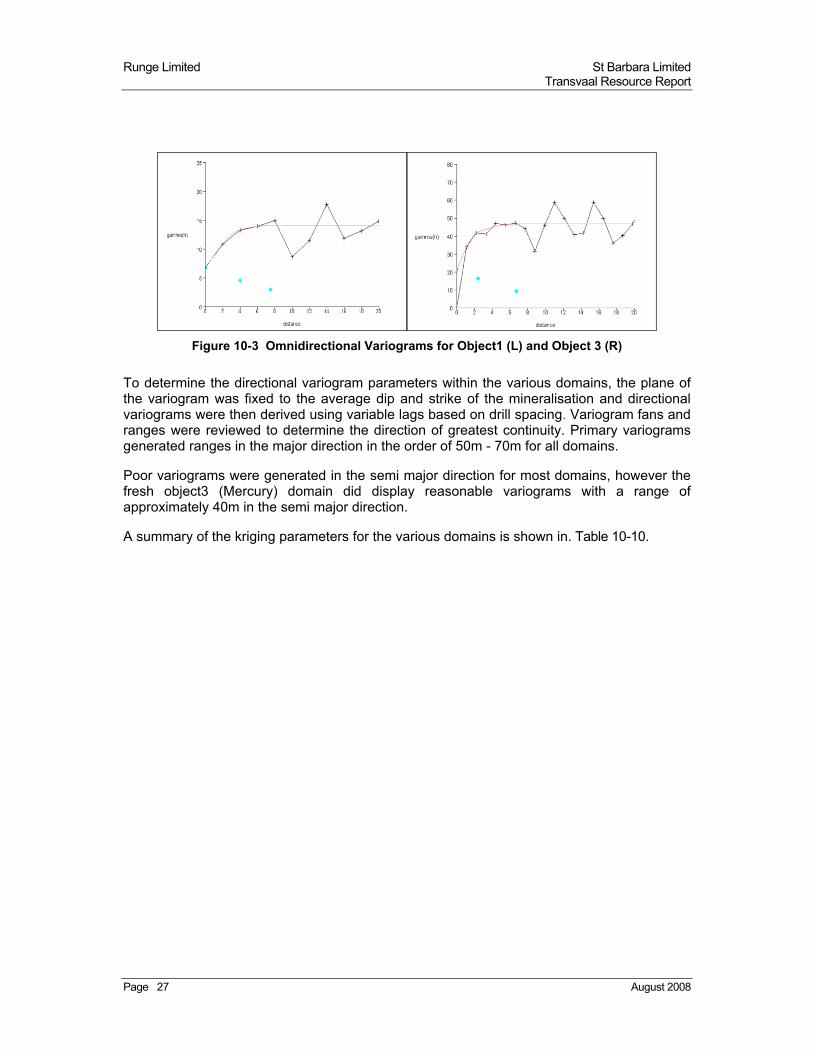
Figure 10-3 displays omnidirectional variograms for the fresh domains of objects 1 and 3.
Runge Limited St Barbara Limited Transvaal Resource Report
Page 27 August 2008
Figure 10-3 Omnidirectional Variograms for Object1 (L) and Object 3 (R)
To determine the directional variogram parameters within the various domains, the plane of the variogram was fixed to the average dip and strike of the mineralisation and directional variograms were then derived using variable lags based on drill spacing. Variogram fans and ranges were reviewed to determine the direction of greatest continuity. Primary variograms generated ranges in the major direction in the order of 50m - 70m for all domains.
Poor variograms were generated in the semi major direction for most domains, however the fresh object3 (Mercury) domain did display reasonable variograms with a range of approximately 40m in the semi major direction.
A summary of the kriging parameters for the various domains is shown in. Table 10-10.

Runge Limited St Barbara Limited Transvaal Resource Report
Page 28 August 2008
Transvaal Kriging Parameters - Combined Upper and Lower Saprolite Domains
Object Major Major Direction Variable Lag Semi-Major Minor
Direction C0 C1 A1 C2 A2 A1 A2 A1 A2
1 0 -> 20 23% 59% 24.9 18% 68.1 20 35 2.1 3.3
2 0 -> 20 23% 59% 24.9 18% 68.1 20 35 2.1 3.3
3 20 -> 184 38% 35% 27.7 28% 74.3 15 35 1.3 2.2
4 0 -> 20 23% 59% 24.9 18% 68.1 20 35 2.1 3.3
5 (8500N-9100N) 0 -> 20 23% 59% 24.9 18% 68.1 20 35 2.1 3.3
5 (9100N-10700N) 20 -> 184 38% 35% 27.7 28% 74.3 15 35 1.3 2.2
6 0 -> 20 23% 59% 24.9 18% 68.1 20 35 2.1 3.3
7 0 -> 20 23% 59% 24.9 18% 68.1 20 35 2.1 3.3
8 0 -> 180 25% 31% 39.1 44% 64.1 16 50 2.6 9.1
9 20 -> 184 38% 35% 27.7 28% 74.3 15 35 1.3 2.2
10 0 -> 180 25% 31% 39.1 44% 64.1 16 50 2.6 9.1
11 20 -> 184 38% 35% 27.7 28% 74.3 15 35 1.3 2.2
12 20 -> 184 38% 35% 27.7 28% 74.3 15 35 1.3 2.2
13 20 -> 184 38% 35% 27.7 28% 74.3 15 35 1.3 2.2
14 0 -> 180 25% 31% 39.1 44% 64.1 16 50 2.6 9.1
15 20 -> 184 38% 35% 27.7 28% 74.3 15 35 1.3 2.2
Transvaal Kriging Parameters - Combined Saprock and Fresh Domains
Object Major Major Direction Variable Lag Semi-Major Minor
Direction C0 C1 A1 C2 A2 A1 A2 A1 A2
1 -67 -> 158 44% 38% 25 18% 50.4 21 36 4 7.5
2 0 -> 20 23% 59% 24.9 18% 68.1 20 35 2.1 3.3
3 20 -> 184 38% 35% 27.7 28% 74.3 15 35 1.3 2.2
4 -67 -> 158 44% 38% 25 18% 50.4 21 36 4 7.5
5 (8500N-9100N) -67 -> 158 44% 38% 25 18% 50.4 21 36 4 7.5
5 (9100N-10700N) 20 -> 184 38% 35% 27.7 28% 74.3 15 35 1.3 2.2
6 0 -> 20 23% 59% 24.9 18% 68.1 20 35 2.1 3.3
7 -67 -> 158 44% 38% 25 18% 50.4 21 36 4 7.5
8 39 -> 187 23% 42% 41.7 35% 77.7 19 37 3.3 6.1
9 20 -> 184 38% 35% 27.7 28% 74.3 15 35 1.3 2.2
10 39 -> 187 23% 42% 41.7 35% 77.7 19 37 3.3 6.1
11 20 -> 184 38% 35% 27.7 28% 74.3 15 35 1.3 2.2
12 20 -> 184 38% 35% 27.7 28% 74.3 15 35 1.3 2.2
13 20 -> 184 38% 35% 27.7 28% 74.3 15 35 1.3 2.2
14 0 -> 180 23% 42% 41.7 35% 77.7 19 37 3.3 6.1
15 20 -> 184 38% 35% 27.7 28% 74.3 15 35 1.3 2.2
Table 10-10 Kriging Parameters for Various Domains

Runge Limited St Barbara Limited Transvaal Resource Report
Page 29 August 2008
11 Resource Estimate 11.1 Block Model
A block model was created using Surpac software to encompass the full extent of the deposit.
The block model used a primary block size of 5m EW by 20m NS by 10m vertical with sub-blocking to 1.25m by 5m by 2.5m.
The parent block size was selected on the basis of approximately 50% of the average drill hole spacing. The small sub-block size was necessary to provide sufficient resolution to the block model within the resource wireframes considering the narrow nature of the wireframes.
A block model summary of dimensions and attributes is displayed in Table 11-1.
Model Name transvaal_20080611.mdl
Y X Z
Origin (minimum y,x,z) 8400 9600 -300
Extent 10600 10200 400
Block Size (Sub-blocks) 20 (5) 5 (1.25) 10 (2.5)
Rotation none
Attributes:
au_cut cut gold value
au_uncut uncut gold value
ave_dis Average distance
class Resource classification - measured, indicated, inferred
class_code 1=Measured, 2=Indicated, 3=Inferred, 4=Unclassified
domain Can be oxide, trans or fresh. Reporting attribute.
kvar Kriging variance
lith_code 1=ultramafic, 2=sediment
lithology Lithology can be ultramafic or sediment
min_dis Minimum distance
mined Mined can be yes or no
num_sam Number of samples
pass_ok Pass number
pod Wireframe object number
service service_attribute used to define where not to reset void_sg.
sg Density
type air, colluvium, upper sap, lower sap, saprock, fresh, void, waste_dump, backfill
type_code 0=air, 1=colluvium, 2=upper sap, 3=lower sap, 4=saprock, 5=fresh, 6=void, 7=waste_dump, 8=backfill
void_sg Density to be used in void areas. Identical values as used in sg.
Table 11-1 Block Model Parameters

Runge Limited St Barbara Limited Transvaal Resource Report
Page 30 August 2008
11.2 Grade Interpolation
The >0.5g/t Au wireframe and the weathering wireframes were used as a hard boundaries for the Ordinary Kriging (OK) interpolation which was used to estimate grade values for the deposit. Objects 2, 6, 13, 14 and 15 were interpolated regardless of weathering wireframe due to the restricted number of records in these objects. OK was selected as it allowed the measured spatial continuity to be incorporated into the estimate. It will have resulted in a degree of smoothing which is appropriate for the nature of the mineralisation.
The kriging parameters for the object were used to define the oriented search ellipses for these objects as they are consistent with the interpreted geology of the deposit.
Three interpolation passes were used for the interpolation of the deposit with parameters as shown in Table 11-2. The majority of the model was estimated in the first pass.
Parameter Pass1 Pass2 Pass3
Search Type Ellipsoid Ellipsoid Ellipsoid
Bearing Variable - adjusted to match the wireframe geometry
Dip Variable - adjusted to match the wireframe geometry
Plunge Variable - adjusted to match the wireframe geometry
Major-Semi Major Ratio 1.5 1.5 1.5
Major-Minor Ratio 5 5 5
Search Radius 75m (55 for some) 150m (110 for some) 150m (110 for some)
Max Vertical Search 999 999 999
Minimum Samples 10 10 4
Maximum Samples 40 40 40
Block Discretisation 4Y by 2X by 4Z 4Y by 2X by 4Z 4Y by 2X by 4Z
Table 11-2 Interpolation parameters
11.3 Density and Material Type
Coding for the “sg” attribute within the Transvaal block model is a function of “type”, “lithology” and “pod”, as per Table 7-1.
A second sg attribute called “void_sg” has been used in the model. Prior to depletion due to mining, the “sg” and “void_sg” attribute is identical for all blocks within the model. All blocks inside the underground working wireframes, or above the topo wireframe were given a “mined” code of yes and their “sg” attribute reset to 0t/m3, while the “void_sg” attribute remained populated.
11.4 Resource Classification
The resource was classified as Indicated and Inferred Mineral Resource based on adequate drilling density to support the proposed geological model and define the grade and volume of mineralisation with sufficient confidence. Preliminary economic analysis has been carried out by SBM and suggests the project has reasonable prospects for eventual economic extraction.
The Indicated portion of the resource was defined where the drill spacing was generally less than 30m by 30m, and lode continuity was good. The Inferred Resource included areas of the resource where drill spacing was greater than 30m by 30m.
The resource block model has attributes “class” and “class_code” for all blocks within the resource wireframes. The “class” attribute is coded as either “indicated” for Indicated or
Runge Limited St Barbara Limited Transvaal Resource Report
Page 31 August 2008
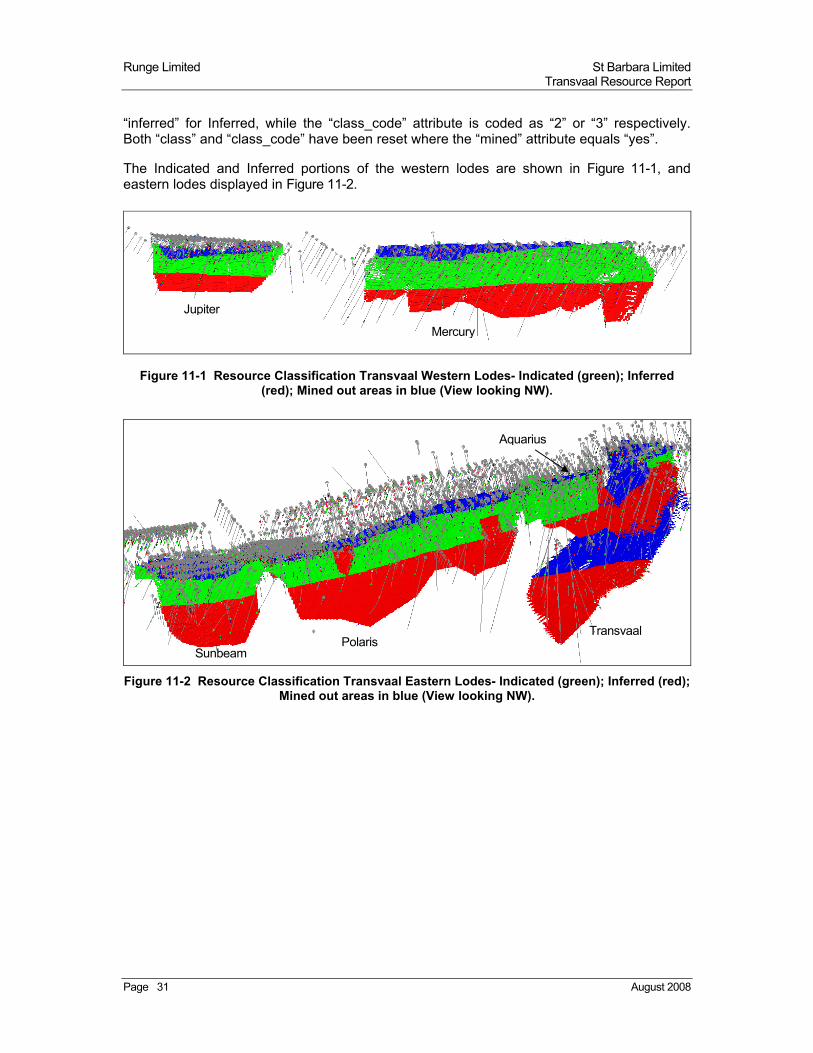
“inferred” for Inferred, while the “class_code” attribute is coded as “2” or “3” respectively. Both “class” and “class_code” have been reset where the “mined” attribute equals “yes”.
The Indicated and Inferred portions of the western lodes are shown in Figure 11-1, and eastern lodes displayed in Figure 11-2.
Figure 11-1 Resource Classification Transvaal Western Lodes- Indicated (green); Inferred (red); Mined out areas in blue (View looking NW).
Figure 11-2 Resource Classification Transvaal Eastern Lodes- Indicated (green); Inferred (red); Mined out areas in blue (View looking NW).
Jupiter
Mercury
Aquarius
Sunbeam Polaris
Transvaal

Runge Limited St Barbara Limited Transvaal Resource Report
Page 32 August 2008
11.5 Results
The detailed results for the Mineral Resource estimates are tabulated in Appendix 1 of this report. A summary of the estimate is shown in Table 11-3 at a 1g/t Au cut off.
Transvaal June 2008 Mineral Resource 1g/t Au Cutoff
Indicated Inferred Total
Type Tonnes Au Tonnes Au Tonnes Au Au
T g/t T g/t T g/t Ounces
Oxide 52,000 2.5 8,000 3.1 60,000 2.6 5,000
Transitional 184,000 2.5 14,000 3.1 198,000 2.6 16,000
Fresh 2,834,000 3.7 3,420,000 3.4 6,254,000 3.5 703,000
Total 3,069,000 3.6 3,442,000 3.4 6,511,000 3.5 725,000
Table 11-3 Transvaal Resource Estimate June 2008 (1g/t Au Cut Off)
To show the tonnage and grade distribution throughout the deposit a bench breakdown plot has been prepared and is shown graphically in Figure 11-3 for the total resource at 1g/t Au cut off. The grade-tonnage curve for the resource is shown in Figure 11-4.
Transvaal Resource: Tonnes and Grade Per 10m Bench
0
100,000
200,000
300,000
400,000
370
350
330
310
290
270
250
230
210
190
170
150
130
110 90 70 50 30 10 -10
-30
-50
-70
-90
-110
-130
-150
-170
-190
-210
-230
Bench Top RL
To
nn
es
0.00
3.00
6.00
9.00
12.00
g/t
Au
Tonnes Per 10m Bench Cut Uncut g/t
Figure 11-3 Transvaal Mineral Resource (10m Bench Breakdown)
Transvaal Resource Grade-Tonnage Curve
0
1,000,000
2,000,000
3,000,000
4,000,000
5,000,000
6,000,000
7,000,000
8,000,000
0.00
0.70
1.00
1.20
1.50
2.00
3.00
4.00
5.00
6.00
7.00
8.00
9.00
10.0
0
11.0
0
12.0
0
13.0
0
14.0
0
15.0
0
16.0
0
17.0
0
Cutoff Grade g/t
To
nn
es
0.00
2.50
5.00
7.50
10.00
12.50
15.00
17.50
20.00
Gra
de
g/t
Tonnes Cut g/t
Figure 11-4 Transvaal Mineral Resource Grade-Tonnage Curve

Runge Limited St Barbara Limited Transvaal Resource Report
Page 33 August 2008
11.6 Model Validation
To check that the interpolation of the block model correctly honoured the drilling data, validation was carried out by comparing the interpolated block grades to the composited sample grades. Validation results for the deposits by northing and by elevation are shown in Figure 11-5 to Figure 11-8 respectively for the Sunbeam/Polaris and Mercury lodes. Full details of the validation are included in Appendix 2.
The validation plots show reasonable correlation between the composite grades and the block model grades for the comparison by easting and elevation. The validation plots highlight the smoothing effect of the OK interpolations especially in areas with low data density. In general, the trends shown by the composited data are honoured by the block model.
Comparison of OK and Composite Grades by Northing
0
15,000
30,000
45,000
60,000
8780
8820
8860
8900
8940
8980
9020
9060
9100
9140
9180
9220
9260
9300
9340
9380
9420
9460
9500
9540
9580
9620
9660
9700
9740
9780
9820
9860
9900
Northing (Y)
Vo
lum
e &
Co
mp
s (*
500)
0.0
2.5
5.0
7.5
10.0
Gra
de
(g/t
)
OK Volume Comps*500 OK Uncut OK Cut Uncut g/t Cut g/t
Figure 11-5 Sunbeam/Polaris (Fresh) Mineral Resource Validation Plot by Northing
Comparison of OK and Composite Grades by RL
-
30,000
60,000
90,000
120,000
150,000
180,000
340
330
320
310
300
290
280
270
260
250
240
230
220
210
200
190
180
170
160
150
140
130
120
110
100 90 80 70 60 50 40 30 20
Bench Top (RL)
Vo
lum
e &
Co
mp
s (*
510)
0.0
1.0
2.0
3.0
4.0
5.0
6.0
Gra
de
(g/t
)
OK Volume Comps*510 OK Uncut OK Cut Uncut g/t Cut g/t
Figure 11-6 Sunbeam/Polaris (Fresh) Mineral Resource Validation Plot by Elevation

Runge Limited St Barbara Limited Transvaal Resource Report
Page 34 August 2008
Comparison of OK and Composite Grades by Northing
0
5,000
10,000
15,000
20,000
9120
9160
9200
9240
9280
9320
9360
9400
9440
9480
9520
9560
9600
9640
9680
9720
9760
9800
9840
9880
9920
Northing (Y)
Vo
lum
e &
Co
mp
s (*
380)
0.0
4.0
8.0
12.0
16.0
Gra
de
(g/t
)
OK Volume Comps*380 OK Uncut OK Cut Uncut g/t Cut g/t
Figure 11-7 Mercury (Fresh) Mineral Resource Validation Plot by Northing
Comparison of OK and Composite Grades by RL
-
10,000
20,000
30,000
40,000
50,000
60,000
350
340
330
320
310
300
290
280
270
260
250
240
230
220
210
200
190
180
170
Bench Top (RL)
Vo
lum
e &
Co
mp
s (*
390)
0.0
2.0
4.0
6.0
8.0
10.0
12.0
Gra
de
(g/t
)
OK Volume Comps*390 OK Uncut OK Cut Uncut g/t Cut g/t
Figure 11-8 Mercury (Fresh) Mineral Resource Validation Plot by Elevation

Runge Limited St Barbara Limited Transvaal Resource Report
Page 35 August 2008
Volume validation of the model was completed by comparing the volume of the wireframe against the volume of the model. Overall an excellent correlation was achieved with only a slight increase in model volume against the wireframe. Global averages for the composites and model by object are shown in Table 11-4 and shows that the model very slightly underestimates the cut composite grade.
Transvaal Resource Block Model Validation by Pod
Wireframe Block Model Composites
Object Lode Resource Ok Uncut Ok Cut Number of Uncut Cut
Number Volume Volume g/t g/t Comps g/t g/t
1 140,852 141,359 2.08 2.08 760 2.52 2.49
2 4,143 4,094 2.36 2.36 30 2.42 2.42
3 341,820 341,953 5.67 5.66 1,086 5.58 5.55
4 316,882 317,469 4.55 4.50 1,806 5.09 5.05
5 1,223,017 1,223,422 2.40 2.28 5,278 2.93 2.73
6 1,914 1,875 2.86 2.82 135 3.14 3.06
7 10,698 10,406 5.61 5.45 335 6.79 6.37
8 44,241 43,609 6.91 4.57 204 5.68 4.15
9 301,785 301,484 3.88 3.74 1,384 3.77 3.55
10 534,058 534,578 6.65 6.32 1,523 6.20 5.88
11 30,208 30,297 6.59 5.40 194 5.75 4.83
12 16,877 16,969 2.73 2.45 170 2.94 2.59
13 18,555 19,297 4.42 2.77 96 4.32 2.68
14 6,626 6,172 6.14 5.83 32 5.63 5.23
15 30,244 30,094 1.61 1.61 178 1.59 1.59
Total 3,021,920 3,023,078 4.01 3.82 13,211 4.07 3.85
Table 11-4 Transvaal Mineral Resource Composite and Global Resource Grade Comparison
12 Reconciliation 12.1 Mining
Detailed historical mining figures on a pit by pit basis were not supplied to Runge, therefore reconciliation of the model with historical mining has not been completed.
13 Risk and Opportunities Mining ceased at Transvaal in 1997, in part due to pit wall failures, but primarily due to
poor metallurgical recoveries realised from the ex-pit material. A thorough metallurgical evaluation should be part of any future investigation into recommencement of mining at Transvaal.
The natural surface wireframe supplied to Runge post-dated mining, and was noted to be incorrect, in that backfill was not accommodated in the surface pickup. Runge fixed the surface pick-up in the areas of Polaris North and Aquarius, but the eastern side of the Transvaal pit is yet to be fixed. The implications on depletion are not large but endeavours should be made to get an accurate surface.
While drilling appears to have closed off the western lodes of Transvaal, opportunities exist in area of the eastern lodes to expand the resource. Drilling underneath Sunbeam, South Polaris and down plunge of the Transvaal lode should realise increases to the Transvaal resource.

Runge Limited St Barbara Limited Transvaal Resource Report
Page 36 August 2008
14 Conclusion and Recommendations The modelled Transvaal deposit represents substantial remnant mineralisation around existing open pit and underground workings.
Resource definition drilling completed throughout 2007 and early 2008 has led to increased understanding and confidence of resource geometry’s and grades. The benefit of the increased drilling has also been to replace some historical drillholes where confidence was low.
Potential exists for the definition of down plunge extensions below the Transvaal, South Polaris and Sunbeam lodes.
Studies into future mining at Transvaal will need to address the complex metallurgy present in the ore system.
The resource model is undiluted, so appropriate dilution needs to be incorporated in any evaluation of the deposit.
Robert Williams
Consultant Geologist
Runge Limited St Barbara Limited Transvaal Resource Report
Page 37 August 2008
15 References James, R. D., 1995. Transvaal 10300 Gold Mine. Southern Cross Greenstone Belt Geology and Gold mines Extended Abstracts, Geoconferences (WA) Inc. Compiled by Schwebel, P.J. Smith, M., 2003. Sons of Gwalia Reource Report – Transvaal. Report No. 03382003-03 Wilde, S.A., 1989. A Petrographic Study of the Relationship Between Lithology, Metamorphism and Mineralisation at Transvaal Open Pit. Internal report for Mawson Pacific Ltd, now Reynlds Yilgar Gold Operations. Scantlebury, G., 2008. Specific Gravity Determinations – Transvaal Deposit. Internal St Barbara Limited Memo. Gee, R. D., 1982. Explanatory notes on the Southern Cross 1:250,000 geological sheet Western Australia. Geological Survey of Western Australia. Internal St Barbara Limited Powerpoint presentations as supplied to Runge.

Runge Limited St Barbara Limited Transvaal Resource Report
Page 38 August 2008
Appendix 1
Transvaal Gold Project
June 2008 Resource Tables

Runge Limited St Barbara Limited Transvaal Resource Report
Page i March 2008
Type Tonnes Uncut Au Cut Tonnes Uncut Au Cut Tonnes Au Uncut Au Cut AuT g/t g/t T g/t g/t T g/t g/t Ounces
Oxide 52,000 2.6 2.5 8,000 5.6 3.1 60,000 3.0 2.6 5,000Transitional 184,000 2.7 2.5 14,000 4.5 3.1 198,000 2.8 2.6 16,000
Fresh 2,834,000 3.8 3.7 3,420,000 3.5 3.4 6,254,000 3.6 3.5 703,000Total 3,069,000 3.8 3.6 3,442,000 3.5 3.4 6,511,000 3.6 3.5 725,000
Transvaal June 2008 Mineral Resource 1g/t Au Cutoff TotalIndicated Inferred

Page ii August 2008
IndicatedBench
Top Tonnes Au Uncut Au Cut Tonnes Au Uncut Au Cut Tonnes Au Uncut Au Cut Tonnes Au Uncut Au Cut Au CutRL T g/t g/t T g/t g/t T g/t g/t T g/t g/t Ounces370 516 1.96 1.96 516 1.96 1.96 33360 2,853 2.13 2.13 145 5.25 5.25 2,998 2.28 2.28 220350 12,238 2.19 2.19 11,897 2.22 2.22 2,228 4.00 4.00 26,363 2.35 2.35 1,995340 21,038 2.71 2.51 31,598 3.02 3.01 38,605 4.25 4.25 91,241 3.47 3.42 10,032330 11,000 2.77 2.62 55,730 2.13 2.11 115,959 4.57 4.57 182,689 3.72 3.70 21,745320 3,575 3.34 3.34 61,088 2.77 2.53 218,163 4.37 4.25 282,826 4.01 3.87 35,196310 413 2.87 2.87 20,672 3.75 3.10 295,081 4.00 3.74 316,166 3.98 3.69 37,539300 2,827 3.29 2.93 334,025 3.95 3.67 336,852 3.95 3.67 39,704290 307,820 4.25 3.87 307,820 4.25 3.87 38,268280 297,455 4.00 3.85 297,455 4.00 3.85 36,787270 283,117 4.00 3.86 283,117 4.00 3.86 35,114260 206,973 3.42 3.29 206,973 3.42 3.29 21,900250 190,941 3.42 3.25 190,941 3.42 3.25 19,978240 176,167 3.27 3.15 176,167 3.27 3.15 17,864230 161,394 3.09 2.97 161,394 3.09 2.97 15,427220 162,944 3.00 2.86 162,944 3.00 2.86 14,970210 42,819 4.44 4.35 42,819 4.44 4.35 5,991
Total 51,633 2.61 2.49 183,812 2.70 2.54 2,833,836 3.85 3.66 3,069,281 3.76 3.57 352,765
InferredBench
Top Tonnes Au Uncut Au Cut Tonnes Au Uncut Au Cut Tonnes Au Uncut Au Cut Tonnes Au Uncut Au Cut Au CutRL T g/t g/t T g/t g/t T g/t g/t T g/t g/t Ounces370 447 2.25 2.25 447 2.25 2.25 32360 688 2.45 2.45 1,392 2.39 2.39 2,080 2.41 2.41 161350 4,503 6.35 3.22 1,856 2.37 2.37 872 2.31 2.31 7,231 4.84 2.89 672340 2,544 5.84 3.32 127 3.75 2.34 1,986 2.32 2.32 4,657 4.28 2.87 429330 5,738 5.59 3.36 1,066 2.82 2.67 6,804 5.15 3.25 711320 3,966 4.50 3.12 3,439 4.30 3.50 7,405 4.41 3.30 785310 675 5.40 4.18 8,380 5.15 4.29 9,055 5.17 4.28 1,247300 10,027 6.10 5.36 10,027 6.10 5.36 1,729290 47,566 2.44 2.33 47,566 2.44 2.33 3,563280 54,880 2.63 2.45 54,880 2.63 2.45 4,329270 44,611 2.87 2.61 44,611 2.87 2.61 3,748260 101,234 4.91 4.86 101,234 4.91 4.86 15,815250 90,433 5.82 5.78 90,433 5.82 5.78 16,816240 90,917 5.91 5.88 90,917 5.91 5.88 17,197230 84,184 6.12 6.07 84,184 6.12 6.07 16,418220 68,103 6.70 6.59 68,103 6.70 6.59 14,426210 180,381 3.78 3.62 180,381 3.78 3.62 20,990200 220,778 3.78 3.62 220,778 3.78 3.62 25,717190 216,370 3.49 3.36 216,370 3.49 3.36 23,359180 202,663 3.28 3.14 202,663 3.28 3.14 20,446170 202,081 3.24 3.10 202,081 3.24 3.10 20,116160 199,514 3.00 2.92 199,514 3.00 2.92 18,747150 186,097 2.97 2.93 186,097 2.97 2.93 17,559140 177,088 3.08 3.03 177,088 3.08 3.03 17,245130 164,784 2.76 2.69 164,784 2.76 2.69 14,232120 144,973 2.43 2.35 144,973 2.43 2.35 10,948110 126,809 2.22 2.11 126,809 2.22 2.11 8,605100 107,047 2.14 2.00 107,047 2.14 2.00 6,88190 89,270 1.94 1.86 89,270 1.94 1.86 5,34780 58,900 1.84 1.84 58,900 1.84 1.84 3,47770 35,553 1.80 1.80 35,553 1.80 1.80 2,05760 29,692 1.66 1.66 29,692 1.66 1.66 1,58350 21,748 1.56 1.56 21,748 1.56 1.56 1,09440 13,563 1.34 1.34 13,563 1.34 1.34 58430 6,539 1.16 1.16 6,539 1.16 1.16 24420 727 1.16 1.16 727 1.16 1.16 2710 10,898 3.51 3.51 10,898 3.51 3.51 1,2290 29,983 3.43 3.43 29,983 3.43 3.43 3,305
-10 32,308 3.13 3.13 32,308 3.13 3.13 3,253-20 32,550 3.07 3.07 32,550 3.07 3.07 3,211-30 31,291 2.98 2.98 31,291 2.98 2.98 2,998-40 29,305 3.00 3.00 29,305 3.00 3.00 2,823-50 30,855 3.17 3.17 30,855 3.17 3.17 3,142-60 28,627 3.58 3.58 28,627 3.58 3.58 3,295-70 24,073 3.58 3.58 24,073 3.58 3.58 2,769-80 20,925 3.44 3.44 20,925 3.44 3.44 2,317-90 17,777 3.21 3.21 17,777 3.21 3.21 1,833-100 13,175 2.85 2.85 13,175 2.85 2.85 1,206-110 9,833 2.28 2.28 9,833 2.28 2.28 720-120 9,397 2.53 2.53 9,397 2.53 2.53 763-130 8,573 2.97 2.97 8,573 2.97 2.97 819-140 9,494 3.07 3.07 9,494 3.07 3.07 937-150 12,642 4.31 4.31 12,642 4.31 4.31 1,751-160 16,081 5.42 5.42 16,081 5.42 5.42 2,802-170 17,002 5.39 5.39 17,002 5.39 5.39 2,947-180 15,936 7.21 7.21 15,936 7.21 7.21 3,693-190 12,981 9.84 9.84 12,981 9.84 9.84 4,106-200 8,331 10.04 10.04 8,331 10.04 10.04 2,690-210 4,214 10.31 10.31 4,214 10.31 10.31 1,397-220 1,211 10.08 10.08 1,211 10.08 10.08 392-230 48 11.25 11.25 48 11.25 11.25 17Total 8,182 5.64 3.13 13,754 4.49 3.09 3,419,785 3.45 3.36 3,441,721 3.46 3.36 371,753
TransitionalOxide
Oxide Fresh
TotalFresh
TotalTransitional
Transvaal June 2008 Mineral Resource 1g/t Au Cutoff

Page iii August 2008
BenchTop Tonnes Au Uncut Au Cut Tonnes Au Uncut Au Cut Tonnes Au Uncut Au Cut Tonnes Au Uncut Au Cut Au CutRL T g/t g/t T g/t g/t T g/t g/t T g/t g/t Ounces370 963 2.09 2.09 0 0.00 0.00 0 0.00 0.00 963 2.09 2.09 65360 3,541 2.19 2.19 1,392 2.39 2.39 145 5.25 5.25 5,078 2.33 2.33 381350 16,741 3.31 2.46 13,753 2.24 2.24 3,100 3.53 3.53 33,594 2.89 2.47 2,667340 23,582 3.05 2.60 31,725 3.02 3.01 40,591 4.15 4.15 95,898 3.51 3.39 10,462330 11,000 2.77 2.62 61,468 2.45 2.23 117,025 4.55 4.55 189,493 3.77 3.69 22,457320 3,575 3.34 3.34 65,054 2.88 2.57 221,602 4.37 4.24 290,231 4.02 3.86 35,981310 413 2.87 2.87 21,347 3.81 3.14 303,461 4.03 3.75 325,221 4.01 3.71 38,786300 0 0.00 0.00 2,827 3.29 2.93 344,052 4.02 3.72 346,879 4.01 3.72 41,433290 0 0.00 0.00 0 0.00 0.00 355,386 4.01 3.66 355,386 4.01 3.66 41,831280 0 0.00 0.00 0 0.00 0.00 352,335 3.79 3.63 352,335 3.79 3.63 41,116270 0 0.00 0.00 0 0.00 0.00 327,728 3.84 3.69 327,728 3.84 3.69 38,862260 0 0.00 0.00 0 0.00 0.00 308,207 3.91 3.81 308,207 3.91 3.81 37,715250 0 0.00 0.00 0 0.00 0.00 281,374 4.19 4.07 281,374 4.19 4.07 36,795240 0 0.00 0.00 0 0.00 0.00 267,084 4.17 4.08 267,084 4.17 4.08 35,062230 0 0.00 0.00 0 0.00 0.00 245,578 4.13 4.03 245,578 4.13 4.03 31,845220 0 0.00 0.00 0 0.00 0.00 231,047 4.09 3.96 231,047 4.09 3.96 29,396210 0 0.00 0.00 0 0.00 0.00 223,200 3.91 3.76 223,200 3.91 3.76 26,981200 0 0.00 0.00 0 0.00 0.00 220,778 3.78 3.62 220,778 3.78 3.62 25,717190 0 0.00 0.00 0 0.00 0.00 216,370 3.49 3.36 216,370 3.49 3.36 23,359180 0 0.00 0.00 0 0.00 0.00 202,663 3.28 3.14 202,663 3.28 3.14 20,446170 0 0.00 0.00 0 0.00 0.00 202,081 3.24 3.10 202,081 3.24 3.10 20,116160 0 0.00 0.00 0 0.00 0.00 199,514 3.00 2.92 199,514 3.00 2.92 18,747150 0 0.00 0.00 0 0.00 0.00 186,097 2.97 2.93 186,097 2.97 2.93 17,559140 0 0.00 0.00 0 0.00 0.00 177,088 3.08 3.03 177,088 3.08 3.03 17,245130 0 0.00 0.00 0 0.00 0.00 164,784 2.76 2.69 164,784 2.76 2.69 14,232120 0 0.00 0.00 0 0.00 0.00 144,973 2.43 2.35 144,973 2.43 2.35 10,948110 0 0.00 0.00 0 0.00 0.00 126,809 2.22 2.11 126,809 2.22 2.11 8,605100 0 0.00 0.00 0 0.00 0.00 107,047 2.14 2.00 107,047 2.14 2.00 6,88190 0 0.00 0.00 0 0.00 0.00 89,270 1.94 1.86 89,270 1.94 1.86 5,34780 0 0.00 0.00 0 0.00 0.00 58,900 1.84 1.84 58,900 1.84 1.84 3,47770 0 0.00 0.00 0 0.00 0.00 35,553 1.80 1.80 35,553 1.80 1.80 2,05760 0 0.00 0.00 0 0.00 0.00 29,692 1.66 1.66 29,692 1.66 1.66 1,58350 0 0.00 0.00 0 0.00 0.00 21,748 1.56 1.56 21,748 1.56 1.56 1,09440 0 0.00 0.00 0 0.00 0.00 13,563 1.34 1.34 13,563 1.34 1.34 58430 0 0.00 0.00 0 0.00 0.00 6,539 1.16 1.16 6,539 1.16 1.16 24420 0 0.00 0.00 0 0.00 0.00 727 1.16 1.16 727 1.16 1.16 2710 0 0.00 0.00 0 0.00 0.00 10,898 3.51 3.51 10,898 3.51 3.51 1,2290 0 0.00 0.00 0 0.00 0.00 29,983 3.43 3.43 29,983 3.43 3.43 3,305
-10 0 0.00 0.00 0 0.00 0.00 32,308 3.13 3.13 32,308 3.13 3.13 3,253-20 0 0.00 0.00 0 0.00 0.00 32,550 3.07 3.07 32,550 3.07 3.07 3,211-30 0 0.00 0.00 0 0.00 0.00 31,291 2.98 2.98 31,291 2.98 2.98 2,998-40 0 0.00 0.00 0 0.00 0.00 29,305 3.00 3.00 29,305 3.00 3.00 2,823-50 0 0.00 0.00 0 0.00 0.00 30,855 3.17 3.17 30,855 3.17 3.17 3,142-60 0 0.00 0.00 0 0.00 0.00 28,627 3.58 3.58 28,627 3.58 3.58 3,295-70 0 0.00 0.00 0 0.00 0.00 24,073 3.58 3.58 24,073 3.58 3.58 2,769-80 0 0.00 0.00 0 0.00 0.00 20,925 3.44 3.44 20,925 3.44 3.44 2,317-90 0 0.00 0.00 0 0.00 0.00 17,777 3.21 3.21 17,777 3.21 3.21 1,833-100 0 0.00 0.00 0 0.00 0.00 13,175 2.85 2.85 13,175 2.85 2.85 1,206-110 0 0.00 0.00 0 0.00 0.00 9,833 2.28 2.28 9,833 2.28 2.28 720-120 0 0.00 0.00 0 0.00 0.00 9,397 2.53 2.53 9,397 2.53 2.53 763-130 0 0.00 0.00 0 0.00 0.00 8,573 2.97 2.97 8,573 2.97 2.97 819-140 0 0.00 0.00 0 0.00 0.00 9,494 3.07 3.07 9,494 3.07 3.07 937-150 0 0.00 0.00 0 0.00 0.00 12,642 4.31 4.31 12,642 4.31 4.31 1,751-160 0 0.00 0.00 0 0.00 0.00 16,081 5.42 5.42 16,081 5.42 5.42 2,802-170 0 0.00 0.00 0 0.00 0.00 17,002 5.39 5.39 17,002 5.39 5.39 2,947-180 0 0.00 0.00 0 0.00 0.00 15,936 7.21 7.21 15,936 7.21 7.21 3,693-190 0 0.00 0.00 0 0.00 0.00 12,981 9.84 9.84 12,981 9.84 9.84 4,106-200 0 0.00 0.00 0 0.00 0.00 8,331 10.04 10.04 8,331 10.04 10.04 2,690-210 0 0.00 0.00 0 0.00 0.00 4,214 10.31 10.31 4,214 10.31 10.31 1,397-220 0 0.00 0.00 0 0.00 0.00 1,211 10.08 10.08 1,211 10.08 10.08 392-230 0 0.00 0.00 0 0.00 0.00 48 11.25 11.25 48 11.25 11.25 17Total 59,815 3.02 2.58 197,566 2.83 2.58 6,253,621 3.63 3.50 6,511,002 3.60 3.46 724,518
FreshOxideTotal Transvaal Project - Inferred and Indicated >1g/t Au
TotalTransitional

Page iv August 2008
BenchTop Tonnes Uncut Cut Uncut CutRL T g/t g/t Ounces Ounces Tonnes Uncut Oz Cut Oz370 963 2.09 2.09 65 65 96 6 6360 5,078 2.33 2.33 381 381 508 38 38350 33,594 2.89 2.47 3,122 2,667 3,359 312 267340 95,898 3.51 3.39 10,814 10,462 9,590 1,081 1,046330 189,493 3.77 3.69 22,960 22,457 18,949 2,296 2,246320 290,231 4.02 3.86 37,521 35,981 29,023 3,752 3,598310 325,221 4.01 3.71 41,962 38,786 32,522 4,196 3,879300 346,879 4.01 3.72 44,721 41,433 34,688 4,472 4,143290 355,386 4.01 3.66 45,838 41,831 35,539 4,584 4,183280 352,335 3.79 3.63 42,902 41,116 35,234 4,290 4,112270 327,728 3.84 3.69 40,511 38,862 32,773 4,051 3,886260 308,207 3.91 3.81 38,707 37,715 30,821 3,871 3,772250 281,374 4.19 4.07 37,932 36,795 28,137 3,793 3,679240 267,084 4.17 4.08 35,805 35,062 26,708 3,581 3,506230 245,578 4.13 4.03 32,605 31,845 24,558 3,260 3,184220 231,047 4.09 3.96 30,362 29,396 23,105 3,036 2,940210 223,200 3.91 3.76 28,055 26,981 22,320 2,805 2,698200 220,778 3.78 3.62 26,831 25,717 22,078 2,683 2,572190 216,370 3.49 3.36 24,279 23,359 21,637 2,428 2,336180 202,663 3.28 3.14 21,389 20,446 20,266 2,139 2,045170 202,081 3.24 3.10 21,056 20,116 20,208 2,106 2,012160 199,514 3.00 2.92 19,257 18,747 19,951 1,926 1,875150 186,097 2.97 2.93 17,798 17,559 18,610 1,780 1,756140 177,088 3.08 3.03 17,517 17,245 17,709 1,752 1,724130 164,784 2.76 2.69 14,601 14,232 16,478 1,460 1,423120 144,973 2.43 2.35 11,342 10,948 14,497 1,134 1,095110 126,809 2.22 2.11 9,043 8,605 12,681 904 861100 107,047 2.14 2.00 7,370 6,881 10,705 737 68890 89,270 1.94 1.86 5,561 5,347 8,927 556 53580 58,900 1.84 1.84 3,477 3,477 5,890 348 34870 35,553 1.80 1.80 2,057 2,057 3,555 206 20660 29,692 1.66 1.66 1,583 1,583 2,969 158 15850 21,748 1.56 1.56 1,094 1,094 2,175 109 10940 13,563 1.34 1.34 584 584 1,356 58 5830 6,539 1.16 1.16 244 244 654 24 2420 727 1.16 1.16 27 27 73 3 310 10,898 3.51 3.51 1,229 1,229 1,090 123 1230 29,983 3.43 3.43 3,305 3,305 2,998 331 331
-10 32,308 3.13 3.13 3,253 3,253 3,231 325 325-20 32,550 3.07 3.07 3,211 3,211 3,255 321 321-30 31,291 2.98 2.98 2,998 2,998 3,129 300 300-40 29,305 3.00 3.00 2,823 2,823 2,931 282 282-50 30,855 3.17 3.17 3,142 3,142 3,086 314 314-60 28,627 3.58 3.58 3,295 3,295 2,863 329 329-70 24,073 3.58 3.58 2,769 2,769 2,407 277 277-80 20,925 3.44 3.44 2,317 2,317 2,093 232 232-90 17,777 3.21 3.21 1,833 1,833 1,778 183 183
-100 13,175 2.85 2.85 1,206 1,206 1,318 121 121-110 9,833 2.28 2.28 720 720 983 72 72-120 9,397 2.53 2.53 763 763 940 76 76-130 8,573 2.97 2.97 819 819 857 82 82-140 9,494 3.07 3.07 937 937 949 94 94-150 12,642 4.31 4.31 1,751 1,751 1,264 175 175-160 16,081 5.42 5.42 2,802 2,802 1,608 280 280-170 17,002 5.39 5.39 2,947 2,947 1,700 295 295-180 15,936 7.21 7.21 3,693 3,693 1,594 369 369-190 12,981 9.84 9.84 4,106 4,106 1,298 411 411-200 8,331 10.04 10.04 2,690 2,690 833 269 269-210 4,214 10.31 10.31 1,397 1,397 421 140 140-220 1,211 10.08 10.08 392 392 121 39 39-230 48 11.25 11.25 17 17 5 2 2Total 6,511,002 3.60 3.46 753,789 724,518
Total Resource 1.0g/t CutoffPer Vertical Metre
Transvaal June 2008 Mineral Resource 1g/t Au Cutoff
Transvaal Resource: Tonnes and Grade Per 10m Bench
0
100,000
200,000
300,000
400,000
370
350
330
310
290
270
250
230
210
190
170
150
130
110 90 70 50 30 10 -10
-30
-50
-70
-90
-110
-130
-150
-170
-190
-210
-230
Bench Top RL
To
nn
es
0.00
3.00
6.00
9.00
12.00
g/t
Au
Tonnes Per 10m Bench Cut Uncut g/t
Tonnes and Ounces Per Vertical Metre
0
10,000
20,000
30,000
40,000
370
350
330
310
290
270
250
230
210
190
170
150
130
110
90
70
50
30
10
-10
-30
-50
-70
-90
-110
-130
-150
-170
-190
-210
-230
Bench Top RL
To
nn
es/
Vm
0
1,500
3,000
4,500
6,000
Ou
nce/
Vm
TVM OVM Cut OVM Uncut

Page v August 2008
Blocks > 1g/t Cutoff
Bench Tonnes Au Uncut Cut Tonnes Au Uncut Cut Tonnes Au Uncut Cut Tonnes Au Uncut CutTop RL T g/t g/t T g/t g/t T g/t g/t T g/t g/t
370 963 2.09 2.09 0 0.00 0.00 0 0.00 0.00 963 2.09 2.09360 3,541 2.19 2.19 1,392 2.39 2.39 145 5.25 5.25 5,078 2.33 2.33350 16,741 3.31 2.46 13,753 2.24 2.24 3,100 3.53 3.53 33,594 2.89 2.47340 23,582 3.05 2.60 31,725 3.02 3.01 40,591 4.15 4.15 95,898 3.51 3.39330 11,000 2.77 2.62 61,468 2.45 2.23 117,025 4.55 4.55 189,493 3.77 3.69320 3,575 3.34 3.34 65,054 2.88 2.57 221,602 4.37 4.24 290,231 4.02 3.86310 413 2.87 2.87 21,347 3.81 3.14 303,461 4.03 3.75 325,221 4.01 3.71300 0 0.00 0.00 2,827 3.29 2.93 344,052 4.02 3.72 346,879 4.01 3.72290 0 0.00 0.00 0 0.00 0.00 355,386 4.01 3.66 355,386 4.01 3.66280 0 0.00 0.00 0 0.00 0.00 352,335 3.79 3.63 352,335 3.79 3.63270 0 0.00 0.00 0 0.00 0.00 327,728 3.84 3.69 327,728 3.84 3.69260 0 0.00 0.00 0 0.00 0.00 308,207 3.91 3.81 308,207 3.91 3.81250 0 0.00 0.00 0 0.00 0.00 281,374 4.19 4.07 281,374 4.19 4.07240 0 0.00 0.00 0 0.00 0.00 267,084 4.17 4.08 267,084 4.17 4.08230 0 0.00 0.00 0 0.00 0.00 245,578 4.13 4.03 245,578 4.13 4.03220 0 0.00 0.00 0 0.00 0.00 231,047 4.09 3.96 231,047 4.09 3.96210 0 0.00 0.00 0 0.00 0.00 223,200 3.91 3.76 223,200 3.91 3.76200 0 0.00 0.00 0 0.00 0.00 220,778 3.78 3.62 220,778 3.78 3.62190 0 0.00 0.00 0 0.00 0.00 216,370 3.49 3.36 216,370 3.49 3.36180 0 0.00 0.00 0 0.00 0.00 202,663 3.28 3.14 202,663 3.28 3.14170 0 0.00 0.00 0 0.00 0.00 202,081 3.24 3.10 202,081 3.24 3.10160 0 0.00 0.00 0 0.00 0.00 199,514 3.00 2.92 199,514 3.00 2.92150 0 0.00 0.00 0 0.00 0.00 186,097 2.97 2.93 186,097 2.97 2.93140 0 0.00 0.00 0 0.00 0.00 177,088 3.08 3.03 177,088 3.08 3.03130 0 0.00 0.00 0 0.00 0.00 164,784 2.76 2.69 164,784 2.76 2.69120 0 0.00 0.00 0 0.00 0.00 144,973 2.43 2.35 144,973 2.43 2.35110 0 0.00 0.00 0 0.00 0.00 126,809 2.22 2.11 126,809 2.22 2.11100 0 0.00 0.00 0 0.00 0.00 107,047 2.14 2.00 107,047 2.14 2.0090 0 0.00 0.00 0 0.00 0.00 89,270 1.94 1.86 89,270 1.94 1.8680 0 0.00 0.00 0 0.00 0.00 58,900 1.84 1.84 58,900 1.84 1.8470 0 0.00 0.00 0 0.00 0.00 35,553 1.80 1.80 35,553 1.80 1.8060 0 0.00 0.00 0 0.00 0.00 29,692 1.66 1.66 29,692 1.66 1.6650 0 0.00 0.00 0 0.00 0.00 21,748 1.56 1.56 21,748 1.56 1.5640 0 0.00 0.00 0 0.00 0.00 13,563 1.34 1.34 13,563 1.34 1.3430 0 0.00 0.00 0 0.00 0.00 6,539 1.16 1.16 6,539 1.16 1.1620 0 0.00 0.00 0 0.00 0.00 727 1.16 1.16 727 1.16 1.1610 0 0.00 0.00 0 0.00 0.00 10,898 3.51 3.51 10,898 3.51 3.510 0 0.00 0.00 0 0.00 0.00 29,983 3.43 3.43 29,983 3.43 3.43
-10 0 0.00 0.00 0 0.00 0.00 32,308 3.13 3.13 32,308 3.13 3.13-20 0 0.00 0.00 0 0.00 0.00 32,550 3.07 3.07 32,550 3.07 3.07-30 0 0.00 0.00 0 0.00 0.00 31,291 2.98 2.98 31,291 2.98 2.98-40 0 0.00 0.00 0 0.00 0.00 29,305 3.00 3.00 29,305 3.00 3.00-50 0 0.00 0.00 0 0.00 0.00 30,855 3.17 3.17 30,855 3.17 3.17-60 0 0.00 0.00 0 0.00 0.00 28,627 3.58 3.58 28,627 3.58 3.58-70 0 0.00 0.00 0 0.00 0.00 24,073 3.58 3.58 24,073 3.58 3.58-80 0 0.00 0.00 0 0.00 0.00 20,925 3.44 3.44 20,925 3.44 3.44-90 0 0.00 0.00 0 0.00 0.00 17,777 3.21 3.21 17,777 3.21 3.21-100 0 0.00 0.00 0 0.00 0.00 13,175 2.85 2.85 13,175 2.85 2.85-110 0 0.00 0.00 0 0.00 0.00 9,833 2.28 2.28 9,833 2.28 2.28-120 0 0.00 0.00 0 0.00 0.00 9,397 2.53 2.53 9,397 2.53 2.53-130 0 0.00 0.00 0 0.00 0.00 8,573 2.97 2.97 8,573 2.97 2.97-140 0 0.00 0.00 0 0.00 0.00 9,494 3.07 3.07 9,494 3.07 3.07-150 0 0.00 0.00 0 0.00 0.00 12,642 4.31 4.31 12,642 4.31 4.31-160 0 0.00 0.00 0 0.00 0.00 16,081 5.42 5.42 16,081 5.42 5.42-170 0 0.00 0.00 0 0.00 0.00 17,002 5.39 5.39 17,002 5.39 5.39-180 0 0.00 0.00 0 0.00 0.00 15,936 7.21 7.21 15,936 7.21 7.21-190 0 0.00 0.00 0 0.00 0.00 12,981 9.84 9.84 12,981 9.84 9.84-200 0 0.00 0.00 0 0.00 0.00 8,331 10.04 10.04 8,331 10.04 10.04-210 0 0.00 0.00 0 0.00 0.00 4,214 10.31 10.31 4,214 10.31 10.31-220 0 0.00 0.00 0 0.00 0.00 1,211 10.08 10.08 1,211 10.08 10.08-230 0 0.00 0.00 0 0.00 0.00 48 11.25 11.25 48 11.25 11.25Total 59,815 3.02 2.58 197,566 2.83 2.58 6,253,621 3.63 3.50 6,511,002 3.60 3.46
Transvaal June 2008 Mineral Resource 1g/t Au Cutoff
Total DepositOxide Transitional Fresh
Kunche Deposit: Tonnes and Grade Per 10m Bench
0
24,000
48,000
72,000
96,000
120,000
Ben
ch
350
310
270
230
190
150
110 70 30 -10
-50
-90
-130
-170
-210
Bench Top RL
To
nn
es
0.000
1.000
2.000
3.000
4.000
5.000
g/t
Au
Tonnes Per 10m Bench Cut20 g/t Uncut g/t
Transvaal Resource - Mineralisation > 1g/t Au
0
100,000
200,000
300,000
400,000
370
340
310
280
250
220
190
160
130
100 70 40 10 -2
0-5
0-8
0-1
10-1
40-1
70-2
00-2
30
Bench Top RL
To
nn
es
0.00
5.00
10.00
15.00
20.00
Gra
de
g/t
Oxide Transitional Fresh Cut g/t

Page vi August 2008
Grade CutoffRange Tonnes Cut Cut Grade Tonnes Cut Cut
g/t T g/t Ounces g/t T g/t Ounces0.0-0.7 5,169 0.67 112 0.00 6,759,194 3.37 731,635
0.7-1.0 243,028 0.90 7,005 0.70 6,754,025 3.37 731,523
1.0-1.2 300,614 1.11 10,687 1.00 6,510,997 3.46 724,518
1.2-1.5 634,997 1.35 27,622 1.20 6,210,383 3.58 713,831
1.5-2.0 1,035,684 1.75 58,365 1.50 5,575,386 3.83 686,209
2.0-3.0 1,651,444 2.46 130,604 2.00 4,539,702 4.30 627,844
3.0-4.0 1,022,469 3.44 112,965 3.00 2,888,258 5.35 497,240
4.0-5.0 658,434 4.46 94,373 4.00 1,865,789 6.41 384,275
5.0-6.0 383,886 5.50 67,851 5.00 1,207,355 7.47 289,902
6.0-7.0 265,555 6.50 55,486 6.00 823,469 8.39 222,051
7.0-8.0 191,470 7.45 45,843 7.00 557,914 9.29 166,565
8.0-9.0 120,973 8.45 32,866 8.00 366,444 10.25 120,722
9.0-10.0 64,258 9.45 19,526 9.00 245,471 11.13 87,855
10.0-11.0 67,666 10.45 22,726 10.00 181,213 11.73 68,330
11.0-12.0 41,400 11.42 15,207 11.00 113,547 12.49 45,604
12.0-13.0 38,677 12.42 15,446 12.00 72,147 13.10 30,397
13.0-14.0 25,575 13.36 10,985 13.00 33,470 13.89 14,951
14.0-15.0 2,083 14.18 950 14.00 7,895 15.62 3,965
15.0-16.0 3,439 15.44 1,707 15.00 5,812 16.14 3,016
16.0-17.0 0 0.00 0 16.00 2,373 17.15 1,309
17.0-18.0 2,373 17.15 1,309 17.00 2,373 17.15 1,309
Total 6,759,194 3.37 731,635
Incremental Mineralisation Cumulative MineralisationTransvaal June 2008 Mineral Resource 1g/t Au Cutoff
Transvaal Resource Grade-Tonnage Curve
0
1,000,000
2,000,000
3,000,000
4,000,000
5,000,000
6,000,000
7,000,000
8,000,000
0.0
0
0.7
0
1.0
0
1.2
0
1.5
0
2.0
0
3.0
0
4.0
0
5.0
0
6.0
0
7.0
0
8.0
0
9.0
0
10
.00
11
.00
12
.00
13
.00
14
.00
15
.00
16
.00
17
.00
Cutoff Grade g/t
To
nn
es
0.00
2.50
5.00
7.50
10.00
12.50
15.00
17.50
20.00
Gra
de
g/t
Tonnes Cut g/t

Page vii August 2008
Appendix 2
Transvaal Gold Project
June 2008 Validation Plots

Page viii August 2008
Object Lode Resource Ok Uncut Ok Cut Number of Uncut CutNumber Volume Volume g/t g/t Comps g/t g/t
1 140,852 141,359 2.08 2.08 760 2.52 2.492 4,143 4,094 2.36 2.36 30 2.42 2.423 341,820 341,953 5.67 5.66 1,086 5.58 5.554 316,882 317,469 4.55 4.50 1,806 5.09 5.055 1,223,017 1,223,422 2.40 2.28 5,278 2.93 2.736 1,914 1,875 2.86 2.82 135 3.14 3.067 10,698 10,406 5.61 5.45 335 6.79 6.378 44,241 43,609 6.91 4.57 204 5.68 4.159 301,785 301,484 3.88 3.74 1,384 3.77 3.55
10 534,058 534,578 6.65 6.32 1,523 6.20 5.8811 30,208 30,297 6.59 5.40 194 5.75 4.8312 16,877 16,969 2.73 2.45 170 2.94 2.5913 18,555 19,297 4.42 2.77 96 4.32 2.6814 6,626 6,172 6.14 5.83 32 5.63 5.2315 30,244 30,094 1.61 1.61 178 1.59 1.59
Total 3,021,920 3,023,078 4.01 3.82 13,211 4.07 3.85
Transvaal Resource Block Model Validation by PodBlock Model CompositesWireframe

Page ix August 2008
Section OK Volume OK Uncut OK Cut Number of Comps*280 Uncut Cut Sample RatioY BCM g/t g/t Comps g/t g/t BCM/comp
8540 797 3.30 3.30 0 8560 6,172 3.01 3.01 39 10,920 3.92 3.92 1588580 11,859 3.37 3.37 73 20,440 4.55 4.55 1628600 12,750 1.60 1.60 59 16,520 2.65 2.65 2168620 10,469 1.15 1.15 33 9,240 1.17 1.17 3178640 10,828 1.55 1.55 45 12,600 1.15 1.15 2418660 10,625 1.97 1.97 34 9,520 2.92 2.92 3138680 9,953 1.99 1.99 40 11,200 1.96 1.96 2498700 8,328 1.98 1.98 30 8,400 1.91 1.91 2788720 7,906 1.97 1.97 18 5,040 2.08 2.08 4398740 3,891 2.49 2.49 8 2,240 1.69 1.69 4868760 4,453 2.97 2.97 15 4,200 4.66 4.66 2978780 7,016 2.18 2.18 27 7,560 2.00 2.00 2608800 7,750 1.68 1.68 20 5,600 1.47 1.47 3888820 6,422 1.73 1.73 0 8840 3,953 1.80 1.80 0 8860 406 1.85 1.85 2 560 2.33 2.33 203Total 123,578 2.05 2.05 443 124,040 2.65 2.65 279
Note: Calculated validation grades differ from resource grades due to weighting by volume, not tonnes.
Block Model CompositesTransvaal Block Model Validation by Northing : Jupiter (fresh)
Comparison of OK and Composite Grades by Northing
0
5,000
10,000
15,000
20,000
25,000
30,000
8540
8580
8620
8660
8700
8740
8780
8820
8860
Northing (Y)
Vo
lum
e &
Co
mp
s (*
280)
0.0
1.0
2.0
3.0
4.0
5.0
6.0
Gra
de
(g/t
)
OK Volume Comps*280 OK Uncut OK Cut Uncut g/t Cut g/t
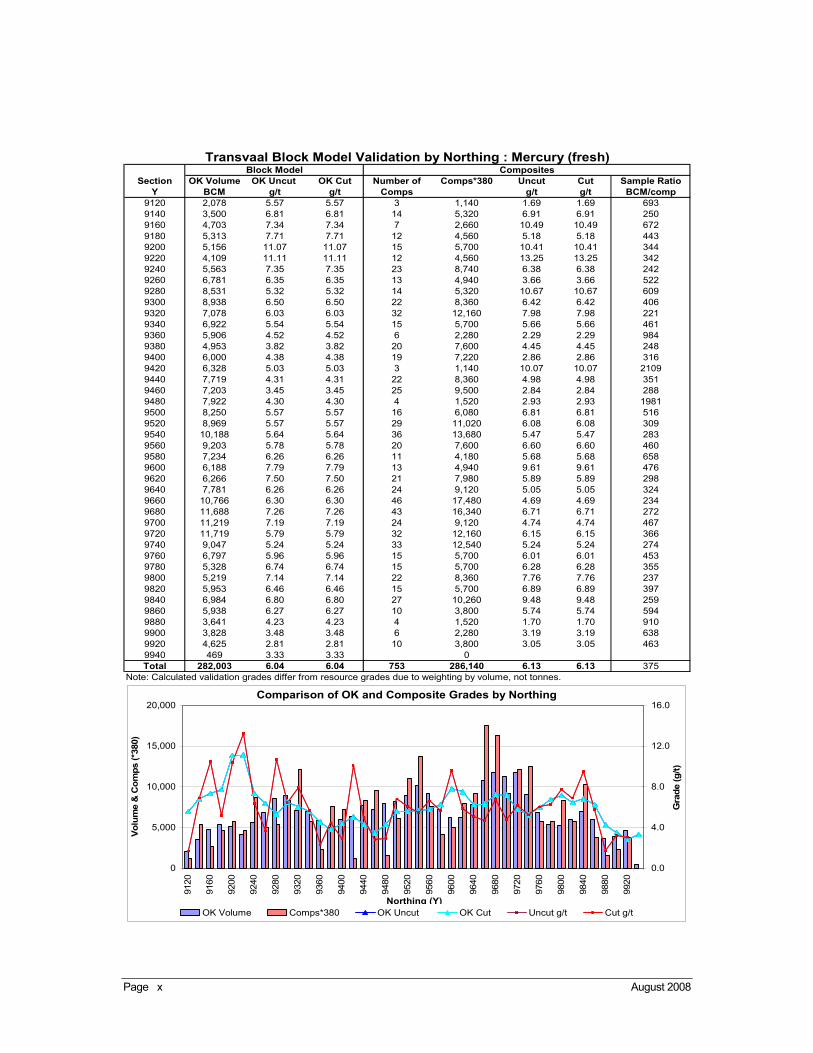
Page x August 2008
Section OK Volume OK Uncut OK Cut Number of Comps*380 Uncut Cut Sample RatioY BCM g/t g/t Comps g/t g/t BCM/comp
9120 2,078 5.57 5.57 3 1,140 1.69 1.69 6939140 3,500 6.81 6.81 14 5,320 6.91 6.91 2509160 4,703 7.34 7.34 7 2,660 10.49 10.49 6729180 5,313 7.71 7.71 12 4,560 5.18 5.18 4439200 5,156 11.07 11.07 15 5,700 10.41 10.41 3449220 4,109 11.11 11.11 12 4,560 13.25 13.25 3429240 5,563 7.35 7.35 23 8,740 6.38 6.38 2429260 6,781 6.35 6.35 13 4,940 3.66 3.66 5229280 8,531 5.32 5.32 14 5,320 10.67 10.67 6099300 8,938 6.50 6.50 22 8,360 6.42 6.42 4069320 7,078 6.03 6.03 32 12,160 7.98 7.98 2219340 6,922 5.54 5.54 15 5,700 5.66 5.66 4619360 5,906 4.52 4.52 6 2,280 2.29 2.29 9849380 4,953 3.82 3.82 20 7,600 4.45 4.45 2489400 6,000 4.38 4.38 19 7,220 2.86 2.86 3169420 6,328 5.03 5.03 3 1,140 10.07 10.07 21099440 7,719 4.31 4.31 22 8,360 4.98 4.98 3519460 7,203 3.45 3.45 25 9,500 2.84 2.84 2889480 7,922 4.30 4.30 4 1,520 2.93 2.93 19819500 8,250 5.57 5.57 16 6,080 6.81 6.81 5169520 8,969 5.57 5.57 29 11,020 6.08 6.08 3099540 10,188 5.64 5.64 36 13,680 5.47 5.47 2839560 9,203 5.78 5.78 20 7,600 6.60 6.60 4609580 7,234 6.26 6.26 11 4,180 5.68 5.68 6589600 6,188 7.79 7.79 13 4,940 9.61 9.61 4769620 6,266 7.50 7.50 21 7,980 5.89 5.89 2989640 7,781 6.26 6.26 24 9,120 5.05 5.05 3249660 10,766 6.30 6.30 46 17,480 4.69 4.69 2349680 11,688 7.26 7.26 43 16,340 6.71 6.71 2729700 11,219 7.19 7.19 24 9,120 4.74 4.74 4679720 11,719 5.79 5.79 32 12,160 6.15 6.15 3669740 9,047 5.24 5.24 33 12,540 5.24 5.24 2749760 6,797 5.96 5.96 15 5,700 6.01 6.01 4539780 5,328 6.74 6.74 15 5,700 6.28 6.28 3559800 5,219 7.14 7.14 22 8,360 7.76 7.76 2379820 5,953 6.46 6.46 15 5,700 6.89 6.89 3979840 6,984 6.80 6.80 27 10,260 9.48 9.48 2599860 5,938 6.27 6.27 10 3,800 5.74 5.74 5949880 3,641 4.23 4.23 4 1,520 1.70 1.70 9109900 3,828 3.48 3.48 6 2,280 3.19 3.19 6389920 4,625 2.81 2.81 10 3,800 3.05 3.05 4639940 469 3.33 3.33 0 Total 282,003 6.04 6.04 753 286,140 6.13 6.13 375
Note: Calculated validation grades differ from resource grades due to weighting by volume, not tonnes.
Block Model CompositesTransvaal Block Model Validation by Northing : Mercury (fresh)
Comparison of OK and Composite Grades by Northing
0
5,000
10,000
15,000
20,000
9120
9160
9200
9240
9280
9320
9360
9400
9440
9480
9520
9560
9600
9640
9680
9720
9760
9800
9840
9880
9920
Northing (Y)
Vo
lum
e &
Co
mp
s (*
380)
0.0
4.0
8.0
12.0
16.0
Gra
de
(g/t
)
OK Volume Comps*380 OK Uncut OK Cut Uncut g/t Cut g/t

Page xi August 2008
Section OK Volume OK Uncut OK Cut Number of Comps*500 Uncut Cut Sample RatioY BCM g/t g/t Comps g/t g/t BCM/comp
8780 6,063 1.99 1.99 8 4,000 2.05 2.05 7588800 10,938 1.78 1.78 13 6,500 1.32 1.32 8418820 13,000 1.54 1.54 35 17,500 1.89 1.89 3718840 15,453 1.13 1.13 42 21,000 0.94 0.94 3688860 16,344 1.03 1.03 57 28,500 1.11 1.11 2878880 15,797 1.16 1.16 86 43,000 1.29 1.29 1848900 17,438 1.14 1.14 41 20,500 1.00 1.00 4258920 20,313 0.98 0.98 42 21,000 0.96 0.96 4848940 19,266 1.02 1.02 14 7,000 1.07 1.07 13768960 12,313 1.31 1.31 5 2,500 0.94 0.94 24638980 4,734 1.56 1.56 7 3,500 2.74 2.74 6769000 3,078 1.34 1.34 7 3,500 1.19 1.19 4409020 938 1.27 1.27 7 3,500 0.52 0.52 1349040 1,875 1.79 1.79 55 27,500 2.96 2.96 349060 2,078 1.09 1.09 13 6,500 1.68 1.68 1609080 2,672 1.15 1.15 18 9,000 1.02 1.02 1489100 7,625 1.53 1.53 17 8,500 1.47 1.47 4499120 12,234 2.16 2.16 32 16,000 2.07 2.07 3829140 14,938 2.81 2.81 40 20,000 3.60 3.60 3739160 13,484 3.71 3.65 24 12,000 6.47 6.47 5629180 15,141 4.51 4.08 41 20,500 8.04 6.00 3699200 18,219 3.22 2.94 79 39,500 4.63 4.03 2319220 20,266 2.84 2.75 28 14,000 2.87 2.87 7249240 21,641 2.35 2.35 27 13,500 2.50 2.50 8029260 21,047 1.72 1.72 38 19,000 1.45 1.45 5549280 22,859 1.81 1.81 20 10,000 1.31 1.31 11439300 24,531 2.04 2.04 26 13,000 2.08 2.08 9449320 29,797 2.43 2.43 17 8,500 2.34 2.34 17539340 34,656 2.66 2.66 34 17,000 3.21 3.21 10199360 37,344 2.37 2.37 73 36,500 2.26 2.26 5129380 30,531 2.53 2.48 44 22,000 3.30 3.30 6949400 26,109 3.39 2.97 24 12,000 2.24 2.24 10889420 22,922 4.70 3.64 23 11,500 4.87 4.87 9979440 19,875 4.83 3.48 23 11,500 8.49 5.60 8649460 17,594 3.54 2.73 11 5,500 2.31 2.31 15999480 17,250 2.34 2.17 21 10,500 1.81 1.81 8219500 17,906 2.33 2.33 32 16,000 3.72 3.72 5609520 18,594 2.17 2.17 32 16,000 4.29 4.29 5819540 17,078 1.66 1.66 12 6,000 1.02 1.02 14239560 17,719 1.30 1.30 23 11,500 1.64 1.64 7709580 19,344 1.29 1.29 27 13,500 1.30 1.30 7169600 18,734 1.52 1.52 22 11,000 1.12 1.12 8529620 20,656 2.15 2.15 35 17,500 1.97 1.97 5909640 22,359 2.42 2.42 59 29,500 3.11 3.11 3799660 21,109 1.78 1.78 56 28,000 1.45 1.45 3779680 21,734 1.74 1.74 64 32,000 2.17 2.17 3409700 18,266 1.64 1.64 43 21,500 1.73 1.73 4259720 22,672 1.96 1.96 89 44,500 2.03 2.03 2559740 29,344 2.46 2.46 31 15,500 1.82 1.82 9479760 34,641 2.81 2.77 110 55,000 2.88 2.88 3159780 32,328 3.49 3.37 68 34,000 2.80 2.49 4759800 24,078 3.17 3.14 84 42,000 3.59 3.59 2879820 20,891 2.82 2.82 44 22,000 3.14 3.14 4759840 20,109 2.49 2.49 56 28,000 2.54 2.54 3599860 15,813 2.24 2.24 32 16,000 1.53 1.53 4949880 8,844 1.35 1.35 27 13,500 1.11 1.11 3289900 6,203 1.04 1.04 5 2,500 0.64 0.64 12419920 703 1.03 1.03 16 8,000 1.38 1.38 44Total 1,019,488 2.33 2.23 2,059 1,029,500 2.55 2.44 495
Note: Calculated validation grades differ from resource grades due to weighting by volume, not tonnes.
Block Model CompositesTransvaal Block Model Validation by Northing : Polaris_Sunbeam (fresh)
Comparison of OK and Composite Grades by Northing
0
15,000
30,000
45,000
60,000
878
0
882
0
886
0
890
0
894
0
898
0
902
0
906
0
910
0
914
0
918
0
922
0
926
0
930
0
934
0
938
0
942
0
946
0
950
0
954
0
958
0
962
0
966
0
970
0
974
0
978
0
982
0
986
0
990
0
Northing (Y)
Volu
me &
Com
ps (*5
00)
0.0
2.5
5.0
7.5
10.0
Gra
de
(g/t)
OK Volume Comps*500 OK Uncut OK Cut Uncut g/t Cut g/t
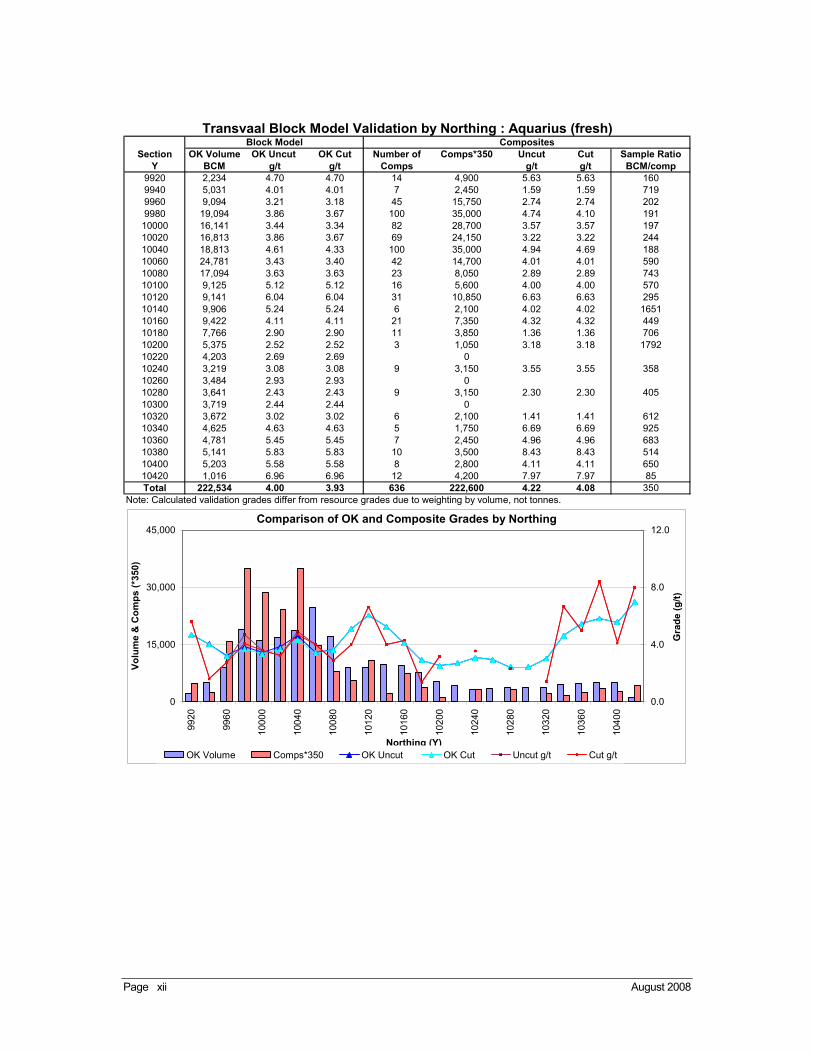
Page xii August 2008
Section OK Volume OK Uncut OK Cut Number of Comps*350 Uncut Cut Sample RatioY BCM g/t g/t Comps g/t g/t BCM/comp
9920 2,234 4.70 4.70 14 4,900 5.63 5.63 1609940 5,031 4.01 4.01 7 2,450 1.59 1.59 7199960 9,094 3.21 3.18 45 15,750 2.74 2.74 2029980 19,094 3.86 3.67 100 35,000 4.74 4.10 19110000 16,141 3.44 3.34 82 28,700 3.57 3.57 19710020 16,813 3.86 3.67 69 24,150 3.22 3.22 24410040 18,813 4.61 4.33 100 35,000 4.94 4.69 18810060 24,781 3.43 3.40 42 14,700 4.01 4.01 59010080 17,094 3.63 3.63 23 8,050 2.89 2.89 74310100 9,125 5.12 5.12 16 5,600 4.00 4.00 57010120 9,141 6.04 6.04 31 10,850 6.63 6.63 29510140 9,906 5.24 5.24 6 2,100 4.02 4.02 165110160 9,422 4.11 4.11 21 7,350 4.32 4.32 44910180 7,766 2.90 2.90 11 3,850 1.36 1.36 70610200 5,375 2.52 2.52 3 1,050 3.18 3.18 179210220 4,203 2.69 2.69 0 10240 3,219 3.08 3.08 9 3,150 3.55 3.55 35810260 3,484 2.93 2.93 0 10280 3,641 2.43 2.43 9 3,150 2.30 2.30 40510300 3,719 2.44 2.44 0 10320 3,672 3.02 3.02 6 2,100 1.41 1.41 61210340 4,625 4.63 4.63 5 1,750 6.69 6.69 92510360 4,781 5.45 5.45 7 2,450 4.96 4.96 68310380 5,141 5.83 5.83 10 3,500 8.43 8.43 51410400 5,203 5.58 5.58 8 2,800 4.11 4.11 65010420 1,016 6.96 6.96 12 4,200 7.97 7.97 85Total 222,534 4.00 3.93 636 222,600 4.22 4.08 350
Note: Calculated validation grades differ from resource grades due to weighting by volume, not tonnes.
Block Model CompositesTransvaal Block Model Validation by Northing : Aquarius (fresh)
Comparison of OK and Composite Grades by Northing
0
15,000
30,000
45,000
9920
9960
1000
0
1004
0
1008
0
1012
0
1016
0
1020
0
1024
0
1028
0
1032
0
1036
0
1040
0
Northing (Y)
Vo
lum
e &
Co
mp
s (*
350)
0.0
4.0
8.0
12.0
Gra
de
(g
/t)
OK Volume Comps*350 OK Uncut OK Cut Uncut g/t Cut g/t
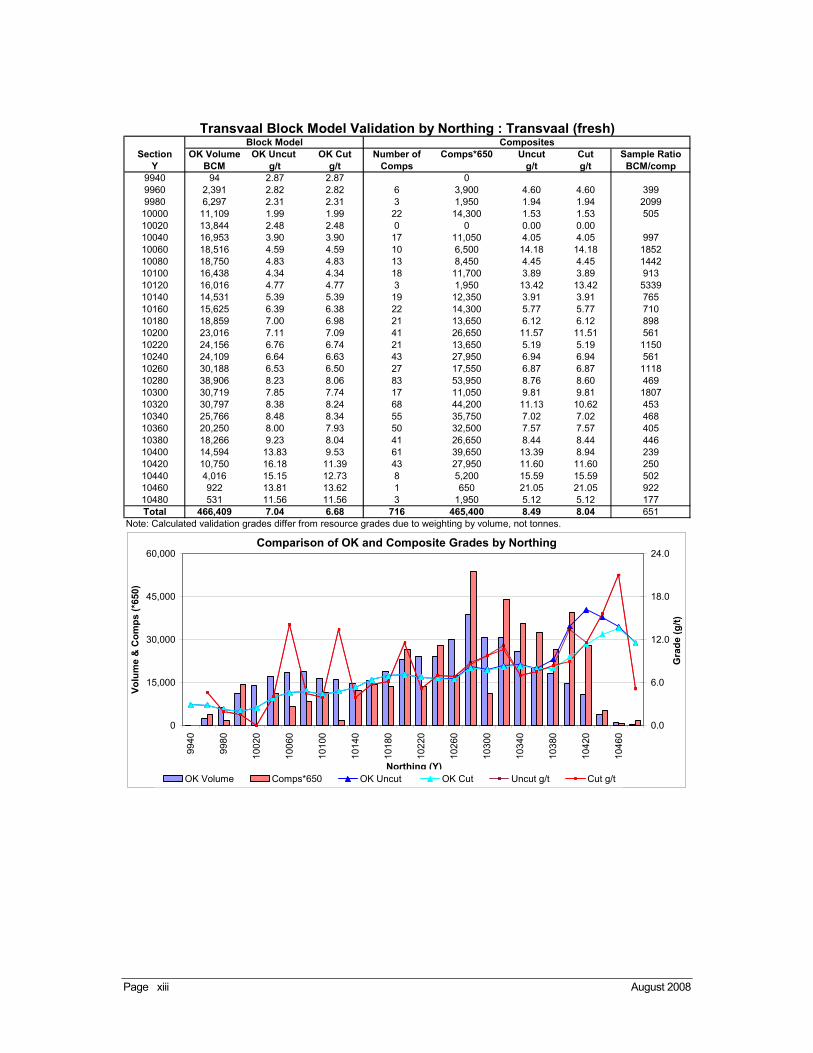
Page xiii August 2008
Section OK Volume OK Uncut OK Cut Number of Comps*650 Uncut Cut Sample RatioY BCM g/t g/t Comps g/t g/t BCM/comp
9940 94 2.87 2.87 0 9960 2,391 2.82 2.82 6 3,900 4.60 4.60 3999980 6,297 2.31 2.31 3 1,950 1.94 1.94 209910000 11,109 1.99 1.99 22 14,300 1.53 1.53 50510020 13,844 2.48 2.48 0 0 0.00 0.00 10040 16,953 3.90 3.90 17 11,050 4.05 4.05 99710060 18,516 4.59 4.59 10 6,500 14.18 14.18 185210080 18,750 4.83 4.83 13 8,450 4.45 4.45 144210100 16,438 4.34 4.34 18 11,700 3.89 3.89 91310120 16,016 4.77 4.77 3 1,950 13.42 13.42 533910140 14,531 5.39 5.39 19 12,350 3.91 3.91 76510160 15,625 6.39 6.38 22 14,300 5.77 5.77 71010180 18,859 7.00 6.98 21 13,650 6.12 6.12 89810200 23,016 7.11 7.09 41 26,650 11.57 11.51 56110220 24,156 6.76 6.74 21 13,650 5.19 5.19 115010240 24,109 6.64 6.63 43 27,950 6.94 6.94 56110260 30,188 6.53 6.50 27 17,550 6.87 6.87 111810280 38,906 8.23 8.06 83 53,950 8.76 8.60 46910300 30,719 7.85 7.74 17 11,050 9.81 9.81 180710320 30,797 8.38 8.24 68 44,200 11.13 10.62 45310340 25,766 8.48 8.34 55 35,750 7.02 7.02 46810360 20,250 8.00 7.93 50 32,500 7.57 7.57 40510380 18,266 9.23 8.04 41 26,650 8.44 8.44 44610400 14,594 13.83 9.53 61 39,650 13.39 8.94 23910420 10,750 16.18 11.39 43 27,950 11.60 11.60 25010440 4,016 15.15 12.73 8 5,200 15.59 15.59 50210460 922 13.81 13.62 1 650 21.05 21.05 92210480 531 11.56 11.56 3 1,950 5.12 5.12 177Total 466,409 7.04 6.68 716 465,400 8.49 8.04 651
Note: Calculated validation grades differ from resource grades due to weighting by volume, not tonnes.
Block Model CompositesTransvaal Block Model Validation by Northing : Transvaal (fresh)
Comparison of OK and Composite Grades by Northing
0
15,000
30,000
45,000
60,000
9940
9980
1002
0
1006
0
1010
0
1014
0
1018
0
1022
0
1026
0
1030
0
1034
0
1038
0
1042
0
1046
0
Northing (Y)
Vo
lum
e &
Co
mp
s (*
650)
0.0
6.0
12.0
18.0
24.0
Gra
de
(g
/t)
OK Volume Comps*650 OK Uncut OK Cut Uncut g/t Cut g/t

Page xiv August 2008
BenchTop OK Volume OK Uncut OK Cut Number of Comps*290 Uncut Cut Sample RatioRL BCM g/t g/t Comps g/t g/t BCM/comp360 47 5.25 5.25 1 290 8.04 8.04 47350 2,328 3.80 3.80 21 6,090 3.83 3.83 111340 10,719 2.83 2.83 126 36,540 3.11 3.11 85330 18,344 2.28 2.28 117 33,930 2.54 2.54 157320 18,906 2.14 2.14 98 28,420 2.28 2.28 193310 17,156 1.92 1.92 39 11,310 1.61 1.61 440300 15,406 1.84 1.84 4 1,160 1.69 1.69 3852290 13,188 1.78 1.78 5 1,450 1.87 1.87 2638280 10,953 1.78 1.78 3 870 1.22 1.22 3651270 9,000 1.66 1.66 7 2,030 1.37 1.37 1286260 6,797 1.69 1.69 3 870 1.54 1.54 2266250 734 1.45 1.45 0
Total 123,578 2.05 2.05 424 122,960 2.59 2.59 291Note: Calculated validation grades differ from resource grades due to weighting by volume, not tonnes.
Block Model CompositesTransvaal Block Model Validation by RL : Jupiter (fresh)
Comparison of OK and Composite Grades by RL
-
10,000
20,000
30,000
40,000
360
350
340
330
320
310
300
290
280
270
260
250
Bench Top (RL)
Vo
lum
e &
Co
mp
s (*
290)
0.0
2.5
5.0
7.5
10.0
Gra
de
(g/t
)
OK Volume Comps*290 OK Uncut OK Cut Uncut g/t Cut g/t
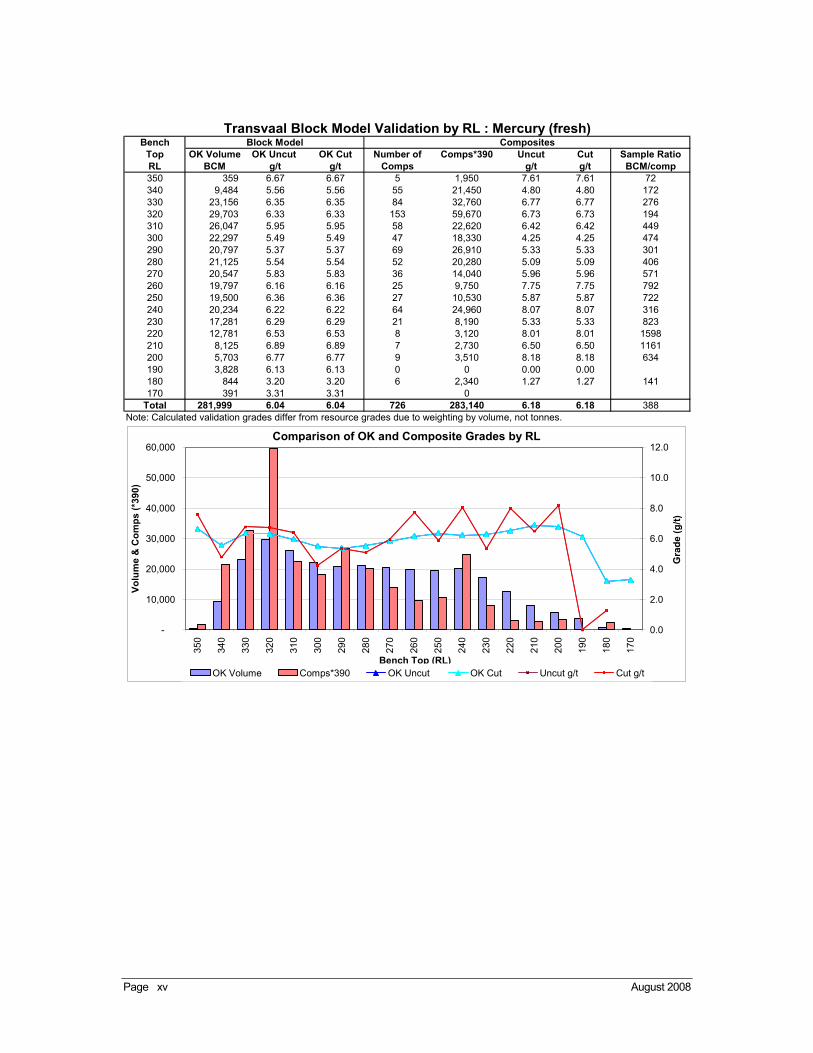
Page xv August 2008
BenchTop OK Volume OK Uncut OK Cut Number of Comps*390 Uncut Cut Sample RatioRL BCM g/t g/t Comps g/t g/t BCM/comp350 359 6.67 6.67 5 1,950 7.61 7.61 72340 9,484 5.56 5.56 55 21,450 4.80 4.80 172330 23,156 6.35 6.35 84 32,760 6.77 6.77 276320 29,703 6.33 6.33 153 59,670 6.73 6.73 194310 26,047 5.95 5.95 58 22,620 6.42 6.42 449300 22,297 5.49 5.49 47 18,330 4.25 4.25 474290 20,797 5.37 5.37 69 26,910 5.33 5.33 301280 21,125 5.54 5.54 52 20,280 5.09 5.09 406270 20,547 5.83 5.83 36 14,040 5.96 5.96 571260 19,797 6.16 6.16 25 9,750 7.75 7.75 792250 19,500 6.36 6.36 27 10,530 5.87 5.87 722240 20,234 6.22 6.22 64 24,960 8.07 8.07 316230 17,281 6.29 6.29 21 8,190 5.33 5.33 823220 12,781 6.53 6.53 8 3,120 8.01 8.01 1598210 8,125 6.89 6.89 7 2,730 6.50 6.50 1161200 5,703 6.77 6.77 9 3,510 8.18 8.18 634190 3,828 6.13 6.13 0 0 0.00 0.00 180 844 3.20 3.20 6 2,340 1.27 1.27 141170 391 3.31 3.31 0
Total 281,999 6.04 6.04 726 283,140 6.18 6.18 388Note: Calculated validation grades differ from resource grades due to weighting by volume, not tonnes.
Block Model CompositesTransvaal Block Model Validation by RL : Mercury (fresh)
Comparison of OK and Composite Grades by RL
-
10,000
20,000
30,000
40,000
50,000
60,000
350
340
330
320
310
300
290
280
270
260
250
240
230
220
210
200
190
180
170
Bench Top (RL)
Vo
lum
e &
Co
mp
s (*
390)
0.0
2.0
4.0
6.0
8.0
10.0
12.0
Gra
de
(g/t
)OK Volume Comps*390 OK Uncut OK Cut Uncut g/t Cut g/t

Page xvi August 2008
BenchTop OK Volume OK Uncut OK Cut Number of Comps*510 Uncut Cut Sample RatioRL BCM g/t g/t Comps g/t g/t BCM/comp340 31 5.69 5.69 0 330 3,328 2.63 2.63 26 13,260 2.33 2.33 128320 28,859 2.21 2.21 346 176,460 2.44 2.44 83310 50,234 2.36 2.31 347 176,970 2.37 2.28 145300 54,531 2.68 2.58 209 106,590 3.31 2.92 261290 54,781 2.75 2.67 174 88,740 2.83 2.83 315280 54,875 2.69 2.64 149 75,990 2.67 2.67 368270 51,109 2.64 2.58 143 72,930 3.17 3.02 357260 47,188 2.54 2.48 121 61,710 2.47 2.47 390250 45,344 2.38 2.33 122 62,220 2.20 2.20 372240 43,281 2.32 2.24 59 30,090 1.59 1.59 734230 42,313 2.23 2.13 64 32,640 2.13 2.13 661220 43,313 2.20 2.06 40 20,400 4.75 3.09 1083210 45,094 2.20 2.05 36 18,360 1.29 1.29 1253200 45,672 2.22 2.05 40 20,400 1.75 1.75 1142190 44,813 2.21 2.05 26 13,260 4.38 4.38 1724180 44,000 2.25 2.08 14 7,140 1.00 1.00 3143170 42,531 2.29 2.11 29 14,790 1.35 1.35 1467160 39,094 2.15 2.05 19 9,690 2.31 2.31 2058150 34,578 2.16 2.11 10 5,100 2.57 2.57 3458140 31,328 2.23 2.16 7 3,570 1.71 1.71 4475130 29,688 2.39 2.27 2 1,020 1.96 1.96 14844120 28,328 2.28 2.14 1 510 1.51 1.51 28328110 23,875 2.23 2.04 17 8,670 1.35 1.35 1404100 21,688 2.30 2.07 0 90 19,203 2.04 1.93 0 80 15,188 1.89 1.89 0 70 11,859 1.77 1.77 0 60 9,625 1.65 1.65 9 4,590 0.98 0.98 106950 7,016 1.56 1.56 0 40 4,375 1.34 1.34 0 30 2,109 1.16 1.16 0 20 234 1.16 1.16 0
Total 1,019,485 2.33 2.23 2,010 1,025,100 2.56 2.46 507Note: Calculated validation grades differ from resource grades due to weighting by volume, not tonnes.
Block Model CompositesTransvaal Block Model Validation by RL : Sunbeam_Polaris (fresh)
Comparison of OK and Composite Grades by RL
-
30,000
60,000
90,000
120,000
150,000
180,000
340
330
320
310
300
290
280
270
260
250
240
230
220
210
200
190
180
170
160
150
140
130
120
110
100 90 80 70 60 50 40 30 20
Bench Top (RL)
Vo
lum
e &
Co
mp
s (*
510)
0.0
1.0
2.0
3.0
4.0
5.0
6.0
Gra
de
(g/t
)
OK Volume Comps*510 OK Uncut OK Cut Uncut g/t Cut g/t

Page xvii August 2008
BenchTop OK Volume OK Uncut OK Cut Number of Comps*360 Uncut Cut Sample RatioRL BCM g/t g/t Comps g/t g/t BCM/comp330 656 4.52 4.52 10 3,600 5.83 5.83 66320 5,531 4.31 4.31 45 16,200 3.09 3.09 123310 11,422 4.16 4.15 78 28,080 3.94 3.92 146300 15,609 4.36 4.36 55 19,800 4.27 4.27 284290 14,922 4.46 4.46 33 11,880 5.29 5.29 452280 14,063 4.72 4.68 59 21,240 4.31 4.31 238270 13,719 4.50 4.41 73 26,280 3.41 3.41 188260 12,734 4.80 4.62 54 19,440 7.88 6.70 236250 11,969 4.86 4.60 37 13,320 4.20 4.20 323240 10,828 4.54 4.33 43 15,480 3.28 3.28 252230 10,359 4.08 3.94 14 5,040 8.23 6.48 740220 11,609 3.75 3.64 26 9,360 3.03 3.03 447210 12,922 3.56 3.47 35 12,600 3.93 3.93 369200 13,516 3.47 3.42 14 5,040 3.09 3.09 965190 12,984 3.42 3.39 4 1,440 2.58 2.58 3246180 11,375 3.38 3.38 8 2,880 3.45 3.45 1422170 10,172 3.37 3.37 2 720 6.01 6.01 5086160 8,703 3.21 3.21 9 3,240 1.82 1.82 967150 6,859 3.06 3.06 4 1,440 2.29 2.29 1715140 5,469 3.13 3.13 5 1,800 1.12 1.12 1094130 3,047 3.29 3.29 1 360 1.61 1.61 3047120 1,734 3.19 3.19 9 3,240 4.29 4.29 193110 1,266 3.05 3.05 2 720 3.73 3.73 633100 750 3.09 3.09 2 720 2.12 2.12 37590 313 2.84 2.84 0
Total 222,531 4.00 3.93 622 223,920 4.25 4.11 358Note: Calculated validation grades differ from resource grades due to weighting by volume, not tonnes.
Block Model CompositesTransvaal Block Model Validation by RL : Aquarius (fresh)
Comparison of OK and Composite Grades by RL
-
6,000
12,000
18,000
24,000
30,000
330
320
310
300
290
280
270
260
250
240
230
220
210
200
190
180
170
160
150
140
130
120
110
100 90
Bench Top (RL)
Vo
lum
e &
Co
mp
s (*
360)
0.0
2.0
4.0
6.0
8.0
10.0
Gra
de
(g/t
)
OK Volume Comps*360 OK Uncut OK Cut Uncut g/t Cut g/t

Page xviii August 2008
BenchTop OK Volume OK Uncut OK Cut Number of Comps*650 Uncut Cut Sample RatioRL BCM g/t g/t Comps g/t g/t BCM/comp330 47 12.53 12.40 0 320 3,078 12.11 11.71 24 15,600 7.30 7.30 128310 9,016 10.67 10.33 34 22,100 9.29 8.88 265300 9,641 10.05 9.78 0 290 8,469 8.96 8.82 14 9,100 3.74 3.74 605280 7,109 7.62 7.60 34 22,100 4.74 4.74 209270 6,016 8.20 8.19 29 18,850 10.50 10.50 207260 5,906 8.63 8.63 21 13,650 6.59 6.59 281250 6,781 9.09 9.04 32 20,800 9.25 9.25 212240 7,719 9.15 9.08 15 9,750 13.88 13.88 515230 7,797 11.24 10.12 17 11,050 12.42 12.42 459220 7,766 14.67 10.69 18 11,700 16.62 14.70 431210 7,531 15.72 10.83 8 5,200 7.66 7.66 941200 7,594 16.24 10.17 19 12,350 26.39 12.11 400190 7,734 11.56 8.98 26 16,900 9.27 9.27 297180 8,141 8.58 7.72 12 7,800 17.12 17.12 678170 9,422 8.50 8.09 9 5,850 11.22 11.22 1047160 11,516 7.91 7.64 17 11,050 8.13 8.13 677150 12,563 7.66 7.66 23 14,950 9.92 9.92 546140 11,516 7.95 7.95 12 7,800 4.39 4.39 960130 10,594 8.55 8.55 11 7,150 13.15 13.15 963120 10,688 8.98 8.97 15 9,750 14.23 14.23 713110 10,750 8.93 8.92 5 3,250 12.97 12.97 2150100 10,594 9.13 9.10 16 10,400 8.00 8.00 66290 10,438 9.71 9.68 10 6,500 7.19 7.19 104480 9,906 9.64 9.61 20 13,000 16.74 16.61 49570 10,281 9.06 9.04 18 11,700 9.36 9.36 57160 11,156 7.83 7.82 23 14,950 9.67 9.67 48550 11,953 6.88 6.88 4 2,600 3.91 3.91 298840 12,031 5.69 5.69 11 7,150 8.17 8.17 109430 12,125 4.94 4.94 24 15,600 3.23 3.23 50520 12,906 4.78 4.78 21 13,650 4.37 4.37 61510 11,656 4.38 4.38 28 18,200 4.51 4.51 4160 10,359 4.05 4.05 2 1,300 9.15 9.15 5180
-10 9,781 3.99 3.99 1 650 2.20 2.20 9781-20 9,188 3.64 3.64 5 3,250 3.96 3.96 1838-30 9,672 3.43 3.43 8 5,200 3.39 3.39 1209-40 10,422 3.13 3.13 11 7,150 5.39 5.39 947-50 10,500 3.07 3.07 10 6,500 2.66 2.66 1050-60 10,094 2.98 2.98 0 -70 9,453 3.00 3.00 23 14,950 1.59 1.59 411-80 9,953 3.17 3.17 5 3,250 2.47 2.47 1991-90 9,234 3.58 3.58 27 17,550 4.50 4.50 342
-100 7,766 3.58 3.58 5 3,250 6.30 6.30 1553-110 6,750 3.44 3.44 1 650 12.95 12.95 6750-120 6,172 3.04 3.04 7 4,550 2.07 2.07 882-130 4,844 2.61 2.61 4 2,600 1.17 1.17 1211-140 3,453 2.17 2.17 2 1,300 2.20 2.20 1727-150 3,328 2.39 2.39 4 2,600 1.90 1.90 832-160 3,406 2.56 2.56 2 1,300 0.89 0.89 1703-170 3,063 3.07 3.07 3 1,950 0.41 0.41 1021-180 4,078 4.31 4.31 4 2,600 7.79 7.79 1020-190 5,188 5.42 5.42 7 4,550 1.79 1.79 741-200 5,484 5.39 5.39 0 -210 5,141 7.21 7.21 0 -220 4,188 9.84 9.84 9 5,850 14.64 14.64 465-230 2,688 10.04 10.04 1 650 10.03 10.03 2688-240 0 -250 5 3,250 10.58 10.58 0Total 464,645 7.03 6.67 716 465,400 8.49 8.04 649
Block Model CompositesTransvaal Block Model Validation by RL : Transvaal (fresh)
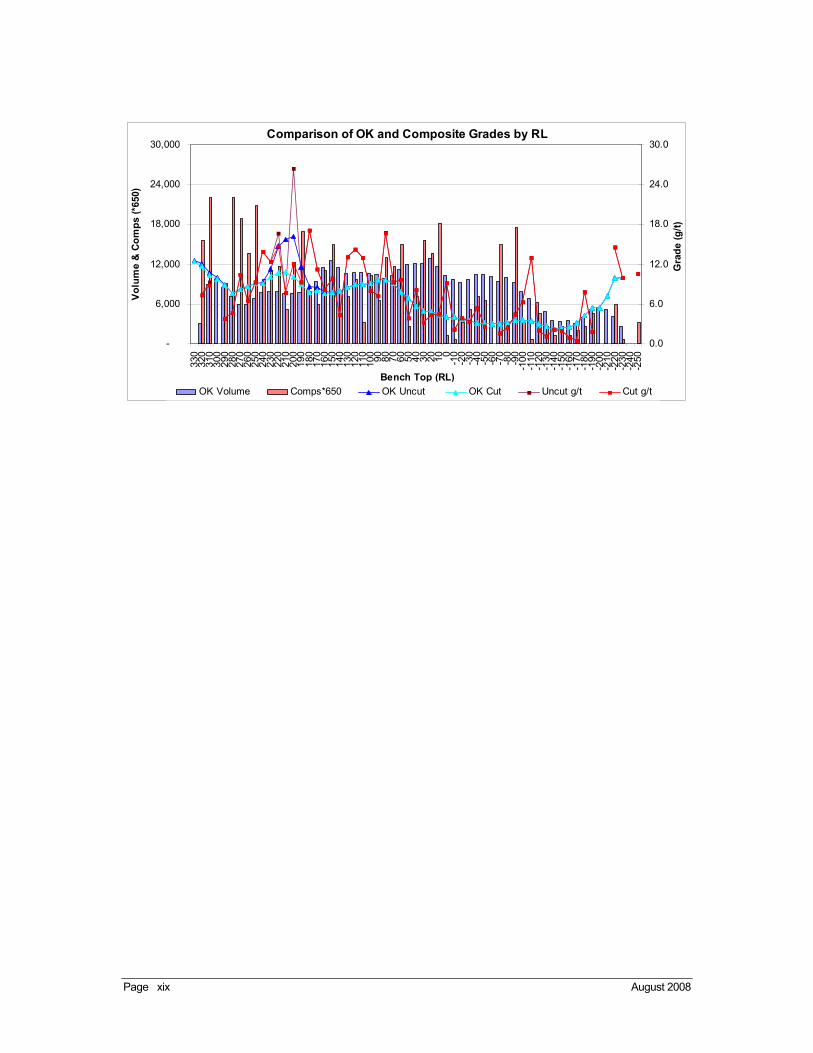
Page xix August 2008
Comparison of OK and Composite Grades by RL
-
6,000
12,000
18,000
24,000
30,000
330
320
310
300
290
280
270
260
250
240
230
220
210
200
190
180
170
160
150
140
130
120
110
100 90 80 70 60 50 40 30 20 10 0
-10
-20
-30
-40
-50
-60
-70
-80
-90
-100
-110
-120
-130
-140
-150
-160
-170
-180
-190
-200
-210
-220
-230
-240
-250
Bench Top (RL)
Vo
lum
e &
Co
mp
s (*
650)
0.0
6.0
12.0
18.0
24.0
30.0
Gra
de
(g/t
)
OK Volume Comps*650 OK Uncut OK Cut Uncut g/t Cut g/t

Page xx August 2008
Appendix 3
Transvaal Gold Project
Statistics and Log Probability Plots

Page xxi August 2008
Parameter Wireframe Object Number
1 3 4 5 7 9 10 12
Number 82 46 27 216 9 30 5 78
Minimum 0.06 0.005 0.005 0.005 0.32 0.04 0.08 0.2
Maximum 14.20 16.00 3.74 23.00 40.50 9.40 3.62 60.00
Mean 2.20 2.47 0.90 2.24 6.60 2.40 2.02 3.72
Median 1.50 0.94 0.65 1.15 2.58 1.40 1.57 1.14
Std Dev 2.28 3.39 0.86 3.44 12.79 2.28 1.61 7.87
Variance 5.21 11.51 0.74 11.83 163.59 5.22 2.59 61.88
Coeff Var 1.04 1.37 0.95 1.54 1.94 0.95 0.80 2.11
Percentiles
10 0.54 0.11 0.03 0.33 0.32 0.52 0.08 0.40
20 0.72 0.34 0.14 0.50 0.74 0.80 0.08 0.52
30 0.89 0.66 0.35 0.68 1.35 0.90 0.31 0.67
40 1.18 0.76 0.51 0.87 2.03 1.18 0.54 0.92
50 1.50 0.94 0.65 1.15 2.58 1.40 1.57 1.14
60 1.84 1.43 0.86 1.54 2.82 1.96 2.60 1.74
70 2.28 2.04 1.16 2.10 2.88 2.86 2.93 2.37
80 2.84 3.29 1.40 2.66 3.46 3.60 3.25 4.22
90 5.17 7.51 1.89 4.79 8.73 4.94 3.44 8.86
95 6.24 9.40 2.28 8.26 24.62 7.16 3.53 13.20
97.5 7.29 10.19 2.78 13.40 32.56 8.77 3.57 19.71
99 10.15 13.38 3.36 19.89 37.32 9.15 3.60 33.09
Cut Statistics
Top Cut Grade 100 100 100 100 35 100 100 26
No. Samples Cut 0 0 0 0 1 0 0 1
Cut Mean 2.20 2.47 0.90 2.24 5.99 2.40 2.02 3.24
All Upper Saprolite Statistics.

Page xxii August 2008
Parameter Wireframe Object Number
1 3 4 5 7 8 9 10 11 12
Number 98 195 98 1655 154 27 414 459 18 61
Minimum 0.005 0.05 0.005 0.005 0.005 0.48 0.04 0.01 0.12 0.02
Maximum 48.50 29.20 36.00 305.00 111.00 5.60 152.00 52.82 24.80 33.70
Mean 2.87 3.78 3.56 3.25 6.90 1.67 4.26 3.95 5.01 2.43
Median 1.17 1.36 1.24 1.46 2.48 1.31 1.62 1.37 0.78 0.79
Std Dev 5.88 5.20 6.56 9.14 13.04 1.25 10.23 7.69 8.33 5.45
Variance 34.54 27.03 43.02 83.51 170.08 1.55 104.59 59.05 69.31 29.70
Coeff Var 2.05 1.38 1.84 2.82 1.89 0.75 2.40 1.95 1.66 2.25
Percentiles
10 0.25 0.36 0.31 0.39 0.48 0.60 0.39 0.24 0.24 0.23
20 0.46 0.60 0.55 0.62 0.67 0.77 0.60 0.50 0.53 0.52
30 0.70 0.79 0.71 0.84 0.90 0.80 0.80 0.71 0.63 0.60
40 0.97 1.06 0.94 1.12 1.44 0.99 1.13 1.00 0.71 0.69
50 1.17 1.36 1.24 1.46 2.48 1.31 1.62 1.37 0.78 0.79
60 1.61 2.06 1.89 1.93 4.17 1.49 2.19 1.96 0.80 1.03
70 1.98 3.26 2.59 2.69 6.14 1.91 3.13 2.88 1.02 1.38
80 3.77 6.23 4.08 3.93 9.80 2.00 5.21 4.26 7.65 2.16
90 6.04 10.85 7.31 7.22 15.76 3.42 8.89 9.04 18.98 2.73
95 7.67 14.68 14.40 11.00 25.55 4.10 16.79 15.87 20.57 12.48
97.5 15.46 17.53 27.15 15.57 30.99 4.63 23.83 31.75 22.69 18.16
99 25.08 25.02 35.31 22.38 61.26 5.21 34.33 44.44 23.95 26.69
Cut Statistics
Top Cut Grade 25 100 25 35 35 100 35 40 100 15
No. Samples Cut 1 0 3 9 3 0 5 6 0 2
Cut Mean 2.73 3.78 3.36 3.03 6.20 1.67 3.88 3.84 5.01 2.08
All Lower Saprolite Statistics.

Page xxiii August 2008
Parameter Wireframe Object Number
1 3 4 5 7 8 9 10 11 12
Number 189 145 576 1538 120 58 339 371 89 36
Minimum 0.005 0.02 0.005 0.005 0.03 0.02 0.04 0.076 0.005 0.201
Maximum 22.07 60.30 62.00 155.00 39.30 10.30 46.84 56.06 65.00 25.50
Mean 2.13 5.67 4.45 3.09 7.54 1.81 2.30 4.48 4.19 2.04
Median 1.27 2.33 1.43 1.50 3.41 1.01 0.96 1.45 0.92 1.08
Std Dev 2.85 8.25 7.40 7.23 9.55 2.20 4.16 8.45 9.84 4.15
Variance 8.10 68.09 54.74 52.25 91.28 4.83 17.31 71.42 96.87 17.24
Coeff Var 1.34 1.46 1.70 2.34 1.27 1.22 1.81 1.89 2.35 2.04
Percentiles
10 0.01 0.40 0.44 0.40 0.55 0.16 0.32 0.35 0.15 0.46
20 0.38 0.70 0.60 0.61 0.78 0.55 0.48 0.58 0.45 0.56
30 0.67 1.13 0.80 0.84 1.21 0.71 0.59 0.73 0.61 0.64
40 0.90 1.50 1.01 1.12 1.80 0.86 0.74 1.02 0.70 0.91
50 1.27 2.33 1.43 1.50 3.41 1.01 0.96 1.45 0.92 1.08
60 1.65 3.91 2.07 1.90 4.68 1.18 1.22 2.02 1.44 1.20
70 2.10 5.81 3.08 2.55 7.89 1.59 1.80 2.76 1.93 1.56
80 3.32 9.35 5.79 3.74 13.40 2.66 2.63 4.27 3.08 2.23
90 4.81 15.40 11.54 6.10 22.10 3.98 4.94 11.77 10.61 2.97
95 7.27 21.28 20.12 9.81 28.90 6.11 8.99 23.57 18.93 3.80
97.5 8.82 26.69 27.84 15.85 31.60 8.63 13.11 30.81 27.05 7.05
99 11.90 33.73 36.94 25.43 38.44 10.08 17.05 44.47 52.72 18.12
Cut Statistics
Top Cut Grade 100 30 40 30 100 100 26 30 30 100
No. Samples Cut 0 2 4 10 0 0 1 11 2 0
Cut Mean 2.13 5.59 4.39 2.84 7.54 1.81 2.25 4.15 3.65 2.04
All Saprock Statistics

Page xxiv August 2008
Parameter Wireframe Object Number
1 3 4 5 7 8 9 10 11
Number 432 749 1149 2053 59 118 622 710 101
Minimum 0.005 0.005 0.005 0.005 0.162 0.005 0.005 0.049 0.005
Maximum 25.60 43.60 60.44 106.33 30.11 275.50 94.60 204.74 100.00
Mean 2.54 6.24 5.64 2.55 5.23 8.52 4.36 8.78 6.73
Median 1.28 3.39 2.28 1.28 2.33 2.00 1.89 4.30 1.69
Std Dev 3.51 7.04 7.84 5.31 5.92 26.81 7.45 14.05 13.53
Variance 12.31 49.52 61.44 28.22 35.01 719.01 55.52 197.45 182.94
Coeff Var 1.38 1.13 1.41 2.08 1.13 3.15 1.71 1.60 2.01
Percentiles
10 0.39 0.42 0.52 0.41 0.50 0.33 0.43 0.69 0.38
20 0.62 0.70 0.70 0.61 0.74 0.69 0.66 1.23 0.61
30 0.80 1.03 0.99 0.80 0.97 0.92 0.98 1.86 1.01
40 0.98 1.81 1.49 1.00 1.18 1.30 1.33 2.78 1.34
50 1.28 3.39 2.28 1.28 2.33 2.00 1.89 4.30 1.69
60 1.59 5.28 3.39 1.62 4.05 2.56 2.79 6.12 2.83
70 2.30 8.09 5.60 2.13 8.70 5.18 3.66 9.05 4.55
80 3.39 11.40 9.18 3.01 9.50 8.42 5.79 13.20 8.85
90 6.27 16.67 15.10 5.05 12.91 20.13 10.52 21.51 17.23
95 9.58 20.00 22.11 8.07 16.51 28.17 16.09 31.63 25.26
97.5 12.24 23.04 28.06 13.54 16.71 47.57 22.67 38.65 37.54
99 18.89 27.64 37.03 20.06 22.26 51.19 35.92 52.16 65.60
Cut Statistics
Top Cut Grade 100 100 50 40 100 30 40 50 30
No. Samples Cut 0 0 2 6 0 5 5 7
Cut Mean 2.54 6.24 5.63 2.46 5.23 6.07 4.22 8.32 6.73
All Fresh Statistics

Page xxv August 2008
Parameter Wireframe Object Number
2 6 13 14 15
Number 30 135 96 32 178
Minimum 0.005 0.005 0.06 0.28 0.005
Maximum 10.30 35.50 81.00 30.80 20.90
Mean 2.43 3.14 4.33 5.64 1.59
Median 1.76 1.38 0.86 2.04 0.97
Std Dev 2.39 4.90 12.13 7.43 2.17
Variance 5.72 24.00 147.14 55.21 4.73
Coeff Var 0.99 1.56 2.80 1.32 1.37
Percentiles
10 0.34 0.38 0.22 0.45 0.29
20 0.50 0.60 0.48 0.68 0.49
30 0.74 0.83 0.62 1.28 0.60
40 1.40 1.10 0.70 1.80 0.76
50 1.76 1.38 0.86 2.04 0.97
60 2.30 1.90 1.05 2.39 1.19
70 2.59 2.66 1.88 4.94 1.55
80 3.46 4.22 2.76 8.38 2.04
90 5.01 6.96 6.50 16.02 3.04
95 7.11 11.80 20.82 19.48 5.24
97.5 8.88 17.68 47.48 23.76 7.26
99 9.73 22.51 57.00 27.98 9.71
Cut Statistics
Top Cut Grade 100 25 20 20 100
No. Samples Cut 0 1 5 2 0
Cut Mean 2.43 3.06 2.68 5.24 1.59
Statistics of Entire Objects

Page xxvi August 2008
Log Probabilty Plots - Upper Saprolite

Page xxvii August 2008
Log Probabilty Plots - Lower Saprolite
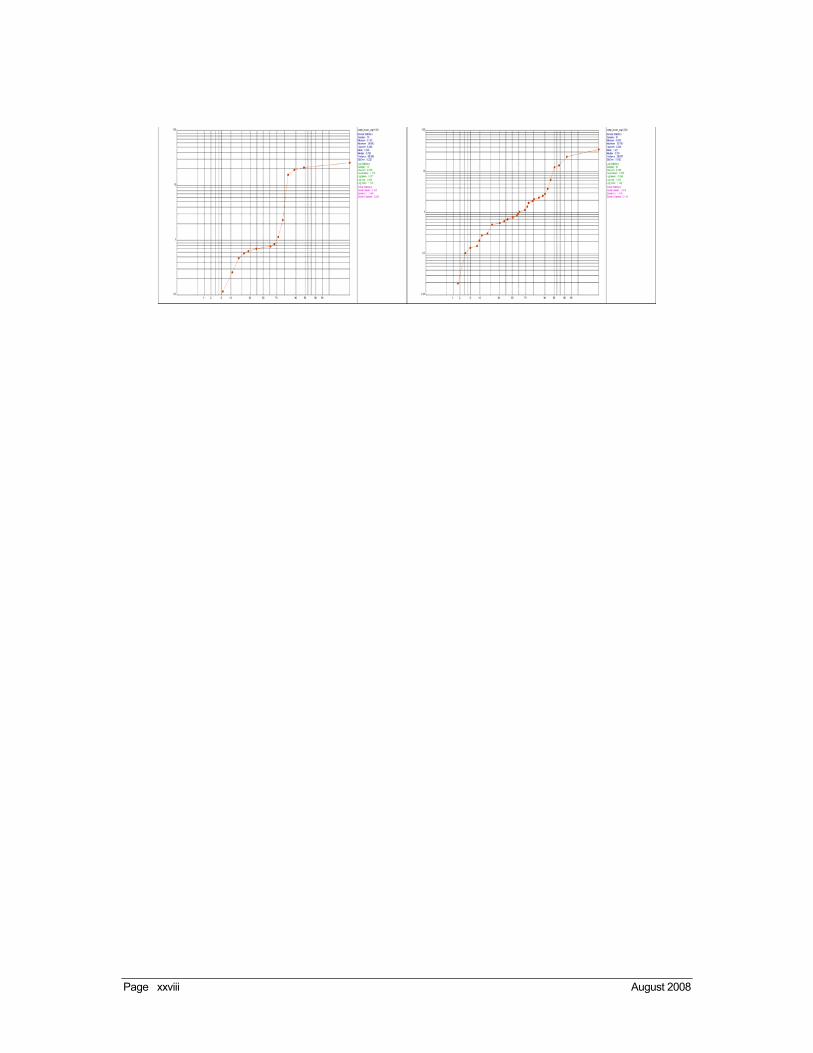
Page xxviii August 2008

Page xxix August 2008
Log Probabilty Plots - Saprock

Page xxx August 2008

Page xxxi August 2008
Log Probabilty Plots - Fresh

Page xxxii August 2008

Page xxxiii August 2008
Log Probabilty Plots – Entire Objects
Page xxxiv August 2008
Appendix 4
Transvaal Gold Project
June 2008 Variography
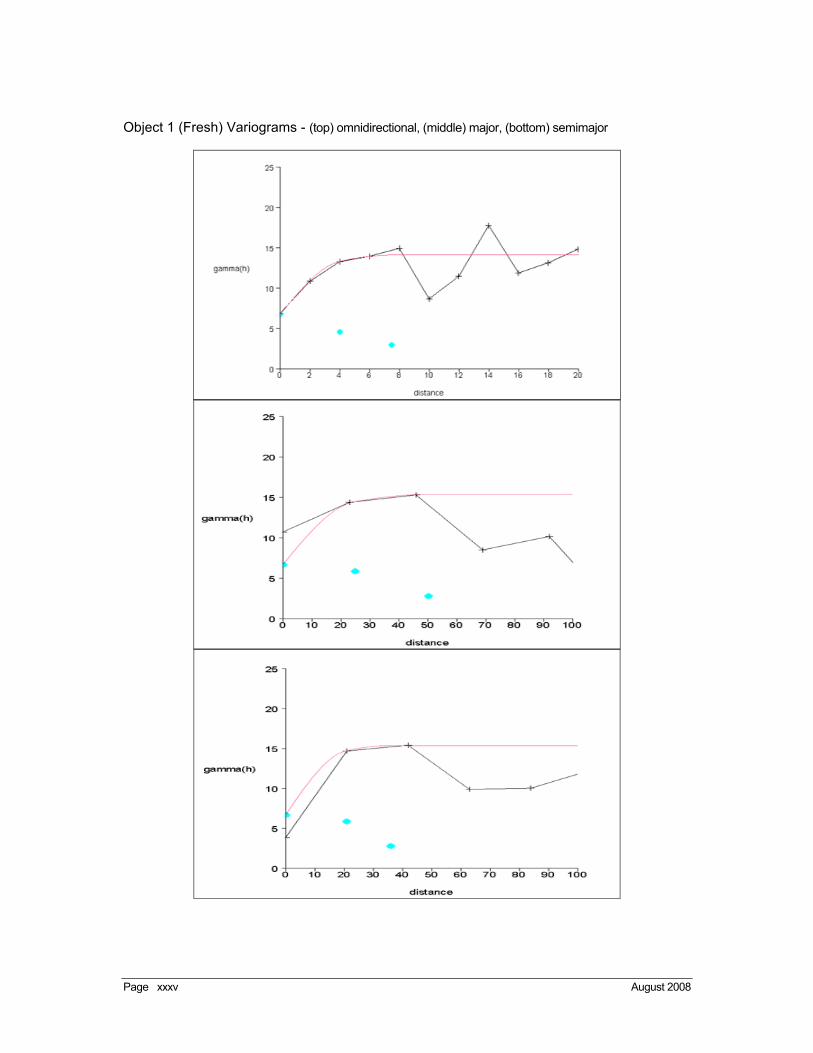
Page xxxv August 2008
Object 1 (Fresh) Variograms - (top) omnidirectional, (middle) major, (bottom) semimajor

Page xxxvi August 2008
Object 3 (Fresh) Variograms - (top) omnidirectional, (middle) major, (bottom) semimajor

Page xxxvii August 2008
Object 10 (Fresh) Variograms - (top) omnidirectional, (middle) major, (bottom) semimajor

Page xxxviii August 2008
Appendix 5
Transvaal Gold Project
Bulk Density Testwork

Page xxxix August 2008
The following bulk density information was supplied to Runge by SBM.
Specific Gravity Determinations
Transvaal Deposit
Gordon Scantlebury
Exploration Geologist
March, 2008
A study was undertaken between November, 2007 and March, 2008 to determine the specific gravities of the waste and ore rocks for the Transvaal deposit. The study included:
• a search of historical reports to determine what SGs had been used in past mining of the deposit; • classical SG determinations of grab samples from the pits; • classical SG determinations of diamond core samples; • moisture content and pycnometer determinations of weathered waste rock from diamond drilling (SGS labs); and • pycnometer determinations from diamond drilling of the eastern lode system (AMMTEC labs).
The results of the classical specific gravity determinations are given in Appendix 1 . Pycnometer specific gravity determinations obtained from the two labs are given in Appendix 2. The results from the various data sources including the specific gravity figures used by Reynolds mining are summarized in Table 1 below.
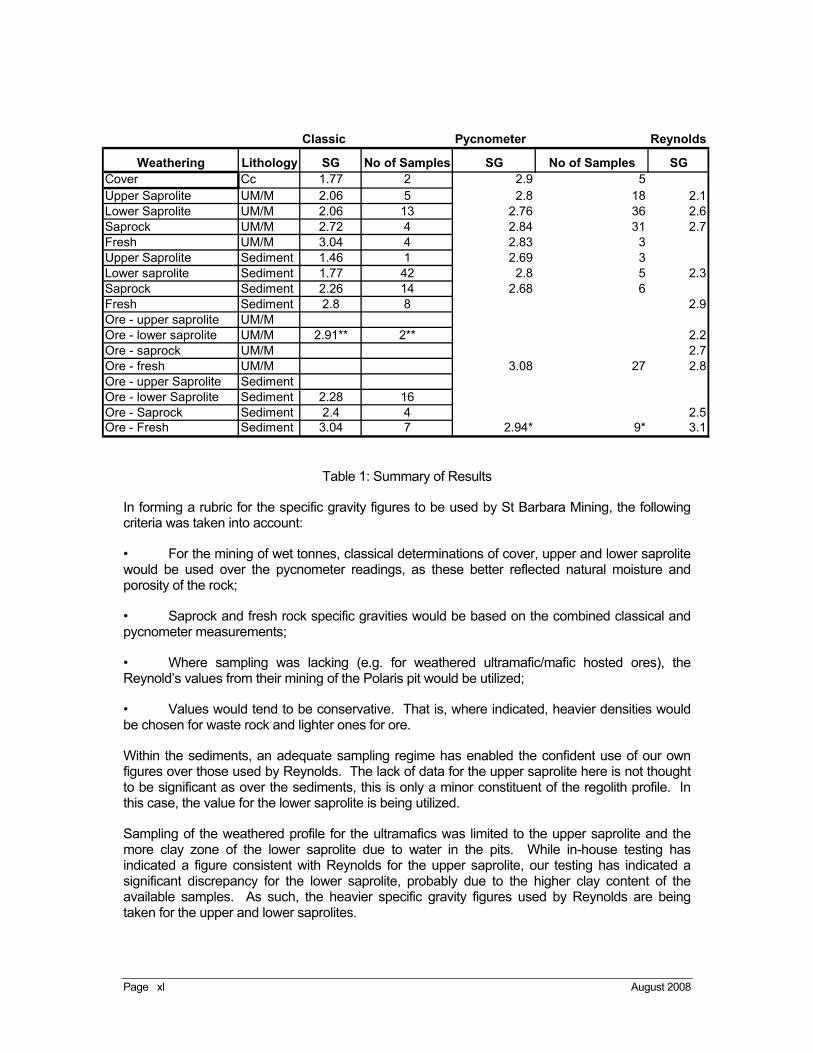
Page xl August 2008
Table 1: Summary of Results
In forming a rubric for the specific gravity figures to be used by St Barbara Mining, the following criteria was taken into account:
• For the mining of wet tonnes, classical determinations of cover, upper and lower saprolite would be used over the pycnometer readings, as these better reflected natural moisture and porosity of the rock;
• Saprock and fresh rock specific gravities would be based on the combined classical and pycnometer measurements;
• Where sampling was lacking (e.g. for weathered ultramafic/mafic hosted ores), the Reynold’s values from their mining of the Polaris pit would be utilized;
• Values would tend to be conservative. That is, where indicated, heavier densities would be chosen for waste rock and lighter ones for ore.
Within the sediments, an adequate sampling regime has enabled the confident use of our own figures over those used by Reynolds. The lack of data for the upper saprolite here is not thought to be significant as over the sediments, this is only a minor constituent of the regolith profile. In this case, the value for the lower saprolite is being utilized.
Sampling of the weathered profile for the ultramafics was limited to the upper saprolite and the more clay zone of the lower saprolite due to water in the pits. While in-house testing has indicated a figure consistent with Reynolds for the upper saprolite, our testing has indicated a significant discrepancy for the lower saprolite, probably due to the higher clay content of the available samples. As such, the heavier specific gravity figures used by Reynolds are being taken for the upper and lower saprolites.
Classic Pycnometer Reynolds
Weathering Lithology SG No of Samples SG No of Samples SGCover Cc 1.77 2 2.9 5Upper Saprolite UM/M 2.06 5 2.8 18 2.1Lower Saprolite UM/M 2.06 13 2.76 36 2.6Saprock UM/M 2.72 4 2.84 31 2.7Fresh UM/M 3.04 4 2.83 3Upper Saprolite Sediment 1.46 1 2.69 3Lower saprolite Sediment 1.77 42 2.8 5 2.3Saprock Sediment 2.26 14 2.68 6Fresh Sediment 2.8 8 2.9Ore - upper saprolite UM/MOre - lower saprolite UM/M 2.91** 2** 2.2Ore - saprock UM/M 2.7Ore - fresh UM/M 3.08 27 2.8Ore - upper Saprolite SedimentOre - lower Saprolite Sediment 2.28 16Ore - Saprock Sediment 2.4 4 2.5Ore - Fresh Sediment 3.04 7 2.94* 9* 3.1

Page xli August 2008
Table 2 below gives the rubric of recommended specific gravities to be used for mining at the Transvaal deposit by St Barbara.
WASTEWeathering Lithology Specific GravityCover Cc 1.77 classicalUpper Saprolite UM/M 2.1 (Reynolds)Lower Saprolite UM/M 2.6 (Reynolds)Saprock UM/M 2.83 classical +pycnometerFresh UM/M 2.95 classical +pycnometerUpper Saprolite Sediment 1.77 (use Ls value)Lower saprolite Sediment 1.77 classicalSaprock Sediment 2.4 classical +pycnometerFresh Sediment 2.8 classical
OREUpper Saprolite UM/M 2.2 (Reynolds)Lower Saprolite UM/M 2.2 (Reynolds)Saprock UM/M 2.7 (Reynolds)Fresh UM/M 3.08 pycnometerUpper Saprolite Sediment (west) 2.28 classicalLower saprolite Sediment (west) 2.28 classicalSaprock Sediment (west) 2.4 classicalFresh Sediment (west) 3.04 classical
Fresh Sediment (east) 2.94 pycnometer
Table 2: Specific Gravity Rubric

Page xlii August 2008
Appendix 6
Transvaal Gold Project
List of Omitted Holes
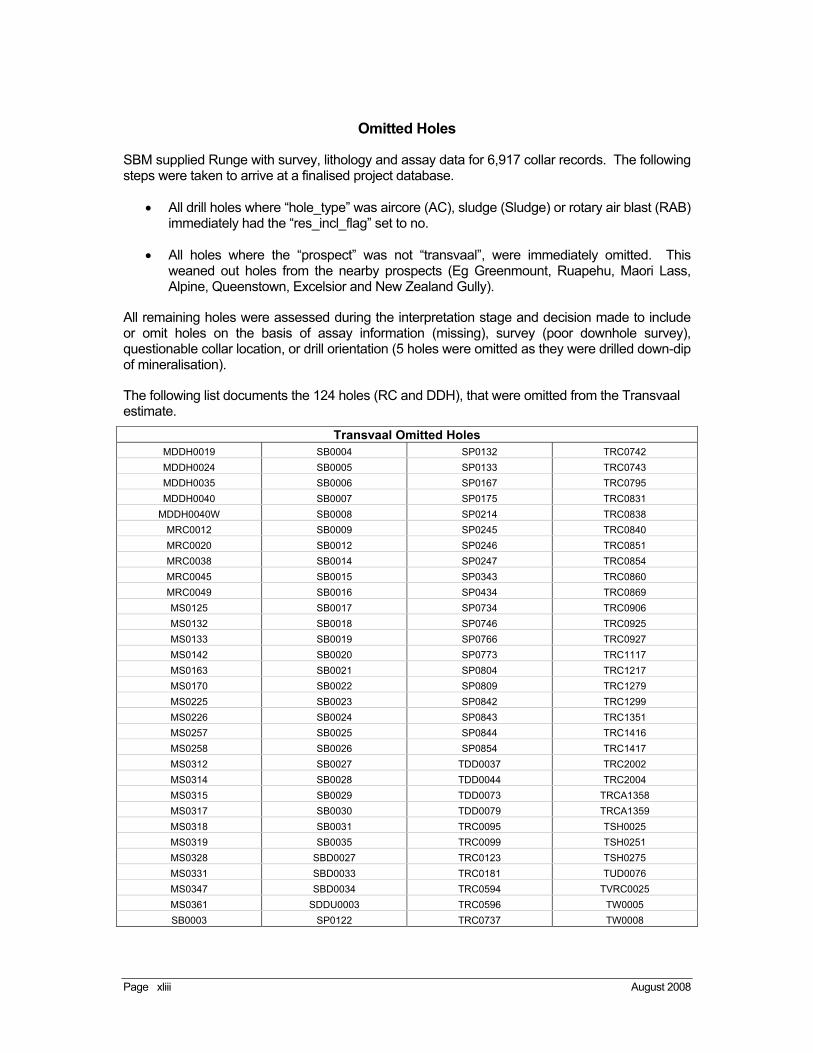
Page xliii August 2008
Omitted Holes
SBM supplied Runge with survey, lithology and assay data for 6,917 collar records. The following steps were taken to arrive at a finalised project database.
All drill holes where “hole_type” was aircore (AC), sludge (Sludge) or rotary air blast (RAB) immediately had the “res_incl_flag” set to no.
All holes where the “prospect” was not “transvaal”, were immediately omitted. This weaned out holes from the nearby prospects (Eg Greenmount, Ruapehu, Maori Lass, Alpine, Queenstown, Excelsior and New Zealand Gully).
All remaining holes were assessed during the interpretation stage and decision made to include or omit holes on the basis of assay information (missing), survey (poor downhole survey), questionable collar location, or drill orientation (5 holes were omitted as they were drilled down-dip of mineralisation).
The following list documents the 124 holes (RC and DDH), that were omitted from the Transvaal estimate.
Transvaal Omitted HolesMDDH0019 SB0004 SP0132 TRC0742
MDDH0024 SB0005 SP0133 TRC0743
MDDH0035 SB0006 SP0167 TRC0795
MDDH0040 SB0007 SP0175 TRC0831
MDDH0040W SB0008 SP0214 TRC0838
MRC0012 SB0009 SP0245 TRC0840
MRC0020 SB0012 SP0246 TRC0851
MRC0038 SB0014 SP0247 TRC0854
MRC0045 SB0015 SP0343 TRC0860
MRC0049 SB0016 SP0434 TRC0869
MS0125 SB0017 SP0734 TRC0906
MS0132 SB0018 SP0746 TRC0925
MS0133 SB0019 SP0766 TRC0927
MS0142 SB0020 SP0773 TRC1117
MS0163 SB0021 SP0804 TRC1217
MS0170 SB0022 SP0809 TRC1279
MS0225 SB0023 SP0842 TRC1299
MS0226 SB0024 SP0843 TRC1351
MS0257 SB0025 SP0844 TRC1416
MS0258 SB0026 SP0854 TRC1417
MS0312 SB0027 TDD0037 TRC2002
MS0314 SB0028 TDD0044 TRC2004
MS0315 SB0029 TDD0073 TRCA1358
MS0317 SB0030 TDD0079 TRCA1359
MS0318 SB0031 TRC0095 TSH0025
MS0319 SB0035 TRC0099 TSH0251
MS0328 SBD0027 TRC0123 TSH0275
MS0331 SBD0033 TRC0181 TUD0076
MS0347 SBD0034 TRC0594 TVRC0025
MS0361 SDDU0003 TRC0596 TW0005
SB0003 SP0122 TRC0737 TW0008

Page xliv August 2008
Appendix 7
Transvaal Gold Project
Surpac String File Descriptions
(All relevant files are included on the Compact Disc
Inside the back cover of this report)

Page xlv August 2008
TRANSVAAL GOLD PROJECT
DIRECTORIES -3DMs
transvaal_20080521.dtm -0.5 g/t Au resource wireframe umafic1.dtm -Ultramafic lithology wireframe botr1.dtm -bottom of colluvium wireframe bous1.dtm -bottom of upper saprolite wireframe boco1.dtm -bottom of complete oxidation
wireframe tofr1.dtm -top of fresh rock wireframe polaris_backfill1.dtm -backfill in Polaris pit aquarius_backfill1.dtm -backfill in Aquarius pit
-BModel
transvaal_20080611.mdl -resource block model Bmodel.zip -block model macros
-Data
transvaal_20080416.mdb -Access database Comps.zip -Composite string file of intercepts
-Nat_Surf & Workings topo_20080521.dtm -natural surface tv_drives1.dtm -transvaal UG development wireframe
-Reports&Spreadsheets
Transvaal_20080611 resource tables 1.0gpt economic cutoff.xls - Resource tables
The Transvaal Mineral Resource estimate was completed using Surpac Mining Software version 6.0.2 and 5.0M.