Embed Size (px)
Citation preview
'.
Record No. 1968/112
Mineral Processing in Australia
TIN
by
J. Ward
The information contained in this report has been obtained by the Department of National Development as part of the policy of the Commonwealth Government to assist in the exploration and development of mineral resources. It may not be published in any form or use in a company prospectus or statement without the permission in writing of the Director, Bureau of Mineral Resources, Geology and Geophysics.
"
SID/IMARY INTROIDCTION
CONTENTS
CURRENT POSITION of the DOMESTIC INIDSTRY
Mine Production Smelt~r Production Exports of Tin-in-Concentrates Imports of Tin Consumption
THE DOMESTIC TIN SMELTING INDUSTRY
Primary Tin Secondary Tin Associated Tin Smelters Pty Ltd
High cost of, local labour High cost of concentrates Diseconomies of scale Treatment of low-grade concentrates and refractory ores Restricted domestic market Uncertainty as to long-term reserve position
Page
IV. 1 •
1 •
2. 3. 4. 4. 5.
6.
6. 6. 7.
7. 7. 8. 8. 8. 9.
CONCLUSIONS 9.
TABLES
Table Table Table Table Table
FIGURES
1. 2. 3. 4. 5.
Salient statistics of the Australian Tin Industry 1963-1967 Mine Production by Company Exports of Tin-in-concentrates January-June 1968 Salient statistics 1967-1968 Australian Tin Reserves
in pocket at back
Figure 1. Australian Production of Tin, 1872-1967 Figure 2. Australian Trade in Tin, 1903-1967
..
-.~
IV
SUMMARY
The current position of the domestic tin industry is outlined with respect to mine production, smelter production, consumption, and trade in tin, and short-term projections of. these facets of the industry are made. The competi tive position of tin smelting in Australia vis a vis world smelters is discussed. The conclusion is reached that domestic smelting costs are such that refined tin of Australian origin is not competitive on world markets and that domestic smelting capaci ty will.b~. geared to mee:t local re'luirements, only.
, ..
-• MINERAL PROCESSING IN AUSTRALIA
TIN
by 0';
J. WARD
RECORD 1968/112
INTRODUCTION
Following Cabinet Decision No. 189 of 1 May 1968 an interdepartmental committee Gonsisting of representatives of the Department of Tra,de and Industry, Tre~sury, ~nd National Development, was set up to study t~e degree to which minerals produced in Australia are processed locally, and to exp,lore possibilities for further processing.
At the initial meeting of the Committee convened on 5 June 1968 it was decided to compile a preliminary review of the current position of mineral processing in Australia and to indicate those sectors where additional processing seemed fea~ible. The Bureau of Mineral Resources prepared a conspectus of minerals produced in quantity in Australia and amenable to processing. A short list of minerals warranting further study was suggested. At the Committee's second meeting held on 15 July 1968 it was decided that the next step should be the preparation of more detailed papers on tin, titanium and $alt processing.
This Record provides the relevant data concerni';ng the domestic tin industry.
CURRENT POSITION OF THE DOMESTIC INDUSTRY
Salient statistics for the domestic tin industry in recent years are given in Table 1.
. ' ~
.-
I'
2 •
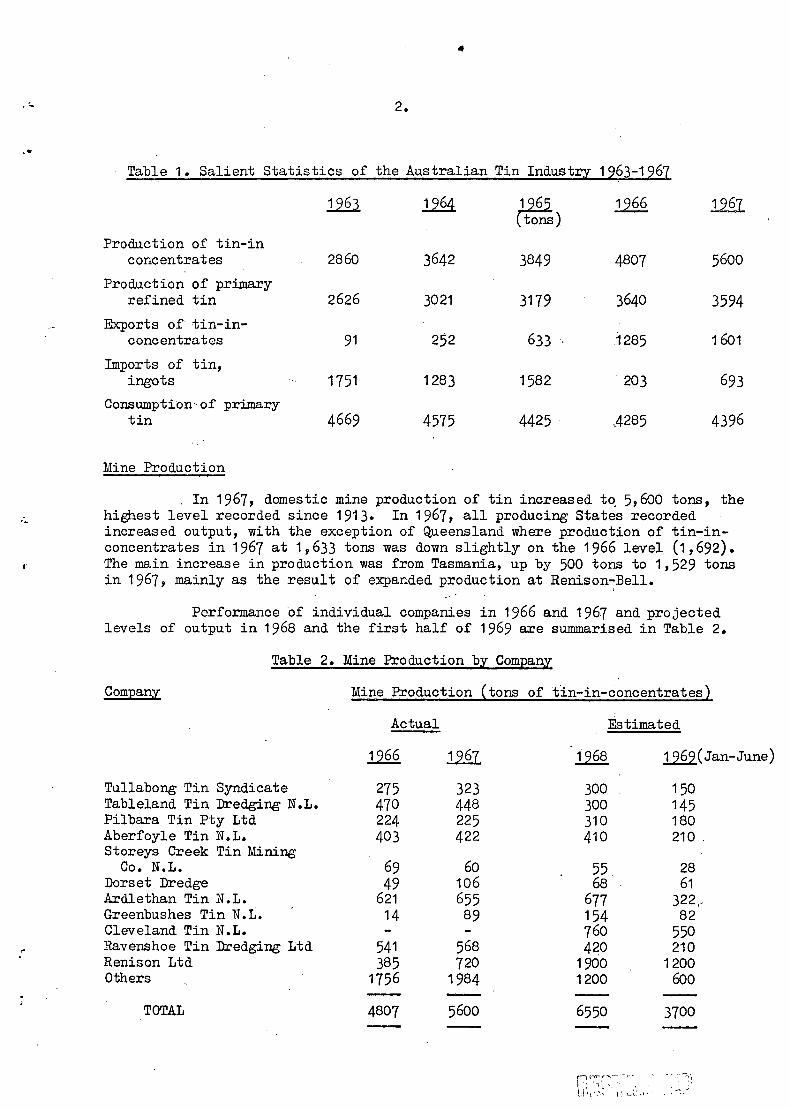
Table 1. Salient Statistics of the Australian Tin Industry 1963-1967
12.§l .12.§.1 Ct! 1966 12.§l tons)
Production of tin-in concentrates 2860 3642 3849 4807 5600
Production of primary refined tin 2626 3021 3179 3640 3594
Exports of tin-in-concentrates 91 252 633 ,1285 1601
Imports of tin, ingots 1751 1283 1582 ' 203 693
Consumption" of primary tin 4669 4575 4425 .,4285 4396
Mine Production
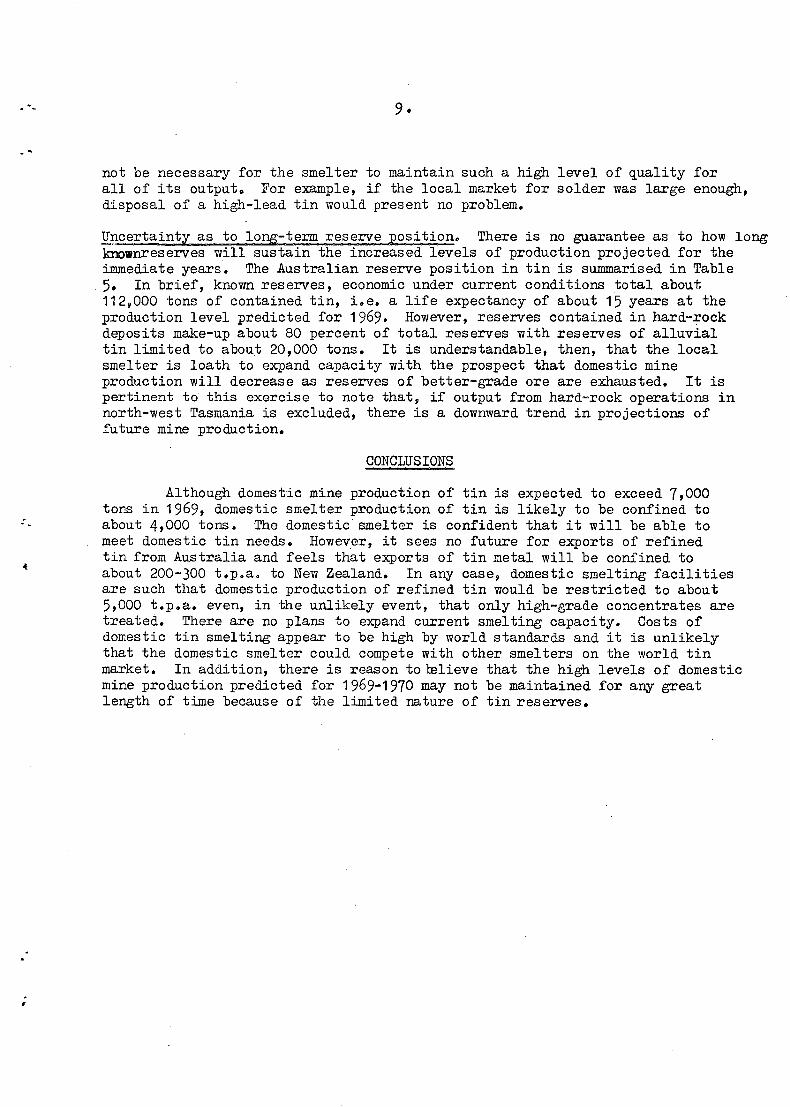
, In 1967, domestic mine production of tin increased t~ 5,600 tons, the highest level recorded since 1913. In 1967, all producing States recorded increased output, with the exception of Queensland where production of tin-inconcentrates in 1967 at 1,633 tons was down slightly on the 1966 level (1,692). The main increase in production was from Tasmania, up by 500 tons to 1,529 tons in 1967, mainly as the result of expanded production at Renison-;Bell.
Performance of individual companies in 1966 and 1967 and projected levels of output in 1968 and the first half of 1969 are summarised in Table 2.
Table 2. Mine Production bl ComEanl
Company Mine Production ~ tons of t'in-in-concentra t es }
Actual Estimated
1.2§ .12§l 1968 12.§2(Jan-June)
Tullabong Tin Syndicate 275 323 300 150 Tableland Tin Dredging N.L. 470 448 300 145 Pilbara Tin pty Ltd 224 225 310 180 Aberfoyle Tin N.L. 403 422 410 210 ' Storeys Creek Tin Mining
Co. N.L. 69 60 55. 28 Dorset Dredge 49 106 68 61 Ardlethan Tin N.L. 621 655 677 322,: Greenbushes Tin N.L. 14 89 154 82 Cleveland Tin N.L. 760 550 Ravenshoe Tin Dredging Ltd 541 568 4~0 210 Renison Ltd 385 720 1900 1200 Others 1756 1984 1200 600
TOTAL 4807 5600 6550 3700
nnT",;f'~~"-- ,~,
~ ! \ 1 ,~~' ;, :J~: \) " , ,.-
·"
~.
Estimates of domestic mine production for 1968 and the first half of 1969 have been revised upwards on the basis of current performance by Renison Ltd. In the fiscal years 1966/67 and 1967/68 Renison produced 543 tons and 1134 tons of tin-in-concentrates, respectively. However, recovery rates were barely above 40 percent and although the mill reached planned capacity of 1,000 t.p.d. of ore, planned tin production (1,750 - 2,000 t.p.a.) was not achieved because of the poor recovery. Most of the ore mined in 1966/67 and 1967/68 was produced from the company's Federal Lode. Recovery of cassiterite from the Federal Lode ore has been low'because of the very fine grain size of the cassiterite and because of the complex cassiterite-sulphide association. Ore from the Boulder Mine, Dreadnought and North Stebbins Lodes is more amenable to treatment. Some ore from the North Stebbins lode was fed to the mill from early July 1968 and the rate of recovery for the first four weeks of the 1968/69 year averaged about 60 percent. This is the highest ra~e of recovery attained in the new mil~ Production of tin-in-concentrates was 172 tons, an annual rate of production of the order of 2,000 tons. The comp&ny plans to further increase production from the Boulder Mine, Dreadnought ~nd North Stebbins lodes in 1968/69 to make up at least 50 percent of mill re'luirements. Ore from the more difficult Federal Lode will be correspondingly decreased until the problems of recovery from the latter orebody have bee~ overcome. The proportion of the two types of ore fed to the mill will h~ve a significant bearing on the production of tin-in-concentrates for the year.
It should be noted that increased production predicted in 1968 and 1969 is due wholly to higher estimates for Renison and Cleveland. In factp if these two major hard-rock operations were excluded, domestic mine production would show a downward trend.
Smelter Production
In 1967, domestic pr~duction of primary refined tin at 3,594 tons was marginally down on the 1966 l'evel. Although this was in part the result of reduced output associated with the commissioning of the new Sydney smelter of Associated Tin Smelters Pty Ltd, a more continuing obstacle t,o increased production appears to be the decreasing proportion o~ high-grade alluvial material in the concentrates available to the smelter. Domestic:production of refined tin for the six months January-June 1968 was reduced :to 1,645 tons, Le. an annual rate of about 3,300, tons. Poor production ~~sults from the smelter during this period hav~ been, due mainly to the diff~culty experienced in obtaining a suitable blend of feed from the miscellaneou~ concentrates available.
The smelter advises t4at. "Currently our number 1 objective is to purchase metal in concentrates to meet the Australia/New Zealand. demand, which we est{mate as under:
Australian Iron and Steel Pty Ltd Other Aus tralian New Zealand
, ,-, i
2',400 tons . 1,350 :tons
200 tons
39950 tons
To cover these re'luirements we are currently committed to various producers
,"
Port
Sydney
'-
to buy concentrates at the rate of 6,070 tons per annum which, at an average grade of 66 %, would contain slightly over 4,000 tons of tin".
~orts of Tin-in-Concentrates
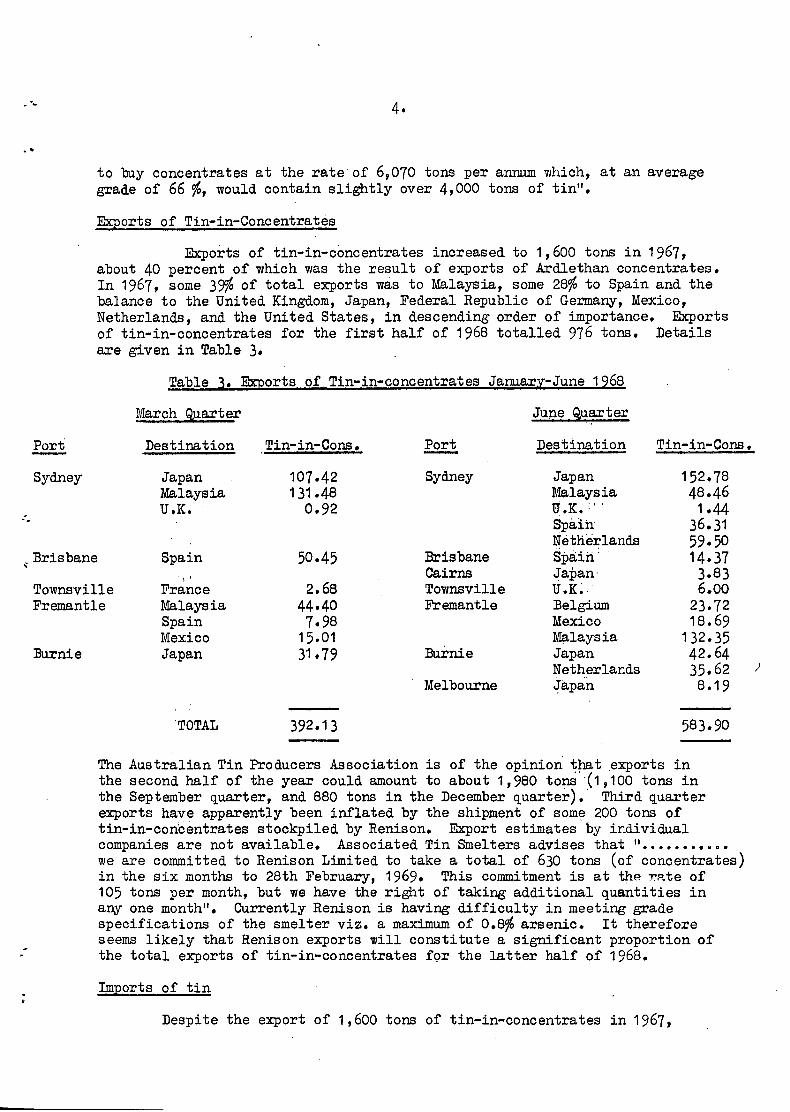
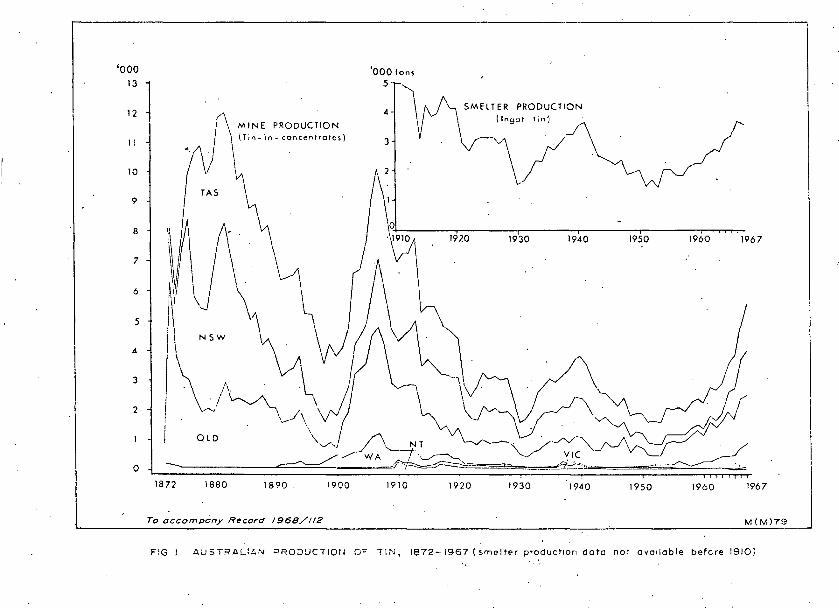
Exports of tin-in-concentrates increased to 1,600 tons in 1967, about 40 percent of which was the result of exports of Ardlethan concentrates. In 1967, some 39% of total exports was to Malaysia, some 28% to Spain and the balance to the United Kingdom, Japan, Federal Republic of Germany, Mexico, Netherlands, and the United States, in descending order of importance. Exports of tin-in-concentrates for the first half of 1968 totalled 976 tons. Details are given in Table 3.
Table 3. Exports of Tin-in-concentrates January-June 1968
March Q.uarter June Q.u~ter
Destination Tin-in-Cons • Port Destination Tin-in-Cons.
Japan 107.42 Sydney Japan 152.78 Malaysia 131.48 Malaysia 48e46 U.K. 0.92 U.K. :' , 1.44
Spa.in 36031 Netherlands 59.50
. :Brisbane Spain 50.45 :Brisbane Spaih: 14.37 , I'
Cairns ~apan" 3.83 Townsville France 2.68 Townsville U.K~ 6.00 Fremantle Malaysia 44.40 Fremantle :Belgium 23.72
:Burnie
Spain 7.98 Mexico 18.69 Mexico 15.01 Malaysia 132.35 Japan 31.79 :Burnie Japan 42.64
Netherlands 35.62 Melbourne -!apan 8.19
'TOTAL 392.13 583.90
The Australian Tin Producers Association is of the opinion that exports in the second half of the year could amount to about 1,980 tonS' (1,100 tons in the September quarter, and 880 tons in the December quarter)." Third quarter exports have apparently been inflated by the shipment of some 200 tons of tin-in-con;cEmtrates stockpiled by Renison. Export estimates by individual companies are not available. Associated Tin Smelters advises that " ••••••••••• we are committed to Renison Limited to take a total of 630 tons (of concentrates) in the six months to 28th February, 1969. This commitment is at th~ ~~te of 105 tons per month, but we have the right of taking additional quantities in any one month". Currently Renison is having difficulty in meeting grade specifications of the smelter viz. a maximum of 0.8% arsenic. It therefore seems likely that Renison exports will constitute a significant proportion of the total exports of tin-in-concentrates for the latter half of 1968.
Im120rts of tin
Despi te the export of 1,600 tons of tin-in-concentra tes in 1967,
)
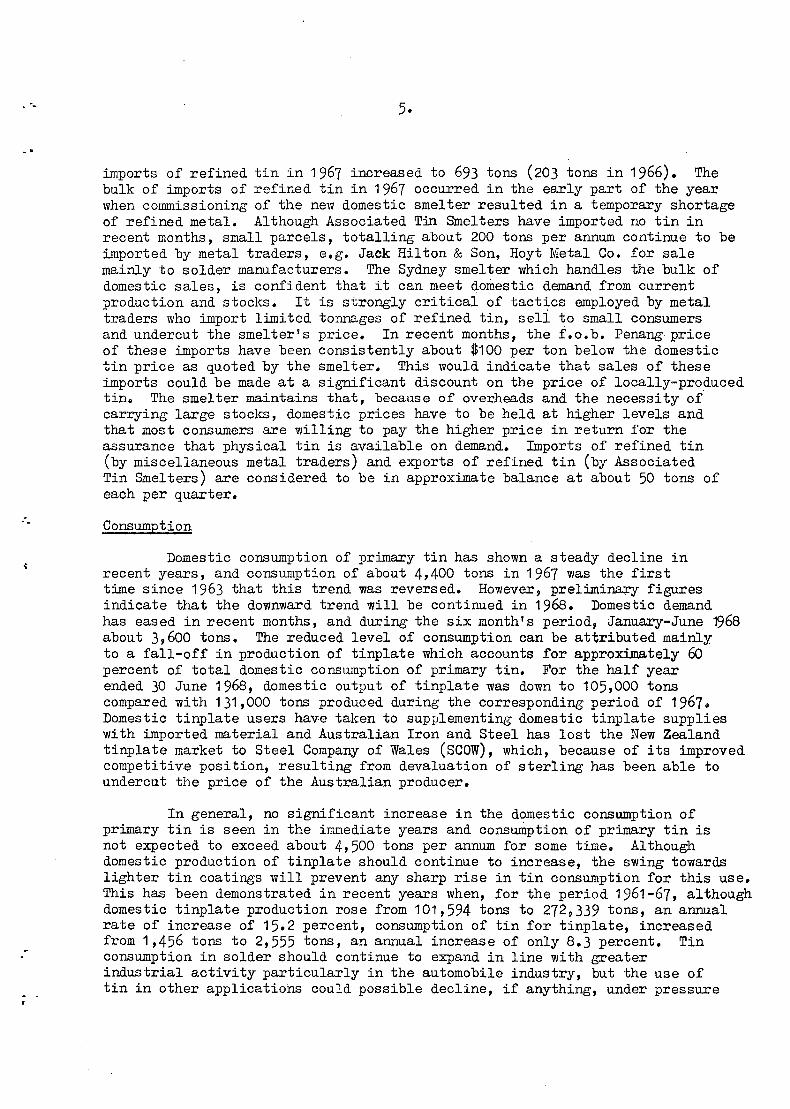
· . imports of refined tin in 1967 increased to 693 tons (203 tons in 1966). The bulk of imports of refined tin in 1967 occurred in the early part of the year when commissioning of the new domestic smelter resulted in a temporary shortage of refined metal. Although Associated Tin Smelters have imported no tin in recent months, small parcels, totalling about 200 tons per annum continue to be imported by metal traders, e.g. Jack Hilton & Son, Hoyt Metal Co. for sale mainly to solder manufacturers. The Sydney smelter which handles the bulk of domestic sales, is confident that it can meet domestic demand from current production and stocks. It is strongly critical of tactics employed by metal traders who import limited tonnages of refined tin, seli to small consumers and undercut the smelter's price. In recent months, the f.o.b. Penangprice of these imports have been consistently about $100 per ton below the domestic tin price as quoted by the smelter. This would indicate that sales of these imports could be made at a significant discount on the price of locally-produced tino The smelter maintains that, because of overheads and the necessity of carrying large stocks, domestic prices have to be held at higher levels and that most consumers are willing to pay the higher price in return for the assurance that physical tin is available on demand. Imports of refined tin (by miscellaneous metal traders) and exports of refined tin (by Associated Tin Smelters) are considered to be in approximate balance at about 50 tons of each per quarter.
Consumption
Domestic consumption of primary tin has shown a steady decline in recent years, and consumption of about 4,400 tons in 1967 was the first time since 1963 that this trend was reversed. However, prelimi~ figures indicate that the downward trend will be continued in 1968. Domestic demand has eased in recent months, and during the six month's period, January-June ~68 about 3,600 tons. The reduced level of consumption can be attributed mainly to a fall-off in production of tinplate which accounts for approximately 60 percent of total domestic consumption of primary tin. For the half year ended 30 June 1968, domestic output of tinplate was down to 105,000 tons compared with 131,000 tons produced during the corresponding period of 19670 Domestic tinplate users have taken to supplementing domestic tinplate supplies with imported material and Australian Iron and Steel has lost the New Zealand tinplate market to Steel Company of Wales (SCOW), which, because of its improved competitive position, resulting from devaluation of sterling has been able to undercut the price of the Australian producer.
In general, no significant increase in the domestic consumption of primary tin is seen in the immediate years and consumption of primary tin is not expected to exceed about 4,500 tons per annum for some time o Although domestic production of tinplate should continue to increase, the swing towards lighter tin coatings will prevent any sharp rise in tin consumption for this use. This has been demonstrated in recent years when, for the period 1961-67, although domestic tinplate production rose from 101,594 tons to 272,339 tons, an annual rate of increase of 15.2 percent, consumption of tin for tinplate, increased from 1,456 tons to 2,555 tons, an annual increase of only 8.3 percent. Tin consumption in solder should continue to expand in line with greater industrial activity particularly in the automobile industry, but the use of tin in other applications could possible decline, if anything, under pressure
. .
:
. r
6.
from cheaper and more efficient substitutes and the increasil1:B' use of scrap metal •
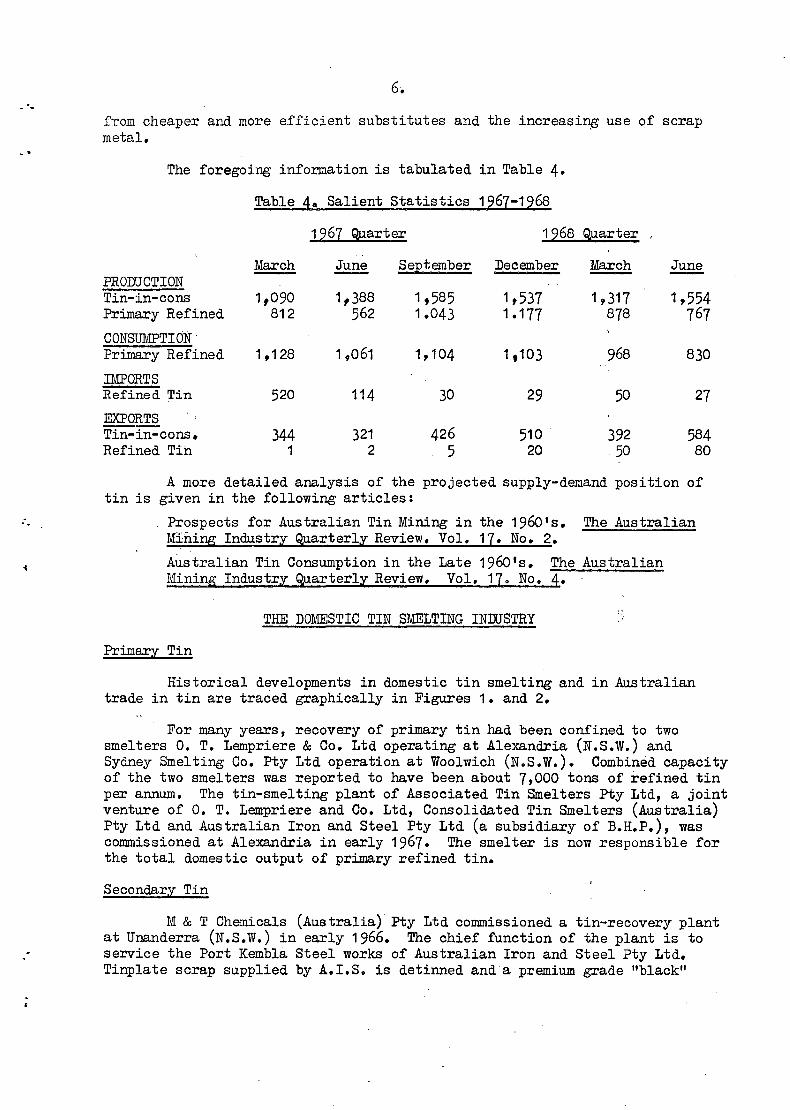
The foregoing information is tabulated in Table 4.
Table 4. Salient Statistics 1967-1968
1967 Q)larter 1968 Q,uarter I
PRODUCTION Tin-in-conS Primary Refined
CONSUMPTION· Primary Refined
IMPORTS Refined Tin
EXPORTS Tin-in-cons. Refined Tin
March
1,090 812
1,128
520
344 1
June -1,388
562
1,061
114
321 2
September December
1,585 1.043
1,104
30
426 5
1,537 1.177
1,103
29
510 20
March
1,317 878
968
50
392 50
June
1,554 767
830
27
584 80
A more detailed analysis of the projected supply-demand position of tin is given in the following articles:
Prospects for Australian Tin Mining in the 1960's. The Australian Mining Industry Q,uarterly Review. Vol. 17. No.2.
Australian Tin Consumption in the Late 1960's. The Australian Mining Industry Q,uarterly Review. Vol. 17. No.4.
THE DOMESTIC TIN SMELTING INIDSTRY
Primary Tin
Historical developments in domestic tin smelting and in Australian trade in tin are traced graphically in Figures 1. and 2.
For many years, recovery of primary tin had been confined to two smelters O. T. Lempriere & Co. Ltd operating at Alexandria (N.S.W.) and Sydney Smelting Co. Pty Ltd operation at Woolwich (N.S.W.). Combined capacity of the two smelters was reported to have been about 7,000 tons of refined tin per annum. The tin-smelting plant of Associated Tin Smelters Pty Ltd, a joint venture of O. T. Lempriere and Co. Ltd, Consolidated Tin Smelters (Australia) Pty Ltd and Australian Iron and Steel Pty Ltd (a subsidiary of B.H.P.), was commissioned at Alexandria in early 1967. The smelter is now responsible for the total domestic output of primary refined tin.
Secondary Tin
M & T Chemicals (Australia) Pty Ltd commissioned a tin-recovery plant at Unanderra (N.S.W.) in early 1966. The chief function of the plant is to service the Port Kembla Steel works of Australian Iron and Steel Pty Ltd. Tinplate scrap supplied by A.I.S. is detinned and a premium grade "black"
--
. •
steel scrap is returned to A.I.S. for charging open-hearth and electric steelmaking furnaces. The bulk of tin recovered, about 200 t.p.a. is converted to stannous chloride for use as an electrolyte in the electrolytic tinplate-line at Port Kembla.
In Melbourne, scrap merchants Albert G. Sims Ltd, recover 50-10 tons of secondary tin annually from tinplate scrap and other materials.
As far as further processing of tin concentrates is concerned, Associated Tin Smelters Pty" Ltd will be solely responsible, unless, and this now seems unlikely, another domestic smelter is commissioned.
Associated Tin Smelters Pty Ltd
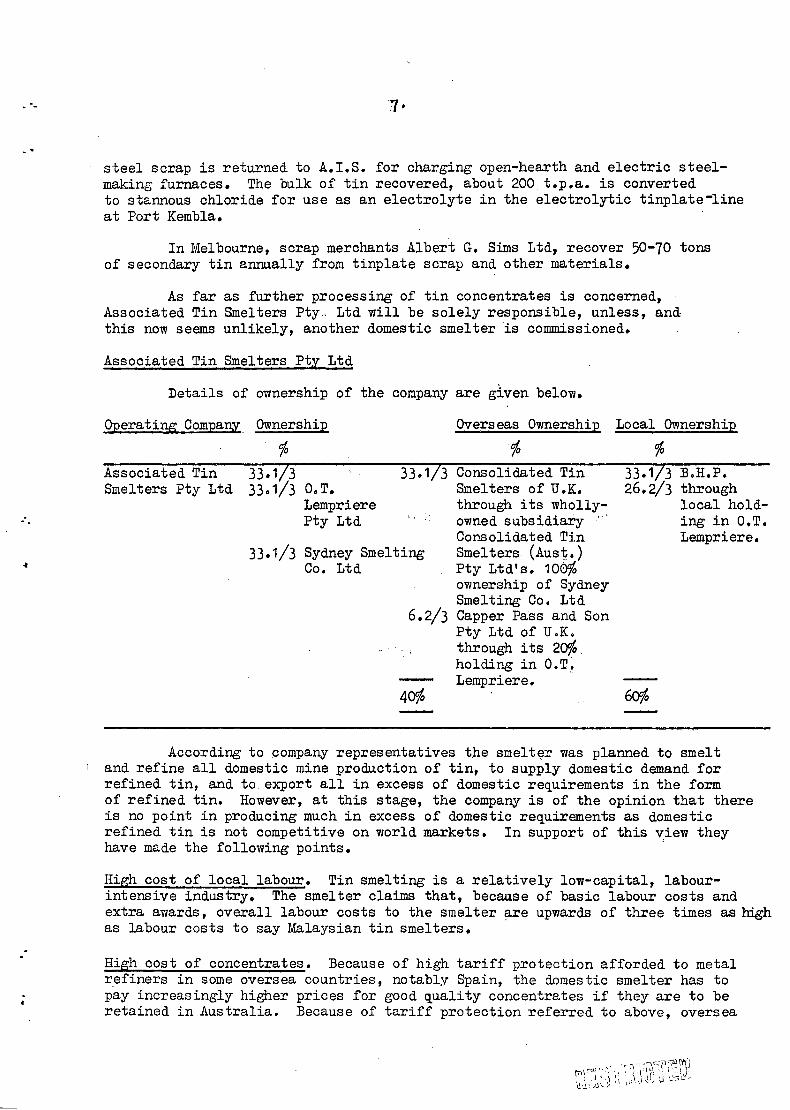
Details of ownership of the company are given below.
0Eerati~ ComEa~ OwnershiE Overseas OwnershiE Local OwnershiE
% % % Associated Tin 33.1/3 33.1/3 Consolidated Tin 33.1/3 B.H.P. Smelters Pty Ltd 33. 1/3 O.T. Smelters of U.K. 26.2/3 through
Lempriere through its wholly- local hold-Pty Ltd owned subsidiary'" ing in O.T.
Consolidated Tin Lempriere. 33.1/3 Sydney Smelting Smelters (Aust,.)
Co. Ltd Pty Ltd's. 100% ownership of Sydney
6.2/3 Smelting Co. Ltd Capper Pass and Son Pty Ltd of U.K. through its 20%. holding in O.T.~ Lempriere.
40% 60%
According to company representatives the smelt~r was planned to smelt and refine all domestic mine production of tin, to supply domestic demand for refined tin, and to. export all in excess of domestic re~uirements in the form of refined tin. However, at this stage, the company is of the opinion that there is no point in producing much in excess of domestic requirements as domestic refined tin is not competitive on world markets. In support of this ~iew they have made the following points.
High cost of local labour. Tin smelting is a relatively low-capital, labourintensive industry. The smelter claims that, because of basic labour costs and extra awards, overall labour costs to the smelter are upwards of three times as high as labour costs to say Malaysian tin smelters.
High cost of concentrates. Because of high tariff protection afforded to metal r.efiners in some oversea countries, notably Spain, the domestic smelter has to pay increasingly higher prices for good quality concentrates if they are to be retained in Australia. Because of tariff protection referred to above, oversea
-.
.:
. •
8 •
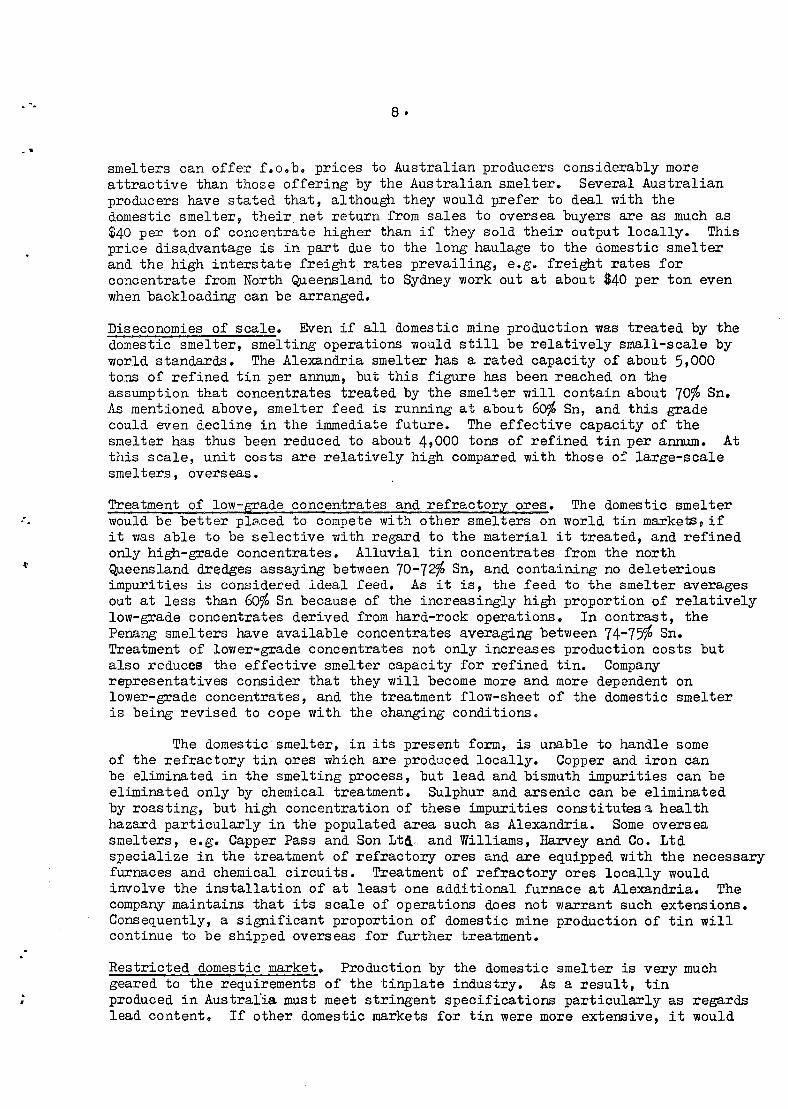
smelters can offer f.o.b. prices to Australian producers considerably more attractive than those offering by the Australian smelter. Several Australian producers have stated that, although they would prefer to deal with the domestic smelter, their net return from sales to oversea buyers are as much as $40 per ton of concentrate higher than if they sold their output locally. This price disadvantage is in part due to the long haulage to the domestic smelter and the high interstate freight rates prevailing, e.g. freight rates for concentrate from North Queensland to Sydney work out at about $40 per ton even when backloading can be arranged.
Diseconomies of scale. Even if all domestic mine production was treated by the domestic smelter, smelting operations would still be relatively small-scale by world standards. The Alexandria smelter has a rated capacity of about 5,000 tons of refined tin per annum, but this figure has been reached on the assumption that concentrates treated by the smelter will contain about 70% Sn. As mentioned above, smelter feed is running at about 60% Sn, and this grade could even decline in the immediate future. The effective capacity of the smelter has thus been reduced to about 4,000 tons of refined tin per annum. At this scale, unit costs are relatively high compared with those of large-scale smelters, overseas.
Treatment of low-grade concentrates and refractory ores. The domestic smelter would be better p18,ced to compete with other smelters on world tin markets, if it was able to be selective with regard to the material it treated, and refined only high-grade concentrates. Alluvial tin concentrates from the north QQeensland dredges assaying between 70-72% Sn, and containing no deleterious impurities is considered ideal feed. As it is, the feed to the smelter averages out at less than 60% Sn because of the increasingly high proportion of relatively low-grade concentrates derived from hard-rock operations. In contrast, the Penang smelters have available concentrates averaging between 74-75% Sn. Treatment of lower-grade concentrates not only increases production costs but also reduces the effective smelter capacity for refined tin. Company representatives consider that they will become more and more dependent on lower-grade concentrates, and the treatment flow-sheet of the domestic smelter is being revised to cope with the changing conditions.
The domestic smelter, in its present form, is unable to handle some of the refractory tin ores which are produced locally. Copper and iron can be eliminated in the smelting process, but lead and bismuth impurities can be eliminated only by chemical treatment. Sulphur and arsenic can be eliminated by roasting, but high concentration of these impurities constitutes a health hazard particularly in the populated area such as Alexandria. Some oversea smelters, e.g. Capper Pass and Son Ltd" and Williams, Harvey and Co. Ltd specialize in the treatment of refractory ores and are equipped with the necessary furnaces and chemical circuits. Treatment of refractory ores locally would involve the installation of at least one additional furnace at Alexandria. The company maintains that its scale of operations does not warrant such extensions. Consequently, a significant proportion of domestic mine production of tin will continue to be shipped overseas for further treatment.
Restricted domestic market. Production by the domestic smelter is very much geared to the requirements of the tinplate industry. As a result, tin produced in AustraLia must meet stringent specifications particularly as regards lead content. If other domestic markets for tin were more extensive, it would
..
not be necessary for the smelter to maintain such a high level of quality for all of its output$ For example, if the local market for solder was large enough, disposal of a high-lead tin would present no problem.
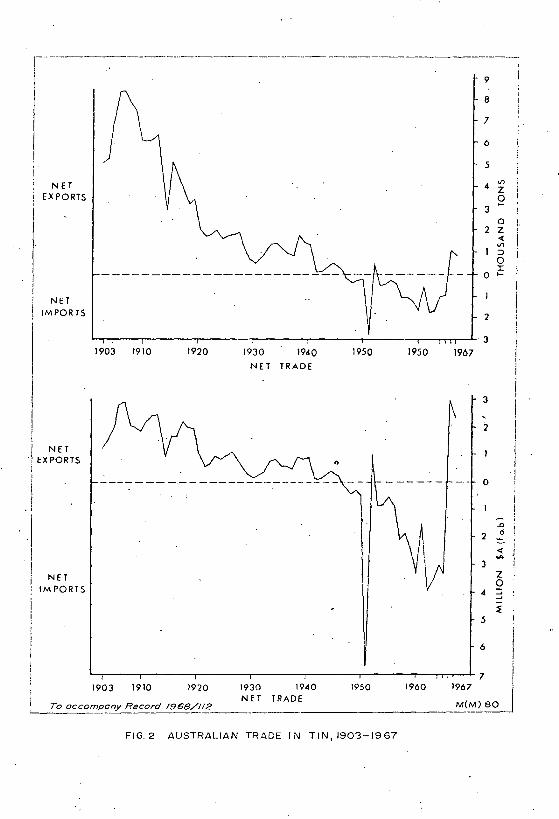
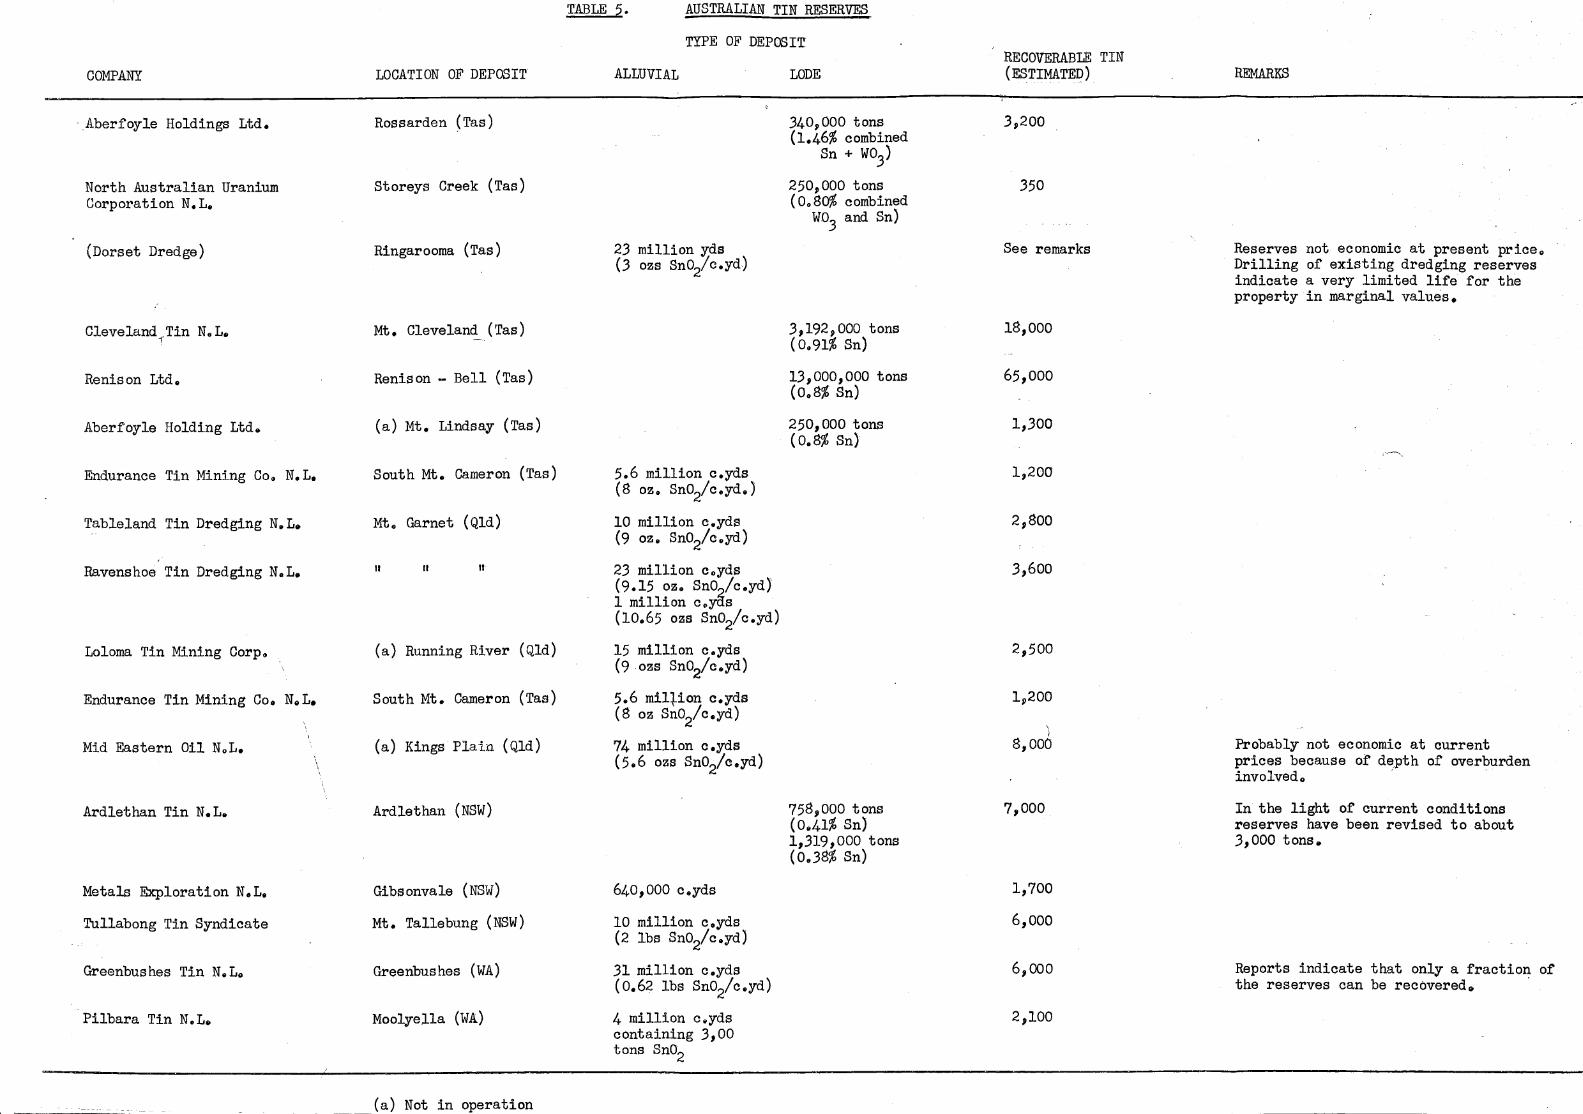
~~certainty as to long-term reserve position. There is no guarantee as to how long knownreserves will sustain the increased levels of production projected for the immediate years. The Australian reserve position in tin is summarised in Table 5. In brief, known reserves, economic under current conditions total about 112?000 tons of contained tin, i.e. a life expectancy of about 15 years at the production level predicted for 1969. However, reserves contained in hard~rock deposits make-up about 80 percent of total reserves with reserves of alluvial tin limited to about 20,000 tons. It is understandable, then, that the local smelter is loath to expand capacity with the prospect that domestic mine production will decrease as reserves of better-grade ore are exhausted. It is pertinent to this exercise to note that, if output from hard-rock operations in north-west Tasmania is excluded, there is a downward trend in projections of future mine production.
CONCLUSIONS
Although domestic mine production of tin is expected to exceed 7,000 tons in 1969, domestic smelter production of tin is likely to be confined to about 4,000 tons. The domestic' smelter is confident that it will be able to meet domestic tin needs. However, it sees no future for exports of refined tin from Australia and feels that exports of tin metal will be confined to about 200-300 t.p.a. to New Zealand. In any case, domestic smelting facilities are such that domestic production of refined tin would be restricted to about 5,000 t.p.a. even, in the unlikely event, that only high-grade concentrates are treated. There are no plans to expand current smelting capacity. Costs of domestic tin smelting appear to be high by world standards and it is unlikely that the domestic smelter could compete with other smelters on the world tin market. In addition, there is reason tooolieve that the high levels of domestic mine production predicted for 1969-1970 may not be maintained for any great length of time because of the limited nature of tin reserves.
'000
13
12
11
10
9
8
7
6
5
4
3
2
o
1
TAS
OLD
1872 1880
MINE PRODUCTION (Tin- jn- concentrote!.)
1890 1900
To OCCOmpany Record 1968/112
'000 tons
5- "
4
3 \fY:;_MELTER PRODUCTION (Ingot I,n') ,
···V 1920 1930 1940
1910 1920 1930 1940
1950 1960 1967
1950 1960 1967
M(M)79
FiG 1 AUSTRALll.N ::>RODUCTlorl OF TIN, 1872-1967 (smelt!?r production data not available before 1910)
,----------------------------------------------------
I 9
i
NET EXPORTS
NE T IMPORTS
I NET
- EXPORTS I I
! j
• i
I I I
NET IMPORTS
8
7
6
5
4 '" Z
3 2 a
2 Z « VI
1 :::> o J: o I-
2
~~---r------,_------._----~------_r------._~~--L 3 1903 1910 1920 1930 1940
NET TRADE
1950 1950 1967
3
i
- ------ 0
.D
2 ~
3
« .... z o
4 ~
5
6 I Ll~90r3----1~9-10------1~9r2-0-----1-9r30------1-9~4-0------19~5-0------1916-0--~T19-6~7 7~1
NET TRADE To occompcny Record !968/~!2 _---'-___________ M(M) 80
FIG_ 2 AUSTRALIAN TRADE I N TIN,1903-1967
I
I i I
i
I I ,
I I I
I !
COMPANY
. Aberfoyle Holdings Ltd.
North Australian Uranium Corporation N.L.
(Dorset Dredge)
Cleveland Tin NeL. I"
Renison Ltd.
Aberfoyle Holding Ltd.
Endurance Tin Mining Coo N.L.
Tableland Tin Dredging N.L.
Ravenshoe Tin Dredging NeL.
Loloma Tin Mining Corp ..
Endurance Tin Mining Co. N .. L.
Mid Eastern Oil NoL.
Ardlethan Tin N.L.
Metals Exploration NeL.
Tullabong Tin Syndicate
Greenbushes Tin NeL ..
Pilbara Tin NeL.
\ ,
LOCATION OF DEPOSIT
Rossarden (Tas)
Storeys Creek (Tas)
Ringarooma (Tas)
Mt. Cleveland (Tas)
Renison - Bell (Tas)
(a) Mt. Lindsay (Tas)
South Mt. Cameron (Tas)
Mt .. Garnet (Qld)
II II II
(a) Running River (Qld)
South Mt. Cameron (Tas)
(a) Kings PlaIn (Qld)
Ardlethan (NSW)
Gibsonvale (NSW)
Mt. Tallebung (NSW)
Greenbushes (WA)
Moolyella (WA)
(a) Not in operation
TABLE 5. AUSTRALIAN TIN RESERVES
TYPE OF DEPOSIT
ALLUVIAL
23 million yds (3 ozs Sn02/c.yd)
5.6 million c.yds (8 oz .. Sn02/ceyd.)
10 million c.yds (9 oz. Sn02/c.yd)
23 million coyds (9.15 oz" Sn02/ceyd) 1 million c,,1Os (10.65 ozs Sn02/ceyd)
15 million c.yds (90zs Sn02/c"yd)
5.6 miltion c.yds (8 oz Sn02/c.yd)
74 million c.yds (5.6 ozs Sn02!c.yd)
640,000 c.yds
10 million c.yds (2 lbs Sn02/c.yd)
31 million c.yds (0.62 lbs Sn02/c"yd)
4 million c.yds containing 3,00 tons Sn02
LODE
340~OOO tons (1.46% combined
Sn + W03)
250,000 tons (0.80% combined
W03
and Sn)
3,192~ 000 tons (0.91% Sn)
13,000,000 tons (008% Sn)
250, 000 tons (0.8% Sn)
758,000 tons (0.41% Sn) 1,319,000 tons (0.38% Sn)
RECOVERABLE TIN (ESTIMATED)
3~200
350
See remarks
18,000
65,000
1,300
1,200
2,800
3,600
2,500
\ )
8,000
7,000
1,700
6,000
6,000
2,100
REMARKS
Reserves not economic at present price" Drilling of existing dredging reserves indicate a very limited life for the property in marginal values.
Probably not economic at current prices because of d~pth of overburden involved 0 - .
In the light of current conditions reserves have been revised to about 3,000 tons.
Reports indicate that only a fraction of the reserves can be recovered.. .