Embed Size (px)
Citation preview
Mineral Exploration Using Aster Images Carlos A. Torres
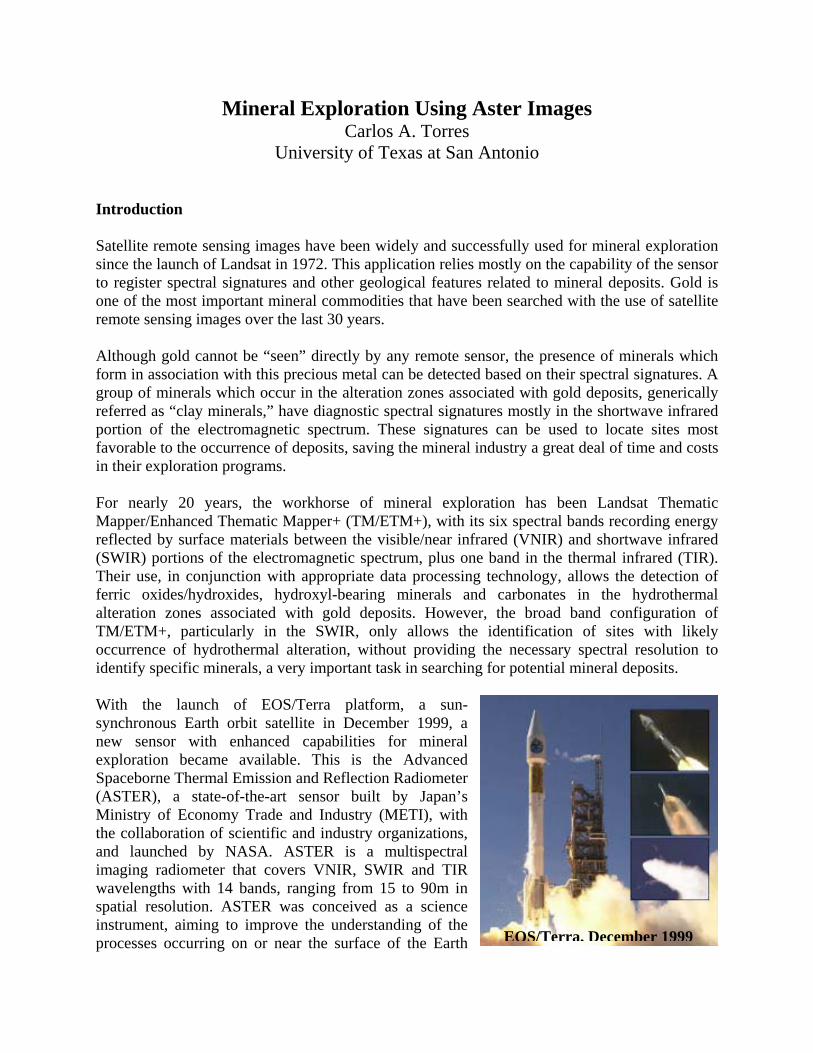
University of Texas at San Antonio Introduction Satellite remote sensing images have been widely and successfully used for mineral exploration since the launch of Landsat in 1972. This application relies mostly on the capability of the sensor to register spectral signatures and other geological features related to mineral deposits. Gold is one of the most important mineral commodities that have been searched with the use of satellite remote sensing images over the last 30 years. Although gold cannot be “seen” directly by any remote sensor, the presence of minerals which form in association with this precious metal can be detected based on their spectral signatures. A group of minerals which occur in the alteration zones associated with gold deposits, generically referred as “clay minerals,” have diagnostic spectral signatures mostly in the shortwave infrared portion of the electromagnetic spectrum. These signatures can be used to locate sites most favorable to the occurrence of deposits, saving the mineral industry a great deal of time and costs in their exploration programs. For nearly 20 years, the workhorse of mineral exploration has been Landsat Thematic Mapper/Enhanced Thematic Mapper+ (TM/ETM+), with its six spectral bands recording energy reflected by surface materials between the visible/near infrared (VNIR) and shortwave infrared (SWIR) portions of the electromagnetic spectrum, plus one band in the thermal infrared (TIR). Their use, in conjunction with appropriate data processing technology, allows the detection of ferric oxides/hydroxides, hydroxyl-bearing minerals and carbonates in the hydrothermal alteration zones associated with gold deposits. However, the broad band configuration of TM/ETM+, particularly in the SWIR, only allows the identification of sites with likely occurrence of hydrothermal alteration, without providing the necessary spectral resolution to identify specific minerals, a very important task in searching for potential mineral deposits. With the launch of EOS/Terra platform, a sun-synchronous Earth orbit satellite in December 1999, a new sensor with enhanced capabilities for mineral exploration became available. This is the Advanced Spaceborne Thermal Emission and Reflection Radiometer (ASTER), a state-of-the-art sensor built by Japan’s Ministry of Economy Trade and Industry (METI), with the collaboration of scientific and industry organizations, and launched by NASA. ASTER is a multispectral imaging radiometer that covers VNIR, SWIR and TIR wavelengths with 14 bands, ranging from 15 to 90m in spatial resolution. ASTER was conceived as a science instrument, aiming to improve the understanding of the processes occurring on or near the surface of the Earth EOS/Terra, December 1999

and to address global change topics. ASTER data can be use to create detailed maps of land surface temperature, emissivity, reflectance, elevation, geological and environmental interpretation, and many other applications. ASTER, like other high spatial resolution, earth observing instruments, provides data useful for a wide range of science research and applications. These include:
• Land surface climatology: investigation of land surface parameters, surface temperature, etc., to understand land-surface interaction and energy and moisture fluxes .
• Vegetation and ecosystem dynamics: investigations of vegetation and soil distribution and their changes to estimate biological productivity, understand land-atmosphere interactions, and detect ecosystem change.
• Volcano monitoring: monitoring of eruptions and precursor events, such as gas emissions, eruption plumes, development of lava lakes, eruptive history and eruptive potential.
• Hazard monitoring: observation of the extent and effects of wildfires, flooding, coastal erosion, earthquake damage, and tsunami damage.
• Hydrology: understanding global energy and hydrologic processes and their relationship to global change; included is evapotranspiration from plants
• Geology and soils: the detailed composition and geomorphologic mapping of surface soils and bedrocks to study land surface processes and earth's history
• Land surface and land cover change: monitoring desertification, deforestation, urbanization; providing data for conservation managers to monitor protected areas, national parks, wilderness areas.
The basic tool for geologists in all disciplines is a map depicting the distribution and identity of rock units exposed at the earth’s surface. Using these maps, economic geologists search for metal and petroleum deposits; hydrogeologists look for ground water; structural geologists classify faults as active or inactive. With its high spatial resolution, and bands covering a wide part of the electromagnetic spectrum, ASTER provides data that will greatly improve geologists’ abilities to produce more accurate geologic maps at a fraction of the cost of conventional ground-based methods. The ASTER instrument consists of three separate instrument subsystems. Each subsystem operates in a different

spectral region, has its own telescope(s), and was built by a different Japanese company. ASTER's three subsystems are: the Visible and Near Infrared (VNIR), the Shortwave Infrared (SWIR), and the Thermal Infrared (TIR).
Swath width of the imagery is 60Km, with scenes covering a 60Km by 60Km area.
Mineral Exploration and Remote Sensing The value of remote sensing data to mineral exploration has evolved and increased as technology has improved. In the early days of aerial photography, aerial photos were used when available to evaluate topography and plan prospecting and sampling forays. After World War II, the analysis of aerial photo data became much more sophisticated and actual geological data began to be extracted. The use of stereoscopic pairs enabled geologist to interpret subtle structural features. Nonetheless, the primary use of remotely gathered data was comparative. If a particular type of deposit was being mined in a district, aerial photos would be used to locate similar features elsewhere within the district. Accurate geologic maps are a fundamental tool used by geologists for many research and practical endeavors. This certainly is true in the case of energy and mineral exploration. Yet, even now, at the beginning of the 21st century, there remain vast reaches of the earth’s land surface for which there exists little or no geologic map coverage. This is even true for parts of the United States! Moderate-resolution satellite land remotely sensed data have been used successfully over the past 30 years to provide geologists, including those exploring for non-renewable natural resources, with valuable geologic information that has been used to create regional to sub-regional geologic maps and has played a role in the discovery of new occurrences of oil, gold, copper, and other resources. As we have learned, ASTER data have characteristics that are particularly useful for geologic studies, especially where the rocks are well exposed.

ASTER can map the distribution of various minerals, including white mica, silicification, carbonates, clays, alunite and iron oxides. ASTER-derived mineral index maps are simple band and relative band depth ratios that correspond to absorption features for particular minerals. Data to be used For this project I’m going to use ASTER Level-1B Data images of Elko County, NV, acquired on July 8th of 2001 at 6:48:19 local time. The images were requested from the Earth Observing System Data Gateway (http://edcimswww.cr.usgs.gov/pub/imswelcome/). The ASTER Level-1B data are L1A data with the radiometric and geometric coefficients applied. All of these data are stored together with metadata in one HDF file. The L1B image is projected onto a rotated map (rotated to “path oriented” coordinate) at full instrument resolutions. The Level-1B data generation also includes registration of the SWIR and TIR data to the VNIR data. And in addition, for SWIR in particular, the parallax errors due to the spatial locations of all of its bands are corrected. Level-1B data define a scene center as the geodetic center of the scene obtained from the L1A attribute named “SceneCenter” in the HDF-EOS attribute “productmetadata.0”. The definition of scene center in L1B is the actual center on the rotated coordinates (L1B coordinates).
ASTER ELKO COUNTY NV., VNIR 3, 2, 1

Methods to be Use The level 1B image has the geometric and radiometric corrections. For the SWIR in particular, the parallax errors due to the spatial locations of all of its bands are also corrected. This really helped with the post processing of the image.
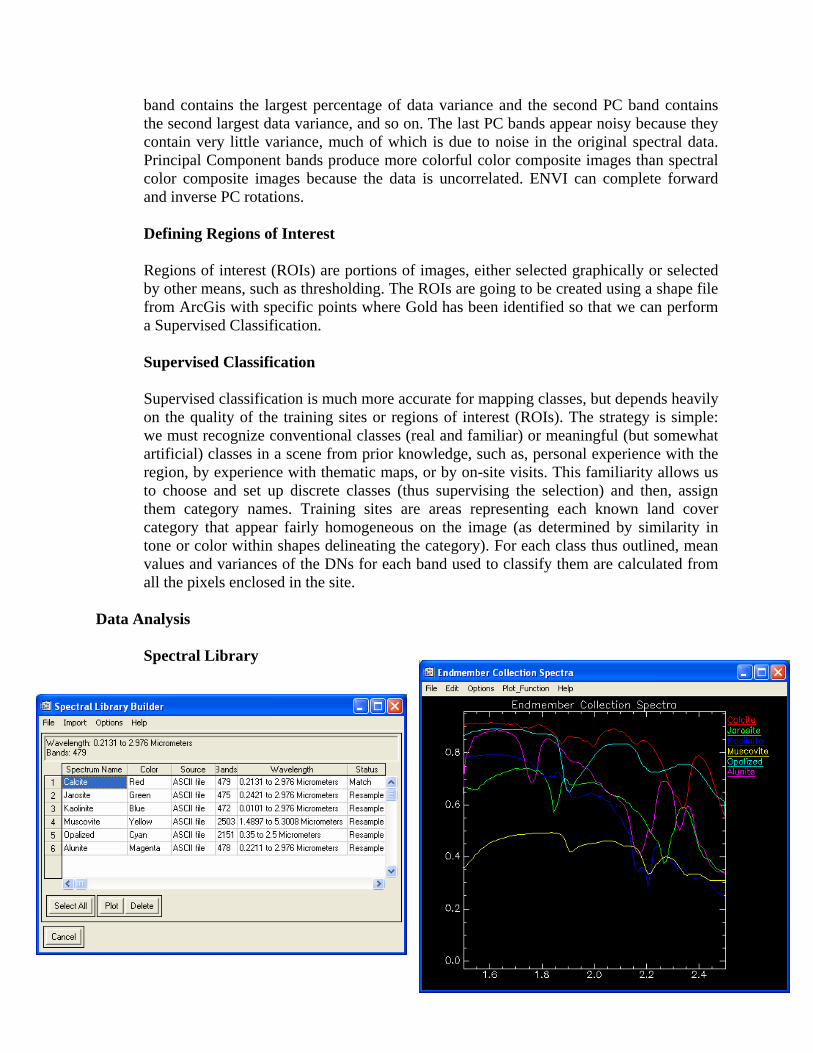
Create a Spectral Library (from the USGS Digital Spectral Library) The purpose for this is to create a Spectral Library with known minerals in the target area and then compare the spectral library with the image and find possible sites for further investigation. Minimum Noise Fraction (MNF) MNF (minimum noise fraction) rotation (using principal components calculations) is used to show the variation between bands in an image. This is a statistical method which works out differences in an image based on pixel DNs in various bands. Mathematically, this uses eigenvectors and eigenvalues to work out the principal vectors and directions of the data cloud (collection of data values for the image). The idea is to show the differences rather than the similarities between bands. So in principal component images you are looking at the maximum differences between what the sensor is picking up in different bands rather than where different bands are recording the same thing i.e. reducing redundancy. The calculations also identify noise in the image. After doing this analysis we can then go and do some band ratios, compare to the MNF or principal components image, and perhaps assign each MNF band to some feature characteristic. Remember that these are statistics and do not indicate any specific mineral, merely differences between areas of the image. This method works best with SWIR images. The use of the MNF Rotation transforms is to determine the inherent dimensionality of image data, to segregate noise in the data, and to reduce the computational requirements for subsequent processing. The data space can be divided into two parts: one part associated with large eigenvalues and coherent eigenimages, and a complementary part with near-unity eigenvalues and noise-dominated images. By using only the coherent portions, the noise is separated from the data, thus improving spectral processing results. Principal Components The use of Principal Components is to produce uncorrelated output bands, to segregate noise components, and to reduce the dimensionality of data sets. Because multispectral data bands are often highly correlated, the Principal Components (PC) Transformation is used to produce uncorrelated output bands. This is done by finding a new set of orthogonal axes that have their origin at the data mean and that are rotated so the data variance is maximized. PC bands are linear combinations of the original spectral bands and are uncorrelated. You can calculate the same number of output PC bands as input spectral bands. The first PC
band contains the largest percentage of data variance and the second PC band contains the second largest data variance, and so on. The last PC bands appear noisy because they contain very little variance, much of which is due to noise in the original spectral data. Principal Component bands produce more colorful color composite images than spectral color composite images because the data is uncorrelated. ENVI can complete forward and inverse PC rotations. Defining Regions of Interest Regions of interest (ROIs) are portions of images, either selected graphically or selected by other means, such as thresholding. The ROIs are going to be created using a shape file from ArcGis with specific points where Gold has been identified so that we can perform a Supervised Classification. Supervised Classification Supervised classification is much more accurate for mapping classes, but depends heavily on the quality of the training sites or regions of interest (ROIs). The strategy is simple: we must recognize conventional classes (real and familiar) or meaningful (but somewhat artificial) classes in a scene from prior knowledge, such as, personal experience with the region, by experience with thematic maps, or by on-site visits. This familiarity allows us to choose and set up discrete classes (thus supervising the selection) and then, assign them category names. Training sites are areas representing each known land cover category that appear fairly homogeneous on the image (as determined by similarity in tone or color within shapes delineating the category). For each class thus outlined, mean values and variances of the DNs for each band used to classify them are calculated from all the pixels enclosed in the site.
Data Analysis Spectral Library

Minimum Noise Fraction (MNF)
MNF SWIR band R 1,G 2, B 3.

Principal Components
PC SWIR band R 1,G 2, B 3.
Region of Interest
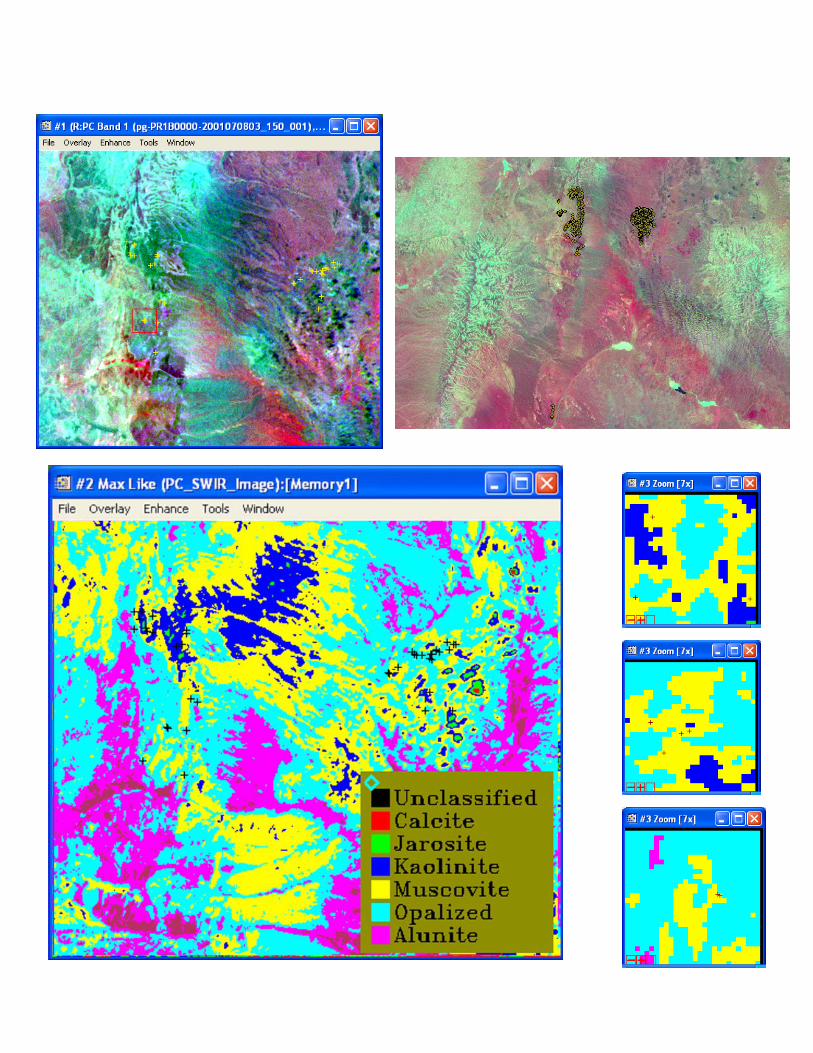

Image using different bands for the project
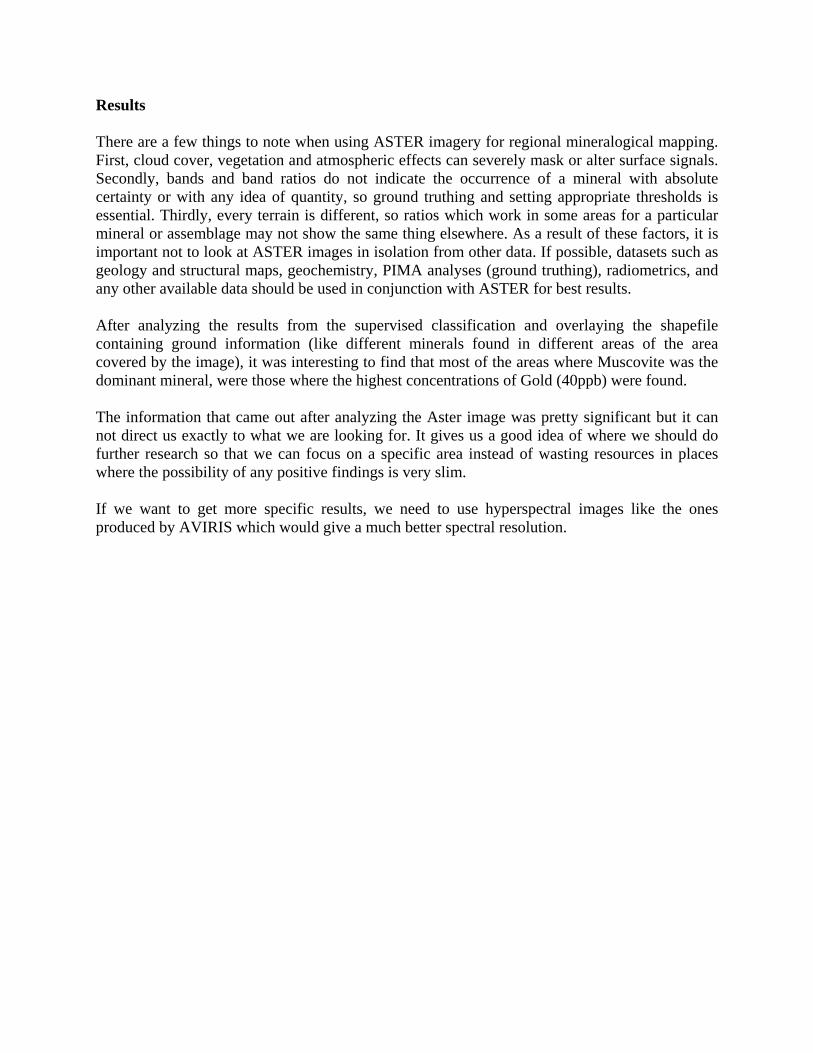
Results There are a few things to note when using ASTER imagery for regional mineralogical mapping. First, cloud cover, vegetation and atmospheric effects can severely mask or alter surface signals. Secondly, bands and band ratios do not indicate the occurrence of a mineral with absolute certainty or with any idea of quantity, so ground truthing and setting appropriate thresholds is essential. Thirdly, every terrain is different, so ratios which work in some areas for a particular mineral or assemblage may not show the same thing elsewhere. As a result of these factors, it is important not to look at ASTER images in isolation from other data. If possible, datasets such as geology and structural maps, geochemistry, PIMA analyses (ground truthing), radiometrics, and any other available data should be used in conjunction with ASTER for best results. After analyzing the results from the supervised classification and overlaying the shapefile containing ground information (like different minerals found in different areas of the area covered by the image), it was interesting to find that most of the areas where Muscovite was the dominant mineral, were those where the highest concentrations of Gold (40ppb) were found. The information that came out after analyzing the Aster image was pretty significant but it can not direct us exactly to what we are looking for. It gives us a good idea of where we should do further research so that we can focus on a specific area instead of wasting resources in places where the possibility of any positive findings is very slim. If we want to get more specific results, we need to use hyperspectral images like the ones produced by AVIRIS which would give a much better spectral resolution.

References Jet Propulsion Laboratory http://asterweb.jpl.nasa.gov/index.asp W. M. KECK Earth Sciences & Mining Research Information Center http://keck.library.unr.edu/ USGS Mineral Resources Program http://minerals.usgs.gov/ “RST” The Remote Sensing Tutorial http://rst.gsfc.nasa.gov/Homepage/Homepage.html