Embed Size (px)
Citation preview

Journal of Hydrology 472–473 (2012) 159–168
Contents lists available at SciVerse ScienceDirect
Journal of Hydrology
journal homepage: www.elsevier .com/ locate / jhydrol
Mineral dissolution and secondary precipitation on quartz sand in simulatedHanford tank solutions affecting subsurface porosity
Guohui Wang a, Wooyong Um a,b,⇑a Pacific Northwest National Laboratory, Richland, WA 99352, United Statesb Pohang University of Science and Technology (POSTECH), Pohang, Republic of Korea
a r t i c l e i n f o a b s t r a c t
Article history:Received 12 March 2012Received in revised form 20 August 2012Accepted 8 September 2012Available online 17 September 2012This manuscript was handled by L. Charlet,Editor-in-Chief, with the assistance ofTamotsu Kozaki, Associate Editor
Keywords:Alkaline nuclear waste solutionHanford SiteDissolution/precipitationApparent activation energyPorosity change
0022-1694/$ - see front matter Published by Elsevierhttp://dx.doi.org/10.1016/j.jhydrol.2012.09.021
⇑ Corresponding author. Address: Pacific NorthweBox 999, P7-54, 902 Battelle Boulevard, Richland, WA509 372 6227; fax: +1 509 371 7249.
E-mail address: [email protected] (W. Um).
Highly alkaline nuclear waste solutions have been released from underground nuclear waste storagetanks and pipelines into the vadose zone at the US Department of Energy’s Hanford Site in Washington,causing mineral dissolution and re-precipitation upon contact with subsurface sediments. High pH caus-tic NaNO3 solutions with and without dissolved Al were reacted with quartz sand through flow-throughcolumns stepwise at 45, 51, and 89 �C to simulate possible reactions between leaked nuclear waste solu-tion and primary subsurface mineral. Upon reaction, Si was released from the dissolution of quartz sand,and nitrate-cancrinite [Na8Si6Al6O24(NO3)2] precipitated on the quartz surface as a secondary mineralphase. Both steady-state dissolution and precipitation kinetics were quantified, and quartz dissolutionapparent activation energy was determined. Mineral alteration through dissolution and precipitationprocesses results in pore volume and structure changes in the subsurface porous media. In this study,the column porosity increased up to 40.3% in the pure dissolution column when no dissolved Al was pres-ent in the leachate, whereas up to a 26.5% porosity decrease was found in columns where both dissolu-tion and precipitation were observed because of the presence of Al in the input solution. The porositychange was also confirmed by calculation using the dissolution and precipitation rates and mineral vol-ume changes.
Published by Elsevier B.V.
1. Introduction
Hundred million liter volumes of liquid radioactive wastes, gen-erated from processing activated nuclear fuels for separation ofplutonium (1943–1989), have been stored in massive undergroundtanks at the Hanford Site in Washington State. The waste chemicalcomposition is generally characterized as hyperalkaline (pH of 9–14) and high-ionic strength (I = 2–14 M) solutions with high con-centrations of dissolved Al (0.7–2 M). These wastes contained highconcentrations of 137Cs and 90Sr and other radionuclides. The wastesolutions in the tanks exhibited high temperatures (up to >100 �C)caused by self-boiling due to chemical reaction and radionuclidedecay for several decades (Serne et al., 1998; Zachara et al.,2007). The temperature in the nearest sediment was estimated tobe as high as 120 �C, and in the sediments 20 m below the tanks itcould be still as high as 70 �C (Pruess et al., 2002) or 50 �C at 40 mbelow the tanks (Liu et al., 2003). Approximately 67 single-shelltanks or the ancillary pipelines of the total 177 waste tanks havereleased fluids to the subsurface. These releases, about 1.9–3.8
B.V.
st National Laboratory, P.O.99354, United States. Tel.: +1
million liters of high-level nuclear waste fluids, have migrated intothe underlying sediments (Zachara et al., 2007). The Pleistocene-age Hanford Formation (coarse-grained glacio-fluvial gravels andsands) and Pliocene-age Ringold Formation (fluvial-lacustrinegravel/sand/silt) are the primary geological units in the unconsoli-dated sediments of Hanford’s vadose zone. The primary minerals inthese sediments are silicate minerals, including quartz, feldspar,mica (biotite and muscovite), and smectite, as well as basaltic rockfragments (Zachara et al., 2007).
Contact of the released hyperalkaline tank fluid with the under-lying sediments has caused geochemical changes, resulting in pri-mary mineral dissolution and precipitation of secondary minerals(Bickmore et al., 2001; Chorover et al., 2003, 2008; Qafoku et al.,2003; Mashal et al., 2004; Zhao et al., 2004; Deng et al., 2006a,b;Rod et al., 2010; Chang et al., 2011). The caustic tank leachate dis-solves silicate minerals and the released Si can react with Al, Na,and anions such as NO�3 ;CO2�
3 , or OH� from tank wastes to formsecondary mineral precipitates. Several laboratory studies have fo-cused primarily on mineral transformations, and observed the spe-cific pathways of mineral alteration under different geochemicalconditions (such as temperature and OH� concentration). Differenttypes of secondary minerals may form depending on the specificnature of the Hanford waste solutions released and the degree oftheir interaction with the underlying sediments of the Hanford
160 G. Wang, W. Um / Journal of Hydrology 472–473 (2012) 159–168
formation (the farther the waste fluids migrate away from thepoint of release the more pH neutralization, temperature reduc-tion, and dilution occur). The secondary minerals that precipitatevary from amorphous aluminosilicates and zeolite to more crystal-line sodalite and cancrinite. However, in general, crystallinefeldspathoids such as sodalite and cancrinite [Na8Si6Al6O24(NO3)2]can be formed at temperatures above 40 �C and at high NaOH(>1 M) solutions (Bickmore et al., 2001; Mattigod et al., 2002;Qafoku et al., 2003; Mashal et al., 2004; Deng et al., 2006a).Compared to the primary minerals, these neo-formed secondaryminerals demonstrate elevated sorption capacity resulting fromincreased surface adsorption and co-precipitation of radionuclidessuch as Sr and Cs (Chorover et al., 2003; Mon et al., 2005; Um et al.,2005; Choi et al., 2006; Rod et al., 2010; Chang et al., 2011).
In addition to elevated sorption capacity (adsorption + co-pre-cipitation) due to the formation and precipitation of secondaryminerals, mineral dissolution and precipitation reactions can alterpore structure and flow behavior through the matrix, thereby cre-ating more complex interactions between reaction and transportprocesses in the subsurface environment (Um et al., 2005). Previ-ous laboratory works have focused on identifying the most impor-tant variables that govern the dissolution–precipitation rates andmechanisms of the interaction between solution and solid, suchas exploring quartz and clay mineral dissolution and precipitationunder different pH and temperatures (Rimstidt and Barnes, 1980;Knauss and Wolery, 1988; Brady and Walther, 1989; Bauer andBerger, 1998). Although quartz dissolution and Hanford Site-spe-cific characterization of neo-formed precipitates have been studied(Qafoku et al., 2003; Bickmore et al., 2006), very little work has ex-plored the kinetics of mineral dissolution together with secondaryprecipitation under high Al-containing caustic waste tank solu-tions, as well as the impact of these reactions on permeabilitychanges in the porous media.
Dissolution and secondary precipitation is one of the major geo-chemical processes controlling radionuclide transport in the va-dose zone at Hanford Site below the so-called ‘‘tank farms.’’ Thespecific objective of this study was to monitor synchronous quartzdissolution and the secondary precipitation at elevated tempera-tures using simulated tank waste solution, and to quantify theporosity changes caused by mineral alteration based on the quartzsand dissolution rate and precipitation rate of nitrate-cancrinite.The mineral-solution reaction was carried out using flow-throughcolumns and the dissolution–precipitation rates were determinedbased on quasi-steady-state breakthrough curves of the releasedSi and Al concentrations.
2. Materials and methods
2.1. Quartz sand
Quartz sand (fractionated to 200–300 lm in diameter; Sigma–Aldrich�) was used for the column packing. In order to purify thepacked materials, before use, the quartz sand was soaked in a 2%nitric acid solution for 2 days, followed by rinsing with deionizedwater and oven-drying at 105 �C for 24 h. We used pure quartzsand instead of natural Hanford sediments to isolate the effectsof newly formed mineral precipitates on pore structure changes.
2.2. Simulated tank waste leachate
A simulated tank waste leachate (STWL) was prepared as atank waste surrogate that has leaked into the vadose zone at theHanford Site tank farms. Reagent-grade chemicals were used toprepare a STWL consisting of 1 M NaNO3, 1.04 M NaOH, 0.01 MAl(NO3)3, and 10�5 M Sr(NO3)2. A solution with the same
composition, but without Al was also prepared (called STWL�Al).The measured pH of the synthesized STWL solution was 13.3 atroom temperature. The chemical composition of the STWL repre-sents the lower range of concentrations of chemical compositionsfound in Hanford tank waste.
2.3. Solid characterizations
The morphology of the reacted quartz sand was observed usinga scanning electron microscope (SEM). Energy-dispersive X-rayspectroscopy (EDS) coupled with an Oxford 80-mm silicon-drift-detector (SDD), and a powder X-ray diffractometer (XRD) wereused to identify chemical compositions and minerals. The XRDwas a Philips X’Pert XRD, coupled with MDI Jade9; it was operatedat 40 kV and 50 mA with a step size of 0.3� 2h. Instead of using thereacted quartz sand from the test columns, the same quartz sandreacted in batch vials (5 g quartz + 50 mL Al-containing STWL(STWL+Al) at 89 �C for 50 days with twice supernatant solutionrefreshment) and unpacked materials from a similar flow throughcolumn [internal-diameter (ID) 0.46 cm � 10 cm length; the samepacked pure quartz with STWL+Al solution flow through at 89 �Cfor 80 days] were used for the above solid characterization. The re-acted samples above were washed three times using 95% ethanol,followed by rinsing with deionized distilled water to remove anyremaining STWL salt ions on the precipitate. Between each wash-ing step, centrifugation at 25,000 G for 45 min was used, which en-abled all particles larger than 0.07 lm diameter to settle out of thewashing solutions. The white-colored floating nitrate-cancriniteparticles in the washing solution of the last step were separatedfrom the quartz grain, dried, and used for XRD, SEM, and EDS anal-yses. In addition, after 28 days of reaction and removing the float-ing nitrate-cancrinite particle-containing supernatant, SEM imagesof the batch reacted quartz grain surface were also collected.
2.4. Column experiments
Two PolyEtherEtherKetone (PEEK) columns (S1 and S3), eachwith a 2.1-mm ID and 10-cm length, were packed with acid-washed pure quartz sand. One more PEEK column with a widerID of 4.6 mm and shorter length of 5 cm (S5) was packed usingthe same quartz material. The initial porosity calculated was0.37, 0.33, and 0.42 for packed columns S1, S3, and S5, respectively.A 5-lm frit was used at both ends of each column to hold thepacked materials in place. The STWL with Al (STWL+Al) or withoutAl (STWL�Al) was introduced into different columns under satu-rated conditions and at stepwise changed temperatures. A solutionof STWL�Al or STWL+Al was flowed through the S1 and S3 col-umns, respectively. Different pore structure changes were ex-pected in these two columns because Al element is necessary forthe formation of secondary aluminosilicate mineral precipitates(sodalite or cancrinite). The solution in the S1 column (STWL�Al)can only result in the dissolution reaction of the quartz surface,while that in the S3 column (STWL+Al) can form secondary mineralprecipitates dominated by feldspathoids. The S5 column was alsotreated with STWL+Al, to duplicate the experimental conditionsused for the S3 column in the larger column dimension. Similardissolution and precipitation reactions were expected to occur incolumns S3 and S5.
Three separated KLOEHN V6 syringe pumps were used to pro-duce a steady flow of STWL solution to each column. The pumpsoffered a constant flow instead of constant pressure. As long asthe pore space inside columns was not totally clogged, the syringepumps maintain constant flow rates. The flow rate for all columnswas initially set to a constant value of 0.07 mL/h, resulting in 13.1,14.9, and 4.8 PV (pore volume)/day for columns S1, S3, and S5,respectively. This flow rate (0.07 mL/h), i.e., 0.24–1.3 m/day in

Table 1Column information and experimental flow-through procedures.
Columns S1 S3 S5
Column size (ID � Length) (mm mm) 2.1 � 100 2.1 � 100 4.6 � 50Material packed (g) 0.58 0.62 1.27Flow-through caustic solution STWL�Al STWL+Al STWL+AlFlow rate (PV/day) and duration (day) 13.1 (0–155) 14.9 (0–147) 4.8 (0–199)
4.3 (155–237) 4.9 (147–229) 1.6 (199–280)Temperature (�C) and duration (day) 21 �C (0–2) 21 �C (0–1) 21 �C (0–1)
51 �C (2–14) 51 �C (1–13)45 �C (14–162) 45 �C (13–154) 45 �C (1–206)89 �C (162–237) 89 �C (154–229) 89 �C (206–280)
G. Wang, W. Um / Journal of Hydrology 472–473 (2012) 159–168 161
terms of the true flow velocity in the packed columns, was chosenbased on the general infiltration rate (2–3 cm/h or �0.6 m/day) inmoderate infiltration-rate in soils, which is similar to the gravelsand dominated sediment at Hanford Site. All three columns wereflushed at 0.07 mL/h with STWL at room temperature (21 �C) for 1–2 days to remove any remaining dispersible particles attached tothe packed quartz sand surface and to confirm the constant flowwith input solutions. Then, for the column S1 and S3 experiments,the temperature was set to 51 �C using a water bath. However,after 12 days of column operation the temperature dropped to45 �C due to unexpected technical reasons. Column S5 was put di-rectly into a 45 �C water bath after 1 day’s conditioning at 21 �C.After 155-, 147-, and 199-day reactions of the columns S1, S3,and S5, respectively, the flow rate was manually decreased to0.023 mL/h (correspondingly 4.3, 4.9, and 1.6 PV/day for S1, S3,and S5, respectively). After 7 day of column operation under the re-duced flow rate at 45 �C, the reaction temperature was increased to89 �C to further accelerate chemical reactions (dissolution and sec-ondary precipitation) till the end of entire experiment. The flowrates in three columns during the experiments were monitoredto be constant, except when the manual reductions were imposed.The condition and running procedures for each column are sum-marized in Table 1. The effluent samples were collected at regulartime intervals, diluted, and analyzed for Na, Si, Al, and Sr usinginductively coupled plasma optical emission spectrometry (ICP-OES; PerkinElmer Optima 3300DV). Column effluent pH was mea-sured at room temperature after sample collection using Hannabenchtop pH meter. The buffer solutions used for pH electrode cal-ibration were the ERA pH 7 and 10 solutions, and additional pH13buffer solution from RICCA chemical company. The calibration wasregularly checked with Fisher pH10 buffer solution before measur-ing the pH.
Table 2Summary of experimental conditions and measured quartz dissolution and neo-formed nitr
Columns Flow rate(mL/h)
T(�C)
Initial reactive surfacearea a (m2)
Input [Si](lM)
Output [S(lM)
S1 0.07 51 0.0053 0 11930.07 45 0.0053 0 6190.023 89 0.0053 0 49649
S3 0.07 51 0.0057 0 6590.07 45 0.0057 0 3740.023 89 0.0057 0 14296
S5 0.07 45 0.0117 0 3480.023 89 0.0117 0 43343
a The total initial reactive surface area = (geometric specific surface area) � (solid masshapes are spheres according to Tester et al. (1994) using equation: geometric surface arand minimum particle size, respectively. In this study, the determined geometric specificthe quartz density (2.65 g/cm3).
b ND indicates ‘‘not determined’’. The reliable precipitation rate cannot be determinedsimilar (within ±5% difference, which is lower than laboratory instrument error allowan
2.5. Calculation of release rates
Quartz dissolution and nitrate-cancrinite precipitation whenalkaline Al-containing solutions are used can be described asfollows:
SiO2ðquartzÞ þ 2OH� ¼ H2SiO2�4 ð1Þ
6AlðOHÞ�4 þ 6H2SiO2�4 þ 8Naþ þ 2NO�3
¼ Na8Si6Al6O24ðNO3Þ2 þ 12OH� þ 12H2O ð2Þ
Since quartz dissolution is taking place at far from equilibriumin a column experiment, the quartz dissolution rate, Rdis, in thestudied one-dimension constant flow-through homogeneous med-ia column can be determined from the measured input and effluentsolution concentrations using an equation below (Taylor et al.,2000),
Rdis ¼ �DCSiVm=ðaSiLAÞ ð3Þ
where L is the length of the column (m), V is the solution volumeinside column (L), v is the true flow velocity (m/s), aSi is the stoichi-ometric ratio of Si in the quartz (=1), A is the total mineral surfacearea in the column (m2), and DCSi is the change in the concentrationof species Si between the input and the output solutions (mol/L). In-stead of Brunaner–Emmett–Teller (BET) surface area, the activegeometric surface area was used in calculating the rates accordingto Tester et al. (1994) (see Table 2). In column S1, where the inputSTWL contained no Al, only Si dissolution was expected, so the mea-sured effluent Si concentration was used directly as the output solu-tion concentration. In columns S3 and S5, where the input solutioncontained dissolved Al, the total released Si concentration wasdetermined as the sum of the measured effluent Si concentration
ate-cancrinite precipitation rates on quartz sand with STWL at 45 �C, 51 �C, and 89 �C.
i] Input [Al](lM)
Output [Al](lM)
Dissolutionrate(mol/cm2/s)
Precipitation rate(mol/cm2/s)
0 0 2.95E�13 00 0 2.27E�13 00 0 8.33E�12 0
25100 24100 2.25E�13 NDb
25100 26100 1.41E�13 NDb
25100 12439 2.81E�12 2.39E�13
25100 25400 1.21E�13 NAb
25100 376 3.32E�12 2.28E�13
s packed); the quartz geometric specific area was calculated assuming the particleea = 6/[((dmax � dmin)/ln(dmax/dmin))q], where dmax and dmin represent the maximumsurface area is 0.0098 m2/g with dmax = 0.3 mm and dmin = 0.2 mm, respectively. q is
because the measured Al concentration values between input and output were quitece of 10%).
162 G. Wang, W. Um / Journal of Hydrology 472–473 (2012) 159–168
and Al-consumed Si concentration, assuming that the total Al con-sumed through the column was used to form nitrate-cancrinite to-gether with the released Si under a molar ratio 1:1 of Si:Al, i.e., DCof Si = measured [Si in solution] + measured [Al input-Al output].
The calculation of nitrate-cancrinite precipitation rates (Rpre)was based solely on the Al concentration consumed in the columnconsidering a stoichiometric number of 6 based on nitrate-cancri-nite chemical formula [Na8Si6Al6O24(NO3)2], assuming the releasedSi was sufficient (proved by steady-state release of Si output). Thenitrate-cancrinite precipitation rate was calculated as Rpre =�qDCAl/(6A), where q (L/s) designates the flow rate, DCAl (mol/L)stands for the Al concentration difference between the constantinput and the steady-state output solutions.
2.6. Estimation of porosity change in the porous matrix
Based on the measured input and effluent Si and Al concentra-tions and the effluent volume, either dissolved quartz or precipi-tated secondary mineral volume can be estimated as follows:
Vdis ¼XfV � ½�ðSiin � SioutÞ þ ðAlin � AloutÞ�
�Mxsio2 �g=qSiO2ð4Þ
Vpre ¼Xf½V � ðAlin � AloutÞ=6�Mxcanc�g=qcanc ð5Þ
Vchange ¼ ðVpre � VdisÞ=Vinit � 100 ð6Þ
Pchange ¼ ðVdis � VpreÞ=ðVcolumn � PinitialÞ ð7Þ
where V is the volume of effluent solution corresponding to eachsample, Vdis is the integrated dissolved volume of packed quartzsand, Vpre is the integrated volume of neo-formed nitrate-cancrinitesecondary precipitate, Vchange is the integrated volume change inpercentage relative to the initial packed quartz sand volume (Vinit),and Pchange denotes the porosity change relative to the initial poros-ity (Pinitial) in the packed column; Siin/out and Alin/out represent themeasured Si and Al molar concentrations of the input and effluentsolutions, respectively. Mxsio2 , MwSi, and Mwcanc are the molecularweights of quartz sand, elemental Si, and nitrate-cancrinite, respec-tively; qSiO2
and qcanc are the densities of pure quartz sand and ni-trate-cancrinite. Vcolumn is the total volume of each experimentalcolumn. As mentioned above, the total dissolved silica in Eq. (4)was calculated as the sum of the effluent Si and Al concentrations.In Eq. (5) the dominant secondary precipitate was assumed to be ni-trate-cancrinite and the calculated nitrate-cancrinite volume wasdetermined based on a 6:1 mol ratio of Al:cancrinite. For columnS1, Vpre was zero because only dissolution reaction was consideredto occur in column S1.
3. Results and discussion
3.1. Nitrate-cancrinite precipitates
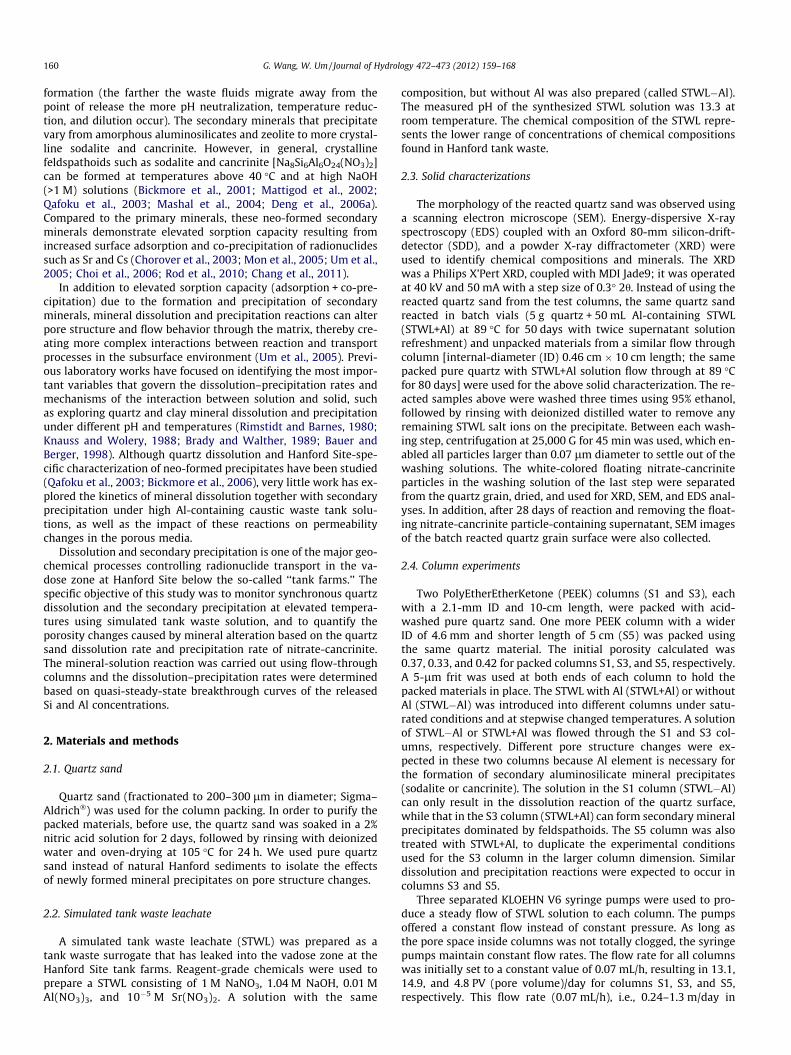
The neo-formed secondary precipitates on the reacted quartzwith the STWL+Al in the batch vials were identified by XRD, SEM,and EDS to be nitrate-cancrinite. Fig. 1 shows the XRD result, SEMimages, and EDS analysis of the neo-formed secondary precipitatescollected from the 50-day 89 �C reaction batch vials (Fig. 1a–f) andfrom the similar flow through column (Fig. 1g and h). The measuredXRD pattern (Fig. 1a) shows the identical characteristic peaks ofnitrate-cancrinite (Buhl et al., 2000), supported by the detectedelement compositions of O, Na, Si, and Al in the EDS analysis(Fig. 1b). Hexagonal platy crystal grew from precipitate and formedtwinned aggregates of cancrinites on the quartz sand surface(Fig. 1e). Meanwhile, more needle-shaped nitrate-cancrinite
crystals (Fig. 1c, d, and g) were observed, which could form ball-shaped aggregates (Deng et al., 2006b). The highly symmetrichexagonal needle shape reflects cancrinite’s hexagonal symmetry(Buhl et al., 2000) and is an indication of high crystallinity (Denget al., 2006b). These findings agree well with those of Bickmoreet al. (2001), who observed the nitrate-cancrinite precipitationimages using field emission scanning electron microscope (FESEM)micrographs on quartz sand reacted with a similar STWL solutionat 89 �C, and reported a saturation index (SI) of 1.3–1.7 withrespect to nitrate-cancrinite. The precipitates formed in the testedcolumns should be the same secondary mineral (nitrate-cancrinite)because of the same reaction temperature (89 �C) and long reactionperiod (about 150 days at 45 �C plus about 80 days at 89 �C). Thiswas confirmed by the SEM and EDS analyses (Fig. 1g and h) of theprecipitates from the similar flow through column in which thesame quartz-packed column was flowed through using sameSTWL+Al solution at 89 �C for 80 days, resulting in the sameneedle-shaped nitrate-cancrinite precipitate (Fig. 1g and h). Similarshapes of cancrinites formed on the quartz surface in the columnat 90 �C were also reported by Rod et al. (2010).
3.2. Column experiments
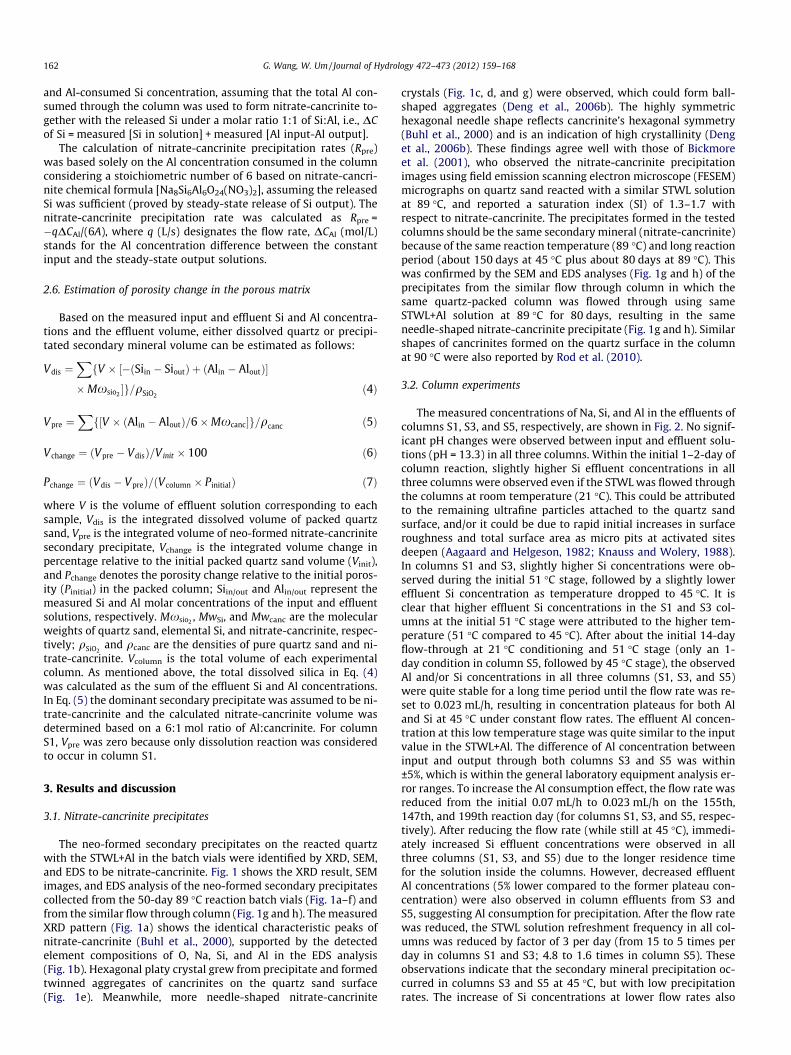
The measured concentrations of Na, Si, and Al in the effluents ofcolumns S1, S3, and S5, respectively, are shown in Fig. 2. No signif-icant pH changes were observed between input and effluent solu-tions (pH = 13.3) in all three columns. Within the initial 1–2-day ofcolumn reaction, slightly higher Si effluent concentrations in allthree columns were observed even if the STWL was flowed throughthe columns at room temperature (21 �C). This could be attributedto the remaining ultrafine particles attached to the quartz sandsurface, and/or it could be due to rapid initial increases in surfaceroughness and total surface area as micro pits at activated sitesdeepen (Aagaard and Helgeson, 1982; Knauss and Wolery, 1988).In columns S1 and S3, slightly higher Si concentrations were ob-served during the initial 51 �C stage, followed by a slightly lowereffluent Si concentration as temperature dropped to 45 �C. It isclear that higher effluent Si concentrations in the S1 and S3 col-umns at the initial 51 �C stage were attributed to the higher tem-perature (51 �C compared to 45 �C). After about the initial 14-dayflow-through at 21 �C conditioning and 51 �C stage (only an 1-day condition in column S5, followed by 45 �C stage), the observedAl and/or Si concentrations in all three columns (S1, S3, and S5)were quite stable for a long time period until the flow rate was re-set to 0.023 mL/h, resulting in concentration plateaus for both Aland Si at 45 �C under constant flow rates. The effluent Al concen-tration at this low temperature stage was quite similar to the inputvalue in the STWL+Al. The difference of Al concentration betweeninput and output through both columns S3 and S5 was within±5%, which is within the general laboratory equipment analysis er-ror ranges. To increase the Al consumption effect, the flow rate wasreduced from the initial 0.07 mL/h to 0.023 mL/h on the 155th,147th, and 199th reaction day (for columns S1, S3, and S5, respec-tively). After reducing the flow rate (while still at 45 �C), immedi-ately increased Si effluent concentrations were observed in allthree columns (S1, S3, and S5) due to the longer residence timefor the solution inside the columns. However, decreased effluentAl concentrations (5% lower compared to the former plateau con-centration) were also observed in column effluents from S3 andS5, suggesting Al consumption for precipitation. After the flow ratewas reduced, the STWL solution refreshment frequency in all col-umns was reduced by factor of 3 per day (from 15 to 5 times perday in columns S1 and S3; 4.8 to 1.6 times in column S5). Theseobservations indicate that the secondary mineral precipitation oc-curred in columns S3 and S5 at 45 �C, but with low precipitationrates. The increase of Si concentrations at lower flow rates also

(a) (b)
(c) (d)
(e) (f)
0 0.5 1 1.5 2
(h)
KeV5 µm
(g)
Fig. 1. XRD, SEM, and EDS results of nitrate-cancrinite created from batch reaction (5 g quartz + 50 mL Al-containing STWL solution) at 89 �C for 50 days with two timessolution refreshment (decanted and refilled). The free movable white-colored nitrate-cancrinite particles in the batch vial were collected after washing and used for XRD,SEM, and EDS analysis (a–d). (a) XRD results with characteristic XRD peaks of nitrate-cancrinite (Buhl et al., 2000) denoted as ‘‘C.’’ (b) The EDX results of the precipitateshowing chemical composition of Si, Al, Na, and O (data collected from spectrum 1 location in (c). (c and d) SEM images of the precipitated hexagonal needle-shaped nitrate-cancrinites. (e and f) SEM images on the quartz sand grain surface after 28 days at 89 �C batch reaction where the floated free movable nitrate-cancrinite particles wereremoved. (e) Twinning of platy crystals created precipitate aggregates where smaller hexagonal needle-shaped crystals grow. (f) Partly covered quartz grain surface by thelepisphere-shaped aggregate of nitrate-cancrinite precipitate. Same nitrate-cancrinite precipitates were observed in a similar flow through column, in which the same quartz-packed column was prepared by same STWL+Al solution at 89 �C for 80 days, resulting in the same needle-shaped nitrate-cancrinite crystals (Fig. 1g and h) precipitated.
G. Wang, W. Um / Journal of Hydrology 472–473 (2012) 159–168 163

Fig. 2. The breakthrough curves of the measured Na, Si, and Al concentrations in the flow-through column experiments (S1, S3, and S5). ‘‘STWL+Al’’ and ‘‘STWL�Al’’ representSTWL solution with or without Al, respectively. The orange and blue dashed lines denote the initial concentrations of Na and Al (C0 for Na and Al) in STWL, respectively. Thegraphs on the right side of figure are identical to those on the left (plus constant Na signal), but are shown with time on a log scale to better illustrate changes occurring duringthe first 10 days of reaction. The significant change of chemical concentrations in the graphs resulted from the flow rate (solid black line) and temperature (red dashed line)change manually. (For interpretation of the references to color in this figure legend, the reader is referred to the web version of this article.)
164 G. Wang, W. Um / Journal of Hydrology 472–473 (2012) 159–168
implied that Si dissolution from quartz sand was far from equilib-rium in our flow-through columns. Otherwise less dissolutionwould be expected due to the saturation of Si in the solution.
The temperature increase to 89 �C dramatically enhanced bothdissolution and precipitation reactions, in which Si and Al effluentconcentrations increased and decreased in columns S1 and S5,respectively. Column S3 also showed concentration changes inboth Si and Al in a similar pattern. Different reaction extents be-tween columns S3 and S5 may be attributable to differences inthe quartz sand mass (reactant) packed inside the two columns.In column S3 after the Si peak concentration resulting from thetemperature increase at 154 days of contact, the effluent Si concen-tration slowly decreased again from its concentration peak value.Meanwhile, the abrupt decrease in effluent Al concentration in col-umn S3 when the temperature was increased at 154 days of con-tact was correspondingly followed by a slow increase again. Thisphenomenon can be explained by the coverage effect of neo-formed (under higher temperature) nitrate-cancrinite on quartzsand grain surfaces which reduced the reactive surface sites,
leading to a decreased dissolution of quartz and thus a reducedeffluent Si concentrations as well. Correspondingly, a slightincrease of effluent Al concentration was observed to reach theinitial Al concentration again due to reduced consumption becausethe dissolved Si concentration decreased. In column S5, thistransient quartz surface coverage phase was much less obviousthan that found in column S3, which again could be explained bymore quartz sand packed in column S5. Theoretically, a similartransient pattern can occur during the lower temperature testperiod, but the surface coverage effect from the neo-formedprecipitate is considered negligible because of the much lowernitrate-cancrinite precipitation rate compared to that at 89 �C.This transient surface coverage effect could be confirmed by theno-decreasing effluent Si concentration in column S1 in which nosecondary mineral precipitate was formed because no Al wasincluded in the STWL. This surface area coverage due to precipita-tion is directly demonstrated by the SEM image in Fig. 1f, whichshows that part of the reacted quartz grain surface was coveredby the precipitated nitrate-cancrinite after 28 days of batch

Table 3Solid volume and porosity changes inside columns at the end of experiment tests.
Columns S1 S3 S5
Volume change (%) of quartz sand to the initial packed sand volume based on the total eluted Si concentrations in the effluents �23.8% �1.5% �4.2%Volume change (%) of quartz sand portion only participating in precipitation to the initially packed sand volume based on the total eluted
Al concentrations in the effluentsNA �7.0% �4.9%
Total volume change (%) of quartz sand to the initially packed sand volume �23.8% �8.5% �9.1%Percentage of nitrate-cancrinite volume created to the initially packed sand volume NA +21.7% +15%Final volume change (%) of solid to the initially packed sand volume �23.8% +13.2% +5.9%Initial packed column porosity calculated (–) 0.37 0.33 0.42Final column porosity calculated after STWL flow-through (–) 0.52 0.24 0.39Final porosity change (%) after entire experiment +40.3% �26.5% �8.4%
Density of quartz sand: 2.65 g/cm3; density value of 2.45 g/cm3 was used for nitrate-cancrinite (Bickmore et al., 2001). The molecular weight (1022 g/mol) of nitrate-cancrinite was calculated based on the chemical formula of Na8Si6Al6O24(NO3)2.
G. Wang, W. Um / Journal of Hydrology 472–473 (2012) 159–168 165
reaction with STWL+Al at 89 �C. Further studies are needed toelucidate the dependence of the Si dissolution rates on the surfacecoverage by cancrinite, especially for estimating long-termdissolution and precipitation rates of natural soil and sedimentsat a field scale. No significant changes in Na concentrations wereobserved in any of the columns because of the relatively highinitial Na concentration in the STWL compared to other elements.
3.3. Dissolution and precipitation rates
In order to validate the ‘‘far from equilibrium’’ prerequisite usedin Eq. (3) for the quartz dissolution rate calculation, we calculatedthe saturation index (SI) of the solutions in all three columns at45 �C and 89 �C using the PHREEQC code with the database of Min-teq V4 dat. With respect to quartz, the calculated SI was in a rangeof �4.04 to �4.59 for all three columns at two temperatures. The SIwas much less than 1.0, indicating the quartz dissolution was tak-ing place at far from equilibrium. The average concentration valuesfrom breakthrough plateaus at 51 �C, 45 �C, and 89 �C were used asAl and Si output concentrations at steady-state for the calculationof the average dissolution and precipitation rates. In addition, thereducing reactive surface areas caused by the precipitation cover-age on the quartz surface in columns S3 and S5 were consideredin the dissolution rate calculation. Reasonable surface-area-reduc-ing factors corresponding to each effluent concentration plateau at45 �C and 89 �C were estimated based on separate batch experi-ments at 89 �C using SEM image analysis (Bickmore et al., 2001).Bickmore et al. (2001) reported that the average surface coveragereached 32–33% on the quartz sand reacted with similar STWLsolutions (containing 1.0 M free OH�) after about 45 days of batchreaction at 89 �C. Assuming that the surface area coated by nitrate-cancrinite precipitates shows linear relation with reaction time, itis reasonable to assume that after 230–280 days of reaction, espe-cially including 83 days of reaction at high temperature (89 �C), atleast 60% of the initial reactive sand surface could be covered bythe precipitates at the end of experiments. Based on this linearrelationship, we estimated that the reactive surface area on thequartz sand grains in column S3 gradually decreased by 20% tillthe end of 45 �C stage column reaction, and further gradually de-creased by another 40% at the end of entire column testing period.Compared to column S3, half surface coverage factor, i.e., 10% de-crease at the end of 45 �C stage, and further decrease by another20% at 89 �C stage were approximately assigned to column S5 sincetwice as much quartz sand was used to pack the S5 column whilethe same flow rate was adopted for both S3 and S5 columns. With-in each temperature stage, an average surface coverage factor wasused in Eq. (3) for the dissolution rate calculation. The average sur-face coverage factors of 0.5 for the S3 column and 0.2 for the S5 col-umn were used for the 89 �C condition, while 0.1 and 0.05 valueswere used for the S3 and S5 columns, respectively, at the 45 �C pla-teau. The amount of reduction in the surface areas provided here
was a reasonable approximation. Direct measurement on thekinetics of the surface area reduction along the experiment processstill needs to be considered in a future study. No surface coverageeffect was considered for column S3 in the 51 �C stage because ofthe short reaction period (8 days) beginning with freshly packedquartz sand. Finally, in the rate calculation the limited changes incolumn pore volume (= V, the volume of solution in the column)was neglected during the 45–51 �C temperature stage. Instead,for all three column reactions at 89 �C stage, averaged V valuesbased on the porosity change (Table 3) for each column were usedin the rate calculation (+0.20, �0.13, and �0.042 for column S1, S3,and S5, respectively).
Regarding the surface area effect in the S1 column (dissolutiononly), we assumed that the change in the reactive geometric sur-face area at lower temperature stage (45–51 �C) due to pure disso-lution in this study can be ignored (only 1.5% of the initially packedquartz mass was flown out of the column). In addition, thisassumption is supported by Gautier et al. (2001), who studiedquartz dissolution rates and concluded that the observed increasein BET surface areas during dissolution consisted essentially unre-active etch pit walls, which contribute negligibly to mineral disso-lution. Over the higher temperature (89 �C) stage, the significantamount of the packed quartz sand release (23.8% of the initiallypacked sand at the end of entire experiment, see Table 3) throughdissolution resulted in a decrease of the total quartz surface areainside column by an average value of 12.7%. Correspondingly, theaverage pore volume inside column S1 was increased by 20.1%(= 40.3%/2, see Table 3) during this stage. Combining these findingswith the constant effluent Si concentrations observed in column S1(Fig. 2), it implies that the quartz dissolution rate was slowlyincreasing along the column reaction process. This can be ex-plained by the increase of the liquid to solid ratio inside column,which enhanced the dissolution process. Therefore, the rate valuesreported here are average quartz dissolution rates.
The experimental reaction conditions and determined averagedissolution and precipitation rates are listed in Table 2. Calculateddissolution rates (on average) in column S1 (8.33E�12 mol/cm2/sat 89 �C, 2.95E�13 mol/cm2/s at 51 �C and 2.27E�13 mol/cm2/sat 45 �C) were about 3 times higher than those from column S3(2.81E�12 mol/cm2/s at 89 �C, 2.25E�13 mol/cm2/s at 51 �C, and1.41E�13 mol/cm2/s at 45 �C) and column S5 (3.32E�12 mol/cm2/s at 89 �C and 1.21E�13 mol/cm2/s at 45 �C). Dove and Rims-tidt (1994) reported the quartz dissolution rates in pure water overa temperature range of 25–300 �C. Our determined dissolutionrates in each temperature stages (e.g., �10�12 mol/cm2/s at 89 �C,and �10�13 mol/cm2/s at 45 �C) were higher than the values of10�14 mol/cm2/s (at 89 �C) and 10�16 mol/cm2/s (at 45 �C) fromDove and Rimstidt’s (1994) in 2–3 orders of magnitude. This is rea-sonable considering the high pH (= 13.3) and high alkali cationssolution used in our experiments. As Dove and Rimstidt (1994)pointed out, the presence of alkali cations (especially, Na and K)

166 G. Wang, W. Um / Journal of Hydrology 472–473 (2012) 159–168
or increasing pH markedly increases the dissolution rate of quartzby orders of magnitude. However, the dissolution rates determinedin this study agree well with the values (10�12 mol/cm2/s at 89 �C)determined by Bickmore et al. (2006), who reacted quartz sandwith high pH (=11.3) solution containing various NaNO3 andAlðOHÞ�4 concentrations. Well agreement of the determined quartzdissolution rates in this study with previous literature values im-plies that our estimation on the surface coverage factor wasreasonable.
In the nitrate-cancrinite precipitation rate calculation, the ini-tial total reactive surface area of packed quartz (0.0057 and0.0117 m2 for S3 and S5, respectively) was used, assuming thatthe neo-formed nitrate-cancrinite could precipitate on the entiresand grain surface in columns. The new generated surface fromthe neo-formed nitrate-cancrinite particles which were attachedon the quartz sand surface and also available for accepting furtherprecipitations, was not taken into account. In order to differ fromthe ‘‘real’’ precipitation rate, we would call the reported rate valuesin this study as ‘‘pseudo precipitation rate’’, calculated based on theinitial grain surface of the packed sand. The average ‘‘pseudo’’ pre-cipitation rate was only determined for columns S3 (2.39E�13 mol/cm2/s) and S5 (2.28 E�13 mol/cm2/s) at the 89 �C teststage (Table 2). A reliable precipitation rate at lower temperaturecould not be determined because of the uncertainty in Al concen-trations. As mentioned before, no reliable Al concentration differ-ences between columns input and output solutions could beobviously determined due to higher flow rate adopted (0.07 mL/h). The determined dissolution and precipitation rates were usedin column matrix porosity change estimation (discussed later).
3.4. Activation energy for quartz dissolution
The temperature variation of mineral dissolution rates is gener-ally described with a version of the Arrhenius relation:
Rdis ¼ Be�Eact=RT ð8Þ
where B is a pre-exponential factor, Eact is the experimental appar-ent activation energy (kJ/mol), T is absolute temperature (K), and Ris the molar gas constant. The apparent activation energy can bedetermined by plotting natural logarithm of dissolution rates vs.1/T. Determination of the calculated dissolution apparent activation
Fig. 3. Apparent activation energy determination of quartz dissolution in STWLover a temperature range of 45–89 �C. The solid lines are the plots using the direct-measured dissolution rates with a uniform specific surface area of 0.00918 m2/g forthe quartz and the initial column pore volume in all three columns (S1, S3, and S5)in the calculations. The dashed lines are modified dissolution rates where thereduction of the reactive surface area on the quartz grains due to precipitation andthe changes of the column pore volumes were accounted for. It was estimated thatabout 60% and 30% of the quartz grains’ surface in columns S3 and S5 was coveredby secondary minerals after about 230 and 280 days’ reaction, respectively, while aloss of 23.8% of the initial total surface area was determined (Table 3) in column S1after 237 day’s dissolution.
energy of this study is shown in Fig. 3. The calculated apparent acti-vation energies based on our measurement data were 74, 54, and69 kJ/mol for columns S1, S3, and S5, respectively (a uniform spe-cific surface area of 0.00918 m2/g of the quartz sand and the initialcolumn pore volume were used for the calculations). As discussedabove, the reactive surface area of the originally packed quartz sandinside the column changed as the chemical reactions progressed(dissolution and precipitation), especially in columns S3 and S5where a decreased quartz sand surface area was expected due tothe coverage of accumulated precipitates on the quartz surfaces.Meanwhile, the pore volume inside each column also changed alongthe reaction time. If the surface area correction and pore volumechange inside columns are taken into account as discussed above,the dissolution apparent activation energy determined in columnsS1, S3 and S5 will be 81, 65 and 72 kJ/mol. Although there are onlytwo or three temperature steps available, the apparent activationenergies for quartz dissolution in SWTL estimated in this study(65–81 kJ/mol) agree well with the values determined by Doveand Crerar (1990) and Rimstidt and Barnes (1980), who reportedvalues of 71 ± 9 kJ/mol and 67–77 kJ/mol for quartz-water reac-tions, respectively. Tester et al. (1994) reported higher activationenergy of 89 ± 5 kJ/mol based on combining quartz dissolution ratesin pure water from five different experimental apparatuses coveringa temperature range of 25–625 �C.
3.5. Estimation of the pore volume changes in the porous media due toreaction
Table 3 shows the calculated solid volume changes inside col-umns at the end of tests due to dissolution and precipitation. Basedon the measured Si concentration and effluent volume using Eqs.(4)–(6), about 23.8% volume of the initially packed quartz sandwas removed by dissolution in column S1 after 237 days of reac-tion. For columns S3 and S5, both quartz dissolution and nitrate-cancrinite precipitation occurred synchronously during the entiretesting period, so the final solid volume change after 229 (in col-umn S3) to 280 (in column S5) days of reaction (compared to theinitially packed solid volume) in each column was an increase of13.2% and 5.9% for column S3 and S5, respectively. The negativevolume change of quartz sand in column S1 confirms that only dis-solution occurred in this column because the STWL�Al was used.However, the net positive solid volume change in columns S3and S5 indicated that more volume of solid was created by second-ary precipitation even if dissolution of quartz occurred. The net in-crease in the solid-phase volume could block the pores and affectpermeability, flow rates, flow pathway, and other associated masstransfer processes inside the columns.
3.6. Prediction of porosity changes based on dissolution andprecipitation rates
Calculated porosity changes in each column as a function oftime (i.e., reaction progress) are shown in Fig. 4 and the final poros-ity changes after entire experiments are listed in Table 3. In columnS1, after 237 days of reaction, including time periods at 45, 51, and89 �C, the calculated porosity in the column matrix increased by40.3% (only �3% increase resulted from reaction during the testperiod at the low temperature of 45–51 �C). Thus, the dissolutionunder STWL�Al increased the porosity from the initial value of0.37 to 0.52. In columns S3 and S5, the sum of the dissolutionand precipitation reactions at 89 �C resulted in a decrease in poros-ity because the precipitation created more solid volume via solid-phase precipitation compared to the increase in porosity caused byquartz dissolution. The final porosity decreased by 26.5% and 8.4%in columns S3 and S5, respectively. Thus, the porosity changed

Fig. 4. Porosity changes (% of the initial packed sand) in columns S1, S3, and S5contacting STWL during dissolution and precipitation reactions at 45 �C and 89 �C.The symbols represent porosity changes calculated based on the measured Si and Alconcentrations in the effluents. The dashed lines represent model predictions usingthe determined average dissolution and precipitation rates at each temperatureplateau considering surface area changes. The remaining available quartz sandsurface area for dissolution was estimated to be 0.8–0.4 and 0.9–0.7 times of theinitial surface values along the �80-day 89 �C test period for column S3 (154–229 days) and S5 (206–280 days), respectively. In column S1, the initial surface areawas used at low temperature stage (45–51 �C), and a linearly decreasing surfacereduction factor of 0.02–0.24 (due to the quartz dissolution along the process) wasapplied as the beginning (162 day) and ending (237 day) points during the entire75-day reaction process at 89 �C. The red dashed lines indicate the temperaturechange on reaction days 162, 154, and 206 for columns S1, S3, and S5, respectively(see Table 1 for detailed information).
G. Wang, W. Um / Journal of Hydrology 472–473 (2012) 159–168 167
from 0.33 to 0.24 and from 0.42 to 0.39 for the S3 and S5 columns,respectively.
In addition to the above-calculated porosity change directlyusing the monitored effluent Al and Si concentrations and effluentvolume, the porosity change could also be well predicted using thedetermined dissolution and precipitation rates, which are shown inFig. 4 as dashed lines. In columns S3 and S5, the reactive surfacearea was considered as a fitting parameter in the model prediction.The reactive surface area of the original quartz packed in columnsS3 and S5 was considered to decrease linearly as the nitrate-cancr-inite precipitation progressed, assuming surface reduction factor islinear. Values of 20% and 10% of the original quartz sand surfacewere roughly assumed to be covered after long-term reactions atlow temperature (45–51 �C) for column S3 and S5, respectively.In column S3, a linearly decreasing surface reduction factor of0.8–0.4 was applied to the initial surface area (0.0098 m2/g) asthe beginning (154 day) and ending (229 day) points during theentire 80-day reaction process at 89 �C (Table 1). In column S5, alinearly decreasing surface reduction factor value of 0.9–0.7 wasalso used for the beginning (206 day) and ending (280 day) points.Smaller surface reduction factor in column S5 was used comparedto column S3 considering the more packed solid mass inside col-umn S5. Although the estimated values are reasonable accordingto the surface image analysis performed by Bickmore et al.(2001), more quantitative study is needed to quantify the surfacecoverage due to precipitation. In the dissolution-only S1 column,the constant initial quartz surface area (0.00918 m2/g) was used
in the model prediction at low temperature stage (45–51 �C)assuming no reactive surface area obviously changed during thedissolution. However, at 89 �C experimental stage, a linearlydecreasing surface reduction factor of 0.02–0.24 (due to the quartzdissolution along the process) was applied as the beginning(162 day) and ending (237 day) points during the entire 75-dayreaction process at 89 �C.
4. Summary
This research investigated the subsurface mineral dissolutionand precipitation (caused by the tank-released caustic nuclearwaste solutions), and related subsurface porosity changes due toquartz dissolution at the beginning. Nitrate-cancrinite was formedon the quartz surface as a secondary mineral precipitate afterreacting with STWL+Al. Neo-formed secondary precipitates modi-fied pore structure so that porosity decreased as the reaction timeincreased. However, the quartz reacted with STWL�Al did notshow any secondary precipitates, resulting in increased porositysolely due to the dissolution reaction.
Porosity and flow path modifications can influence radionuclidetransport in the vadose zone below the Hanford Site tank farms.Because the mineral dissolution and precipitation rates are depen-dent on temperature and solution composition/concentration,varying dissolution and precipitation rates are expected at differ-ent zones within the field waste plumes. The varying temperatureand chemical concentration regimes in both time and space (dis-tance from the leaking Hanford tanks) result in the need to use atime-varying porosity values to understand radionuclide transportin the subsurface environment. Predictions of different dissolutionand precipitation rates as the released liquid wastes interact withthe underlying sediments as a function of time and space are sig-nificantly important to accurately predicting the fate of contami-nants at the Hanford Site.
Acknowledgements
This research was funded by the US Department of Energy(DOE) through Subsurface Biogeochemical Research (SBR) underGrant Numbers DE-FG02-09ER64747 (SUNY Stony Brook) andKP1702030-54908 (PNNL) and DE-FG02-06ER64190. The PacificNorthwest National Laboratory (PNNL) is operated for the DOEby Battelle Memorial Institute under Contract DE-AC05-76RL01830. The authors appreciate J. Serne’s (PNNL) discussionand review. The SEM, EDS, and XRD analyses were performed inEnvironmental Molecular Sciences Laboratory (EMSL). EMSL is anational scientific user facility sponsored by the DOE’s Office ofBiological and Environmental Research and located at PNNL. Partof this research was funded by Pohang University of Science andTechnology (POSTECH) supported by World Class University(WCU) program through the National Research Foundation of Kor-ea funded by the Ministry of Education, Science and Technology(R31-30005). The authors thank H.S. Chang and B. Williams fortheir laboratory support, and B. Steven for analyzing the samplesusing ICP-OES. The authors thank two anonymous reviewers fortheir comments which improved the manuscript.
References
Aagaard, P., Helgeson, H.C., 1982. Thermodynamic and kinetic constraints onreaction rates among minerals and aqueous solutions, 1. Theoreticalconsiderations. Am. J. Sci. 282, 237–285.
Bauer, A., Berger, G., 1998. Kaolinite and smectite dissolution rate in high molarKOH solutions at 35 �C and 80 �C. Appl. Geochem. 13, 905–916.
Bickmore, B.R., Nagy, K.L., Young, J.S., Drexler, J.W., 2001. Nitrate-cancriniteprecipitation on quartz sand in simulated Hanford tank solutions. Environ.Sci. Technol. 35, 4481–4486.

168 G. Wang, W. Um / Journal of Hydrology 472–473 (2012) 159–168
Bickmore, B.R., Nagy, K.L., Gary, A.K., Brinkerhoff, A.R., 2006. The effect of AlðOHÞ�4on the dissolution rate of quartz. Geochim. Cosmochimi. Acta 70, 290–305.
Brady, P.V., Walther, J.V., 1989. Controls on silicate dissolution rates in natural andbasic pH solutions at 25 �C. Geochim. Cosmochimi. Acta 53, 2823–2830.
Buhl, J.C., Stief, F., Fechtelkord, M., Gesing, T.M., Taphorn, U., Taake, C., 2000.Synthesis, X-ray diffraction and MAS NMR characteristics of nitrate cancriniteNa7.6[AlSiO4]6(NO3)1.6(H2O)2. J. Alloy. Compd. 305 (1�2), 93–102.
Chang, H.S., Um, W., Rod, K., Serne, R.J., Thompson, A., Perdrial, N., Steefel, C.I.,Chorover, J., 2011. Strontium and cesium release mechanisms duringunsaturated flow through waste-weathered hanford sediments. Environ. Sci.Technol. 45 (19), 8313–8320.
Choi, S., O’Day, P.A., Rivera, N.A., Mueller, K.T., Vairavamurthy, M.A., Seraphin, S.,Chorover, J., 2006. Strontium speciation during reaction of kaolinite withsimulated tank-waste leachate: bulk and microfocused EXAFS analysis. Environ.Sci. Technol. 40 (8), 2608–2614.
Chorover, J., Choi, S., Amistadi, M.K., Karthikeyan, K.G., Grossen, G., Mueller, K.T.,2003. Linking cesium and strontium uptake to kaolinite weathering insimulated tanks waste leachate. Environ. Sci. Technol. 37, 2200–2208.
Chorover, J., Choi, S., Rotenberg, P., Serne, R.J., Rivera, N., Strepka, C., Thompson, A.,Muller, K.T., O’Day, P.A., 2008. Silicon control of strontium and cesiumpartitioning in hydroxide-weathered sediments. Geochim. Cosmochimi. Acta72, 2024–2047.
Deng, Y., Flury, M., Harsh, J.M., Felmy, A.R., Qafoku, O., 2006a. Cancrinite and sodaliteformation in the presence of cesium, potassium, magnesium, calcium andstrontium in Hanford tank waste stimulants. Appl. Geochem. 21, 2049–2063.
Deng, Y., Harsh, J.M., Flury, M., Young, J.S., Boyle, J.S., 2006b. Mineral formationduring simulated leaks of Hanford waste tanks. Appl. Geochem. 21, 1392–1409.
Dove, P.M., Crerar, D.A., 1990. Kinetics of quartz dissolution in electrolyte solutionsusing a hydrothermal mixed flow reactor. Geochim. Cosmochimi. Acta 54 (4),955–969.
Dove, P.M., Rimstidt, J.D., 1994. Silica-water interactions. In: Heaney, P.J., Prewitt,C.T., Gibbs, G.V. (Eds.), Silica: Physical Behavior, Geochemistry and MaterialsApplications. Reviews in Mineralogy, vol. 29. BookCrafters, Inc., Chelsea,Michigan, pp. 280–284.
Gautier, J.M., Oelkers, E.H., Schott, J., 2001. Are quartz dissolution rates proportionalto BET surface areas? Geochim. Cosmochimi. Acta 65, 1059–1070.
Knauss, K.G., Wolery, T.J., 1988. The dissolution kinetics of quartz as a function ofpH and time at 70 �C. Geochim. Cosmochimi. Acta 52, 43–53.
Liu, C., Zachara, J.M., Qafoku, O., Smith, S.C., 2003. Effect of Temperature on Cs+sorption and desorption in subsurface sediments at the Hanford Site, USA.Environ. Sci. Technol. 37 (12), 2640–2645.
Mashal, K., Harsh, J.B., Flury, M., Felmy, A.R., Zhao, H., 2004. Colloid formation inHanford sediments reacted with simulated tank waste. Environ. Sci. Technol.38, 5750–5756.
Mattigod, S.V., Hobbs, D.T., Parker, K.E., McCready, D.E., 2002. Precipitation ofAluminum Containing Species in Tank Wastes. PNNL-13881. Pacific NorthwestNational Laboratory, Richland, WA.
Mon, J., Deng, Y.J., Flury, M., Harsh, J.B., 2005. Cesium incorporation and diffusion incancrinite, sodalite, zeolite, and allophone. Microporous Mesoporous Mater. 86(1–3), 277–286.
Pruess, K., Yabusaki, S., Steefel, C., Lichtner, P., 2002. Fluid flow, heat transfer, andsolute transport at nuclear waste storage tanks in the Hanford vadose zone.Vadose Zone J. 1, 68–88.
Qafoku, N.P., Aninsworth, C.C., Szecsody, J.E., Bish, D.L., Young, J.S., McCready, D.E.,Qafoku, O.S., 2003. Aluminum effect on dissolution and precipitation underhyperalkaline conditions: II. Solid phase transformation. J. Environ. Qual. 32,2364–2372.
Rimstidt, J.D., Barnes, H.L., 1980. The kinetics of silica–water reaction. Geochim.Cosmochimi. Acta 44, 1683–1699.
Rod, K.A., Um, W., Flury, M., 2010. Transport of strontium and cesium in simulatedHanford tank waste leachate through quartz sand under saturated andunsaturated flow. Environ. Sci. Technol. 44, 8089–8094.
Serne, R.J., Zachara, J.M., Burke, D.S. 1998. Chemical Information on TankSupernatants, Cs Adsorption from Tank Liquids onto Hanford Sediments, andField Observations of Cs Migration from Past Tank Leaks. PNNL-11495. PacificNorthwest National Laboratory, Richland, WA.
Taylor, A.S., Blum, J.D., Lasaga, A.C., 2000. The dependence of labradorite dissolutionand Sr isotope release rates on solution saturation state. Geochim. Cosmochimi.Acta 64, 2389–2400.
Tester, J.W., Worley, W.G., Robinson, B.A., Grigsby, C.O., Feerer, J.L., 1994. Correlatingquartz dissolution kinetics in pure water from 25 to 625 �C. Geochim.Cosmochimi. Acta 58, 2407–2420.
Um, W., Serne, R.J., Yabusaki, S.B., Owen, A.T., 2005. Enhanced radionuclideimmobilization and flow path modifications by dissolution and secondaryprecipitates. J. Environ. Qual. 34, 1404–1414.
Zachara, J.M., Serne, J., Freshley, M., Mann, F., Anderson, F., Wood, M., Jones, T.,Myers, D., 2007. Geochemical processes controlling migration of tank waste inHanford’s vadose zone. Vadose Zone J. 6, 985–1003.
Zhao, H., Deng, Y., Harsh, J.B., Flury, M., Boyle, J.S., 2004. Alteration of kaolinite tocancrinite and sodalite by simulated Hanford tank waste and its impact oncesium retention. Clays Clay Miner. 52, 1–13.