Embed Size (px)
Citation preview
Minding the Coast: Its Everybody's BusinessProceedings ofthe16* International Conference ofThe Coastal Society, Williamsburg. VA USA
ABSTRACT
TRACKING PROGRESS OF THE CHESAPEAKE BAY PROGRAM'S
NUTRIENT REDUCTION GOALS
Michael L. Clipper, Chesapeake Research ConsortiumMichael W. Palace, Science Applications International Corp., Annapolis MD
Thomas W. Simpson, Chair of The Chesapeake Bay Program's TributaryStrategy Workgroup, Maryland Department of Agriculture
Lewis C. Linker, United States Environmental Protection Agency, ChesapeakeBay Program
James E. Hannawald, Department of Agriculture-Natural ResourcesConservation Service, Chesapeake Bay Program
The 1987 Chesapeake Bay Agreement established the goal to attain the waterquality necessary to support the living resources in the Bay and its tidaltributaries. As part of this historic agreement, the jurisdictions of Maryland,Pennsylvania, Virginia, and the District of Columbia committed to reducenitrogen and phosphorous loadingto the Bay from controllable sources by 40 %by 2000, using 198Sas a base year. In 1992, the jurisdictions reaffirmed thisgoal and committed to attain it through the use of individual tributary strategiesto meet nutrient reduction loading levels established for all tributaries of theBay. Tributary strategy nutrient reduction progress is assessed with ChesapeakeBay Program's Watershed Model (WSM). Tracking of point source nutrientreductions are through nutrient reductions at the point of discharge and WSMsimulation of the load transported to the Bay. Tracking of Best ManagementPractices (BMPs) nonpoint nutrient reductions in fertilizer and manureapplications, atmosphericdepositionand/or septic system loads is obtained withchanges in land use or BMP nutrient reduction efficiencies, and the WSMsimulation of the load transported to the Bay.
Michael Clipper Modeling Fellow, Chesapeake Bay Program410 Severn Avenue
Annapolis, MD 21403Phone; (410) 267-5787Fax; (410) [email protected]
225

Minding the Coast: Its Everybody's BusinessProceedings ofthe1<f* International Conference ofThe Coastal Society, Williamsburg, VA USA
The South Carolina Coastal Management Program:
Evaluating Permitting in Critical Areas
M. Grant Cunningham,Clemson University
Background
Two bills introduced in the 1997 legislative session of the South CarolinaGenera] Assembly involved changing the presentstatusof the state's coastalmanagement program. One bill was introducedby Senator Holly Cork, aRepublican from BeaufortCounty, andthe otherby RepresentativeDavidWilkins, a Republican fromGreenville. Cork's bill would reestablish theindependent agency, CoastalCouncil, to run the coastalmanagement programby elevatingthe Office of Ocean andCoastal Resource Management (OOCRM)from its division-level status within the Department of Health andEnvironmental Control (DHEC). The Wilkins bill would allow DHEC to furtherdemote OOCRM to just a bureau-level program within an existing division ofthe agency. Speculationover the fate of both bills does not appear favorable,with a slim likelihood of either passing during the current session.
In lightof thesepending bills,questions about the necessity of eitherproposalareraised. Once a proudand highly touted program, the South Carolina CoastalCouncil was recognizedin 1992by the National Oceanicand AtmosphericAdministration (NOAA) for operatingthe best coastalmanagement program inthe country. NOAA is the lead federally agency forcoastal managementactivities, and it funds 29 federally approved state coastal programs each yearthrough its Coastal Zone Management Program. However, with therestructuring of stategovernment in 1994, the autonomous Coastal Councilwasabolished and the entire coastalmanagement program was moved to DHEC as anew internal division. In the fall of 1996, DHEC Commissioner Doug Bryantsoughtto changethe status of the divisionduring internal agencyreorganizationmoves,andthecoastal program wasmade a bureau withinanexistingdivision.Environmental Quality Control (EQC).
A furorarose led by legislators from coastalareas and environmental advocacygroups. They feared the move would lessenthe emphasis on protecting thecoastal environment. Officials from NOAA voiced concerns over the movealso.The long-standing headof the statecoastal managementprogram WayneBeam resignedshortly after Bryant's announcement to demote the programwithin DHEC. Beam had led the former Coastal Council since its creation in1977and laterbecamea deputy commissionerof DHECover the coastalprogram with its move to the agency during state government restructuring. Thelegality of further demotionof the coastal program was questioned, andthe StateAttorneyGeneral Charlie Condon stated afterreview in a non-binding opinionthat the legislature must approve the move. Subsequently, CommissionerBryant returned thecoastal management program to division status shortly afterthe Attorney General offered hisopinion; however, he named the head of theEQC division asheadof the coastal program divisionalso. Further, Bryant
226

announced that he would seek to carry out his internal reorganization by takinghisplanto statelegislators andasking fora billto allow thechange, which heclaimed was necessary to eliminateagency waste. Thus, House memberWilkins introduced his bill in February 1997, and Senator Cork countered byintroducing her bill less thana month laterin earlyMarch. A companion to theCork bill was introduced in the House in April 1997 with numerous sponsors.
Heretofore, the more importantaspect of this debate over the status of the SouthCarolina Coastal ManagementProgramhas not been discussed because politicalsquabbling has dominated the issue. A credible debate over an autonomousagencyadministering the coastal management programrather than a bureauwithina "mega-agency"can ensue following a thorough evaluationof theprogram's effectiveness inachieving stated goals andobjectives. In thisinstance, the effectivenessof the programcan be evaluated before restructuringand after to determine whether the change in program status affected goalattainment. If all things are equal on that front, then the debate can turn to issuesof efficiency (costs).
Evaluating Coastal Programs
Forthe mostpart,a coastal management program includes thosepolicies andprograms thataredeveloped toaddress situations of scarcity among naturalresources found in the coastal zone. At the time the federal Coastal ZoneManagement Act of 1972was passed, incidents of conflictbetweenvariousformsof economic development andestablished environmental valueswereextremelycommonthroughout the nation's coastalregion. The response by Congressto thegrowing crisis wastheenactment of legislation thatcalled fora balancing ofdevelopment andenvironmental concerns. Since thestates aresovereign in land-use controls, the Act did not establishany federal standards,allowing the coastalstatesand territories considerable leeway in the meansof achievingthe balance.Thisresulted in theprograms varying from state to stateboth in themethods ofweighing environmental anddevelopmental objectives andin theemphasis giventoeachduringthe implementation of policies (Zwicky andClark 1973; HealyandZinn 1985; Archer 1988).
The fact that the federal Act did not contain substantive standards did notnecessarily prevent thestates from developing strong, effective programs. Itdidmean theprograms werediverse. Thatdiversity is reflective of thegeographic,economic, political, andcultural differences foundamongcoastalstates,and thedifferences in the legaland institutional capacity of eachstate to exert authorityover thecoastalzone. Rightfully, eachstate tailored its coastalmanagementprogram to addressissuesaffecting coastalareaswithin its borders. Moreover,eachstate had to incorporate coastalzonemanagement policies into the frameworkof existing statelaws, policies andstandards. Lastly, eachstatehadto findor createthe properinstitutional arrangement to housetheauthority thatexercisedcontrolover itscoastalzone(Zwicky andClark 1973; HealyandZinn 1985;Archer 1988).
Thediversity between thestates andthe lackof substantive federal standards havegreatly complicated attempts to evaluate theeffectiveness of both the federal andindividual statecoastal management programs. For the mostpart, the purposeof an
227

evaluation is to respond to demands for information - information that will be usedto make policy decisions. Therefore, evaluations are necessary for several reasons,including: 1) to judge the usefulness ofongoing programsand policies and todetermine the need for improvements; 2) to assess the utility of innovativeprogramsand policies;3) to increase the effectiveness of program management andadministration; and4) to meet variousaccountability requirements(Lowry 1980;Rossi and Freeman 1980).
Methods of Program Evaluation
Approaches to policy evaluation are numerous, yet there is agreement amongresearchers that several basic items should be available to conduct an effective
evaluation of coastal management programs: 1) historical information to identifythe problems and their causes which led to the development of interest groupsand agencies and the passage of CZM legislation to address to the problems; 2)the structure of groups and organizations involved in coastal zone managementactivities, including interest groups and public agencies, and the nature of theinterrelationships that exist between them across the system; 3) the process fordecision making by governmental bodies involved in coastal zone management;4) the goals of coastal management policies and programs, as written in coastalzone legislation, listed as objectives in an agency's administrative guidelines,and carried out by those involved in coastal management activities; and 5)criteria to measure the achievement of goals (Swanson 1975; Englander,Feldmann and Hershman 1977; Lowry 1980).
Evaluating Relationships: Inputs to Outputs ~ Englander, Feldman andHershman (1977) stated that an early decision to focus evaluation efforts at onelevel of government is necessary —either federal, state, regional, or local, and aspecific definition of what is to be evaluated(which goal), as well as the criteriato be used must follow. Resource outcome (impact) and organizational process(implementation) problems peculiar to the level of government should be thesource of criteria for evaluation. Resource outcome problems are defined as"the expressed dissatisfactions with a naturalresource state," and organizationalprocess problems were "those deficient characteristics or procedures that inhibitan organization from attaining its goals and objectives."
The researchers found there was a close interrelationshipbetween various resourceoutcome problems, with one frequently cited as the cause ofanother. Whereasorganizational process problems were not as interrelated as the resource outcomeproblems, certain process problems wereidentified as leading to, if notcausingother process problems. By linkingresource outcome problems to organizationalprocessproblems, the latteris identified as probable causesof the former, and anassessment can be made to determine if a coastal management activity hasalleviated the resource problem at a particular point in time. Thus, an attempt canbe made to attribute the evaluation results to specific organizations, laws, andresource management programs.
228

First, the resourceproblem mustbe identified, then it can be determined whetheracoastal management program offered any remedy. Second, objective criteriameasuring the level of goal achievement must be developed.
Past Studies Utilizing PermittingData - A review of the literature on coastalmanagement indicated several earlyprogram evaluations analyzedpermit records.Swanson (1975) evaluated theeffectiveness of theSan Francisco BayConservationandDevelopment Commission withrespect to itscentral goalof regulating,through a permitting process, developments on, in or near the Bay - particularlythoseutilizing fills that woulddecrease thesize of the Bay. Rosentraub and Warren(1976) proposedthat coastal agenciesdevelopbasic information on their internalmanagement and decision processes from the permit records. Thus, a self-evaluative capacity iscreated allowing theagency to monitor andjudge itsactivities relative to goal achievement
Similarly, Sabatier (1977) found thatapproximately 97%ofall permits submittedto thesix regional commissions of California were approved. Using a differentapproach, he examined a random sample of thenearly 4%of regional commissiondecisions thatwere significant or controversial enough to beappealed to theStateCommission during a three-year period from February 1973 toJune 1975. Finally,McCreaand Feldman(1976) attemptedto examineand evaluate the first threeyearsof Washington state'sShoreline Management Act (SMA) from 1971 to 1974,focusing on the permit management system mandated by the SMA.
The South Carolina Coastal Management Program
As stated in the SouthCarolinaCoastal ZoneManagement Act of 1977,the policyof thestateis "toprotect thequality of thecoastal environment and to promote theeconomic andsocial improvement of thecoastal zone andof all thepeople of theState." This policy guided the South Carolina Coastal Council (SCCC) as itadministered the SouthCarolinaCoastalManagement Program(SCCMP)andsought to accomplish the following goals:
1) to develop a management program that will achieve a rational balance between economicdevelopment and environmental conservation of naturalresources in the coastal zone ofthe South Carolina;
2) to develop a permittingsystem foractivitiesin criticalareasofthe coastalzone (beaches,primary sand dunes, tidclonds andcoastal waters) that willserve to implement thegoals andobjectives of the management program andpromote thebest interest of allcitizensof SouthCarolina:
3) to promote intergovernmental coordination andpublic participation in the development andimplementationof the coastalmanagementprogramforSouth Carolina.
Accordingto the South CarolinaCoastalManagement Program,the State hasutilized a "performance standard approach" throughout its management plan;therefore, "evaluation effects" are focused on "theoutcomes and impactsofactivities, ratherthanon procedures and processes." Initially, a bodyof baselinedata was gathered (before the permittingprocess was instituted) for several of themostsignificantareas of possibleimpact, including beach access,beach erosioncontrol,tidelandsprotection, and marineand estuarinepollution. A numberof
229

indicatorsofchange were identifiedfor each of the areas of concern, and methodsweredevised wherebythese indicators were periodically monitored.
A New Approach to Policy Evaluation
There are numerous opportunities for policy analysts and researchers to applytheoryto coastal resourcemanagement issues,particularly socialorganizationtheory. Fourdevelopments support thispoint First, socialorganization theoryprovidesa new perspective, and evaluation researchefforts in the past have rarelyused this approach (Dillon and Miller 1986). Second, coastal resources aremanaged by various entities of organizedsociety, includinggovernmental agencies,interest groups, associations,and individuals(Ditton and Miller 1986;Born andMiller 1988). Third, scarce coastal resourcescreate the need for managementprograms to allocate their use, thus utilizingprinciplesof social organizationtheory. Last, social organization theory is rich with applicable constructs, such asconsensus, conflict, power and values, which are directly related to the highly-organized,politically-active institutions and interestgroups involvedin coastalzone management.
Theories of Public Policy-Making
From a theoreticalperspective, the processof public policy-makinginvolves thepolitical behavior of individuals, governmental agencies, and other authoritativegroups and institutions. In political sociology, there are several major theories toexplain the process ofpublic policy-making: 1) individual decision-making theory(or political behavior),2) elite theory, 3) group theory,4) institutionalism(complexorganizations), and 5) systems theory. Each of these theoreticalapproaches focusesattention on the inherent political aspect of public policy-making(Bauer andGergen 1968).
Perhaps, the most comprehensive of all the theories of policy making is thesystems approach. Bertrand (1972) stated that "human existence is constrainedby the necessity of forming systems of cooperation, and these systems aremanifest in terms of interactional patterns which are ordered and predictable."According to Talcott Parsons (1958) any system is characterized by action, orbehavior, that is oriented toward specific goals. Collective action is organizedaround relationships among several actors, creating a social system with sharedvalue orientations. Since these relations are not random, they consist of anetwork of roles. Two conditions must be fulfilled in order for the system toremain stable: the actors must in some degree remain committed to their sharedvalue orientations, and their role-playing activity must be in sufficientconformity with the norms of interaction so that action is possible within theframework of the system. Thus, value orientations, specific goals, andregularized patterns of role playing are all functional to a system; they are alsoanalytic variables that must be identified in order to understand the functioningof a system (Schoettle 1968).
Therefore,using a systemsapproach to evaluatepolicy-making requiresfocusingon the relationships (interactions) whichconnect thecomponents of the systemandwhichare the pathways by whichchangesarecommunicated amongthe
230

components (Perloff andWingo 1962); component elements are linkedalmostentirely through the intercommunication of information (Buckley 1967).According to Pool(1973), "[a]cts of communication canbe described as the threadthatholdsanysocialorganization together, if notthe skeleton thatdetermines thestructure. It appears thatsystems theory provides an approach which permits thecomplexity of socialcommunication to bedescribed and analyzed at a highlevelofabstraction."
One particularly interesting set of issuesworthinvestigating whendiscussingpolicyevaluation is the role of values in the policy-makingprocess. Neither the policymaker nor the evaluation researcher is totally free of values. In fact, they areseeking to achieveor maximize givenvalues. However, they should takeextraprecautions to keepsocialpressures or personal interests frominfluencing facts.These precautions caninclude theuseof multiple sources forcrosscheckinginformation, makingrawdata available for secondary analysis, and makingassumptions moreexplicit Policy-makers andevaluation researchers can alsoattempt tojustifythegoalstheyare seeking to achieve by demonstrating theirrelationshipto higher,widelyacceptedvalues (Nagel 1980).
Problem Statement
Since the CZMA did not establish federal standards, it has been difficult torigorously evaluate thefederal program's national impact on theprotection of thecoastalenvironment or on the rateof coastaldevelopment. More importantly, thereare no criteriaestablished to evaluatethe programs implemented by individualstates. The CZMAgave thestatesconsiderable leeway in establishing notonly therelative importance of particular environmental anddevelopment values butalsoinhow the balance between them would be struck. Therefore, the states andterritories participating in thefederal CZM program differ greatly from oneanotherin: 1)what toolsare employed to allocate coastalresources amongalternative uses;2) who actuallymakeswhichdecisions; 3) whichparties,includingdevelopers,environmental organizations, localgovernments, and individual citizens, havestanding toparticipate in thedeliberations orotherwise to influence thedecisions(Healy and Zinn 1985).
In implementing theirprograms, moststates haveusedthesametoolswidelyutilized in landuseplanning - regulation by permit zoningandsubdivision laws,comprehensive andspecific planning, acquisition of land, andformal and informalnegotiation amongaffectedparties(HealyandZinn 1985; Archer 1988). Bylookingat a state'seffort (the process)to implementa coastal managementprogram-- the institutional arrangement its policyobjectives, and the mechanisms toachieve itsobjectives - perhaps, an objective method of evaluating theimpact ofmanagement programs on coastalvaluescan be developed.
In particular, thisstudyattempted toevaluate the SouthCarolina CoastalManagement Program, focusing on thedecision-making process in the formation,implementation andevaluation of policies pertaining to themanagement ofcoastalresources in SouthCarolina. In this analysisan attempt was made to identifythesocial forces - political, economic, andtechnological - which have most likely
231

influenced the development and outcome of statecoastal zonemanagement policiesand programs. The objectivesof thisstudy were:
1. to develop a model of thecurrent socio-political process fordeveloping coastalresource
management policies in SouthCarolina priorto restructuring;2. to determine if the former Coastal Council achievedthe goals and objectives ofthe SCCMP.
Methodology
In this studya new approach forevaluating coastal management programs wasoffered by using thetheories of social organization - particularly thetheoreticalapproaches of publicpolicymaking - as a framework to analyzeprogramimplementation. Specifically, a case study of theSouth Carolina Coastal ZoneManagement Program was conducted toexamine theroles of various internal andexternal parties involved withcoastal management activities. Additionally, adatabase wascreated tocompile andanalyze over8300 permit applications thatwere processed bytheSouth Carolina Coastal Council during a 16-year periodfromSeptember1977to July 1993.
Through a historical analysis, a description of the structure of thestate institutionwas developed byexamining past organizational charts and delineating theiroperating rules and regulations. The organizational charts depict patterns ofinteraction betweencouncil membersand professional staff mat ultimatelyleads totheachievement of goals andobjectives bythe institution. Therules andregulations emphasize criteria andmethods forachieving theinstitution's goals andobjectives.
Permitting decisions were examined forthe 16-year period from fiscal year1977-78through 1992-93. Data obtained from thepermit files of theSCCC were codedona variety of topics, including: 1) the type permit requested; 2) itscounty andlocale (urban or rural); 3) the staffrecommendation; 4) the issues(values) raisedbystaff, if any; 5)theissues (values) raised byoutside individuals and groups, if any;6) thecouncil decision and the record ofeach member's vote, if applicable; 7) theconditions placed on thepermit if so issued; 8) ifappealed, theoutcome includingissues raised andthesubsequent vote bypermitting committee members and/or fullcouncil.
Findings
Based onempirical data, several hypothetical relationships were created whichlinked theparties involved with managing theState's coastal resources to thefinaldecisions onpermit applications. Theprimary interest was toexamine therolesthat various social actors fulfilledor fell shortof fulfilling within the policysubsystem. Inreviewing the literature onpolicy evaluation, research has shownthat, on one hand, some social actors assume roles that are designated within thelaw orpolicy for the permitting process, while onthe other hand, some social actorsassume roles thataresimply perceived toexist within thispolicy subsystem.Whether designated by lawor perceived byothers, theroles of various actors wereanalyzed tounderstand the relationship that existed between aparticular social actor
232

and a certain outcome of the decision-makingprocess for the coastal regulatoryprogram. Further, to determine thestrength of theassociation, thechi-squarestatisticwas computed for each relationship.
The analysisindicated that thedecision-making processfor permitting in criticalareas was mostly free of undue influence from any particularparty,but somepermitting decisions werequestioned by outsidepartiesinvolved in managingtheState's coastal resources. Overall, the permitting system operated within theboundaries established by lawto achieve the goalsand objectivesof themanagement program.
Implications
This studysuccessfully compiledandanalyzed data on permitting in criticalareaduring the 16-yearperiod before staterestructuring changed the statusof the SouthCarolinaCoastalManagement Program. In arguingthe meritsof two pendingbills- one that allows further demotion of the program within DHEC's organizationalstructure or the other that reestablishes the former Coastal Council - no argumentcan be adequately developed untilan attemptis made to analyzein a similarfashionpermitting data since restructuring in 1994.
Throughexamination of programperformance measuresreportedto the GeneralAssembly each year and madeavailable via its web site,a significant increaseinthenumber of permitapplications processed by OCRM hasoccurred (alongwithincreases in otherprogramactivities, suchas certifications, enforcement actions,and appeals). There were 1022permitapplications processed in the 1993-95report timeframe; 1378 in fiscal year 1995-1996; and 1133 in fiscal year 1996-97.All this,with no increase in the staff (about50 employees) after the restructuringchangewas implemented. The effecton thedecision-making processforpermitting as causedby thechangein the program'sadministrative statusand theapparent increased workload should beexamined utilizing the analytical frameworkdiscussed above.
Bibliography
Archer. JackH. "Coastal Management in theUnited States: A SelectiveReview andSummary."Technical Report SeriesTR-D-1. International Coastal Resources Project. University of RhodeIsland.1988.
Bauer. Raymond A. andKenneth J.Cergen. eds. TheStudyof Policy Formation. NewYork:The FreePress. 1968.
Bcrtrand, Alvin L. SocialOrganization: A General Systemsand RoleTheoryPerspective.Philadelphia: F.A. Davis Company, 1972.
Bom, StephenM.,andAllen H. Miller. "Assessing Networked Coastal Zone Management Programs."CoastalManagement,Vol. 16.(1988). 229-243.
Buckley.Walter. SociologyandModemSystemsTheory. Englewood Cliffs, NJ: Prentice-Hall. 1967.
Ditton. Robert B.. andMarc L. Miller. "Coastal Recreation: An Emerging Areaof Management ConcernandResearch Opportunity." LeisureSciences.8. No. 3. (1986).223-239.
233

Englander. Ernie.Jim Feldman, and Marc Hershman. "Coastal Zone Problems." Coastal ZoneManagement Journal. 3. No. 3. (1977).217-236.
Healy. Robert G. andJeffreyA. Zinn. "Environment andDevelopment Conflicts inCoastal ZoneManagement." Journal Of The AmericanPlanning Association, SI, (Summer 1985),299-311.
Lowry,G. Kern,Jr. "Policy-Relevant AssessmentofCoastal Zone Management Programs." CbastalZone ManagementJournal, 8, No. 3, (1980),227-2SS.
McCrea,Maureen,and James H. Feldman. "InterimAssessment ofWashington State ShorelineManagement" Coastal Zone Management Journal, 3, No.2, (1977). 119-150.
Nagel.StuartS. "Introduction: PolicyAnalysisResearch. What It IsandWhere It IsGoing." ImprovingPolicyAnalysis.Ed. StuaitS. Nagel. Beverly Hills: SagePublications, Inc., 1980.
Parsons, Talcon. "SomeHighlights of theGeneral Theoryof Action." Approaches to the StudyofPolitics. RolandYoung,ed. Evanston. IL:Northwestern University Press, 1958.
Perloff, Harvey S. andLowdonWingo,Jr. "Urban Growth andthePlanning of OutdoorRecreation."Land& Leisure; Concepts andMethods inOutdoor Recreation, ed. DavidFischer, John E Lewis,andGeorge B. Priddle. Chicago:Maaroufa Press,Inc., 1974.
Pool, IthieldeSola Pool. "Communication Systems." Handbook of Communication, ed. IthieldeSolaPool, WilburSchramm, et al. Chicago: RandMcNally College Publishing Company, 1973.
Rosentraub,Mark S.. and RobertWarren. "InformationUtilizationandSelf-EvaluatingCapacities forCoastal Zone Management Agencies." Coastal ZoneManagement Journal, 2, No. 3, (1976), 193-221.
Rossi,PeterH. andHoward E. Freeman. Evaluation: A SystematicApproach. Beverly Hills: SagePublications, 1982.
Sabatier,Paul. "State Review of Local Land-Use Decisions:The CaliforniaCoastal Commission."CoastalZone ManagementJournal, 3, No. 3, (1977),255-290.
Schoettle, EnidCurtis Bok. "TheStateof the Art in Policy Studies." The Studyof Policy Formation.RaymondBauerand Kenneth Gergen, eds. New York:The Free Press, 1968.
Swanson. Gerald G "Coastal ZoneManagement from anAdministrative Perspective: A Case Studyofthe SanFrancisco BayConservation andDevelopment Commission." Coastal ZoneManagementJournal. 2. No. 2. (1975). pp. 81-102.
Zwicky.Steven, and John Clark. "Environmental Protection Motivation inCoastal ZoneLand-UseLegislation." Coastal Zone Management Journal. I. No. 1,(1973),103-108.
M. Grant Cunningham Clemson UniversityDepartment of Planning and LandscapeArchitecture
131 Lee Hall
Clemson, SC 29634-0511Ph (864) 656-1587 Fax (864) [email protected]
234

Minding theCoast:ItsEverybody's BusinessProceedingsof the 16thInternational Conferenceof theCoastalSociety, JufyI2-lS. 1998. Williamsburg. VA USA
THE USE OFTHE RATIO OF NATURAL COAST AS A USEFUL INDEX SHOWINGTHE NATURAL COASTAL ENVIRONMENTON THE MACRO LEVEL IN JAPAN
Asami SHIKIDA
The coastal zones are obviouslyimportantareas. It is the interfacebetween landwherehumankind liveand sea whichprovides numerous biological, spatial andenergy resources. Most ofuswould accept that thevalue of thecoastal zone isprecious andthezone should be preserved forthenext generation.
Wein these days, however, areconfronted byseveral difficulties. Theeffect ofhuman-induced pressure hascaused serious impacts on thecoastal environmentIt is obviousthat humanactivityboth industrial and non-industrial has damagedmarine andcoastalecosystems and natural processes. Landreclamation ofshallowwater to create useful industrialsite is a typicalexample. It has causesdetrimental effects on the natural environment in the coastal zone and, at worstestuaries and wetland systems arecurrently beingdestroyed. Demands forinexpensive industrial and residential land arelikely to be themain cause of thisproblem. These deformations certainly involve losses of natural shorelines,because naturalshorelinesare oftenmodifiedby coastal land use and landprotection. Therefore, monitoring of natural shorelines canbean importantindex to measure the loss of the natural environment
Except forthree national coastal environmental investigation projects conductedat the beginning of 1978bytheEnvironmental Agency of Japan,noinvestigations have so farbeen conducted toexamine thelength of naturalcoastlines. Thisreport is todevelop anefficient monitoring toolof naturalcoastal environment usingnational coastal statistics and presenthistoricalchanges in natural shorelines in Japanafter 1960.
The value and utilization of the coastal zone in Japan
Thepreservation of thenatural environment in thecoastal zones isoneof theimportant issues inJapan, notonly because of itssignificance forcoastaldependent development and industries such as fisheries, butalso itsrecreationaland tourism values. In fact a largenumber of people loveto stay in thecoastalzonefor tourism purposes andspend some timetherefor theirrecreation, suchasbathing andrecreational fishing. A national survey conducted bythePrimeMinister's Office in 1995suggestedthat approximately 50% ofpeople going tocoastal areas, use the coastal zone for recreational purposes (Prime Minister'sOffice,1995). Forexample, according to theNational LeisureCenter,morethan30 million peoplego to beaches for bathing particularly in the summerseason(National Leisure Center, 1995). Another 30 million recreationalfishermen enjoy saltwater fishing throughout theyear (Ministry of Agriculture,Forestry and Fisheries, 1995). Furthermore, over300thousand pleasure boatsarecurrently innavigable coastal waters around Japan, and thenumber isincreasing everyyear(National Leisure Center, 1995).
235

Pressures and subsequent modifications on the coastal environment
Although the importance of the coastal zones has been widely accepted, asmentioned before, Japanese coastal zones have faced intense developmentpressuresduringJapan's higheconomic growth. There havebeen numerouslossesand degradations of coastalwetlands, estuariesand shallow waters. Thecoastal environment in Japan has been seriouslymodified.
There are three major reasons for these modifications. Firstly, demands for landfor residential and industrial use have been continually rising along with Japan'shigheconomic growth. This is originally stemsfromthe riseof landpricesinJapanduringdramatic economic growth afterWorld War II. Privateenterpriseshaveplanned to obtaininexpensive landsfor industrial development tomaximizetheir profits. These industrial developments accelerated the expansionof demand for residential land among workersas well. Local and nationalgovernments carriedout large-scale landreclamation projects to respond totheserequirements. As a result, over 120,000 ha of coastal waters havebeenfilled from 1945 to 1975 (Wakabayashi, 1977).
Secondly, constructions of largeportsforJapan's improved tradeinduced themodification of natural coastlines. As of 1997, there are 1,094 ports for marinetransportation in Japan(Ministry of Transportation, 1997). Theseconstructionsaccompanied by the installation of related facilities provoked large-scale lossesof coastal estuaries. In addition, constructions of small local fishing ports haveresulted in incrementaland piecemeallosses of importantcoastal wetlands.Approximately 2,500fishing portshavebeenconstructed and re-constructedafter 1945 (National Fishing Port Association, 1997).
Thirdly, shorelineerosion problemsoccurred widely in the Japan's coastalzones.This is partlybecauseof natural cycles,but the rise of privatepropertyvalues in coastal zone also requires further protectionof shorelines fromhazardous erosions. This led to the steep increase in shoreline protection insteadof adopting setbackrestrictions or strategic retreat. Natural shorelines have beenreinforced by concreteconstructions, suchas seawalls, breakwaters and groins.On the other hand, few localgovernments imposed restrictions on the buildingof erosion control structures. As a result, man-made structures on shorelineshave increased drastically. Theseprotections have involved the modification ofnatural shorelines as well. In particular, the number of artificial coasts rosesteadily during the last three decades.
Needs for macro level index valuing environmental preservation
Monitoring the environment is a basicapproach in managing any naturalenvironment. The same can be said for the coastal zone. Once coastaldevelopment occurs in a certainarea,as wenoted, the development is likelytomodify the natural coastlines because thecoastal development needs to utilizebeaches and shorelines for the construction of facilities and land use. Therefore,a ratioof the length of natural coasts to modified shorelines canbe used as apractical index showing thedegree of thenatural environment in thecoastalzone.
236
It must be noted that we have only limited information on national and regionallevel alternation of the natural environment Lack of these macro level indices
cause serious problems in discussing environmental preservation in the coastalzone in Japan because no policy makersand governments show practicalguidelines to balance preservation and modification of natural coasts.
Except for national coastal environmental investigation projects conducted in1978,1984 and 1993 by the Environmental Agency of Japan, no investigationshave so far measured the length of natural coastlines. The author developed anefficient monitoring tool of the naturalcoastal environment and present chronicchanges in natural shorelines in Japan using national coastal statistics.
Using the ratio of natural to entire coast as a practical index
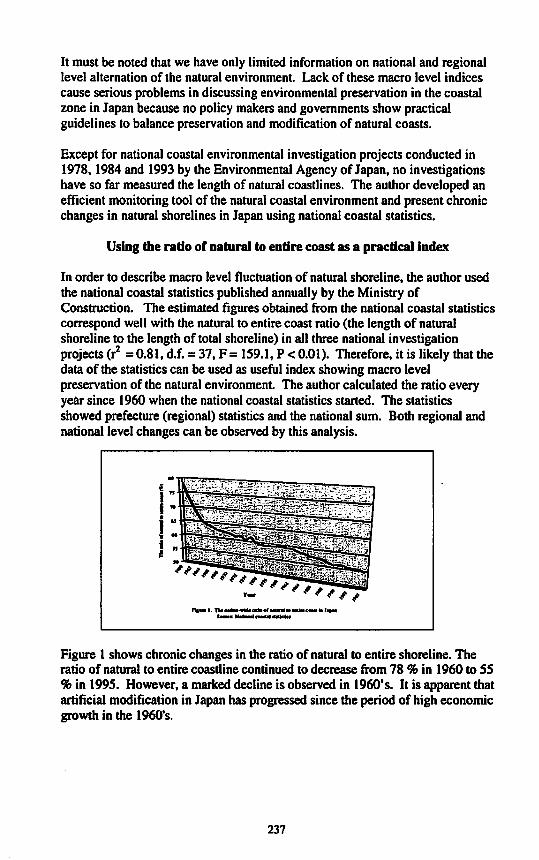
In order to describe macro level fluctuation of natural shoreline, the author usedthe national coastal statistics published annually by the Ministry ofConstruction. The estimated figures obtained from the national coastal statisticscorrespond well with the natural to entire coast ratio (the length of naturalshoreline to the length of total shoreline) in all three national investigationprojects (r2 =0.81, d.f. =37, F= 159.1, P<0.01). Therefore, it islikely that thedata of the statistics can be used as useful index showing macro levelpreservation of the natural environment The author calculated the ratio everyyear since 1960 when the national coastal statistics started. The statisticsshowed prefecture (regional)statistics and the national sum. Both regional andnational level changes can be observed by this analysis.
Figure 1 shows chronic changes in the ratio of natural to entire shoreline. Theratio of natural to entire coastline continued to decrease from 78 % in 1960 to 55
% in 1995. However, a marked decline is observed in 1960's. It is apparent thatartificial modification in Japan has progressed since the period of high economicgrowth in the 1960's.
237

Figure 2 describes thesizeof land reclamation in designated fishery right watersafter 1963 whenthe Japan marked higheconomic growth afterWorldWar II. Itis likelythat reclamation of wetlands and estuaries strongly affected thesharp
rtftn 2. Stu ofrtcbtand tod In dfriguhd Ittnjr ritll ••tenud Ckenils of Minidart to tatlrt coed
drop of the ratio of natural to entire coast Furthermore, Figure 3 indicated thatthe cumulative size of reclaimed water clearly correlates the ratio of natural toentire coast.
In addition, based on the data from the statistics, the history of the artificialmodification of the coastline falls roughlyinto two phases. The first phasebegan in 1960and is characterized by the rapid decrease in natural coastline.The second phase began in 1980 and shows a substantial loss of naturalcoastline in an area designated by the Coastal Protection Act as needingprotection.
^y/fe^u^^b^^ £%%^^*$$®.i
t)jn um ts.oi
The rmtfo or nttoral to entire cut! (»)
t»e !• 4«l|Kttte hfcwf ritbl viltr
238

The recent changes in the ratio of natural to entire coast in Seto Inland Sea Area
Seto Inland Sea is located between southeastern Honshu and Shikoku islands.
The area holds approximately 30% of Japan's industrial production. Thechronic record suggests that the ratio has continuously and clearly decreased inSeto Inland Sea Area where numerous land reclamation projects have beencarriedout (Figure4). It is suggested that the increase in artificial coast in SetoInland Sea area showed that the Seto Inland Sea Special Protection Act did notprevent landfills in the area.
Ftgm 4. The ratio at uturml (e srttfldal c I fa Seto Marl Sea Ana
References
Ministryof Agriculture,Forestry and Fisheries (I99S), ReportNo2 of the 9th Fisheries CensusSurveyed at November 1 of 1993.
MinistryofTransportation (1997), PortHandbook 1997.
National FishingPortAssociation(1997), Fishing Portand FishingVillage Handbook 1997.
National Leisure Center (1995), Leisure White Paper 1994.
Prime Minister's Office (1995), Needs for coastalzones in Japan,Monthlypubuc-opinion-poll,27(5), 2-37.
Wakabayashi.K. (1994), PresentStatusof Shorelines, Tokasaki, Y. and Kihara, K. eds., inIrihomaken, Tokyo, Japan publishers, 13-24.
AsamiShikada Kanazawa Institute ofTechnologyFaculty of Environmental Systems Engineering7-1 OhgigaokaNonoichi Ishikawa 921-8501 JAPAN
Phone number: +81-76-294-6710Fax number: +81 -76-294-6711
239

Minding the Coast: Its Everybody's BusinessProceedings ofthe I6'k International Conference ofThe Coastal Society, Williamsburg, VA USA
Abstract
Can We AggregateSpatial Data from severalWisconsin Countiesinto a Lake Michigan Region Coastal GIS?
Allen H. Miller, Assistant Director for Advisory Servicesand
David Hart, Coastal GIS Specialist Land Information andComputer GraphicsFacility
University ofWisconsin-Madison
The approach to land records modernization in Wisconsin has been to stimulateGIS development at the county level. As custodians of the majority of recordsabout the land e.g. ownership, assessment and propertydescriptions, countiesare the building blocks ofWisconsin's efforts. With digital records at the countylevel, the question becomes: Can we aggregatethese data into special purposemulti-county databases for use by managersat a regional, state, or federal level?The Land Information and Computer Graphics Facility at the University ofWisconsin-Madison in conjunction with the Wisconsin Coastal ManagementProgram is trying to answer that question in the eleven Lake Michigan coastalcounties.
Concern over shore erosion and potential property damage caused by high lakelevels and severe storms has generated a need to understand and evaluatepotential impacts from a state and GreatLakes-wide perspective.Thepresentation will identify the opportunities and challenges of building multi-county databases from county data.
David A. Hart, AICP Land Information and Computer Graphics FacilityRoom B102, Steenbock Library550 Babcock Drive
Madison, WI53706phone: (608) 263-5534fax: (608) 262-2500email: [email protected]
WWW:http://www.lic.wisc.edu/~dhart/dhart.htm
240

Mindingthe Coast: Its Everybody's BusinessProceedings ofthe 16* International Conference ofThe Coastal Society, Williamsburg, VA USA
DIVE OPERATOR USE PATTERNS IN THE DESIGNATED FLORIDA
KEYS NATIONAL MARINE SANCTUARY (FKNMS) NO-TAKEZONES: A TABULAR ANALYSIS
Manoj Shivlani, University of Miami, andDaniel O. Suman, University ofMiami
Introduction
The Florida Keys, containing the United States' only continental coral reefecosystem, hosts several million visitors annually. In 1995-96, the estimatedtourist total was 3.06 million individuals (Leeworthy and Wiley, 1996). Of thattotal, 31.3 percent of the visitors participated in diving or snorkeling activities.Coupled with the tourism influx into the Florida Keys, 80,000 permanentresidents live in the region and many participate in the same activities as dotourists. Special activities, such as the spiny lobster recreation season, attract asmany as 30,000 divers within a single month to the region (Hunt, 1994). Studiesin South Florida and other regions containing coral reefs have determined thatdivers and snorkelers cause a variety of impacts on the marine resources,including physical damage caused by inexperienced users (Tilmant 1987),increased incidence ofdamage caused by increased rates of use (Tilmant andSchmal, 1981), and a greater susceptibility among the organisms to naturalperturbations as a result ofdiver/snorkeler interactions (Sullivan et. at, 1996).Moreover, chronic damage can also affect the aesthetic or amenity value of theareas (Hawkins and Roberts, 1996; Dixon, et. al., 1993).
The Florida Keys National Marine Sanctuary (hereafter 'FKNMS'), designatedin 1990, proposed a series of action plans and regulations as part of its DraftManagement Plan (hereafter 'DMP') devised to minimize such water activityimpacts to sensitive habitats within its boundaries. One of the most significantstrategies in the DMP was the Zoning Action Plan. Zoning, or "the setting asideof areas for specific activities to balance commercial and recreational interestswith the need for a sustainableecosystem"(NOAA, 1996), led to the proposeddesignation of 26 Sanctuary zones, including three ReplenishmentReserves(RR), 19 Sanctuary Preservation Areas (SPA), and four Special-use Areas(SUA). The proposed RRs and SPAs would have constituted 5.26 percent of theSanctuary, and die SUAs would have constituted 0.02 percent of the Sanctuary.The proposed Sanctuary Regulations outlined the activity regulations withinthese zones and restricted all harvesting of marine resources within the 26 zones(with the exception of the Key Largo Replenishment Reserve in the UpperKeys) and all activities except passage in the four SUAs unless expresslyauthorized by NOAA.
Although the DMP permitted recreational diving in all the zones except theSUAs, the FKNMS recognized the potential negative impacts of unregulatedwater activities. In response to those impacts, the FKNMS proposed a carryingcapacity study that would determine the effects of recreation and boatingactivities on Sanctuary resources, establish user carrying capacities that would
241

minimize impacts, and impose limits in high-useand sensitive areas, includingthe SPAs "where no-anchoring zones should be established" (NOAA, 1995).
Our study determines the extent of zone use by commercial dive operators in theFKNMS and analyzes the importance of individual zones to the group. Theanalysis, generated using a Geographical Information Systems (GIS) approach,determines the relationships between users and zone locations, identifies specificzone preferences, and discusses effects of potential zone closures and carryingcapacity limits on users (Bonham-Carter, 1994;Laurini and Thompson, 1992).The relational model provides a holistic view on user zone preferences andsubsequent user perceptions of Sanctuary zoning strategies.
We anticipate that commercial dive operatorsdisproportionately visit FKNMSzones and selectively impact marine resources. Dive use may grow significantlyin the regions that the FKNMS has designated for protection, and withoutcontrolling the number of visits per site, the zones may not achieve theirobjectives of resource protection.
Methodology
The Florida Keys is a congregation ofcoral and limestone islands connected tothe mainland ofFlorida via a 135-mile highway (Halas et at, 1993). The regionand a small southwestern section of peninsularSouth Florida form MonroeCounty. We initially conducted a "pilot survey" periodsession during which wedetermined pertinentissues amongdive operators and identified the total diveoperator population. We then developed the survey instrument which wasconducted on site and in person.
We conducted the pre-survey, pilot survey, and mailers in September andOctober 1995. Field surveys and data collection started in October 1995 andended in June 1996. Finally, we coded and analyzed the databetween July andSeptember 1996.
We divided the Florida Keys into three study regions based on theirgeographical differences: the Upper Keys, ranging from Key Largo to LongKey; the Middle Keys, from Conch Key to the islandof Marathon; and theLower Keys, from the Content Keys to Key West Refer to Figure 1 for a mapof the study area, sub-regions, the FKNMS, and other significant protectedareas.
242

FIGURE 1: FKNMS boundaries and proposed zones
GULF OF MEXICO
Dljr Tortocu Natiaoal Park(natlncludadinFKNHS)
ZflNB LEGEND
1- Key Largo RR2- Cacysfcrt SPA3- The Elbow SPA
4- Dry Rocks SPA5- Grecian Rocks SPA6- French ReefSPA7- Molasses ReefSPA
8- Conch Reef SUA9- Conch Reef SPA
10- Cheeca Rocks SPAll-Davii ReefSPA
12- Ken and Chickens SPA
13- AlligatorReefSPA14- Tennessee ReefSUAIS-Coffins Patch SPA
16- Sombrero Key SPA17- Newfound HarborKey SPA18- Lone Key SPA
13 12
ATLANTIC OCEAH
19-LooeKeySUA20- Pelican Shoal SUA
21- Sambos RR
22- Western Sambo SPA
23- Eastern Dry Rocks SPA24-Rock Key SPA25-Sand Key SPA26- Dry Tortugas RR
NOTE: RR refers to replenishment reserves; SPArefers to sanctuary preservation area, andSUArefers to special-use area
In our surveys, we querieddive operators on the total number of trips they madein 1995, the average number of divers/snorkelers they took per trip, thepercentage of their total tripstakento individual zones designated undertheDMP Zoning Action Plan. We alsoasked dive operators to list their typical tripcosts, and whether they allowedconsumptive activities such as spearfishingontheir trips.
Upon completion of the survey period, we created a shape file (usingARCINFO) for the 26 Sanctuary zones and added zone trip and diver/snorkelerperzone datafor each zone as field attribute data(ESRI, 1996). This shape filewas then overlaid with a Monroe County shape file (using ARCVIEW) to whichwe added dive operator density by island data as field attribute data. Theresulting images, discussed in the following section,demonstraterelative spatialimportanceofdive operator density with zone use, as well as the significance ofindividual zones to dive operators.
Results
Refer to "GlS-based analysis of dive operator use patterns in the designated no-take zones within the Florida Keys NationalMarine Sanctuary" (in preparation)by M. P. Shivlani and D. O. Suman for a graphical analysisof the tabulardatapresented in this abstract.
243

We surveyed a total of62 dive operators, out ofa populationof75, in theFlorida Keys. A majority of our interviews were conducted in the Upper Keysregion where we surveyed 88 percent of the dive operators. In the Lower andMiddle Keys, our surveys included 87 percent and 58 percent of the operatorpopulations, respectively.
Table 1 below presents the total trips and divers the dive operator samplereported in 1995. The table also determines the percentageof trips made toFKNMS zones, as well as the percentageof divers that dive operatorstransported to FKNMS zones.
TABLE 1
RS3ION TOTAL TOPS ZOtCTHPS %ZONETOPS TOTAL DA/SB zorc OVERS
1. Upper Keys 16,020 12,131 75.7 349,604 290,572
2.MrJdbKeys 2.295 808 35.1 23,685 5,544
3. Lower Keys 6395 4,164 63.1 76.390 50,301
TOTAL 24,910 17,101 68.7 449,679 346,417
In total, the respondenu reported making almost 25,000 dive trips in the FloridaKeys in 1995. These trips transportedapproximately 350,000 divers andsnorkelers. FKNMS zones constituted a significant percentage of dive operatortrips in 1995, as almost 69 percent of all trips were made to one of the 26designated zones. Dive operators in the Upper Keys made the greatest numberof trips and attracted the highest total of divers. FKNMS zone trips were alsothe highest in the Upper Keys, as over three-quarters of all trips in the regionwere bound for an FKNMS zone. Lower Keys dive operators also relied onFKNMS zones, as 63 percent of their 6,595 trips were made in one of the zones.Only Middle Keys operators, who made the least number of trips, did not makemore than 35 percent of their trips to FKNMS zones. Table 2 presents the tripstaken to each FKNMS zone.
TABLE 2zorc 1995 trips 1995%trks 1995 divers 1995% (fivers tots) users dhreisil/lp
1. Key Largo RR 116 0.7 4.257 1.3 2 36.7
2. Carysfort 166 1 8.088 1.8 5 36.7
3. TheBbow 1.433 8.4 25413 73 13 17.7
4. Dry Rocks 1.169 6.8 54,701 15.8 14 463
5. Grecian Rocks 1.961 11.4 68,326 19.7 12 34.8
6. French Beet 1.603 9.4 44,609 12.9 16 27.8
7. MjlassesReef 3,007 17.5 62218 17.9 22 20.7
8. Conch Reel SUA 220 1.3 1.859 0.5 10 83
S. Conch Reef 732 4.3 5.270 1.5 16 72
10. OxKca Rocks 164 1 1.945 0.6 3 11.9
11. DavbReef 860 5 6.406 1.8 13 7.4
12. Hcn+Chiekens 225 1.3 £355 0.7 10 103
13. AlgatofRsef 475 2.8 7225 2.9 9 15.2
14. Tennessee Reef SUA SO 0.5 810 0.2 1 9
IS. Collins F&tch 230 1.3 1.399 0.4 6 6.1
16. Socrtworo Key 486 2.8 3.335 1 6 6.9
17. NowloundHirborKey 0 0 0 0 0 0
IB. LooaKey 1.331 7.6 22.936 6.6 4 17.2
19. Loos Kay SUA 129 0.8 3.225 0.9 1 25
20. Pclcan Shoal SUA 25 0.1 124 0.04 2 5
21. Sambos RR 157 0.9 1.976 0.6 7 12.6
22. Western Santo 1439 93 12324 3.6 12 7.5
23. Bstem Dry Rocks 249 1.4 2384 03 9 113
24. Rack Key 324 15 3.114 0.9 9 93
25. Sand Key 310 1.8 3.747 1.1 10 1Z1
26. Dry Tortuoas RR 0 0 0 0 0 0
TOTAL 17.101 - 346,417 - - -
244

Table 2 demonstrates thatthe most popular FKNMS zones in 1995, by thenumber of trips reported by dive operators, were Molasses Reef, GrecianRocks,French Reef, Elbow, and Dry Rocks SPAs in the Upper Keys, andWesternSamboandLooe Key SPAs in the LowerKeys. Together, theseSPAs capturedalmost71 percent of the zone-specific trips, as well as 84 percent of the divers.Two FKNMS zones - the Dry Tortugas RR and the Newfound Harbor Key SPA(both in the Lower Keys region)• had no reported trips in 1995.
Discussion
The tabular analysis demonstrates that thedive operators in the Florida Keysdisproportionately visit FKNMS zones. Also withinFKNMS zone types, diveoperators display preferences by concentrating their trips within individualzones.
Trips by zone type and popular zones
SPAs: Within the zone types, the SPAs werethe most important FKNMS zonesin all three subregions. Constituting only 0.16 percentof the FKNMS and 3percent of the FKNMS zones, the 19SPAs accounted for two-thirds (66 percent)of all trips and three quarters (74.3 percent) of all divers the respondentsreported takingin 1995, andthey hosted over95 percent of all zone-specifictrips and divers. The FKNMS estimated that80-85 percentof the total, annualsnorkelers and divers in the Keys use the 18 SPAs designated in the FinalManagement Plan (FMP) (NOAA, 1996). The SPAs within the pre-existingKey LargoNational MarineSanctuary (KLNMS) and Looe Key NationalMarine Sanctuary (LKNMS) wereheavilyused, attracting over 63 percent of alltrips made to FKNMS zones in 1995. These SPAs also attracted almost 83percent of all divers in FKNMS zones in 1995. Unlike in the SPAs outside thetwo existingnational marine sanctuaries where dive tripsincluded smallgroups,the averagenumber ofdivers per trip to SPAs in KLNMS and LKNMSaveraged between 17.7and 46.8 divers pertrip. Dive operators neartheselocations appear to invest considerably in largervessels to accommodate visitordemands, and they take more trips than theircounterparts do to other SPAs.
RRs: RRs were the largestof the zone types proposed by the DMP. Covering48,597 hectares, the three RRs included5.1 percent of the FKNMS and 96.6percentof the FKNMS zones. In our surveyefforts, we identifiedonly twooperators using the Key Largo RR in the UpperKeys and seven using theSambos RR in the Lower Keys. There wereno reported trips to the DryTortugas RR, although we did identify one dive operationthat made daily tripsto the Dry Tortugas region. Although that operation refused to conduct oursurvey, we learnedthat its trips were made specifically to the Dry TortugasNational Park (DTNP) and not the Dry Tortugas RR. The RRs attracted lessthan 2 percentof the zone-specific trips anddivers, and they accounted for only1.1 percent of the total trips and 1.4 percent of the divers. The DMP did notidentify significant diving activities in any of the RRs, and it estimated that onlydeepwater spearfishing activities would be displaced in the Sambos RR. Ourstudy corroborates the DMP's findings, as RRs did not attract much diving, andit demonstrates that zone location, rather than size, determines the popularity ofthe dive site. For instance, the largest FKNMS zone in the Lower Keys, Sambos
245

RR, only hosted4 percentof the subregion's zone specific trips. Western SamboSPA, locatedentirelywithin the SRR, captured almost40 percent of such trips.Similarly, Key LargoRR hosted much fewer tripsthan neighboring SPAs eventhough all the zones, including Key Largo RR, are located in the KLNMS.
SUAs:The four SUAs, comprisingonly 0.02 percentof the FKNMS or 0.4percentof the FKNMS zones, were not importantto dive operators. Theyhosted 2.7 percentof the zone-specific trips and 1.7 percentof the zone-specificdivers, or 1.9 percentof the total trips and 1.3 percentof the total divers in 1995.Location of the SUAs played a major partin their lower utilization. Both ConchReef SUA and Looe Key SUA are located adjacent to popular SPAs. Therewere over three times more trips made to Conch Reef SPA than Conch ReefSUA, and over ten times more trips made to Looe Key SPA than Looe KeySUA. The DMP identified these differences as well, noting that Conch ReefSPA captures a majority of the diving activities over Conch Reef SUA, and thatLooe Key SUA will have "very little impact on current users" (NOAA, 1995).Only one dive operatorreported usingTennessee Reef SUA in the Middle Keys.It is located at the northeastern edge of the Middle Keys and has no adjacentdive locations. Similarly, only two dive operators used Pelican Shoal SUA inthe Lower Keys. Located east of the popular Western Sambo SPA, it attractedunder 130 trips. Representing the only FKNMS zones that would not permitdiving activities, our study determined that the SUAs would not adversely affectdive operator activities. Dive operatorsbelieve that SUAs are a positive form ofresource management, as greaterthan half of the respondents favored theestablishment of the DMP SUAs, and a similar percentage agreed that SUAswill have a positive impact on the marine environment. However, diveoperators were less inclined to support the establishment of more SUAs, as 56.4percent of those surveyed stated that they would not favor any more SUAs in theFKNMS. The spatialuse analysisresults suggest that acceptability of the DMPSUAs may be related to their low use profiles, and that dive operators may notfavor other no-dive areas, especially if such areas are designated in high-usesites.
Diving impacts and carrying capacity
Carrying capacity refers to a maximum level of use that is sustainable, beyondwhich threshold there will be physical deterioration to the resource and damageto naturalhabitats. The concept calls for the maintenance of a system'secological integrity while maximizing user loading acceptable to the visitors andresidents, if any. The determination ofcarrying capacity is a complex processinvolving an understanding ofeffects that the users impose on the environment,and a calculation of the total number of users that can use the environment
without significant degradation. Studies in the Caribbeanand Red Seas haveestimated that the ecologically-derived thresholds for dive trip maxima arebetween 3,000 to 5,000 per site annually,basedon a site definition of an areawith a length between 500 to 600 meters (Hawkins and Roberts, 1996; Dixon etat, 1993). Davis and Tisdell (1996) add that ecologically-derived carryingcapacity totals overlook importantsocialand economic factors that may greatlyaffect the number of acceptable trips. Othershave statedthat most divercarryingcapacitytotals areelastic,andthey may be positively enhanced by
246

diver education and reef etiquette or negatively increased by inexperienced usersand infrastructuredevelopment (Hawkins and Roberts, 1996).
The FKNMS considered carryingcapacity in the DMP, as a strategy in itsMooring Buoy Action Plan (NOAA, 1995). Under its mooring buoy-based,carrying capacity strategy, the FKNMS planned to assess the effects ofrecreation and boating activitieson its resources, establishrecreational usercarrying capacities, and enforcecarrying-capacity limits in high-useareas andhighly sensitivehabitats. As a primary activity, the DMPcalled for theestablishment of regulations that requirethe use of mooring buoys in areaswhere there will be recreationalaccess management, particularly the SPAs"where no-anchoring zones should be established" (NOAA, 1995). Upondetermination of the carryingcapacity limits, the FKNMS planned to develop aplan thatwoulduse the total number of mooring buoys asa control mechanism.After certainSAC members (Slate, pers.comm; Holston, pers.comm.) andpubliccomments argued against the use of mooringbuoys to implementcarryingcapacity, the FKNMS moved the strategy from the Mooring BuoyAction Plan into the Research and Monitoring Action Plan (NOAA, 1996). Therevisedstrategy in the FMP plans to assess the impactsof recreation activitieson FKNMS resources, includingdiving impacts. Once carrying-capacity limitshave been established, the FKNMS will require the use of buoys only in "high-use" and "highly sensitive" areas(NOAA, 1996).
Areas such as the SPAs within the KLNMS are among the most popular divedestinations in the Florida Keys, and Molasses Reef SPA is possibly the mostvisited dive site in the world (Halas et al., 1993). Ward (1990) argued that theseveral Upper Keys reefshaveexceeded their carrying capacities. Similarly inthe Lower Keys, zones such as Western Sambo SPA and Looe Key SPA haveboth hosted increasinglymore trips since the 1980's. Trips to LKNMS increased400 percent from 1985 to 1990 (Talge, 1992), and the total hasreached 70,000visitors into the 1990's(Haskell, pers. comm.). Our trip totals suggest thatlocations such as Molasses Reef SPA (3,007 trips),Grecian Rocks SPA (1,961trips),French Reef SPA (1,603 trips), the Elbow SPA (1,433 trips).WesternSambo SPA (1,639 trips),Looe Key SPA (1,331 trips) may be approachingcarrying capacitytotals, estimated usingthe 3,000to 5,000 trip maximadetermined by previous studies. Moreover, our totalsdo not includethe privateand charter diver trip totals. Leeworthy andWiley (1996) estimate that over onemillion visitors reported diving in the Florida Keys in 1995-96.
Carryingcapacity limits may not be applicable in different subregions of theFKNMS because of the profiles ofdive operator trips. In the Upper Keyssubregion, dive operators frequent different FKNMS zones, suggestingthatswitchingtrips is a viableoption; however,Lower Keys operators do not switchtheirtripsas frequently, indicating thatthey disproportionately rely on particularFKNMS zones. Therefore, dive operators may not be able to withstandindividual site limits in the Lower Keys, as they are already limited by thenumber of sites they visit most frequently. Also, decision-makers need toconsider the divers per trip statistics when implementing a mooring buoy-based,carryingcapacity plan. As demonstrated in Table 2, the statisticsaremuchhigher for certain SPAs. Even if mooringbuoy limits were instituted in suchzones, they could not limit the size of the vessels and the number of divers
247

impacting the resources. For instance,Western Sambo SPA hosted 370 moretrips than Dry Rocks SPA, but it attracted only 12.6 divers per trip. Dry RocksSPA had almost 47 divers per trip. With each trip, it attracted almost four timesas many users as Western Sambos SPA, demonstrating that mooring buoys maynot necessarily control diver totals or impacts.
To manage for sustainable diving, Harriot et. al. (1997) have suggested that theregulationofdiver activities and numbers be controlled by "clearly definedpropertyrights in MPAs (marine protected areas)". In an open-accesssystem,users have no incentive to protect the resource from other users; under a limitedpropertyrights system, which may includea limited numberof permits allocatedto dive operators, permitted userscould share access within MPAs. Permitsmust remain transferable to give permit holders a financial stake in the resource.Under such a system, permitteddive operators can be expected to police andprotectthe sites,reportillegal users, andapplysustainable codes of conduct fortheir divers. Other areas, such as the Bonaire Marine Park and Saba MarinePark,chargeuser fees from divers (Dixon et al, 1993;White et al., 1994).Managers could increase the charges for the use of individualdive sites,including those that areover-visited as aneffort to reducedemand and raisefunds. From our survey study, most dive operators in the Florida Keys areopposedto the developmentof a diver-funded mooring buoy plan(57.8 percentdisagree) and the institutionof an annual fee foran FKNMS zone maintenanceplan(87.1 percent disagree), but several of the respondents did statethat theywould prefer a limited-entry system fordive operators in the FKNMS.
There is presently no limited-entry system for commercial dive operators in theFlorida Keys. Any operator usinga vesselthatholdssix or lessdivers (knowncolloquially asa "six-pack operation") only requires anoccupational licensefrom the State of Florida. Only those operators that transportgreaterthan sixdivers needto meet specificU.S. Coast Guard requirements. Unlike the diveoperations in Saba andthe Great Barrier Reef National Marine Park thatrequirepermits, Florida Keys operators enjoyanopenaccess system. Under suchasystem,operations haveto compete witheach other, often with loweredattention toward the health of the resource (Harriot et. al., 1997). Dive operatorsin the Florida Keys mustalsocompete with general charterboats thattakeoutvisitorson fishing, diving, or mixed trips. Under unlimitedentry,diveoperations becometransitory. In the time period that we researched anddetermined the size of our dive operator population, we discovered that 15(or16.9 percent) of theoperators identified had left the industry. Mostof the diveoperations surveyed, or70.5 percent, had been in business for 10years or less.
Conclusions
Dive use has increased in areas designated for protectionin the FloridaKeys, asevidenced by the growth in dive activities in KLNMS andLKNMS. Whenimplemented, the FKNMS zonesmayattract considerable divingactivities, andconsequendy sufferincreased impacts. This studysuggests thatcertain zonesmay already be approaching theirdivercapacity thresholds. Althoughthe DMPand FMP versions of the FKNMS management plansconsider the total amountof mooring buoys asa means of establishing carrying capacity, we suggest thatlimiting buoys maynotminimize impacts. Operations near popular FKNMS
248

zones utilize large vessels, transporting up to 140 passengers per trip. Diversper trip approximate almost 50 in other popular SPAs. Capacity limits on buoysmay also increase user conflicts, particularlyin SPAs that allow multiple use.Finally, buoy limits may engender intra-groupconflicts.
Instead of a mooring buoy-based,carrying capacity system, managers shouldconsider the development a limited-entry system for dive operationsin theFlorida Keys. Even if implemented with all current operators,such a systemwould ensure that as diving use increases across the FKNMS and particularly inthe FKNMS zones, the dive operations would not need to compromiseconservation ethics to attract more clientele from their competitors. TheFKNMS could expect greatercooperation within and from the industry, withlowered, competitive pressure. Also, limited-entry should be accompanied witha strong, educational component for both dive operatorsand divers on properreef etiquette. Previous researchhas demonstrated that diver education leads tominimized impacts, thus increasing diver capacity in marine protected areas(Hawkins and Roberts, 1996). With a well-defined number of users, managersmay better understand the cumulative impactsofcommercial dive operationsinthe FKNMS zones. This understanding would greatly facilitate impactminimization or site restoration activities, and it could assist in the estimation ofdiver and trip capacities. Operators could more easily switch zone use, asovercrowding would be minimized. Finally, a limited-entry system wouldprovideprosperity and stability withinthe dive industry, particularly if thepermits are transferable. Diveoperations then wouldnotbe forced to maximizetheir diver or trip totals, and could insteadfocus on diver educationand resourceconservation.
References
Bohme-Carter. G. 1994.Geographic Information Systemsfor Geoscientists: Modeling withGIS.New York, NY: Pergamon Press.
Davis, D., and C. Tisdell. 19%. Economic Managementof RecreationalScuba Diving andEnvironment. Journal ofEnvironmentalManagement48: 229-248.
Dixon, J. A., L F. Scuta, and T. van't Hoff. 1993. Meeting Ecological and Economic Goals:Marine Parks in the Caribbean. Ambio22(2): 117-125.
Environmental Systems Research Institute, Inc(ESRI). 1996. Using ArcViewGIS: TheGeographicInformation System for Everyone. Redlands, CA: ESRI, Inc.
Halas. J„ I. Halas, and D. Kincaid. 1993. Diving and SnorkelingGuide to the Florida Keys.Houston. TX: Gulf Publishing Company.
Harriot, V. J., D. Davis, and S. A. Banks. 1997. Recreational Diving and its Impact inMarine Protected Areas in Eastern Australia. Ambio 26 (3): 173-179.
Hawkins. J. P., and C. M. Roberts. 1996. Estimating the CarryingCapacity ofCoral ReefsforScuba Diving. In Proceedings of the8th International Coral ReefSymposium, ed. H. A.Lessios, 1923-1926. PanamaCity, Panama: Universidad de Panama.
Hunt, I. H. 1994, Status of the Fishery for Panularisargus in Florida. In Spiny LobsterManagement, eds. B. F. Phillips, J. S. Cobb,andJ. A. Conti, 158-167. Oxford,UK: FishingNews Books.
Laurini, R., and D.Thompson. 1992. Fundamentals ofSpatialInformation Systems. SanDiego, CA: Academic Press.
249

Leeworthy, V. R., and P.C. Wiley, 1997. A Socioeconomic Analysisofthe RecreationActivities ofMonroe County Residents in the Florida Keys/Key West. Washington, DC:NOAA, US Department ofCommerce.
Leeworthy, V.R., and P. C. Wiley, 1996. Visitor Profiles: Florida Keys/Key West.Washington, DC: NOAA, US Department of Commerce.
NationalOceanic and Atmospheric Administration(NOAA). 1996. Florida Keys NationalMarine Sanctuary Final ManagementPlan/Environmental ImpactAnalysis: Volume I: TheManagement Plan. Silver Spring. MD: SRD/OCRM/NOS/NOAA.
NationalOceanicand Atmospheric Administration(NOAA). I99S. FloridaKeys NationalMarine Sanctuary Draft ManagementPlan/Environmental ImpactStatement: Volume I: TheManagement Plan. Silver Spring, MD: SRD/OCRM/NOS/NOAA.
Personal communication with B. Haskell, Science Coordinator, FKNMS, in Marathon, FL.January21,1998.
Personalcommunication with R. Holston,SanctuaryAdvisory Council member, in Marathon,FL, March 15.1997.
Personal communicationwith S. Slate, Sanctuary AdvisoryCouncil member,in Key ColonyBeach, FL, January20,1996.
Sullivan, K. M., M. Chiappone, andC. Lott. 1996. Controversies and Conservation Issues.Zenda. WI: The Preserver.
Talge. H. 1992. Impactof Recreational Diverson Scleratinian Coralsat Looe Key, Florida.In Proceedings ofthe7th International CoralReefSymposium, 1077-1082. Mangilao.Guam: University ofGuam.
Tilmant, J. T. 1987. Impacts of Recreational activitieson Coral Reefs. InHuman Impactson Coral Reefs: Facts and Recommendations, ed.B.SalvuL 195-214. FrenchPolynesia:Antenne Museum EPHE.
Tilmant, J. T., and G. P. Schmal. 1981. A Comparative Analysis ofCoral Damage onRecreotionallyUsed reefs Within Biscayne NationalPark,Florida. In ProceedingsoftheFourth International CoralReefSymposium, ed. E. D.Gomez, 187-192. Quezon City,Philippines: Marine SciencesCenter,University of the Philippines.
Ward, F. 1990. Florida'sCoral Reefs are Imperiled. National Geographic, July 1990: 115-132.
White, A. T., L Hale, Y. Renard, and L Cortesi (eds). 1994. Collaborative and Community-basedManagement of CoralReefs: Lessonsfrom Experience. West Hartford, CT: Kumarian Press.
Manoj. J. Shivlani Research AssociateDivision of Marine Affairs and PolicyRosenstiel School of marine Science
University of Miami4600 Rickenbacker CausewayMiami, FL 33149-1098 USA305/361-4685
Fax: 305/361-4675
250