Embed Size (px)
Citation preview
November 14, 2017 Analyst:AshutoshTiwari [email protected] (+91-8128694112) Page 1 of 1
Before reading this report, you must refer to the disclaimer on the last page.
Minda Industries Absolute : ADD
Relative Benchmark
2QFY18 Result: Estimate (), TP (), Rating () Regular Coverage 8% ATR in 14 Months
Futuristic product portfolio to drive strong growth – maintain ADD Auto Parts
© 2017 Equirus All rights reserved
Rating Information
Price (Rs) 1,032
Target Price (Rs) 1,116
Target Date 30th Dec'18
Target Set On 14th Nov '17
Implied yrs of growth (DCF) 17
Fair Value (DCF) 829
Fair Value (DDM) 122
Ind Benchmark BSEAUTO
Model Portfolio Position LONG
Stock Information
Market Cap (Rs Mn) 89,132
Free Float (%) 25.98 %
52 Wk H/L (Rs) 1044.4/262.1
Avg Daily Volume (1yr) 139,444
Avg Daily Value (Rs Mn) 80
Equity Cap (Rs Mn) 173
Face Value (Rs) 2
Bloomberg Code MNDA IN
Ownership Recent 3M 12M
Promoters 71.0 % 1.2 % -3.1 %
DII 7.4 % 0.1 % 5.0 %
FII 7.8 % 0.7 % 3.7 %
Public 13.9 % -1.9 % -5.6 %
Price % 1M 3M 12M
Absolute 24.8 % 31.9 % 204.5 %
Vs Industry 24.3 % 26.5 % 183.6 %
GABRIEL -2.4 % 12.6 % 67.5 %
SUPRAJIT 0.6 % -0.5 % 42.8 %
Standalone Quarterly EPS forecast
Rs/Share 1Q 2Q 3Q 4Q
EPS (17A) 2.6 3.8 2.2 2.3
EPS (18E) 2.1 4.9 2.5 2.5
Minda Industries (MNDA) continued to outdo our estimates, with 2QFY18 sales/EBITDA
beating EE by 9%/22% led by strong growth in Minda Kosei (alloy wheel subsidiary), MJ
Casting and Rinder. Consolidated EBITDA margins at 12.4% improved 161bps
yoy/171bps qoq on a better product mix and operating leverage. The alloy wheel plant
at Bawal reached its full capacity due to strong demand from MSIL. Accordingly, we
increase our sales estimates over FY18-FY20. The company announced the acquisition
of stakes in Minda F-Ten and F-Ten Minda. Due to strong traction across businesses, we
raise our FY18/FY19E EPS by 6%/7% and maintain ADD with a Mar’18 TP of Rs 1,116 set
at 32x FY19E EPS (vs. a Dec’18 TP of Rs 881 at 28x earlier); the increase in P/E
multiple is justified given the strong growth visibility.
Portfolio of new-age products to find increasing application in vehicles: Alloy
wheel penetration in 4Ws in India is around 25%, which is set to increase as it
reduces vehicle weight and is more aesthetically appealing. Infotainment system,
which has come through F-Ten Minda, is becoming another differentiating feature
for cars with GPS and a reverse camera view clubbed in the same offering.
Promoters own an 8% stake in TG Minda (top-3 in air bags in India) with an option to
increase the stake to 45%, which will eventually be transferred to MNDA. Lighting
subsidiary Rinder would also be big beneficiary of a shift to LED lights in 2Ws, which
is gaining traction in the industry. MNDA had formed a JV with TTE, which is the
third largest player globally in driver assistance systems.
All-round growth leads to 23% yoy/16% qoq sales growth, 9% ahead of EE: The
alloy wheel plant ramped up to full capacity in August with sales up 25%+ qoq. MJ
Casting sales also saw robust sales qoq due to strong volumes of HMSI during the
quarter. Standalone sales were impacted due to hiving off of the battery business to
a separate subsidiary (adj. for which sales would have grown 11% vs. 9% reported);
removal of the headlamp switch from most 2Ws post AHO regulations also impacted
standalone sales.
EBITDA up 41% yoy/35% qoq on improved product mix, operating leverage: MNDA
witnessed strong growth in some double-digit margin businesses like alloy wheel,
Minda Kyoraku and MJ Casting, leading to an improved product mix during the
quarter. Standalone performance benefitted from tooling income, costs for which
were booked in 1Q. However, 1H margins were normal; an improvement in lighting
margins was driven by tooling income booked only during 2Q.
Change in Estimates
Current Change (%)
Rs Mn FY18E FY19E FY18E FY19E
Sales 41,270 55,043 3.0% 3.1%
EBITDA 4,639 6,460 4.4% 5.2%
PAT 2,325 3,013 5.8% 6.5%
EPS 26.9 34.9 5.8% 6.5%
Consolidated Financials Rs. Mn YE Mar FY17A FY18E FY19E FY20E
Sales 35,047 41,270 55,043 62,277
EBITDA 3,835 4,639 6,460 7,331
Depreciation 1,360 1,551 1,930 2,187
Interest Expense 394 330 430 340
Other Income 142 271 127 164
Reported PAT 1,679 2,325 3,013 3,506
Recurring PAT 1,679 2,325 3,013 3,506
Total Equity 10,273 12,162 14,433 17,005
Gross Debt 5,324 4,779 4,779 3,279
Cash 3,766 96 460 2,173
Rs Per Share FY17A FY18E FY19E FY20E
Earnings 19.4 26.9 34.9 40.6
Book Value 119 141 167 197
Dividends 2.2 2.5 3.0 4.0
FCFF 1.9 -33.8 7.2 40.0
P/E (x) 53.1 38.4 29.6 25.4
P/B (x) 8.7 7.3 6.2 5.2
EV/EBITDA (x) 23.9 20.7 14.9 12.8
ROE (%) 22 % 21 % 23 % 22 %
Core ROIC (%) 16 % 14 % 17 % 17 %
EBITDA Margin (%) 11 % 11 % 12 % 12 %
Net Margin (%) 5 % 6 % 5 % 6 %

Minda Industries Absolute – ADD Relative – Benchmark 8% ATR in 14 Months
November 14, 2017 Analyst: AshutoshTiwari [email protected] (+91-8128694112) Page 2 of 11
Earnings call takeaways
Industry performance
The auto industry registered significant improvement in 2QFY18 after a muted
performance driven by pre-GST uncertainty.
Demand improved for PV and 2W segments on the back of a satisfactory monsoon,
cheaper financing and festive season sales.
Demand is expected to sustain in 2HFY18, which augurs well for well-diversified
players in the ancillary universe.
Financial performance
Revenues grew 23% yoy to Rs 10.98bn (2QFY17: Rs 8.96bn) driven by improved
performances from Minda Kosei, MJ Casting and Rinder India.
EBITDA margins expanded 161bps yoy to 12.43% driven by higher operating leverage
and improving efficiency.
EBITDA grew by 41% yoy to Rs 1.37bn.
PAT stood at Rs 0.67bn with 75% yoy growth.
Domestic market constituted 81% of the topline and exports 19%.
Management believes margins of 11.5-12% are sustainable in the longer run.
Segment performance
Switching systems contributed 32% to the consolidated turnover. Overall, EBIDTA
margins for the segment stood at ~12% during the quarter.
Lighting business contributed 27% to overall revenue with about 11% margins at the
EBITDA level.
The acoustic division contributed 15% to the overall turnover.
Other products like alloy wheels, aluminium die casting and blow molding hoses
formed about 26% of the consolidated top line with robust margins of 19%.
Consolidation update
The board has approved the purchase of a 49% stake in Fujitsu Ten Minda Pvt. Ltd.
(F-Ten Minda) and a 51% stake in Minda F Ten Pvt. ltd. (Minda F-Ten). The total
purchase consideration for both companies will be Rs. 0.26bn. The sale & purchase
agreement is expected to be completed by 1 Jan’18.
F-Ten Minda is engaged in business development and manufacturing of car
infotainment systems, with revenues of Rs 3.08bn, EBITDA margins of about 10% and
PAT of Rs 0.26bn. Minda F-Ten is the marketing arm for infotainment systems
manufactured by F-Ten Minda with revenues of Rs 3.15bn.
F Ten’s key customers are MSIL and Toyota Kirloskar; it also caters to Innova Crysta
and Baleno, and has about 20-21% market share.
Other highlights
Mindarika is expected to be consolidated by the end of Jan’18.
The battery business has been hived off and transferred to a wholly-owned
subsidiary.
Mindarika’s revenue is about Rs. 6.35bn while Minda Torika’s about Rs. 2.3bn.
Margins for car horns were diluted due to Mexico plant’s initial ramp-up cost.
The total wheel capacity is 120,000 wheels per month, with orders mainly from MSIL
and M&M and the entire capacity fully booked. Sales from Gujarat are expected to
start from Apr’18 and the planned capacity is at 60,000.
The alloy wheels business posted a topline of Rs 1.1bn.
TTE is expected to be commissioned by 1QFY19. Management expects peak revenues
from one line to be about Rs 3.5bn.
For the Mexico plant, one line is operational and the second should be operational by
Apr’18.
The consolidation plan is on schedule and there is no challenge on this front; barring a
couple of entitles, all other entities should be consolidated by Mar’18. These two
entities are in the business of seat belts and airbags, adding Rs 7bn-8bn to the topline.
Top-3 customers expected on a consolidated basis for future are MSIL, Bajaj and
HMSI. These three will contribute ~40% of sales with maximum contribution from
MSIL.
Management expects Torika to be consolidated by 3QFY17 and F-Ten Minda
consolidation to be effective from 4QFY18.
Rinder is primarily for 2W and CV lighting, and about 17% is export business. It has
about 11.5% of margins, slightly higher than the standalone lighting business.
Realizations for LED are about 2-2.5x of conventional lights.
Management expects about 15% growth in the lighting business.
Total capex stands at Rs 3bn for the Gujarat plant, around 0.65bn for the Chennai
lighting expansion, 0.65bn for Minda Kurako, Rs 1.4bn for group consolidation with
other capex of ~0.4bn over the next 18 months.

Minda Industries Absolute – ADD Relative – Benchmark 8% ATR in 14 Months
November 14, 2017 Analyst: AshutoshTiwari [email protected] (+91-8128694112) Page 3 of 11
Quarterly performance, standalone
(Rs mn) 2QFY18 2QFY18E 1QFY18 2QFY17 % Change
Comments 2QFY18E 1QFY18 2QFY17
Net Sales 4,777 4,699 4,230 4,388 2% 13% 9%
Cost of raw material 3,039 3,059 2,671 2,863 -1% 14% 6%
Employee Cost 617 620 605 535 -1% 2% 15%
Other Expenditure 624 569 607 548 10% 3% 14%
Total Expenditures 4,279 4,248 3,882 3,947 1% 10% 8%
EBITDA 498 451 348 441 10% 43% 13%
Depreciation 131 135 119 129 -3% 10% 1%
EBIT 367 316 229 312 16% 60% 18%
Interest 11 19 17 35 -43% -39% -70%
Other Income 182 60 48 124 206% 279% 47%
PBT 538 357 260 400 51% 107% 34%
Tax 113 86 77 81 32% 47% 38%
Recurring PAT 426 271 183 319 57% 132% 33%
Extraordinaries 7 0 -55 -1
Reported PAT 419 271 238 320 55% 76% 31%
EPS (Rs) 4.9 3.1 2.1 3.7 57% 132% 33%
EBITDA Margin 10.4% 9.5% 8.2% 10.1% 87 bps 220 bps 37 bps
EBIT Margin 7.7% 5.8% 5.4% 7.1% 190 bps 226 bps 57 bps
PBT Margin 11.3% 5.9% 6.1% 9.1% 539 bps 513 bps 215 bps
PAT Margin 8.8% 4.5% 5.6% 7.3% 430 bps 314 bps 148 bps
Tax Rate 20.9% 24.0% 29.5% 20.3% -306 bps -853 bps 60 bps
Raw Material 63.6% 65.1% 63.2% 65.3% -148 bps 47 bps -164 bps
Employee cost 12.9% 13.2% 14.3% 12.2% -29 bps -139 bps 71 bps
Other expenses 13.1% 12.1% 14.3% 12.5% 96 bps -128 bps 56 bps
Minda Industries Absolute – ADD Relative – Benchmark 8% ATR in 14 Months
November 14, 2017 Analyst: AshutoshTiwari [email protected] (+91-8128694112) Page 4 of 11
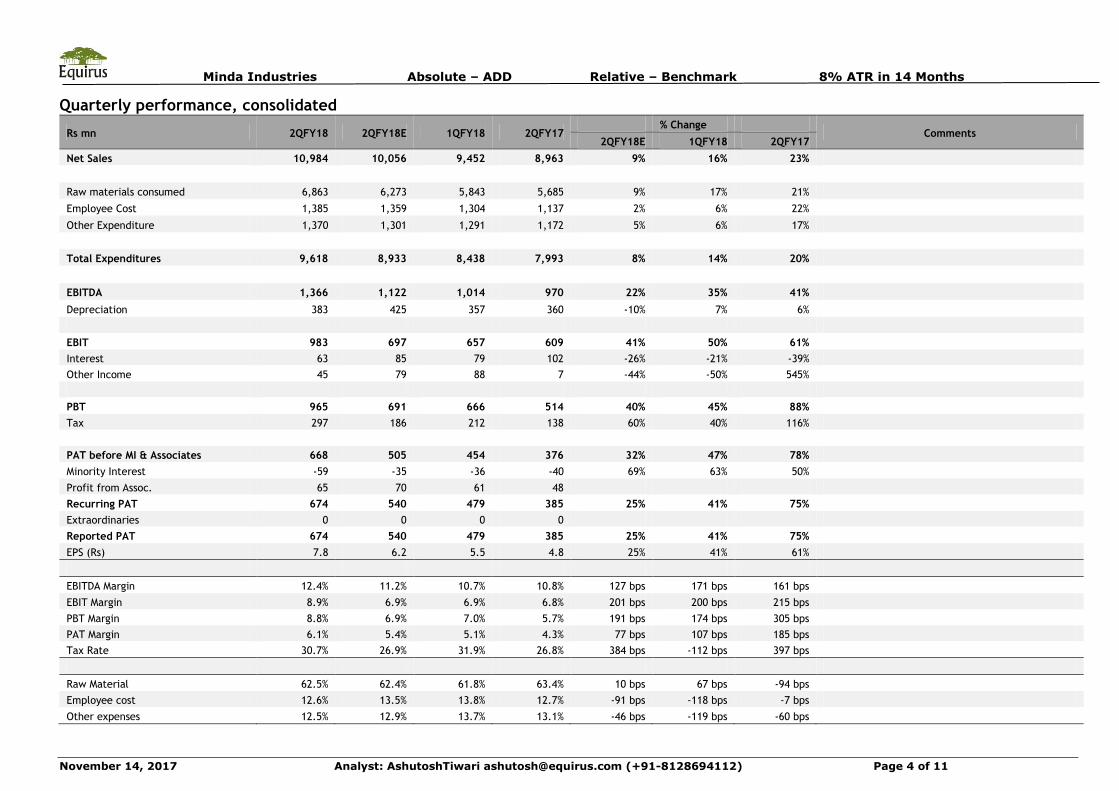
Quarterly performance, consolidated
Rs mn 2QFY18 2QFY18E 1QFY18 2QFY17 % Change
Comments 2QFY18E 1QFY18 2QFY17
Net Sales 10,984 10,056 9,452 8,963 9% 16% 23%
Raw materials consumed 6,863 6,273 5,843 5,685 9% 17% 21%
Employee Cost 1,385 1,359 1,304 1,137 2% 6% 22%
Other Expenditure 1,370 1,301 1,291 1,172 5% 6% 17%
Total Expenditures 9,618 8,933 8,438 7,993 8% 14% 20%
EBITDA 1,366 1,122 1,014 970 22% 35% 41%
Depreciation 383 425 357 360 -10% 7% 6%
EBIT 983 697 657 609 41% 50% 61%
Interest 63 85 79 102 -26% -21% -39%
Other Income 45 79 88 7 -44% -50% 545%
PBT 965 691 666 514 40% 45% 88%
Tax 297 186 212 138 60% 40% 116%
PAT before MI & Associates 668 505 454 376 32% 47% 78%
Minority Interest -59 -35 -36 -40 69% 63% 50%
Profit from Assoc. 65 70 61 48
Recurring PAT 674 540 479 385 25% 41% 75%
Extraordinaries 0 0 0 0
Reported PAT 674 540 479 385 25% 41% 75%
EPS (Rs) 7.8 6.2 5.5 4.8 25% 41% 61%
EBITDA Margin 12.4% 11.2% 10.7% 10.8% 127 bps 171 bps 161 bps
EBIT Margin 8.9% 6.9% 6.9% 6.8% 201 bps 200 bps 215 bps
PBT Margin 8.8% 6.9% 7.0% 5.7% 191 bps 174 bps 305 bps
PAT Margin 6.1% 5.4% 5.1% 4.3% 77 bps 107 bps 185 bps
Tax Rate 30.7% 26.9% 31.9% 26.8% 384 bps -112 bps 397 bps
Raw Material 62.5% 62.4% 61.8% 63.4% 10 bps 67 bps -94 bps
Employee cost 12.6% 13.5% 13.8% 12.7% -91 bps -118 bps -7 bps
Other expenses 12.5% 12.9% 13.7% 13.1% -46 bps -119 bps -60 bps
Minda Industries Absolute – ADD Relative – Benchmark 8% ATR in 14 Months
November 14, 2017 Analyst: AshutoshTiwari [email protected] (+91-8128694112) Page 5 of 11
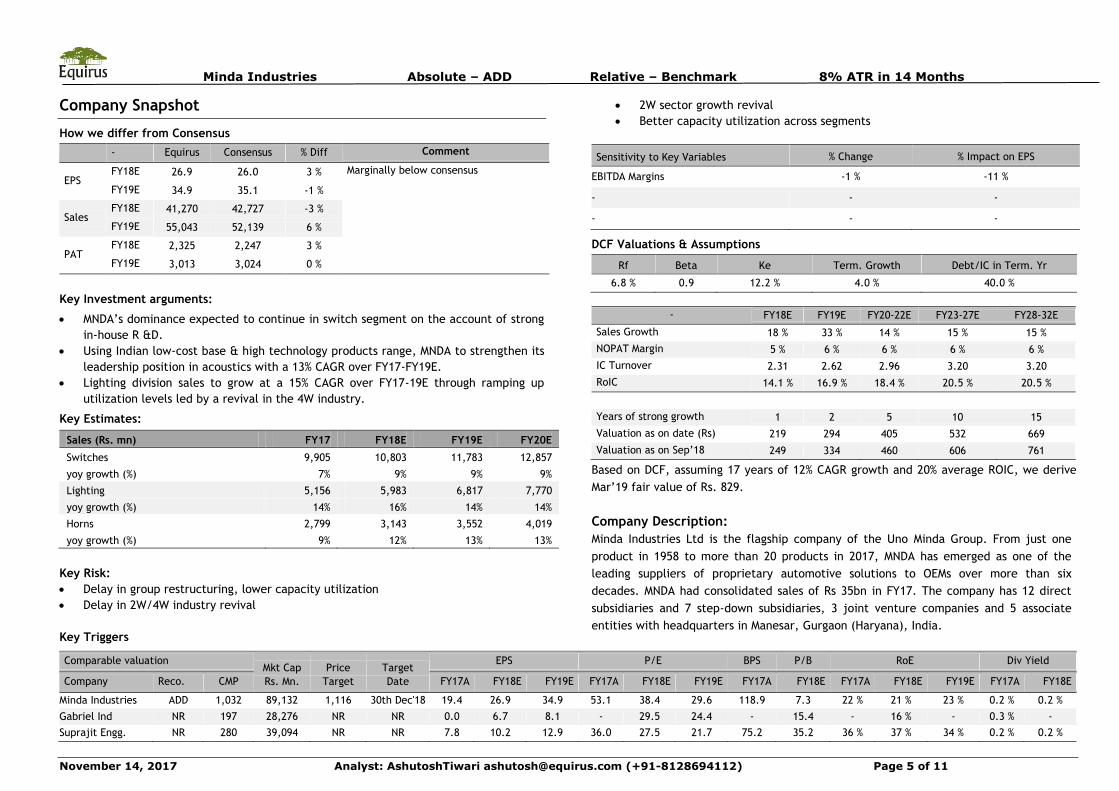
Company Snapshot
How we differ from Consensus
- Equirus Consensus % Diff Comment
EPS FY18E 26.9 26.0 3 % Marginally below consensus
FY19E 34.9 35.1 -1 %
Sales FY18E 41,270 42,727 -3 %
FY19E 55,043 52,139 6 %
PAT FY18E 2,325 2,247 3 %
FY19E 3,013 3,024 0 %
Key Investment arguments:
MNDA’s dominance expected to continue in switch segment on the account of strong
in-house R &D.
Using Indian low-cost base & high technology products range, MNDA to strengthen its
leadership position in acoustics with a 13% CAGR over FY17-FY19E.
Lighting division sales to grow at a 15% CAGR over FY17-19E through ramping up
utilization levels led by a revival in the 4W industry.
Key Estimates:
Sales (Rs. mn) FY17 FY18E FY19E FY20E
Switches 9,905 10,803 11,783 12,857
yoy growth (%) 7% 9% 9% 9%
Lighting 5,156 5,983 6,817 7,770
yoy growth (%) 14% 16% 14% 14%
Horns 2,799 3,143 3,552 4,019
yoy growth (%) 9% 12% 13% 13%
Key Risk:
Delay in group restructuring, lower capacity utilization
Delay in 2W/4W industry revival
Key Triggers
2W sector growth revival
Better capacity utilization across segments
Sensitivity to Key Variables % Change % Impact on EPS
EBITDA Margins -1 % -11 %
- - -
- - -
DCF Valuations & Assumptions
Rf Beta Ke Term. Growth Debt/IC in Term. Yr
6.8 % 0.9 12.2 % 4.0 % 40.0 %
- FY18E FY19E FY20-22E FY23-27E FY28-32E
Sales Growth 18 % 33 % 14 % 15 % 15 %
NOPAT Margin 5 % 6 % 6 % 6 % 6 %
IC Turnover 2.31 2.62 2.96 3.20 3.20
RoIC 14.1 % 16.9 % 18.4 % 20.5 % 20.5 %
Years of strong growth 1 2 5 10 15
Valuation as on date (Rs) 219 294 405 532 669
Valuation as on Sep’18 249 334 460 606 761
Based on DCF, assuming 17 years of 12% CAGR growth and 20% average ROIC, we derive
Mar’19 fair value of Rs. 829.
Company Description:
Minda Industries Ltd is the flagship company of the Uno Minda Group. From just one
product in 1958 to more than 20 products in 2017, MNDA has emerged as one of the
leading suppliers of proprietary automotive solutions to OEMs over more than six
decades. MNDA had consolidated sales of Rs 35bn in FY17. The company has 12 direct
subsidiaries and 7 step-down subsidiaries, 3 joint venture companies and 5 associate
entities with headquarters in Manesar, Gurgaon (Haryana), India.
Comparable valuation Mkt Cap
Rs. Mn.
Price
Target
Target
Date
EPS P/E BPS P/B RoE Div Yield
Company Reco. CMP FY17A FY18E FY19E FY17A FY18E FY19E FY17A FY18E FY17A FY18E FY19E FY17A FY18E
Minda Industries ADD 1,032 89,132 1,116 30th Dec'18 19.4 26.9 34.9 53.1 38.4 29.6 118.9 7.3 22 % 21 % 23 % 0.2 % 0.2 %
Gabriel Ind NR 197 28,276 NR NR 0.0 6.7 8.1 - 29.5 24.4 - 15.4 - 16 % - 0.3 % -
Suprajit Engg. NR 280 39,094 NR NR 7.8 10.2 12.9 36.0 27.5 21.7 75.2 35.2 36 % 37 % 34 % 0.2 % 0.2 %

Minda Industries Absolute – ADD Relative – Benchmark 8% ATR in 14 Months
November 14, 2017 Analyst: AshutoshTiwari [email protected] (+91-8128694112) Page 6 of 11
Standalone Quarterly Earnings Forecast and Key Drivers Rs in Mn 1Q17A 2Q17A 3Q17A 4Q17A 1Q18A 2Q18A 3Q18E 4Q18E 1Q19E 2Q19E 3Q19E 4Q19E FY17A FY18E FY19E FY20E
Revenue 4,005 4,388 4,002 3,996 4,226 4,777 4,344 4,385 4,955 5,265 4,917 4,684 16,392 17,732 19,821 22,198
EBITDA 394 410 384 371 344 498 387 386 471 500 467 445 1,559 1,614 1,883 2,109
Depreciation 112 117 124 131 119 131 131 134 138 141 145 147 483 515 571 616
EBIT 283 293 260 240 225 367 256 252 333 359 322 298 1,076 1,099 1,312 1,493
Interest 45 35 37 23 17 11 17 7 0 0 0 0 139 52 0 0
Other Income 47 157 38 10 52 182 50 45 26 27 30 24 251 328 108 124
PBT 285 415 261 227 260 538 288 289 359 386 352 322 1,188 1,375 1,420 1,617
Tax 60 85 72 25 77 113 69 69 86 93 85 77 242 328 341 388
Recurring PAT 224 331 190 202 183 426 219 220 273 294 268 245 946 1,047 1,079 1,229
Extraordinary 0 0 0 0 -55 7 0 0 0 0 0 0 0 -48 0 0
Reported PAT 224 331 190 202 238 419 219 220 273 294 268 245 946 1,096 1,079 1,229
EPS (Rs) 2.60 3.83 2.19 2.34 2.12 4.92 2.53 2.54 3.16 3.40 3.10 2.83 10.95 12.12 12.49 14.22
Key Drivers
- - - - - - - - - - - - - - - - -
- - - - - - - - - - - - - - - - -
- - - - - - - - - - - - - - - - -
- - - - - - - - - - - - - - - - -
- - - - - - - - - - - - - - - - -
- - - - - - - - - - - - - - - - -
Sequential Growth (%)
Revenue 5 % 10 % -9 % 0 % 6 % 13 % -9 % 1 % 13 % 6 % -7 % -5 % - - - -
EBITDA 7 % 4 % -6 % -3 % -7 % 45 % -22 % 0 % 22 % 6 % -7 % -5 % - - - -
EBIT 30 % 4 % -11 % -8 % -6 % 63 % -30 % -2 % 32 % 8 % -10 % -8 % - - - -
Recurring PAT 1 % 47 % -43 % 6 % -9 % 132 % -49 % 0 % 24 % 8 % -9 % -9 % - - - -
EPS 1 % 47 % -43 % 6 % -9 % 132 % -49 % 0 % 24 % 8 % -9 % -9 % - - - -
Yearly Growth (%)
Revenue 17 % 16 % 8 % 5 % 6 % 9 % 9 % 10 % 17 % 10 % 13 % 7 % 12 % 8 % 12 % 12 %
EBITDA 47 % 2 % 9 % 0 % -13 % 21 % 1 % 4 % 37 % 1 % 21 % 15 % 12 % 4 % 17 % 12 %
EBIT 85 % 7 % 17 % 11 % -20 % 25 % -2 % 5 % 48 % -2 % 26 % 18 % 24 % 2 % 19 % 14 %
Recurring PAT 65 % 43 % -7 % -9 % -18 % 29 % 15 % 9 % 49 % -31 % 22 % 11 % 19 % 11 % 3 % 14 %
EPS 65 % 43 % -7 % -9 % -18 % 29 % 15 % 9 % 49 % -31 % 22 % 11 % 19 % 11 % 3 % 14 %
Margin (%)
EBITDA 10 % 9 % 10 % 9 % 8 % 10 % 9 % 9 % 10 % 9 % 10 % 10 % 10 % 9 % 9 % 9 %
EBIT 7 % 7 % 7 % 6 % 5 % 8 % 6 % 6 % 7 % 7 % 7 % 6 % 7 % 6 % 7 % 7 %
PBT 7 % 9 % 7 % 6 % 6 % 11 % 7 % 7 % 7 % 7 % 7 % 7 % 7 % 8 % 7 % 7 %
PAT 6 % 8 % 5 % 5 % 4 % 9 % 5 % 5 % 6 % 6 % 5 % 5 % 6 % 6 % 5 % 6 %

Minda Industries Absolute – ADD Relative – Benchmark 8% ATR in 14 Months
November 14, 2017 Analyst: AshutoshTiwari [email protected] (+91-8128694112) Page 7 of 11
Consolidated Financials
P&L (Rs Mn) FY17A FY18E FY19E FY20E
Balance Sheet (Rs Mn) FY17A FY18E FY19E FY20E
Cash Flow (Rs Mn) FY17A FY18E FY19E FY20E
Revenue 35,047 41,270 55,043 62,277 Equity Capital 173 173 173 173 PBT 2,223 3,030 4,228 4,968
Op. Expenditure 31,213 36,631 48,582 54,946 Reserve 10,101 11,989 14,260 16,832 Depreciation 1,360 1,551 1,930 2,187
EBITDA 3,835 4,639 6,460 7,331 Networth 10,273 12,162 14,433 17,005 Others 309 0 0 0
Depreciation 1,360 1,551 1,930 2,187 Long Term Debt 5,324 4,779 4,779 3,279 Taxes Paid 508 808 1,155 1,360
EBIT 2,475 3,089 4,531 5,144 Def Tax Liability 768 2,350 2,780 3,298 Change in WC 177 -581 -1,126 -566
Interest Expense 394 330 430 340 Minority Interest 1,390 1,566 1,996 2,513 Operating C/F 3,561 3,192 3,877 5,229
Other Income 142 271 127 164 Account Payables 5,151 6,223 8,143 9,259 Capex -4,657 -5,300 -3,570 -2,015
PBT 2,223 3,030 4,228 4,968 Other Curr Liabi 1,206 1,429 1,846 2,099 Change in Invest -2,837 -1,054 0 0
Tax 488 808 1,155 1,360 Total Liabilities & Equity 24,111 28,509 33,976 37,453 Others 3,774 0 0 0
PAT bef. MI & Assoc. 1,734 2,222 3,073 3,608 Net Fixed Assets 8,955 12,456 13,726 13,140 Investing C/F -3,720 -6,353 -3,570 -2,015
Minority Interest 200 176 430 517 Capital WIP 1,373 1,373 1,373 1,373 Change in Debt 372 -545 0 -1,500
Profit from Assoc. 145 279 370 415 Others 1,250 2,551 2,921 3,336 Change in Equity 2,965 -176 -430 -517
Recurring PAT 1,679 2,325 3,013 3,506
Inventory 2,513 3,052 4,145 4,714 Others -669 1,602 488 517
Extraordinaires 0 0 0 0 Account Receivables 5,235 6,445 8,393 9,543 Financing C/F 2,669 880 58 -1,501
Reported PAT 1,679 2,325 3,013 3,506 Other Current Assets 1,020 1,147 1,569 1,784 Net change in cash 2,510 -2,281 365 1,713
FDEPS (Rs) 19.4 26.9 34.9 40.6 Cash 3,766 96 460 2,173 RoE (%) 22 % 21 % 23 % 22 %
DPS (Rs) 2.2 2.5 3.0 4.0 Total Assets 24,111 27,120 32,586 36,063
RoIC (%) 14 % 13 % 15 % 15 %
CEPS (Rs) 38.3 44.8 57.2 65.9 Non-cash Working Capital 2,411 2,992 4,118 4,684
Core RoIC (%) 16 % 14 % 17 % 17 %
FCFPS (Rs) 1.9 -33.8 7.2 40.0 Cash Conv Cycle 25.1 26.5 27.3 27.5 Div Payout (%) 13 % 11 % 10 % 12 %
BVPS (Rs) 118.9 140.7 167.0 196.8 WC Turnover 14.5 13.8 13.4 13.3 P/E 53.1 38.4 29.6 25.4
EBITDAM (%) 11 % 11 % 12 % 12 % FA Turnover 3.4 3.0 3.6 4.3 P/B 8.7 7.3 6.2 5.2
PATM (%) 5 % 6 % 5 % 6 % Net D/E 0.2 0.4 0.3 0.1 P/FCFF 550.5 -30.5 144.0 25.8
Tax Rate (%) 22 % 27 % 27 % 27 % Revenue/Capital Employed 2.5 2.1 2.5 2.5 EV/EBITDA 23.9 20.7 14.9 12.8
Sales Growth (%) 39 % 18 % 33 % 13 %
Capital Employed/Equity 1.9 1.7 1.7 1.6
EV/Sales 2.6 2.3 1.7 1.5
FDEPS Growth (%) 58 % 38 % 30 % 16 %
Dividend Yield (%) 0.2 % 0.2 % 0.3 % 0.4 %
TTM P/E vs. 2 yr forward EPS growth TTM EV/EBITDA vs. 2 yr forward EBITDA growth TTM P/B vs. 2 yr forward RoE
5x
10x
15x
20x
25x
0%
20%
40%
60%
80%
100%
0
300
600
900
1200
1500
1800
Mar/10
Jun/10
Sep/10
Dec/10
Mar/11
Jun/11
Sep/11
Dec/11
Mar/12
Jun/12
Sep/12
Dec/12
Mar/13
Jun/13
Sep/13
Dec/13
Mar/14
Jun/14
Sep/14
Dec/14
Mar/15
Jun/15
Sep/15
Dec/15
Mar/16
Jun/16
Sep/16
Dec/16
Mar/17
EPS Growth
0%
10%
20%
30%
40%
50%
60%
0
4000
8000
12000
16000
20000
24000
28000
Mar/10
Jun/10
Sep/10
Dec/10
Mar/11
Jun/11
Sep/11
Dec/11
Mar/12
Jun/12
Sep/12
Dec/12
Mar/13
Jun/13
Sep/13
Dec/13
Mar/14
Jun/14
Sep/14
Dec/14
Mar/15
Jun/15
Sep/15
Dec/15
Mar/16
Jun/16
Sep/16
Dec/16
Mar/17
3x
5x
7x
9x
11xEBITDA Growth
0%
5%
10%
15%
20%
25%
30%
0
300
600
900
1200
1500
1800
Mar/10
Jun/10
Sep/10
Dec/10
Mar/11
Jun/11
Sep/11
Dec/11
Mar/12
Jun/12
Sep/12
Dec/12
Mar/13
Jun/13
Sep/13
Dec/13
Mar/14
Jun/14
Sep/14
Dec/14
Mar/15
Jun/15
Sep/15
Dec/15
Mar/16
Jun/16
Sep/16
Dec/16
Mar/17
RoE
0.5x
1x
2x
3x
4x

Minda Industries Absolute – ADD Relative – Benchmark 8% ATR in 14 Months
November 14, 2017 Analyst: AshutoshTiwari [email protected] (+91-8128694112) Page 8 of 11
Historical Consolidated Financials
P&L (Rs Mn) FY14A FY15A FY16A FY17A
Balance Sheet (Rs Mn) FY14A FY15A FY16A FY17A
Cash Flow (Rs Mn) FY14A FY15A FY16A FY17A
Revenue 17,061 22,266 25,273 35,047 Equity Capital 159 159 159 173 PBT 129 688 1,335 2,223
Op. Expenditure 16,283 20,723 22,895 31,213 Reserve 2,955 3,494 4,593 10,101 Depreciation 591 835 926 1,360
EBITDA 778 1,543 2,378 3,835 Networth 3,113 3,653 4,752 10,273 Others 395 104 277 309
Depreciation 591 835 926 1,360 Long Term Debt 2,779 2,088 3,927 5,324 Taxes Paid 87 168 253 508
EBIT 187 708 1,452 2,475 Def Tax Liability 265 294 427 768 Change in WC -611 -104 -822 177
Interest Expense 242 250 257 394 Minority Interest 138 213 1,096 1,390 Operating C/F 416 1,354 1,463 3,561
Other Income 184 229 140 142 Account Payables 2,473 2,670 3,215 5,151 Capex -1,143 -646 -3,425 -4,657
PBT 129 688 1,335 2,223 Other Curr Liabi 1,046 1,049 1,487 1,206 Change in Invest -248 195 -2,133 -2,837
Tax 76 194 277 488 Total Liabilities & Equity 9,814 9,966 14,903 24,111 Others 23 59 2,989 3,774
PAT bef. MI & Assoc. 53 494 1,058 1,734 Net Fixed Assets 4,005 3,987 5,664 8,955 Investing C/F -1,368 -391 -2,569 -3,720
Minority Interest -10 -3 115 200 Capital WIP 219 219 1,301 1,373 Change in Debt 1,058 -674 1,602 372
Profit from Assoc. 8 24 117 145 Others 551 570 903 1,250 Change in Equity 0 53 0 2,965
Recurring PAT 72 520 1,059 1,679 Inventory 1,247 1,406 1,838 2,513 Others -256 -362 -368 -669
Extraordinaires 0 -160 -52 0 Account Receivables 2,610 2,895 3,639 5,235 Financing C/F 802 -984 1,234 2,669
Reported PAT 72 680 1,111 1,679 Other Current Assets 673 589 957 1,020 Net change in cash -150 -21 127 2,510
EPS (Rs) 0.8 6.0 12.3 19.4 Cash 508 301 567 3,766
RoE (%) 2 % 15 % 25 % 22 %
DPS (Rs) 0.6 1.2 1.4 2.2
Total Assets 9,814 9,966 14,869 24,111
RoIC (%) 3 % 11 % 15 % 14 %
CEPS (Rs) 8.4 17.1 25.0 38.3 Non-cash Working Capital 1,011 1,171 1,732 2,411 Core RoIC (%) 1 % 9 % 15 % 16 %
FCFPS (Rs) -10.7 14.4 -11.4 1.9 Cash Conv Cycle 21.6 19.2 25.0 25.1 Div Payout (%) 78 % 82 % 73 % 13 %
BVPS (Rs) 39.2 46.0 59.5 118.9 WC Turnover 16.9 19.0 14.6 14.5
P/E 1,243.8 171.5 84.2 53.1
EBITDAM (%) 5 % 7 % 9 % 11 % FA Turnover 4.0 5.3 3.6 3.4 P/B 26.3 22.4 17.4 8.7
PATM (%) 0 % 2 % 4 % 5 % Net D/E 0.7 0.5 0.7 0.2 P/FCFF -96.1 71.7 -90.6 550.5
Tax Rate (%) 59 % 28 % 21 % 22 % Revenue/Capital Employed 3.0 3.6 3.1 2.5 EV/EBITDA 118.1 59.3 39.2 23.9
Sales growth (%) 27 % 31 % 14 % 39 %
Capital Employed/Equity 1.8 1.9 2.0 1.9
EV/Sales 5.4 4.1 3.7 2.6
FDEPS growth (%) -75 % 625 % 104 % 58 %
Dividend Yield (%) 0.1 % 0.1 % 0.1 % 0.2 %
Minda Industries Absolute – ADD Relative – Benchmark 8% ATR in 14 Months
November 14, 2017 Analyst: AshutoshTiwari [email protected] (+91-8128694112) Page 9 of 11
Equirus Securities
Research Analysts Sector/Industry Email
Equity Sales E-mail
Abhishek Shindadkar IT Services [email protected] 91-22-43320643 Vishad Turakhia [email protected] 91-22-43320633
Ashutosh Tiwari Auto, Metals & Mining [email protected] 91-79-61909517 SubhamSinha [email protected] 91-22-43320631
Depesh Kashyap Mid-Caps [email protected] 91-79-61909528 SwetaSheth [email protected] 91-22-43320634
Devam Modi Power & Infrastructure [email protected] 91-79-61909516 Viral Desai [email protected] 91-22-43320635
Dhaval Dama FMCG, Mid-Caps [email protected] 91-79-61909518 Dealing Room E-mail
Manoj Gori Consumer Durables [email protected] 91-79-61909523 Ashish Shah [email protected] 91-22-43320662
Maulik Patel Oil and Gas [email protected] 91-79-61909519 IleshSavla [email protected] 91-22-43320666
PrafulBohra Pharmaceuticals [email protected] 91-79-61909532 Manoj Kejriwal [email protected] 91-22-43320663
Rohan Mandora Banking & Financial Services [email protected] 91-79-61909529 Dharmesh Mehta [email protected] 91-22-43320661
Associates E-mail SandipAmrutiya [email protected] 91-22-43320660
Ankit Choudhary [email protected] 91-79-61909533 Compliance Officer E-mail
Bharat Celly [email protected] 91-79-61909524 Jay Soni [email protected] 91-79-61909561
Harshit Patel [email protected] 91-79-61909522 Corporate Communications E-mail
Meet Chande [email protected] 91-79-61909513 Mahdokht Bharda [email protected] 91-22-43320647 Parva Soni [email protected] 91-79-61909521
Pranav Mehta [email protected] 91-79-61909514
Ronak Soni [email protected] 91-79-61909525
Samkit Shah [email protected] 91-79-61909520
Shreepal Doshi [email protected] 91-79-61909541
Varun Baxi [email protected] 91-79-61909527
Vikas Jain [email protected] 91-79-61909531
Rating & Coverage Definitions: Absolute Rating • LONG : Over the investment horizon, ATR >= Ke for companies with Free Float market cap > Rs 5 billion and ATR >= 20% for rest of the companies • ADD: ATR >= 5% but less than Ke over investment horizon • REDUCE: ATR >= negative 10% but <5% over investment horizon • SHORT: ATR < negative 10% over investment horizon Relative Rating • OVERWEIGHT: Likely to outperform the benchmark by at least 5% over investment horizon • BENCHMARK: likely to perform in line with the benchmark • UNDERWEIGHT: likely to under-perform the benchmark by at least 5% over investment horizon Investment Horizon Investment Horizon is set at a minimum 3 months to maximum 18 months with target date falling on last day of a calendar quarter. Lite vs. Regular Coverage vs. Spot Coverage We aim to keep our rating and estimates updated at least once a quarter for Regular Coverage stocks. Generally, we would have access to the company and we would maintain detailed financial model for Regular coverage companies. We intend to publish updates on Lite coverage stocks only an opportunistic basis and subject to our ability to contact the management. Our rating and estimates for Lite coverage stocks may not be current. Spot coverage is meant for one-off coverage of a specific company and in such cases, earnings forecast and target price are optional. Spot coverage is meant to stimulate discussion rather than provide a research opinion.
Registered Office:
Equirus Securities Private Limited
Unit No. 1201, 12th Floor, C Wing, Marathon Futurex,
N M Joshi Marg, Lower Parel,
Mumbai-400013.
Tel. No: +91 – (0)22 – 4332 0600
Fax No: +91- (0)22 – 4332 0601
Corporate Office:
3rd floor, House No. 9,
Magnet Corporate Park, Near Zydus Hospital, B/H Intas Sola Bridge,
S.G. Highway Ahmedabad-380054
Gujarat
Tel. No: +91 (0)79 - 6190 9550
Fax No: +91 (0)79 – 6190 9560
Minda Industries Absolute – ADD Relative – Benchmark 8% ATR in 14 Months
November 14, 2017 Analyst: AshutoshTiwari [email protected] (+91-8128694112) Page 10 of 11
© 2017 Equirus Securities Private Limited. All rights reserved. For Private Circulation only. This report or any portion hereof may not
be reprinted, sold or redistributed without the written consent of Equirus Securities Private Limited
Analyst Certification
I, Ashutosh Tiwari, author to this report, hereby certify that all of the views expressed in this report accurately reflect my personal views about the subject company or companies and its or their securities. I also
certify that no part of my compensation was, is or will be, directly or indirectly, related to the specific recommendations or views expressed in this report.
Disclosures
Equirus Securities Private Limited (ESPL) having Corporate Identification Number U65993MH2007PTC176044 is registered in India with Securities and Exchange Board of India (SEBI) as a trading member on the
Capital Market (Reg. No. INB231301731), Futures & Options Segment (Reg. No.INF231301731) of the National Stock Exchange of India Ltd. (NSE) and on Cash Segment (Reg. No.INB011301737) of Bombay Stock
Exchange Limited (BSE).ESPL is also registered with SEBI as Research Analyst under SEBI (Research Analyst) Regulations, 2014 (Reg. No. INH000001154), as a Portfolio Manager under SEBI (Portfolio Managers
Regulations, 1993 (Reg. No. INP000005216) and as a Depository Participant of the Central Depository Services (India) Limited (Reg. No. IN-DP-324-2017). There are no disciplinary actions taken by any regulatory
authority against ESPL. ESPL is a subsidiary of Equirus Capital Pvt. Ltd. (ECPL) which is registered with SEBI as Category I Merchant Banker and provides investment banking services including but not limited to
merchant banking services, private equity, mergers & acquisitions and structured finance.
As ESPL and its associates are engaged in various financial services business, it might have: - (a) received compensation (except in connection with the preparation of this report) from the subject company for
investment banking or merchant banking or brokerage services in the past twelve months;(b) managed or co-managed public offering of securities for the subject company in the past twelve months; or (c) have
received a mandate from the subject company; or (d) might have other financial, business or other interests in entities including the subject company (ies) mentioned in this Report. ESPL & its associates, their
directors and employees may from time to time have positions or options in the company and buy or sell the securities of the company (ies) mentioned herein. ESPL and its associates collectively do not own (in
their proprietary position) 1% or more of the equity securities of the subject company mentioned in the report as the last day of the month preceding the publication of the research report. ESPL or its Analyst or
Associates did not receive any compensation or other benefits from the companies mentioned in the report or third party in connection with preparation of the research report. Accordingly, neither ESPL nor
Research Analysts have any material conflict of interest at the time of publication of this report. Compensation of our Research Analysts is not based on any specific merchant banking, investment banking or
brokerage service transactions. ESPL has not been engaged in market making activity for the subject company.
The Research Analyst engaged in preparation of this Report:-
(a) has not received any compensation from the subject company in the past twelve months; (b) has not managed or co-managed public offering of securities for the subject company in the past twelve months;
(c) has not received any compensation for investment banking or merchant banking or brokerage services from the subject company in the past twelve months; (d) has not received any compensation for products
or services other than investment banking or merchant banking or brokerage services from the subject company in the past twelve months; (e) has not received any compensation or other benefits from the
subject company or third party in connection with the research report; (f) might have served as an officer, director or employee of the subject company; (g) is not engaged in market making activity for the
subject company.
This document is not directed or intended for distribution to, or use by, any person or entity who is a citizen or resident of or located in any locality, state, country or other jurisdiction, where such distribution,
publication, availability or use would be contrary to law, regulation or which would subject ESPL and affiliates to any registration or licensing requirement within such jurisdiction. The securities described herein
may or may not be eligible for sale in all jurisdictions or to a certain category of investors. Persons in whose possession of this document are required to inform themselves of, and to observe, such applicable
restrictions. Please delete this document if you are not authorized to view the same. By reading this document you represent and warrant that you have full authority and all rights necessary to view and read this
document without subjecting ESPL and affiliates to any registration or licensing requirement within such jurisdiction.
This document has been prepared solely for information purpose and does not constitute a solicitation to any person to buy, sell or subscribe any security. ESPL or its affiliates are not soliciting any action based
on this report. The information and opinions contained herein is from publicly available data or based on information obtained in good faith from sources believed to be reliable but ESPL provides no guarantee as
to its accuracy or completeness. The information contained herein is as on date of this report, and is subject to change or modification and any such changes could impact our interpretation of relevant
information contained herein. While we would endeavour to update the information herein on reasonable basis, ESPL and its affiliates, their directors and employees are under no obligation to update or keep the
information current. Also there may be regulatory, compliance, or other reasons that may prevent ESPL and its group companies from doing so. This document is prepared for assistance only and is not intended
to be and must not alone be taken as the basis for an investment decision. Each recipient of this document should make such investigations as it deems necessary to arrive at an independent evaluation of an
investment in the securities of companies referred to in this document including the merits and risks involved. This document is intended for general circulation and does not take into account the specific
investment objectives, financial situation or particular needs of any particular person. ESPL and its group companies, employees, directors and agents accept no liability, and disclaim all responsibility, for the
consequences of you or anyone else acting, or refraining to act, in reliance on the information contained in this publication or for any decision based on it. ESPL/its affiliates do and seek to do business with
companies covered in its research report. Thus, investors should be aware that the firm may have conflict of interest.

Minda Industries Absolute – ADD Relative – Benchmark 8% ATR in 14 Months
November 14, 2017 Analyst: AshutoshTiwari [email protected] (+91-8128694112) Page 11 of 11
A graph of daily closing prices of securities is available at http://www.nseindia.com/ChartApp/install/charts/mainpage.jsp and www.bseindia.com (Choose a company from the list on the browser and select the
“three years” period in the price chart).
Disclosure of Interest statement for the subject Company Yes/No If Yes, nature of such interest
Research Analyst’ or Relatives’ financial interest No
Research Analyst’ or Relatives’ actual/beneficial ownership of 1% or more No
Research Analyst’ or Relatives’ material conflict of interest No
Disclaimer for U.S. Persons
ESPL/its affiliates are not a registered broker–dealer under the U.S. Securities Exchange Act of 1934, as amended (the“1934 act”) and under applicable state laws in the United States. In addition Equirus is not a
registered investment adviser under the U.S. Investment Advisers Act of 1940, as amended (the "Advisers Act" and together with the 1934 Act, the “Acts”), and under applicable state laws in the United States.
Accordingly, in the absence of specific exemption under the Acts, any brokerage and investment services provided by Equirus, including the products and services described herein are not available to or intended
for U.S. persons. The information contained in this Report is not intended for any person who is a resident of the United States of America or a resident of any jurisdiction, the laws of which imposes prohibition
on soliciting the securities business in that jurisdiction without going through the registration requirements and/ or prohibit the use of any information contained in this report. This Report and its respective
contents do not constitute an offer or invitation to purchase or subscribe for any securities or solicitation of any investments or investment services and/or shall not be considered as an advertisement tool. "U.S.
Persons" are generally defined as a natural person, residing in the United States or any entity organized or incorporated under the laws of the United States. US Citizens living abroad may also be deemed "US
Persons" under certain rules.