Embed Size (px)
Citation preview
Mind Your Metadata: Exploiting Semantics for Configuration, Adaptation, and Provenance in
Scientific Workflows
Yolanda Gil1, Pedro Szekely1, Sandra Villamizar2, Thomas C. Harmon2, Varun Ratnakar1, Shubham Gupta1,
Maria Muslea1, Fabio Silva1, Craig A. Knoblock1
1 Information Sciences Institute, University of Southern California, 4676 Admiralty Way, Marina del Rey, CA 90292, USA
2 School of Engineering, University of California Merced, 5200 North Lake Rd., Merced, CA 95343, USA
{gil, szekely, varunr, shubhamg, mariam, fabio, knoblock}@isi.edu {tharmon, villamizar_amaya}@ucmerced.edu
Abstract. Scientific metadata containing semantic descriptions of scientific data is expensive to capture and is typically not used across entire data analytic processes. We present an approach where semantic metadata is generated as scientific data is being prepared, and then subsequently used to configure models and to customize them to the data. The metadata captured includes sensor descriptions, data characteristics, data types, and process documentation. This metadata is then used in a workflow system to select analytic models dynamically and to set up model parameters automatically. In addition, all aspects of data processing are documented, and the system is able to generate extensive provenance records for new data products based on the metadata. As a result, the system can dynamically select analytic models based on the metadata properties of the data it is processing, generating more accurate results. We show results in analyzing stream metabolism for watershed ecosystem management.
Keywords: Scientific metadata, semantic workflows, data integration.
1 Introduction
Despite significant advances in computational infrastructure and sensor network observatories, many environmental scientists are slowed down by the tasks required to set up their analyses as data comes in daily from their sensors. Data preparation is time-consuming: scientists gather data from multiple sources and sensors, they must first clean the data, normalize it so that data from different sources is represented using the same units and formats, and they must integrate it and configure it according to the requirements of their models and simulation software. Data analysis is also time consuming: scientists run different models and must make sure to provide each model the inputs it requires in the format it requires, and that the outputs of one model are compatible with the inputs of the next one.
An important aspect of data analysis is selecting and fine-tuning models according to the data characteristics. For example, for analyzing metabolism in a river some models are appropriate for high water flows, and others are best for low water flows. One way to do this is for the scientist to first prepare the data, and then based on the characteristics of the data select the appropriate models. This simple approach becomes cumbersome and time-consuming when scientists wish to run their analysis periodically (e.g., every day) to analyze data coming from sensors.
Despite best intentions and care, the execution of a model may fail, often because data violates a model assumption for which components do not explicitly check. Errors that surface in running a model may have been introduced in an earlier step. To understand and debug these problems, scientists need to trace back the provenance of the data.
Finally, to assess progress, scientists must be able to reproduce their analyses, to run new models on previous data, and to easily retrieve results of prior runs. Reproducing previous analyses becomes difficult if the process involved manual steps where scientists manually configured models, or interactively provided inputs. The process needs to be fully audited so it can be accurately reproduced. Results from many runs need to be found based on their properties. Inspecting prior results is often difficult because scientific analysis processes often generate vast amounts of data and files, and without explicit metadata and provenance information it is hard to understand where each piece of data came from and what it represents.
All these issues could be addressed if scientists invested the time and were thorough in creating and propagating metadata as they prepare and process data. However, the management of metadata often has to be done manually, so it becomes a burden and therefore it is seldom done.
The main contribution of our work is to show that by explicitly capturing the semantics of the data and their provenance, our tools enable scientists to focus on their science rather than on the mechanics of running their models. We show that capturing metadata and propagating it through the data preparation and analysis processes is useful to: 1) save manual effort in managing metadata and setting up and running analyses, 2) make all data and analytic results searchable, 3) make results understandable and interpretable, 4) share results with other scientists. We demonstrate two integrated systems for data preparation and analysis that capture and use metadata and provenance information as data flows through different steps of the process. Karma, our data preparation system [Tuchinda et al. 2011] helps scientists extract, clean, normalize and integrate the data coming from sensors and third-party data sources. Karma uses a programming by example paradigm to enable scientists to perform these tasks by providing examples of how the data should be transformed. Karma infers general procedures from these examples that it can then apply to entire data sets. During this process, Karma also learns models of the data, aligning the data to a domain ontology and augmenting the data sets with metadata that records the learned models. This metadata is passed along with the data to Wings, a workflow system that uses the metadata to ensure that the workflow components fit together in a semantically meaningful way. Most importantly, this metadata enables Wings to dynamically select analytic models and parameters that are appropriate for the data being processed. Because all metadata is expressed according to a domain ontology, it is possible to query all workflow results in terms of the domain ontology.
Karma and Wings work together to make metadata management effective and accessible to scientists while saving them time throughout the data analysis processes. Karma generates the metadata that Wings uses to reason about the workflow almost as a side effect of preparing the data for the workflow. Much of the metadata is learned automatically from the data itself. Wings then propagates the metadata throughout the workflow to all intermediate data sets that each workflow component produces as it is executed. In the end, the provenance for all data sets is captured in the metadata, producing a complete audit trail of the workflow products.
This paper presents our approach in the context of a case study where scientists analyze stream metabolism of the Merced river in California’s Central Valley. In the next section we describe the case study in more detail. In section 3 we present an overview of the approach, and in sections 4 and 5 we describe Karma and Wings in more detail. In section 6 we show the results of our case study, and in section 7 we present conclusions and directions for future work.
2 Motivation: Environmental Science
Despite tremendous advances in shared infrastructure, many daily tasks faced by scientists are disconnected from those capabilities. For environmental scientists and many of the observatory disciplines, the scientific method—hypothesize, observe, analyze, interpret—remains bogged down by myriad manual and routine data analysis processes aimed at separating environmental variability from the phenomena of interest. To truly enable transformative science, the time and effort required for these processes must be lowered in order to substantially compress the timeframe of observatory-scale analysis.
We motivate key requirements to support scientists with the problem of simulation of whole stream metabolism, where we use a model for estimating rates of aquatic photosynthesis known as gross primary production (GPP) and community respiration (CR24) [Bott 2007]. These estimates are useful for assessing the status of and changes in stream ecosystems in the context of a watershed management.
In our domain of interest, the hypothesize, observe, analyze, interpret cycle takes weeks to months longer than the timescale of observation, such that the best that scientists can achieve are post-hoc interpretations of river conditions. Furthermore, in uncontrolled (real) systems, they often learn only late in the observation or analysis parts of the cycle that an experiment has failed due to unexpected changes in river flow or water chemistry. These limitations make it difficult for researchers to discover the cause and effect links between different drivers (e.g., climate and land use change) and the aquatic ecosystem function on a timescale less than years, or even decades. By automating and compressing the cycle of data collection, integration, and analysis, we aim not only to enable the more rapid advancement of river science, but to advance the environmental science paradigm by enabling timely, practical resource management decisions [Dozier and Gail, 2009]. We now describe the data preparation, integration, and processing steps in this cycle for water metabolism.
Data Preparation Stream ecologists spend significant time collecting data in the field and preparing it
to be useful for running computational models. Metadata regarding data origins is needed at collection time to annotate the station, location, type of sensor, and error rates. This metadata is important for selecting supplemental data and to determine which models to run. For example, the time and location are needed so that weather data from national weather sites is selected consistently with the sensor readings. Once the raw data is transmitted or brought back to the lab, it needs to be checked for consistency and anomalies. For example, data filtering is generally needed to remove noise and spurious data points, or sometimes sensor calibration drift necessitates systematic adjustment of the data. These quality control steps should be tracked, as they transform data in ways that are important to select models and to interpret results of future steps.
Data Integration Beyond investigations of local, site-specific scope, a major need for environmental
scientists is the integration of their data with the massive amounts of data and other resources that the national scale cyberobservatories are designed to provide. For example, river simulators require inputs such as: (1) the material properties (e.g., the soil type of the river bed in different parts of the model) and structure or geometry of the simulated domain (e.g., the bathymetry of the river bed), (2) the fluid properties, including dissolved chemical species, and (3) the initial and boundary conditions associated with the river (e.g., a constant flow condition on the upstream boundary would drive flow into the system). The data behind these parameters are populated from a variety of data sources and are in different formats, including spatial shapefiles, time series, and locally gridded data (as from robotic sensor platforms). It is important to capture metadata about types and constraints to represent the semantics of what the data means and what data each source provides. The origin metadata captured during earlier data preparation steps is useful here in order to select the appropriate supplemental data sources. In addition, metadata about statistical properties of the datasets provides extremely useful characteristics that drive model use and facilitate search. For example, extracting the average daily depth of a river based on hourly readings enables scientists to determine days of low flow and select models appropriately.
Data Processing Once datasets are located, cleansed, and integrated, there are many possible data
analysis processes performed using analytic software or simulation models. Analytic and simulation software may be developed in-house or by colleagues, or obtained from third parties such as government agencies or commercial vendors. Examples range from relatively sophisticated simulation engine codes for river flow, chemical fate, and transport modeling to statistical packages for time series analysis. These tools are used in diverse aspects of the modeling processes. For example, spatial interpolation routines are often used to prepare spatially distributed material properties or physical parameters for input to gridded numerical simulation models.
For our task of river metabolism analysis, there are a variety of model types available. Selecting the most appropriate models for analysis is important. In the
current post-hoc modeling paradigm, the researcher needs to select an appropriate one on the basis of key observational parameters and knowledge of the field. For instance, some metabolism rate models work better when the river flow is relatively low while others are better suited to high flow conditions. Indeed, for a given location in a river, different models may be appropriate over different time periods because the amount of water may change drastically based on changes in conditions dictated by weather (e.g. heavy precipitation or snow melt) or human activities (e.g., reservoir releases). Therefore, the metadata about statistical properties captured earlier during data integration is useful to select models at this stage.
As if managing the data transfers across individual tools and models were not challenging and time consuming enough, metadata is often poorly managed and laborious to integrate into the analysis. Key metadata is often archived locally by key investigators but not moved along with the data throughout the analytic process steps. Metadata for analytic results is tracked manually and seldom published. This process metadata is key for documenting results, so that they can be interpreted appropriately, searched based on what processes were used to generate them, and so that they can be understood and used by other investigators. For example, the fact that a particular model was used to generate a result and what the parameter settings were matter tremendously if the result is to be integrated with other results.
In summary, scientists need integrated environments for managing end-to-end data preparation, integration, and analysis that offer a comprehensive treatment of metadata throughout the processes. In order to make scientific data analysis processes more efficient and useful, we must offer better support to capture metadata about: 1) the origins of raw data, 2) the types and relationships across datasets, 3) the statistical properties of datasets, and 4) the processes applied to the data.
3 Approach: Provenance-Aware Systems that Manage Metadata
Our approach is to develop provenance-aware systems that create, propagate, and use metadata as they contribute to scientific data analysis processes. Metadata can be extracted from original data sources, created during data integration and analysis, and propagated throughout the different steps of the analysis process so that the provenance of any result (whether intermediate or final) is well documented. All this metadata is useful throughout the process to integrate with new data sources, to select and setup analytic steps, and to understand analytic results.
To demonstrate our approach, we have developed two provenance-aware systems that address complementary steps in the scientific analysis process. Karma, our data preparation tool, carries out data preparation and integration steps [Tuchinda et al. 2011]. Wings, our workflow system, carries our data processing steps through computations [Gil et al. 2011]. Both systems capture and use metadata as the data flows through different steps.
Figure 1 shows an overview of the interaction between Karma and Wings, which will be described in detail in the rest of the paper. The bottom-left part of the figure
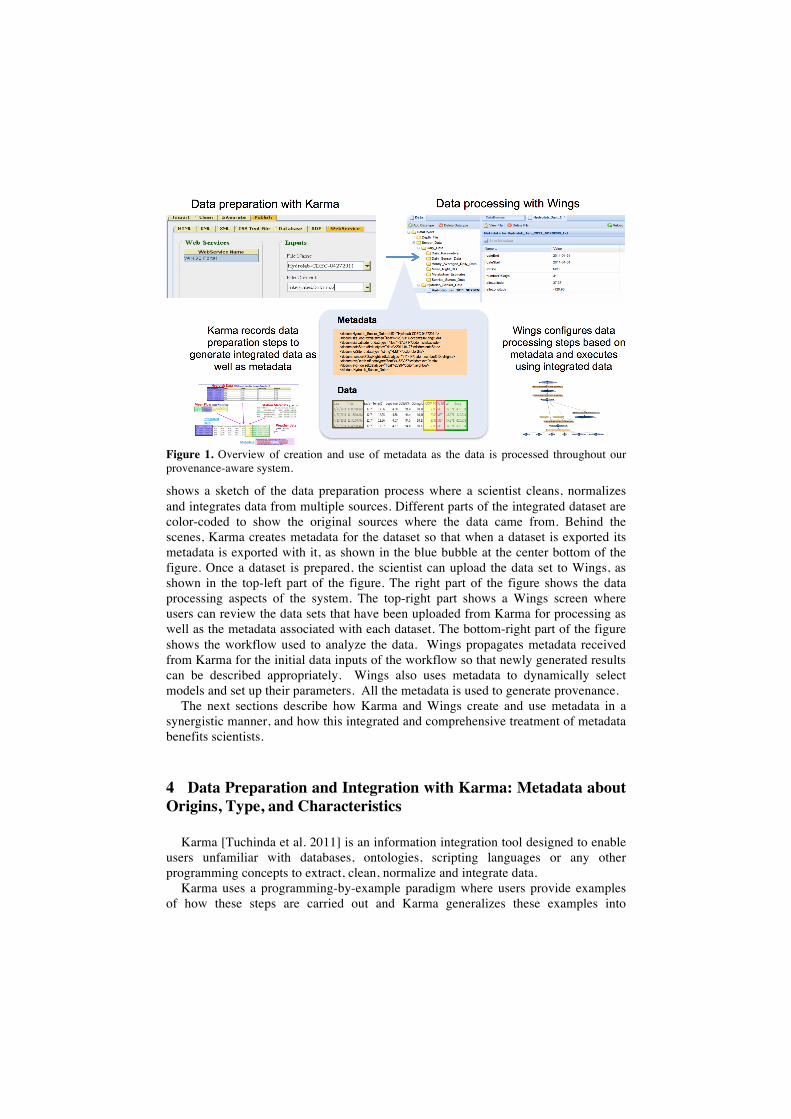
Figure 1. Overview of creation and use of metadata as the data is processed throughout our provenance-aware system.
shows a sketch of the data preparation process where a scientist cleans, normalizes and integrates data from multiple sources. Different parts of the integrated dataset are color-coded to show the original sources where the data came from. Behind the scenes, Karma creates metadata for the dataset so that when a dataset is exported its metadata is exported with it, as shown in the blue bubble at the center bottom of the figure. Once a dataset is prepared, the scientist can upload the data set to Wings, as shown in the top-left part of the figure. The right part of the figure shows the data processing aspects of the system. The top-right part shows a Wings screen where users can review the data sets that have been uploaded from Karma for processing as well as the metadata associated with each dataset. The bottom-right part of the figure shows the workflow used to analyze the data. Wings propagates metadata received from Karma for the initial data inputs of the workflow so that newly generated results can be described appropriately. Wings also uses metadata to dynamically select models and set up their parameters. All the metadata is used to generate provenance.
The next sections describe how Karma and Wings create and use metadata in a synergistic manner, and how this integrated and comprehensive treatment of metadata benefits scientists.
4 Data Preparation and Integration with Karma: Metadata about Origins, Type, and Characteristics
Karma [Tuchinda et al. 2011] is an information integration tool designed to enable users unfamiliar with databases, ontologies, scripting languages or any other programming concepts to extract, clean, normalize and integrate data.
Karma uses a programming-by-example paradigm where users provide examples of how these steps are carried out and Karma generalizes these examples into
procedures that can be applied to entire datasets. User studies [Tuchinda et al. 2011] showed that users were able to complete three information integration tasks about three times faster using Karma than using Dapper/Yahoo Pipes (a state of the art tool). These studies also revealed that the Karma users were able to complete the tasks without error. In contrast, 83% of Dapper/Yahoo Pipes users made at least one error in the first task, 45% in the second and 95% in the third. Karma is a visual tool that offers users a table representation of their data and commands to import, clean, integrate and publish their data. We present the Karma capabilities in the context of our stream metabolism case study.
The first data preparation step is to import the various data sets needed to drive the stream metabolism analysis. The first set of sources comes from the California Data Exchange Center (CDEC, water.ca.gov). We defined a Web service that provides programmatic access to the data published in this web site. After users select the appropriate web service from the library of web services registered in Karma, they can select the parameters of the service that are of interest. In the CDEC service, users can choose the station, sensor and date ranges. The data retrieved from the Web service is subsequently shown in a table where users can proceed with further data preparation steps. In our case study, users import data for multiple sensors obtaining a collection of five tables with data for the dates of interest. Our users also use data from their own water quality sensors, which comes from a comma-separated-value (CSV) file, and a metadata source from CDEC that records the geospatial coordinates of all the CDEC sensors, also a CSV file.
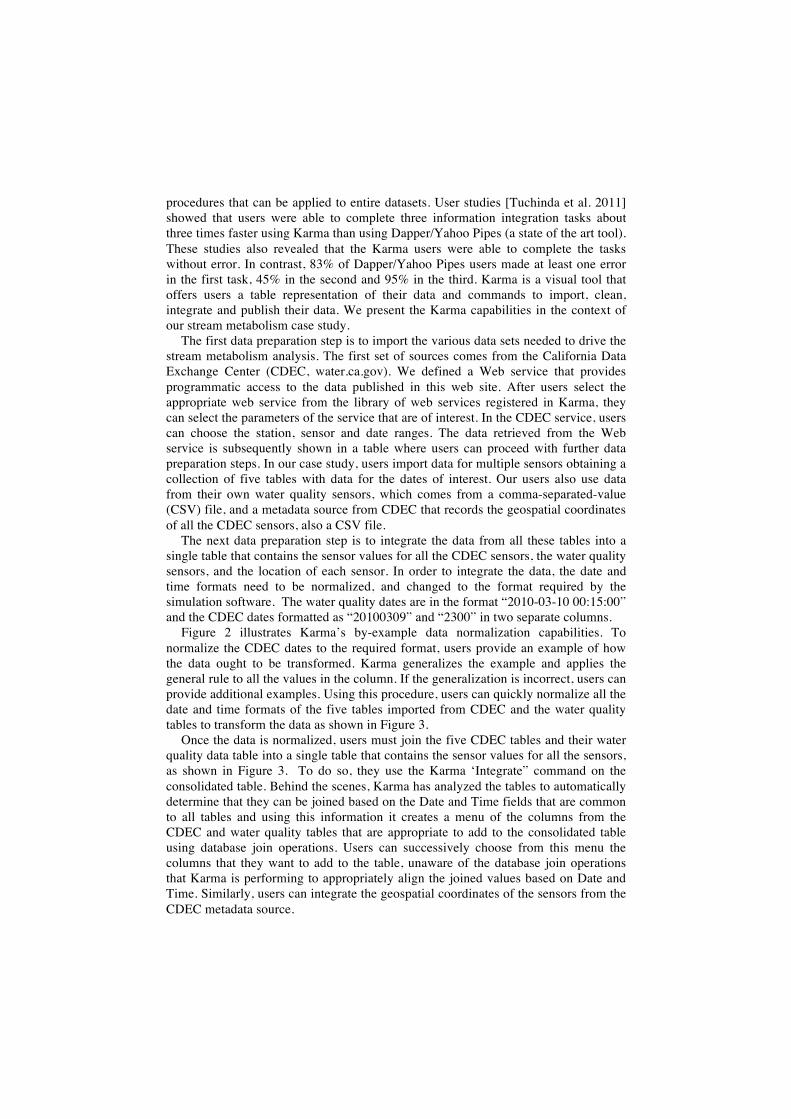
The next data preparation step is to integrate the data from all these tables into a single table that contains the sensor values for all the CDEC sensors, the water quality sensors, and the location of each sensor. In order to integrate the data, the date and time formats need to be normalized, and changed to the format required by the simulation software. The water quality dates are in the format “2010-03-10 00:15:00” and the CDEC dates formatted as “20100309” and “2300” in two separate columns.
Figure 2 illustrates Karma’s by-example data normalization capabilities. To normalize the CDEC dates to the required format, users provide an example of how the data ought to be transformed. Karma generalizes the example and applies the general rule to all the values in the column. If the generalization is incorrect, users can provide additional examples. Using this procedure, users can quickly normalize all the date and time formats of the five tables imported from CDEC and the water quality tables to transform the data as shown in Figure 3.
Once the data is normalized, users must join the five CDEC tables and their water quality data table into a single table that contains the sensor values for all the sensors, as shown in Figure 3. To do so, they use the Karma ‘Integrate” command on the consolidated table. Behind the scenes, Karma has analyzed the tables to automatically determine that they can be joined based on the Date and Time fields that are common to all tables and using this information it creates a menu of the columns from the CDEC and water quality tables that are appropriate to add to the consolidated table using database join operations. Users can successively choose from this menu the columns that they want to add to the table, unaware of the database join operations that Karma is performing to appropriately align the joined values based on Date and Time. Similarly, users can integrate the geospatial coordinates of the sensors from the CDEC metadata source.
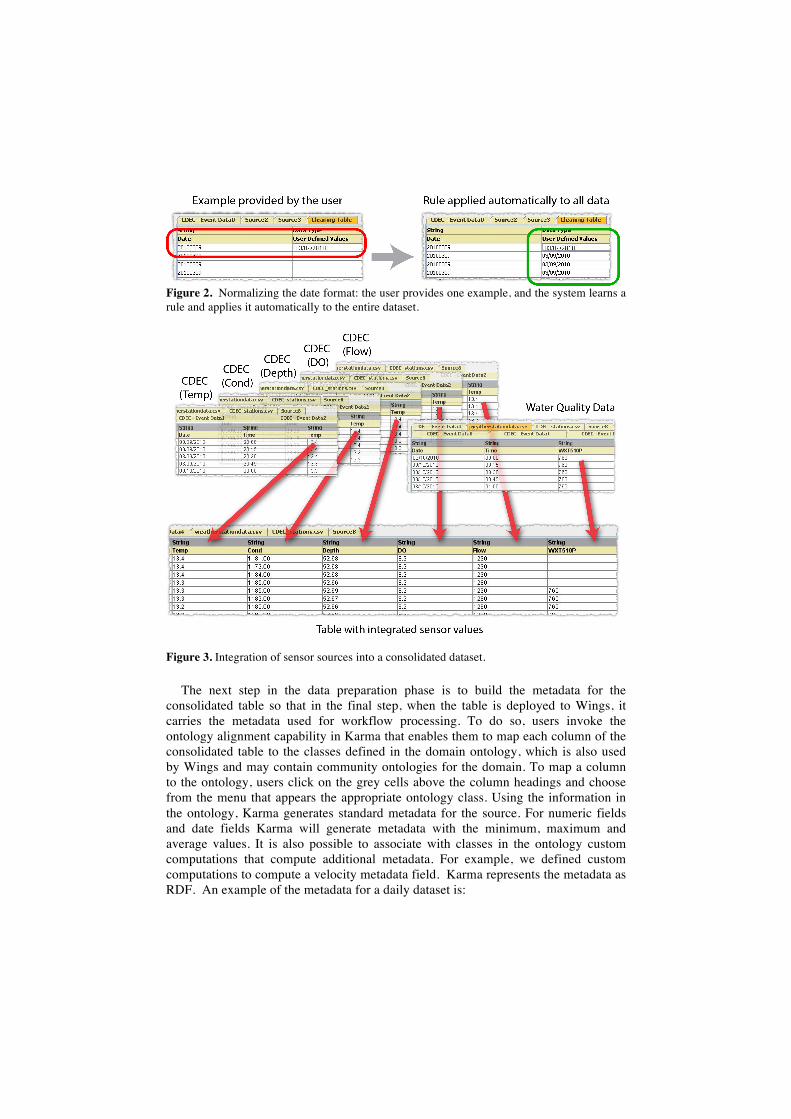
Figure 2. Normalizing the date format: the user provides one example, and the system learns a rule and applies it automatically to the entire dataset.
Figure 3. Integration of sensor sources into a consolidated dataset.
The next step in the data preparation phase is to build the metadata for the
consolidated table so that in the final step, when the table is deployed to Wings, it carries the metadata used for workflow processing. To do so, users invoke the ontology alignment capability in Karma that enables them to map each column of the consolidated table to the classes defined in the domain ontology, which is also used by Wings and may contain community ontologies for the domain. To map a column to the ontology, users click on the grey cells above the column headings and choose from the menu that appears the appropriate ontology class. Using the information in the ontology, Karma generates standard metadata for the source. For numeric fields and date fields Karma will generate metadata with the minimum, maximum and average values. It is also possible to associate with classes in the ontology custom computations that compute additional metadata. For example, we defined custom computations to compute a velocity metadata field. Karma represents the metadata as RDF. An example of the metadata for a daily dataset is:
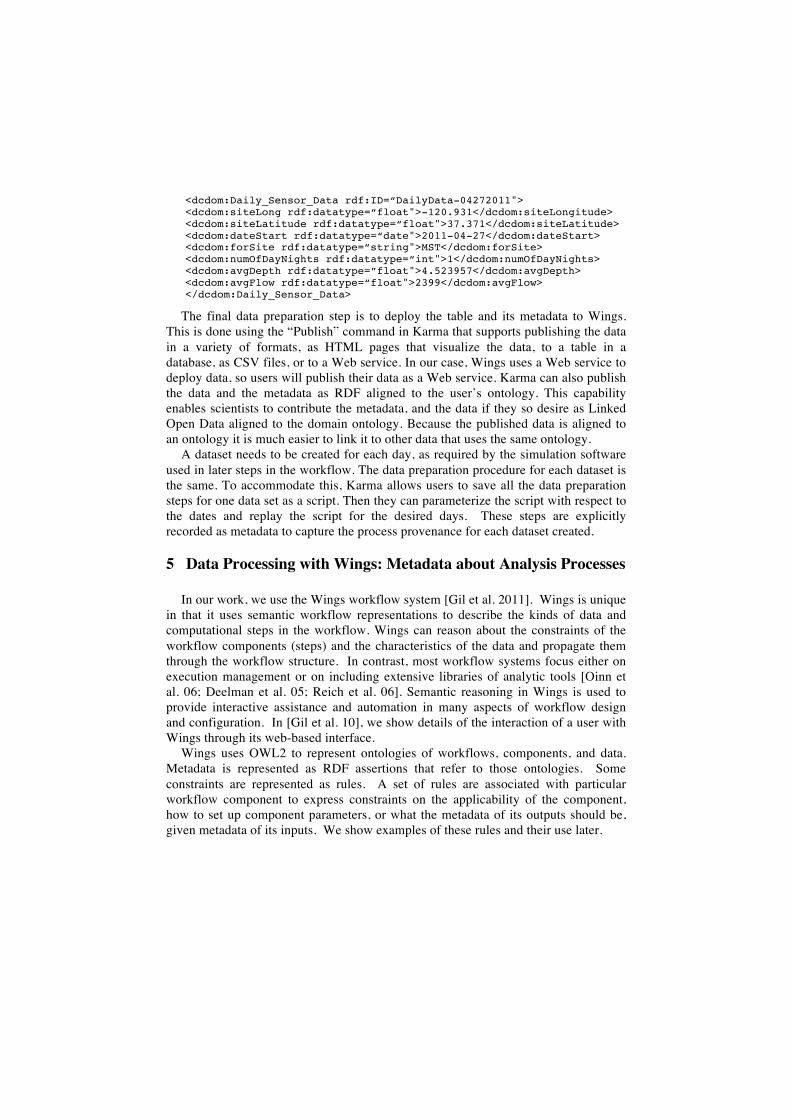
<dcdom:Daily_Sensor_Data rdf:ID=“DailyData-04272011"> <dcdom:siteLong rdf:datatype=“float">-120.931</dcdom:siteLongitude> <dcdom:siteLatitude rdf:datatype=“float">37.371</dcdom:siteLatitude> <dcdom:dateStart rdf:datatype=“date">2011-04-27</dcdom:dateStart> <dcdom:forSite rdf:datatype=”string">MST</dcdom:forSite> <dcdom:numOfDayNights rdf:datatype=“int">1</dcdom:numOfDayNights> <dcdom:avgDepth rdf:datatype=”float">4.523957</dcdom:avgDepth> <dcdom:avgFlow rdf:datatype=“float">2399</dcdom:avgFlow> </dcdom:Daily_Sensor_Data>
The final data preparation step is to deploy the table and its metadata to Wings. This is done using the “Publish” command in Karma that supports publishing the data in a variety of formats, as HTML pages that visualize the data, to a table in a database, as CSV files, or to a Web service. In our case, Wings uses a Web service to deploy data, so users will publish their data as a Web service. Karma can also publish the data and the metadata as RDF aligned to the user’s ontology. This capability enables scientists to contribute the metadata, and the data if they so desire as Linked Open Data aligned to the domain ontology. Because the published data is aligned to an ontology it is much easier to link it to other data that uses the same ontology.
A dataset needs to be created for each day, as required by the simulation software used in later steps in the workflow. The data preparation procedure for each dataset is the same. To accommodate this, Karma allows users to save all the data preparation steps for one data set as a script. Then they can parameterize the script with respect to the dates and replay the script for the desired days. These steps are explicitly recorded as metadata to capture the process provenance for each dataset created.
5 Data Processing with Wings: Metadata about Analysis Processes
In our work, we use the Wings workflow system [Gil et al. 2011]. Wings is unique in that it uses semantic workflow representations to describe the kinds of data and computational steps in the workflow. Wings can reason about the constraints of the workflow components (steps) and the characteristics of the data and propagate them through the workflow structure. In contrast, most workflow systems focus either on execution management or on including extensive libraries of analytic tools [Oinn et al. 06; Deelman et al. 05; Reich et al. 06]. Semantic reasoning in Wings is used to provide interactive assistance and automation in many aspects of workflow design and configuration. In [Gil et al. 10], we show details of the interaction of a user with Wings through its web-based interface.
Wings uses OWL2 to represent ontologies of workflows, components, and data. Metadata is represented as RDF assertions that refer to those ontologies. Some constraints are represented as rules. A set of rules are associated with particular workflow component to express constraints on the applicability of the component, how to set up component parameters, or what the metadata of its outputs should be, given metadata of its inputs. We show examples of these rules and their use later.
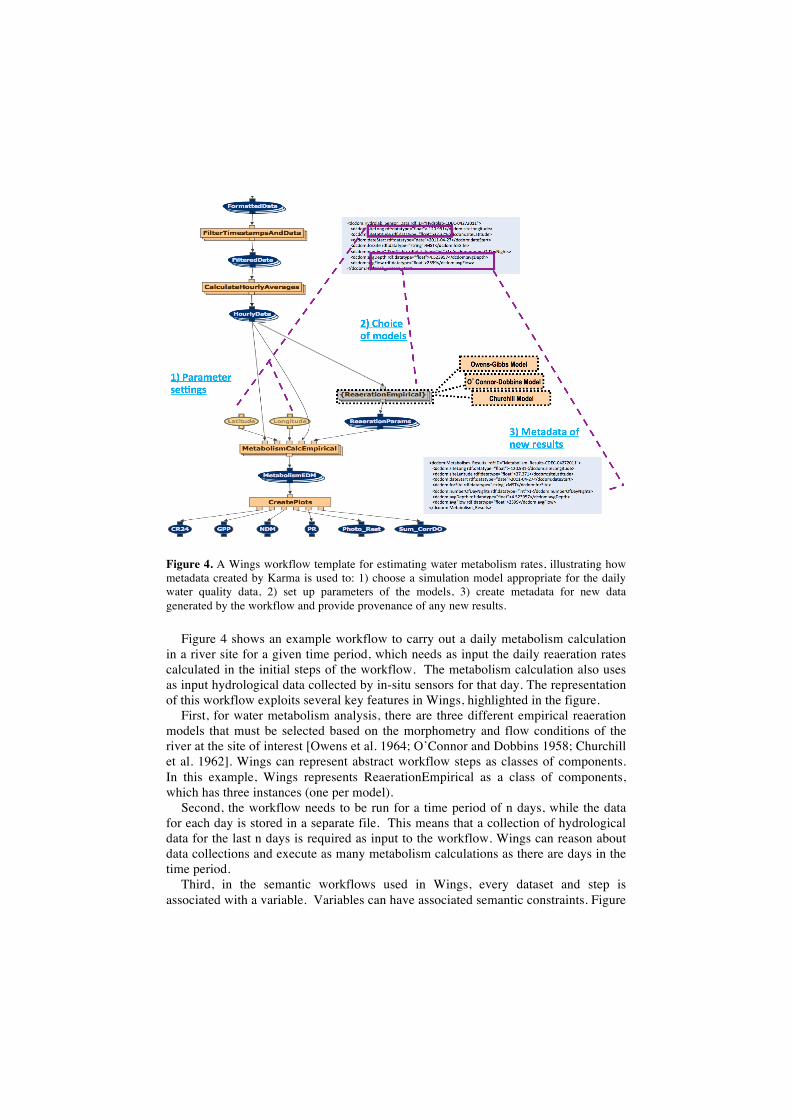
Figure 4. A Wings workflow template for estimating water metabolism rates, illustrating how metadata created by Karma is used to: 1) choose a simulation model appropriate for the daily water quality data, 2) set up parameters of the models, 3) create metadata for new data generated by the workflow and provide provenance of any new results.
Figure 4 shows an example workflow to carry out a daily metabolism calculation
in a river site for a given time period, which needs as input the daily reaeration rates calculated in the initial steps of the workflow. The metabolism calculation also uses as input hydrological data collected by in-situ sensors for that day. The representation of this workflow exploits several key features in Wings, highlighted in the figure.
First, for water metabolism analysis, there are three different empirical reaeration models that must be selected based on the morphometry and flow conditions of the river at the site of interest [Owens et al. 1964; O’Connor and Dobbins 1958; Churchill et al. 1962]. Wings can represent abstract workflow steps as classes of components. In this example, Wings represents ReaerationEmpirical as a class of components, which has three instances (one per model).
Second, the workflow needs to be run for a time period of n days, while the data for each day is stored in a separate file. This means that a collection of hydrological data for the last n days is required as input to the workflow. Wings can reason about data collections and execute as many metabolism calculations as there are days in the time period.
Third, in the semantic workflows used in Wings, every dataset and step is associated with a variable. Variables can have associated semantic constraints. Figure
4 shows these constraints for the input variable Formatted_Data in a small box at the top, they are not readable but they are the metadata generated by Karma shown in the last section. These semantic constraints can be used to represent metadata properties of input datasets, such as the type of sensor and the collection date of a dataset of water flow rates. Wings checks that the metadata properties of the input datasets are consistent with the constraints of the workflow variable Formatted_Data.
Several important capabilities of Wings are used in this application and described in the rest of this section.
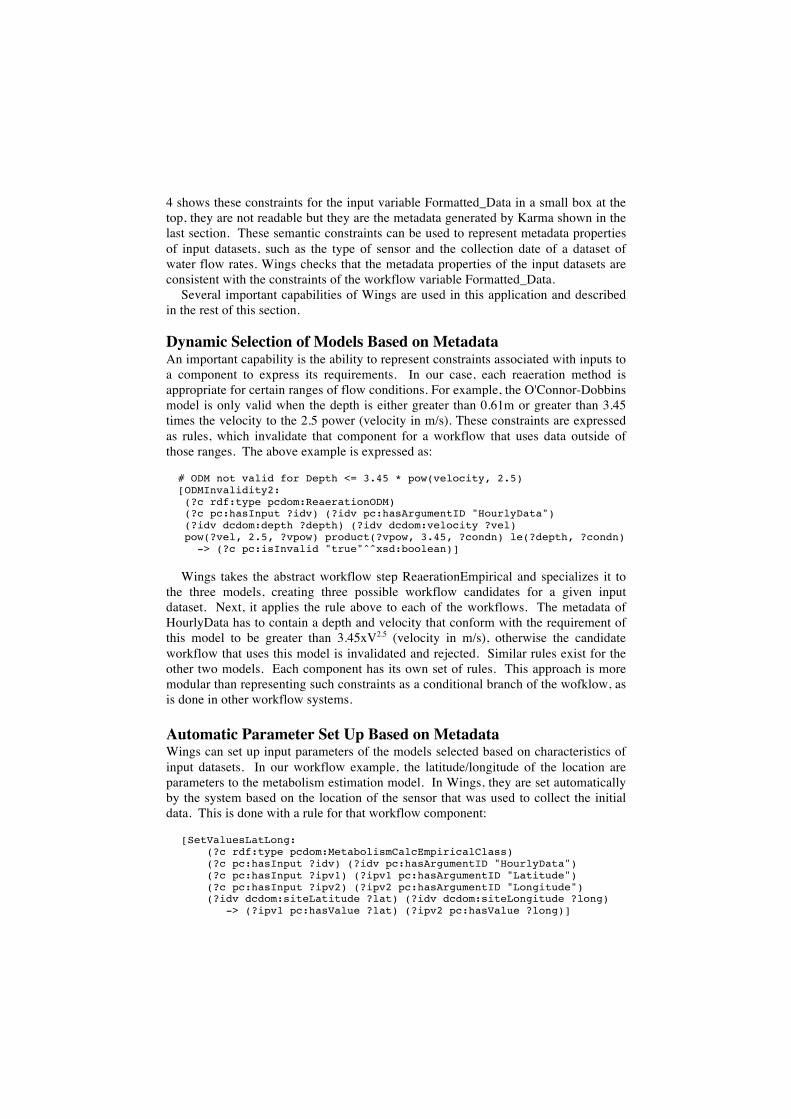
Dynamic Selection of Models Based on Metadata An important capability is the ability to represent constraints associated with inputs to a component to express its requirements. In our case, each reaeration method is appropriate for certain ranges of flow conditions. For example, the O'Connor-Dobbins model is only valid when the depth is either greater than 0.61m or greater than 3.45 times the velocity to the 2.5 power (velocity in m/s). These constraints are expressed as rules, which invalidate that component for a workflow that uses data outside of those ranges. The above example is expressed as:
# ODM not valid for Depth <= 3.45 * pow(velocity, 2.5) [ODMInvalidity2: (?c rdf:type pcdom:ReaerationODM) (?c pc:hasInput ?idv) (?idv pc:hasArgumentID "HourlyData") (?idv dcdom:depth ?depth) (?idv dcdom:velocity ?vel) pow(?vel, 2.5, ?vpow) product(?vpow, 3.45, ?condn) le(?depth, ?condn) -> (?c pc:isInvalid "true"^^xsd:boolean)] Wings takes the abstract workflow step ReaerationEmpirical and specializes it to
the three models, creating three possible workflow candidates for a given input dataset. Next, it applies the rule above to each of the workflows. The metadata of HourlyData has to contain a depth and velocity that conform with the requirement of this model to be greater than 3.45xV2.5 (velocity in m/s), otherwise the candidate workflow that uses this model is invalidated and rejected. Similar rules exist for the other two models. Each component has its own set of rules. This approach is more modular than representing such constraints as a conditional branch of the wofklow, as is done in other workflow systems.
Automatic Parameter Set Up Based on Metadata Wings can set up input parameters of the models selected based on characteristics of input datasets. In our workflow example, the latitude/longitude of the location are parameters to the metabolism estimation model. In Wings, they are set automatically by the system based on the location of the sensor that was used to collect the initial data. This is done with a rule for that workflow component:
[SetValuesLatLong: (?c rdf:type pcdom:MetabolismCalcEmpiricalClass) (?c pc:hasInput ?idv) (?idv pc:hasArgumentID "HourlyData") (?c pc:hasInput ?ipv1) (?ipv1 pc:hasArgumentID "Latitude") (?c pc:hasInput ?ipv2) (?ipv2 pc:hasArgumentID "Longitude") (?idv dcdom:siteLatitude ?lat) (?idv dcdom:siteLongitude ?long) -> (?ipv1 pc:hasValue ?lat) (?ipv2 pc:hasValue ?long)]
Note however that the HourlyData input to the metabolism calculation is not an
input to the workflow, so it does not have any metadata. That is, while we know what the characteristics are for the input water quality datasets generated by Karma (FormattedData), we do not know what the characteristics are for other datasets in the workflow. Wings has the ability to create metadata for HourlyData by propagating metadata throughout the workflow, as we explain below. Automatic Generation of Metadata for New Results Wings generates metadata for all new workflow data products, and we already discussed how this metadata is used by the two types of rules that we just described.
Wings uses rules for components that express what the output metadata properties are based on input metadata properties. This is handled through metadata propagation rules associated with each component. An example rule for the first workflow step is:
[FwdPropFilter: (?c rdf:type pcdom:FilterTimestampsAndDataClass) (?c pc:hasInput ?idv) (?idv pc:hasArgumentID "InputSensorData") (?c pc:hasOutput ?odv) (?odv pc:hasArgumentID "outputSensorData") (?idv ?p ?val) (?p rdfs:subPropertyOf dc:hasDataMetrics) -> (?odv ?p ?val)]
Here, the property hasDataMetrics is a superclass of all the metadata properties that must be propagated to the outputs of a component, otherwise they are assumed to be different for the output dataset created by the component. Other rules express how metadata of the outputs will be different based on the metadata of the inputs, what the computation is about, and what the parameter settings are. These metadata propagation rules are used to automatically create metadata for all workflow data products. As a result, any resulting data can be queried based on their properties.
Workflow data products also have detailed provenance metadata that records what workflow was used to generate them. All workflow executions with their provenance can be exported as Linked Data using the Open Provenance Model (http://openprovenance.org). Unlike other provenance systems, Wings provenance records include semantic metadata associated to datasets, which can be used to query about workflow results. We show examples of such queries in the next section.
6 Results
An important contribution of our work is that our provenance-aware system automatically chooses a model each day based on metadata characteristics that are created and propagated by the system about the daily data. The results of the data analysis are more meaningful from the point of view of the scientific application.
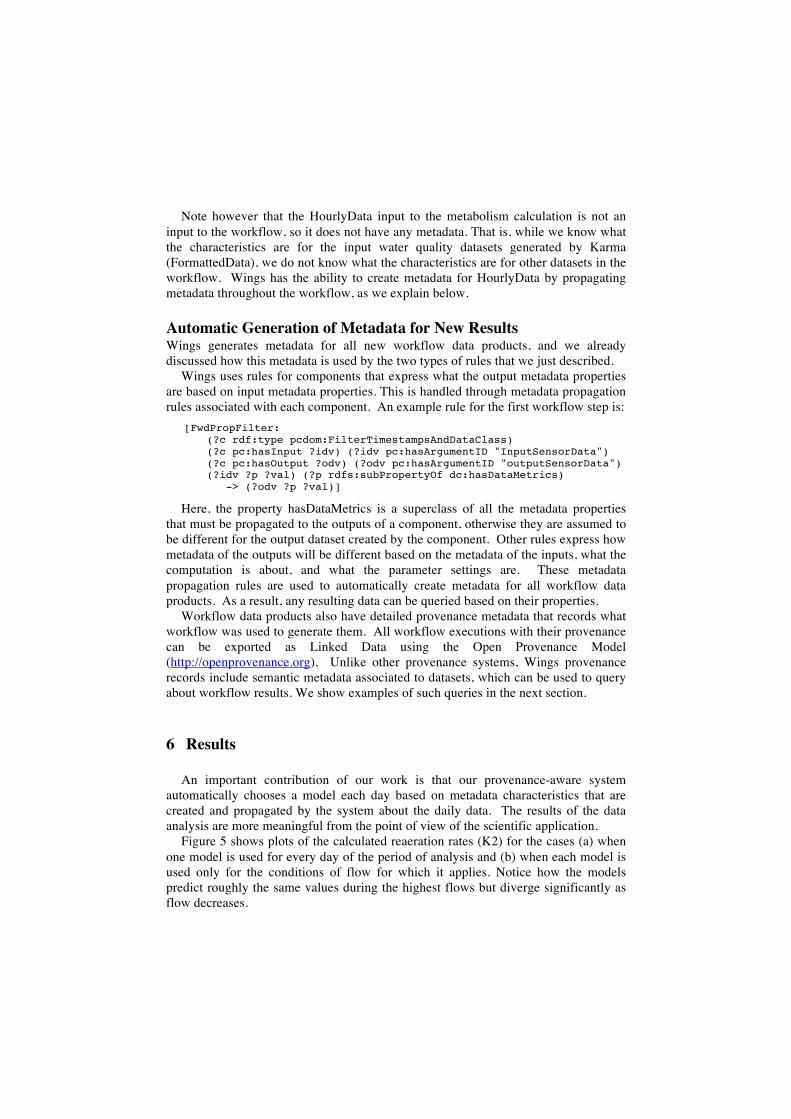
Figure 5 shows plots of the calculated reaeration rates (K2) for the cases (a) when one model is used for every day of the period of analysis and (b) when each model is used only for the conditions of flow for which it applies. Notice how the models predict roughly the same values during the highest flows but diverge significantly as flow decreases.
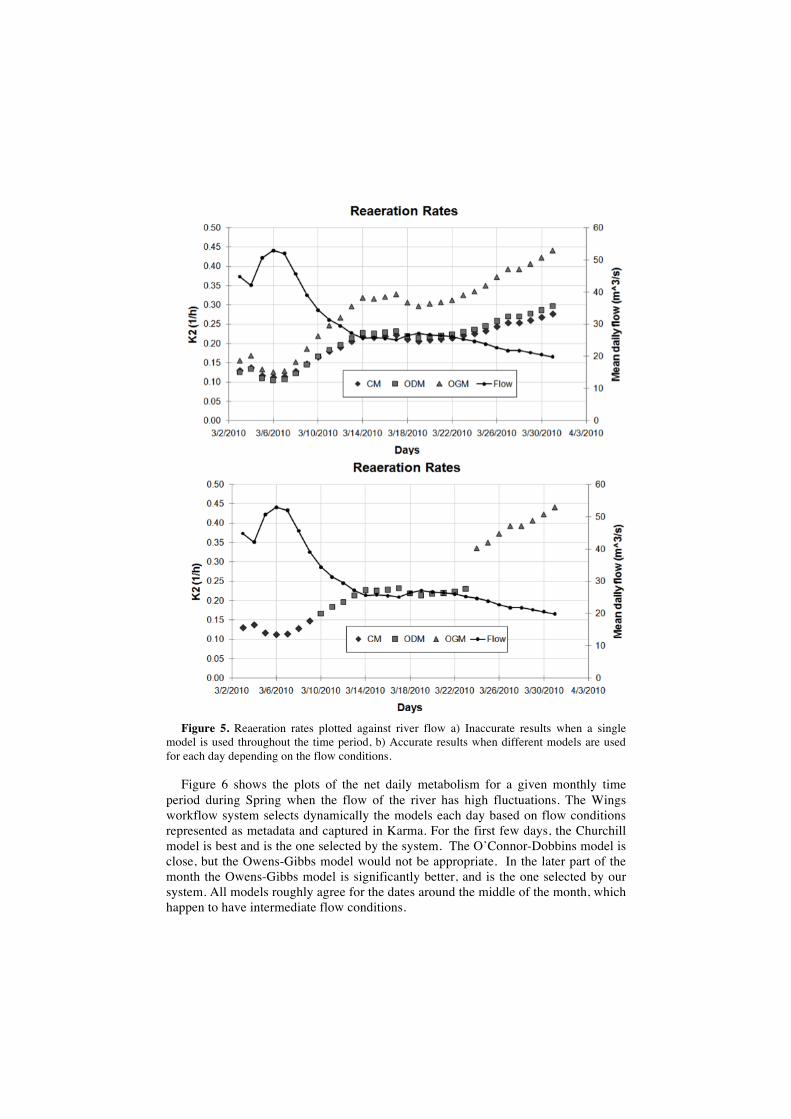
Figure 5. Reaeration rates plotted against river flow a) Inaccurate results when a single
model is used throughout the time period, b) Accurate results when different models are used for each day depending on the flow conditions.
Figure 6 shows the plots of the net daily metabolism for a given monthly time
period during Spring when the flow of the river has high fluctuations. The Wings workflow system selects dynamically the models each day based on flow conditions represented as metadata and captured in Karma. For the first few days, the Churchill model is best and is the one selected by the system. The O’Connor-Dobbins model is close, but the Owens-Gibbs model would not be appropriate. In the later part of the month the Owens-Gibbs model is significantly better, and is the one selected by our system. All models roughly agree for the dates around the middle of the month, which happen to have intermediate flow conditions.
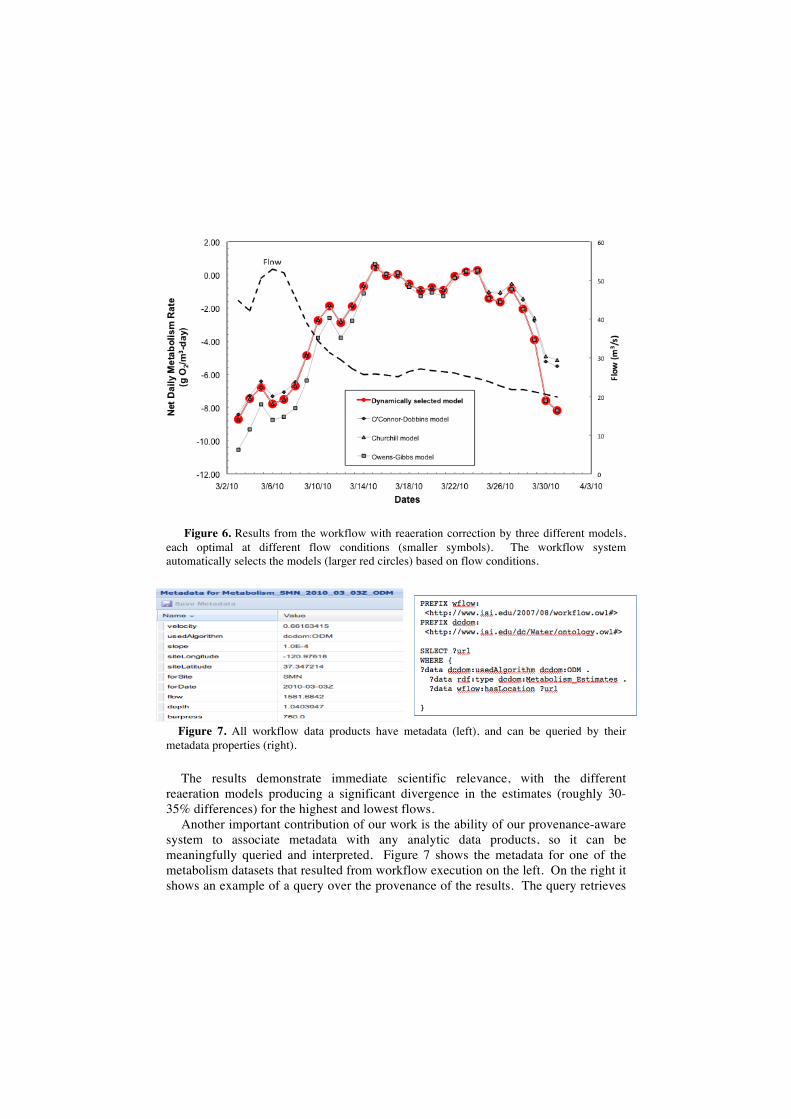
Figure 6. Results from the workflow with reaeration correction by three different models, each optimal at different flow conditions (smaller symbols). The workflow system automatically selects the models (larger red circles) based on flow conditions.
Figure 7. All workflow data products have metadata (left), and can be queried by their metadata properties (right).
The results demonstrate immediate scientific relevance, with the different
reaeration models producing a significant divergence in the estimates (roughly 30-35% differences) for the highest and lowest flows.
Another important contribution of our work is the ability of our provenance-aware system to associate metadata with any analytic data products, so it can be meaningfully queried and interpreted. Figure 7 shows the metadata for one of the metabolism datasets that resulted from workflow execution on the left. On the right it shows an example of a query over the provenance of the results. The query retrieves
all data products that were obtained with workflows that used the ODM model as a component and were metabolism data.
7 Related Work
Although there are many tools for scientific data preparation and integration, Karma provides a unique approach that learns from user-provided examples. Many scientists still use spreadsheets for these tasks, and Karma retains that paradigm and adds to it novel capabilities for capturing metadata. There has been recent related work on integrating large data sets using a spreadsheet paradigm in a project called Google Fusion Tables [Gonzalez et al. 2010; Gonzalez et al. 2010]. In this effort they developed an online service that allows users to integrate large datasets, annotate and collaborate on the data, and visualize the integrated results. The focus of the work is primarily on the scalability and visualization of the integrated data instead of on the problems of extracting, modeling, cleaning, and integrating the data. The ideas in Google Fusion Tables are relevant to Karma and would apply directly to deal with the problems of scaling up to large datasets and visualizing the integrated results. In contrast, Karma is able to generate valuable metadata for daily datasets that it exports together with the integrated data. This is a novel capability in a spreadsheet paradigm for data manipulation.
Scientific workflow systems generate provenance of new data products (see [Taylor et al 2007] for an overview), many using the community-developed Open Provenance Model (http://www.openprovenance.org). However, other systems focus on provenance concerning execution details, such as the specific invocations of the components and the execution times and other details. Wings is the only workflow system that uses semantic constraints and rules to generate metadata, as well as to represent abstract steps as classes of components.
8 Conclusions
We have presented two integrated complementary systems that create, propagate, and use metadata in different stages of scientific data analysis processes. They are provenance-aware systems that capture metadata about: 1) the origins of raw data, 2) the types and relationships across datasets, 3) the statistical properties of datasets, and 4) the processes applied during data analysis. Our approach makes the management of metadata more efficient for scientists, and at the same time the metadata captured reduces the amount of manual work by using the metadata to dynamically select models, set up their parameters, and generate provenance metadata. These capabilities are crucial in environmental sciences, where sensor networks report daily on datasets that cannot be analyzed manually in a timely manner. We used our approach in an application for water metabolism analysis, showing significant improvements in accuracy as the system dynamically analyzes daily water quality data.
We are currently setting up the system to produce water metabolism results in a timely manner as data comes in daily from sensors in the observation site. We are also using the system to analyze data for the last five years, in order to produce more accurate historical models of the metabolism in the observation site.
In future work, we want to use metadata to control the sensor collection and transmittal system. By making the sensor system provenance aware and integrating it with the data preparation and processing systems that we already have, we can have a feedback loop to guide the sensors to produce the data that is most useful for scientists.
References Bott, T. L. “Primary productivity and community respiration, in Methods in Stream Ecology,”
2nd ed., F.R. Hauer and G.A. Lamberti (Eds), pp. 663-690, Academic Press (2007) Churchill, M.A., Elmore, H.L., and Buckingham, R.A., “The prediction of stream reaeration
rates.” Am. Soc. Civil Engineers Journ., 88, no.SA-4, 1-46 (1962) Deelman, E.; G. Singh, M. Su, J. Blythe, Y. Gil, C. Kesselman, J. Kim, G. Mehta, K. Vahi, G.
B. Berriman, J. Good, A. Laity, J. C. Jacob, D. S. Katz. “Pegasus: A Framework for Mapping Complex Scientific Workflows onto Distributed Systems”. Scientific Programming, Vol. 13, No. 3 (2005)
Dozier, J. and W.B. Gail. “The emerging science of environmental applications.” In The Fourth Paradigm: Data-Intensive Scientific Discovery, T. Hey, S. Tansley and K. Toll (Eds.), Microsoft Research (2009)
Gil, Y.; Ratnakar, V.; and Fritz, C. “Assisting Scientists with Complex Data Analysis Tasks through Semantic Workflows.” In Proceedings of the AAAI Fall Symposium on Proactive Assistant Agents, Arlington, VA (2010)
Gil, Y.; Gonzalez-Calero, P. A.; Kim, J.; Moody, J.; and Ratnakar, V. “A Semantic Framework for Automatic Generation of Computational Workflows Using Distributed Data and Component Catalogs.” To appear in the Journal of Experimental and Theoretical Artificial Intelligence (2011)
Gonzalez, H., Halevy, A. Y., Jensen, C. S., Langen, A., Madhavan, J., Shapley, R., and Shen, W. “Google fusion tables: data management, integration and collaboration in the cloud.” In Proceedings of the First Symposium on Cloud Computing, Industrial Track. 175–180 (2010)
Gonzalez, H., Halevy, A. Y., Jensen, C. S., Langen, A., Madhavan, J., Shapley, R., Shen, W., and Goldberg-Kidon, J. “Google fusion tables: web-centered data management and collaboration.” In Proceedings of SIGMOD, Industrial Track. 1061–1066 (2010)
O'Connor, D.J. and Dobbins, W.E., “Mechanisms of reaeration in natural streams.” Am. Soc. Civil Engineers Trans., 123, 641-684 (1958)
Oinn, T.; M. Greenwood, M. Addis, N. Alpdemir, J. Ferris, K. Glover, C. Goble, A. Goderis, D. Hull, D. Marvin, P. Li, P. Lord, M. Pocock, M. Senger, R. Stevens, A. Wipat, and C. Wroe, “Taverna: lessons in creating a workflow environment for the life sciences,” Concurrency and Computation: Practice and Experience, Vol. 18, No. 10, (2006)
Owens, M., Edwards, R.W., and Gibbs, J.W., “Some reaeration studies in streams.” Int. Jour. Air and Water Pollution, 8, 469-486 (1964)
Reich, M.; T. Liefeld, J. Gould, J. Lerner, P. Tamayo, and J. P. Mesirov (2006) “GenePattern 2.0”. Nature Genetics 38 no. 5, pp500-501 doi:10.1038/ng0506-500 (2006)
Taylor, I.; Deelman, E., Gannon, D., Shields, M., (Eds). “Workflows for e-Science”, Springer (2007)
Tuchinda, R.; Knoblock, C. A.; and Szekely, P., “Building Mashups by Demonstration,” To appear in ACM Transactions on the Web (TWEB) (2011)