Embed Size (px)
Citation preview

Mind the gap:The distributional effects of South Africa’s national lockdown on gender wage inequality
By Robert Hill and Tim Köhler
DPRU Working Paper 202101January 2021


Mind the gap:
The distributional effects of South Africa’s
national lockdown on gender wage inequality
DEVELOPMENT POLICY RESEARCH UNIT
ROBERT HILL [email protected]
TIM KÖHLER [email protected]
Working Paper 202101
ISBN 978-1-920633-82-0
January 2021
© DPRU, University of Cape Town 2021
This work is licensed under the Creative Commons Attribution-Non-Commercial-Share Alike 2.5 South Africa License. To view a copy of this licence, visit http://creativecommons.org/licenses/by-nc-sa/2.5/za or send a letter to Creative Commons, 171 Second Street, Suite 300, San Francisco, California 94105, USA.
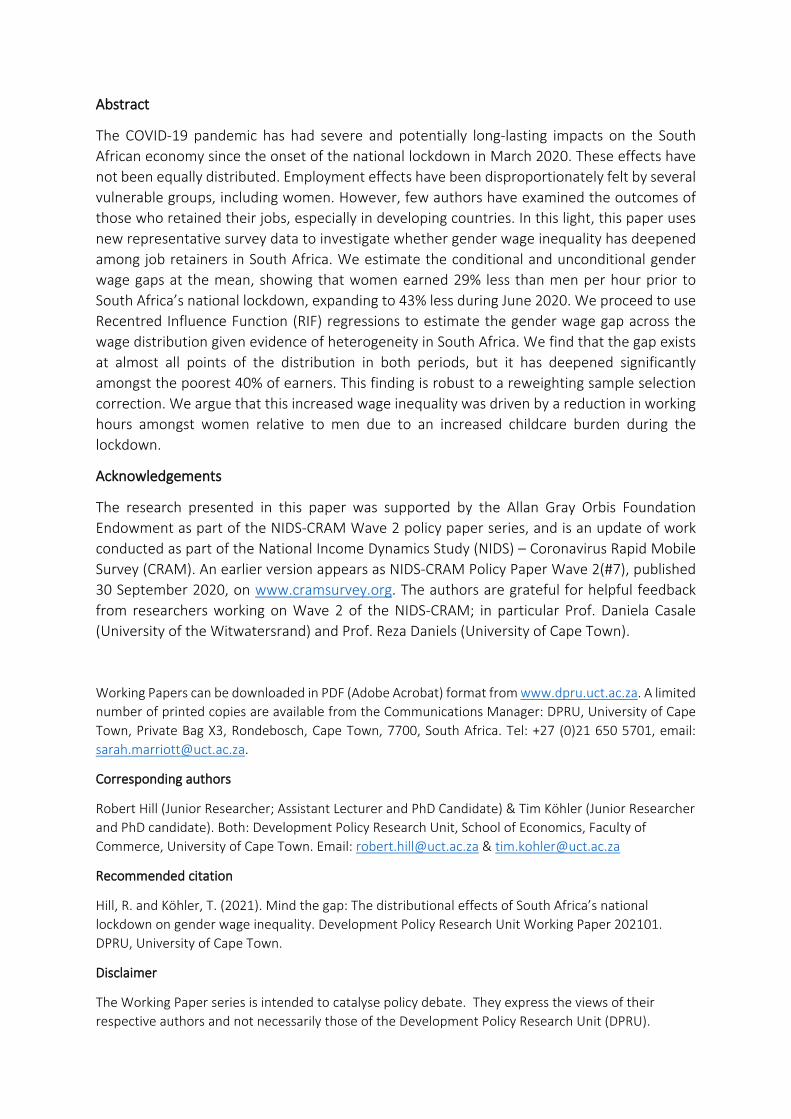
Abstract
The COVID-19 pandemic has had severe and potentially long-lasting impacts on the South African economy since the onset of the national lockdown in March 2020. These effects have not been equally distributed. Employment effects have been disproportionately felt by several vulnerable groups, including women. However, few authors have examined the outcomes of those who retained their jobs, especially in developing countries. In this light, this paper uses new representative survey data to investigate whether gender wage inequality has deepened among job retainers in South Africa. We estimate the conditional and unconditional gender wage gaps at the mean, showing that women earned 29% less than men per hour prior to South Africa’s national lockdown, expanding to 43% less during June 2020. We proceed to use Recentred Influence Function (RIF) regressions to estimate the gender wage gap across the wage distribution given evidence of heterogeneity in South Africa. We find that the gap exists at almost all points of the distribution in both periods, but it has deepened significantly amongst the poorest 40% of earners. This finding is robust to a reweighting sample selection correction. We argue that this increased wage inequality was driven by a reduction in working hours amongst women relative to men due to an increased childcare burden during the lockdown.
Acknowledgements
The research presented in this paper was supported by the Allan Gray Orbis Foundation Endowment as part of the NIDS-CRAM Wave 2 policy paper series, and is an update of work conducted as part of the National Income Dynamics Study (NIDS) – Coronavirus Rapid Mobile Survey (CRAM). An earlier version appears as NIDS-CRAM Policy Paper Wave 2(#7), published 30 September 2020, on www.cramsurvey.org. The authors are grateful for helpful feedback from researchers working on Wave 2 of the NIDS-CRAM; in particular Prof. Daniela Casale (University of the Witwatersrand) and Prof. Reza Daniels (University of Cape Town).
Working Papers can be downloaded in PDF (Adobe Acrobat) format from www.dpru.uct.ac.za. A limited number of printed copies are available from the Communications Manager: DPRU, University of Cape Town, Private Bag X3, Rondebosch, Cape Town, 7700, South Africa. Tel: +27 (0)21 650 5701, email: [email protected].
Corresponding authors
Robert Hill (Junior Researcher; Assistant Lecturer and PhD Candidate) & Tim Köhler (Junior Researcher and PhD candidate). Both: Development Policy Research Unit, School of Economics, Faculty of Commerce, University of Cape Town. Email: [email protected] & [email protected]
Recommended citation
Hill, R. and Köhler, T. (2021). Mind the gap: The distributional effects of South Africa’s national lockdown on gender wage inequality. Development Policy Research Unit Working Paper 202101. DPRU, University of Cape Town.
Disclaimer
The Working Paper series is intended to catalyse policy debate. They express the views of their respective authors and not necessarily those of the Development Policy Research Unit (DPRU).

i
Contents 1. Introduction ........................................................................................................................... 2
2. Literature review .................................................................................................................... 3
2.1 The gender wage gap: local and global evidence 3
2.2 Gender wage inequality and COVID-19 5
3. Data ........................................................................................................................................ 7
3.1 The National Income Dynamics Study: Coronavirus Rapid Mobile Survey 7
3.2 Earnings in the NIDS-CRAM data: Adjusting for outliers and selection into bracket response 8
4. Method .................................................................................................................................. 8
5. Descriptive statistics ............................................................................................................ 11
6. Model results ....................................................................................................................... 16
7. Conclusion ............................................................................................................................ 22
References ................................................................................................................................... 23
Technical appendix ...................................................................................................................... 26
Representativity in the NIDS-CRAM 26
Adjusting the NIDS-CRAM earnings data for outliers and selection into bracket responses 27

DPRU WP 202101
2
1. Introduction Wage inequality and discrimination on the basis of gender have been the subject of many empirical studies over the past few decades. Inequality in South Africa is already high, and progressive policies have been implemented by the state to address this. However, the onset of the coronavirus (COVID-19) pandemic and the subsequent national lockdown at the start of 2020 has had potentially devastating effects on inequality. In this paper, focus falls on the gendered impacts of the COVID-19 lockdown. Gender is an important factor in determining the economic impact of the pandemic. International literature suggests that, unlike previous recessions where men have borne the brunt of the economic downturn, this ‘pandemic recession’ is likely to disproportionately and persistently impact women (Alon et al., 2020). This is already clearly the case in South Africa, where initial research has shown that of the estimated three million fewer employed people in April relative to February 2020 as a result of the pandemic, two in every three were women (Casale and Posel, 2020; Ranchhod and Daniels, 2020). However, although research has been conducted on the employment effects of the COVID-19 pandemic in South Africa, less research has been conducted on whether there have been inequality-deepening effects for those individuals who have managed to remain employed during the national lockdown. This paper aims to investigate the impact that the lockdown has had on gender wage inequality in South Africa for those individuals who have remained in employment during the period. Given international evidence that women have been found to take on greater shares of responsibility in the home relative to men during this period of working from home (Alon et al., 2020; Collins et al., 2020), it is our hypothesis that, even amongst those women who have remained employed, they are likely to have been more adversely affected by the onset of the COVID-19 pandemic relative to their male counterparts. We make use of a comparable econometric specification using the first two waves of the National Income Dynamics Study: Coronavirus Rapid Mobile Survey (NIDS-CRAM) data, conducted from May to June and July to August 2020 respectively, to estimate the evolution of the unconditional and conditional gender wage gaps in South Africa. We use these data as two independent cross-sections that are broadly representative of the adult population and, in doing so, we are able to construct estimates of the gender wage gap for a pre-lockdown period and compare them to estimates from during the lockdown to determine whether there have been any inequality-deepening impacts of the lockdown on inter-gender wages. We begin by considering the conditional and unconditional gender wage gap at the mean of the earnings distribution. We show that the unconditional gender wage gap was large and evident both before and during lockdown, while our point estimates suggest the average gap widened during the period regardless of whether monthly or hourly wages are used, although these differences are not statistically significant. After accounting for several confounding factors through Mincerian-style regressions, we show that the gender wage gap was 46% - 73% higher in June 2020 relative to February on average. Although this change in point estimates is compelling, these differences are again statistically insignificant. To obtain a more nuanced understanding of the impact of the pandemic on gender wage inequality, we utilise Recentred Influence Functions (RIFs) in order to estimate the conditional gender wage gap at various points along the wage distribution in February and June 2020. Our estimates indicate that the conditional gender wage gap is indeed heterogeneous across the

Mind the Gap: The Distributional Effects of South Africa's National Lockdown on Gender Wage Inequality
3
wage distribution, and in particular, we find evidence of a widening monthly gender wage gap amongst the poorest 40% of earners. Using a reweighting technique to account for sample selection bias in the June 2020 sample, we find that the results are robust to sample selection corrections. This is indicative of a trajectory of deepening gender inequality amongst an already vulnerable group of individuals. Coupled with the fact that there is no indication of any deepening hourly wage gap, we argue that the driving force behind monthly wage inequality may be an adjustment to working hours that has disproportionately affected women. Potential reasons for this change are that women may be employed in jobs less amenable to remote working practices, or that they have disproportionately taken up the burden of childcare relative to men during the lockdown period. Either of these explanations would be consistent with findings from the international literature on the impact of the pandemic of female eco- nomic outcomes (Alon et al., 2020; Collins et al., 2020). Indeed, we show descriptively that the reduction in working hours during the lockdown due to childcare affected significantly more women than men. The remainder of the paper is structured as follows: Section 2 provides an overview of research conducted on the gender wage gap, both in general and during the COVID- 19 pandemic. Section 3 details the data used for this study as well as the creation of new weights used to correct for selection into wage bracket responses in the data. Section 4 briefly outlines our adopted methodology and discusses the DiNardo, Fortin and Lemieux (DFL) reweighting procedure undertaken to correct for sample selection. Section 5 presents several descriptive statistics, while Section 6 presents the results of the econometric models. Finally, Section 7 provides several concluding remarks.
2. Literature review 2.1 The gender wage gap: local and global evidence Gender wage inequality has been the focus of a large body of literature, both within South Africa and abroad. This research has been mostly unanimous in concluding that the gender wage gap, although narrowing, is still a persistent feature of the global labour market. According to Weichselbaumer and Winter-Ebmer (2005), early estimates of the gender wage gap in the international labour market began at approximately 65% in the 1960s and narrowed to approximately 30% by the late 1990s. Furthermore, in South Africa specifically, gender inequality and – in particular, the gender wage gap – has continued to narrow in the post-apartheid period (Mosomi, 2019; Posel and Casale, 2019). Mosomi (2019) estimated the South African gender wage gap at the mean of the wage distribution to have narrowed from approximately 40% in 1993 to approximately 16% in 2014. The gender wage gap at the median of the distribution has also decreased, but not to the same extent. In 1993, the gender wage gap at the median of the distribution was approximately 35%, while in 2015, it had decreased to approximately 23% (Mosomi, 2018). These estimates, using survey data, are slightly lower than those which use ad- ministrative data, where the gender wage gap is estimated to be approximately 35% in the South African formal sector. Estimates of the South African median gender wage gap are relatively comparable with international estimates for the same time period. In 2009, full-time female workers in the US earned approximately 80 cents per dollar earned by male workers, indicating a gender wage gap of approximately 20% (Hegewisch et al., 2010; Blau and Kahn, 2017). The German gender wage gap is at a comparable level, having been estimated to

DPRU WP 202101
4
be approximately 20% (Antonczyk et al., 2010). However, estimates of the gender wage gap at the mean or median of the distribution, while informative, can obscure important variation in wage inequality across the wage distribution. For example, Bhorat and Goga (2013) find that the gender wage gap is most pronounced (approximately 63%) at the 10th percentile of the distribution, but decreases to only approximately 7.2% by the 90th percentile. Although the reported size of the gender wage gap at different points along the South African wage distribution differs, the over-riding conclusion of heterogeneity in wage inequality across the wage distribution has been consistent. Ntuli (2007) shows that the gender wage gap has not consistently narrowed across the distribution. Rather, the narrowing of the mean gender wage gap was driven by decreasing inequality at the top and bottom of the distribution. Findings by Mosomi (2018) clearly support this narrative, showing stagnating inequality at the middle of the distribution with decreasing inequality at the top and bottom. This narrowing of the gender wage gap at the bottom of the distribution is likely driven by a combination of increased human capital characteristics and upward pressure on wages as a result of minimum wage legislation, particularly in the female-dominated domestic workers sector (Mosomi, 2018, 2019). This heterogeneity of the gender wage gap across the wage distribution is not only a South African phenomenon, however. In the United States, Blau and Kahn (2017) find that the gender wage gap declined substantially more slowly at the top of the distribution than at the middle or bottom. As a result, the United States has experienced a widening of the gender wage gap at the top of the wage distribution. The German labour market has shown similar trends, with evidence of a shrinking gender wage gap only present at the bottom of the wage distribution, while wage inequality at the top has increased over time (Antonczyk et al., 2010). Given that evidence presented in the literature provides a strong argument for het- erogenous wage inequality across the wage distribution, we opt for a distributional analysis in this paper. By analysing the gender wage gap across the entire distribution of wages, rather than simply at the mean, we will be able to better understand the interaction between wages and employment dynamics that have occurred in the South African economy as a result of the national lockdown. This will provide a more nuanced platform from which to engage in policy discussions, as impacts on individuals at either end of the distribution will be hidden by simply estimating an average effect. Studies on the gender wage gap, both locally and internationally, have provided a number of socio-economic characteristics that impact wage inequality. For example, the race of a worker has been found to be highly significant in correctly estimating the gender wage gap. Hinks (2002) found that the gender wage gap at the mean of the distribution is found to be highest amongst White individuals at approximately 40%, whilst amongst Coloured individuals, the gap is only estimated to be approximately 5%. Similarly, the age of workers is found to be a significant driver of the gender wage gap. Wage inequality between men and women is substantially lower for younger cohorts (Mosomi, 2019). The gender wage gap increases steadily over the course of an individual’s lifetime; however, this is potentially explained by labour market interruptions as a result of childbirth for women (Budlender, 2019), or that women are more likely to be employed in occupations that provide limited room for real wage growth (Mosomi, 2019).
Mind the Gap: The Distributional Effects of South Africa's National Lockdown on Gender Wage Inequality
5
Education is a further factor that acts to narrow the gender wage gap, especially given the complementarities that arise between education and skills-biased technical change. Specifically, Mwabu and Schultz (2000) argue that the returns to higher education in particular are higher for women. In recent years, women have realised greater increases in human capital than men, and there has been a pattern of skills-biased technical change underway in the South African economy (Mosomi, 2019). Combined, these factors are thought to explain why education has played a large role in the narrowing of the South African gender wage gap (Mosomi, 2019). Skills-biased technical change has not only narrowed the gender wage gap in South Africa, but all around the world. The mechanisation of occupations that have a focus on manual or routine tasks has primarily occurred in male-dominated occupations, thus placing downward pressure of male wages and narrowing the gender wage gap in the United States (Yamaguchi, 2018). Evidence from Germany supports these findings, showing that the returns to labour market skills have risen over time (Antonczyk et al., 2010). Coupled with the fact that labour market skills that receive lowest returns are predominantly held my men, this could partially explain the narrowing of the gender wage gap in parts of the developed world (Yamaguchi, 2018). Occupational segregation is a persistent cause of gender wage inequality, with female- dominated occupations generally presenting a higher gender wage gap than male-dominated occupations (Hegewisch et al., 2010; Hinks, 2002). In fact, according to a predictive model proposed by Hegewisch et al. 2010, a high-skilled occupation in the United States that is 100% female would pay approximately 46% less than one that is 100% male.1 A similar finding is true for female-dominated industries when compared to male-dominated industries. There is a general decrease in the gender wage gap as the proportion of male employment in the industry increases (Landman and O’Clery, 2020; Hegewisch et al., 2010). This finding holds in the South African context, and it is hypothesised that the reason for this has to do with compliance with the Employment Equity Act (No. 55 of 1998). In particular, because of legislation that forces South African firms to representatively hire female employees, it is necessary to entice female workers to enter and remain in male-dominated industries. The easiest way to accomplish this is through higher wages. Through this mechanism, the gender wage gap in male-dominated industries is forced downwards and wage inequality decreases Landman and O’Clery (2020). 2.2 Gender wage inequality and COVID-19 Evidence from the local and global literature has shown that the gender wage gap can be influenced by a number of socio-economic characteristics and trends. The COVID- 19 pandemic has had a large impact on both the local and global economy, and studies have shown the disproportionate impact it has had on women in South Africa (Casale and Posel, 2020). As a result, it is likely that gender-based wage inequality will also be affected. Given that at the time of writing, much of the world is still struggling with the COVID-19 pandemic, this area of research is rather sparsely populated, particularly for the developing world. The COVID-19 pandemic has produced an economic crisis quite different to any other in recent history, and as such, the effects of the pandemic on economic outcomes is not clear-cut. For example, Alon et al. (2020) report that the Global Financial Crisis of 2007/2008 disproportionately impacted male labour market outcomes, while the COVID- 19 pandemic has quite clearly had a more severe impact on female labour market out- comes. One channel through which this
1 The predicted wages for men and women in these hypothetical occupations are $1555 and $840, respectively.
DPRU WP 202101
6
disproportionate effect on women has been felt is working hours. In the United States, women with young children have reduced their working hours between four and five times more than fathers, leading to the gender gap in working hours growing by between 20 and 50% (Collins et al., 2020). The effects of these reductions in working hours may feed through to future labour market inequality as employers may choose to reward longer working hours with higher pay and, as a result, increase male wages disproportionately over female wages once again (Collins et al., 2020; Alon et al., 2020). It is possible that inequality in labour market outcomes has been exacerbated by an inability to work effectively from home. In the United States, it was found that only 28% of men and 22% of women were employed in so-called tele-commutable occupations and able to work from home Alon et al. (2020). This discrepancy in working conditions may lead to disproportionate job or pay losses for women, as they cannot meet the same obligations as before the pandemic. A similar result in the United Kingdom showed that women made up a greater share of employment amongst those sectors that needed to shut down during COVID-19 lockdown, thus disproportionately impacting women’s ability to work, and ultimately, their wages during the pandemic (Blundell et al., 2020). In the South African context, it is clear that women are still feeling the brunt of the COVID-19 lockdown. South Africa’s national lockdown was implemented from the end of March 2020. Of the estimated three million less people employed in April relative to February 2020, women accounted for approximately two in every three less people employed (Casale and Posel, 2020). Using pre-crisis data, only 13.8% of workers have been estimated to be able to work from home (Kerr and Thornton, 2020). Considering these individuals are concentrated at the top end of the wage distribution, it is likely that wage inequality in South Africa is likely to increase as a result of the lockdown. Furthermore, with South Africa’s lockdown-related workplace restrictions considered amongst the most stringent in the world (Gustafsson, 2020), impacts on wage inequality are likely to be more severe in South Africa than other comparable countries. Indeed, preliminary evidence from recent work using the NIDS-CRAM data in South Africa has shown that 80% of women and 65% of men indicated that they had spent more than 4 extra hours per day on childcare as a result of the national lockdown (Casale and Posel, 2020). Furthermore, as the lockdown progressed, the unconditional childcare gap between men and women increased from approximately 2.9 hours per day in April to approximately 3.3 hours per day in June (Casale and Posel, 2020). It is clear then that there has been a deepening of the childcare gap between men and women in South Africa, which could disproportionately impact on women’s ability to work. These disproportionate changes in women’s childcare burden relative to men’s could lead to further inequalities persisting – in particular, the gender wage gap. If women’s time has been disproportionately taken up by childcare responsibilities, then they will have to disproportionately decrease the number of hours they work in response, which may lead to a deepening of the gender wage gap in South Africa, in accordance with the hypotheses put forward by Alon et al. (2020) and Collins et al. (2020). In this paper, we aim to estimate the impact of the national lockdown on gender wage inequality in South Africa by estimating the unconditional and conditional gender wage gap across the wage distribution. In particular, we focus on whether the increased childcare burden faced by women (as reported by Casale and Posel (2020)) has had any impact on gender wage inequality. The

Mind the Gap: The Distributional Effects of South Africa's National Lockdown on Gender Wage Inequality
7
following section of the paper describes the data that is available for use, as well as some of the corrections and manipulations performed in order to ensure that our estimates of the impact are accurate.
3. Data 3.1 The National Income Dynamics Study: Coronavirus Rapid Mobile Survey This paper uses data from the first two waves of the National Income Dynamics Study: Coronavirus Rapid Mobile Survey (NIDS-CRAM), conducted from 7 May to 27 June and 13 July to 13 August 2020, respectively. The NIDS-CRAM is a representative, panel, individual-level and individual-based survey of approximately 7 000 South African adults, which will be repeated over several months as South Africa’s national lockdown progresses. Conducted as a collaborative research project by several South African universities, the aim of the survey is to provide frequent, representative data on key socioeconomic out- comes in South Africa during the COVID-19 pandemic and national lockdown. The survey forms part of a broader study, which this paper forms part of, which aims to inform policymaking using rapid, reliable research in the context of the COVID-19 pandemic. The survey instrument includes a wide array of questions on income and employment, house- hold welfare, and COVID-19-related knowledge and behaviour. The NIDS-CRAM sample frame consists of individuals resident in South Africa aged 18 years or older at the time of fieldwork in April 2020 who were surveyed in Wave 5 of the National Income Dynamics Study (NIDS) conducted in 2017. The NIDS is a nationally representative, panel, face-to-face, individual-level, household-based survey conducted ap- proximately every two years from 2008 to 2017. The NIDS-CRAM sample is a sub-sample of the NIDS Wave 5 sample and was drawn using a stratified sampling design. For more information on the NIDS-CRAM sampling design, the interested reader is referred to (Ingle et al., 2020). More details pertaining to the representativity of the NIDS-CRAM are available in the Appendix. The NIDS-CRAM Wave 1 and 2 data includes information on individuals’ earnings in February (pre-lockdown), April (one month into lockdown) and June 2020 (three months into lockdown). To estimate the gender wage gap during the national lockdown, we choose to use the June 2020 earnings data in the NIDS-CRAM Wave 2 data. The data allows us to control for wage variation induced by differences in marital status, main occupation, highest level of education, and number of children present in the household to name a few.2 Considering our analysis focuses on heterogeneity in wages conditional on employment, we restrict our within-wave samples to working-age adults (18-64 years) who were employed at the time of the relevant reference period of their earnings (that is, February and June 2020).3 In essence then, our analysis can be regarded as pooled cross-sectional.4
2 Due to data limitations, we are however unable to control for several unavailable variables, such as union membership 3 This lower age bound of 18 years, as opposed to the standard lower bound of the working-age population of 15 years, is used because younger individuals were not sampled in the NIDS-CRAM. 4 We considered restricting our sample to those employed in all time periods; however, doing so may result in biased estimates given that employment outcomes in one period may be endogenous to an individual’s characteristic(s) in another period. This is important considering that employment loss between February and April 2020 was more prevalent within several groups such as women and individuals at the lower end of the earnings distribution in February 2020.

DPRU WP 202101
8
3.2 Earnings in the NIDS-CRAM data: Adjusting for outliers and selection into bracket response
For earnings in both February and June 2020 in the NIDS-CRAM, individuals were asked to report an actual monetary (Rand) amount after taking deductions into account. If they were not willing, they were asked to report which bracket their income lies in. Simply ignoring bracket responses incorrectly ignores responses that may come from the top end of the income distribution. For instance, in an analysis of South African household survey data, Wittenberg (2017) shows that individuals who do so tend to have higher incomes. Thus, any analysis which does not address these concerns beforehand may produce biased estimates. We adopt several statistical techniques to address these issues and adjust raw earnings in the NIDS-CRAM data. First, outlier values are identified and coded as missing by using the “extreme studentised regression residuals” approach as advised by Wittenberg (2017).5 Second, we address selection into responding with bracket information by constructing bracket weights, calculated as the inverse of the probability of an actual monetary (Rand) response in a particular bracket in a particular wave (NIDS Wave 1 or Wave 2), multiplied by the sampling weight for each individual. We opt for the reweighting procedure rather than the use of within-bracket imputation as imputation can produce artificial spikes in the data at the imputation values, which would affect the percentiles – an important aspect of our distributional analysis here. The outcome of our reweighting process is summarised by the unweighted and weighted (with sampling and bracket weights) distribution of wages in Figure A1 in the Appendix. The observed differences between the sampling and bracket weighted distributions are attributable to the varied likelihoods of responding with an actual monetary (Rand) amount across the distribution (see Table A2). Unless indicated otherwise, all estimates for all periods are weighted using these computed bracket weights while accounting for the NIDS-CRAM complex survey design. Lastly, it is important to note that his reweighting approach does not do anything about those who refuse to answer or who otherwise have missing data - it only corrects for bracket responses. More details pertaining to these adjustments are available in the Appendix. After these adjustments, our final sample consists of 2 590 employed, working-age individuals with non-missing monthly wage data in February 2020 (78.1% of the working- age employed sample of 3 316 individuals) and 1 738 in June 2020 (78.75% of the working- age employed sample of 2 207 individuals). All earnings data were inflated to July 2020 Rands ($1 was approximately R16.50 at the time of writing). In our analysis, we focus on both real hourly and real monthly wages seeing as a considerable proportion of the NIDS-CRAM sample report zero working hours, despite being employed.
4. Method This section very briefly discusses the method used for estimating the unconditional and conditional gender wage gaps in this paper. Although there are a number of methods available, the choice of method was informed by a combination of the best practice in the available literature and practicality of implementation given the size of the sample in the first two waves
5 This adjustment resulted in just three February 2020 earnings values being coded as missing in the NIDS-CRAM Wave 1 data, and two June 2020 earnings values in the NIDS-CRAM Wave 2 data.

Mind the Gap: The Distributional Effects of South Africa's National Lockdown on Gender Wage Inequality
9
of the NIDS-CRAM. First, we estimate the unconditional and conditional gender wage gaps separately for both February and June 2020 at the mean through Mincerian-style regressions. That is, we employ Ordinary Least Squares (OLS) to regress the natural logarithm of real hourly (or monthly) wages on a vector of observable covariates, including a binary indicator for women. Specifically, we estimate the following equation:
logwi = β0 + β1femalei + β2Xi + εi (1) where logwi is the natural logarithm of real monthly or hourly wages of individual i, femalei a dummy variable equal to one if individual i is a self-reported female and zero otherwise, Xi a vector of observable covariates including age, race, marital status, highest level of education, occupation, and number of children in the household to name a few, and εi the error term. This allows us to estimate the evolution of the conditional gen- der wage gap at the mean; that is, the percentage difference between the real hourly or monthly wages of men and women on average in February and June, while accounting for variation in wages induced by variation in other characteristics. Our estimate of interest is, of course, β1: the coefficient on the binary indicator for women. After estimating the conditional gender wage gaps at the mean of the wage distributions in February and June 2020, we seek to analyse the gap across the entire distribution in both periods. The econometric method utilised in this paper for this purpose is that of Recentred Influence Function (RIF) regressions, as proposed by Firpo et al. (2009). The RIF regression method essentially allows for the marginal effect of a change in an explanatory variable on the dependent variable to be estimated at each of a number of specified quantiles of the unconditional distribution of the dependent variable (Firpo et al., 2009). In other words, the coefficients from a RIF regression at the τth quantile can be interpreted as the marginal effect of a change in xi on y at quantile τ . Estimation of a RIF regression relies heavily on the influence function, defined as IF (Y; v, FY), where Y is the dependent variable of interest; v is the distributional statistic of interest in the influence function - in this case, the quantile; and FY is the unconditional distribution of Y . To produce a recentred influence function, one simply adds the influence function to the distributional statistic of interest. In other words, given that the functional form of the quantile influence function is known, the recentred influence function for the τth quantile of the distribution, qτ , is defined as follows:
RIF (Y ; qτ , FY ) = qτ + (τ − ]_[Y ≤ qτ ])/fY (qτ ) (2) The regression estimation simply uses this newly defined RIF of Yi, estimated at quantile qτ as the dependent variable in an OLS regression. This leads to a regression model of the following form to be estimated:
RIF (Yi; qτ , FY ) = ατ + βτ femalei + γτ Xi + εi (3) In the above model, the dependent variable is the log of monthly wages6; the matrix of individual-level covariates, Xi, includes variables such as race, marital status, home language, occupation, and education level, amongst others. The coefficient βτ is the point estimate of the
6 Although the log of monthly wages is the preferred dependent variable for this research, log of hourly wages is also used due to concerns that using monthly wages will overestimate the size of the gender wage gap (Bhorat and Goga, 2013; Weichselbaumer and Winter-Ebmer, 2005).
DPRU WP 202101
10
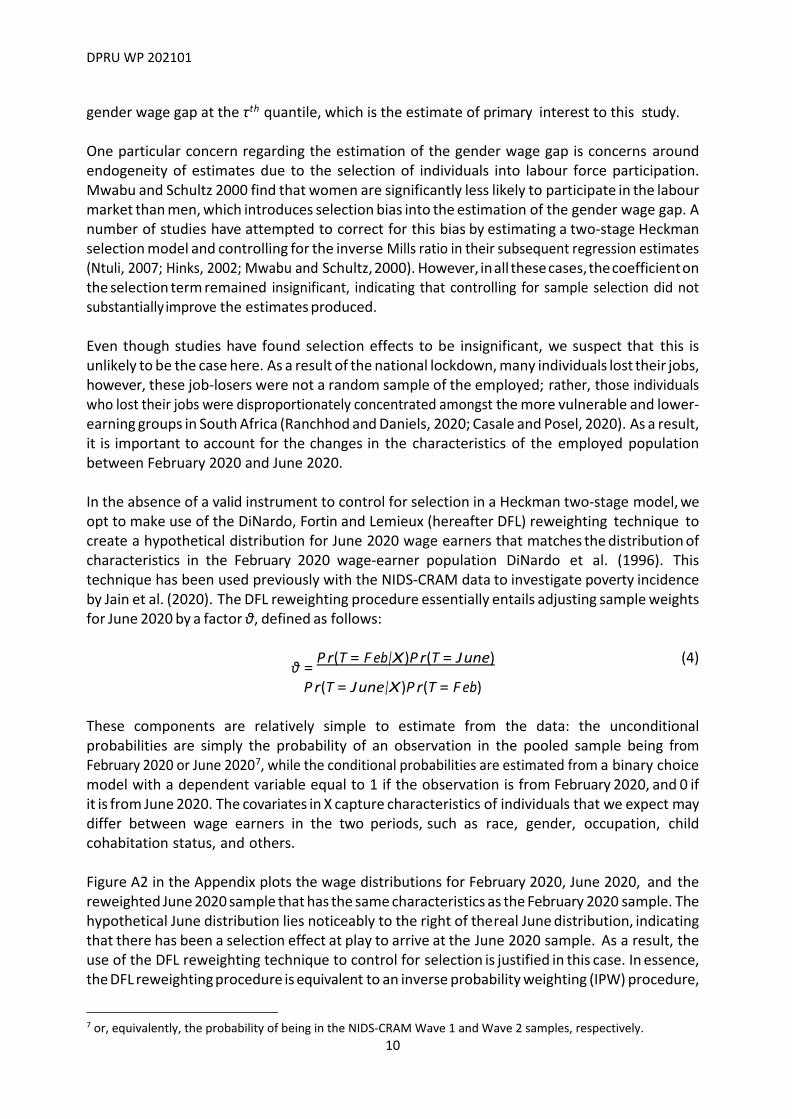
gender wage gap at the τth quantile, which is the estimate of primary interest to this study. One particular concern regarding the estimation of the gender wage gap is concerns around endogeneity of estimates due to the selection of individuals into labour force participation. Mwabu and Schultz 2000 find that women are significantly less likely to participate in the labour market than men, which introduces selection bias into the estimation of the gender wage gap. A number of studies have attempted to correct for this bias by estimating a two-stage Heckman selection model and controlling for the inverse Mills ratio in their subsequent regression estimates (Ntuli, 2007; Hinks, 2002; Mwabu and Schultz, 2000). However, in all these cases, the coefficient on the selection term remained insignificant, indicating that controlling for sample selection did not substantially improve the estimates produced. Even though studies have found selection effects to be insignificant, we suspect that this is unlikely to be the case here. As a result of the national lockdown, many individuals lost their jobs, however, these job-losers were not a random sample of the employed; rather, those individuals who lost their jobs were disproportionately concentrated amongst the more vulnerable and lower-earning groups in South Africa (Ranchhod and Daniels, 2020; Casale and Posel, 2020). As a result, it is important to account for the changes in the characteristics of the employed population between February 2020 and June 2020. In the absence of a valid instrument to control for selection in a Heckman two-stage model, we opt to make use of the DiNardo, Fortin and Lemieux (hereafter DFL) reweighting technique to create a hypothetical distribution for June 2020 wage earners that matches the distribution of characteristics in the February 2020 wage-earner population DiNardo et al. (1996). This technique has been used previously with the NIDS-CRAM data to investigate poverty incidence by Jain et al. (2020). The DFL reweighting procedure essentially entails adjusting sample weights for June 2020 by a factor θ, defined as follows:
θ = P r(T = F eb|X)P r(T = June) (4)
P r(T = June|X)P r(T = F eb) These components are relatively simple to estimate from the data: the unconditional probabilities are simply the probability of an observation in the pooled sample being from February 2020 or June 20207, while the conditional probabilities are estimated from a binary choice model with a dependent variable equal to 1 if the observation is from February 2020, and 0 if it is from June 2020. The covariates in X capture characteristics of individuals that we expect may differ between wage earners in the two periods, such as race, gender, occupation, child cohabitation status, and others. Figure A2 in the Appendix plots the wage distributions for February 2020, June 2020, and the reweighted June 2020 sample that has the same characteristics as the February 2020 sample. The hypothetical June distribution lies noticeably to the right of the real June distribution, indicating that there has been a selection effect at play to arrive at the June 2020 sample. As a result, the use of the DFL reweighting technique to control for selection is justified in this case. In essence, the DFL reweighting procedure is equivalent to an inverse probability weighting (IPW) procedure,
7 or, equivalently, the probability of being in the NIDS-CRAM Wave 1 and Wave 2 samples, respectively.

Mind the Gap: The Distributional Effects of South Africa's National Lockdown on Gender Wage Inequality
11
which is commonly used to weight regression analysis in the programme evaluation literature (Elder et al., 2015). To this end, we rerun the June 2020 regressions as specified in Equation (2), above, but using the adjusted DFL weights as regression weights. In the following section, we present a brief overview of the structure of the data through several descriptive statistics. This will provide the background for the econometric estimation of the gender wage gap undertaken in Section 6.
5. Descriptive statistics In both February and June 2020, the unconditional gender wage gap is statistically significant and evident, regardless of whether monthly or hourly real wages are used. When we consider changes in monthly wages over the period, our point estimates suggest that the unconditional gap has increased at the mean, however the difference in the magnitude of the gap is not statistically significant. On the other hand, once we account for working hours, our point estimates suggest that the unconditional gap seems to have decreased, given that the average women’s hourly wage increased at a greater rate than the average man. The increase in the latter was not statistically significant; however, that of the average women’s was. Table 1 presents the average real monthly and hourly wages for men and women in February and June 2020, as well as the mean within-gender weekly working hours. The average man’s real monthly earnings increased (R9 548 to R10 614) while that of the average woman also increased (R5 639 to R6 134). However, despite both increasing, our point estimates still suggest a widening of the unconditional gap at the mean, given that the former rate of increase (11%) exceeds the latter (9%), even if marginally. Table 1: Absolute mean real wages, weekly working hours, and daily childcare hours for men and women: February and June 2020
February 2020 June 2020
Male Female Male Female Real monthly wage
9 548.24 5 639.25 10 613.94 6 134.36 [7 761.00; 11 334.49] [4 865.02; 6 413.49] [8 625.48; 12 602.41] [5 006.80; 7 261.92]
Real hourly wage
69.18 39.58 86.26 61.43 [50.32; 88.044] [34.36; 44.80] [67.46; 105.07] [47.69; 75.17]
Weekly working hours
39.28 35.62 41.00 39.24 [37.81; 40.75] [34.26; 36.98] [38.95; 43.04] [36.8; 41.68]
Daily childcare hours*
6.16 9.95 4.15 7.99 [5.08; 7.25] [8.82; 11.07] [3.12; 5.19] [6.63; 9.36]
Source: NIDS-CRAM Waves 1 and 2. Authors' own calculations. Notes: [1] Within-wave samples restricted to employed individuals aged 18-64 years. Estimates are weighted using computed bracket weights and account for complex survey designs. [2] All wages inflated to July 2020 Rands. [3] *Daily childcare hours measured as the reported number of hours per day looking after kids. [4] Variable does not refer to February or June, but rather lockdown level 5 (April) and 3 (June and July). [5] 95% confidence intervals reported in brackets. Once we account for working hours, the wages of both men and women have also risen on

DPRU WP 202101
12
average, from R69 to R86 for men and R40 to R61 for women. It should be noted that both changes in average monthly and hourly wages are likely indicative of selection into employment: higher earners being more likely to remain employed during the lockdown period, and not individual’s actual wages increasing. Similar increases are observed for working hours. Pre-lockdown, the average man worked 3.5 more hours than the average women - a statistically significant difference, whereas mean working hours between men and women in June were not statistically different from one another. Disparities in working hours may be at least partially explained by the disproportionate childcare burden amongst women. Our estimates in Table 1 indicate that during both the relatively stringent level 5 lockdown in April and level 3 lockdown in June and July, women devoted statistically more time to childcare relative to men on average - specifically, about 62% more in the former and almost double more in the latter. We further find that, as indicated in Figure 1, that much more women (an estimated 1.65 million) than men (1.23 million) reported that childcare during lockdown in June 2020 stopped them from working the same number of hours compared to pre-lockdown levels. It is also evident that, in absolute terms, the distribution of this childcare burden is regressive, with more than twice as many women than men in the poorest 40% of earners reporting so. Figure 1: Absolute and relative prevalence of inability to work the same number of hours due to childcare during lockdown in June 2020, by sex and household income quintile
Source: NIDS-CRAM Wave 2. Authors’ own calculations. Notes: [1] Within-wave samples restricted to employed individuals aged 18-64 years. [2] Estimates are weighted using computed bracket weights. [3] Wages inflated to July 2020 Rands. To examine these wage changes in more detail, Figure 2 presents the distributions of real monthly and hourly wages for men and women in February and June 2020. The shifts in distributions are substantial for both men and women. Considering the evolution of real monthly wages, it appears that the increase in wages for men was driven by a reduction in the number of poorer earners

Mind the Gap: The Distributional Effects of South Africa's National Lockdown on Gender Wage Inequality
13
towards the bottom of the distribution and an increase in the number of richer earners from the middle towards the top. This is indicative of higher earners being more likely to remain employed during the lockdown period. For women on the other hand, the increase in wages seems to be driven also by a reduction in the number of poorer earners but also an increase in the number of earners in the middle of the distribution. Once we account for working hours, we see similar patterns for men. Male earners at the 90th percentile earned R161 per hour in February but R208 per hour in June. For women, most of the hourly wage distribution has shifted to the right, with the most notable changes at the top end. In February and June 2020 respectively, female earners at the 75th percentile earned R42 and R71, at the 90th percentile R108 and R129, and the 99th percentile R217 and R476. Again, this likely reflects a selection issue; that is, higher-earning men and women were far more likely than their lower-earning counterparts to remain employed during the national lockdown. Figure 2: Distribution of log real monthly and hourly wages by gender in February and June 2020
Source: NIDS-CRAM Waves 1 and 2. Authors’ own calculations. Notes: [1] Within-wave samples restricted to employed individuals aged 18-64 years. [2] Estimates are weighted using computed bracket weights. [3] Wages inflated to July 2020 Rands. It is worth investigating how the unconditional gap has changed within and between varied demographic groups. Table 2 presents the mean real hourly wages for men and women in February and June 2020 as well as the computed inter-group unconditional wage gaps; that is, the ratio of the average women’s real hourly wage relative to that of men’s in a given month. We investigate these gaps between several demographic groups, including self-reported racial population group, age group, highest level of education, and usual occupation to name a few. The table suggests that the overall unconditional gender wage gap seems to have narrowed between February and June 2020, although the gap is still evident and significant in both periods. This however excludes individuals whose reported weekly working hours in June 2020 were zero,

DPRU WP 202101
14
despite earning a positive wage. Overall, for every Rand earned by the average man for a given hour of work, the average women earned 57 cents in February, but 71 cents in June. This varies however once we consider variation across the wage distribution. The unconditional wage gap seems to have widened amongst the poorest 20% of earners. In June, the average women in this group earned about 83% of the average man’s wage for a given hour of work – down from approximately parity in February. Amongst the richest quintile of earners, however, the unconditional gap seems to have narrowed. Within this group, the average women earned 61 cents for every Rand earned by the average man for a given hour of work in February, up to 90 cents in June. Across the middle of the distribution, the gap is statistically unchanged. We observe significant heterogeneity in the evolution of the unconditional gender wage gap across self-reported racial population groups. Amongst Black African individuals, the gap is still substantial in both February and June however it seems to have narrowed, from 0.54 to 0.66. On the other hand, amongst Coloured individuals, in February women earned R1.24 for every Rand earned by men for a given hour of work on average. This reduced to approximately parity by June. Due to the small sample size, we prefer not to infer anything about the unconditional gender wage gap amongst Indian/Asian individuals. Lastly, the gap remains largest and unchanged amongst White individuals. In both February and June, for every Rand earned by the average White man for a given hour of work, the average women earned half. Moving onto varied age groups, our point estimates suggest that the gap has narrowed slightly but is still evident for all groups, especially one in particular: those aged between 50 and 64 years. Amongst this group, the gap narrowed from 0.35 in February to 0.60 in June: a 71% reduction. Considering varied levels of education, the gap seems to have narrowed for all groups, but remains highest amongst individuals who have a tertiary qualification. Notably, the average woman within this group earned 56 cents for every Rand earned by the average man for a given hour of work in June, up from just 45 cents in February. The evolution of the gap across individuals’ usual occupations varied considerably. For instance, Managers saw their gap reduce from 0.35 to 0.70, whereas Technicians and associate professionals saw their gap widen from 0.78 to 0.38.

Mind the Gap: The Distributional Effects of South Africa's National Lockdown on Gender Wage Inequality
15
Table 2: Mean real hourly wage across select covariates by gender: February and June 2020 February 2020 June 2020
Male Female Ratio Male Female Ratio Overall 69.18 39.58 0.57 86.26 61.43 0.71
Age group
18-34 44.28 33.02 0.75 63.02 50.58 0.80 35-49 66.95 42.68 0.64 82.98 60.08 0.72 50-64 142.50 49.27 0.35 150.87 90.78 0.60
Race
Black African 53.30 28.79 0.54 72.01 47.67 0.66 Coloured 36.35 45.01 1.24 58.99 60.79 1.03 Indian/Asian 54.37 34.18 0.63 54.32 282.90 5.21 White 195.68 98.27 0.50 199.28 99.58 0.50
Education
Up to primary 19.21 16.97 0.88 52.30 60.44 1.16 Up to secondary 29.90 20.30 0.68 59.17 45.80 0.77 Complete secondary 43.43 27.20 0.63 56.44 37.49 0.66 Tertiary 148.49 66.13 0.45 153.91 86.00 0.56
Occupation
Managers 183.88 64.05 0.35 204.94 143.12 0.70 Professionals 172.54 82.91 0.48 186.37 93.85 0.50 Technicians and assoc. professionals 91.47 71.64 0.78 74.76 28.50 0.38 Clerical support workers 30.92 37.34 1.21 55.47 107.21 1.93 Service and sales workers 38.51 19.14 0.50 36.58 29.60 0.81 Skilled agricultural, forestry and fish 20.27 12.54 0.62 20.49 21.80 1.06 Craft and related trades workers 27.50 18.95 0.69 102.98 50.09 0.49 Plant and machine operators 50.95 20.61 0.40 49.08 45.73 0.93 Elementary occupations 22.04 17.54 0.80 45.81 28.07 0.61
Real hourly wage quintile
Poorest 20% 4.73 4.86 1.03 10.82 9.01 0.83 2 13.74 14.31 1.04 20.25 20.49 1.01 3 24.17 24.44 1.01 32.70 31.94 0.98 4 47.82 47.78 1.00 65.43 69.59 1.06 Richest 20% 221.60 134.67 0.61 257.66 232.45 0.90
Source: NIDS-CRAM Waves 1 and 2. Authors’ own calculations. Notes: [1] Within-wave samples restricted to employed individuals aged 18-64 years. [2] Estimates are weighted using computed bracket weights and account for complex survey designs. [3] All wages inflated to July 2020 Rands.

DPRU WP 202101
16
6. Model results Our analysis up to this point has only included examining variation in real monthly and hourly wages between men and women across the distribution in an unconditional environment. Of course, the observed variation in inter-gender wages can be explained by factors other than gender itself. We now turn to examining changes in the gender wage gap while controlling for possible confounding variables. First, we conduct this analysis at the mean of the distribution; that is, we estimate a Mincerian-style OLS regression for February 2020 and June 2020 separately. This allows us to estimate the evolution of the conditional gender wage gap at the mean; that is, the percentage difference between the real hourly or monthly wages of men and women on average, while accounting for variation in wages induced by variation in other characteristics. Here, we specifically control for age, race, highest level of education, main occupation, type of employment contract, marital status, geographic area and province of residence, home language, the number of household members younger than 18 years, and a dummy variable indicating if a respondent lives with at least one child who is younger than seven years old. When we regress using real monthly wages, we additionally control for weekly hours worked. Our estimate of interest is the coefficient on the binary indicator for women. The succinct results of these regressions are presented in Table 3. The complete results are available in Table A4 in the appendix. Table 3: Unconditional and conditional Mincerian regression estimates of the gender wage gap: February and June 2020 Period February 2020 June 2020 February 2020 June 2020
Log real hourly wage Log real monthly wage (1) (2) (3) (4) (5) (6) (7) (8)
Female -0.298***
-0.293***
-0.336***
-0.429***
-0.371***
-0.299***
-0.593***
-0.516***
(0.091) (0.086) (0.095) (0.087) (0.088) (0.077) (0.102) (0.078)
Controls N Y N Y N Y N Y Constant 3.368*** -0.658 3.822*** 1.668*** 8.344*** 3.071*** 8.749*** 6.159***
(0.076) (0.705) (0.079) (0.617) (0.076) (0.714) (0.077) (0.591) N 2 296 963 1 168 983 2 474 966 1 577 983 R2 0.014 0.551 0.024 0.447 0.018 0.575 0.061 0.527
Source: NIDS-CRAM Waves 1 and 2. Authors’ own calculations. Notes: [1] Within-wave samples restricted to employed individuals aged 18-64 years. [2] Estimates are weighted using computed bracket weights and account for complex survey designs.[3] All monthly wages inflated to July 2020 Rands.[4] Conditional estimates obtained from regressing the natural logarithm of real hourly (monthly) wage on sex, age, age squared, race, highest level of education, main occupation, type of employment contract, marital status, geographic area and province of residence, home language, number of household members younger than 18 years, and a dummy variable for living with at least one child younger than 7 years (and weekly hours worked). Unconditional estimates obtained from regressing the natural logarithm of real hourly (monthly) wage on sex. [5] * p<0.1; ** p<0.05; *** p<0.01. Overall, our estimates suggest that even after controlling for several individual-level characteristics of men and women, both the unconditional and conditional monthly and hourly gender wage gaps were higher in June 2020 relative to February 2020 - at least on average. Without controlling for any confounders, the average women earned about 30% less wages than

Mind the Gap: The Distributional Effects of South Africa's National Lockdown on Gender Wage Inequality
17
men for a given hour of work in February 2020 and 34% less in June 2020 - indicative of an increase in the unconditional gap of about 13%. This increase is even larger after we control for the aforementioned vector of covariates: the estimated conditional gender hourly wage gap at the mean is 29% in February 2020 and 43% in June 2020. That is, women earned 29% less than men of the same observable characteristics in February and 43% less in June – indicative of an increase in the conditional gender wage gap of about 46%. When we consider monthly rather than hourly wages, the increase in both the unconditional and conditional gender wage gaps are even larger. The unconditional gap increases from 37% in February to 59% in June 2020, while the conditional gap increases from 30% to 52% (representing a nearly 73% increase). Although these estimates of the conditional gender wage gap in both February and June 2020 are statistically significantly different from zero regardless of whether hourly or monthly wages are used, the changes in the gaps over the period are not statistically significant. This may be due to our relatively small samples. Despite this, the differences in the magnitudes of our point estimates are compelling. As such, we interpret these changes as indicative of a widening gender wage gap at the mean. Next, we explore the evolution of the conditional gender wage gap across the entire earnings distribution, as opposed to just at the mean. One particular concern with the results presented in the remainder of this section is that in order for the wage regressions to be comparable between the two periods, we cannot control for industry. Research has shown strong results supporting the fact that an individual’s industry of employment can have an impact on the size of the gender wage gap (Landman and O’Clery, 2020). In particular, the gender wage gap is found to be lower in male-dominated industries, likely due to male-dominated industries needing to diversify their workforce and recruit and retain female employees (Landman and O’Clery, 2020). In order to check the extent to which industry impacts our results, we ran the June 2020 regressions including industry dummies (as this data was available in the NIDS-CRAM Wave 2 data). The resulting estimates did not differ from those presented below by much, and as a result, we are confident that the results below do not suffer greatly from having industry left out of the model specification. Figure 3 plots the conditional gender wage gap in monthly wages across the earnings distribution for February 2020 and June 2020, along with the relevant 90% confidence intervals for the estimates. The left-hand panel of Figure 3 shows the estimates of the gender wage gap from the actual distribution of June 2020 wages, while the right-hand panel plots the gender wage gap from the reweighted June 2020 sample to account for sample selection. For the most part, the confidence intervals for the February 2020 and June 2020 estimates (whether reweighted or not) overlap, providing little evidence of a unilateral deepening of the monthly gender wage gap. However, in both panels of Figure 3, the 90% confidence intervals8 overlap less often at the bottom of the distribution, than at the top. This indicates that there is a more severe and statistically significant deepening of the monthly gender wage gap at the bottom of the distribution than at the top. Comparing the two panels, it is also clear that the monthly gender wage gap has deepened more severely for those at the bottom of the distribution in the right-hand panel than in the left-hand panel. This indicates that by not correcting for sample selection bias in the June 2020 sample, one may underestimate the gender wage gap. This is sensible, as low-wage earners at the bottom of the distribution were more likely to lose their jobs during the lockdown (Ranchhod and Daniels, 2020), meaning that the bottom
8 Figures presenting 95% confidence intervals are presented in the Appendix.

DPRU WP 202101
18
of the uncorrected earnings distribution in June 2020 would have been made up of individuals from higher up in the wage distribution. Figure 3: Estimates of the conditional gender wage gap in real monthly wages across the wage distribution: February 2020, June 2020, and June 2020 (reweighted)
Source: NIDS-CRAM Waves 1 and 2. Authors’ own calculations. Notes: [1] Left-hand panel shows February 2020 estimated gender wage gap compared to June 2020 estimated gender wage gap. Right-hand panel shows February 2020 estimated gender wage gap compared to reweighted June 2020 gender wage gap. [2] Variables controlled for in regressions include age, age squared, race, highest level of education, main occupation, area of residence, province, home language, marital status, presence of a written contract, number of cohabiting children under age 18, and weekly hours worked. [3] Estimates are weighted using computed bracket weights, or DFL reweighted bracket weights. [4] Wages inflated to July 2020 Rands. [5] Shaded areas represent 90% Confidence Intervals. Even though there is not consistent statistical significance of a deepening monthly gender wage gap, point estimates of the February-to-June gender wage gap ratio point towards a trend of deepening wage inequality. Table 4 reports the point estimates of the gender wage gap as extracted from the RIF regressions at each quantile for February 2020, June 2020 and the reweighted June 2020 sample. Interestingly, in February 2020, there is little statistical evidence of a gender wage gap up to the 20th percentile of the wage distribution as the coefficient estimates are either insignificant or only significant at the 10% level. However, in both samples for June 2020, women clearly earn statistically significantly lower monthly wages than men at every quantile of the earnings distribution, all else constant. As a sense check, we confirm that our estimates at the median of the distribution accord with reported gender wage gap estimates from Mosomi (2018) and Bezuidenhout et al. (2019).These researchers estimate a gender wage gap of approximately 35% at this point in the distribution, and while the point estimates we present are slightly different, all 95% confidence intervals overlap with an estimated 35% gap, indicating that our estimates are more or less in line with the literature.

Mind the Gap: The Distributional Effects of South Africa's National Lockdown on Gender Wage Inequality
19
Table 4: Distribution of conditional gender wage gap estimates in real monthly wages: February 2020, June 2020, and June 2020 (reweighted)
Quantile Gender wage gap estimates Ratios
February 2020 June 2020 June 2020 February : June 2020 February : June 2020 (reweighted) (reweighted)
5 -0.116 -0.487*** -0.349*** 0.238 0.332 10 -0.483 -0.487*** -1.024*** 0.992 0.472 15 -0.154* -0.801*** -0.859*** 0.192*** 0.179*** 20 -0.142* -0.498*** -0.422*** 0.284** 0.335 25 -0.388** -0.354*** -0.393*** 1.099 0.988 30 -0.266*** -0.444*** -0.404*** 0.600 0.660 35 -0.175** -0.618*** -0.630*** 0.283*** 0.278*** 40 -0.194*** -0.508*** -0.503*** 0.382* 0.386* 45 -0.186*** -0.439*** -0.315*** 0.424 0.591 50 -0.227** -0.382*** -0.492*** 0.593 0.461 55 -0.221*** -0.686*** -0.628*** 0.322** 0.352* 60 -0.402*** -0.536*** -0.550*** 0.750 0.731 65 -0.449*** -0.535*** -0.352*** 0.840 1.278 70 -0.595*** -0.360** -0.424*** 1.655 1.405 75 -0.343*** -0.347** -0.510*** 0.986 0.672 80 -0.411*** -0.383*** -0.548*** 1.073 0.749 85 -0.382*** -0.328*** -0.516*** 1.167 0.741 90 -0.177 -0.667*** -0.849*** 0.265* 0.208* 95 -0.234* -0.410*** -0.559** 0.570 0.419
Source: NIDS-CRAM Waves 1 and 2. Authors’ own calculations. Notes: [1] Within-wave samples restricted to employed individuals aged 18-64 years. [2] Point estimates are the coefficient on the female dummy in the relevant RIF regression at a given quantile. [3] Estimates are weighted using computed bracket weights, or DFL reweighted bracket weights. [4] All monthly wages inflated to July 2020 Rands. [5] * p<0.1; ** p<0.05; *** p<0.01. [6] Variables controlled for in regressions include age, age squared, race, highest level of education, main occupation, main industry, area of residence, province, home language, marital status, presence of a written contract, and weekly hours worked. Where the evolution of the conditional gender wage gap across the distribution is concerned, the results are generally insignificant, indicating that the gap has not statistically significantly changed from February 2020 to June 2020. This being said, however, there is some statistical significance in the changes below the 40th percentile. Over this portion of the distribution, the February-to-June gender wage gap ratios show that the gender wage gap has deepened to up to five times its February 2020 level (and are often significant changes). The point estimates of the ratios above the 60th percentile are much milder, and indicate that although there may have been a deepening of the gender wage gap for these individuals, it was substantially less severe than for those at the bottom of the distribution. Although broadly insignificant, these results are still interesting: if there is truly a deepening of the gender wage gap amongst low-earners, then it means that already vulnerable workers are being subjected to further inequality and welfare losses. Conversely, those individuals at the top of the wage distribution are experiencing much less severe effects of the lockdown on wage inequality, with some individuals around the 70th percentile even seeing a narrowing of the gender wage gap. If this evidence is considered indicative of trends in wage inequality that may promulgate into
DPRU WP 202101
20
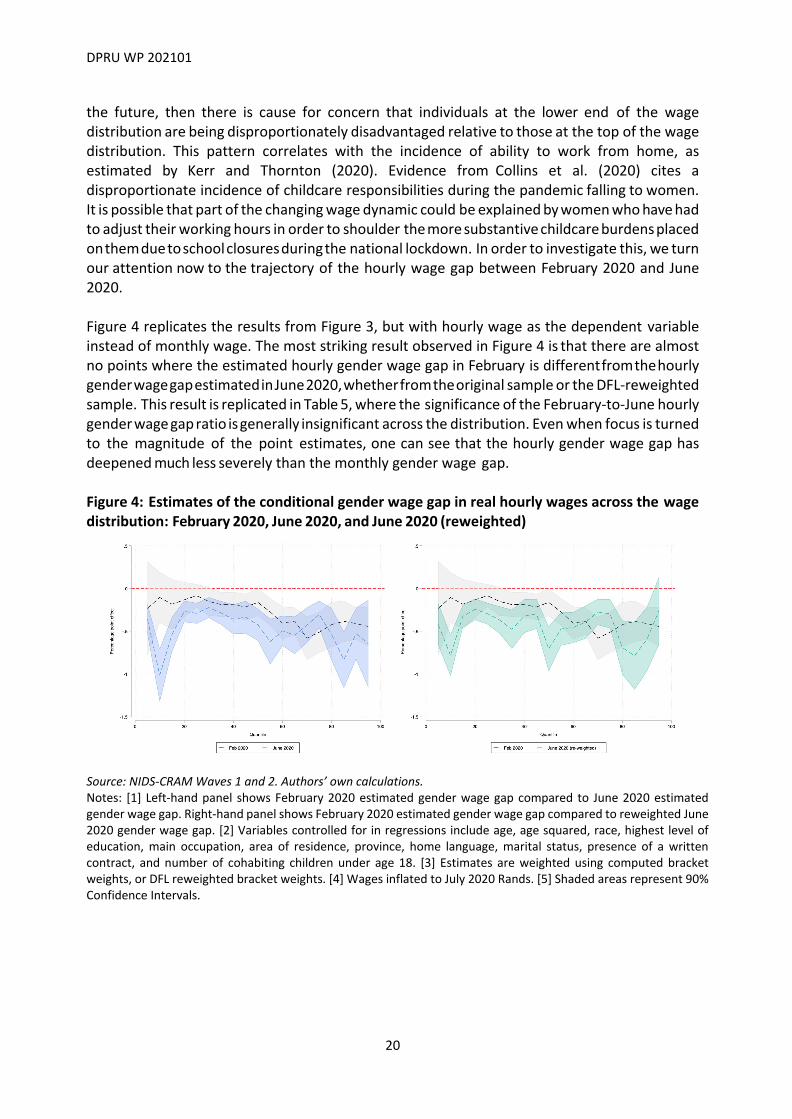
the future, then there is cause for concern that individuals at the lower end of the wage distribution are being disproportionately disadvantaged relative to those at the top of the wage distribution. This pattern correlates with the incidence of ability to work from home, as estimated by Kerr and Thornton (2020). Evidence from Collins et al. (2020) cites a disproportionate incidence of childcare responsibilities during the pandemic falling to women. It is possible that part of the changing wage dynamic could be explained by women who have had to adjust their working hours in order to shoulder the more substantive childcare burdens placed on them due to school closures during the national lockdown. In order to investigate this, we turn our attention now to the trajectory of the hourly wage gap between February 2020 and June 2020. Figure 4 replicates the results from Figure 3, but with hourly wage as the dependent variable instead of monthly wage. The most striking result observed in Figure 4 is that there are almost no points where the estimated hourly gender wage gap in February is different from the hourly gender wage gap estimated in June 2020, whether from the original sample or the DFL-reweighted sample. This result is replicated in Table 5, where the significance of the February-to-June hourly gender wage gap ratio is generally insignificant across the distribution. Even when focus is turned to the magnitude of the point estimates, one can see that the hourly gender wage gap has deepened much less severely than the monthly gender wage gap. Figure 4: Estimates of the conditional gender wage gap in real hourly wages across the wage distribution: February 2020, June 2020, and June 2020 (reweighted)
Source: NIDS-CRAM Waves 1 and 2. Authors’ own calculations. Notes: [1] Left-hand panel shows February 2020 estimated gender wage gap compared to June 2020 estimated gender wage gap. Right-hand panel shows February 2020 estimated gender wage gap compared to reweighted June 2020 gender wage gap. [2] Variables controlled for in regressions include age, age squared, race, highest level of education, main occupation, area of residence, province, home language, marital status, presence of a written contract, and number of cohabiting children under age 18. [3] Estimates are weighted using computed bracket weights, or DFL reweighted bracket weights. [4] Wages inflated to July 2020 Rands. [5] Shaded areas represent 90% Confidence Intervals.

Mind the Gap: The Distributional Effects of South Africa's National Lockdown on Gender Wage Inequality
21
Table 5: Distribution of conditional gender wage gap estimates in real hourly wages: February 2020, June 2020, and June 2020 (reweighted)
Quantile Gender wage gap estimates Ratios
February 2020 June 2020 June 2020 February : June 2020 February : June 2020 (reweighted) (reweighted)
5 -0.234 -0.357*** -0.421*** 0.657 0.556 10 -0.105 -1.015*** -0.782*** 0.104** 0.135** 15 -0.185 -0.538*** -0.326*** 0.344 0.567 20 -0.133 -0.269*** -0.244*** 0.496 0.546 25 -0.084 -0.291*** -0.295*** 0.290 0.286 30 -0.152 -0.224*** -0.368*** 0.680 0.413 35 -0.189** -0.286*** -0.478*** 0.660 0.395 40 -0.190** -0.360*** -0.324*** 0.527 0.586 45 -0.216** -0.336*** -0.297*** 0.643 0.728 50 -0.163* -0.425*** -0.707*** 0.384 0.231** 55 -0.274*** -0.622*** -0.474*** 0.440 0.578 60 -0.406*** -0.496*** -0.457*** 0.819 0.889 65 -0.382*** -0.547*** -0.394*** 0.698 0.969 70 -0.583*** -0.427*** -0.276*** 1.363 2.114 75 -0.512*** -0.305*** -0.297*** 1.677 1.721 80 -0.423*** -0.536*** -0.691*** 0.789 0.612 85 -0.385*** -0.834*** -0.787*** 0.461 0.489 90 -0.411*** -0.529*** -0.595*** 0.776 0.690 95 -0.446*** -0.647** -0.255 0.689 1.751
Source: NIDS-CRAM Waves 1 and 2. Authors’ own calculations. Notes: [1] Within-wave samples restricted to employed individuals aged 18-64 years. [2] Point estimates are the coefficient on the female dummy in the relevant RIF regression at a given quantile. [3] Estimates are weighted using computed bracket weights, or DFL reweighted bracket weights. [4] All monthly wages inflated to July 2020 Rands. [5] * p<0.1; ** p<0.05; *** p<0.01. [6] Variables controlled for in regressions include age, age squared, race, highest level of education, main occupation, main industry, area of residence, province, home language, marital status, presence of a written contract, and weekly hours worked. Taken together with the results presented in Figure 3 and Table 4, these results tell an interesting story: It seems that although there has been no significant change in the hourly wage gap between men and women between February 2020 and June 2020, there is evidence of a deepening monthly gender wage gap at the bottom of the wage distribution. This suggests that a change in hours worked may be the driving force behind the deepening gender wage gap at the monthly level. Given evidence from Collins et al. (2020), this may be as a result of an increased childcare burden that disproportionately affected women’s ability to work effectively during this period of working from home. With the majority of schools closed between March 2020 and June 2020 due to the national lock- down, parents would have had to take responsibility for childcare, and this responsibility is found to disproportionately fall on mothers, thus negatively impacting the number of hours they are able to work at their jobs. Thus, even if hourly wage inequality between men and women remained unchanged (as it has done between February 2020 and June 2020, according to our estimates), then monthly wage inequality would have increased due to adjustments in working patterns along the intensive margin. Alon et al. (2020) suggest that women may also be less likely to be employed in jobs that are easily adapted to be tele-commutable. In other words, women may not be able to work from home as easily as men. If

DPRU WP 202101
22
this is true, then women would likely decrease their hours worked, also potentially explaining the patterns in the deepening gender wage gap we see above. Overall, the model results indicate that although the statistical evidence is sparse, there is still some indication of a widening monthly gender wage gap between February 2020 and June 2020. This finding is relatively robust when reweighting to account for selection concerns. However, it is likely that even with insignificant results, the trajectories created by these point estimates are indicative of a general pattern that we should take note of. There seems to be a generally significant deepening of the conditional gender wage gap in the bottom third of the wage distribution, while the gap has not deepened as severely in the top of the distribution. Coupled with the fact that there is little evidence to support a deepening hourly gender wage gap, it is possible that the deepening monthly gender wage gap is attributable to women decreasing their hours worked more than men. According to the literature, one reason for this may be because of increased childcare responsibilities (Collins et al., 2020). We indeed observe such disproportionate effects of childcare on working hours for women relative to men, particularly towards the bottom of the wage distribution in absolute terms, as highlighted in Figure 1.
7. Conclusion Unlike previous recessions where it has been observed that men have borne the brunt of the economic downturn, the COVID-19 ‘pandemic recession’ is likely to disproportionately and persistently impact women. In the context of South Africa, initial research has shown that of the estimated three million fewer employed people in April relative to February 2020, two in every three were women. However, less is known about the implications of the pandemic on those women who managed to remain in employment during the lockdown period. In this light, we use newly-available representative survey data to analyse the evolution of gender wage inequality in South Africa prior to and during the national lockdown. We do so by constructing estimates of the unconditional and conditional gender wage gaps through Mincerian-esque regressions and Recentered Influence Functions (RIFs) for a pre-lockdown period and compare them to similar estimates from during the lockdown to determine whether there have been any inequality-deepening im- pacts of the lockdown on inter-gender wages. Additionally, we analyse variation in gender wage inequality across the entire wage distribution, given the evidence of distributional heterogeneity in the South African literature. By making use of the DiNardo, Fortin and Lemieux (DFL) reweighting technique, we can confirm that out results are robust to sample selection concerns, considering the systematic differences between job-losers and job-retainers in the February and June 2020 samples. We find that the gender wage gap was evident both before and during South Africa’s lockdown, and after accounting for several confounding factors, we estimate the average gap to have widened by 46% - 73% in June 2020 (during lockdown) relative to February (pre-lockdown). Although the conditional gender wage gap is statistically significant in each period, the changes in the gaps over the period are not statistically significant. De- spite this, the differences in the magnitudes of our point estimates are compelling and as such, we interpret these changes as indicative of a widening gender wage gap at the mean. When we further investigate this gap across the wage distribution, it is clear that the gap exists across the entire distribution but varies considerably. For most of the distribution, our

Mind the Gap: The Distributional Effects of South Africa's National Lockdown on Gender Wage Inequality
23
distributional estimates of the gap in June 2020 are statistically insignificantly different from those in February 2020. However, we observe a significant widening of the gap amongst the poorest 40% of earners, not reflected towards the top of the distribution. We estimate the monthly gender wage gap in June 2020 to be up to 5 times larger than its value in February 2020. This finding is a concern for policymakers, considering that it speaks to deepening inequality amongst an already vulnerable group. A comparison of the relevant monthly and hourly wage gap estimates is suggestive of an adjustment of working hours amongst women which outweighs that amongst men. We argue that the widening of the gap is likely attributable to the disproportionate effects of childcare on working hours during the lockdown for women relative to men, particularly amongst the poorest earners.
References Alon, T. M., Doepke, M., Olmstead-Rumsey, J., and Tertilt, M. (2020). The impact of COVID-19 on gender equality. Technical report, National Bureau of Economic Research. Antonczyk, D., Fitzenberger, B., and Sommerfeld, K. (2010). Rising wage inequality, the decline of collective bargaining, and the gender wage gap. Labour economics, 17(5):835– 847. Ardington, C. (2020). NIDS-CRAM Wave 1 Data Quality. National Income Dynamics Study Coronavirus Rapid Mobile Survey (NIDS-CRAM) Technical Document, Wave 1. Bezuidenhout, C., van Rensburg, C. J., Matthee, M., and Stolzenburg, V. (2019). Trading firms and the gender wage gap: evidence from South Africa. Agenda, 33(4):79–90. Bhorat, H. and Goga, S. (2013). The gender wage gap in post-apartheid South Africa: A re-examination. Journal of African Economies, 22(5):827–848. Blau, F. D. and Kahn, L. M. (2017). The gender wage gap: Extent, trends, and explanations. Journal of Economic Literature, 55(3):789–865. Blundell, R., Dias, M. C., Joyce, R., and Xu, X. (2020). COVID-19 and inequalities. Fiscal Studies. Budlender, D. (2019). Changes in the care burden over the transition to adulthood. SALDRU Working Paper Number 234, Version 1/ NIDS Discussion Paper 2019/1. Casale, D. and Posel, D. (2020). Gender and the early effects of the Covid-19 crisis in the paid and unpaid economies in South Africa. National Income Dynamics Study Coronavirus Rapid Mobile Survey (NIDS-CRAM) Working Paper, Wave 1(4). Collins, C., Landivar, L. C., Ruppanner, L., and Scarborough, W. J. (2020). COVID-19 and the gender gap in work hours. Gender, Work & Organization. DiNardo, J., Fortin, N. M., and Lemieux, T. (1996). Labor market institutions and the distribution of wages, 1973-1992: A semiparametric approach. Econometrica, 64:1001– 1044. Elder, T. E., Goddeeris, J. H., and Haider, S. J. (2015). Isolating the roles of individual covariates

DPRU WP 202101
24
in reweighting estimation. Journal of applied econometrics, 30(7):1169–1191. Firpo, S., Fortin, N. M., and Lemieux, T. (2009). Unconditional quantile regressions. Econometrica, 77(3):953–973. Gustafsson, M. (2020). How does South Africa’s COVID-19 response compare globally? A preliminary analysis using the new oxcgrt dataset. Stellenbosch Economic Working Papers, WP07/2020. Stellenbosch: University of Stellenbosch. Hegewisch, A., Liepmann, H., Hayes, J., and Hartmann, H. (2010). Separate and not equal? Gender segregation in the labor market and the gender wage gap. IWPR Briefing Paper, 377:1–16. Hinks, T. (2002). Gender wage differentials and discrimination in the new South Africa. Applied Economics, 34(16):2043–2052. Ingle, K., Brophy, T., and Daniels, R. (2020). National Income Dynamics Study – Coronavirus Rapid Mobile Survey (NIDS-CRAM) Panel User Manual. Wave 2 Release September 2020. Version 1. Jain, R., Budlender, J., Zizzamia, R., and Ihsaan, B. (2020). The labour market and poverty impacts of Covid-19 in South Africa. National Income Dynamics Study Coronavirus Rapid Mobile Survey (NIDS-CRAM) Working Paper, Wave 1(5). Kerr, A. and Thornton, A. (2020). Essential workers, working from home and job loss vulnerability in South Africa. A DataFirst Technical Paper 41. Cape Town: DataFirst, University of Cape Town. Landman, M. S. and O’Clery, N. (2020). The impact of the employment equity act on female inter-industry labour mobility and the gender wage gap in South Africa. World Institute for Development Economic Research (UNU-WIDER), WIDER Working Paper 2020/52. Mosomi, J. (2019). An empirical analysis of trends in female labour force participation and the gender wage gap in South Africa. Agenda, 33(4):29–43. Mosomi, J. N. (2018). Distributional changes in the gender wage gap in the post-apartheid South African labour market. PhD thesis, Faculty of Commerce. University of Cape Town. Mwabu, G. and Schultz, T. P. (2000). Wage premiums for education and location of South African workers, by gender and race. Economic Development and Cultural Change, 48(2):307–334. National Income Dynamics Study - Coronavirus Rapid Mobile Survey (NIDS-CRAM) 2020 Wave 2 [dataset] (2020). Version 1.1.0. Cape Town: Allan Gray Orbis Foundation [funding agency]. Cape Town: Southern Africa Labour and Development Research Unit [implementer]. Ntuli, M. (2007). Exploring gender wage “discrimination” in South Africa, 1995-2004: A quantile regression approach.

Mind the Gap: The Distributional Effects of South Africa's National Lockdown on Gender Wage Inequality
25
Posel, D. and Casale, D. (2019). Gender and the economy in post-apartheid South Africa: Changes and challenges. Agenda, 33(4):3–10. Ranchhod, V. and Daniels, R. (2020). Labour market dynamics in South Africa in the time of Covid-19: Evidence from Wave 1 of the NIDS-CRAM survey. National Income Dynamics Study Coronavirus Rapid Mobile Survey (NIDS-CRAM) Working Paper, Wave 1(9). Republic of South Africa (1998). Employment Equity Act, No. 55 of 1998. Government Gazette, 400(19370). Weichselbaumer, D. and Winter-Ebmer, R. (2005). A meta-analysis of the international gender wage gap. Journal of Economic Surveys, 19(3):479–511. Wittenberg, M. (2017). Wages and Wage Inequality in South Africa 1994–2011: Part 1 – Wage Measurement and Trends. South Africa Journal of Economics, 85(2). Yamaguchi, S. (2018). Changes in returns to task-specific skills and gender wage gap. Journal of Human Resources, 53(1):32–70.

DPRU WP 202101
26
Technical appendix Representativity in the NIDS-CRAM We believe our estimates come with important caveats due to unavoidable imprecision which render them still approximations. We discuss these caveats here. First, it is important to note that because the NIDS-CRAM sample is drawn from a representative sample of individuals in NIDS Wave 5 (conducted in 2017), the weighted estimates are not necessarily representative of the South African adult population in 2020. Although post-stratification weights make the NIDS Wave 5 sample representative of the South African population in 2017, the weighted NIDS-CRAM estimates are only representative of the outcomes in 2020 of those aged 15 years and older in 2017 who were followed up 3 years later – hence ‘broadly’ representative. Second, it is not unusual to observe disparities between estimates of the NIDS and other household surveys such as the QLFS. This is because NIDS was always designed to be a panel survey representative of the population in 2008, and as such, factors such as selective migration from the sample over time are not accounted for. Since the NIDS-CRAM sample is drawn from the NIDS Wave 5 sample, this characteristic will continue into NIDS-CRAM. Third, although NIDS-CRAM respondents can be matched to their observations in the core NIDS panel, caution should be exercised when making comparisons between these two datasets. NIDS-CRAM uses a much shorter questionnaire (and is thus less detailed) which takes on average 20 minutes to administer, is conducted via CATI as opposed to face-to-face interviews, and is an individual-level, individual-based survey as opposed to being household-based. This latter point presents complications for deriving household- level variables from individual-level variables. In the NIDS-CRAM sampling method, no restriction was made to selecting just one individual per NIDS Wave 5 household, and no attempt was made to check whether successfully re-interviewed individuals resided in the same households as they did in Wave 5. Moreover, NIDS asked the oldest women or most knowledgeable person in the household (where possible) about the household and its members, whereas every respondent in NIDS-CRAM was asked about their household. This has important implications for precise estimates of household income, for example. In general, the level of detail of the questions in NIDS-CRAM will not allow for full- imputations of income as in NIDS. Finally, individuals from larger households were more likely to be sampled in the NIDS-CRAM relative to individuals from smaller households (Kerr et al., 2020). We emphasise that the reader keeps these concerns in mind throughout the paper. There remain, however, important advantages of the NIDS-CRAM data that make it incredibly valuable for understanding the current context in South Africa. First, because the survey is designed as a panel, it can provide a substantial amount of information about the dynamics of sampled individuals as the pandemic and lockdown unfolds. At the time of writing there is no comparable existing dataset which can be used to analyse these dynamics. Second, despite unavoidable comparability issues with the NIDS-CRAM and other surveys, internal validity and comparisons over time for the sample are not issues of concern. Many of the operational challenges experienced by the NIDS-CRAM survey will almost certainly be experienced by other surveys being conducted during this period. Third, unlike many other rapid mobile surveys conducted to analyse the impacts of COVID-19, the panel nature of the NIDS-CRAM means that researchers can check under- or over-reporting of key variables by linking respondents back to their records in earlier NIDS waves.

Mind the Gap: The Distributional Effects of South Africa's National Lockdown on Gender Wage Inequality
27
Adjusting the NIDS-CRAM earnings data for outliers and selection into bracket responses more detailed household surveys such as the NIDS. In the NIDS, several items exist which seek to gather information on an individual’s labour market earnings and other sources of income (such as that from an individual’s primary and secondary jobs, casual work, self-employment). On the other hand, in the NIDS-CRAM Waves 1 and 2 data, much fewer items exist. Specifically, individuals were asked what their last take-home pay and/or profit for February, April, and June 2020 was. For the latter two reference periods, the data varies by respondent’s reported frequency of payment (daily, weekly, fortnightly, or monthly). We interpret these items collectively as an inclusive wage variable. It is however reassuring that in an assessment of the quality of the NIDS-CRAM Wave 1 data, Ardington (2020) shows that the weighted distribution of earnings is plausible given its similarity to distributions in other surveys (such as the NIDS Wave 5 and General House- hold Survey 2018). We convert all wages reported in monetary amounts to a monthly frequency.9 We adopt several statistical techniques to address outliers and selection into providing bracket responses in the NIDS-CRAM earnings data. First, outlier values are identified and coded as missing by using the “extreme studentised regression residuals” approach as advised by Wittenberg (2017). This is done by estimating a Mincerian-style Ordinary Least Squares (OLS) regression of the logarithm of nominal monthly earnings on a vector of observable covariates and identifying outliers as those observations with absolute residuals in excess of four.10 This adjustment resulted in just three February 2020 earnings values being coded as missing in the NIDS-CRAM Wave 1 data, and two June 2020 earnings values in the NIDS-CRAM Wave 2 data. Second, we address selection into responding with bracket information through a reweighting technique. Specifically, we construct bracket weights, similar to those constructed in the Post-Apartheid Labour Market Series (PALMS) version 3.3 dataset. These are calculated as the inverse of the probability of an actual monetary (Rand) response in a particular bracket in a particular wave (NIDS Wave 1 or Wave 2), multiplied by the sampling weight for each individual. This process weights up individuals whose reported incomes are in brackets where the proportion of actual monetary responses are lower, relative to brackets where such response is high.11 To generate these weights, we first needed to generate consistent brackets, considering that in the NIDS-CRAM Wave 2 data the bracket categories differ by the frequency of payments (weekly, fortnightly, and monthly). More information pertaining to this harmonisation process is provided in Tables A1 and A2 in the Appendix. The outcome of our reweighting process is summarised by the unweighted and weighted (with sampling and bracket weights) distribution of wages in Figure A1 in the Appendix. In both waves, the weighted (sampling weight or bracket weight) distributions are notably shifted to the right relative to the unweighted. The sampling weighted
9 To do so, we assume 4.33 weeks per month and use self-reported data on individuals’ average work week lengths measured in days. 10 The covariates we use here include age, age squared, self-reported gender and race, area (traditional, farms, or urban), province of residence, highest level of education, marital status, usual occupation, usual industry, type of contract (written or verbal), and weekly hours worked. 11 For example, if we observe 95% of individuals within the bracket R1 000 - R2 000 gave actual Rand responses, then these individuals will get revised weights equal the sampling weight divided by 0.95. On the other hand, individuals within the bracket R20 000 – R30 000 where 35% gave actual Rand responses will get revised weights equal the sampling weight divided by 0.35. The latter will be weighted up relative to individuals in the lower bracket.

DPRU WP 202101
28
February 2020 distribution (mean of R7 285.94) is substantially different from the bracket weighted distribution (mean of R7 607.05). Similarly, the sampling weighted June 2020 distribution (mean of R8 157.08) is substantially different from the bracket weighted distribution (mean of R8 779.92). These observed differences between the sampling and bracket weighted distributions are attributable to the varied likelihoods of responding with an actual monetary (Rand) amount across the distribution (see Table A2). It is important to note that his reweighting approach does not do anything about those who refuse to answer or who otherwise have missing data - it only corrects for bracket responses.12 Table A1: Harmonisation of NIDS-CRAM Wave 2 income brackets into one consistent bracket Original NIDS-CRAM bracket (Rands per month)
Formula for conversion Final monthly equivalent bracket
Weekly bracket Zero/nothing
Lower or upper bound/7 × 30
0 1 - 700 <= 3 000 701 - 1 400 3 001 - 6 000 1 401 - 2 800 6 001 - 12 000 2 801 - 5 500 12 001 - 24 000
Fortnightly bracket
1 401 - 2 800
Lower or upper bound/14 × 30
3 001 - 6 000 2 801 - 5 500 6 001 - 12 000 5 501 - 11 000 12 001 - 24 000 > 11 000 > 24 000
Source: NIDS-CRAM Wave 2. Authors’ own calculations. Note: Only relevant brackets with non-missing data shown here. Table A2: Probability of reporting an actual Rand amount by final income bracket and wave
Final monthly earnings bracket Probability of reporting a Rand amount NIDS-CRAM W1: Feb 2020 NIDS-CRAM W2: June 2020
1. Zero/nothing 0.639 0.945 2. < 3 000 0.853 0.879 3. 3 001 and 6 000 0.831 0.932 4. 6 001 and 12 000 0.865 0.871 5. 12 001 and 24 000 0.735 0.762 6. > 24 001 0.756 0.771
Source: NIDS-CRAM Waves 1 and 2. Authors’ own calculations.
12 In this paper, we chose not to impute wage values for such observations because furloughed workers are very imprecisely defined, and there are a considerable amount of them in the data due to the national lockdown. Consequently, imputations would be biased for furloughed workers in particular, and therefore biased overall for all income imputations.

Mind the Gap: The Distributional Effects of South Africa's National Lockdown on Gender Wage Inequality
29
Figure A1: Distribution of log nominal monthly wages in February and June 2020: unweighted and weighted using the sampling weights and computed bracket weights
Source: NIDS-CRAM Waves 1 and 2. Authors’ own calculations. Figure A2: February 2020, June 2020, and hypothetical June 2020 log real hourly wage distributions after DFL reweighting
Source: NIDS-CRAM Waves 1 and 2. Authors’ own calculations. Notes: [1] Variables controlled for in regressions include age, age squared, race, highest level of education, main occupation, area of residence, province, home language, marital status, presence of a written contract, number of cohabiting children under age 18, and weekly hours worked. [2] Hypothetical distribution represents the distribution of earnings that wage earners in June 2020 would have obtained if their characteristics were the same as February 2020 wage earners. [3] Wages inflated to July 2020 Rands.

DPRU WP 202101
30
Table A3: Complete Mincerian OLS regression estimates of the gender wage gap: February and June 2020
Period: Feb Feb June June Feb Feb June June Dep var: Log (real hourly wage) Log (real monthly wage) Female -0.298*** -0.293*** -0.336*** -0.429*** -0.371*** -0.299*** -0.593*** -0.516*** Age 0.138*** 0.053** 0.147*** 0.038* Age squared
-0.001*** -0.000 -0.002*** -0.000
Coloured -0.030 -0.542** 0.028 -0.288* Asian/ Indian
-0.135 -0.234 0.055 -0.232
White 0.479** -0.177 0.516** 0.041 Urban 0.143 -0.101 0.157 0.033 Farm -0.204 -0.206* 0.036 -0.099 Up to Secondary
0.154 0.406** 0.204 0.495***
Matric 0.385** 0.563*** 0.436** 0.725*** Tertiary 0.856*** 0.997*** 0.919*** 1.113*** Eastern Cape
0.141 -0.286 0.092 -0.228
Northern Cape
0.541** -0.179 0.306** -0.220
Free State
0.173 -0.457* 0.283* -0.216
KwaZulu-Natal
0.115 -0.122 0.117 -0.118
North West
0.322* -0.241 0.286 -0.148
Gauteng 0.294** -0.028 0.331** -0.043 Mpum-alanga
0.283* -0.178 0.279* -0.133
Limpopo 0.332* -0.081 0.259 -0.097 Managers 0.262 0.378 0.384* 0.274 Profess-ionals
0.493* 0.164 0.553** 0.093
Techn-icians
0.322 -0.831*** 0.365 -0.789***
Clerks -0.229 -0.199 -0.100 -0.366** Service workers
-0.390* -0.752*** -0.231 -0.618***
Skilled agri -0.381 -0.760*** -0.018 -0.711*** Craft -0.352 -0.091 -0.328 -0.215 Plant operators
-0.186 -0.288 -0.014 -0.226
Elemen-tary
-0.586** -0.598*** -0.527** -0.596***
Married 0.118 0.078 0.175** 0.207*** IsiXhosa 0.499 0.852*** 0.659** 0.952*** IsiZulu 0.354 0.688*** 0.541* 0.886*** Sepedi 0.110 0.606** 0.224 0.810** Sesotho 0.373 0.943*** 0.374 0.846*** Setswana 0.160 0.902*** 0.391 1.008***

Mind the Gap: The Distributional Effects of South Africa's National Lockdown on Gender Wage Inequality
31
Period: Feb Feb June June Feb Feb June June Dep var: Log (real hourly wage) Log (real monthly wage) siSwati 0.384 0.641** 0.543 0.757** Tshivenda 0.456 0.820** 0.795** 0.779** Xitsonga -0.013 0.595** 0.243 0.676** Afrikaans 0.358 1.208*** 0.447 0.988*** English 0.391 1.045*** 0.462 0.944*** Written contract
0.306*** 0.122 0.441*** 0.232***
Number of residents < 18 years
-0.027 -0.051* -0.004 -0.042*
Co-resides with child <7years
-0.019 0.028 -0.100 0.035
Working hours
0.089*** 0.010***
Constant 3.368*** -0.658 3.822*** 1.668*** 8.344*** 3.071*** 8.749*** 6.159*** Obser-vations 2 296 963 1 168 983 2 474 966 1 577 983
R2 0.014 0.551 0.024 0.447 0.018 0.575 0.061 0.527 Source: NIDS-CRAM Waves 1 and 2. Authors’ own calculations. Notes: [1] All estimates are weighted using computed bracket weights after accounting for complex survey designs. [2] * p<0.1, ** p<0.05, *** p<0.01. [3] Standard errors are suppressed. [4] Base groups for categorical variables: African, Traditional area, up to primary, Western Cape, Armed forces, and IsiNdebele. Figure A3: Estimates of the conditional gender wage gap in real monthly wages across the wage distribution: February 2020, June 2020, and June 2020 (reweighted)
Source: NIDS-CRAM Waves 1 and 2. Authors’ own calculations. Notes: [1] Left-hand panel shows February 2020 estimated gender wage gap compared to June 2020 estimated gender wage gap. Right-hand panel shows February 2020 estimated gender wage gap compared to reweighted June 2020 gender wage gap. [2] Variables controlled for in regressions include age, age squared, race, highest level of education, main occupation, area of residence, province, home language, marital status, presence of a written contract, and number of cohabiting children under age 18. [3] Estimates are weighted using computed bracket weights, or DFL reweighted bracket weights. [4] Wages inflated to July 2020 Rands. [5] Shaded areas represent 95% Confidence Intervals.

DPRU WP 202101
32
Figure A4: Estimates of the conditional gender wage gap in real hourly wages across the wage distribution: February 2020, June 2020, and June 2020 (reweighted)
Source: NIDS-CRAM Waves 1 and 2. Authors’ own calculations. Notes: [1] Left-hand panel shows February 2020 estimated gender wage gap compared to June 2020 estimated gender wage gap. Right-hand panel shows February 2020 estimated gender wage gap compared to reweighted June 2020 gender wage gap. [2] Variables controlled for in regressions include age, age squared, race, highest level of education, main occupation, area of residence, province, home language, marital status, presence of a written contract, and number of cohabiting children under age 18. [3] Estimates are weighted using computed bracket weights, or DFL reweighted bracket weights. [4] Wages inflated to July 2020 Rands. [5] Shaded areas represent 95% Confidence Intervals.
Development Policy Research UnitUniversity of Cape TownPrivate Bag, Rondebosch 7701Cape Town, South AfricaTel: +27 21 650 5701www.dpru.uct.ac.za