Embed Size (px)
Citation preview

MIMO RADIO-OVER-FIBRE DISTRIBUTED
ANTENNA SYSTEM FOR NEXT GENERATION
WIRELESS COMMUNICATION
Yumeng Yang
Department of Engineering
University of Cambridge
This dissertation is submitted for the degree of
Doctor of Philosophy
Sidney Sussex College September 20th, 2017


i
I would like to dedicate this thesis to my parents …

ii
Declaration
I hereby declare that except where specific reference is made to the work of others, the contents
of this dissertation are original and have not been submitted in whole or in part for consideration
for any other degree or qualification in this, or any other University. This dissertation is the
result of my own work and includes nothing which is the outcome of work done in
collaboration, except where specifically indicated in the text. This dissertation contains less
than 65,000 words including appendices, bibliography, footnotes, tables and equations and has
less than 150 figures.
Yumeng Yang
September 20th, 2017
iii
Acknowledgements
First of all, I would like to acknowledge my supervisor, Prof. Richard Penty, for his guidance
during my PhD study. I am grateful for his inspiration and continuous support in the past four
years. I would also like to thank my advisor, Prof. Ian White, whose comments and suggestions
contribute to the complement of this thesis. Their help and supports benefit me a lot, not only
in the field of radio over fibre technology but also on the way to become an independent
researcher.
I want to thank Dr Michael Crisp and Dr Tongyun Li especially, who provided me with infinite
helps to the first steps in my PhD study. They spent their valuable time to discuss academic
problems with me. Also thanks for Adrian Wonfer and George Gordon for their constant help
in my research.
Other group members also gave me valuable support, including Peter Vasilyev, Nikos
Bamiedakis, Jinlong Wei, Sithamparanathan Sabesan, Qixiang Cheng, Xuhan Guo, Jiannan
Zhu, Jian Chen, Sicheng Zou, Xin Li, Minsheng Ding, Shuai Yang, Priyanka De Souza, Eric
Lowe. Thank them all for their help. I would like to give my special thanks to Minsheng Ding
and Shuai Yang, who have been my best friends and companions during my PhD and ordered
delivery food with me in the very late nights.
Most importantly, I would like to express my gratitude to my parents (Hefa Yang and Danwen
Shen), who gave me the strongest supports all the time. Without their spiritual encouragement
and meticulous supports, it is impossible for me to finish this work. I am particularly grateful
to my wife – Wen Sun. She gave me unconditional companionship and understanding at my
most difficult time.
In the end, when I am writing this thesis, my grandfather is suffering from cancer. I hope he
can get well. Best wishes to him.

iv
Abstract
This thesis introduces low-cost implementations for the next generation distributed antenna
system (DAS) using analogue radio over fibre. A multiple-input-multiple-output (MIMO)
enabled radio over fibre (RoF) system using double sideband (DSB) frequency translation
system is proposed. In such a system, the 2x2 MIMO signals can be transmitted to the remote
antenna units (RAUs) from the base station via a single optical link. By using the DSB
frequency translation, the original single-input-single-output (SISO) DAS can be upgraded into
the MIMO DAS without implementing parallel optical links. Experimentally, the DSB
frequency translation 2x2 MIMO RoF system transmits 2x2 LTE MIMO signals with 20MHz
bandwidth in each channel via a 300m MMF link. The condition number of the system is
<10dB within the power equaliser bandwidth which means the MIMO system is well-
conditioned and the crosstalk between the channels can be compensated by the MIMO signal
processing.
To install the DSB frequency translation system in a wideband service-agnostic DAS, the
original MIMO signals need to be translated into unoccupied frequency bands over the DAS,
which are usually occupied by specific applications that are not to be transmitted over the DAS.
The frequency spectrum allocation of the wireless services is analysed showing that by
choosing a particular LO frequency (2.2GHz in the UK), in the DSB frequency translation
system, the original MIMO signals can always be translated into unoccupied frequency bands
so that the same infrastructure can support multiple services.
The idea of DSB frequency translation system can not only support MIMO radio over fibre but
can also improve the SFDR of a general radio over fibre system. Because when the upper
sideband and the lower sideband of the signal after translation are converted back to the original
frequency band, the noise adds incoherently but the signals add-up coherently, this gives the
system theoretically 2dB 3rd order SFDR improvement. If the idea of the DSB frequency
translation is extended into a higher number of sidebands, the system SFDR can be further
improved. Experimentally, the system 3rd order SFDR can be improved beyond the intrinsic

v
optical link by 2.7dB by using quadruple sideband (QSB) frequency translation. It means the
optical bandwidth in a general RoF system can be traded for the electrical SFDR.
By integrating the analogue and the digital RoF systems, a hybrid DAS has been demonstrated,
showing that the EVM dynamic range for the 4G LTE service (using digital RoF link) can be
improved to be similar to the 3G UMTS service (using analogue RoF link), so that fewer
number of RAUs for the LTE services are needed.
vi
List of Publications
[1] Y. Yang, M. J. Crisp, R. V. Penty and I. H. White, "Low-Cost MIMO Radio Over Fiber
System for Multiservice DAS Using Double Sideband Frequency Translation," in Journal of
Lightwave Technology, vol. 34, no. 16, pp. 3818-3824, Aug.15, 15 2016.
[2] Y. Yang, M. J. Crisp, T. Li, R. V. Penty, I. H. White, "MIMO Capable RoF System with
Improved SFDR using Quadruple Sidebands, " 2017 IEEE International Topical Meeting on
Microwave Photonics (MWP), Beijing, China, 2017.
[3] R. V. Penty, G. Gordon, Y Yang, M. J. Crisp, T. Wilkinson, I. White, "Methods for
Transmitting MIMO Radio Signals Over Fibre," 2017 IEEE International Topical Meeting on
Microwave Photonics (MWP), Beijing, China, 2017. (Invited)

1
Contents
Contents ..................................................................................................................................... 1
List of Figures ............................................................................................................................ 4
List of Tables ............................................................................................................................. 9
Nomenclature ........................................................................................................................... 10
Chapter 1 Introduction ........................................................................................................ 13
1.1 MIMO-enabled RoF for Indoor Wireless Coverage ................................................. 13
1.1.1 A brief historical background of modern wireless communication ................... 13
1.1.2 Need and challenges for indoor wireless coverage of MIMO signals ............... 15
1.1.3 Solutions for indoor wireless coverage .............................................................. 17
1.2 Thesis Scope .............................................................................................................. 22
1.3 Novel Contributions .................................................................................................. 23
Chapter 2 Fundamentals of a Radio over Fibre Systems and Literature Reviews ............. 25
2.1 Intrinsic Analogue RoF Link..................................................................................... 25
2.1.1 Benefits of using radio over fibre ...................................................................... 25
2.1.2 The architecture of an intrinsic analogue RoF link ............................................ 26
2.2 Performance Measurement of a RoF Link ................................................................ 32
2.2.1 Link intrinsic gain .............................................................................................. 32
2.2.2 Error Vector Magnitude ..................................................................................... 34
2.3 Architecture of an Analogue SISO DAS................................................................... 38
2.4 Challenges to Implement DAS and Integrate MIMO Services into an Analogue DAS
……………………………………………………………………………………...40
2.4.1 Nonlinearity ....................................................................................................... 42
2.5 State-of-the-Arts of MIMO-enabled RoF System ..................................................... 45
2.5.1 Interleaved MIMO DAS and co-located MIMO DAS ...................................... 45
2.5.2 Multiplexing Schemes ....................................................................................... 46
2
2.6 Summary and Conclusion ......................................................................................... 50
Chapter 3 2x2 MIMO RoF System using DSB Frequency Translation Technique ........... 51
3.1 Introduction ............................................................................................................... 51
3.2 SISO RoF System ..................................................................................................... 51
3.2.2 Pre-amplifier and post-amplifier in a SISO RoF system ................................... 52
3.2.3 Basic experimental measurements of a SISO RoF system ................................ 56
3.3 Modelling of SSB and DSB MIMO-enabled RoF System ....................................... 59
3.3.1 Third order SFDR of the SSB and the DSB frequency translation system ....... 61
3.3.2 Crosstalk in the DSB frequency translation system ........................................... 63
3.3.3 EVM simulation for a DSB frequency translation system................................. 67
3.4 Experiments for MIMO-enabled RoF using DSB frequency translation .................. 69
3.4.1 Experimental Setup ............................................................................................ 69
3.4.2 Experimental Results ......................................................................................... 71
3.5 Summary and Conclusion ......................................................................................... 77
Chapter 4 Broadband Implementation for MIMO RoF using DSB Frequency Translation
…………………………………………………………………………………79
4.1 Introduction ............................................................................................................... 79
4.2 Services to be transmitted over a DAS...................................................................... 79
4.3 Local oscillator frequency selection .......................................................................... 81
4.4 Experiment for broadband EVM test ........................................................................ 86
4.4.1 Experimental setup............................................................................................. 86
4.4.2 Experimental results........................................................................................... 88
4.5 Demonstration for local oscillator signal remote delivery and real-life 2x2 MIMO
RoF ……………………………………………………………………………………...90
4.5.1 Local oscillator signal remote delivery. ............................................................. 90
4.5.2 Real-life Wi-Fi 2x2 MIMO RoF test with free-space propagation.................... 95
4.6 Summary and Conclusion ......................................................................................... 97
Chapter 5 SFDR improvement using multiple-sideband frequency translation ................. 99
5.1 Introduction ............................................................................................................... 99
5.2 Theory of 3rd order SFDR improvement in a quadrature-multiplexed frequency
translation system ............................................................................................................... 100
5.3 Simulation results and link trade-offs ..................................................................... 103
5.4 Experiment on the 3rd order SFDR improvement by trading optical bandwidth ... 104
3
5.5 Simulation on the capability to transmit MIMO-type signals using QSB frequency
translation ........................................................................................................................... 106
5.6 Summary and conclusion ........................................................................................ 108
Chapter 6 Hybrid DAS using Digital and Analogue RoF ................................................ 110
6.1 Introduction ............................................................................................................. 110
6.2 Proposed hybrid DAS system ................................................................................. 111
6.3 Signal processing in the digital link ........................................................................ 113
6.4 Simulation of the analogue link .............................................................................. 114
6.5 Experimental layout and test results........................................................................ 117
6.6 Summary and Conclusion ....................................................................................... 120
6.7 Acknowledgement ................................................................................................... 121
Chapter 7 Conclusion and Future Work ........................................................................... 122
7.1 Thesis Summary ...................................................................................................... 122
7.2 Potential future work ............................................................................................... 125
References .............................................................................................................................. 130

4
List of Figures
Figure 1.1 Milestones of wireless communication [1]............................................................. 13
Figure 1.2 Evolution of cellular networks from the 1980s [4] ................................................ 14
Figure 1.3: Cisco’s forecast on mobile data generated per month globally [5] ....................... 15
Figure 1.4: Cisco’s forecast on global mobile device growth [5] ............................................ 16
Figure 1.5: Architecture of a signal repeater [7] ...................................................................... 17
Figure 1.6 Architecture of a stand-alone small cell [9] ........................................................... 18
Figure 1.7 Architecture of a small cell system using RRUs .................................................... 19
Figure 1.8 Typical architecture of a DAS ................................................................................ 20
Figure 1.9 Typical Layout of a single link DAS: (a) Digital DAS; (b) Analogue DAS .......... 20
Figure 2.1 Intensity modulation of RF signal over optical link: (a) Direct Modulation; (b)
External Modulation ................................................................................................................ 28
Figure 2.2 Concept of direct modulation of a laser diode........................................................ 28
Figure 2.3 Concept of external intensity modulation............................................................... 29
Figure 2.4 Intrinsic analogue radio over fibre link .................................................................. 32
Figure 2.5 Small signal model of the intrinsic RoF link [43] .................................................. 33
Figure 2.6 Typical layout for a QAM transmitter .................................................................... 35
Figure 2.7 Typical layout for a QAM receiver ........................................................................ 35
Figure 2.8 Error vector magnitude ........................................................................................... 36
Figure 2.9 Constellation diagrams with (a) low EVM; (b) high EVM .................................... 36
Figure 2.10 Typical downlink layout of an in-building analogue DAS: (a) active secondary
hub; (b) passive secondary hub ................................................................................................ 39
Figure 2.11 Cabling of a Commscope® DAS: (a) central hub; (b) inbuilding cabling [57] .... 41
Figure 2.12 Frequency distribution of 2nd and 3rd order IMD products ................................... 42
Figure 2.13 Passband signal going through a nonlinear system .............................................. 43
Figure 2.14 nth order IMD, IIP, OIP and SFDR ....................................................................... 44
Figure 2.15 Interleaved 2x2 MIMO DAS and co-located 2x2 MIMO DAS ........................... 46
Figure 2.16 Typical Layout for a WDM RoF system .............................................................. 47
Figure 2.17 Typical layout of an SCM RoF system ................................................................ 47
Figure 3.1 Layout for a general cascaded system .................................................................... 51

5
Figure 3.2 SISO RoF System ................................................................................................... 52
Figure 3.3 3rd order SFDR vs pre-amplifier gain for a SISO RoF system when pre-amplifier
noise figure=0dB ...................................................................................................................... 53
Figure 3.4 3rd order SFDR vs pre-amplifier gain for a SISO RoF system when pre-amplifier
noise figure=10dB .................................................................................................................... 53
Figure 3.5 Influence of the pre-amplifier on the cascaded 3rd order SFDR of a SISO RoF link:
(a) cascaded SFDR3 vs Pre-amplifier IIP3; (b) cascaded SFDR3 vs pre-amplifier noise figure
.................................................................................................................................................. 54
Figure 3.6 3rd order SFDR vs post-amplifier gain for a SISO RoF system when post-amplifier
noise figure=10dB .................................................................................................................... 55
Figure 3.7 Influence of the post-amplifier on the cascaded 3rd order SFDR of a SISO RoF
link: (a) cascaded SFDR3 vs post-amplifier IIP3; (b) cascaded SFDR3 vs post-amplifier noise
figure ........................................................................................................................................ 55
Figure 3.8 Experiment setup for laser diode L-I characteristic test ......................................... 56
Figure 3.9 L-I characteristic of the Mitsubishi® FU-68-PDF DFB laser ................................. 56
Figure 3.10 Experimental layout for 300m MMF link S21 parameter test ............................. 57
Figure 3.11S21 amplitude-frequency response of the optical link using Mitsubishi® FU-68-
PDF DFB laser ......................................................................................................................... 57
Figure 3.12 General layout of the two-tone test to measure the SFDR of a nonlinear system 58
Figure 3.13 3rd order SFDR test result for intrinsic optical link .............................................. 59
Figure 3.14 Schematic of a single sideband frequency translation system for 2x2 MIMO RoF
[71] ........................................................................................................................................... 60
Figure 3.15 Schematic of a double sideband frequency translation system for 2x2 MIMO RoF
[70] ........................................................................................................................................... 61
Figure 3.16 Simulation results comparing DSB with SSB frequency translation system:
(a)IIP3; (b) OIP3; (c)output noise floor; (d) 3rd order SFDR................................................... 62
Figure 3.17 Schematic of the model of MIMO-enabled RoF system using DSB frequency
translation. ................................................................................................................................ 63
Figure 3.18 Simulation of the crosstalk caused by the phase error of 90-degree hybrid
couplers, and amplitude imbalance between two sidebands. ................................................... 67
Figure 3.19 Simulation layout for 2x2 DSB MIMO RoF system in VPItranmissionMaker® 68
Figure 3.20 Simulation result: constellation diagram of two channels of 64QAM 20MHz BW
signal transmitted over 300m MMF link using DSB frequency translation. Left: channel 1
EVM=3.1%; right channel 2 EVM = 3.8% ............................................................................. 68
Figure 3.21 Experimental layout of MIMO-enabled RoF system using DSB frequency
translation technique. ............................................................................................................... 69
Figure 3.22 EVM test layout for MIMO-enabled multi-service RoF system .......................... 70

6
Figure 3.23 Experimental setup for condition number test...................................................... 71
Figure 3.24 Experimental test result for 2×2 LTE MIMO-enabled radio over 300m MMF,
using double sideband frequency translation technique. Central carrier frequency=700MHz
Upper: EVM vs. carrier frequency (normalized); Lower: constellation diagram. (a) channel
bandwidth=5MHz; (b) channel bandwidth=10MHz; (c) channel bandwidth= 20MHz .......... 72
Figure 3.25 Experimental test result for IEEE 802.11g signal (54Mbps) transmitting along
with 2×2 LTE MIMO signals. Mean EVM=1.16%. ................................................................ 73
Figure 3.26 EVM comparison for four different types of optical fibres (carrier frequency =
700MHz ) ................................................................................................................................. 74
Figure 3.27 Measurement of channel matrix elements (phase is not shown) and calculated
condition number vs carrier frequency. ................................................................................... 75
Figure 3.28 SFDR test for MIMO-enabled RoF system using DSB frequency translation ... 76
Figure 3.29 EVM dynamic range improvement of DSB frequency translation from SSB
frequency translation ................................................................................................................ 77
Figure 4.1 Typical services to be transmitted over a DAS in the UK ..................................... 80
Figure 4.2 Typical frequency bands that are not occupied in the DAS in the UK (reserved for
space to earth communication and aeronautical communication) ........................................... 80
Figure 4.3 Example frequency translation map to translate 800MHz and 1.8GHz LTE
channels into unoccupied frequency bands on a DAS ............................................................. 81
Figure 4.4 Experiment setup for S21 parameter measurement for broadband RoF optical link
.................................................................................................................................................. 86
Figure 4.5 S21 magnitude response for broadband optical link and pre-amplifier+optical link
.................................................................................................................................................. 86
Figure 4.6 Experimental layout for 2×2 MIMO-enabled broadband RoF using DSB frequency
translation technique and frequency spectrum (700MHz carrier frequency LTE shown by way
of example). ............................................................................................................................. 87
Figure 4.7 2x2 LTE MIMO EVM measurement setup ........................................................... 88
Figure 4.8 Broadband EVM test result for 2×2 LTE MIMO-enabled RoF using DSB
frequency translation. ............................................................................................................... 88
Figure 4.9 EVM input power dynamic range tested at 800MHz and 1800MHz ..................... 89
Figure 4.10 Constellation diagrams for 800MHz carrier frequency 20MHz BW LTE: (a)
input power = -27dBm; (b) input power =-11dBm; (c) input power = 3dBm ......................... 90
Figure 4.11Experimental setup for LO remote delivery in an SCM system. .......................... 91
Figure 4.12 EVM performance comparison between the LO remote delivery and the ideal
case when using SCM .............................................................................................................. 92
Figure 4.13 LO oscillator phase noise in LO remote delivery ................................................. 92
7
Figure 4.14 Experimental layout for DSB 2x2 MIMO RoF system using LO remote delivery.
.................................................................................................................................................. 93
Figure 4.15 EVM test result for both MIMO channels when using LO remote delivery ........ 94
Figure 4.16 Constellation and EVM vs. carrier frequency diagrams for the LO remote
delivery in 2x2 DSB MIMO RoF system: (a) at -35dBm input signal power; (b) at -12dBm
input signal power; (c)at -3dBm input signal power ............................................................... 94
Figure 4.17 Experiment setup for Wi-Fi 2x2 MIMO RoF throughput test ............................. 96
Figure 4.18 Throughput cumulative distribution function for MIMO RoF system using
SSB/DSB frequency translation ............................................................................................... 97
Figure 5.1 Translate signal into different numbers of sidebands, DSB: two sidebands; QSB:
four sidebands; OSC: eight sidebands ................................................................................... 100
Figure 5.2 Simulation result: the system maximum possible 3rd order SFDR and pre-
amplifier gain required to achieve maximum SFDR [98] ..................................................... 103
Figure 5.3 Experiment layout: two-tone test for 3rd order SFDR measurement of a 2x2 MIMO
RoF system............................................................................................................................. 105
Figure 5.4 Layout for quadrature-multiplexed frequency translation system........................ 105
Figure 5.5 Experimentally measured 3rd order SFDR of DSB and QSB system at 800MHz
centre frequency, comparing with intrinsic optical link ........................................................ 106
Figure 5.6 Simulation result: received 64QAM constellation diagram using QSB, (a)channel
1 EVM = 2.45% (b)channel 2 EVM = 2.50% ....................................................................... 107
Figure 5.7 System crosstalk vs phase error in 90-degree hybrid couplers for a QSB system.
................................................................................................................................................ 108
Figure 6.1 Architecture of a hybrid DAS using digital and analogue RoF ............................ 111
Figure 6.2 Concept for the analogue and digital hybrid RoF [103] ....................................... 112
Figure 6.3 Digital signal processing in the DRoF link [103] ................................................. 113
Figure 6.4 Simulation layout for the analogue RoF link: (a) in the traditional analogue RoF
system; (b) in the hybrid RoF system .................................................................................... 115
Figure 6.5 Two-tone test simulation result: (a) traditional analogue RoF link; (b) analogue
RoF link in the hybrid system (7dB loss for two couplers included) .................................... 116
Figure 6.6 OIP2-Noise floor vs optical link loss ................................................................... 117
Figure 6.7 Experimental layout for analogue and digital hybrid RoF system. ...................... 118
Figure 6.8 Experiment setup for hybrid RoF link .................................................................. 119
Figure 6.9 EVM dynamic range of the analogue and digital RoF system ............................. 119
Figure 7.1 3x3 MIMO RoF system using DSB frequency translation [64] ........................... 127
Figure 7.2 4x4 MIMO RoF system using DSB frequency translation .................................. 127

9
List of Tables
Table 1.1 Comparison among different indoor signal coverage solutions .............................. 21
Table 2.1 Performance comparison between the PIN photodiode and the APD [26] [27] ...... 27
Table 2.2 Comparison between direct modulation and external modulation .......................... 30
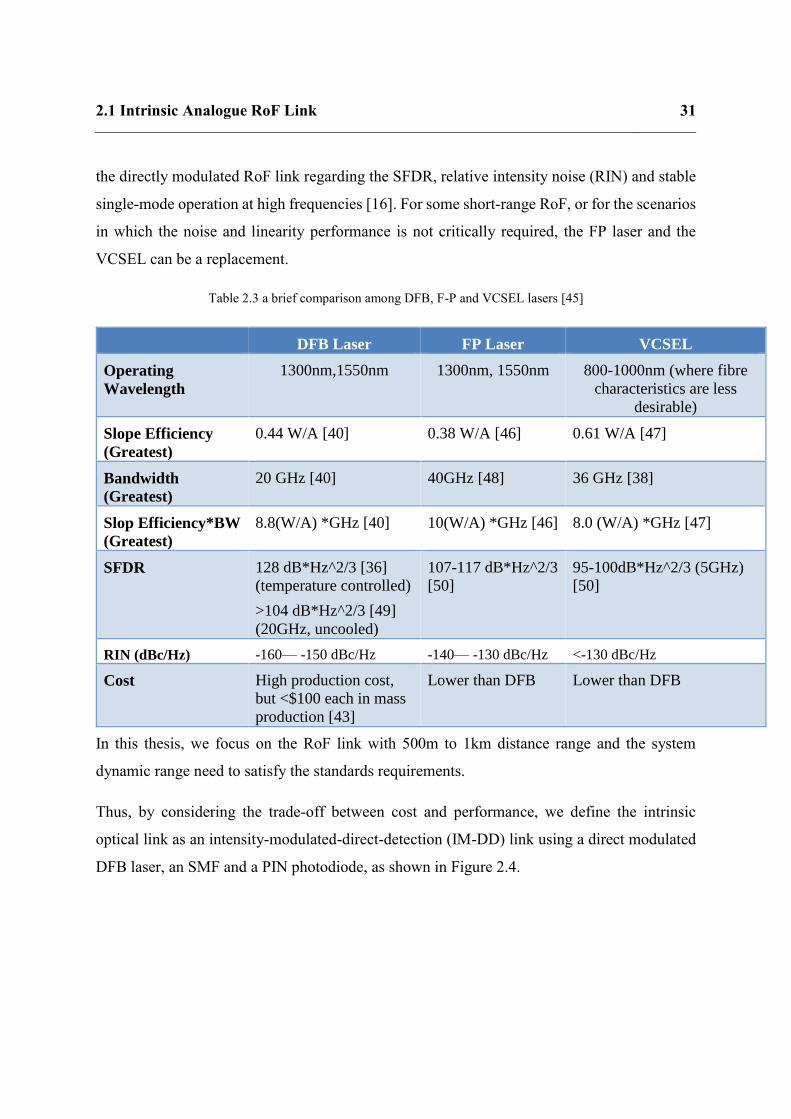
Table 2.3 a brief comparison among DFB, F-P and VCSEL lasers [44] ................................. 31
Table 2.4 3GPP defined EVM requirement for QAM in LTE PDSCH [52] [53] ................... 37
Table 2.5 EVM requirement for IEEE 802.11a/g legacy devics and 802.11n devices [54] .... 38
Table 2.6 Frequency distribution of IMD harmonics .............................................................. 43
Table 2.7 Previous researches in commercial analogue MIMO-enabled RoF systems ........... 49
Table 3.1 Symbols used from (3.7) to (3.20) ........................................................................... 65
Table 4.1 Detailed LTE frequency translation table in the UK when using DSB frequency
translation and 2.2GHz LO frequency [91] ............................................................................. 82
Table 4.2 Detailed LTE frequency translation table in the USA when using DSB frequency
translation and 2.2GHz LO frequency ..................................................................................... 83
Table 4.3 Detailed LTE frequency translation table in P. R. China when using DSB frequency
translation and 2.2GHz LO frequency [95, 96, 97] ................................................................. 85

10
Nomenclature
2G Second-generation wireless telephone technology
3G Third-generation wireless telephone technology
3GPP The 3rd Generation Partnership Project
4G Fourth-generation wireless telephone technology
64QAM 64 quadrature amplitude modulation
ADC Analogue to Digital Converter
AP Access point
APD Avalanche Photodiode
CW Continuous Wave
DAC Digital to Analogue Converter
DAS Distributed antenna system

11
DDAS Digitized Distributed Antenna System
DSB Double Sideband
DSP Digital Signal Processing
EDFA Erbium-doped fibre amplifier
EVM Error Vector Magnitude
FDD Frequency-division duplexing
FPGA Field Programmable Gate Array
GSM Global system for mobile
IF Intermediate Frequency
LO Local Oscillator
LoS Line-of-Sight
LTE Long-term evolution
MIMO Multiple-Input Multiple-Output
PoE Power over Ethernet
POI Point of Interface
QoS Quality of Service
RAU Remote Antenna Unit

12
RF Radio Frequency
RoF Radio over fibre
RRU Remote Radio Unit
SFDR Spurious-free Dynamic Range
SSB Single Sideband
TDD Time-division duplexing
UMTS Universal mobile telecommunication service
VNA Vector Network Analyser
VSG Vector Signal Generator
1.1 MIMO-enabled RoF for Indoor Wireless Coverage 13
Chapter 1 Introduction
1.1 MIMO-enabled RoF for Indoor Wireless Coverage
1.1.1 A brief historical background of modern wireless communication
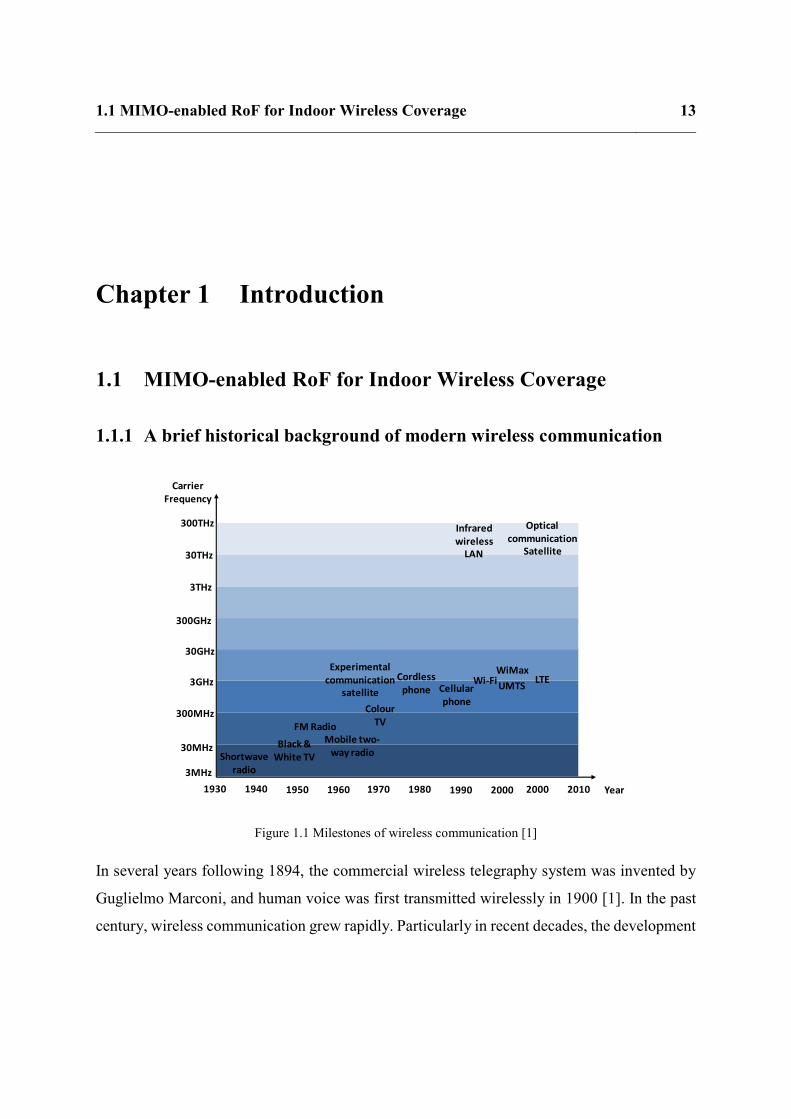
Figure 1.1 Milestones of wireless communication [1]
In several years following 1894, the commercial wireless telegraphy system was invented by
Guglielmo Marconi, and human voice was first transmitted wirelessly in 1900 [1]. In the past
century, wireless communication grew rapidly. Particularly in recent decades, the development
3MHz
30MHz
300MHz
3GHz
30GHz
300GHz
3THz
30THz
300THz
1930 1940 1950 1960 1970 1980 1990 2000 2000 2010
Shortwave radio
Black & White TV
FM RadioMobile two-
way radio
Colour TV
Experimental communication
satellite
Cordless phone Cellular
phone
Wi-FiWiMax
UMTS
Infrared wireless
LAN
Optical communication
Satellite
Carrier Frequency
Year
LTE
1.1 MIMO-enabled RoF for Indoor Wireless Coverage 14
of cellular networks has revolutionised many lives and is still experiencing fast growth. Figure
1.1 shows some of the milestones of the wireless communication.
In fact, the revolutionary change in wireless communication is happening in every decade, and
the overall trend of the development is to a higher frequency and higher data rate. Nowadays,
the wireless communication has been a critical part of people’s daily lives. Currently, there are
6.9 billion mobile cellular subscriptions worldwide [2].
Various of wireless standards have been defined and deployed rapidly to satisfy the demand on
the wireless capacity, including the 1st generation (1G) to the 4th generation (4G) cellular
networks and other wireless services, such as IEEE 802.11 series (Wi-Fi) and IEEE 802.16
series (WiMAX). After the cellular concept was raised by researchers in the Bell Laboratories
in the 1970s [1], the booming of cellular networks became one of the most revolutionary events
in human’s communication history.
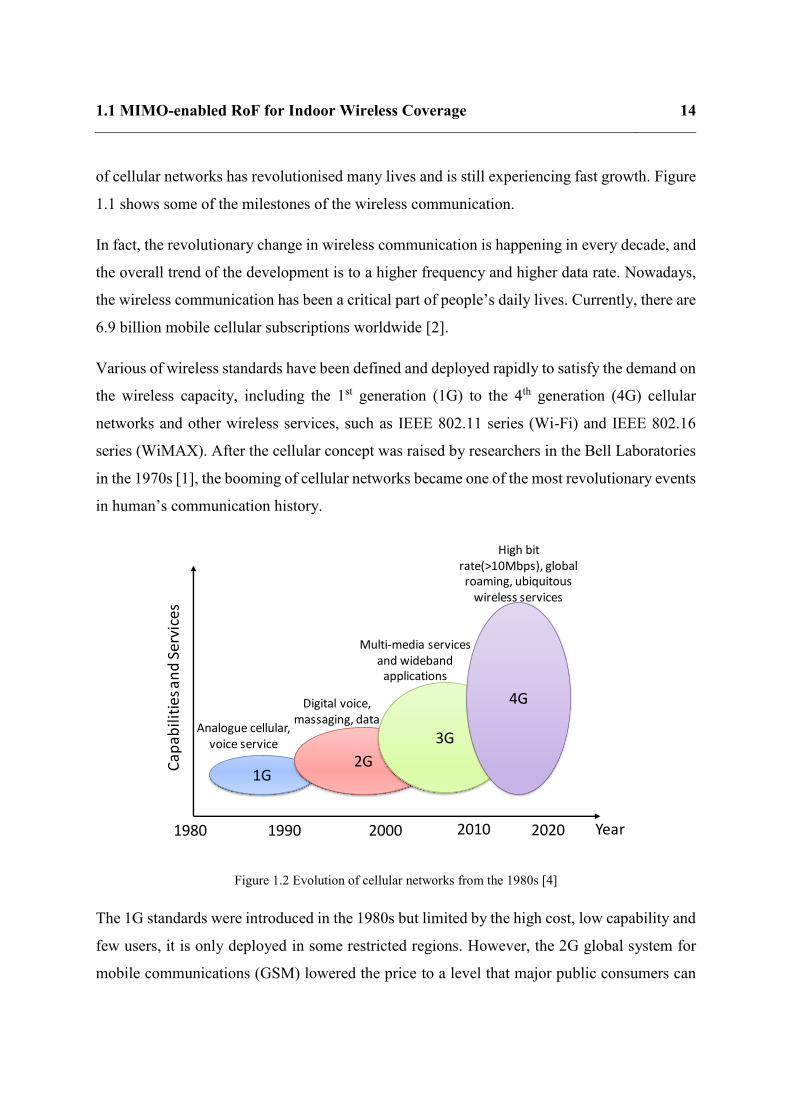
Figure 1.2 Evolution of cellular networks from the 1980s [4]
The 1G standards were introduced in the 1980s but limited by the high cost, low capability and
few users, it is only deployed in some restricted regions. However, the 2G global system for
mobile communications (GSM) lowered the price to a level that major public consumers can
Cap
abili
ties
an
d S
ervi
ces
Year1980 1990 2000 2010 2020
1G2G
3G
4G
Analogue cellular, voice service
Digital voice, massaging, data
Multi-media services and wideband
applications
High bit rate(>10Mbps), global roaming, ubiquitous
wireless services

1.1 MIMO-enabled RoF for Indoor Wireless Coverage 15
accept. Since then, the 2G networks have been spreading into all over the world [3]. Compared
with the analogue 1G services, the digital 2G services can support not only the voice
communication but also messaging and low-speed data services, as shown in Figure 1.2. At the
same period with the 2G network, the code-division multiple access (CDMA) has been
specified in Qualcomm® IS-95 and IS-2000 standards. These two standards have enhanced the
commercialisation of the 2G system [4].
To cope with the wideband multi-media data communication, a higher speed network was
developed. The wideband code division multiple access (WCDMA) became one of the key
technologies in the 3rd generation cellular network [4]. The first release of the 3GPP long-term
evolution (LTE) technology has been deployed as one of the key 4G candidate systems in 2009.
The 4G network can provide much higher data rate (>10Mbps) than previous generations of
cellular networks.
1.1.2 Need and challenges for indoor wireless coverage of MIMO signals
Figure 1.3: Cisco’s forecast on mobile data generated per month globally [5]
Following the 4G mobile deployment, an enormous amount of mobile data is now being made.
Cisco® predicts that by 2020, 30.6 Exabytes wireless data will be produced per month [5], as

1.1 MIMO-enabled RoF for Indoor Wireless Coverage 16
shown in Figure 1.3. And by 2020, the number of portable devices will be beyond 10 billion
and 40% of them will be smartphones (Figure 1.4). By 2018, 4G will make up 15% of
connections and 51% of total traffic [5]. In the 4G standards, such as long-term evolution (LTE)
and LTE-advanced, the use of MIMO techniques can increase data throughput and improve
transmission reliability without increasing the occupied spectrum.
Figure 1.4: Cisco’s forecast on global mobile device growth [5]
However, 80-90% of wireless data traffic originates in the indoor environments [6], where
propagation conditions are usually poor with a high degree of multipath. The users suffer from
a bad data connection or the drop of call in the inbuilding area. Non Line-of-sight (LoS)
propagation and high attenuation through the building structure seriously lower the quality of
service (QoS) for wireless services users inside buildings.
Therefore, it is necessary to find a cost-effective way to cover the indoor area by LTE and
MIMO services.

1.1 MIMO-enabled RoF for Indoor Wireless Coverage 17
1.1.3 Solutions for indoor wireless coverage
Various solutions have been developed to improve indoor wireless coverage, such as signal
repeaters, femtocells (or small cells), and distributed antenna systems (DAS).
The signal repeater is a straightforward and the lowest cost solution. It is a bi-directional
amplifier, which picks up and amplifies off-air downlink signals as signal sources, and also
delivers users’ uplink signal back to free space. However, the signal repeater can only provide
service via a line-of-sight radio link to a neighbouring macro base station, as shown in Figure
1.5. The signal quality of the repeater is poorer than the small cells and distributed antenna
systems. All these factors make the signal repeater unsuitable for most indoor environments,
for example, buildings with complicated structures and large stadiums/shopping malls with
high user density.
Figure 1.5: Architecture of a signal repeater [7]
The small cell delivers baseband signals from the operator core network to remote access
points (APs). Typically, there are two types of small cell structures.
Power
Repeater
Outdoor Antenna
Indoor Antenna
Portable Devices
Cellular Signals
Base Station
Repeater
Power Cable
1.1 MIMO-enabled RoF for Indoor Wireless Coverage 18
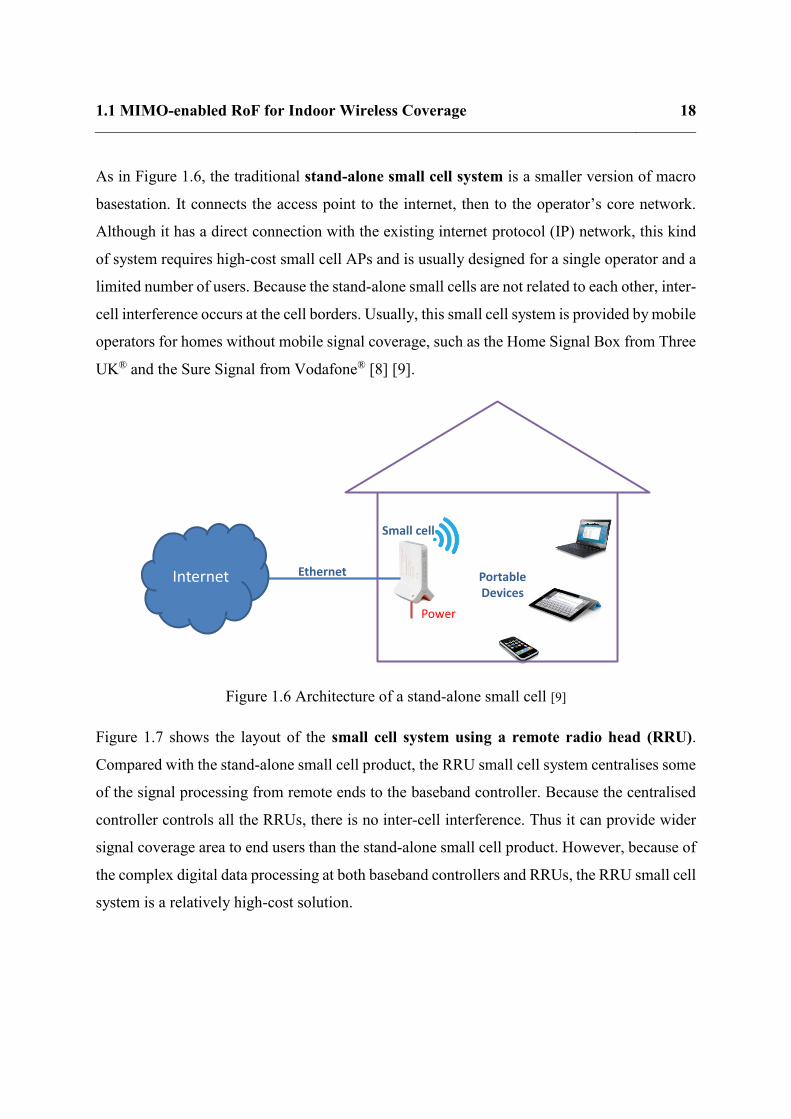
As in Figure 1.6, the traditional stand-alone small cell system is a smaller version of macro
basestation. It connects the access point to the internet, then to the operator’s core network.
Although it has a direct connection with the existing internet protocol (IP) network, this kind
of system requires high-cost small cell APs and is usually designed for a single operator and a
limited number of users. Because the stand-alone small cells are not related to each other, inter-
cell interference occurs at the cell borders. Usually, this small cell system is provided by mobile
operators for homes without mobile signal coverage, such as the Home Signal Box from Three
UK® and the Sure Signal from Vodafone® [8] [9].
Figure 1.6 Architecture of a stand-alone small cell [9]
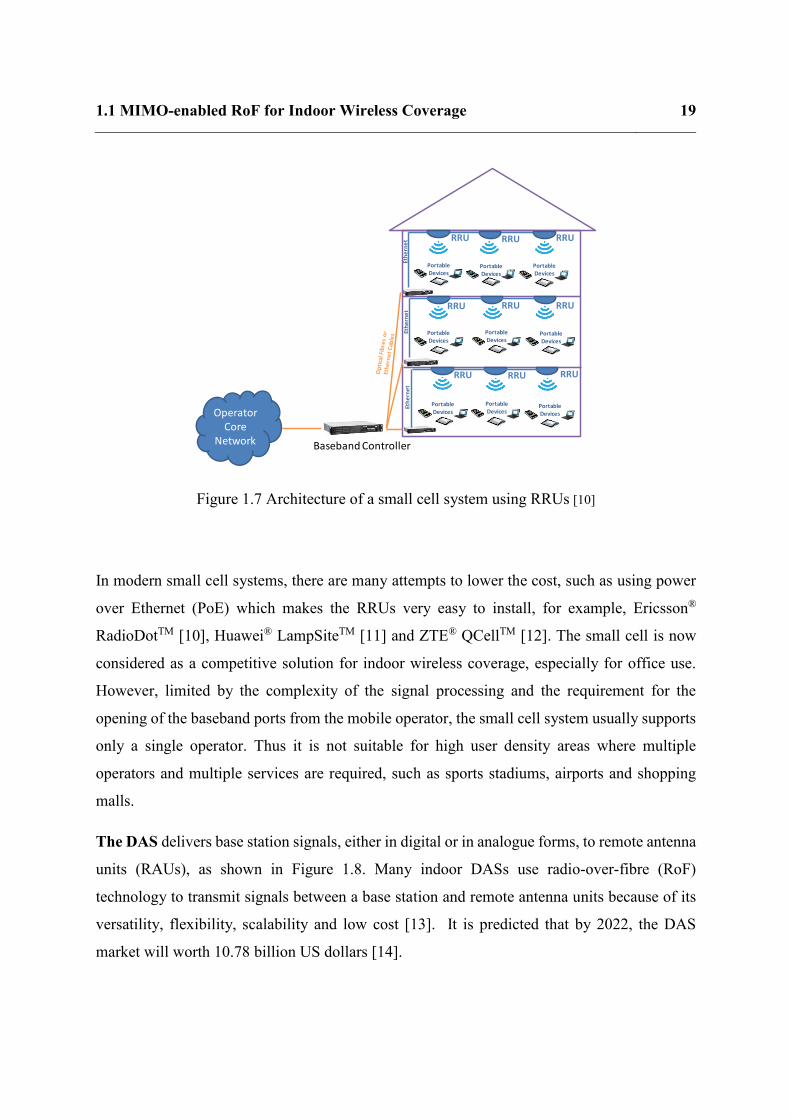
Figure 1.7 shows the layout of the small cell system using a remote radio head (RRU).
Compared with the stand-alone small cell product, the RRU small cell system centralises some
of the signal processing from remote ends to the baseband controller. Because the centralised
controller controls all the RRUs, there is no inter-cell interference. Thus it can provide wider
signal coverage area to end users than the stand-alone small cell product. However, because of
the complex digital data processing at both baseband controllers and RRUs, the RRU small cell
system is a relatively high-cost solution.
Ethernet Portable Devices
Internet
Power
Small cell
1.1 MIMO-enabled RoF for Indoor Wireless Coverage 19
Figure 1.7 Architecture of a small cell system using RRUs [10]
In modern small cell systems, there are many attempts to lower the cost, such as using power
over Ethernet (PoE) which makes the RRUs very easy to install, for example, Ericsson®
RadioDotTM [10], Huawei® LampSiteTM [11] and ZTE® QCellTM [12]. The small cell is now
considered as a competitive solution for indoor wireless coverage, especially for office use.
However, limited by the complexity of the signal processing and the requirement for the
opening of the baseband ports from the mobile operator, the small cell system usually supports
only a single operator. Thus it is not suitable for high user density areas where multiple
operators and multiple services are required, such as sports stadiums, airports and shopping
malls.
The DAS delivers base station signals, either in digital or in analogue forms, to remote antenna
units (RAUs), as shown in Figure 1.8. Many indoor DASs use radio-over-fibre (RoF)
technology to transmit signals between a base station and remote antenna units because of its
versatility, flexibility, scalability and low cost [13]. It is predicted that by 2022, the DAS
market will worth 10.78 billion US dollars [14].
Operator Core
Network
RRU RRU RRU
RRU RRU RRU
RRURRURRU
Portable Devices
Portable Devices
Portable Devices
Portable Devices
Portable Devices
Portable Devices
Portable Devices
Portable Devices
Portable Devices
Baseband Controller
Eth
ern
et
Eth
ern
et
Eth
ern
et

1.1 MIMO-enabled RoF for Indoor Wireless Coverage 20
Figure 1.8 Typical architecture of a DAS [15]
Figure 1.9 Typical Layout of a single link DAS: (a) Digital DAS; (b) Analogue DAS [16] [17]
RAU RAU RAU
RAU RAU RAU
RAURAURAU
Portable Devices
Portable Devices
Portable Devices
Portable Devices
Portable Devices
Portable Devices
Portable Devices
Portable Devices
Portable Devices
Primary Hub
Op
tica
l Fib
re
Base Station
Op
tica
l Fib
reO
pti
cal F
ibre
Optical Fibre
Secondary Hubs
FPGAADC
RF signal from base station
LO
IFFPGA DAC
LO
Recovered RF signal
IF
RAU
Optical Link
Hub
(a)
RF signal from base station
Recovered RF signal
Optical LinkPre-amplifier Post-amplifier
HubRAU
(b)

1.1 MIMO-enabled RoF for Indoor Wireless Coverage 21
Digital DAS (DDAS), as shown in Figure 1.9 (a), converts original base station RF signals into
a lower intermediate frequency (IF), and then digitises IF signals using an ADC. In some
DDASs, an FPGA follows the ADC to do digital data processing, such as data rate compression
[17] [18]. The digital data after the FPGA is then transmitted via optical links to the RAUs
where it is reconverted to the original basestation RF signal. Compared with analogue DASs,
the DDAS has larger tolerance to long distance RF performance degradation and is easy to be
controlled by system administrators, but the massive amount of data generated by sampling
base station signals make the DDAS approach hard to cope with very high capacity
applications, such as MIMO and future 5G network.
Analogue DASs, as shown in Figure 1.9 (b), transmit RF signals from base stations to RAUs
via a directly modulated optical link without any digitisation [19]. The simplicity makes the
analogue DAS low-cost and capable of handling large bandwidth signals. However, because
the signal quality can be degraded by the nonlinearity and noise of active devices in the
analogue DAS, such as such as power amplifiers and optical components in the link, the system
needs to be very carefully designed to make sure it has satisfactory RF performance.
Table 1.1 Comparison among different indoor signal coverage solutions
Repeater Stand-alone
Small Cell
RRU Small
Cell
Digital
DAS
Analogue
DAS
Coverage area Small Small Medium Large Large
Multi-operator No No No Yes Yes
Multi-service No No Yes Yes Yes
Capacity Low Medium High High High
Cost/m2 * High High Medium Medium Low
* Indicates the cost for large area signal coverage per remote unit per service.
Table 1.1 gives a brief comparison among different indoor signal coverage solutions. Repeaters
and stand-alone small cells are suitable for a single operator and small area coverage, such as

1.2 Thesis Scope 22
home use. Although RRU small cell and DDAS can be used for large area signal coverage,
because of the DSP complexity, they are high cost and not suitable for wide bandwidth and
multi-operator multi-service signal coverage. Especially when in the scenarios that MIMO RoF
is required, the huge data rate generated in the DDAS occupies wide optical bandwidth and
leads to high cost in digital signal processing and optical transceiver components. All these
reasons the make analogue DAS be a potential solution for next-generation indoor broadband
MIMO signal coverage.
In this thesis, the author will discuss the topics relating to transmitting broadband MIMO
signals using analogue DAS.
1.2 Thesis Scope
The aim of this dissertation is to study the challenges and solutions to the transmission of
MIMO signals over a single optical fibre in a low-cost and high-quality way for indoor
analogue distributed antenna systems.
Chapter 2 introduces fundamentals of a MIMO radio over fibre system. From an intrinsic RoF
link to the architecture of an analogue DAS, the implementation of a MIMO-enabled DAS is
illustrated. Technical challenges to build such a system and state-of-the-art of current solutions
are described.
Chapter 3 discusses a cost-effective MIMO radio over fibre system using double sideband
(DSB) frequency translation multiplexing scheme. Models have been built to simulate the link
performance and the origins of system noise, nonlinearity and crosstalk. Experiments have
been carried out to exam the system characteristics.
Chapter 4 extends the narrowband implementation in chapter 3 into a broadband solution.
Frequency bands of all the services to be transmitted over DAS have been investigated. In the
experiment, system EVM performance has been tested using commercial LTE bands. The

1.3 Novel Contributions 23
throughput of an IEEE 802.11n 2x2 MIMO signal is measured, showing that the system can
work under real-life conditions.
Chapter 5 theoretically and experimentally demonstrates that the DSB frequency translation
system can effectively improve the system 3rd order SFDR. If the number of sidebands is
increased, say to quadruple sidebands (QSB), the SFDR can be further improved. By using
DSB and QSB frequency translation, the system SFDR can be higher than the intrinsic optical
link itself. This research shows the potential to trade optical bandwidth for SFDR improvement.
Chapter 6 proposes a hybrid system using analogue and digital radio over fibre. By using the
hybrid system, the dynamic range of the SISO LTE service can be improved, so that fewer
number of RAUs are required for the LTE coverage. Compared with the pure analogue or pure
digital system, the hybrid system can lower the system cost.
The conclusions and potential future works are discussed in Chapter 7.
1.3 Novel Contributions
The novel contributions in this thesis are included below:
A simple power equaliser has been designed to make the DSB frequency translation system
capable of transmitting wideband LTE MIMO service over MMF optical link.
The broadband operation of a MIMO RoF system using DSB frequency translation
technique has been proposed and investigated, showing that by selecting certain LO
oscillator frequencies (for example, 2.2GHz in the UK), the original MIMO signal can
always be translated into the free spectrum over the DAS, giving the DSB frequency
translation system the capability to support broadband operation.
It is shown that the optical bandwidth of a RoF system can be traded for the SFDR. The
DSB frequency translation technique has been extended to a higher number of sidebands.

1.3 Novel Contributions 24
By using double sideband and quadruple sidebands frequency translation, it is shown that
the SFDR of an RoF link can be improved beyond the intrinsic optical link.
A hybrid analogue and digital radio over fibre system have been proposed and
demonstrated. The low-cost hybrid system has higher dynamic range than the traditional
analogue system and simpler DSP than the traditional system.
2.1 Intrinsic Analogue RoF Link 25
Chapter 2 Fundamentals of a Radio over Fibre
Systems and Literature Reviews
2.1 Intrinsic Analogue RoF Link
2.1.1 Benefits of using radio over fibre
The idea of analogue radio over fibre was introduced in the 1990s [20]. The analogue radio
over fibre system delivers the radio frequency (RF) microwave signals by modulating them
onto the lightwave carrier and transmitted over optical fibres. In this sense, the RoF link is
serving as an active RF waveguide. In recent decades, there has been an explosion in the
number of applications of analogue optical links. Compared with traditional microwave cables,
such as coaxial cables and twisted pairs, the optical fibre has many benefits, such as:
i) The smaller size and lighter weight: a conventional coated optical fibre has 250µm
diameter [21]. This allows the optical fibre links much easier to be installed and
maintained.
ii) Much wider bandwidth: The combination bandwidth of 850nm, 1310nm and
1550nm window is >50THz [22]. It allows systems’ multi-service and wide
bandwidth operation.
iii) Lower attenuation loss: The attenuation loss for a single mode fibre operating at
the 1550nm wavelength is 0.2dBo/km [23], which is much lower than the coaxial
cable loss. RG6 coaxial cable, for instance, has ~214dB/km loss at 1GHz frequency
[24].
2.1 Intrinsic Analogue RoF Link 26
All these properties make the optical link suitable for wide bandwidth RF transmission,
especially in long distance.
In the DAS, multiple wireless services from multiple operators are to be transmitted from the
centralised hub to remote units. The transmitting range is a few hundred metres to 1 kilometre,
depending on the size of the building. Compared with the passive DAS which uses coaxial
cables, the DAS using radio over fibre has higher bandwidth and can cover larger areas. It is
also easier to be installed and maintained.
2.1.2 The architecture of an intrinsic analogue RoF link
A. Detection of lightwave
To deliver RF signals over an optical link, the lightwave needs to be modulated and detected
using one of its parameters, such as amplitude (power), frequency or phase. Direct detection of
an intensity-modulated lightwave is straightforward using a photodiode [25]. The photodiode
has a square law characteristic, producing a photocurrent (Ipd), which is proportional to the
incident optical power (P) and its responsivity(R).
𝐼𝑝𝑑 = 𝑅𝑃
On the other hand, the detection of phase or frequency modulated lightwave needs a coherent
optical receiver [26]. Although coherent detection has higher sensitivity than direct detection
[27], it requires a much more complicated receiver structure than direct detection. Direct
detection performance can satisfy the performance requirement for current commercial mobile
services, as will be explained in the following chapters. Here, in this thesis, we use direct
intensity detection in the optical receiver.
The PIN photodiodes and avalanche photodiodes (APD) are two types of commonly used
photodiodes. A brief comparison between the InGaAs PIN photodiodes and the InGaAs APD
is shown in Table 2.1. Here the Si photodiodes are not included because the 1310nm and
1550nm wavelength windows are more widely used in the radio over fibre systems for indoor
DAS.

2.1 Intrinsic Analogue RoF Link 27
Table 2.1 Performance comparison between the PIN photodiode and the APD [28] [29]
InGaAs PIN photodiode InGaAs APD
Typical operating wavelength 1100 - 1700 nm 1100 - 1700 nm
Responsivity 0.5 – 0.8 A/W 0.5 – 0.8 A/W
Multiplication factor 1 20-400
RF bandwidth Up to 40GHz Up to 40GHz
Reverse bias voltage 5 – 10 V 25 – 400 V
Both the InGaAs PIN photodiode and the InGaAs APD have a wide optical bandwidth from
1100nm to 1700nm, meaning that if 1310 nm and the 1550 nm optical signals exist in the same
optical link, both of them can be detected by the same photodiode. In the radio-over-fibre
applications, the primary difference between the PIN photodiodes and APDs are the
multiplication factor and the reverse bias voltage.
The avalanche effect does not happen in the PIN photodiode. However, in the APDs, the
detected optical signal is converted into electrical signal and then amplified by the avalanche
effect, in which additional carriers are injected into an area with a high electrical field. The
carriers then collide with neutral semiconductor atoms generating other carriers. This collision
process repeats, again and again, giving the effectively amplified number of carriers in the free
carrier generation [30]. Therefore, compared with the PIN photodiode, the APD produces
multiplication factor giving additional gain. It can be used various of applications with high
sensitivity requirement [31].
However, the APDs require much higher reverse bias voltage than the PIN photodiodes [32],
meaning harder to be implemented in the DAS remote units. Moreover, as the APD
multiplication factor changes with the reverse bias voltage, the vibration in the power source
may affect the output RF performance. Therefore, a higher cost power source is required in an
APD system. The PIN photodiode, on the other hand, is much easier to be installed into a low
power system and has a lower cost than the APD. In this thesis, because the application is for

2.1 Intrinsic Analogue RoF Link 28
indoor wireless communication, in which the typical transmission distance is in hundred metre
range, we use the PIN photodiode in the intrinsic optical link.
B. Intensity modulation
Because direct intensity detection is used, the optical carrier must be modulated in intensity.
Broadly the optical intensity modulation can be categorised into two means - direct modulation
and external modulation [33], as shown in Figure 2.1.
Figure 2.1 Intensity modulation of RF signal over optical link: (a) Direct Modulation; (b)
External Modulation
Figure 2.2 Concept of direct modulation of a laser diode
Laser Diode
RF
(a)
Bias TDC
Optical Fibre
DC+RF
Intensity modulated lightwave
Laser Diode
(b)
DC External Intensity
ModulatorOptical Fibre
RF
Intensity modulated lightwaveCW
Laser diode forward bias current
(in linear unit)
Laser diode output power (in linear unit)
Ith
Electrical RF Signal
Modulated laser output
optical power
DC bias

2.1 Intrinsic Analogue RoF Link 29
In direct modulation (Figure 2.1(a)), a DC bias current is applied to the laser diode to make it
operate in the linear region, as shown in Figure 2.2. Usually, the highest dynamic range can be
achieved when the laser diode is biased at the middle point of the linear region. As shown in
Figure 2.2, in the linear region, laser diode output optical power follows to the variation of its
driving current. The electrical RF modulation signal is inside the linear region and produces a
modulated output optical signal. As the RF signal is directly applied to the laser diode, the
modulation signal must be within the laser’s modulation bandwidth, which can be limited by
the relaxation oscillation frequency [27] and chirping [28].
Figure 2.3 Concept of external intensity modulation
In external modulation (Figure 2.1(b)), the laser diode emits continuous wave (CW) light,
and the modulation is done in an external optical modulation device, such as a Mach-Zehnder
Modulator (MZM) or Electro-absorption (EA) modulator. As shown in Figure 2.4, if the MZM
is biased at the Vpi/2, it has an approximately linear transfer function which does not rely on
the laser diode modulation frequency. The output optical intensity follows the MZM driving
voltage. In the external modulation, the modulation bandwidth is not limited by the laser diode
MZM bias voltage (Vbias)
MZM transfer function(Pout/Pin )
Vpi

2.1 Intrinsic Analogue RoF Link 30
relaxation frequency. Therefore, compared with the direct modulation, the external modulation
has higher modulation bandwidth.
A brief comparison between the direct modulation and the external modulation has been shown
in Table 2.2. The external modulation has advantages over the direct modulation regarding RF
noise figure, SFDR and bandwidth. However, in the external modulation, an additional optical
component is required, so it has a higher cost than the direct modulation.
Table 2.2 Comparison between direct modulation and external modulation
Direct Modulation External Modulation
Modulate in electric domain Modulate in optical domain
Lowest Noise Figure 17.8 dB [34] 2.5 dB [35]
Greatest SFDR 128 dB*Hz-2/3 [36] 132 dB*Hz-2/3 [37]
Bandwidth 20GHz to 40GHz depends
on laser [38] [39] [40]
MZM:70GHz [41]
EA: 60GHz [42]
Complexity Simple Complex
Cost Cheap Expensive needs optical
modulator
C. Laser diodes for direct modulation
Nowadays, the development of semiconductor lasers enables the direct modulation at high
frequencies. It has been reported that the modulation bandwidth of a distributed feedback
(DFB) laser can be 35GHz [40] and this is enough for current commercial wireless services.
And the cost for a packaged DFB laser has been lowered to less than a hundred dollars in mass
production [43].
A brief comparison among the DFB, Fabry-Perot and vertical-cavity surface-emitting
(VCSEL) laser has been shown in Table 2.3 [44]. The DFB laser is a preferable type laser in
2.1 Intrinsic Analogue RoF Link 31
the directly modulated RoF link regarding the SFDR, relative intensity noise (RIN) and stable
single-mode operation at high frequencies [16]. For some short-range RoF, or for the scenarios
in which the noise and linearity performance is not critically required, the FP laser and the
VCSEL can be a replacement.
Table 2.3 a brief comparison among DFB, F-P and VCSEL lasers [45]
DFB Laser FP Laser VCSEL
Operating
Wavelength
1300nm,1550nm 1300nm, 1550nm 800-1000nm (where fibre
characteristics are less
desirable)
Slope Efficiency
(Greatest)
0.44 W/A [40] 0.38 W/A [46] 0.61 W/A [47]
Bandwidth
(Greatest)
20 GHz [40] 40GHz [48] 36 GHz [38]
Slop Efficiency*BW
(Greatest)
8.8(W/A) *GHz [40] 10(W/A) *GHz [46] 8.0 (W/A) *GHz [47]
SFDR 128 dB*Hz^2/3 [36]
(temperature controlled)
>104 dB*Hz^2/3 [49]
(20GHz, uncooled)
107-117 dB*Hz^2/3
[50]
95-100dB*Hz^2/3 (5GHz)
[50]
RIN (dBc/Hz) -160— -150 dBc/Hz -140— -130 dBc/Hz <-130 dBc/Hz
Cost High production cost,
but <$100 each in mass
production [43]
Lower than DFB Lower than DFB
In this thesis, we focus on the RoF link with 500m to 1km distance range and the system
dynamic range need to satisfy the standards requirements.
Thus, by considering the trade-off between cost and performance, we define the intrinsic
optical link as an intensity-modulated-direct-detection (IM-DD) link using a direct modulated
DFB laser, an SMF and a PIN photodiode, as shown in Figure 2.4.

2.2 Performance Measurement of a RoF Link 32
Figure 2.4 Intrinsic analogue radio over fibre link
D. Fibre Path
The single mode (SMF) fibre and the multi-mode fibre (MMF) are two commonly used types
of optical fibres. Both types of fibres typically have 125 µm outer diameter which is similar to
the size of the human hairs. The single-mode fibre has typically 9 µm core diameter which
allows the light to be transmitted in only in the fundamental mode, while other modes are
removed. However, the multi-mode fibre has a larger core (typically 50 µm or 62.5 µm) so that
multiple modes can be transmitted [51].
Theoretically, the multimode fibre has better light gathering ability than the single mode fibre.
However, the severe dispersion problem in the MMF make it hard to be used in the long-
distance transmission, and the RF bandwidth can be limited by the dispersion effect. The
MMFs are easier to be manufactured than the SMFs, so have a lower price, although compared
with other parts of the system and the engineering cost, the price of the optical fibres is
negligible. Historically, many buildings’ ethernet backbones use MMFs, so it is still
meaningful to do RoF over the MMF in some scenarios. Because of SMFs’ higher bandwidth
* distance product, the single mode fibres are preferred in the new infrastructures [52].
2.2 Performance Measurement of a RoF Link
2.2.1 Link intrinsic gain
The power of the intrinsic RoF link (the LD-Fibre-PD link) is defined as the ratio between the
output RF power at the load following the photodiode and the input RF power to be modulated
Laser Diode
RF
Bias TDC
PhotodiodeOptical Fibre
DC+RF RF+DC

2.2 Performance Measurement of a RoF Link 33
at the RoF link input (direct modulated onto the laser diode). The intrinsic link power gain is
usually negative and dominated by the electrical to optical (E/O) conversion loss and the optical
to electrical (O/E) conversion loss. A comprehensive analysis can be carried out using the small
signal model as shown in Figure 2.5.
Figure 2.5 Small signal model of the intrinsic RoF link [16]
A DC-biased RF signal source (Vs) with impedance Rs is input into an impedance matching
circuit and then to a laser diode. There is voltage loss, because of the impedance mismatch
between RL and RS. Assuming the laser diode has slope efficiency Sl (W/A) and the photodiode
has responsitivity rd (A/W), the current and the voltage across the load are:
𝑖𝑜𝑢𝑡 =𝑉𝑠
𝑅𝑠+𝑅𝑀𝑎𝑡𝑐ℎ+𝑅𝐿𝑠𝑙𝑟𝑑 (2.1)
𝑣𝑜𝑢𝑡 =𝑉𝑠
𝑅𝑠+𝑅𝑀𝑎𝑡𝑐ℎ+𝑅𝐿𝑠𝑙𝑟𝑑𝑅𝐿𝑜𝑎𝑑 (2.2)
Considering the input side,
𝑖𝑖𝑛 =𝑉𝑠
𝑅𝑠+𝑅𝑀𝑎𝑡𝑐ℎ+𝑅𝐿 (2.3)
𝑣𝑖𝑛 = 𝑉𝑠 (2.4)
The intrinsic power gain of the link yields,
RS RMatch
RL
RLoad
slrd
VS
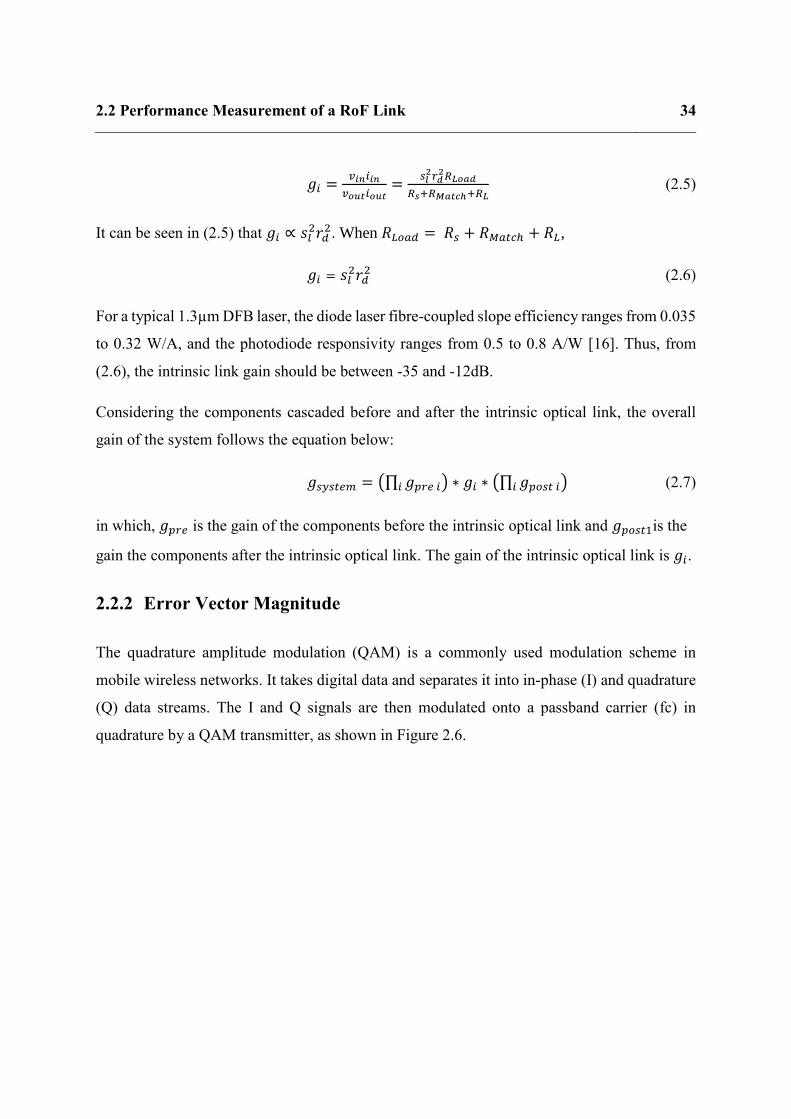
2.2 Performance Measurement of a RoF Link 34
𝑔𝑖 =𝑣𝑖𝑛𝑖𝑖𝑛
𝑣𝑜𝑢𝑡𝑖𝑜𝑢𝑡=
𝑠𝑙2𝑟𝑑
2𝑅𝐿𝑜𝑎𝑑
𝑅𝑠+𝑅𝑀𝑎𝑡𝑐ℎ+𝑅𝐿 (2.5)
It can be seen in (2.5) that 𝑔𝑖 ∝ 𝑠𝑙2𝑟𝑑
2. When 𝑅𝐿𝑜𝑎𝑑 = 𝑅𝑠 + 𝑅𝑀𝑎𝑡𝑐ℎ + 𝑅𝐿,
𝑔𝑖 = 𝑠𝑙2𝑟𝑑
2 (2.6)
For a typical 1.3µm DFB laser, the diode laser fibre-coupled slope efficiency ranges from 0.035
to 0.32 W/A, and the photodiode responsivity ranges from 0.5 to 0.8 A/W [16]. Thus, from
(2.6), the intrinsic link gain should be between -35 and -12dB.
Considering the components cascaded before and after the intrinsic optical link, the overall
gain of the system follows the equation below:
𝑔𝑠𝑦𝑠𝑡𝑒𝑚 = (∏ 𝑔𝑝𝑟𝑒 𝑖𝑖 ) ∗ 𝑔𝑖 ∗ (∏ 𝑔𝑝𝑜𝑠𝑡 𝑖𝑖 ) (2.7)
in which, 𝑔𝑝𝑟𝑒 is the gain of the components before the intrinsic optical link and 𝑔𝑝𝑜𝑠𝑡1is the
gain the components after the intrinsic optical link. The gain of the intrinsic optical link is 𝑔𝑖.
2.2.2 Error Vector Magnitude
The quadrature amplitude modulation (QAM) is a commonly used modulation scheme in
mobile wireless networks. It takes digital data and separates it into in-phase (I) and quadrature
(Q) data streams. The I and Q signals are then modulated onto a passband carrier (fc) in
quadrature by a QAM transmitter, as shown in Figure 2.6.

2.2 Performance Measurement of a RoF Link 35
Figure 2.6 Typical layout for a QAM transmitter
The QAM receiver (Figure 2.7), takes the QAM signal and demodulates it by multiplying it
with two sine waves with the 90-degree phase difference. A low-pass filter is then used to
obtain the baseband information.
Because the QAM uses the phase of the signal, it has high spectrum efficiency, and it is
included in many wireless standards, such as IEEE 802.11 series and 3G/4G cellular standards.
Figure 2.7 Typical layout for a QAM receiver
The demodulated QAM signal can be shown in a constellation diagram. Because of the noise
and interference, the demodulated signal does not necessarily locate to the position of the
reference constellation point. The shift between the demodulated QAM signal and the ideal
constellation point results in an error vector. The average amplitude of the error vector
(normalised to the ideal symbol vector) is the EVM (Figure 2.8), which can be expressed in the
equation below:
𝐸𝑉𝑀(%) = √1
𝑁∑
|𝐸𝑟𝑟𝑜𝑟 𝑉𝑒𝑐𝑡𝑜𝑟|2
|𝐼𝑑𝑒𝑎𝑙 𝑆𝑦𝑚𝑏𝑜𝑙 𝑉𝑒𝑐𝑡𝑜𝑟 |2𝑁𝑛=1 × 100% (2.8)
Data stream
Flow splitter
Impulse Generator
Impulse Generator
Transmitter Filter
Transmitter Filter
cos (2*pi*fc*t)
-sin (2*pi*fc*t)
QAM Signal
QAM Signal
cos (2*pi*fc*t)
-sin (2*pi*fc*t)
Low pass filter
Low pass filter
Receiver Filter
Receiver Filter
A/D
A/D
Flow merger
RecoveredData
stream

2.2 Performance Measurement of a RoF Link 36
In an analogue RoF system, the signal’s EVM directly relates to the signal to noise and
interference ratio (SNIR) at the receiving end [49]:
𝐸𝑉𝑀(%) = √1
𝑠𝑛𝑖𝑟(1) (2.9)
Figure 2.8 Error vector magnitude
Figure 2.9 Constellation diagrams with (a) low EVM; (b) high EVM (measured by a vector signal analyser in
the experiment)
I
Q
Measured Symbol
Ideal Symbol Error Vector=Measured Symbol-Ideal Symbol
(a) (b)
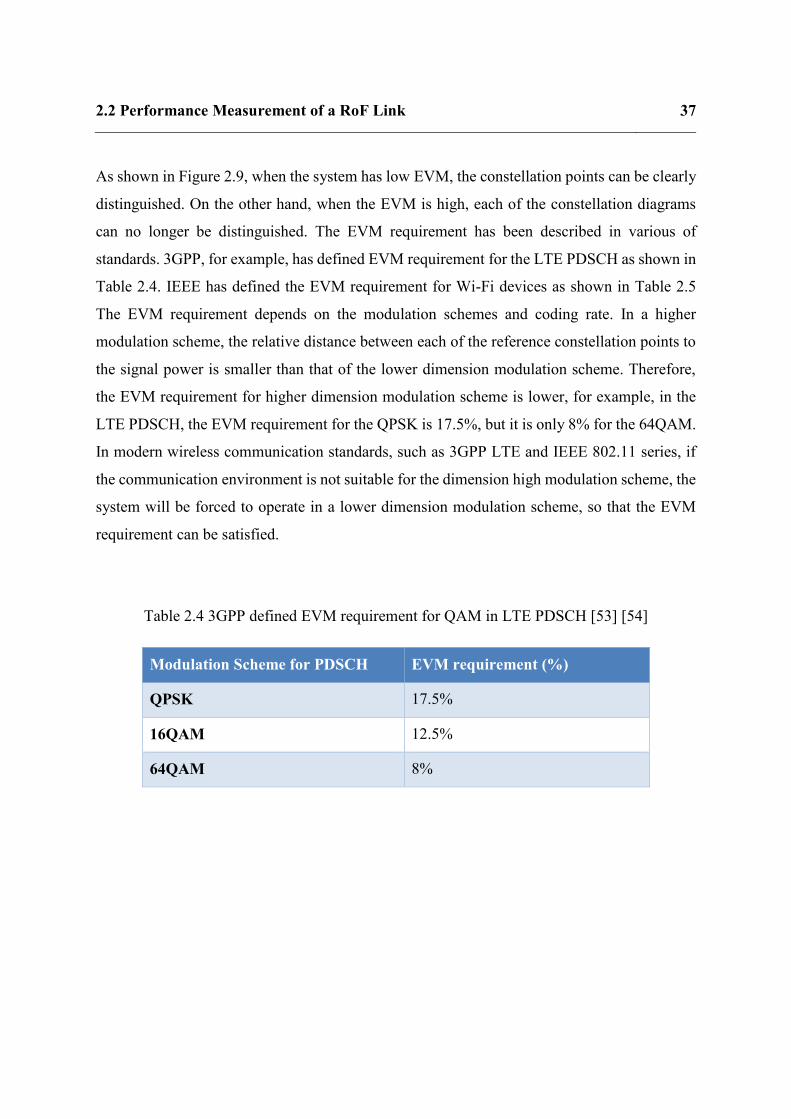
2.2 Performance Measurement of a RoF Link 37
As shown in Figure 2.9, when the system has low EVM, the constellation points can be clearly
distinguished. On the other hand, when the EVM is high, each of the constellation diagrams
can no longer be distinguished. The EVM requirement has been described in various of
standards. 3GPP, for example, has defined EVM requirement for the LTE PDSCH as shown in
Table 2.4. IEEE has defined the EVM requirement for Wi-Fi devices as shown in Table 2.5
The EVM requirement depends on the modulation schemes and coding rate. In a higher
modulation scheme, the relative distance between each of the reference constellation points to
the signal power is smaller than that of the lower dimension modulation scheme. Therefore,
the EVM requirement for higher dimension modulation scheme is lower, for example, in the
LTE PDSCH, the EVM requirement for the QPSK is 17.5%, but it is only 8% for the 64QAM.
In modern wireless communication standards, such as 3GPP LTE and IEEE 802.11 series, if
the communication environment is not suitable for the dimension high modulation scheme, the
system will be forced to operate in a lower dimension modulation scheme, so that the EVM
requirement can be satisfied.
Table 2.4 3GPP defined EVM requirement for QAM in LTE PDSCH [53] [54]
Modulation Scheme for PDSCH EVM requirement (%)
QPSK 17.5%
16QAM 12.5%
64QAM 8%
2.3 Architecture of an Analogue SISO DAS 38
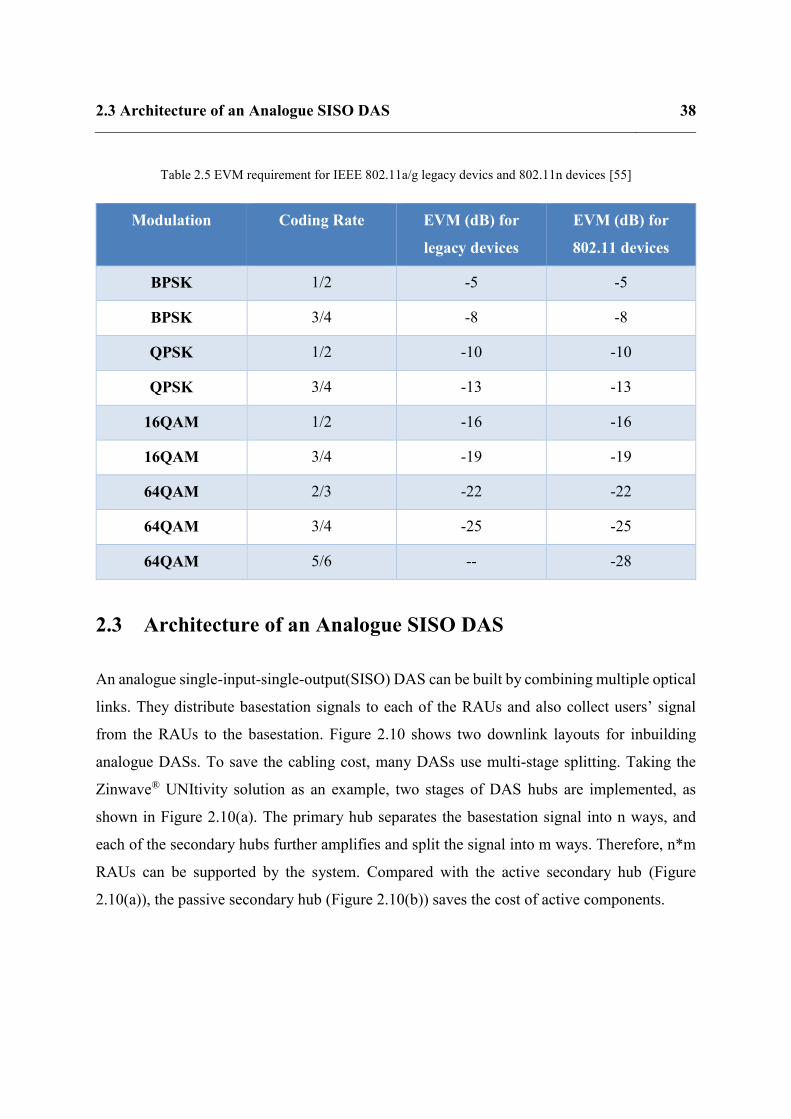
Table 2.5 EVM requirement for IEEE 802.11a/g legacy devics and 802.11n devices [55]
Modulation Coding Rate EVM (dB) for
legacy devices
EVM (dB) for
802.11 devices
BPSK 1/2 -5 -5
BPSK 3/4 -8 -8
QPSK 1/2 -10 -10
QPSK 3/4 -13 -13
16QAM 1/2 -16 -16
16QAM 3/4 -19 -19
64QAM 2/3 -22 -22
64QAM 3/4 -25 -25
64QAM 5/6 -- -28
2.3 Architecture of an Analogue SISO DAS
An analogue single-input-single-output(SISO) DAS can be built by combining multiple optical
links. They distribute basestation signals to each of the RAUs and also collect users’ signal
from the RAUs to the basestation. Figure 2.10 shows two downlink layouts for inbuilding
analogue DASs. To save the cabling cost, many DASs use multi-stage splitting. Taking the
Zinwave® UNItivity solution as an example, two stages of DAS hubs are implemented, as
shown in Figure 2.10(a). The primary hub separates the basestation signal into n ways, and
each of the secondary hubs further amplifies and split the signal into m ways. Therefore, n*m
RAUs can be supported by the system. Compared with the active secondary hub (Figure
2.10(a)), the passive secondary hub (Figure 2.10(b)) saves the cost of active components.

2.3 Architecture of an Analogue SISO DAS 39
Figure 2.10 Typical downlink layout of an in-building analogue DAS: (a) active secondary hub; (b) passive
secondary hub
Signal Flow
RAUs
1:8
ele
ctri
cal
split
ter
Secondary Hub
(a)
Base station
Primary Hub
Elec
tric
al
split
ter
1:8
op
tica
l co
up
ler
Signal FlowRAUs
Secondary Hub
(b)
Base station
Primary Hub
Elec
tric
al
split
ter
2.4 Challenges to Implement DAS and Integrate MIMO Services into an
Analogue DAS
40
2.4 Challenges to Implement DAS and Integrate MIMO
Services into an Analogue DAS
Currently, the DAS has been one of the most commonly used solutions to cover and extend
wireless services in large venues like shopping malls, stadiums, undergrounds, airports. Soon,
the DAS will be more implemented in areas such as universities, healthcare, multi-functional
buildings, and in urban areas for offloading data traffic.
As a service-agnostic system, the DAS needs to transmit all different services to users within
one infrastructure. Nowadays, there is a range of wireless services and services providers, such
as 3G/4G cellular services (O2, 3, Vodafone, …), Wi-Fi, public safety and others. All these
services and service providers use different standards and occupy different frequency bands.
Delivering these various things together to users become one of the key challenges to the DAS.
To do this, the DAS needs to be broadband, covering all frequency bands from 700MHz to
3.5GHz [56]. In a future 5G network, this frequency range may be extended up to 80GHz [57].
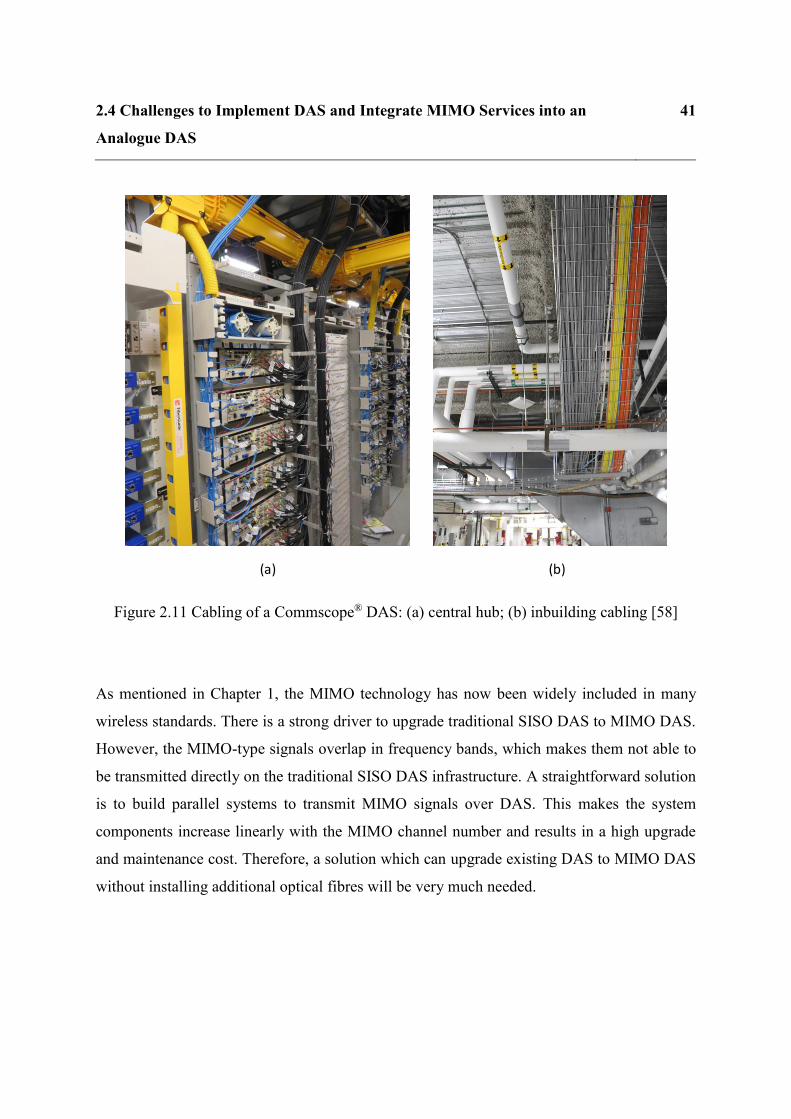
From a business perspective, the cost and complexity is a challenge to DAS deployment. The
installation of a DAS requires long optical fibres and power supplies at each of the RAUs. The
cabling from the central unit to the RAUs is complicated (as shown in Figure 2.11) and the
installation cost can be enormous. Due to the complicity of the system and the lack of ready
solutions for rack elevation drawings, cabling installation guidance, and other system design
elements, the installation of a DAS needs experienced RF engineers and technicians.
2.4 Challenges to Implement DAS and Integrate MIMO Services into an
Analogue DAS
41
Figure 2.11 Cabling of a Commscope® DAS: (a) central hub; (b) inbuilding cabling [58]
As mentioned in Chapter 1, the MIMO technology has now been widely included in many
wireless standards. There is a strong driver to upgrade traditional SISO DAS to MIMO DAS.
However, the MIMO-type signals overlap in frequency bands, which makes them not able to
be transmitted directly on the traditional SISO DAS infrastructure. A straightforward solution
is to build parallel systems to transmit MIMO signals over DAS. This makes the system
components increase linearly with the MIMO channel number and results in a high upgrade
and maintenance cost. Therefore, a solution which can upgrade existing DAS to MIMO DAS
without installing additional optical fibres will be very much needed.
(a) (b)

2.4 Challenges to Implement DAS and Integrate MIMO Services into an
Analogue DAS
42
2.4.1 Nonlinearity
A. The 2nd and the 3rd order intermodulation products
The linearity of the RoF is a critical parameter, which influences the system dynamic range.
The nonlinearity of a RoF link can cause intermodulation distortion (IMD), and unwanted RF
harmonics will be generated. Nonlinear products can make the system RF performance degrade
significantly [59].
Figure 2.12 Frequency distribution of 2nd and 3rd order IMD products
Assuming there are two pure sine waves (f1 and f2) at the input of a nonlinear system, at the
system’s output, the spectrum consists of fundamental tones (f1, f2) and high order IMD
products.
Figure 2.12 shows the frequency spectrum at the output of the nonlinear system with
fundamental tones and the second order and the third order distortion harmonics. The
fundamental tone appears at the same frequency as the input signals, but the 2nd order and 3rd
order harmonics appear at the following frequencies, as shown in Table 2.6.
2nd order IMD Products
3rd order IMD Products
f2-f
1
2f1
-f2
2f2
-f1
f1 f2
2f1
2f2
f1+f
2
3f1
3f2
2f1
+f2
2f2
+f1
Fundamental Tones
2.4 Challenges to Implement DAS and Integrate MIMO Services into an
Analogue DAS
43
Table 2.6 Frequency distribution of IMD harmonics
Harmonic
order
m n frequencies
2 -1 1 -f1+f2
0 2 2f2
1 1 f1+f2
2 0 2f1
3 -1 2 -f1+2f2
0 3 3f2
1 2 f1+2f2
2 -1 2f1-f2
2 1 2f1+f2
3 0 3f1
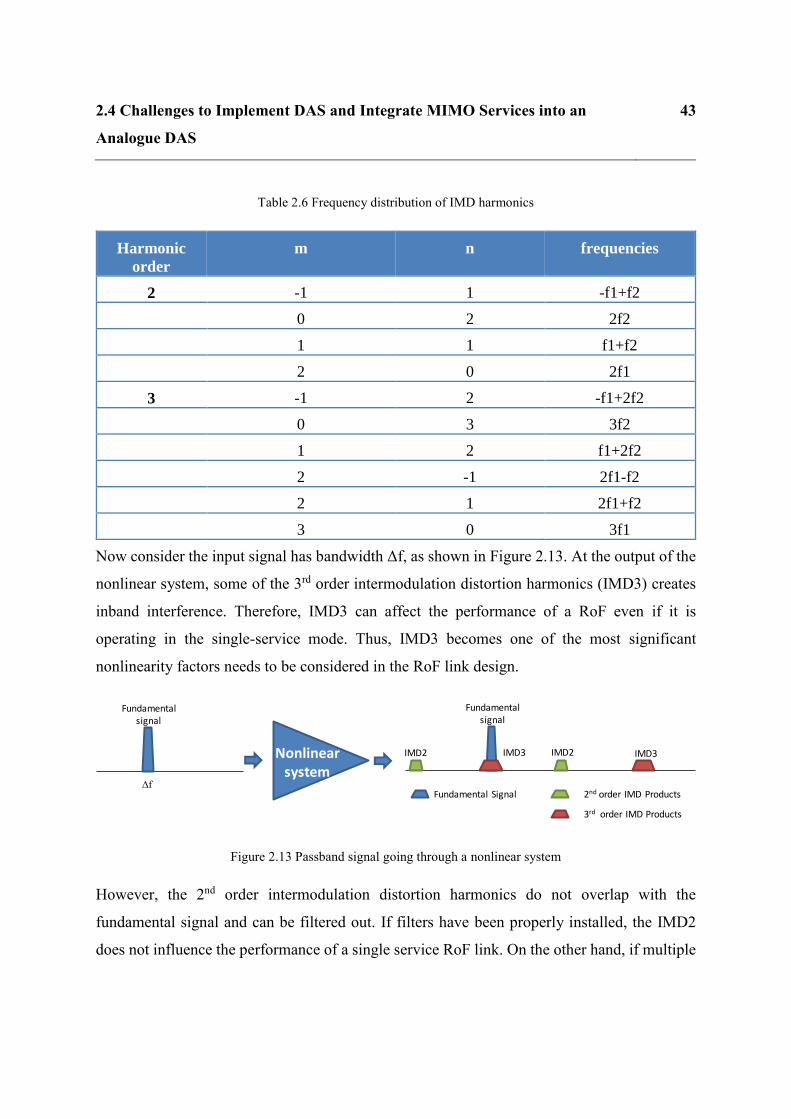
Now consider the input signal has bandwidth Δf, as shown in Figure 2.13. At the output of the
nonlinear system, some of the 3rd order intermodulation distortion harmonics (IMD3) creates
inband interference. Therefore, IMD3 can affect the performance of a RoF even if it is
operating in the single-service mode. Thus, IMD3 becomes one of the most significant
nonlinearity factors needs to be considered in the RoF link design.
Figure 2.13 Passband signal going through a nonlinear system
However, the 2nd order intermodulation distortion harmonics do not overlap with the
fundamental signal and can be filtered out. If filters have been properly installed, the IMD2
does not influence the performance of a single service RoF link. On the other hand, if multiple
2nd order IMD Products
3rd order IMD Products
Fundamental signal
Fundamental Signal
IMD2IMD2 IMD3
Fundamental signal
Δf
Nonlinear system
IMD3
2.4 Challenges to Implement DAS and Integrate MIMO Services into an
Analogue DAS
44
services need to be supported in the RoF link, the 2nd order harmonics of one service can
overlap with the frequency bands of the other services.
As many RoF systems are designed for multiple-service operation, the linearity requirements
need to be satisfied in a wide range of frequencies [60].
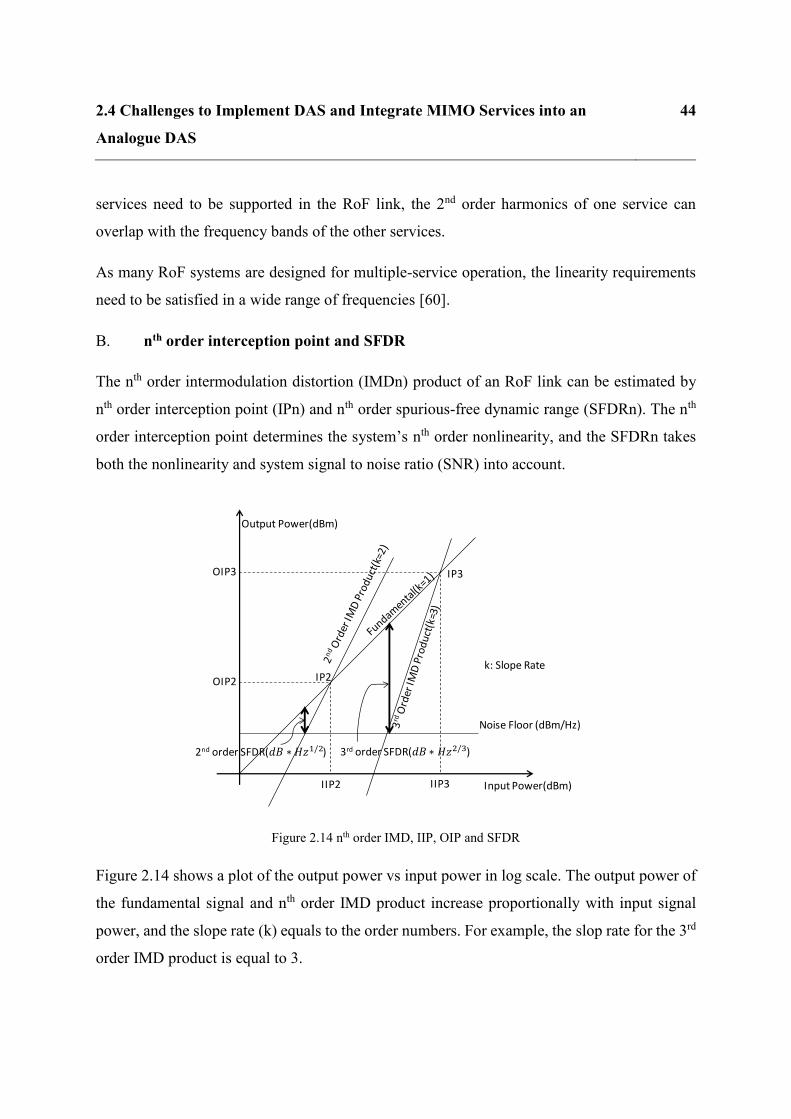
B. nth order interception point and SFDR
The nth order intermodulation distortion (IMDn) product of an RoF link can be estimated by
nth order interception point (IPn) and nth order spurious-free dynamic range (SFDRn). The nth
order interception point determines the system’s nth order nonlinearity, and the SFDRn takes
both the nonlinearity and system signal to noise ratio (SNR) into account.
Figure 2.14 nth order IMD, IIP, OIP and SFDR
Figure 2.14 shows a plot of the output power vs input power in log scale. The output power of
the fundamental signal and nth order IMD product increase proportionally with input signal
power, and the slope rate (k) equals to the order numbers. For example, the slop rate for the 3rd
order IMD product is equal to 3.
Input Power(dBm)
Output Power(dBm)
Noise Floor (dBm/Hz)
OIP3
OIP2
IIP3IIP2
2nd order SFDR( ∗ 1 2) 3rd order SFDR( ∗ 2 )
IP3
IP2k: Slope Rate

2.5 State-of-the-Arts of MIMO-enabled RoF System 45
IPn is defined as the crossing point between the nth order IMD product curve and the
fundamental signal power curve. IIPn and OIPn are respectively defined as the input power
and the output power at the nth order interception point.
SFDRn is defined as the power difference between the fundamental signal and the nth order
IMD product when the power of the nth order IMD product equals to system output noise floor
(per Hz).
2.5 State-of-the-Arts of MIMO-enabled RoF System
2.5.1 Interleaved MIMO DAS and co-located MIMO DAS
The MIMO DAS can be broadly categorised into interleaved MIMO DAS and co-located
MIMO DAS. The interleaved DAS (Figure 2.15(a)) separates MIMO antennas by relatively
large distance (at least a few metres), and each of the MIMO antennas work with each other.
The MIMO services can achieve nearly full MIMO performance at the overlapped areas among
MIMO antennas [61]. The Co-located MIMO DAS (Figure 2.15(b)), on the other hand, place
MIMO antenna from each channel at every RAU, so that MIMO service can be achieved in all
signal coverage areas.
Because there is only one signal channel to be transmitted to the interleaved MIMO DAS
RAUs, while there are multiple MIMO signal channels to be transmitted to the co-located DAS
RAU, the interleaved DAS has relatively lower cost than the co-located DAS. However,
previous research [62, 63] have shown that the co-located MIMO DAS has better QoS than
interleaved DAS. Practically, the co-located MIMO DAS can offer better MIMO signal
coverage than the interleaved DAS. Moreover, in the future mobile wireless network, large
scale MIMO is desirable to provide users with large capacity [64]. It is meaningful to
investigate the methods to deliver MIMO signals over co-located DAS. Therefore, the co-
located DAS is the structure we discuss in this thesis.
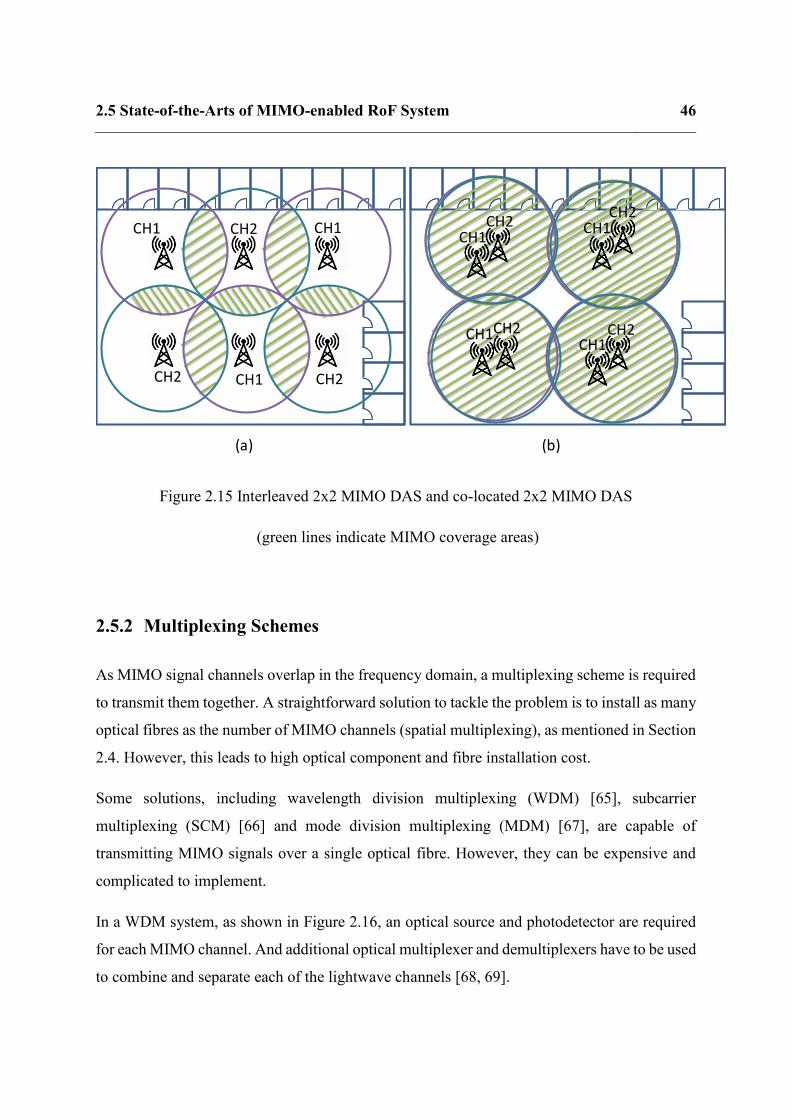
2.5 State-of-the-Arts of MIMO-enabled RoF System 46
Figure 2.15 Interleaved 2x2 MIMO DAS and co-located 2x2 MIMO DAS
(green lines indicate MIMO coverage areas)
2.5.2 Multiplexing Schemes
As MIMO signal channels overlap in the frequency domain, a multiplexing scheme is required
to transmit them together. A straightforward solution to tackle the problem is to install as many
optical fibres as the number of MIMO channels (spatial multiplexing), as mentioned in Section
2.4. However, this leads to high optical component and fibre installation cost.
Some solutions, including wavelength division multiplexing (WDM) [65], subcarrier
multiplexing (SCM) [66] and mode division multiplexing (MDM) [67], are capable of
transmitting MIMO signals over a single optical fibre. However, they can be expensive and
complicated to implement.
In a WDM system, as shown in Figure 2.16, an optical source and photodetector are required
for each MIMO channel. And additional optical multiplexer and demultiplexers have to be used
to combine and separate each of the lightwave channels [68, 69].
CH1
CH1
CH1CH2
CH2 CH2
CH1CH2
CH1CH1
CH2
CH1CH2
CH2
(a) (b)

2.5 State-of-the-Arts of MIMO-enabled RoF System 47
Figure 2.16 Typical Layout for a WDM RoF system
In an SCM system [66], as shown in Figure 2.17, each of the MIMO channels is shifted into
different frequency bands by local oscillators (LO) and mixers. n-1 LOs are required for n
MIMO signal channels.
Figure 2.17 Typical layout of an SCM RoF system
In other words, the number of optical or electrical components increases linearly with the
number of MIMO signal channels in WDM systems and SCM systems. In an MDM system,
an expensive spatial light modulator is required.
Digital time division multiplexing (TDM) can also be a potential solution. However, here radio
frequency signals need to be digital before transmission and this requires high-speed digital
signal processing modules, which add cost and significant power consumption. Although some
MIMO CH1
MIMO CH2
MIMO CHn
Op
tical m
ultip
lexe
r
MIMO CH1
MIMO CH2
MIMO CHn
Op
tica
l d
em
ult
iple
xer
MIMO CH1
MIMO CH2
MIMO CHn
LOn-1
LO1
LO2
MIMO CH1
MIMO CH2
MIMO CHn
LO1
LO2
LOn-1
MIMO CH3 MIMO CH3

2.5 State-of-the-Arts of MIMO-enabled RoF System 48
research has been done on lowering the digital RoF bit rate [70], the high-cost components,
such as analogue-to-digital and digital-to-analogue converters, are unavoidable.
To reduce the cost of MIMO-enabled RoF system, two alternative analogue RoF systems using
double sideband (DSB) frequency translation [71] and single sideband (SSB) frequency
translation [72] techniques have been proposed by researchers. The operating principle of these
two systems is similar to a traditional SCM system, but here two MIMO channels share the
same LO so that the number of LOs can be halved. However, in [71] and [72], the authors find
that the DSB system does not have such good performance as the SSB system and cannot work
when the upper band and the lower band of the translated signal are widely separated.
Moreover, a narrow band notch filter is required in the DSB frequency translation system which
results in the system only carry a single service.
Some researchers have improved the SSB system to support multiple services by translating
signals to different bands [73] and lower its cost using directly modulated lasers and MMF [74,
75, 76]. However, due to the filtering process required by the SSB frequency translation
system, it unavoidably wastes the power of one of the upper sideband and the lower sideband
of the signal, and it requires many filters at the basestation side and the RAU side of the system.
There are also researchers working on low-cost MDM systems [67], WDM systems [65], as
well as polarisation-multiplexing systems [77]. Although all these systems can support
multiple-service, none of them is likely to fundamentally be lower cost than the system using
frequency translation technique.
Some of the previous literatures about the multiplexing schemes for the MIMO-RoF have been
shown in Table 2.7.

2.5 State-of-the-Arts of MIMO-enabled RoF System 49
Table 2.7 Previous researches in commercial analogue MIMO-enabled RoF systems
Year Technique Transmitted Signals Carrier Frequency
Channel bandwidth or
throughput or data rate Fibre Limitations Ref
2008 DSB Freq Translation,
Direct Mod PRBS, QAM16, 3×3 2.4GHz
1 MSymb/s
SMF 2.2km Cannot multiple services, narrow band filter [71]
2010 SSB Freq Translation,
Direct Mod PRBS, QAM16, 3×3 2.44GHz 11 MSymb/s MMF 550m Power of lower sideband is lost [72]
2010 SSB Freq Translation,
External Mod PRBS, AM, 3×3 0.5GHz-3GHz & 60 GHz 100Mb/s SMF 10km Power of lower sideband is lost [73]
2011 WDM-PON, VCSEL,
Direct Mod PRBS, QAM4, 2×2 5.6GHz 198.5Mb/s SMF 20km High cost [75]
2012 WDM, Direct Mod 802.11n, 2×2 2.4GHz
~15 Mbit/s for single channel
to ~22 Mbit/s max for
MIMO
MMF 5.4km High cost [76]
2013 SSB Freq Translation,
Direct Mod 802.11n, 2×3 2.4 GHz ~22 Mbit/s MMF 100m Power of upper sideband is lost [74]
2014 MDM 802.11n, 3×3 2.4GHz 20MHz channel, 43.3Mbps MMF 30m High cost [78]
2014 Polarization-Multiplex LTE-A, 2×2 0.8GHz, 2.6GHz 10MHz, 20MHz channel SMF 10km-50km High cost [77]
2016
DSB Freq Translation,
Direct Mod
LTE, 2×2,
802.11g,
0.7GHz & 2.4GHz 20MHz LTE channel,
54Mbps 802.11g MMF 300m
Limited by the speed of laser, original
carrier frequency cannot be very high. [79]

2.6 Summary and Conclusion 50
2.6 Summary and Conclusion
In this chapter, we have defined the intrinsic analogue RoF link in this thesis as a directly
modulated DFB laser followed by a short single mode fibre and a PIN photodiode with direct
detection.
The e/o and o/e conversion gain contributes to the most to the gain of an intrinsic RoF link,
which is typically -35 to -12 dB. Other performance measurement terms, such as nonlinearity
and EVM are also introduced in this chapter.
By extending the intrinsic RoF link, typical layouts of an analogue SISO DAS are described in
this chapter, showing that using a passive secondary DAS hub is a more cost-effective solution
than the active secondary hub when the number of RAUs is <64.
Because MIMO-type signals overlap in the frequency domain, a multiplexing scheme has to
be used to implement a co-located MIMO-enabled DAS. The SSB and DSB frequency
translation systems are considered to be relatively low-cost solutions among state-of-the-art
technologies.
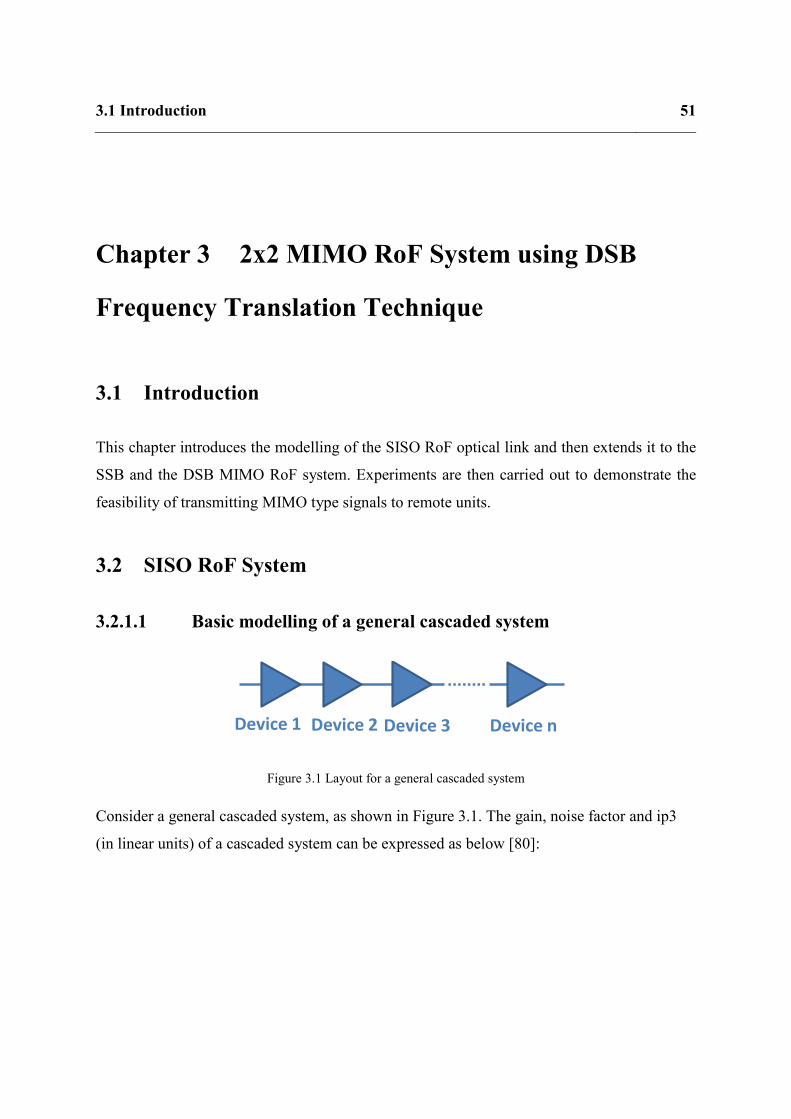
3.1 Introduction 51
Chapter 3 2x2 MIMO RoF System using DSB
Frequency Translation Technique
3.1 Introduction
This chapter introduces the modelling of the SISO RoF optical link and then extends it to the
SSB and the DSB MIMO RoF system. Experiments are then carried out to demonstrate the
feasibility of transmitting MIMO type signals to remote units.
3.2 SISO RoF System
3.2.1.1 Basic modelling of a general cascaded system
Figure 3.1 Layout for a general cascaded system
Consider a general cascaded system, as shown in Figure 3.1. The gain, noise factor and ip3
(in linear units) of a cascaded system can be expressed as below [80]:
Device 1 Device 2 Device 3 Device n

3.2 SISO RoF System 52
𝑔𝑠𝑦𝑠𝑡𝑒𝑚 = 𝑔1 ∗ 𝑔2 ∗ …∗ 𝑔𝑛 (3.1)
𝑛𝑓𝑠𝑦𝑠𝑡𝑒𝑚 = 𝑛𝑓1 +𝑛𝑓2−1
𝑔1+
𝑛𝑓3−1
𝑔1∗𝑔2+⋯+
𝑛𝑓𝑛−1
𝑔1∗𝑔2∗…∗𝑔𝑛−1 (3.2)
𝑖𝑖𝑝3𝑠𝑦𝑠𝑡𝑒𝑚
= (1
𝑖𝑖𝑝31
+𝑔1
𝑖𝑖𝑝32
+𝑔1𝑔2
𝑖𝑖𝑝33
+ ⋯+𝑔1∗𝑔2∗…𝑔𝑛−1
𝑖𝑖𝑝3𝑛
)−1
(3.3)
𝑜𝑖𝑝3𝑠𝑦𝑠𝑡𝑒𝑚
= 𝑖𝑖𝑝3𝑠𝑦𝑠𝑡𝑒𝑚
∗ 𝑔𝑠𝑦𝑠𝑡𝑒𝑚
(3.4)
Assuming system input noise is the thermal noise, system output noise floor follows the
equation below:
𝑆𝑦𝑠𝑡𝑒𝑚 𝑂𝑢𝑡𝑝𝑢𝑡 𝑁𝑜𝑖𝑠𝑒 𝐹𝑙𝑜𝑜𝑟 = 𝑇ℎ𝑒𝑟𝑚𝑎𝑙 𝑁𝑜𝑖𝑠𝑒 ∗ 𝑔𝑠𝑦𝑠𝑡𝑒𝑚 ∗ 𝑛𝑓𝑠𝑦𝑠𝑡𝑒𝑚 (3.5)
The system 3rd order SFDR in dB can be expressed as below:
𝑆𝐹𝐷𝑅3𝑆𝑦𝑠𝑡𝑒𝑚( ) =2
3(𝑂𝐼𝑃3( 𝑚) − 𝑂𝑢𝑡𝑝𝑢𝑡 𝑁𝑜𝑖𝑠𝑒 𝐹𝑙𝑜𝑜𝑟( 𝑚)) (3.6)
To compensate the loss in a RoF link, a pre-amplifier and a post-amplifier are installed in a
SISO RoF system, as shown in Figure 3.2. It can be considered as a cascaded system, in which
the intrinsic RoF link has the dominant noise figure.
Figure 3.2 SISO RoF System
3.2.2 Pre-amplifier and post-amplifier in a SISO RoF system
A simulation has been performed to show the contributions of the pre-amplifier and the post-
amplifier to the performance of the SISO RoF link. It is assumed that the intrinsic optical link
Optical Fibre
Intrinsic RoF linkPre-amplifier Post-amplifier
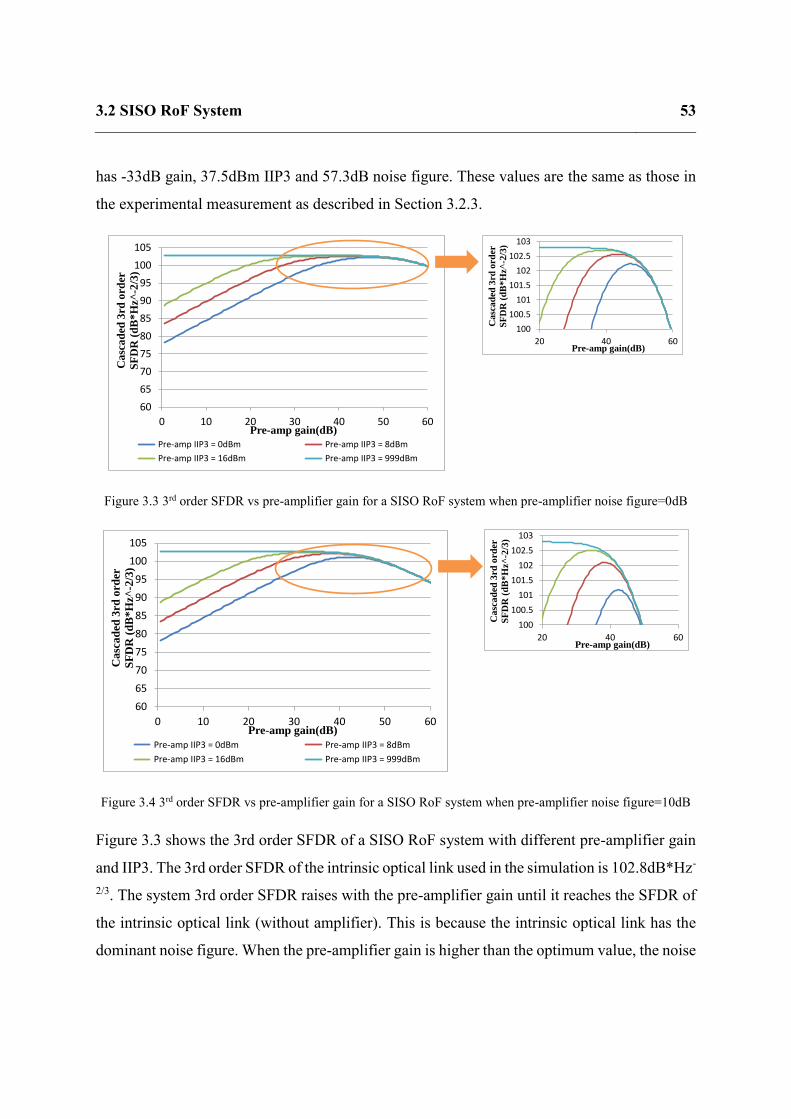
3.2 SISO RoF System 53
has -33dB gain, 37.5dBm IIP3 and 57.3dB noise figure. These values are the same as those in
the experimental measurement as described in Section 3.2.3.
Figure 3.3 3rd order SFDR vs pre-amplifier gain for a SISO RoF system when pre-amplifier noise figure=0dB
Figure 3.4 3rd order SFDR vs pre-amplifier gain for a SISO RoF system when pre-amplifier noise figure=10dB
Figure 3.3 shows the 3rd order SFDR of a SISO RoF system with different pre-amplifier gain
and IIP3. The 3rd order SFDR of the intrinsic optical link used in the simulation is 102.8dB*Hz-
2/3. The system 3rd order SFDR raises with the pre-amplifier gain until it reaches the SFDR of
the intrinsic optical link (without amplifier). This is because the intrinsic optical link has the
dominant noise figure. When the pre-amplifier gain is higher than the optimum value, the noise
60
65
70
75
80
85
90
95
100
105
0 10 20 30 40 50 60
Ca
sca
ded
3rd
ord
er
SF
DR
(d
B*
Hz^
-2/3
)
Pre-amp gain(dB)
Pre-amp IIP3 = 0dBm Pre-amp IIP3 = 8dBm
Pre-amp IIP3 = 16dBm Pre-amp IIP3 = 999dBm
100
100.5
101
101.5
102
102.5
103
20 40 60
Ca
sca
ded
3rd
ord
er
SF
DR
(d
B*
Hz^
-2/3
)
Pre-amp gain(dB)
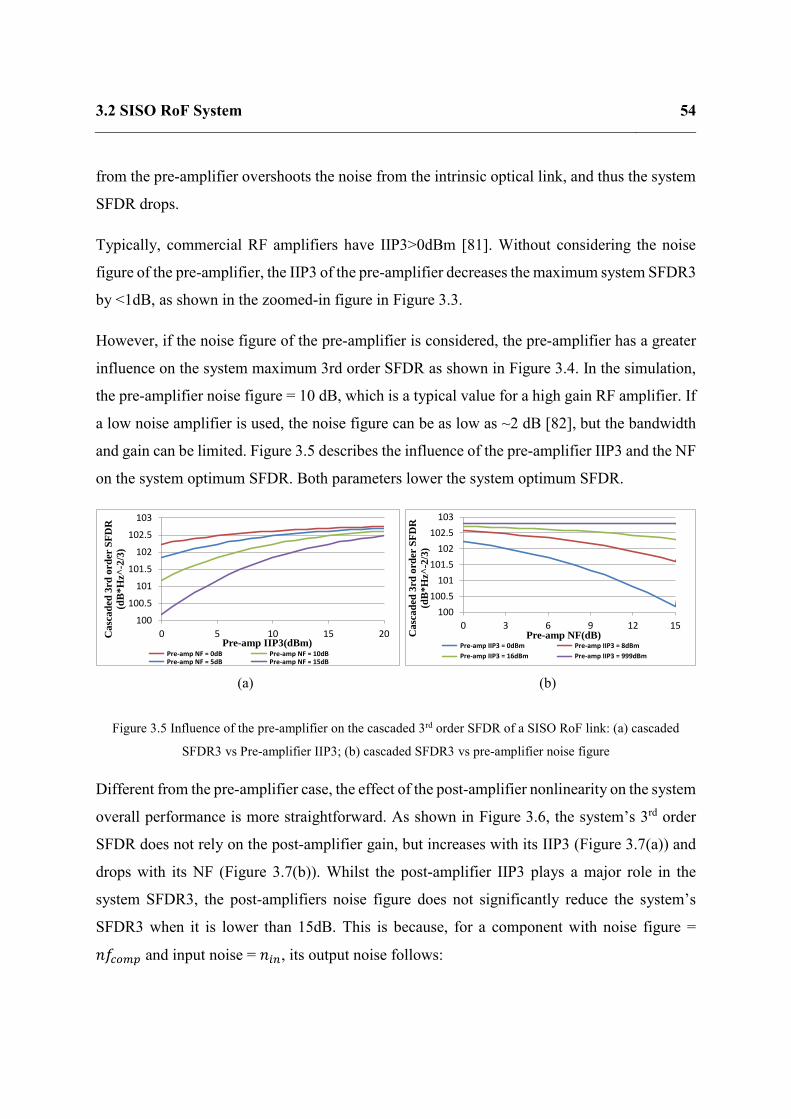
3.2 SISO RoF System 54
from the pre-amplifier overshoots the noise from the intrinsic optical link, and thus the system
SFDR drops.
Typically, commercial RF amplifiers have IIP3>0dBm [81]. Without considering the noise
figure of the pre-amplifier, the IIP3 of the pre-amplifier decreases the maximum system SFDR3
by <1dB, as shown in the zoomed-in figure in Figure 3.3.
However, if the noise figure of the pre-amplifier is considered, the pre-amplifier has a greater
influence on the system maximum 3rd order SFDR as shown in Figure 3.4. In the simulation,
the pre-amplifier noise figure = 10 dB, which is a typical value for a high gain RF amplifier. If
a low noise amplifier is used, the noise figure can be as low as ~2 dB [82], but the bandwidth
and gain can be limited. Figure 3.5 describes the influence of the pre-amplifier IIP3 and the NF
on the system optimum SFDR. Both parameters lower the system optimum SFDR.
Figure 3.5 Influence of the pre-amplifier on the cascaded 3rd order SFDR of a SISO RoF link: (a) cascaded
SFDR3 vs Pre-amplifier IIP3; (b) cascaded SFDR3 vs pre-amplifier noise figure
Different from the pre-amplifier case, the effect of the post-amplifier nonlinearity on the system
overall performance is more straightforward. As shown in Figure 3.6, the system’s 3rd order
SFDR does not rely on the post-amplifier gain, but increases with its IIP3 (Figure 3.7(a)) and
drops with its NF (Figure 3.7(b)). Whilst the post-amplifier IIP3 plays a major role in the
system SFDR3, the post-amplifiers noise figure does not significantly reduce the system’s
SFDR3 when it is lower than 15dB. This is because, for a component with noise figure =
𝑛𝑓𝑐𝑜𝑚𝑝 and input noise = 𝑛𝑖𝑛, its output noise follows:
100
100.5
101
101.5
102
102.5
103
0 3 6 9 12 15
Ca
sca
ded
3rd
ord
er S
FD
R
(dB
*H
z^-2
/3)
Pre-amp NF(dB) Pre-amp IIP3 = 0dBm Pre-amp IIP3 = 8dBm
Pre-amp IIP3 = 16dBm Pre-amp IIP3 = 999dBm
(a) (b)
100
100.5
101
101.5
102
102.5
103
0 5 10 15 20Ca
sca
ded
3rd
ord
er S
FD
R
(dB
*H
z^-2
/3)
Pre-amp IIP3(dBm) Pre-amp NF = 0dB Pre-amp NF = 10dB Pre-amp NF = 5dB Pre-amp NF = 15dB
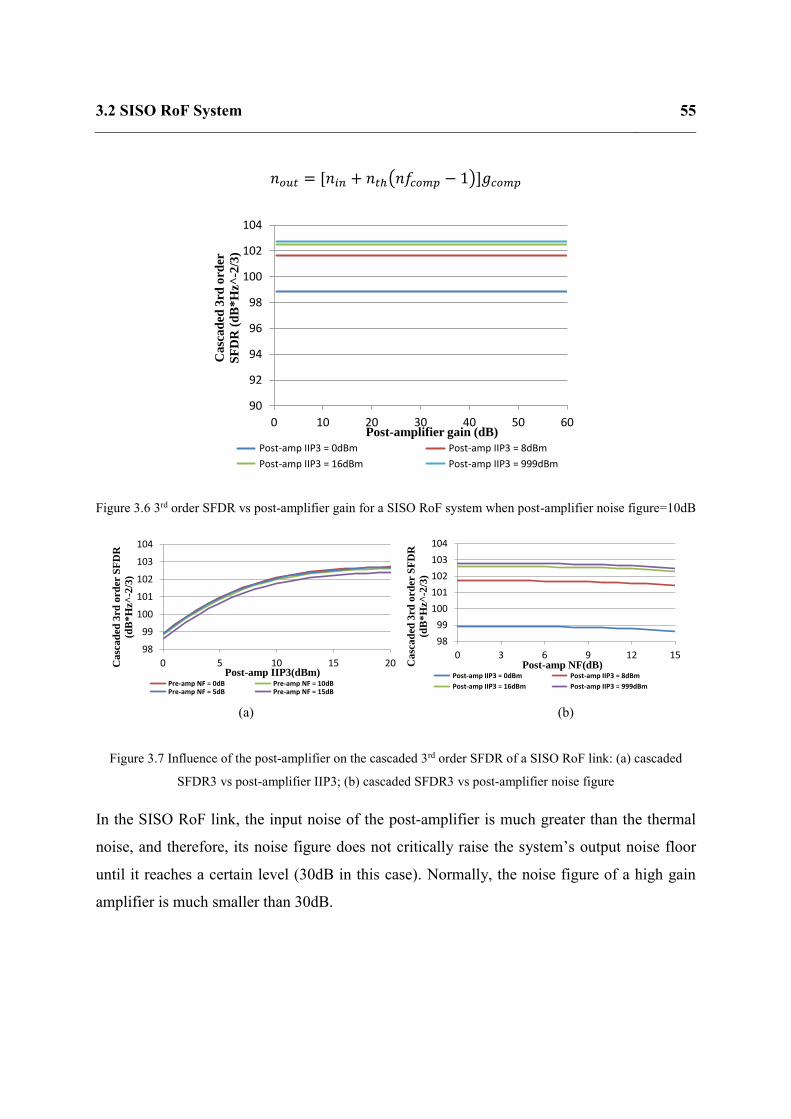
3.2 SISO RoF System 55
𝑛𝑜𝑢𝑡 = [𝑛𝑖𝑛 + 𝑛𝑡ℎ(𝑛𝑓𝑐𝑜𝑚𝑝 − 1)]𝑔𝑐𝑜𝑚𝑝
Figure 3.6 3rd order SFDR vs post-amplifier gain for a SISO RoF system when post-amplifier noise figure=10dB
Figure 3.7 Influence of the post-amplifier on the cascaded 3rd order SFDR of a SISO RoF link: (a) cascaded
SFDR3 vs post-amplifier IIP3; (b) cascaded SFDR3 vs post-amplifier noise figure
In the SISO RoF link, the input noise of the post-amplifier is much greater than the thermal
noise, and therefore, its noise figure does not critically raise the system’s output noise floor
until it reaches a certain level (30dB in this case). Normally, the noise figure of a high gain
amplifier is much smaller than 30dB.
90
92
94
96
98
100
102
104
0 10 20 30 40 50 60
Ca
sca
ded
3rd
ord
er
SF
DR
(d
B*
Hz^
-2/3
)
Post-amplifier gain (dB)
Post-amp IIP3 = 0dBm Post-amp IIP3 = 8dBm
Post-amp IIP3 = 16dBm Post-amp IIP3 = 999dBm
98
99
100
101
102
103
104
0 5 10 15 20Ca
sca
ded
3rd
ord
er S
FD
R
(dB
*H
z^-2
/3)
Post-amp IIP3(dBm) Pre-amp NF = 0dB Pre-amp NF = 10dB Pre-amp NF = 5dB Pre-amp NF = 15dB
98
99
100
101
102
103
104
0 3 6 9 12 15
Ca
sca
ded
3rd
ord
er S
FD
R
(dB
*H
z^-2
/3)
Post-amp NF(dB) Post-amp IIP3 = 0dBm Post-amp IIP3 = 8dBm
Post-amp IIP3 = 16dBm Post-amp IIP3 = 999dBm
(a) (b)

3.2 SISO RoF System 56
3.2.3 Basic experimental measurements of a SISO RoF system
A. Laser diode L-I characteristic
Figure 3.8 Experiment setup for laser diode L-I characteristic test
The light-current characteristic of the Mitsubishi® FU-68-PDF Direct modulated DFB laser at
20 °C has been tested using a lightwave multimeter as shown in Figure 3.8. The laser diode
temperature is controlled by a thermoelectric cooler (TEC) inside the laser diode’s package. In
the experimental results in Figure 3.9, the slope rate for the L-I curve is ~0.2W/A. And the
curve starts to be nonlinear when laser diode bias current >80 mA. The laser diode threshold
current ~10 mA. Therefore, if the laser diode is biased at the ~45 mA point, the RoF link will
have the best linearity performance in direct modulation. Moreover, if this laser is directly
modulated, severe distortion will happen when the RF signal peak current >35 mA, which is
~15dBm in power if it is 50 ohms matched.
Figure 3.9 L-I characteristic of the Mitsubishi® FU-68-PDF DFB laser
DM DFB Laser
Lightwave multimeter
Laser controller
Current control
TEC
0
2
4
6
8
10
12
14
0 20 40 60 80 100
Lase
r D
iod
e O
utp
ut
Po
we
r (m
W)
Laser Diode Bias Current (mA)
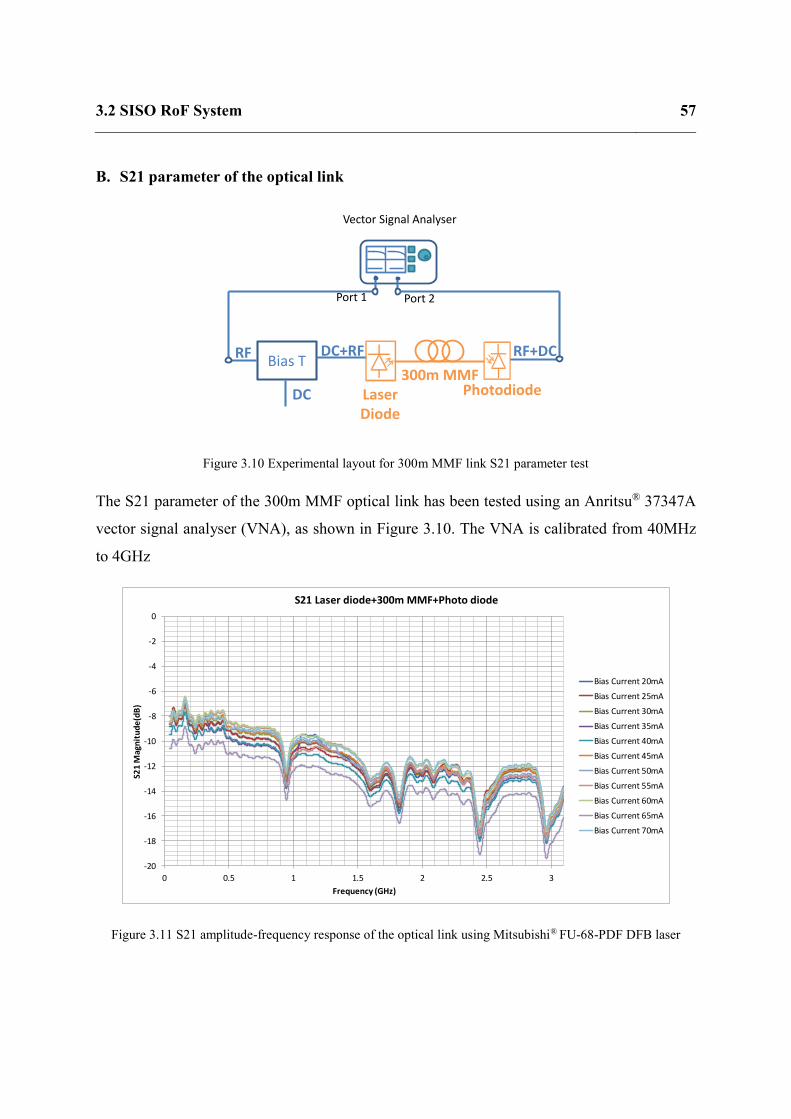
3.2 SISO RoF System 57
B. S21 parameter of the optical link
Figure 3.10 Experimental layout for 300m MMF link S21 parameter test
The S21 parameter of the 300m MMF optical link has been tested using an Anritsu® 37347A
vector signal analyser (VNA), as shown in Figure 3.10. The VNA is calibrated from 40MHz
to 4GHz
Figure 3.11 S21 amplitude-frequency response of the optical link using Mitsubishi® FU-68-PDF DFB laser
Vector Signal Analyser
Port 1 Port 2
Laser Diode
RFBias T
DC Photodiode300m MMF
DC+RF RF+DC
-20
-18
-16
-14
-12
-10
-8
-6
-4
-2
0
0 0.5 1 1.5 2 2.5 3
S21
Mag
nit
ud
e(d
B)
Frequency (GHz)
S21 Laser diode+300m MMF+Photo diode
Bias Current 20mA
Bias Current 25mA
Bias Current 30mA
Bias Current 35mA
Bias Current 40mA
Bias Current 45mA
Bias Current 50mA
Bias Current 55mA
Bias Current 60mA
Bias Current 65mA
Bias Current 70mA

3.2 SISO RoF System 58
It is shown in Figure 3.11 that for the direct modulated DFB laser under test (Mitsubishi® FU-
68-PDF DFB), the 6dB RF bandwidth of the optical link is ~2.5GHz. RF resonance in the laser
diode package causes the dips in the plot.
C. SFDR
The 3rd order SFDR of the system can be measured by the two-tone test (Figure 3.12). Two
signal generators generate two sine waves with respectively 800MHz and 801MHz carrier
frequencies. A power coupler then combines signals from two signal generators, and the
comobined signals are directly modulated to a DFB laser. The power of the fundamental tones
and 3rd order tones at the output of the intrinsic optical link have been measured using a
spectrum analyser, as plotted in Figure 3.13. The interception point between the fundamental
tone and the 3rd order harmonics (IP3) shows the optical link has 37.5dBm IIP3 and 8dBm
OIP3. The output noise floor of the optical link is measured -145dBm/Hz. Therefore, the 3rd
order SFDR can be calculated using equation (3.6): 102dBm/Hz2/3.
Figure 3.12 General layout of the two-tone test to measure the SFDR of a nonlinear system
Nonlinear system under test
Signal generator, pure sinewave @f1
Spectrum AnalyserElectrical CombinerSignal generator,
pure sinewave @f2

3.3 Modelling of SSB and DSB MIMO-enabled RoF System 59
Figure 3.13 3rd order SFDR test result for intrinsic optical link
3.3 Modelling of SSB and DSB MIMO-enabled RoF System
The single sideband (SSB) and double sideband (DSB) frequency translation systems convert
original MIMO signals into different electrical sidebands as shown in Figure 3.14 and Figure
3.15. The two MIMO channels share the same local oscillator. Therefore, half the number of
local oscillators are required than the number of channels. In both systems, the local oscillator
translates the original MIMO signals into upper and lower sidebands, respectively at 𝑓𝑙𝑜𝑤 =
|𝑓𝐿𝑂 − 𝑓𝑐| and 𝑓𝑢𝑝 = 𝑓𝐿𝑂 + 𝑓𝑐.
-180
-160
-140
-120
-100
-80
-60
-40
-20
0
20
-20 -10 0 10 20 30 40 50
Po
ut(
dB
m)
Pin(dBm)Optical link output fundamental (dBm) Optical link output 3rd order harmonics (dBm)
Optical link interception Optical link noise floor (dBm/Hz)
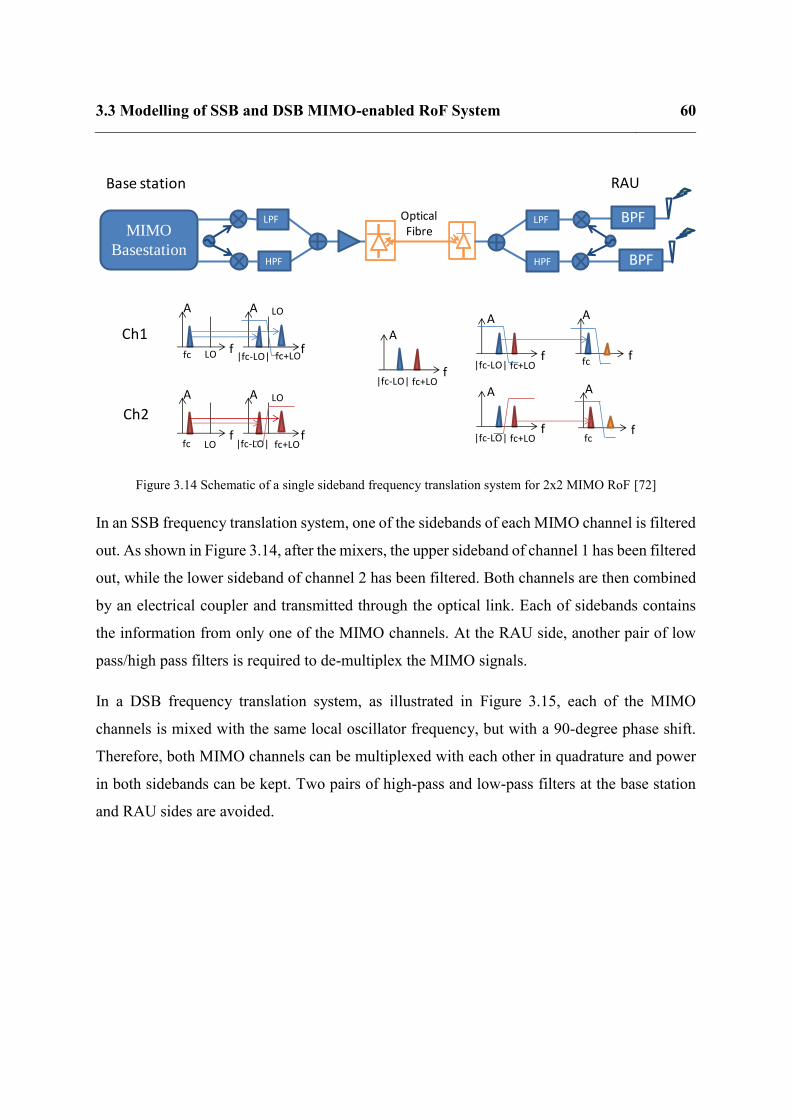
3.3 Modelling of SSB and DSB MIMO-enabled RoF System 60
Figure 3.14 Schematic of a single sideband frequency translation system for 2x2 MIMO RoF [72]
In an SSB frequency translation system, one of the sidebands of each MIMO channel is filtered
out. As shown in Figure 3.14, after the mixers, the upper sideband of channel 1 has been filtered
out, while the lower sideband of channel 2 has been filtered. Both channels are then combined
by an electrical coupler and transmitted through the optical link. Each of sidebands contains
the information from only one of the MIMO channels. At the RAU side, another pair of low
pass/high pass filters is required to de-multiplex the MIMO signals.
In a DSB frequency translation system, as illustrated in Figure 3.15, each of the MIMO
channels is mixed with the same local oscillator frequency, but with a 90-degree phase shift.
Therefore, both MIMO channels can be multiplexed with each other in quadrature and power
in both sidebands can be kept. Two pairs of high-pass and low-pass filters at the base station
and RAU sides are avoided.
MIMO
Basestation
f
A
fc f
A
f
A
LO
LO
|fc-LO| fc+LO
f
A
f
A
LO
LO
fc |fc-LO| fc+LO
fc+LO|fc-LO|
f
A
fc+LO|fc-LO|
BPF
BPF
f
A
fc+LO|fc-LO|
f
A
fc
f
A
fc
Optical Fibre
LPF
HPF
LPF
HPF
Ch1
Ch2
Base station RAU

3.3 Modelling of SSB and DSB MIMO-enabled RoF System 61
Figure 3.15 Schematic of a double sideband frequency translation system for 2x2 MIMO RoF [71]
3.3.1 Third order SFDR of the SSB and the DSB frequency translation
system
Different from the SISO RoF link, the SSB and DSB frequency translation system involves RF
mixers, which usually have poor IIP3 and high conversion loss. For example, the frequency
mixer used in the experiment and simulation has ~25dBm IIP3 and ~8dB conversion loss. This
will influence the system’s overall performance.
In the SSB frequency translation system, if the input noise of the mixer is thermal noise, the
noise figure of a mixer equals to its conversion loss. In a DSB frequency translation system, at
the RAU side, when the mixer translates upper and lower sidebands back to the original
frequency, the signal power adds coherently but the noise power adds in-coherently, giving the
DSB system higher SNR than the SSB system (if two systems use the same optical link and
the same pre-amplifier).
Simulations have been performed in spreadsheet model by calculating the link power budget
as shown in Figure 3.16. Detailed mathematical theory will be described in Chapter 5.
MIMO
Basestation
0
pi/2
f
A
fc f
A
f
A
LO
LO
|fc-LO| fc+LO
f
A
f
A
LO
LO
0
pi/2
fc |fc-LO| fc+LO
fc+LO|fc-LO|
f
A
fc+LO|fc-LO|
BPF
BPF
f
A
fc+LO|fc-LO|
f
A
fc
f
A
fc
Optical Fibre
Ch1
Ch2
Base station RAU

3.3 Modelling of SSB and DSB MIMO-enabled RoF System 62
(a) (b)
(c) (d)
Figure 3.16 Simulation results comparing DSB with SSB frequency translation system: (a)IIP3; (b) OIP3;
(c)output noise floor; (d) 3rd order SFDR.
The SSB and DSB system have the same IIP3 (Figure 3.16(a)). However, as the double
sideband system uses the power from both sidebands, its OIP3 is 6dB higher than the SSB
system (Figure 3.16(b)). In the DSB system, the noise from both sidebands adds in-coherently,
thus the output noise floor is 3dB higher than the SSB system (Figure 3.16(c)).
Thus, overall, the DSB system has 2/3*(6dB-3dB) = 2dB higher 3rd order SFDR than the SSB
system (Figure 3.16 (d)). This property makes the DSB system’s dynamic range superior to the
SSB system and means that the optical bandwidth can be traded for the electrical SFDR.
-20
-10
0
10
20
0 20 40 60
Cas
cad
ed II
P3(
dB
m)
Pre-amplifier gain (dB)
SSB IIP3
DSB IIP3 -40
-30
-20
-10
0
10
0 20 40 60
Cas
cad
ed O
IP3
(dB
m)
Pre-amplifier gain (dB)
SSB OIP3DSB OIP3
-170
-160
-150
-140
-130
0 20 40 60
Ou
tpu
t n
ois
e fl
oo
r (d
Bm
/Hz)
Pre-amplifier gain (dB)
SSB output noiseDSB output noise
80
85
90
95
100
105
0 20 40 60
Cas
cad
ed S
FDR
3(d
B*H
z^-2
/3)
Pre-amplifier gain (dB)
SSB SFDRDSB SFDR

3.3 Modelling of SSB and DSB MIMO-enabled RoF System 63
3.3.2 Crosstalk in the DSB frequency translation system
Two major factors contribute to the crosstalk between the two MIMO channels in a DSB
frequency translation system – phase error of the 90-degree hybrid coupler and the amplitude
imbalance between the upper sideband and the lower sideband.
Figure 3.17 Schematic of the model of MIMO-enabled RoF system using DSB frequency translation.
To simplify the model, we model the optical link as a low-pass filter and time delay (∆𝑡), as
shown in Figure 3.17. Assuming there are two MIMO channels, they respectively contain
information 𝑚1 and 𝑚2. And they are modulated to the same carrier angle frequency 𝜔, but
the initial phases are different – respectively 𝛼 and 𝛽. The 90-degree hybrid couplers have 𝜎1
and 𝜎2 phase error. The local oscillators at the basestation side and the RAU side are not
synchronised and they have phase difference 𝜃, but with the same angle frequency 𝜃. It is
assumed that the phase of the local oscillator at the BS side is the reference phase.
The multiplexing and de-multiplexing process can be expressed as the equations shown below:
𝑀𝑚𝑢𝑥 = 𝑚1 sin(ωt + α) sin(𝜔𝐿𝑂t) + 𝑚2 sin(ωt + β) cos(𝜔𝐿𝑂t + 𝜎1)
= 𝑀𝑝𝑟𝑒,𝜔−𝜔𝐿𝑂(𝑡) + 𝑀𝑝𝑟𝑒,𝜔+𝜔𝐿𝑂
(𝑡) (3.7)
in which,
0 0MIMO1
MIMO2
MIMO1
MIMO2
LPF
The optical link is acting as a low-pass filter.
Basestation(BS) Remote Antenna Unit(RAU)

3.3 Modelling of SSB and DSB MIMO-enabled RoF System 64
𝑀𝑝𝑟𝑒,𝜔−𝜔𝐿𝑂(t) =
1
2{𝑚1 cos[(𝜔 − 𝜔𝐿𝑂)𝑡 + 𝛼] + 𝑚2sin [(𝜔 − 𝜔𝐿𝑂)𝑡 + 𝛽 − 𝜎1]} (3.8)
𝑀𝑝𝑟𝑒,𝜔+𝜔𝐿𝑂(𝑡) =
1
2{−𝑚1 cos[(𝜔 + 𝜔𝐿𝑂)𝑡 + 𝛼] + 𝑚2sin [(𝜔 + 𝜔𝐿𝑂)𝑡 + 𝛽 + 𝜎1]} (3.9)
After the RoF link,
𝑀𝑝𝑜𝑠𝑡,𝜔−𝜔𝐿𝑂(t) = 𝐺𝜔−𝜔𝐿𝑂
𝑀𝑝𝑟𝑒,𝜔−𝜔𝐿𝑂(t + ∆t) (3.10)
𝑀𝑝𝑜𝑠𝑡,𝜔+𝜔𝐿𝑂(t) = 𝐺𝜔+𝜔𝐿𝑂
𝑀𝑝𝑟𝑒,𝜔+𝜔𝐿𝑂(t + ∆t) (3.11)
then, the de-multiplexed signal,
𝑀𝑑𝑒𝑚𝑢𝑥1 = [𝑀𝑝𝑜𝑠𝑡,𝜔−𝜔𝐿𝑂(t) + 𝑀𝑝𝑜𝑠𝑡,𝜔+𝜔𝐿𝑂
(t)] ∙ sin (𝜔𝐿𝑂t + θ) (3.12)
𝑀𝑑𝑒𝑚𝑢𝑥2 = [𝑀𝑝𝑜𝑠𝑡,𝜔−𝜔𝐿𝑂(t) + 𝑀𝑝𝑜𝑠𝑡,𝜔+𝜔𝐿𝑂
(t) ∙ cos (𝜔𝐿𝑂t + θ + 𝜎2)] (3.13)
Considering only the components at 𝜔 in channel 1,
𝑀𝑑𝑒𝑚𝑢𝑥1 = 𝑀𝑠𝑖𝑔𝑛𝑎𝑙1 +𝑀𝑐𝑟𝑜𝑠𝑠𝑡𝑎𝑙𝑘1 (3.14)
𝑀𝑠𝑖𝑔𝑛𝑎𝑙1 =𝑚1𝐺𝜔−𝜔𝐿𝑂
4sin(𝜔𝑡 + 𝛼 + 𝛿1 + 𝜃) +
𝑚1𝐺𝜔+𝜔𝐿𝑂
4sin (𝜔𝑡 + 𝛼 + 𝛿2 − 𝜃) (3.15)
𝑀𝑐𝑟𝑜𝑠𝑠𝑡𝑎𝑙𝑘1 = −𝑚2𝐺𝜔−𝜔𝐿𝑂
4cos(𝜔𝑡 + 𝛽 − 𝜎1 + 𝛿1 + 𝜃)
+𝑚2𝐺𝜔+𝜔𝐿𝑂
4cos (𝜔𝑡 + 𝛽 + 𝜎1 + 𝛿2 − 𝜃) (3.16)
If no crosstalk, 𝑀𝑐𝑟𝑜𝑠𝑠𝑡𝑎𝑙𝑘1 = 0. Then,
𝐺𝜔−𝜔𝐿𝑂= 𝐺𝜔+𝜔𝐿𝑂
(3.17)
and
𝛽 − 𝜎1 + 𝛿1 + 𝜃 = 𝛽 + 𝜎1 + 𝛿2 − 𝜃 + 2𝑛𝜋 (3.18)

3.3 Modelling of SSB and DSB MIMO-enabled RoF System 65
(3.18) can be rearranged into:
θ = 𝜎1 +ωLO∆t + 𝑛 (3.19)
Similarly, if we consider channel 2, when no crosstalk,
θ = ωLO∆t − 𝜎2 + 𝑛𝜋 (3.20)
and 𝐺𝜔−𝜔𝐿𝑂= 𝐺𝜔+𝜔𝐿𝑂
All the symbols used from (3.7) to (3.20) are shown in
Table 3.1 Symbols used from (3.7) to (3.20)
Symbol Quantity
𝐦𝟏,𝐦𝟐 Message contained in MIMO channel 1 and channel 2
𝛚 Angle frequency of MIMO signals
𝛚𝐋𝐎 Angle frequency of LO signal
𝛂, 𝛃 Initial phase of MIMO channel 1 and channel 2 signal
𝛔𝟏, 𝛔𝟐 Phase error of the 90-degree splitter at the BS and the RAU side
𝛉 Phase difference between two LOs
∆𝐭 Delay time between the BS side and RAU side
𝛅𝟏, 𝛅𝟐 Respectively (ω − ωLO)∆t and (ω + ωLO)∆t
𝐌𝐦𝐮𝐱 Multiplexed signal, before the laser, but after the power combiner at
the BS side.
𝐌𝐩𝐫𝐞,𝛚±𝛚𝐋𝐎 Frequency component at ω±ωLO of Mmux
𝐌𝐩𝐨𝐬𝐭,𝛚±𝛚𝐋𝐎 Frequency component at ω±ωLO of the signal after the optical link
(low-pass filter)

3.3 Modelling of SSB and DSB MIMO-enabled RoF System 66
𝐆𝛚±𝛚𝐋𝐎 Gain of the optical link (low-pass filter) at ω±ωLO
𝐌𝐝𝐞𝐦𝐮𝐱𝟏 De-multiplexed signal of channel 1 and channel 2 after the frequency
mixer at RAU side
𝐌𝐬𝐢𝐠𝐧𝐚𝐥𝟏 Effective signal contained in Mdemux1
𝐌𝐜𝐫𝐨𝐬𝐬𝐭𝐚𝐥𝐤𝟏 Crosstalk contained in Mdemux1
Equations (3.17) to (3.20) show that three major factors contribute to the crosstalk: (i) phase
mismatch caused by the microwave transmission time (∆t); (ii) phase error of the 90-degree
hybrid couplers (σ1, σ2); (iii) amplitude imbalance between two bands (Gω−ωLO, Gω+ωLO
). To
eliminate the crosstalk between two channels, Equations (3.17) to (3.20) have to be satisfied.
Due to the group delay of the link (∆t), the upper band and the lower bands arrive at the
frequency mixers with different phases (δ1and δ2). If there is no phase error in the 90-degree
hybrid couplers (σ1 = 0, σ2 = 0), the effect of δ1and δ2 can be eliminated by adjusting the
phase difference between the mux and demux LOs via a delay line, which sets the value of θ =
ωLO∆t + nπ.
However, if there is a phase error in the 90-degree hybrid couplers, Equation (3.19) and (3.20)
can never be fully satisfied at the same time, and this becomes one of the major factors which
results in the system crosstalk.
The amplitude imbalance between the upper band and the lower band is another important
factor that causes crosstalk. As shown in equation (3.17), when the signals are demultiplexed
at the RAU side, the signal from the unwanted channel has to be cancelled which requires that
the two sidebands of the DSB signal have the same amplitude.
The simulation results in Figure 3.18 show the crosstalk caused by the phase error of the 90-
degree hybrid coupler and the amplitude imbalance between two frequency bands. Typically,
the phase error of a 90-degree hybrid coupler can be within 2°, but the amplitude imbalance of

3.3 Modelling of SSB and DSB MIMO-enabled RoF System 67
the two sidebands caused by the variation in the S21 frequency response of the optical link can
be >1dB.
Figure 3.18 Simulation of the crosstalk caused by the phase error of 90-degree hybrid couplers, and amplitude
imbalance between two sidebands.
3.3.3 EVM simulation for a DSB frequency translation system
A simulation is performed to show the EVM performance of a DSB frequency translation
system in VPItransmissionMaker® as shown in Figure 3.19. Two channels each of 20MHz
bandwidth 64QAM signal at 800MHz carrier bandwidth have been used at the input of the
system. The input signal power is -20dBm. The mixer is modelled as an ideal multiplier
followed by a nonlinear component, whose IIP3 has been defined the same as the mixer used
in the experiment. An attenuator represents the mixers' conversion loss. The phase error of the
90-degree hybrid coupler is <2°, which is a typical value for a commercial product [83]. The
optical link used in the simulation consists of a direct modulated DFB laser and a PIN
photodiode. The optical fibre is a 300m MMF.
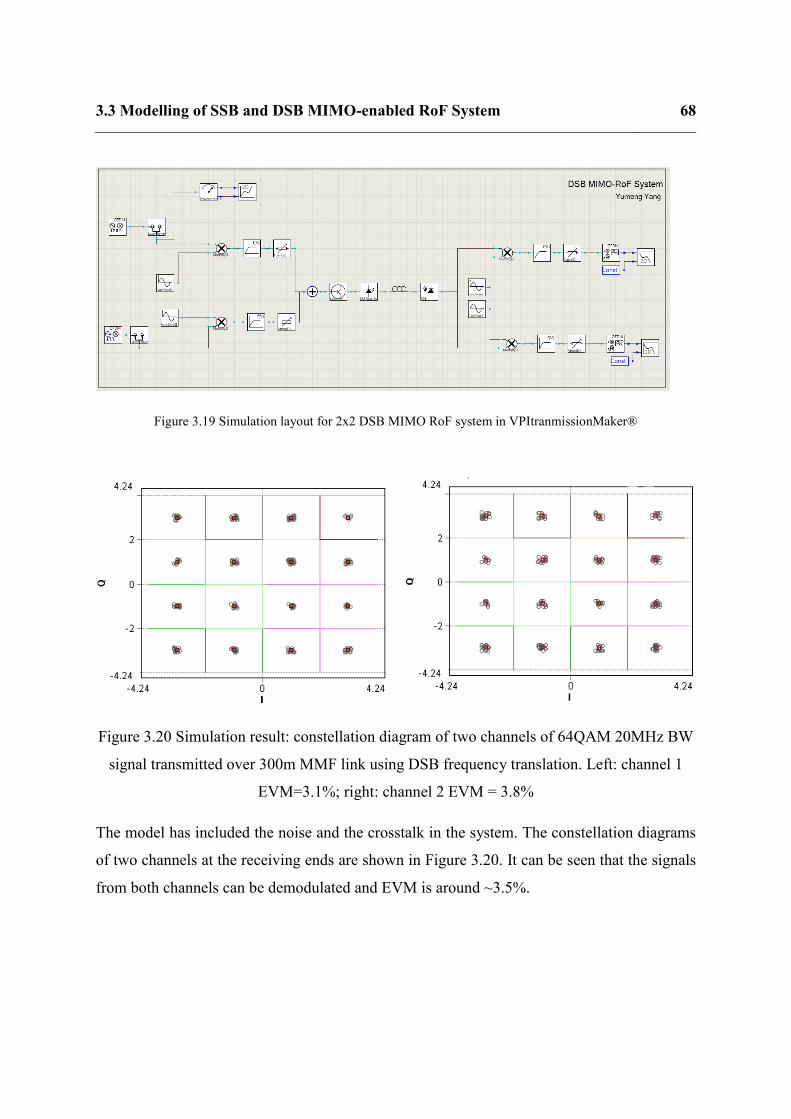
3.3 Modelling of SSB and DSB MIMO-enabled RoF System 68
Figure 3.19 Simulation layout for 2x2 DSB MIMO RoF system in VPItranmissionMaker®
Figure 3.20 Simulation result: constellation diagram of two channels of 64QAM 20MHz BW
signal transmitted over 300m MMF link using DSB frequency translation. Left: channel 1
EVM=3.1%; right: channel 2 EVM = 3.8%
The model has included the noise and the crosstalk in the system. The constellation diagrams
of two channels at the receiving ends are shown in Figure 3.20. It can be seen that the signals
from both channels can be demodulated and EVM is around ~3.5%.
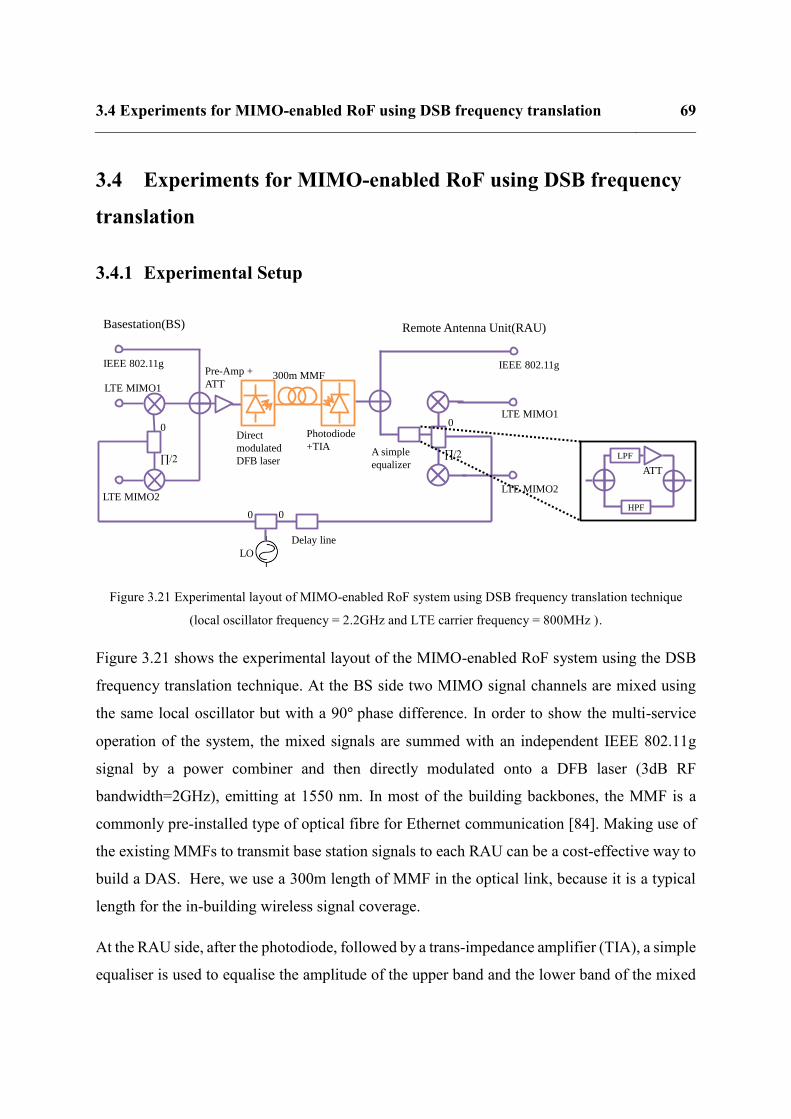
3.4 Experiments for MIMO-enabled RoF using DSB frequency translation 69
3.4 Experiments for MIMO-enabled RoF using DSB frequency
translation
3.4.1 Experimental Setup
Figure 3.21 Experimental layout of MIMO-enabled RoF system using DSB frequency translation technique
(local oscillator frequency = 2.2GHz and LTE carrier frequency = 800MHz ).
Figure 3.21 shows the experimental layout of the MIMO-enabled RoF system using the DSB
frequency translation technique. At the BS side two MIMO signal channels are mixed using
the same local oscillator but with a 90° phase difference. In order to show the multi-service
operation of the system, the mixed signals are summed with an independent IEEE 802.11g
signal by a power combiner and then directly modulated onto a DFB laser (3dB RF
bandwidth=2GHz), emitting at 1550 nm. In most of the building backbones, the MMF is a
commonly pre-installed type of optical fibre for Ethernet communication [84]. Making use of
the existing MMFs to transmit base station signals to each RAU can be a cost-effective way to
build a DAS. Here, we use a 300m length of MMF in the optical link, because it is a typical
length for the in-building wireless signal coverage.
At the RAU side, after the photodiode, followed by a trans-impedance amplifier (TIA), a simple
equaliser is used to equalise the amplitude of the upper band and the lower band of the mixed
0
∏/2
0
∏/2
LTE MIMO1
LTE MIMO1
LTE MIMO2
LO
0 0
Delay line
A simple
equalizer
Basestation(BS) Remote Antenna Unit(RAU)
LTE MIMO2
ATT
LPF
HPF
Pre-Amp +
ATT300m MMF
Direct
modulated
DFB laser
Photodiode
+TIA
IEEE 802.11g IEEE 802.11g

3.4 Experiments for MIMO-enabled RoF using DSB frequency translation 70
signals. Here, the filters in the equaliser also prevent the leakage of IEEE 802.11g signal to the
frequency mixers. Following the equaliser, a symmetry layout as the transmitting side is used
to de-multiplex the MIMO signals.
In this experiment, the BS side and the RAU side share the same LO to save one test device.
In reality, there should be two phase-locked LOs, one for each side of the link. To show the
difference between two LOs and to provide the necessary phase shift (θ, explained in Section
3.3.2), a delay line is used.
Figure 3.22 EVM test layout for MIMO-enabled multi-service RoF system
Figure 3.22 shows the experimental layout for the EVM test. Rohde & Schwarz® vector signal
generators and an Anritsu® signal generator are used to generate two channels of LTE signals
(centred at 700MHz) and a channel of an IEEE 802.11g signal (centred at 2.4GHz). A Rohde
& Schwarz® vector signal analyser is used to analyse the de-multiplexed LTE MIMO signals
and received Wi-Fi signal at the RAU side separately. MIMO processing, which can lower the
EVM by doing EVM compensation, is not used. The system is tested for 5MHz, 10MHz and
20MHz LTE channel bandwidths.
RAU side
LTE
Vector signal generator for Wi-Fi signal
Signal analyser
LTE
Vector signal generator for LTE MIMO signals
Basestation side
WiFi
MIMO-enabled multiservice RoFsystem (as shown
in Fig. 3.21)
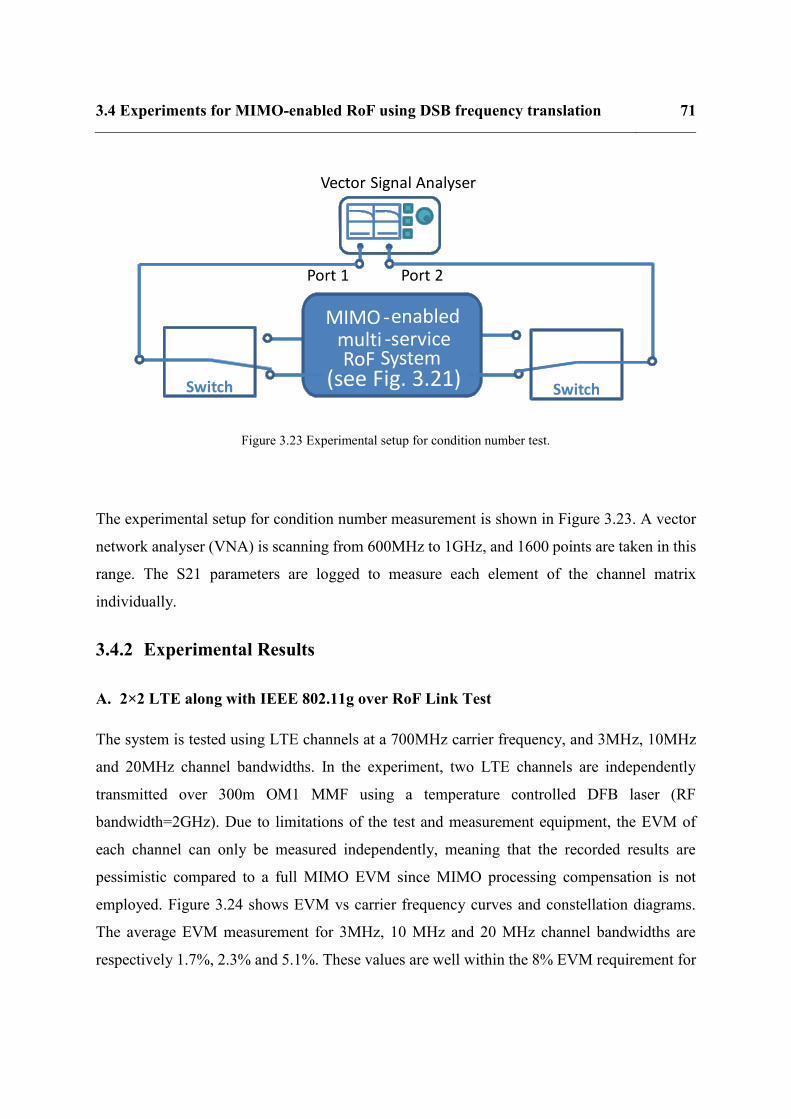
3.4 Experiments for MIMO-enabled RoF using DSB frequency translation 71
Figure 3.23 Experimental setup for condition number test.
The experimental setup for condition number measurement is shown in Figure 3.23. A vector
network analyser (VNA) is scanning from 600MHz to 1GHz, and 1600 points are taken in this
range. The S21 parameters are logged to measure each element of the channel matrix
individually.
3.4.2 Experimental Results
A. 2×2 LTE along with IEEE 802.11g over RoF Link Test
The system is tested using LTE channels at a 700MHz carrier frequency, and 3MHz, 10MHz
and 20MHz channel bandwidths. In the experiment, two LTE channels are independently
transmitted over 300m OM1 MMF using a temperature controlled DFB laser (RF
bandwidth=2GHz). Due to limitations of the test and measurement equipment, the EVM of
each channel can only be measured independently, meaning that the recorded results are
pessimistic compared to a full MIMO EVM since MIMO processing compensation is not
employed. Figure 3.24 shows EVM vs carrier frequency curves and constellation diagrams.
The average EVM measurement for 3MHz, 10 MHz and 20 MHz channel bandwidths are
respectively 1.7%, 2.3% and 5.1%. These values are well within the 8% EVM requirement for
Vector Signal Analyser
Port 1 Port 2
MIMO -enabled multi -service RoF System
Switch Switch(see Fig. 3.21)
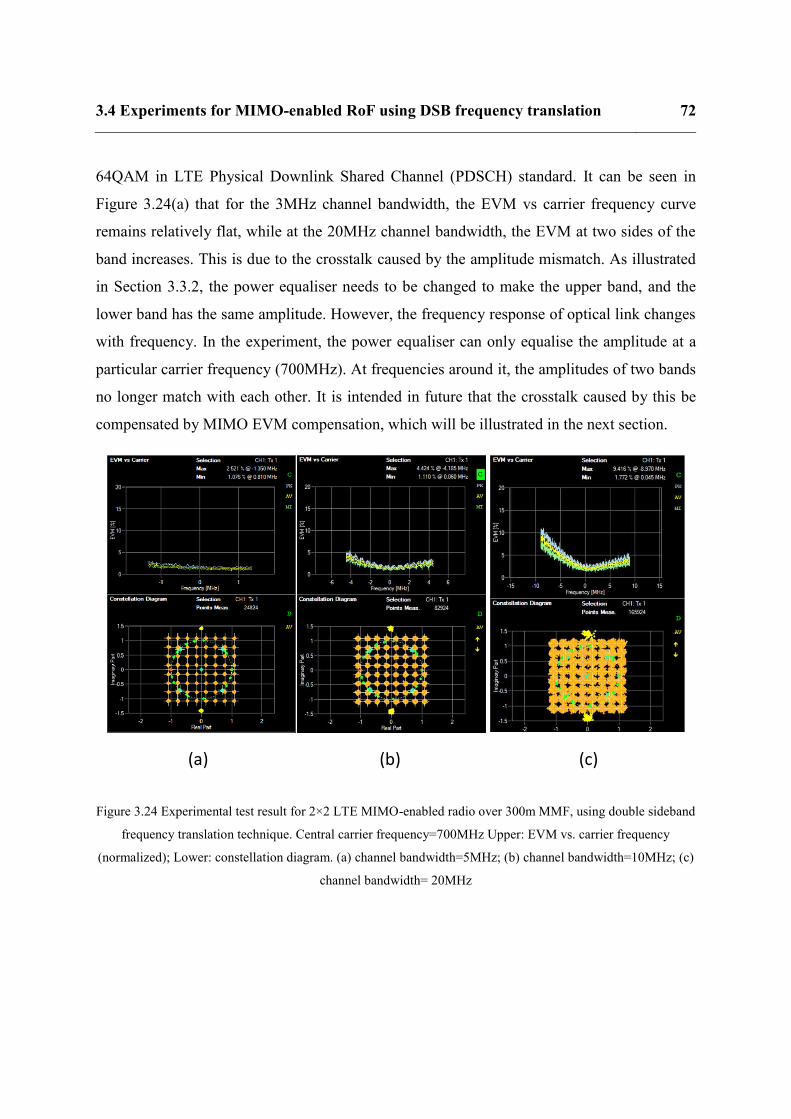
3.4 Experiments for MIMO-enabled RoF using DSB frequency translation 72
64QAM in LTE Physical Downlink Shared Channel (PDSCH) standard. It can be seen in
Figure 3.24(a) that for the 3MHz channel bandwidth, the EVM vs carrier frequency curve
remains relatively flat, while at the 20MHz channel bandwidth, the EVM at two sides of the
band increases. This is due to the crosstalk caused by the amplitude mismatch. As illustrated
in Section 3.3.2, the power equaliser needs to be changed to make the upper band, and the
lower band has the same amplitude. However, the frequency response of optical link changes
with frequency. In the experiment, the power equaliser can only equalise the amplitude at a
particular carrier frequency (700MHz). At frequencies around it, the amplitudes of two bands
no longer match with each other. It is intended in future that the crosstalk caused by this be
compensated by MIMO EVM compensation, which will be illustrated in the next section.
Figure 3.24 Experimental test result for 2×2 LTE MIMO-enabled radio over 300m MMF, using double sideband
frequency translation technique. Central carrier frequency=700MHz Upper: EVM vs. carrier frequency
(normalized); Lower: constellation diagram. (a) channel bandwidth=5MHz; (b) channel bandwidth=10MHz; (c)
channel bandwidth= 20MHz
(a) (b) (c)
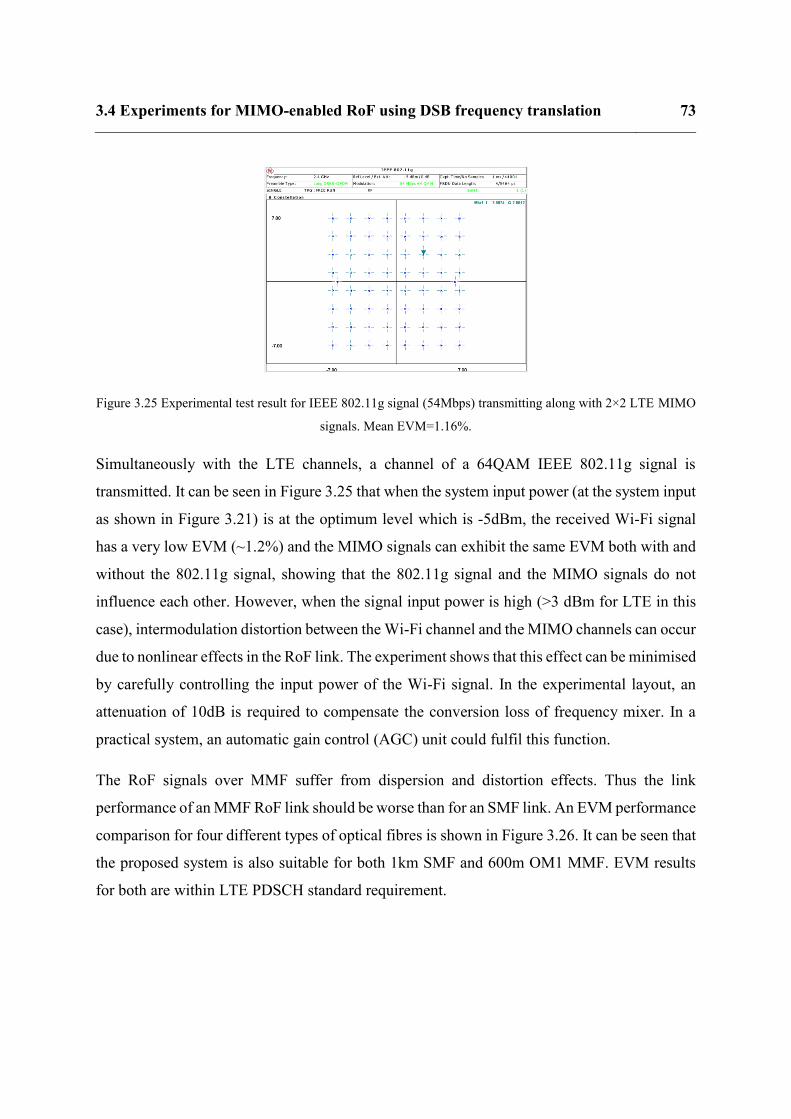
3.4 Experiments for MIMO-enabled RoF using DSB frequency translation 73
Figure 3.25 Experimental test result for IEEE 802.11g signal (54Mbps) transmitting along with 2×2 LTE MIMO
signals. Mean EVM=1.16%.
Simultaneously with the LTE channels, a channel of a 64QAM IEEE 802.11g signal is
transmitted. It can be seen in Figure 3.25 that when the system input power (at the system input
as shown in Figure 3.21) is at the optimum level which is -5dBm, the received Wi-Fi signal
has a very low EVM (~1.2%) and the MIMO signals can exhibit the same EVM both with and
without the 802.11g signal, showing that the 802.11g signal and the MIMO signals do not
influence each other. However, when the signal input power is high (>3 dBm for LTE in this
case), intermodulation distortion between the Wi-Fi channel and the MIMO channels can occur
due to nonlinear effects in the RoF link. The experiment shows that this effect can be minimised
by carefully controlling the input power of the Wi-Fi signal. In the experimental layout, an
attenuation of 10dB is required to compensate the conversion loss of frequency mixer. In a
practical system, an automatic gain control (AGC) unit could fulfil this function.
The RoF signals over MMF suffer from dispersion and distortion effects. Thus the link
performance of an MMF RoF link should be worse than for an SMF link. An EVM performance
comparison for four different types of optical fibres is shown in Figure 3.26. It can be seen that
the proposed system is also suitable for both 1km SMF and 600m OM1 MMF. EVM results
for both are within LTE PDSCH standard requirement.
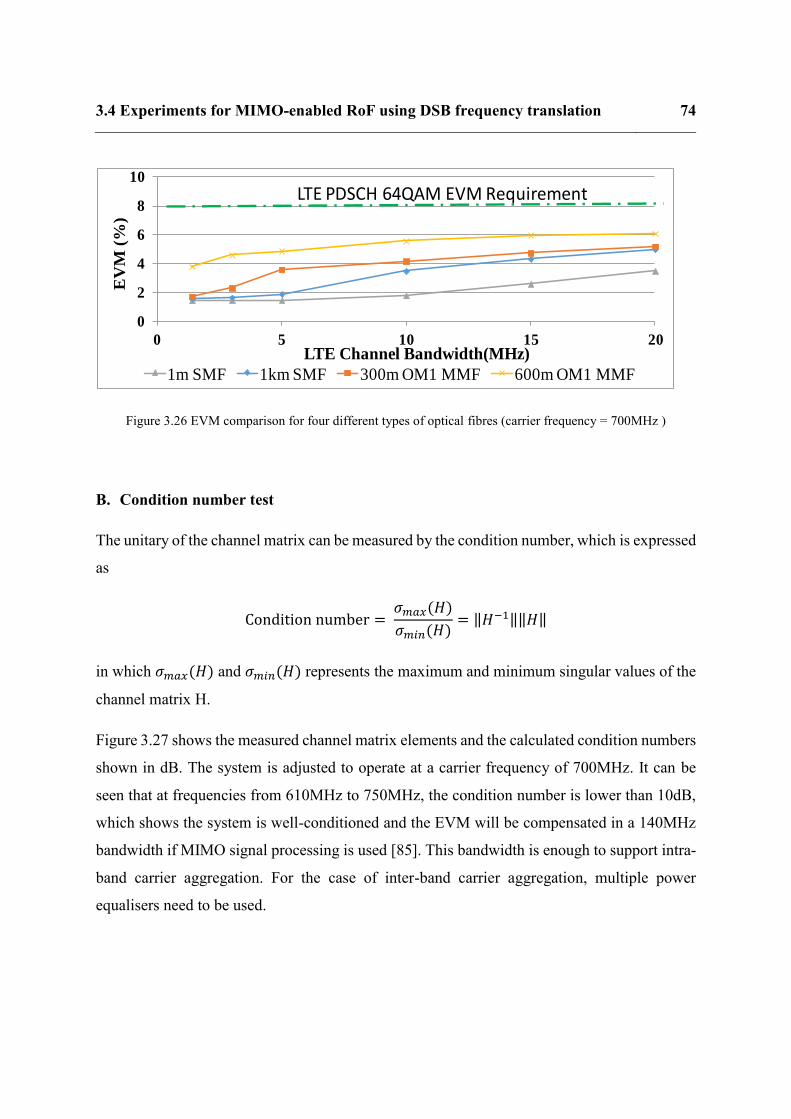
3.4 Experiments for MIMO-enabled RoF using DSB frequency translation 74
Figure 3.26 EVM comparison for four different types of optical fibres (carrier frequency = 700MHz )
B. Condition number test
The unitary of the channel matrix can be measured by the condition number, which is expressed
as
Condition number = 𝜎𝑚𝑎𝑥( )
𝜎𝑚𝑖𝑛( )= ‖ −1‖‖ ‖
in which 𝜎𝑚𝑎𝑥( ) and 𝜎𝑚𝑖𝑛( ) represents the maximum and minimum singular values of the
channel matrix H.
Figure 3.27 shows the measured channel matrix elements and the calculated condition numbers
shown in dB. The system is adjusted to operate at a carrier frequency of 700MHz. It can be
seen that at frequencies from 610MHz to 750MHz, the condition number is lower than 10dB,
which shows the system is well-conditioned and the EVM will be compensated in a 140MHz
bandwidth if MIMO signal processing is used [85]. This bandwidth is enough to support intra-
band carrier aggregation. For the case of inter-band carrier aggregation, multiple power
equalisers need to be used.
0
2
4
6
8
10
0 5 10 15 20
EV
M (
%)
LTE Channel Bandwidth(MHz)
1m SMF 1km SMF 300m OM1 MMF 600m OM1 MMF
LTE PDSCH 64QAM EVM Requirement

3.4 Experiments for MIMO-enabled RoF using DSB frequency translation 75
Figure 3.27 Measurement of channel matrix elements (phase is not shown) and calculated condition number vs
carrier frequency.
Limited by the phase error of the 90-degree hybrid couplers, the minimum value of the h12 and
h21 parameters are not at the same frequency (Figure 3.27). The minimum points for both the
h12 and h21 curves occur when one of the equation (11) and (13) is satisfied, and the
intersection of the two curves occurs when θ is chosen to be an optimum value between 𝜎1 +
ωLO∆t + 𝑛𝜋 and θ = ωLO∆t − 𝜎2 + 𝑛𝜋, such that h12 and h21 are both small. At this point,
the condition number is the lowest (0.27dB) and the EVM can be well compensated by MIMO
processing.
At the frequencies out of the bandwidth of the power equaliser, which is 610MHz to 750MHz
in this experiment, the condition number increases and the system become ill-conditioned. In
this case, the power equaliser needs to be adjusted.
C. Noise Figure, SFDR and EVM Dynamic Range Test
In the DSB system, when the upper and lower band signals are translated back to their original
frequency, they sum in the field. Thus there will theoretically be a 6dB signal power increase
over an SSB system. In contrast, the independent noise power will only be increased by 3dB.
Experimentally, it is shown that, compared with the SSB system, the DSB system can increase
0
10
20
30
40
50
60
70
80
-100
-90
-80
-70
-60
-50
-40
-30
-20
0.6 0.7 0.8 0.9 1
Co
nd
itio
n N
um
ber
(d
B)
Ch
an
nel
Ma
trix
Ele
men
ts (
dB
)
Carrier Frequency (GHz)
h11(dB) h21(dB) h12(dB) h22(dB) Condition Number (dB)

3.4 Experiments for MIMO-enabled RoF using DSB frequency translation 76
the output signal power by 5.8dB and output noise power by only 3.0dB, and thus the system
NF is lowered from 46.0dB to 43.2dB. This approximately agrees with theory and the 0.2dB
impairment can be attributed to the phase mismatch of the 90° hybrid coupler.
Figure 3.28 SFDR test for MIMO-enabled RoF system using DSB frequency translation
The SFDR of the MIMO-enabled DSB frequency translation system is measured. In Figure
3.28, it is shown that by adjusting the pre-amplifier gain, the system SFDR increases from 101
dB·Hz2/3 to above 107 dB·Hz2/3. This is because when pre-amplifier gain <22dB, the optical
link has the dominant noise figure in the whole system. Higher pre-amplifier gain can give
system higher OIP3 without significantly increasing output noise floor. When the pre-amplifier
gain >22dB, the noise introduced by the amplifier becomes dominant, thus the SFDR drops.
The detailed illustration will be shown in Chapter 5.
In Figure 3.29, a comparison between the system using DSB frequency translation and
conventional SSB frequency translation is made when using 3.84MHz channel bandwidth. A
variable attenuator is added at the output of the pre-amplifier to adjust the system dynamic
range. In the SSB system, two MIMO channels always have different EVM curves. This is due
to the bandwidth of the optical link – the upper band of the translated signal suffers from a

3.5 Summary and Conclusion 77
much higher RF loss than the lower band, which results in a lower SNR. However, in the DSB
system, as the two MIMO channels are orthogonally multiplexed, they occupy the same
spectrum and thus in principle have the same EVM performance. This leads to a much larger
effective EVM dynamic range.
Figure 3.29 EVM dynamic range improvement of DSB frequency translation from SSB frequency translation
3.5 Summary and Conclusion
In this chapter, a SISO RoF system was modelled and then extended into a MIMO RoF system.
The SISO RoF system can be modelled as a cascaded system, consisting of a pre-amplifier, an
optical link and a post-amplifier. The pre-amplifier’s gain needs to be chosen to be a suitable
value to get optimum system SFDR, but the gain of the post-amplifier does not significantly
affect system SFDR.
The DSB frequency translation system is an effective solution to transmit MIMO signals over
a single optical link. Compared with SSB frequency translation system, theoretically, the DSB
system has 2dB higher 3rder order SFDR. However, there are two major factors that contribute
to the crosstalk in the DSB frequency translation system, which can reduce the performance: i.
the phase error in 90-degree hybrid couplers; ii. the amplitude imbalance between the upper
and lower sidebands of the mixing products. In the simulation, if the crosstalk between two
0
1
2
3
4
5
6
-40 -30 -20 -10 0 10
EVM(%)
Pin(dBm)
SSB CH1 ATT=-16 SSB CH1 ATT=-8SSB CH1 ATT=-0 SSB CH2 ATT=-16
0
1
2
3
4
5
6
-30 -20 -10 0 10
EVM(%)
Pin(dBm)
DSB CH1 ATT=-16 DSB CH1 ATT=-8DSB CH1 ATT=-0 DSB CH2 ATT=-16

3.5 Summary and Conclusion 78
MIMO channels is required to be <-10dB, the amplitude variation in the S21 response of the
optical link should be <1dB and the phase error of the 90-degree hybrid coupler should be <4°.
Experimentally, a power-equaliser is installed to overcome the problem of the amplitude
imbalance between two sidebands of the mixing products. Therefore, 20MHz bandwidth LTE
MIMO radio over fibre system can be demonstrated beyond optical link’s 3dB RF bandwidth.
An IEEE 802.11g (Wi-Fi) and a 2x2 LTE MIMO service are transmitted together using the
DSB frequency translation. The optimum average EVM test result for the Wi-Fi service is 1.16%
and for LTE service is 1.7% (for 3MHz channels), 2.3% (for 10MHz channels) or 5.1% (for
20MHz channels). All these values are within the standard requirement.
The experimental results show the DSB frequency translation system has improved effective
dynamic range than the SSB frequency translation system because both of the MIMO channels
are symmetric and have the same EVM performance.

4.1 Introduction 79
Chapter 4 Broadband Implementation for MIMO
RoF using DSB Frequency Translation
4.1 Introduction
There is a range of wireless services that we transmit over distributed antenna systems, and all
these wireless services have different service providers. A service agnostic DAS needs to be
broadband and each of the services should not influence the others.
In a DSB frequency translation system, all services are transmitted through the same optical
link. Two major factors may cause crosstalk among services – i) the upper sideband and the
lower sideband after frequency translation may overlap with other services over the optical
link; ii) the second order harmonic of the service may influence the others.
In this chapter, the broadband implementation of a 2x2 MIMO RoF system using DSB
frequency translation technique will be investigated.
4.2 Services to be transmitted over a DAS
For a commercial DAS, various wireless services are required to be transmitted to users,
including 2G, 3G, 4G and Wi-Fi. On the other hand, not all the spectral regions need to be
transmitted over DAS, for example, the spectral regions for space to earth communication,
aeronautical mobile and aeronautical radio navigation. In a DSB frequency translation system,
the original MIMO signal is translated into the upper sideband and the lower sideband. The
system designer needs to make sure the sidebands after frequency translation occupy the
regions that are not used for other services on the DAS.

4.2 Services to be transmitted over a DAS 80
Figure 4.1 Typical services to be transmitted over a DAS in the UK
Figure 4.1 shows the frequency spectrum allocation for the 2G/3G/4G, Wi-Fi and WiMax
services in the UK. These services are typically required to be transmitted over a DAS. In the
UK, the LTE frequency bands are occupied by four major service providers – 3 mobile, EE,
O2, and Vodafone. They occupy 800MHz, 1800MHz, 2100MHz, 2600MHz and 3500MHz
frequency bands. For the UMTS services, the UK service providers are in 900MHz and
2100MHz bands. For the GSM services, the standard has defined several frequency bands, such
as GSM450, GSM800, GSM900, GSM1800, but only GSM900 and GSM1800 are used in the
UK [86, 87, 88, 89, 90].
Figure 4.2 Typical frequency bands that are not occupied in the DAS in the UK (reserved for space to earth
communication and aeronautical communication)
Although these services occupy many frequency bands, there are still empty spectral regions
on the DAS. These empty regions are usually occupied by military communication, satellite
communication and aeronautical communication [91], as shown in Figure 4.2. For example,
the spectrum from 470MHz to 790MHz cannot be assigned to civilian use, but “Ofcom may
agree to the use of these frequencies for military purposes with the Ministry of Defence” [91];
the wide band from 960MHz to 1350MHz is reserved for aeronautical mobile, aeronautical
radio navigation, radio navigation satellite, earth exploration satellite and space research [91].
~
LTE IEEE802.11 series IEEE802.16 seriesUMTSGSM

4.3 Local oscillator frequency selection 81
These empty spectral regions can be used to transmit the frequency translated MIMO signals
over the DAS. Detailed frequency spectrum allocation in the UK can be found in [91] and is
not listed here.
4.3 Local oscillator frequency selection
In a DSB frequency translation system, to translate original MIMO signals into unoccupied
frequency bands in a DAS, the local oscillator frequency needs to be carefully selected.
Figure 4.3 Example frequency translation map to translate 800MHz and 1.8GHz LTE channels into unoccupied
frequency bands on a DAS
Figure 4.3 shows an example frequency translation map. The 800MHz LTE channel, for
instance, can be translated into 1.4GHz and 3.0GHz bands by a 2.2GHz local oscillator and
both sidebands are then in the empty spectral region as shown in Figure 4.2.
As shown in Table 4.1 and Figure 4.3, by using a 2.2GHz local oscillator, the LTE services in
the UK can always be translated into unused spectral regions over the DAS. For the case outside
the UK, similar situations can be found. The 2.2GHz local oscillator frequency can be used in
many major countries in the world. The frequency translation maps using 2.2GHz LO for the
US and China are shown in
Translate to upper sidebandTranslate to lower sideband upper sidebandlower sideband LO
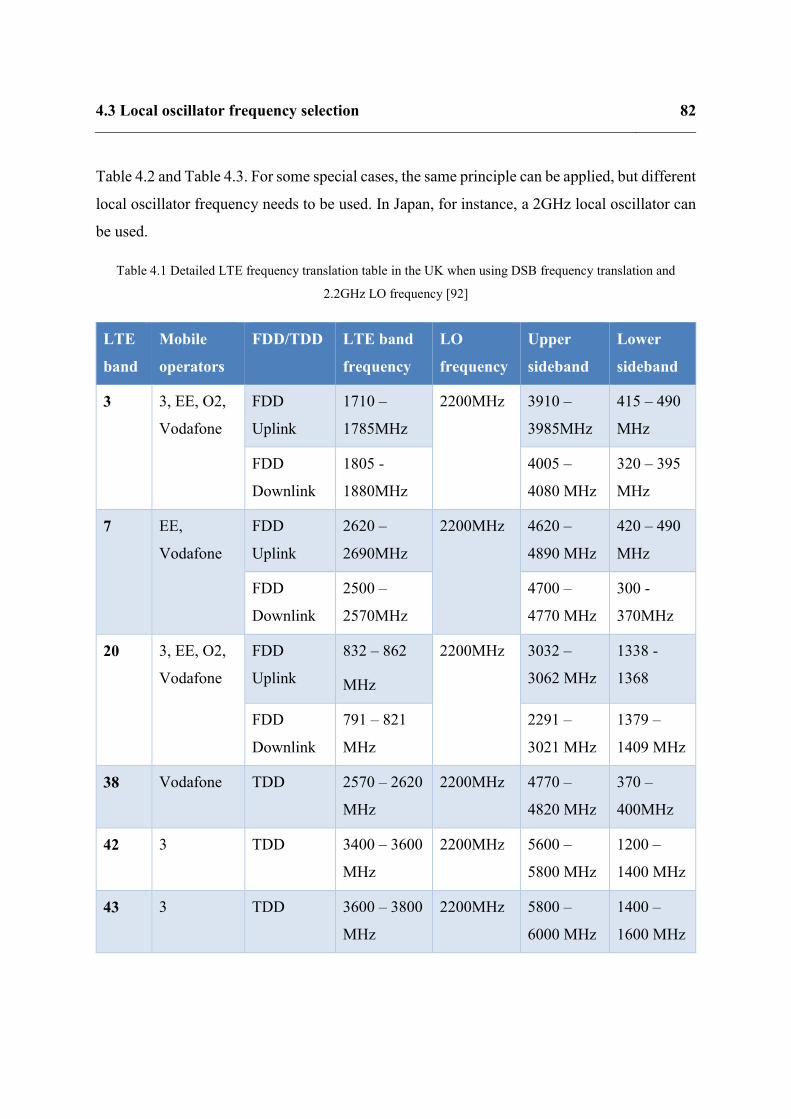
4.3 Local oscillator frequency selection 82
Table 4.2 and Table 4.3. For some special cases, the same principle can be applied, but different
local oscillator frequency needs to be used. In Japan, for instance, a 2GHz local oscillator can
be used.
Table 4.1 Detailed LTE frequency translation table in the UK when using DSB frequency translation and
2.2GHz LO frequency [92]
LTE
band
Mobile
operators
FDD/TDD LTE band
frequency
LO
frequency
Upper
sideband
Lower
sideband
3 3, EE, O2,
Vodafone
FDD
Uplink
1710 –
1785MHz
2200MHz 3910 –
3985MHz
415 – 490
MHz
FDD
Downlink
1805 -
1880MHz
4005 –
4080 MHz
320 – 395
MHz
7 EE,
Vodafone
FDD
Uplink
2620 –
2690MHz
2200MHz 4620 –
4890 MHz
420 – 490
MHz
FDD
Downlink
2500 –
2570MHz
4700 –
4770 MHz
300 -
370MHz
20 3, EE, O2,
Vodafone
FDD
Uplink
832 – 862
MHz
2200MHz 3032 –
3062 MHz
1338 -
1368
FDD
Downlink
791 – 821
MHz
2291 –
3021 MHz
1379 –
1409 MHz
38 Vodafone TDD 2570 – 2620
MHz
2200MHz 4770 –
4820 MHz
370 –
400MHz
42 3 TDD 3400 – 3600
MHz
2200MHz 5600 –
5800 MHz
1200 –
1400 MHz
43 3 TDD 3600 – 3800
MHz
2200MHz 5800 –
6000 MHz
1400 –
1600 MHz
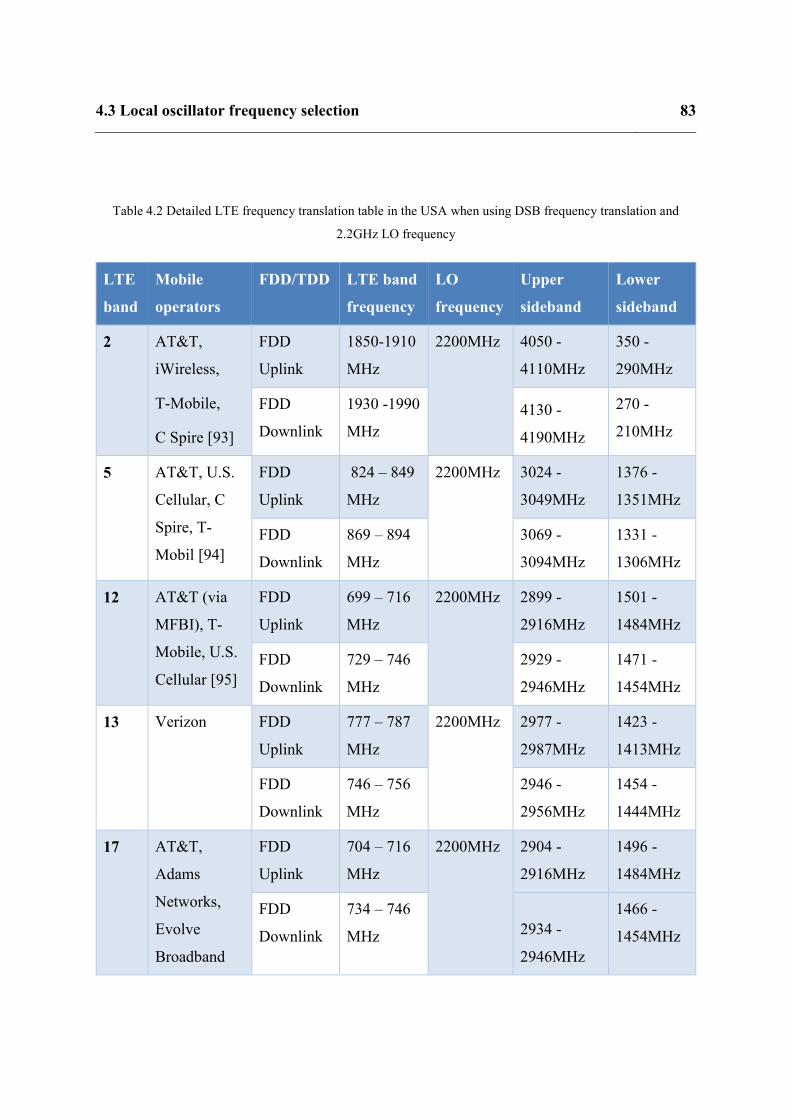
4.3 Local oscillator frequency selection 83
Table 4.2 Detailed LTE frequency translation table in the USA when using DSB frequency translation and
2.2GHz LO frequency
LTE
band
Mobile
operators
FDD/TDD LTE band
frequency
LO
frequency
Upper
sideband
Lower
sideband
2 AT&T,
iWireless,
T-Mobile,
C Spire [93]
FDD
Uplink
1850-1910
MHz
2200MHz 4050 -
4110MHz
350 -
290MHz
FDD
Downlink
1930 -1990
MHz
4130 -
4190MHz
270 -
210MHz
5 AT&T, U.S.
Cellular, C
Spire, T-
Mobil [94]
FDD
Uplink
824 – 849
MHz
2200MHz 3024 -
3049MHz
1376 -
1351MHz
FDD
Downlink
869 – 894
MHz
3069 -
3094MHz
1331 -
1306MHz
12 AT&T (via
MFBI), T-
Mobile, U.S.
Cellular [95]
FDD
Uplink
699 – 716
MHz
2200MHz 2899 -
2916MHz
1501 -
1484MHz
FDD
Downlink
729 – 746
MHz
2929 -
2946MHz
1471 -
1454MHz
13 Verizon FDD
Uplink
777 – 787
MHz
2200MHz 2977 -
2987MHz
1423 -
1413MHz
FDD
Downlink
746 – 756
MHz
2946 -
2956MHz
1454 -
1444MHz
17 AT&T,
Adams
Networks,
Evolve
Broadband
FDD
Uplink
704 – 716
MHz
2200MHz 2904 -
2916MHz
1496 -
1484MHz
FDD
Downlink
734 – 746
MHz 2934 -
2946MHz
1466 -
1454MHz
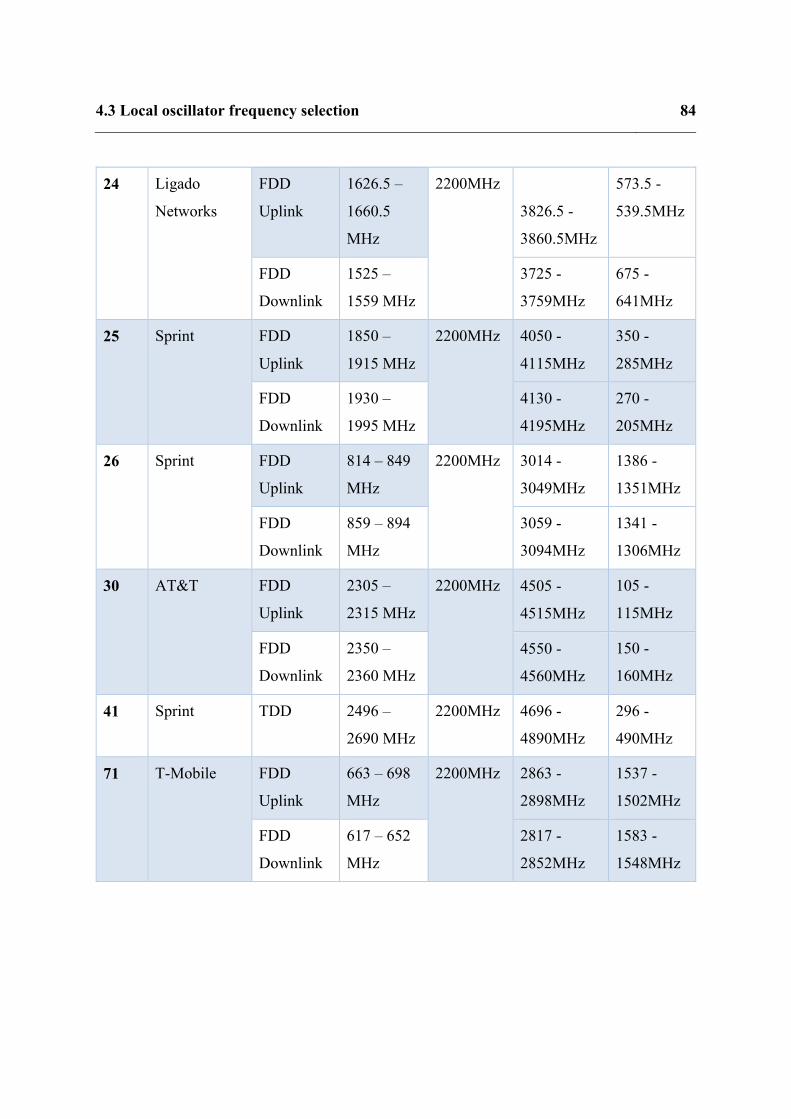
4.3 Local oscillator frequency selection 84
24 Ligado
Networks
FDD
Uplink
1626.5 –
1660.5
MHz
2200MHz
3826.5 -
3860.5MHz
573.5 -
539.5MHz
FDD
Downlink
1525 –
1559 MHz
3725 -
3759MHz
675 -
641MHz
25 Sprint FDD
Uplink
1850 –
1915 MHz
2200MHz 4050 -
4115MHz
350 -
285MHz
FDD
Downlink
1930 –
1995 MHz
4130 -
4195MHz
270 -
205MHz
26 Sprint FDD
Uplink
814 – 849
MHz
2200MHz 3014 -
3049MHz
1386 -
1351MHz
FDD
Downlink
859 – 894
MHz
3059 -
3094MHz
1341 -
1306MHz
30 AT&T FDD
Uplink
2305 –
2315 MHz
2200MHz 4505 -
4515MHz
105 -
115MHz
FDD
Downlink
2350 –
2360 MHz
4550 -
4560MHz
150 -
160MHz
41 Sprint TDD 2496 –
2690 MHz
2200MHz 4696 -
4890MHz
296 -
490MHz
71 T-Mobile FDD
Uplink
663 – 698
MHz
2200MHz 2863 -
2898MHz
1537 -
1502MHz
FDD
Downlink
617 – 652
MHz
2817 -
2852MHz
1583 -
1548MHz
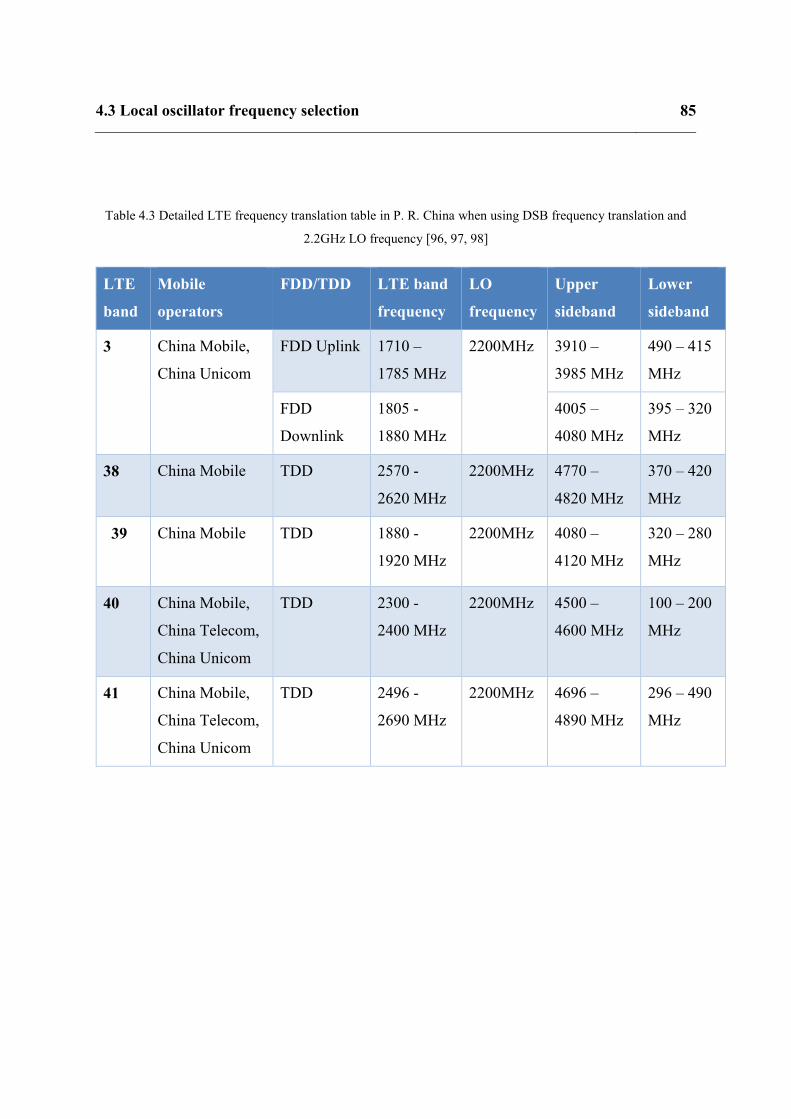
4.3 Local oscillator frequency selection 85
Table 4.3 Detailed LTE frequency translation table in P. R. China when using DSB frequency translation and
2.2GHz LO frequency [96, 97, 98]
LTE
band
Mobile
operators
FDD/TDD LTE band
frequency
LO
frequency
Upper
sideband
Lower
sideband
3 China Mobile,
China Unicom
FDD Uplink 1710 –
1785 MHz
2200MHz 3910 –
3985 MHz
490 – 415
MHz
FDD
Downlink
1805 -
1880 MHz
4005 –
4080 MHz
395 – 320
MHz
38 China Mobile TDD 2570 -
2620 MHz
2200MHz 4770 –
4820 MHz
370 – 420
MHz
39 China Mobile TDD 1880 -
1920 MHz
2200MHz 4080 –
4120 MHz
320 – 280
MHz
40 China Mobile,
China Telecom,
China Unicom
TDD 2300 -
2400 MHz
2200MHz 4500 –
4600 MHz
100 – 200
MHz
41 China Mobile,
China Telecom,
China Unicom
TDD 2496 -
2690 MHz
2200MHz 4696 –
4890 MHz
296 – 490
MHz

4.4 Experiment for broadband EVM test 86
4.4 Experiment for broadband EVM test
4.4.1 Experimental setup
The broadband performance of a DSB frequency translation 2x2 MIMO RoF system is tested
using an optical link with >10GHz RF bandwidth. A directly modulated DFB laser emitting at
1310nm wavelength and a 500m SMF link is used. The pre-amplifier used in the system has
been chosen to be a broadband amplifier, which can provide the system with a relatively flat
S21 amplitude-frequency response.
Figure 4.4 Experiment setup for S21 parameter measurement for broadband RoF optical link
Figure 4.5 S21 magnitude response for broadband optical link and pre-amplifier+optical link
The system S21 amplitude-frequency response has been tested using the setup shown in Figure
4.4. As shown in Figure 4.5, the S21 magnitude slowly decays with some fluctuation in the
required frequency bands (0.1GHz to 5.8GHz). The roll off at high frequencies is <5dB.
Switch
Vector Network
Analyzer
Pre-Amp
+ ATT
500m SMF
Direct modulated
DFB laser
Photodiode
+TIA
-40
-30
-20
-10
0
0 2 4 6 8 10
S2
1 M
ag
nit
ud
e (d
B)
Frequency (GHz)
Pre-amplifier + Optical link Optical link

4.4 Experiment for broadband EVM test 87
As illustrated in Section 3.3.2, to lower the crosstalk in the DSB frequency translation system,
a power equaliser needs to be used to balance the amplitude difference of the lower sideband
and the upper sideband after the frequency translation.
Figure 4.6 Experimental layout for 2×2 MIMO-enabled broadband RoF using DSB frequency translation
technique and frequency spectrum (700MHz carrier frequency LTE shown by way of example).
As shown in Figure 4.6, a power equaliser consisting of a low-pass filter and a high-pass filter
with 3dB cut-off frequencies at 2.2GHz and a variable attenuator is employed to compensate
any imbalance between the upper and lower bands of the signal after the optical link. A 2.2GHz
cut-off frequency is chosen to allow the upper and the lower bands to be separated without
affecting any of the frequency-translated LTE signals shown in Table 4.1. LTE MIMO-type
signals with 20MHz channel bandwidths are presented to the system input. The electrical
spectrums at different positions in the system are shown in Figure 4.6.
Figure 4.7 shows the experimental layout for the error vector magnitude (EVM) measurement.
A Rohde & Schwarz® SMW200A vector signal generator is used to generate an LTE channel,
while another Rohde & Schwarz® FMQ06B vector signal generator is used to generate a
64QAM signal with the same bandwidth and centre frequency to create an LTE-like signal at
the same RF frequency due to the availability of only one LTE signal source. A Rohde &
Schwarz® FSQ26 vector signal analyser (VSA) is used to receive and analyse the signal at the
RAU side.
-110
-100
-90
-80
-70
-60
-50
-40
-30
-20
-10
-2.5E+7 -1.5E+7 -5.0E+6 5.0E+6 1.5E+7 2.5E+7
Am
pli
tud
e (d
Bm
)
Offset Frequency
-90
-80
-70
-60
-50
-40
-30
-20
-10
5.0E+8 1.0E+9 1.5E+9 2.0E+9 2.5E+9 3.0E+9
Am
pli
tud
e(d
Bm
)
Frequency (Hz)
-110
-100
-90
-80
-70
-60
-50
-40
-2.5E+7 -1.5E+7 -5.0E+6 5.0E+6 1.5E+7 2.5E+7
Am
pli
tud
e (d
Bm
)
Offset Frequency (Hz)
Upper sidebandLower sideband
Local oscillator Leakage
Original Signal
Leakage
20MHz Bandwidth LTE
20MHz Bandwidth LTE
0
∏/2
0
∏/2
MIMO1
MIMO2
MIMO1
MIMO2
LO
0 0
Pre-Amp
+ ATT
Delay line
500m SMF
Direct modulated
DFB laser
Power
equalizer
ATT
LPF
HPF
Basestation(BS) Remote Antenna Unit(RAU)

4.4 Experiment for broadband EVM test 88
Figure 4.7 2x2 LTE MIMO EVM measurement setup
The system has been tested using LTE carrier frequencies from 700MHz to 2.6GHz, covering
most of the commercial LTE bands, other than 3.5 and 3.6GHz bands. This is because the
Rohde & Schwarz® SMW200A vector signal generator used in the experiment has a maximum
RF frequency of 3GHz, so it was not possible to generate test signals in these bands. If the
original carrier frequency is 3.5-3.6GHz, when using 2.2GHz LO, the upper sideband of the
signal after translation is at 5.7-5.8GHz respectively. As shown in Figure 4.5, these frequencies
are within 6dB RF bandwidth of the pre-amplifier + optical link. Therefore, the system can be
expected to also work for 3.5 and 3.6GHz bands.
4.4.2 Experimental results
Figure 4.8 Broadband EVM test result for 2×2 LTE MIMO-enabled RoF using DSB
frequency translation.
MIMO-enabled Broadband RoF system
Switch
VSG for
LTE signal
Vector Signal
Analyzer
VSG for
64QAM
64QAM EVM requirement
0
1
2
3
4
5
6
7
8
9
0.7 1.2 1.7 2.2 2.7
EV
M(%
)
Carrier Frequency (GHz)
3MHz LTE CH1 EVM (%) 3MHz LTE CH2 EVM (%)20MHz LTE CH1 EVM (%) 20MHz LTE CH2 EVM (%)
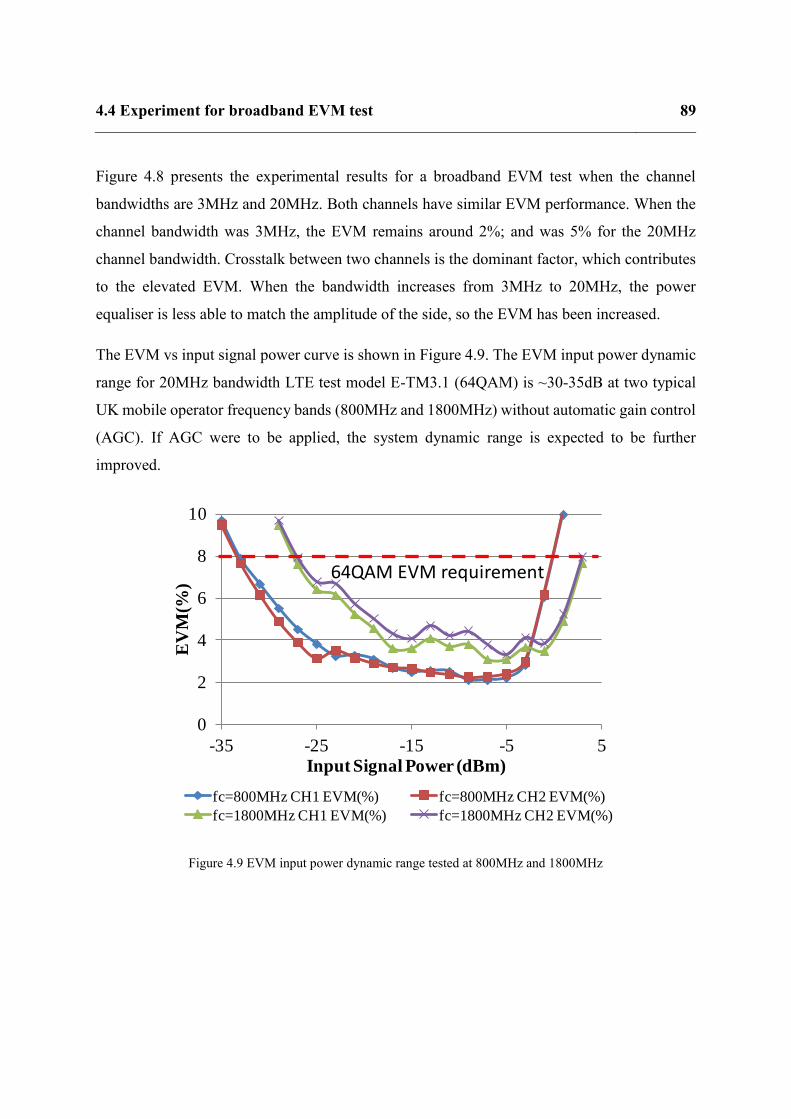
4.4 Experiment for broadband EVM test 89
Figure 4.8 presents the experimental results for a broadband EVM test when the channel
bandwidths are 3MHz and 20MHz. Both channels have similar EVM performance. When the
channel bandwidth was 3MHz, the EVM remains around 2%; and was 5% for the 20MHz
channel bandwidth. Crosstalk between two channels is the dominant factor, which contributes
to the elevated EVM. When the bandwidth increases from 3MHz to 20MHz, the power
equaliser is less able to match the amplitude of the side, so the EVM has been increased.
The EVM vs input signal power curve is shown in Figure 4.9. The EVM input power dynamic
range for 20MHz bandwidth LTE test model E-TM3.1 (64QAM) is ~30-35dB at two typical
UK mobile operator frequency bands (800MHz and 1800MHz) without automatic gain control
(AGC). If AGC were to be applied, the system dynamic range is expected to be further
improved.
Figure 4.9 EVM input power dynamic range tested at 800MHz and 1800MHz
0
2
4
6
8
10
-35 -25 -15 -5 5
EV
M(%
)
Input Signal Power (dBm)
fc=800MHz CH1 EVM(%) fc=800MHz CH2 EVM(%)
fc=1800MHz CH1 EVM(%) fc=1800MHz CH2 EVM(%)
64QAM EVM requirement

4.5 Demonstration for local oscillator signal remote delivery and real-life 2x2
MIMO RoF
90
.
Figure 4.10 Constellation diagrams for 800MHz carrier frequency 20MHz BW LTE: (a)
input power = -27dBm; (b) input power =-11dBm; (c) input power = 3dBm
4.5 Demonstration for local oscillator signal remote delivery and
real-life 2x2 MIMO RoF
In the experimental setup in Section 4.4.1 and Figure 4.6, the base station side and the RAU
side share the same local oscillator. In a real system, however, the local oscillator signal needs
to be remotely delivered to each RAU. Limited by the available equipment, the MIMO signal
processing is not included in the experiments in the previous sections. In this section, a real-
life 2x2 MIMO radio over fibre system will be demonstrated using an IEEE 802.11n 2x2
MIMO Wi-Fi signal.
4.5.1 Local oscillator signal remote delivery.
First of all, a simple experiment has been performed in the laboratory environment. As shown
inFigure 4.11, before the optical link, a local oscillator is split, and half of the signal power is
used to translate a 700MHz LTE signal into another carrier frequency (here 1.5GHz); the other
half of LO signal is combined with the LTE signal after the frequency translation and then
transmitted together via the optical link. The electrical spectrum after the photodiode is shown
in Figure 4.11, the LO signal and the LTE signal can be clearly seen in the diagram. After the
(a) (b) (c)

4.5 Demonstration for local oscillator signal remote delivery and real-life 2x2
MIMO RoF
91
photodiode, the LO signal is filtered out then fed back to translate the LTE signal back to the
original frequency using the mixer.
The EVM performance of the transmitted signal by using LO remote delivery is compared with
the ideal case (both the mixers from both sides of the optical link share the same local oscillator
source), as shown in Figure 4.12. The EVM performance of the system using remote LO
delivery is comparable to the ideal case.
Figure 4.11Experimental setup for LO remote delivery in an SCM system.
Because the LO is transmitted at relatively high RF power on the optical link, the high order
harmonics of the LO signal occur in the received spectrum. Because the LO signal used here
is 2.2GHz, as illustrated in Section 4.3, the LO high-order harmonic products (at 4.4GHz,
6.6GHz…) do not overlap with any of the other services to be transmitted over DAS. However,
it is still possible that the beating products of the LO and service signals on the optical link
influence the system performance. Therefore, the LO signals need to be attenuated before the
optical link to reduce or prevent distortion.
LTE
Signal generator for LO signal
Vector signal generator for LTE signal
500m SMF
DM DFB laser
PIN PD + TIA
LPF
BPF
Signal analyser
-80
-70
-60
-50
-40
-30
-20
-10
0
10
0 1E+09 2E+09 3E+09 4E+09
Am
pli
tud
e (d
Bm
)
Frequency (Hz)
Local oscillator signal
LTE signal after frequency translation

4.5 Demonstration for local oscillator signal remote delivery and real-life 2x2
MIMO RoF
92
Figure 4.12 EVM performance comparison between the LO remote delivery and the ideal case when using SCM
Figure 4.13 LO oscillator phase noise in LO remote delivery
0
2
4
6
8
10
12
-70 -60 -50 -40 -30 -20 -10 0
EV
M(%
)
Pin(dBm)
EVM(Remote LO) (%) EVM(Split LO) (%)Ideal
-160
-140
-120
-100
-80
-60
-40
-20
0
1E+1 1E+2 1E+3 1E+4 1E+5 1E+6 1E+7
Ph
ase
No
ise
(d
Bc/H
z)
Offset Frequency (Hz)Signal gen RAU mixer LO BS mixer LO

4.5 Demonstration for local oscillator signal remote delivery and real-life 2x2
MIMO RoF
93
The LO phase noise has been tested for the LO remote delivery as shown in Figure 4.13.The
local oscillator signal at the RAU side (after the optical link) has 10dB higher phase noise when
offset frequency >1MHz.
Now we extend the system into a 2x2 MIMO RoF system using the DSB frequency translation
technique. As shown in Figure 4.14, two vector signal generators are used at the system input
for two channels of MIMO type signals at the 700MHz carrier frequency, and they are
multiplexed together using the DSB frequency translation technique. A sine wave at 2.2GHz
frequency and 18dBm electrical power is generated as the LO signal at the base station side
(before the optical link). A power splitter follows the LO signal generator to split the LO signal
two ways – one is used to feed the mixers at the base station side, the other is attenuated by
20dB and then transmitted to the RAU side. At the RAU side, the LO signal from the optical
link is filtered out and amplified to feed the mixers.
Figure 4.14 Experimental layout for DSB 2x2 MIMO RoF system using LO remote delivery.
LTE
Signal generator for LO signal
Vector signal generator for MIMO2
500m SMF
DM DFB laser
PIN PD + TIA BPF
Signal analyser0
pi/2
LTE
Vector signal generator for MIMO1
Att
Amp
Amp
Phaseshifter
Basestation side
RAU side
Phaseshifter

4.5 Demonstration for local oscillator signal remote delivery and real-life 2x2
MIMO RoF
94
Figure 4.15 EVM test result for both MIMO channels when using LO remote delivery
Figure 4.16 Constellation and EVM vs. carrier frequency diagrams for the LO remote delivery in 2x2 DSB
MIMO RoF system: (a) at -35dBm input signal power; (b) at -12dBm input signal power; (c)at -3dBm input
signal power
Figure 4.15 shows the EVM test result for both MIMO channels. As both channels have
identical EVM performance, only one curve has been presented here. It can be seen that the
LO has been effectively delivered to the RAU. The EVM result is well below the standard
requirement for 64QAM in ~35dB range, and if an AGC is used, the dynamic range can be
further improved. Also, the EVM performance for using LO remote delivery is comparable to
0
2
4
6
8
10
12
14
16
-45 -40 -35 -30 -25 -20 -15 -10 -5 0
EV
M(%
)
Input Signal Power (dBm)
Remote LO 20MHz BW LTE CH1 Remote LO 20MHz BW LTE CH2
Split LO 20MHz BW LTE both CHs
E U T R A /L T E
Freq: 700 MHz Meas Setup: 1 TX x 1 RX Ext. A tt: 0 dB
Mode: DL FDD, 100 RB (20 MHz), Normal (C P ) Sync State: O K C apture T ime: 20.1 ms
SINGLE TRG : FREE RUN RF Frame 1 O f 1 (1)
A C ons te l l a t i o n D i a g ram Points Meas. 17988
-5 -4 -3 -2 -1 0 1 2 3 4 5
-1.0
-0.5
0.0
0.5
1.0
-1.5
1.5
B E V M v s C a rr i e r(% ) A V M I P K
-15.36 MHz 15.36 MHz3.07 MHz/div
2
4
6
8
10
12
14
16
18
Date: 11.MAY.2016 16:02:24
E U T R A /L T E
Freq: 700 MHz Meas Setup: 1 TX x 1 RX Ext. A tt: 0 dB
Mode: DL FDD, 100 RB (20 MHz), Normal (C P ) Sync State: O K C apture T ime: 20.1 ms
SINGLE TRG : FREE RUN RF Frame 1 O f 1 (1)
A C ons te l l a t i o n D i a g ram Points Meas. 17988
-5 -4 -3 -2 -1 0 1 2 3 4 5
-1.0
-0.5
0.0
0.5
1.0
-1.5
1.5
B E V M v s C a rr i e r(% ) A V M I P K
-15.36 MHz 15.36 MHz3.07 MHz/div
2
4
6
8
10
12
14
16
18
Date: 11.MAY.2016 16:05:03
E U T R A /L T E
Freq: 700 MHz Meas Setup: 1 TX x 1 RX Ext. A tt: 0 dB
Mode: DL FDD, 100 RB (20 MHz), Normal (C P ) Sync State: O K C apture T ime: 20.1 ms
SINGLE TRG : FREE RUN RF Frame 1 O f 1 (1)
A C ons te l l a t i o n D i a g ram Points Meas. 17988
-5 -4 -3 -2 -1 0 1 2 3 4 5
-1.0
-0.5
0.0
0.5
1.0
-1.5
1.5
B E V M v s C a rr i e r(% ) A V M I P K
-15.36 MHz 15.36 MHz3.07 MHz/div
2
4
6
8
10
12
14
16
18
Date: 11.MAY.2016 16:06:48
4.5 Demonstration for local oscillator signal remote delivery and real-life 2x2
MIMO RoF
95
the ideal case (when the BS side and the RAU side share the same LO). The constellation
diagrams at -35dBm, -12dBm and -3dBm input power are shown in Figure 4.16.
4.5.2 Real-life Wi-Fi 2x2 MIMO RoF test with free-space propagation
In the previous sections, the MIMO signal processing and the free-space propagation has not
been included. Although the MIMO signal processing can improve the previous EVM test
results, a real-life 2x2 MIMO RoF system test is done to show the feasibility of using the DSB
frequency translation RoF system.
Limited by the equipment, an experiment has been carried out using IEEE 802.11n MIMO
signal. As shown in Figure 4.17, a computer with an IEEE 802.11n 2x2 MIMO wireless card
with has been used as a server, which is shielded inside a metal cupboard and no signal leak
out. The downlink MIMO signal from the server is transmitted to the remote antennas using
SSB and DSB frequency translation via a 500m SMF link. The layout of the SSB and the DSB
systems are as shown in Figure 3.14 and Figure 3.15. Another computer with an IEEE802.11
MIMO wireless card and antennas are used as a client to receive MIMO signals from the free
space. The uplink is connected directly using coaxial cables with gain control to maintain the
same gain with the downlink.

4.5 Demonstration for local oscillator signal remote delivery and real-life 2x2
MIMO RoF
96
Figure 4.17 Experiment setup for Wi-Fi 2x2 MIMO RoF throughput test
The throughput test is done by TamoSoft® Throughput Test software using UDP and IPv4
protocols. The downlink throughput is tested and 100 data points have been collected
respectively for the SISO back-to-back and SSB/DSB frequency translation system. The
throughput cumulative distribution function is as shown in Figure 4.18. It can be seen that the
Wi-Fi MIMO signal can be delivered to the client. When the DSB 2x2 MIMO RoF system is
used the system can achieve ~1.5 times throughput as the SISO back-to-back result. There are
some points in the SSB/DSB frequency translation system that has low throughput. This is
because the Wi-Fi transceiver used here is operating in the EVM margin, some degradation in
the optical link can cause the system in operation in the lower dimension modulation scheme.
11n 2x2 MIMO Wireless card
2x2 MIMO ROF downlink
(500m SMF)
11n 2x2 MIMO Wireless card
Server
Client
Shielded in a metal cupboard
1m free-space
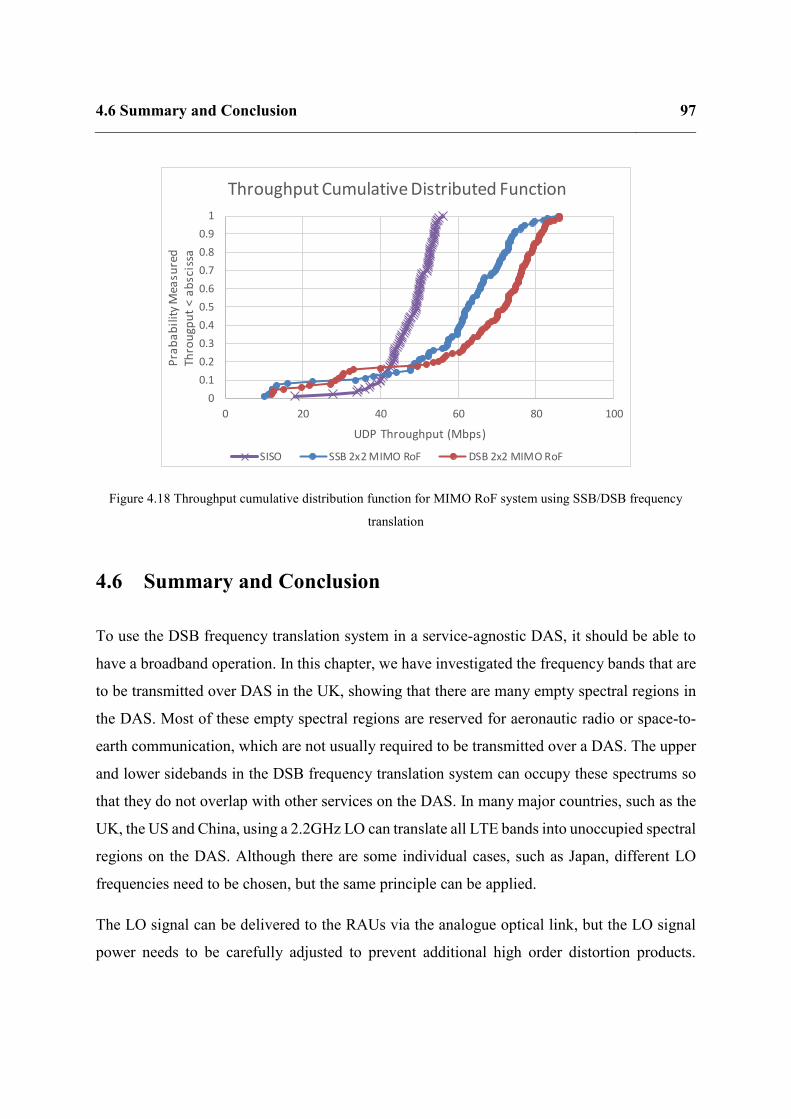
4.6 Summary and Conclusion 97
Figure 4.18 Throughput cumulative distribution function for MIMO RoF system using SSB/DSB frequency
translation
4.6 Summary and Conclusion
To use the DSB frequency translation system in a service-agnostic DAS, it should be able to
have a broadband operation. In this chapter, we have investigated the frequency bands that are
to be transmitted over DAS in the UK, showing that there are many empty spectral regions in
the DAS. Most of these empty spectral regions are reserved for aeronautic radio or space-to-
earth communication, which are not usually required to be transmitted over a DAS. The upper
and lower sidebands in the DSB frequency translation system can occupy these spectrums so
that they do not overlap with other services on the DAS. In many major countries, such as the
UK, the US and China, using a 2.2GHz LO can translate all LTE bands into unoccupied spectral
regions on the DAS. Although there are some individual cases, such as Japan, different LO
frequencies need to be chosen, but the same principle can be applied.
The LO signal can be delivered to the RAUs via the analogue optical link, but the LO signal
power needs to be carefully adjusted to prevent additional high order distortion products.
0
0.1
0.2
0.3
0.4
0.5
0.6
0.7
0.8
0.9
1
0 20 40 60 80 100
Pra
ba
bil
ity
Mea
sure
dTh
rou
gpu
t <
ab
scis
sa
UDP Throughput (Mbps)
Throughput Cumulative Distributed Function
SISO SSB 2x2 MIMO RoF DSB 2x2 MIMO RoF

4.6 Summary and Conclusion 98
Experimentally, the LO signal at the base station side needs to be attenuated by ~10dB before
the optical link. The EVM performance of the LO remote delivery in the DSB frequency
translation system is <2% higher than the ideal LO delivery (using the LO signal is split to feed
the BS side and the RAU side). A real-life WiFi MIMO radio over fibre system has been
demonstrated using LO remote delivery, showing that the system can successfully deliver Wi-
Fi MIMO signal from the central unit to the client. The throughput is tested using the SSB and
DSB frequency translation for 2x2 MIMO RoF. The SSB system gives >60 Mbps throughput,
and the DSB system offers >70 Mbps throughput.
5.1 Introduction 99
Chapter 5 SFDR improvement using multiple-
sideband frequency translation
5.1 Introduction
In the previous sections, we have described a DSB frequency translation system; two MIMO
channels are multiplexed onto sidebands with a 90° phase shift. At the RAU side, the signals
are de-multiplexed back to the original frequency. The noise from the upper and lower
sidebands adds incoherently, but the wanted signals add coherently at the output. As a result,
the DSB system can theoretically have a 2dB higher SFDR than the SSB system. The SFDR is
a particularly important metric and one of the performance limiting factors for RF services on
RoF links.
In this chapter, we extend this concept to a general quadrature-multiplexed frequency
translation system and show that if the original RF signal is translated into more than two
sidebands, for instance, quadruple sidebands (QSB), the system is not only MIMO-capable but
can also exceed the 3rd order SFDR limit of the intrinsic optical link. This shows that in a
general radio over the fibre system, the RF bandwidth in the optical link can be traded for
electrical SFDR by increasing the number of sidebands onto which the original RF signal is
modulated.

5.2 Theory of 3rd order SFDR improvement in a quadrature-multiplexed
frequency translation system
100
5.2 Theory of 3rd order SFDR improvement in a quadrature-
multiplexed frequency translation system
A model has been built to analyse the 3rd order SFDR performance when original MIMO signal
has been translated into different numbers of sidebands by using multiple frequency mixers. In
a DSB frequency translation system, at the base station side, the original signal is translated
into two sidebands using a frequency mixer. In the case for more than two sidebands, multiple
mixers are cascaded. After the optical link, the frequency mixers combine all the sidebands
back together, making the signal add coherently, but the noise adds incoherently. Figure 5.1
shows the layout for translating the RF signal into double sidebands (DSB), quadruple
sidebands (QSB) and octuple sidebands (OSB). In the QSB system, two pairs of frequency
mixers are used at each side of the optical link, while in the OSB system, three pairs are used.
Figure 5.1 Translate signal into different numbers of sidebands, DSB: two sidebands; QSB: four sidebands;
OSC: eight sidebands
0
pi/2
0
pi/2
0
pi/2
0
pi/2
0
pi/2
0
pi/2
0
pi/2
0
pi/2
0
pi/2
0
pi/2
0
pi/2
0
pi/2
Intrinsic Optical Link
DSB
QSB
OSB
Pre-amp
Pre-amp
Pre-amp

5.2 Theory of 3rd order SFDR improvement in a quadrature-multiplexed
frequency translation system
101
Mathematically, we consider a radio over fibre system has thermal noise as input noise (𝑛𝑡ℎ).
The total cascaded output noise floor can be represented as,
𝑛𝑜𝑢𝑡 = 𝑛𝑡ℎ𝑔𝑜𝑝𝑡𝑔𝑚𝑖𝑥2(𝑛𝑓𝑜𝑝𝑡 − 1 + 𝑔𝑎𝑚𝑝𝑛𝑓𝑎𝑚𝑝 − 𝑔𝑎𝑚𝑝) 𝑚 (5.1)
where 𝑛𝑡ℎ is thermal noise; 𝑔𝑜𝑝𝑡, 𝑔𝑚𝑖𝑥2 and 𝑔𝑎𝑚𝑝 are respectively the gains of the optical link,
the mixers at the RAU side and the pre-amplifier; 𝑛𝑓𝑜𝑝𝑡 and 𝑛𝑓𝑎𝑚𝑝 are the noise factors of the
intrinsic optical link and pre-amplifier; 𝑚 is the number of sidebands that the system uses, for
example, 𝑚 = 4 if it is a quadruple sideband system.
The total cascaded iip3 is,
𝑖𝑖𝑝3𝑇 = (1
𝑖𝑖𝑝 𝑚𝑖𝑥1+
𝑔𝑚𝑖𝑥1
𝑖𝑖𝑝 𝑎𝑚𝑝+
𝑔𝑚𝑖𝑥1𝑔𝑎𝑚𝑝
𝑖𝑖𝑝 𝑜𝑝𝑡+
𝑔𝑚𝑖𝑥1𝑔𝑎𝑚𝑝𝑔𝑜𝑝𝑡
𝑖𝑖𝑝 𝑚𝑖𝑥2)−1
( 5.2)
Therefore, the total 3rd order sfdr is,
𝑠𝑓 𝑟3 = (𝑜𝑖𝑝 𝑇
𝑛𝑜𝑢𝑡)2 = (
𝑔𝑇∗𝑖𝑖𝑝 𝑇
𝑛𝑜𝑢𝑡)2 (5.3)
in which,
𝑔𝑇 = 𝑔𝑚𝑖𝑥1 ∗ 𝑔𝑎𝑚𝑝 ∗ 𝑔𝑜𝑝𝑡 ∗ 𝑔𝑚𝑖𝑥2 (5.4)
𝑚𝑖𝑥1 and 𝑚𝑖𝑥2 respectively represents the overall effect of the mixers at the basestation side
and the RAU side.
Combining equations (5.1), (5.2) and (5.3)
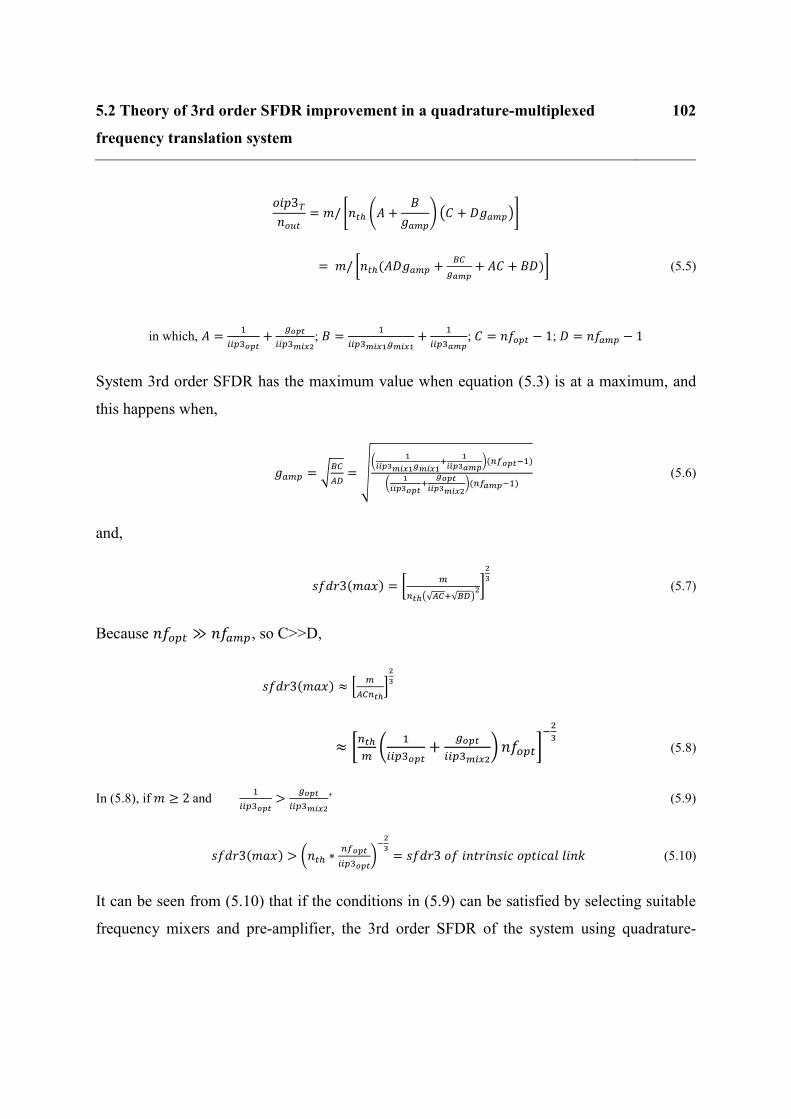
5.2 Theory of 3rd order SFDR improvement in a quadrature-multiplexed
frequency translation system
102
𝑜𝑖𝑝3𝑇𝑛𝑜𝑢𝑡
= 𝑚 [𝑛𝑡ℎ (𝐴 +
𝑔𝑎𝑚𝑝
) (𝐶 + 𝐷𝑔𝑎𝑚𝑝)]
= 𝑚 [𝑛𝑡ℎ(𝐴𝐷𝑔𝑎𝑚𝑝 +𝐵𝐶
𝑔𝑎𝑚𝑝+ 𝐴𝐶 + 𝐷)] (5.5)
in which, 𝐴 =1
𝑖𝑖𝑝 𝑜𝑝𝑡+
𝑔𝑜𝑝𝑡
𝑖𝑖𝑝 𝑚𝑖𝑥2; =
1
𝑖𝑖𝑝 𝑚𝑖𝑥1𝑔𝑚𝑖𝑥1+
1
𝑖𝑖𝑝 𝑎𝑚𝑝; 𝐶 = 𝑛𝑓𝑜𝑝𝑡 − 1; 𝐷 = 𝑛𝑓𝑎𝑚𝑝 − 1
System 3rd order SFDR has the maximum value when equation (5.3) is at a maximum, and
this happens when,
𝑔𝑎𝑚𝑝 = √𝐵𝐶
𝐴𝐷= √
(1
𝑖𝑖𝑝3𝑚𝑖𝑥1𝑔𝑚𝑖𝑥1+
1
𝑖𝑖𝑝3𝑎𝑚𝑝)(𝑛𝑓𝑜𝑝𝑡−1)
(1
𝑖𝑖𝑝3𝑜𝑝𝑡+
𝑔𝑜𝑝𝑡
𝑖𝑖𝑝3𝑚𝑖𝑥2)(𝑛𝑓𝑎𝑚𝑝−1)
(5.6)
and,
𝑠𝑓 𝑟3(𝑚𝑎𝑥) = [𝑚
𝑛𝑡ℎ(√𝐴𝐶+√𝐵𝐷)2]
2
3 (5.7)
Because 𝑛𝑓𝑜𝑝𝑡 ≫ 𝑛𝑓𝑎𝑚𝑝, so C>>D,
𝑠𝑓 𝑟3(𝑚𝑎𝑥) ≈ [𝑚
𝐴𝐶𝑛𝑡ℎ]
2
3
≈ [𝑛𝑡ℎ
𝑚(
1
𝑖𝑖𝑝 𝑜𝑝𝑡+
𝑔𝑜𝑝𝑡
𝑖𝑖𝑝 𝑚𝑖𝑥2) 𝑛𝑓𝑜𝑝𝑡]
−2
3 (5.8)
In (5.8), if 𝑚 ≥ 2 and 1
𝑖𝑖𝑝 𝑜𝑝𝑡>
𝑔𝑜𝑝𝑡
𝑖𝑖𝑝 𝑚𝑖𝑥2’ (5.9)
𝑠𝑓 𝑟3(𝑚𝑎𝑥) > (𝑛𝑡ℎ ∗𝑛𝑓𝑜𝑝𝑡
𝑖𝑖𝑝 𝑜𝑝𝑡)−2
3= 𝑠𝑓 𝑟3 𝑜𝑓 𝑖𝑛𝑡𝑟𝑖𝑛𝑠𝑖𝑐 𝑜𝑝𝑡𝑖𝑐𝑎𝑙 𝑙𝑖𝑛𝑘 (5.10)
It can be seen from (5.10) that if the conditions in (5.9) can be satisfied by selecting suitable
frequency mixers and pre-amplifier, the 3rd order SFDR of the system using quadrature-

5.3 Simulation results and link trade-offs 103
multiplexed multiple sideband frequency translation technique can be higher than the intrinsic
optical link.
5.3 Simulation results and link trade-offs
Using the layout as shown in Figure 5.1, simulations have been performed, assuming the
intrinsic optical link has -33dB gain, 57.3 dB noise figure and 37.5dBm IIP3; each frequency
mixer has 22dBm IIP3 and -8dB conversion gain. These values are the same with the
experimental measurements in previous sections.
Figure 5.2 Simulation result: the system maximum possible 3rd order SFDR and pre-amplifier gain required to
achieve maximum SFDR [99]
As shown in Figure 5.2, when the pre-amplifier has low noise figure, the system has to increase
SFDR with the number of frequency bands. This is because the original MIMO signal has
been spread into more frequency sidebands in the optical domain. And when these bands are
combined back, the noise adds incoherently, but the signal adds coherently. As shown in
equation (5.8), 𝑠𝑓 𝑟3(𝑚𝑎𝑥) rises with the number of sidebands (m).
0
10
20
30
40
50
60
101
103
105
107
109
111
113
115
2 4 8 16 32
Pre
-am
p g
ain
req
uri
ed
to
ach
ieve
maxim
um
SF
DR
(d
B)
Maxim
um
3rd
ord
er
SF
DR
(d
B*H
z^
2/3
)
Number of bandsSFDR NF=3 SFDR NF=5 SFDR NF=10 SFDR NF=15Pre-amp Gain NF=3 Pre-amp Gain NF=5 Pre-amp Gain NF=10 Pre-amp Gain NF=15
SFDR of intrinsic optical link.
NF=3
NF=5
NF=10
NF=15
NF=3
NF=15
……
5.4 Experiment on the 3rd order SFDR improvement by trading optical
bandwidth
104
On the other hand, to achieve the maximum SFDR, the required gain of pre-amplifier becomes
higher with the number of frequency bands. This is because the overall mixers’ conversion loss
increases with the number of mixers used in the system and higher pre-amplifier gain is
required to compensate the conversion loss of the mixers before the optical link. As shown in
equation (5.6), because of using multiple frequency mixers, the mixers’ overall conversion gain
(gmix1and gmix2 ) and IIP3 ( iip3mix1 and iip3mix2 ) will be lowered, meaning higher pre-
amplifier gain (gamp) will be required.
It can also be seen in Figure 5.2 that the pre-amplifier noise figure affects the maximum system
SFDR. If the pre-amplifier noise figure>10dB, the maximum system SFDR does not increase
much when there are more than eight bands. This is because, if the pre-amplifier has high noise
figure, the output noise of the amplifier overtakes the optical link’s noise floor in lower gain.
5.4 Experiment on the 3rd order SFDR improvement by trading
optical bandwidth
A proof-of-principle experiment has been carried out using DSB and QSB frequency
translation. A two-tone test has been performed at the 800MHz centre frequency, with a 1MHz
frequency separation on one of the input channels with the other terminated, as shown in Figure
5.3. If both MIMO channels are occupied, the optimum pre-amplifier gain is lower so that the
same composite power is presented to the optical link. However, the maximum SFDR is only
slightly reduced since the optical ink is the most significant noise source, so the output noise is
largely unaffected by the change in amplifier gain.

5.4 Experiment on the 3rd order SFDR improvement by trading optical
bandwidth
105
Figure 5.3 Experiment layout: two-tone test for 3rd order SFDR measurement of a 2x2 MIMO RoF system
Figure 5.4 Layout for quadrature-multiplexed frequency translation system.
(a)DSB system (b)QSB system (dash line part is not used in SFDR test)
The layouts for the DSB and QSB systems are as shown in Figure 5.4 (a)(b). The optical link
in the experiment uses a directly modulated DFB laser, a 500m SMF link and a PIN photodiode
2x2 MIMO ROF using DSB or QSB frequency
translationTerminator Terminator
0
∏/2
0
∏/2
MIMO CH1 MIMO CH1
MIMO CH2
LO Delay
Basestation(BS) Remote Antenna Unit(RAU)
MIMO CH2
Pre-AmpSMF
Direct modulated
DFB laser
PD +TIA LO
(a)
MIMO CH1 MIMO CH1
LO1
Basestation(BS) Remote Antenna Unit(RAU)Pre-Amp
MIMO CH2
0
∏/2LO2
∏/2
0 0
∏/2LO2 + delay
∏/2
0
MIMO CH2(b)
LO1 + delay

5.5 Simulation on the capability to transmit MIMO-type signals using QSB
frequency translation
106
with a transimpedance amplifier (TIA). The RF pre-amplifier has 40dB maximum gain and
10dB NF.
The experimental results for the SFDR measurement are shown in Figure 5.5. The 3rd order
SFDR of the DSB and the QSB systems are 104.5 dB·Hz-2/3 and 105.5 dB·Hz-2/3 respectively,
while the 3rd order SFDR of the intrinsic optical link is 102.8 dB·Hz-2/3. Therefore, by using
DSB and QSB frequency translation, the system 3rd order SFDR has been improved by 1.7dB
and 2.7dB beyond that of the intrinsic optical link respectively. The results are achieved using
a pre-amplifier gain of 30dB for the DSB system and 35dB for the QSB system. These results
are in line with the theory presented above.
Figure 5.5 Experimentally measured 3rd order SFDR of DSB and QSB system at 800MHz centre frequency,
comparing with intrinsic optical link
5.5 Simulation on the capability to transmit MIMO-type signals
using QSB frequency translation
To show the system’s MIMO capability, a simulation has been performed in
VPItransmissionMakerTM with the same QSB system layout as in Figure 5.4(b). The optical
-180
-160
-140
-120
-100
-80
-60
-40
-20
0
20
-50 -30 -10 10 30 50
Po
ut(
dB
m)
Pin(dBm)
Optical link output fundamental (dBm) Optical link output 3rd order harmonics (dBm)
DSB output fundamental (dBm) DSB output 3rd order harmonics (dBm)
QSB output fundamental (dBm) QSB output 3rd order harmonics (dBm)
QSBDSBOpt Link
Noise floor for each measurement has been
normalised to the same level
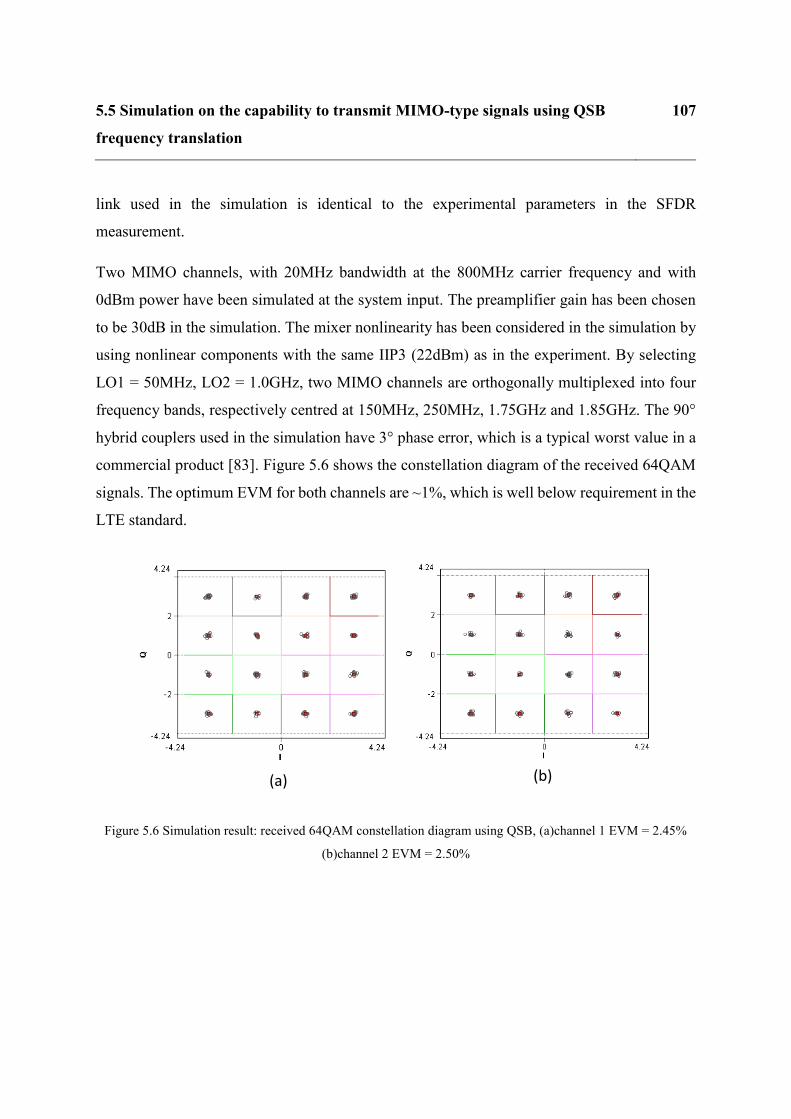
5.5 Simulation on the capability to transmit MIMO-type signals using QSB
frequency translation
107
link used in the simulation is identical to the experimental parameters in the SFDR
measurement.
Two MIMO channels, with 20MHz bandwidth at the 800MHz carrier frequency and with
0dBm power have been simulated at the system input. The preamplifier gain has been chosen
to be 30dB in the simulation. The mixer nonlinearity has been considered in the simulation by
using nonlinear components with the same IIP3 (22dBm) as in the experiment. By selecting
LO1 = 50MHz, LO2 = 1.0GHz, two MIMO channels are orthogonally multiplexed into four
frequency bands, respectively centred at 150MHz, 250MHz, 1.75GHz and 1.85GHz. The 90°
hybrid couplers used in the simulation have 3° phase error, which is a typical worst value in a
commercial product [83]. Figure 5.6 shows the constellation diagram of the received 64QAM
signals. The optimum EVM for both channels are ~1%, which is well below requirement in the
LTE standard.
Figure 5.6 Simulation result: received 64QAM constellation diagram using QSB, (a)channel 1 EVM = 2.45%
(b)channel 2 EVM = 2.50%
(a) (b)
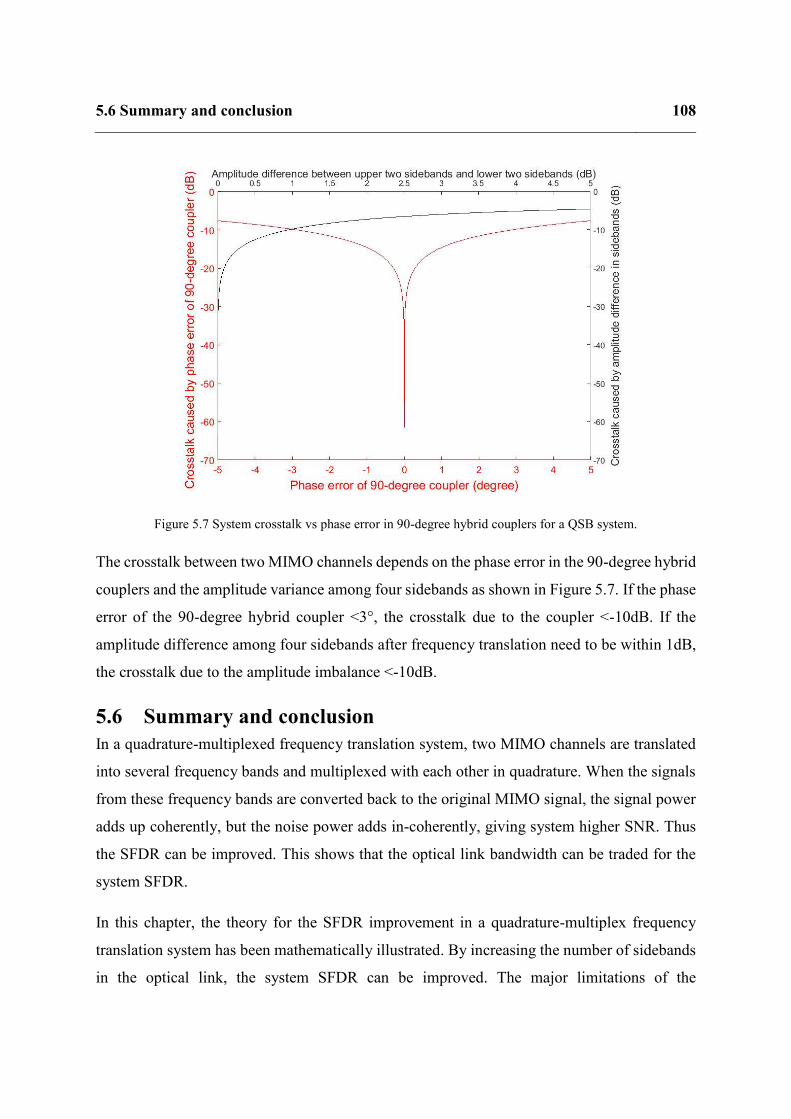
5.6 Summary and conclusion 108
Figure 5.7 System crosstalk vs phase error in 90-degree hybrid couplers for a QSB system.
The crosstalk between two MIMO channels depends on the phase error in the 90-degree hybrid
couplers and the amplitude variance among four sidebands as shown in Figure 5.7. If the phase
error of the 90-degree hybrid coupler <3°, the crosstalk due to the coupler <-10dB. If the
amplitude difference among four sidebands after frequency translation need to be within 1dB,
the crosstalk due to the amplitude imbalance <-10dB.
5.6 Summary and conclusion
In a quadrature-multiplexed frequency translation system, two MIMO channels are translated
into several frequency bands and multiplexed with each other in quadrature. When the signals
from these frequency bands are converted back to the original MIMO signal, the signal power
adds up coherently, but the noise power adds in-coherently, giving system higher SNR. Thus
the SFDR can be improved. This shows that the optical link bandwidth can be traded for the
system SFDR.
In this chapter, the theory for the SFDR improvement in a quadrature-multiplex frequency
translation system has been mathematically illustrated. By increasing the number of sidebands
in the optical link, the system SFDR can be improved. The major limitations of the
5.6 Summary and conclusion 109
improvement include: i) higher pre-amplifier gain is required to compensate the mixers’
conversion loss when the original RF signal is translated into more sidebands; ii) the pre-
amplifier noise figure limits system’s the highest SFDR; iii) frequency mixers introduce
additional nonlinearity products and conversion loss.
Simulations and experiments have been performed, showing that by using DSB and QSB
frequency translation, the system can be improved beyond the intrinsic link. The DSB system
can improve the system 3rd order SFDR from 102.8dB/Hz2/3 to 104.5 dB/Hz2/3, while the QSB
system has 105.5dB/Hz2/3 SFDR3. If the pre-amplifier noise figure>10dB, it is not worth to
translate the original RF signal into more than eight sidebands.

6.1 Introduction 110
Chapter 6 Hybrid DAS using Digital and
Analogue RoF
6.1 Introduction
In an analogue RoF system, the loss of SNR and linearity occurs in most of the system stages.
In a digital RoF system, however, because the RF signal is digitised, as long as the receiver can
recognise the digital signal, the signal quality is not critically affected by the analogue
degradation in the optical link. Thus, the digital radio over fibre system has higher dynamic
range than the analogue RoF system, but because of the analogue-to-digital (ADC) and digital-
to-analogue (DAC) conversion, the digital RoF has higher component cost [100]. However,
the comparison between the prices of these two systems is not straightforward. Although the
digital DAS has a higher price in ADC and DAC, its greater dynamic range means that each of
the RAUs can cover larger areas than the analogue DAS [101]. Moreover, in the digital DAS,
standard SFP transceivers can be used [102], making the system’s transceivers lower cost than
the analogue DAS. On the other hand, in the digital DAS, the high data rate after sampling
occupies a high bandwidth [103]. It makes the system hard to cope with the MIMO signals.
In a service-agnostic DAS, multiple wireless services need to be transmitted to the RAUs. In
the digital DAS, every service needs to be down-converted and digitised (as illustrated in
Section 1.1.3 Figure 1.9), meaning that the system cost increases with the number of services.
The digital RoF system has a dynamic range advantage over the analogue RoF, especially for
the wide bandwidth services, such as 4G LTE. However, because the 2G/3G services have the
relatively narrower bandwidth, the improvement of using digital RoF over analogue RoF is less
critical. It is meaningful to have a hybrid digital and analogue DAS to remove narrow
bandwidth services from the digital link to the analogue link to lower system’s overall cost.

6.2 Proposed hybrid DAS system 111
In this chapter, an analogue and digital hybrid DAS is proposed, in which the 3G services are
transmitted over the analogue RoF link, and the 4G SISO LTE service is transmitted over the
digital RoF link. The proposed hybrid DAS has a lower cost than both the digital DAS and the
analogue DAS.
6.2 Proposed hybrid DAS system
Figure 6.1 Architecture of a hybrid DAS using digital and analogue RoF
The idea of hybrid DAS is to use both the analogue RoF and the digital RoF in the same DAS
infrastructure, as shown in Figure 6.1. Different wireless services are connected to the points
of interface (POI) or the analogue input port in the central unit (CU) of the hybrid system, as
shown in Figure 6.2. The 2G and 3G services are routed through the analogue RoF link, while
the 4G LTE service is sent through the digital RoF link. Inside the hybrid central unit, each of
the services is delivered by separate service cards. Each of the service cards consists of the
signal processing units and optical transceivers. The analogue signal and the digital data are
then combined in the CU and sent to the secondary hubs over the same optical fibre. At the
secondary hub, the digital and the analogue services are separated and respectively delivered
to the analogue/digital remote units (RUs).
RF Service1
Hybrid CU
Secondary hub
Secondary hub
Digital RU
Analogue RU
RF Service2
RF Service3

6.2 Proposed hybrid DAS system 112
At the digital remote units, FPGAs and DACs are required to convert digitised service signal
back to the original form, while at the analogue remote units, no digital signal processing is
needed. As shown in Figure 6.1, the analogue RUs are more sparsely installed than the digital
RUs, in which 4G services are transmitted. This is because the coverage area for the 2G/3G
services is much wider than the 4G service at the same power level.
Figure 6.2 Concept for the analogue and digital hybrid RoF [104]
Compared with the traditional analogue or digital RoF system, the cost advantage of the
hybrid system is driven by three aspects, which are:
a) The reduction in the number of service cards inside the D-RUs by removing the
2G/3G services from the digital link.
b) Compared with traditional analogue DAS, the fewer number of A-RUs is required.
c) Lower number of 4G signal sources (or base stations) is needed, compared with
analogue DAS.
Operator 1
Operator 2
Operator 3
Hybrid CU
Antennas
Analogue RU
Digital RU
2G/3G/LoRa/Sigfox
4G/RFID/ NB-
IoT
Antennas
Hybrid
analogue
and digital
DAS
Hybrid CU
Analogue RF Service Cards
Digital/RF Service Cards
POI or Analogue
Input
Analogue TRx
Digital TRx
Service 1
Service 2
Service 3
To analogue and digital hybrid
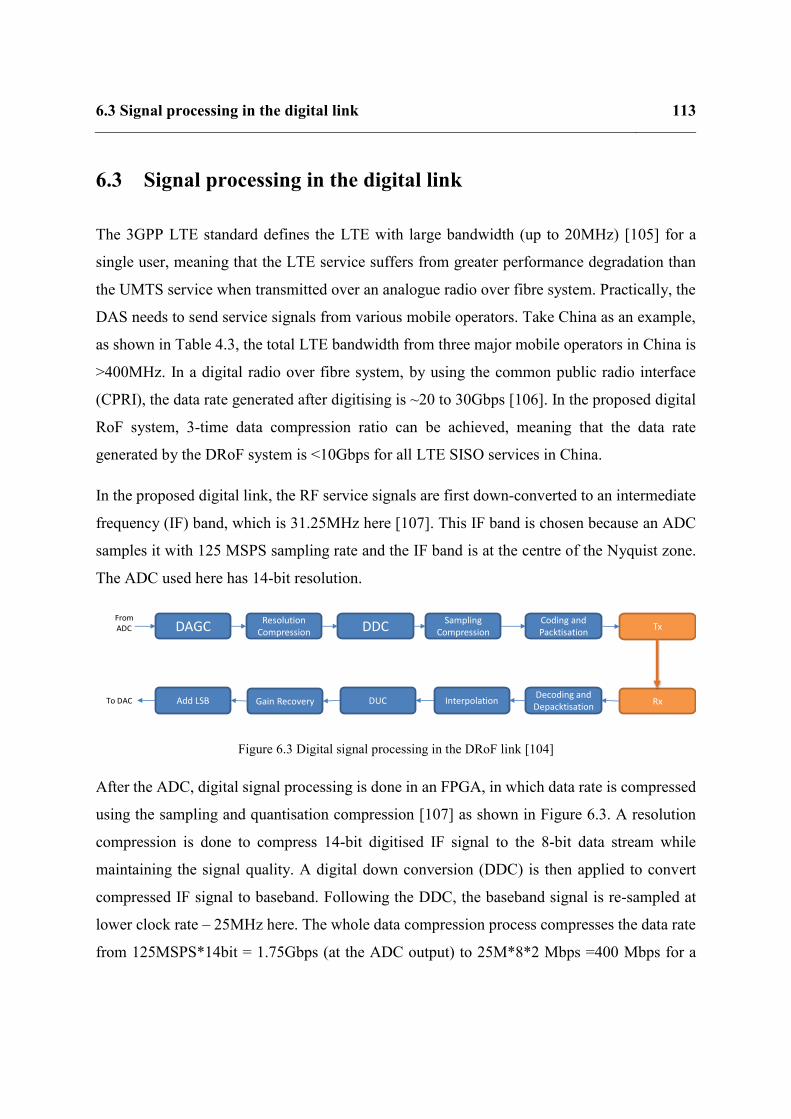
6.3 Signal processing in the digital link 113
6.3 Signal processing in the digital link
The 3GPP LTE standard defines the LTE with large bandwidth (up to 20MHz) [105] for a
single user, meaning that the LTE service suffers from greater performance degradation than
the UMTS service when transmitted over an analogue radio over fibre system. Practically, the
DAS needs to send service signals from various mobile operators. Take China as an example,
as shown in Table 4.3, the total LTE bandwidth from three major mobile operators in China is
>400MHz. In a digital radio over fibre system, by using the common public radio interface
(CPRI), the data rate generated after digitising is ~20 to 30Gbps [106]. In the proposed digital
RoF system, 3-time data compression ratio can be achieved, meaning that the data rate
generated by the DRoF system is <10Gbps for all LTE SISO services in China.
In the proposed digital link, the RF service signals are first down-converted to an intermediate
frequency (IF) band, which is 31.25MHz here [107]. This IF band is chosen because an ADC
samples it with 125 MSPS sampling rate and the IF band is at the centre of the Nyquist zone.
The ADC used here has 14-bit resolution.
Figure 6.3 Digital signal processing in the DRoF link [104]
After the ADC, digital signal processing is done in an FPGA, in which data rate is compressed
using the sampling and quantisation compression [107] as shown in Figure 6.3. A resolution
compression is done to compress 14-bit digitised IF signal to the 8-bit data stream while
maintaining the signal quality. A digital down conversion (DDC) is then applied to convert
compressed IF signal to baseband. Following the DDC, the baseband signal is re-sampled at
lower clock rate – 25MHz here. The whole data compression process compresses the data rate
from 125MSPS*14bit = 1.75Gbps (at the ADC output) to 25M*8*2 Mbps =400 Mbps for a
DDCSampling
CompressionDAGCResolution
CompressionCoding and Packtisation
Tx
Decoding and Depacktisation
InterpolationDUCGain RecoveryAdd LSB RxTo DAC
FromADC

6.4 Simulation of the analogue link 114
20MHz bandwidth LTE channel. The compressed data is coded and then transmitted in serial
by an SFP optical transceiver.
At the receiver side, another SFP optical transceiver is used to convert the optical baseband
signal back to the electrical domain. After interpolation, the baseband digital signal is digital
up-converted to the IF band (in the digital domain). Then the 14-bit data is reconstructed
according to the compression bit width by adding the least significant bits (LSB) [107].
The recovered digital data is converted back to the analogue IF band by an analogue to digital
converter (ADC) and then upconverted to the original service signal an analogue signal
upconverter.
6.4 Simulation of the analogue link
In the analogue and digital hybrid RoF system, because two systems are combined using optical
couplers, the loss from the optical coupler can lower the RF performance in the analogue link.
A simulation is done in the VPItransmittionMaker®, comparing the analogue RoF link
performance in the traditional analogue RoF system (Figure 6.4 (a)) and the hybrid RoF system
(Figure 6.4 (b)). A CW DFB laser emitting at a 1530nm wavelength and 10dBm optical power
has been used to create the interference from the digital link. The analogue input signal has
been pre-amplified before it is directly modulated onto a DFB laser, emitting at a 1550nm
wavelength and 6dBm optical power. The DFB laser performance used in the analogue link
simulation is identical to the laser used in the experiment. Two optical couplers in the optical
link have a 3.5dB loss for each.
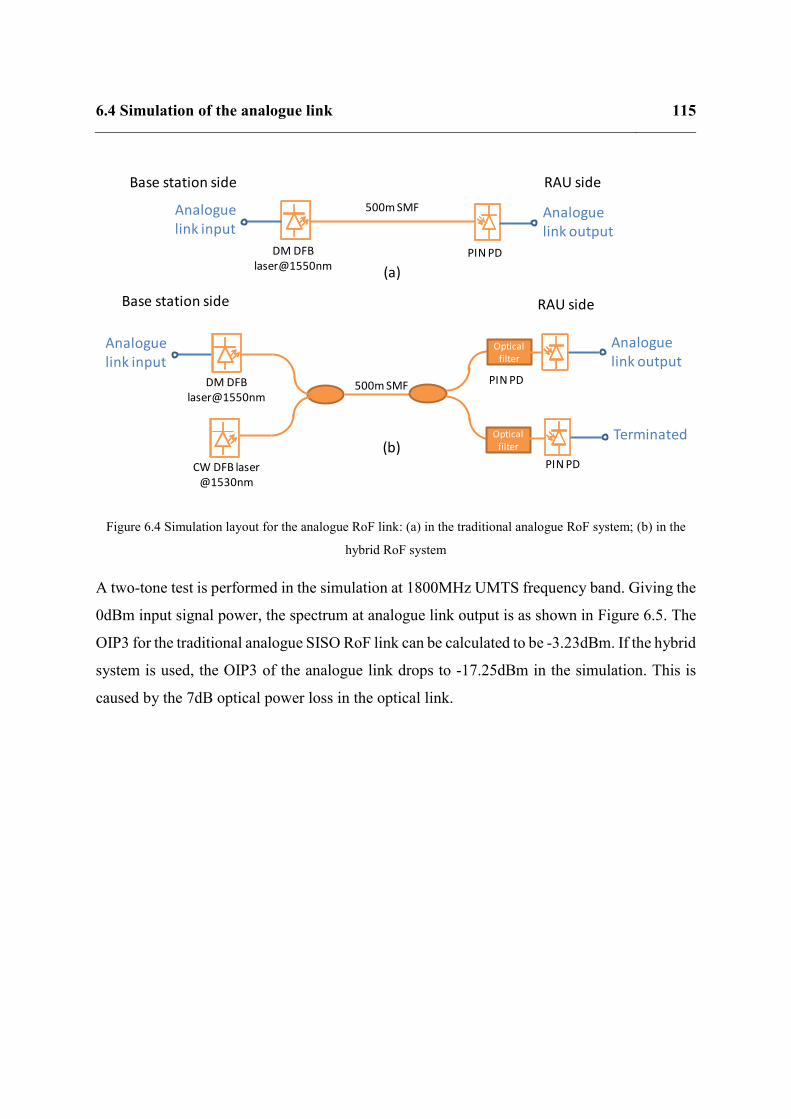
6.4 Simulation of the analogue link 115
Figure 6.4 Simulation layout for the analogue RoF link: (a) in the traditional analogue RoF system; (b) in the
hybrid RoF system
A two-tone test is performed in the simulation at 1800MHz UMTS frequency band. Giving the
0dBm input signal power, the spectrum at analogue link output is as shown in Figure 6.5. The
OIP3 for the traditional analogue SISO RoF link can be calculated to be -3.23dBm. If the hybrid
system is used, the OIP3 of the analogue link drops to -17.25dBm in the simulation. This is
caused by the 7dB optical power loss in the optical link.
Base station side RAU side
500m SMFDM DFB laser@1550nm
PIN PD
CW DFB laser @1530nm
PIN PD
Analogue link input
Analogue link output
TerminatedOptical filter
Optical filter
DM DFB laser@1550nm
500m SMF
PIN PD
Analogue link input
Analogue link output
Base station side RAU side
(a)
(b)
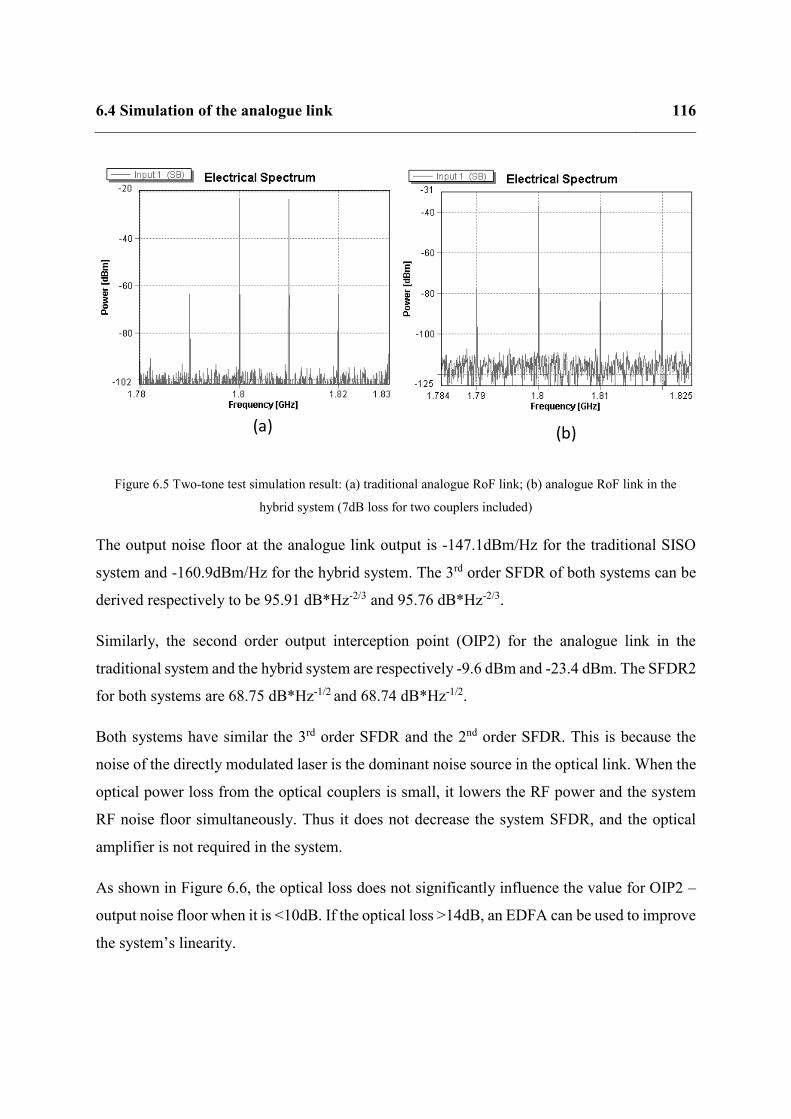
6.4 Simulation of the analogue link 116
Figure 6.5 Two-tone test simulation result: (a) traditional analogue RoF link; (b) analogue RoF link in the
hybrid system (7dB loss for two couplers included)
The output noise floor at the analogue link output is -147.1dBm/Hz for the traditional SISO
system and -160.9dBm/Hz for the hybrid system. The 3rd order SFDR of both systems can be
derived respectively to be 95.91 dB*Hz-2/3 and 95.76 dB*Hz-2/3.
Similarly, the second order output interception point (OIP2) for the analogue link in the
traditional system and the hybrid system are respectively -9.6 dBm and -23.4 dBm. The SFDR2
for both systems are 68.75 dB*Hz-1/2 and 68.74 dB*Hz-1/2.
Both systems have similar the 3rd order SFDR and the 2nd order SFDR. This is because the
noise of the directly modulated laser is the dominant noise source in the optical link. When the
optical power loss from the optical couplers is small, it lowers the RF power and the system
RF noise floor simultaneously. Thus it does not decrease the system SFDR, and the optical
amplifier is not required in the system.
As shown in Figure 6.6, the optical loss does not significantly influence the value for OIP2 –
output noise floor when it is <10dB. If the optical loss >14dB, an EDFA can be used to improve
the system’s linearity.
(a) (b)
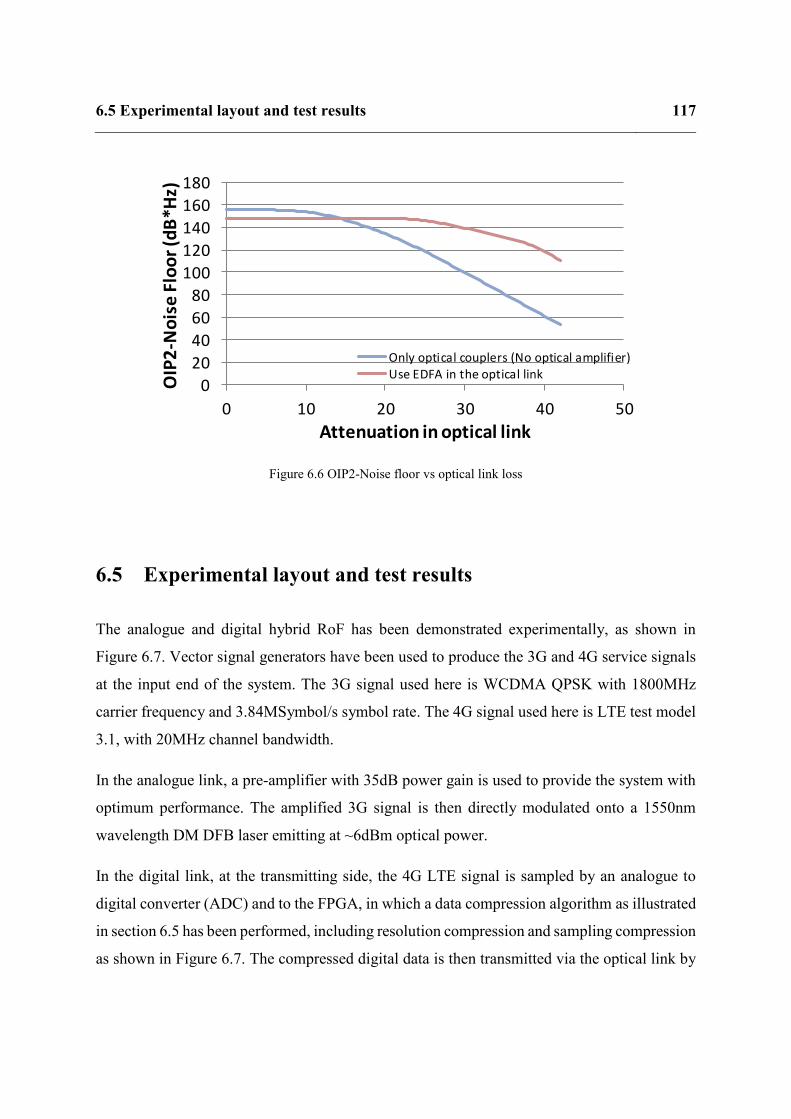
6.5 Experimental layout and test results 117
Figure 6.6 OIP2-Noise floor vs optical link loss
6.5 Experimental layout and test results
The analogue and digital hybrid RoF has been demonstrated experimentally, as shown in
Figure 6.7. Vector signal generators have been used to produce the 3G and 4G service signals
at the input end of the system. The 3G signal used here is WCDMA QPSK with 1800MHz
carrier frequency and 3.84MSymbol/s symbol rate. The 4G signal used here is LTE test model
3.1, with 20MHz channel bandwidth.
In the analogue link, a pre-amplifier with 35dB power gain is used to provide the system with
optimum performance. The amplified 3G signal is then directly modulated onto a 1550nm
wavelength DM DFB laser emitting at ~6dBm optical power.
In the digital link, at the transmitting side, the 4G LTE signal is sampled by an analogue to
digital converter (ADC) and to the FPGA, in which a data compression algorithm as illustrated
in section 6.5 has been performed, including resolution compression and sampling compression
as shown in Figure 6.7. The compressed digital data is then transmitted via the optical link by
0
20
40
60
80
100
120
140
160
180
0 10 20 30 40 50
OIP
2-N
ois
e Fl
oo
r (d
B*H
z)
Attenuation in optical link
Only optical couplers (No optical amplifier)Use EDFA in the optical link

6.5 Experimental layout and test results 118
a DFB laser emitting at 1530nm wavelength. Both the analogue link and the digital link are
combined in optical domain by an optical coupler, then sent to the remote end via a 500km
SMF.
At the remote end, the optical signals of the analogue and digital link are split and filtered out
into two ways and separately received by photodetectors. They are then converted back to the
original 3G and 4G signals at the remote end. A vector signal analyser is used to test the
recovered signals. A picture showing the experimental setup has been presented in Figure 6.8.
Figure 6.7 Experimental layout for analogue and digital hybrid RoF system.
From ADC
ADC FPGA1530nm
SFP
1550nm
Laser
Optical
Coupler
50
0m
SM
F
DDC
Sampling Compression
DAGC
Resolution Compression
Coding and Packtisation
Tx
Decoding and Depacktisation
Interpolation
DUC
Gain Recovery
Add LSB
Rx
To DAC
3G
LTEPre-amplifier
PD
Optical
Coupler
SFP RxFPGA DACOptical
Filter 1530
VSG for 3G service
VSG for 4G service
VSA
Optical
Filter 1550

6.5 Experimental layout and test results 119
Figure 6.8 Experiment setup for hybrid RoF link
Figure 6.9 EVM dynamic range of the analogue and digital RoF system
Experimentally, the EVM dynamic range for both the analogue RoF link and the digital RoF
link have been tested as shown in Figure 6.9. The 3G WCDMA service has ~42dB EVM
DM DFB laser in the ARoF link
SFP transceiver in the DRoF link
FPGA in the DRoF linkOptical coupler
0
5
10
15
20
25
30
35
-80 -70 -60 -50 -40 -30 -20 -10 0 10
EVM
(%
)
Input Power (dBm)
Hybrid DAS Performance (500m Fibre Link)
4G LTE with Data Compression 4G ARoF only 2GHz WCDMA TM3
LTE Req. 8% WCDMA Req. 17.5%
6.6 Summary and Conclusion 120
dynamic range without using AGC, and the 4G LTE service has ~43dB EVM dynamic range
without using AGC. By using digital RoF, the link dynamic range of the 4G LTE service has
been improved to be a comparable value as the 3G service. Meaning that, if the hybrid system
is compared with the analogue system, the users can get better service for the 4G system. If it
is compared with traditional digital RoF system, the hybrid system only does the DSP for the
4G service, but leave the other services in analogue, meaning that the cost for the ADC/DAC
and FPGA can be lowered.
6.6 Summary and Conclusion
In a DAS, if the 4G signals and the 3G signals are treated equally, the 4G services will have
poorer coverage. By using the analogue and digital hybrid RoF system, the system can have
improved QoS without critically increase the cost.
In this chapter, we have proposed a layout for the analogue and digital RoF hybrid DAS. In the
digital link, resolution and sampling rate compression have been used, giving the system 3-
time compression ratio compared with CPRI. The digital and analogue RoF links are combined
using optical couplers.
Simulations show that the optical couplers give the system 7dB optical power loss. However,
system’s 2nd order and 3rd order SFDR is not significantly lowered (<0.5 dB). This is because
the laser diode’s RIN is dominant noise source in the system and the optical loss decreases the
signal power and noise power simultaneously. Experiments have been carried out transmitting
the 4G signal over the DRoF link and the 3G signal over the ARoF link. The experiment result
shows that the 4G LTE and 3G WCDMA services have comparable EVM dynamic range in
the proposed hybrid RoF system, respectively 43dB and 42dB.
The hybrid DAS potentially has a lower cost than traditional digital or analogue DAS because
of three reasons: i) it reduces the number of service cards in the DDAS; ii) reduces the number
of RAUs in the ADAS; iii) it reduces the number of signal sources required in the ADAS.

6.7 Acknowledgement 121
6.7 Acknowledgement
The work in Chapter 6 is the outcome of the calibration with Dr Tongyun Li. The idea of hybrid
DAS is generated by Dr Tongyun Li and he designed the hardware and the software part of the
digital link in the hybrid system. The author designed and simulated the analogue part of the
hybrid system. Both Dr Tongyun Li and the author got involved in the experiments.

7.1 Thesis Summary 122
Chapter 7 Conclusion and Future Work
7.1 Thesis Summary
A. Motivations
Nowadays the 3G and 4G services are widely deployed, and in the future 5G era, the high
capacity wireless communication techniques, such as MIMO will be broadly implemented.
Indoor areas, where 80% of the wireless data traffic originates, are difficult to be covered using
wireless signal [108]. It is, therefore, necessary to find a cost-effective solution to cover the
indoor area by multiple wireless services.
This thesis aims to develop a low-cost solution for next-generation indoor wireless coverage.
Among currently available solutions, such as signal repeaters, small cells and distributed
antenna systems, the DAS has many benefits: i. Each of the RAUs works together so no inter-
cell interference; ii. It delivers the RF signals and does not require the baseband information
from the mobile service operators so that it can be operated by neutral hosts, such as the owners
of public infrastructure, commercial real estate and enterprises; iii. the DAS is also service-
agnostic and broadband, making it suitable for extensive public areas with high user density.
Nowadays, a straightforward solution to transmit MIMO signals over the DAS is to deliver
each of the MIMO channels using different strands of fibres (space division multiplexing). This
solution gives the system high installation cost, makes it difficult to upgrade current SISO DAS
into the MIMO DAS.
B. Principles of DSB frequency translation 2x2 RoF system
For all these reasons, the author developed a low-cost DSB frequency translation system, which
can upgrade the current SISO DAS infrastructure into MIMO DAS without installing parallel
optical fibres. In the DSB frequency translation system, two MIMO channels were multiplexed
7.1 Thesis Summary 123
with each other in quadrature, so that the powers in both sidebands after frequency mixing can
be kept. The author investigated the performance of the system. The following problems can
cause the crosstalk in the MIMO RoF system using DSB frequency translation:
i. The phase error of the 90-degree hybrid coupler;
ii. The amplitude imbalance between the upper sideband and the lower sideband of the
frequency mixing products, which is caused by the S21 vibration in the pre-
amplifier and the optical link;
iii. The signal’s group delay when transmitting from the BS station to the RAUs.
The first problem is caused by the component quality. Usually, the phase error for a commercial
90-degree hybrid coupler can be <2°. The second problem is caused by the modulation
bandwidth of the DM DFB laser and the dispersion if it is in an MMF link. A power equaliser
has been designed to compensate some of the amplitude imbalance in two sidebands so that
the system can operate in LTE bandwidth. The third problem can be overcome by adding a
phase shifter to adjust the LO phase at the RAUs.
Experimentally, the DSB frequency translation system was demonstrated to work for LTE
signals, and compared with the traditional SSB frequency translation system, the DSB system
has higher 1.7dB 3rd order SFDR and effective EVM dynamic range. The system is well
conditioned in the power equaliser bandwidth, which is 610MHz to 750MHz in the experiment,
meaning the crosstalk between two MIMO channels can be well compensated in this range.
C. Broadband implementation of DSB frequency translation MIMO RoF system
To make the DSB frequency translation system service-agnostic, the author investigated the
frequency spectrums in the major countries in world, finding that there are some frequency
spectral regions that are reserved for particular uses, such as aeronautical communication and
satellite communication. Signals from these frequency bands are not usually required to be

7.1 Thesis Summary 124
delivered over the DAS. By translating the original MIMO signals into these frequency bands
can avoid the overlap between the signals after the frequency translation and other services in
the DAS, so that the system can be broadband and service-agnostic. In the UK, US and China,
a 2.2 GHz LO can be used to make sure all the LTE frequency bands to be translated into
unoccupied bands over DAS. In the other countries, similar but different LO frequencies can
be found.
To show the feasibility of the system, a demonstration was made using a 2x2 Wi-Fi MIMO.
The MIMO signals and the LO signal was successfully delivered from the central unit to the
RAU via a 500m SMF link using the DSB frequency translation. The client can receive the
MIMO signals from the RAU with high throughput.
D. SFDR improvement using multiple sidebands quadrature-multiplexed frequency
translation technique
By extending the idea of the DSB frequency translation, the MIMO signal can be converted
into more than two sidebands so that the SFDR of the RoF system can be further improved. It
has been theoretically shown that the DSB and QSB system can improve the system 3rd order
SFDR beyond the intrinsic optical link. If an ideal pre-amplifier and mixer are used, the DSB
and QSB system can give the system respectively 2dB and 3dB 3rd order SFDR improvement.
If the original signals are translated into more sidebands, higher pre-amplifier gain is required
to compensate the conversion loss of the frequency mixers. Limited by the noise figure of the
high gain amplifier, if the amplifier NF>10dB, the 3rd order SFDR improvement does not
increase when the original signals are translated into more than eight sidebands.
Experimentally, the DSB system gives ~1.7dB improvement, while the QSB system can give
~2.7dB increase. The degradation comes from the pre-amplifier noise figure and the
nonlinearity of the mixers and the pre-amplifier. The simulation shows the system can support
MIMO radio over fibre.
This shows that the optical bandwidth can be traded for the RF SFDR and at the same time,
MIMO operation can be supported.
7.2 Potential future work 125
E. Hybrid DAS using analogue and digital RoF
The 3GPP standards have defined wider bandwidth in 4G services than the 3G. Thus if they
are treated equally, the wideband 4G services can cover less area than the 3G. Traditional
digital radio over fibre system has higher dynamic range than the analogue system but
generates a large amount of data when digitising the RF signals. Because the 3G services have
relatively narrow bandwidth, the dynamic range improvement by using DDAS is not critical.
However, if all the 3G services are to be transmitted using the DDAS, many service cards will
be required, giving the system high-cost. Therefore, it is meaningful to transmit 2G and 3G
services in the analogue DAS to lower the system cost.
The hybrid analogue and digital radio over fibre system transmit the 4G LTE services in digital
while keeping the 3G services in analogue. Compared with the traditional digital DAS and
analogue DAS, the hybrid DAS reduces the cost in three means: i) reduces the number of
service cards in the DDAS; ii) lowers the number of RAUs in the ADAS; iii) reduces the
number of the signal sources required in the ADAS.
The hybrid DAS combines and separates the DRoF and the ARoF links in optical domain by
using optical couplers. Simulation shows that the optical power loss introduced by the optical
couplers does not significantly decrease the signal SFDR (<0.5dB). Experimentally, by using
the hybrid system, the EVM dynamic ranges of the 20MHz bandwidth LTE service in the
digital link and 3G WCDMA service in the analogue link are respectively 43 and 42 dB.
7.2 Potential future work
While this thesis has introduced low-cost solutions for next-generation indoor wireless
coverage, more research can be carried out to achieve an ultimate deployment of the future
DAS.
A. Higher MIMO dimensions on RoF

7.2 Potential future work 126
The 5G era is coming in 2020 and now is the critical transition time from 4G to 5G technology.
One of the important solutions to get high capacity in the 5G era is to use a large number of
MIMO channels. In the mobile world congress in 2017 (MWC 2017), mobile device vendors
have demonstrated their attempts to achieve high dimension MIMO communication. For
example, ZTE® has demonstrated their massive MIMO macro basestation solutions with 128
antennas [109]. However, limited by the size of the mobile devices and the wavelength of the
mobile signal carrier frequency, it is hard to install high dimension MIMO receivers inside the
mobile devices. The current ZTE® Gigabit Phone use 4x4 MIMO and carrier aggregation to
achieve Gbps wireless communication [110].
In this thesis, a low-cost 2x2 MIMO RoF system using DSB frequency translation has been
demonstrated. There is a strong driver to extend the 2x2 MIMO RoF system into higher
dimensions. There are several challenges:
i. In [64], the authors have proposed a 3x3 MIMO RoF system by using DSB
frequency translation for two of the MIMO channels, while keeping the third MIMO
channel at its original frequency, as shown in Figure 7.1. Practically, because of the
RF signal leakage in the frequency mixers, the signal leakage from the first and the
second MIMO channels remains in the same frequency band with the 3rd MIMO
channels. Therefore, filters must be used to prevent the 3rd MIMO channel from the
crosstalk.
However, because the LTE frequency bands cover from 700MHz to 3.5GHz,
different filters need to be installed for different LTE frequency bands. These filters
will prevent the system from being agnostic. A method needs to be found out to
address this problem.
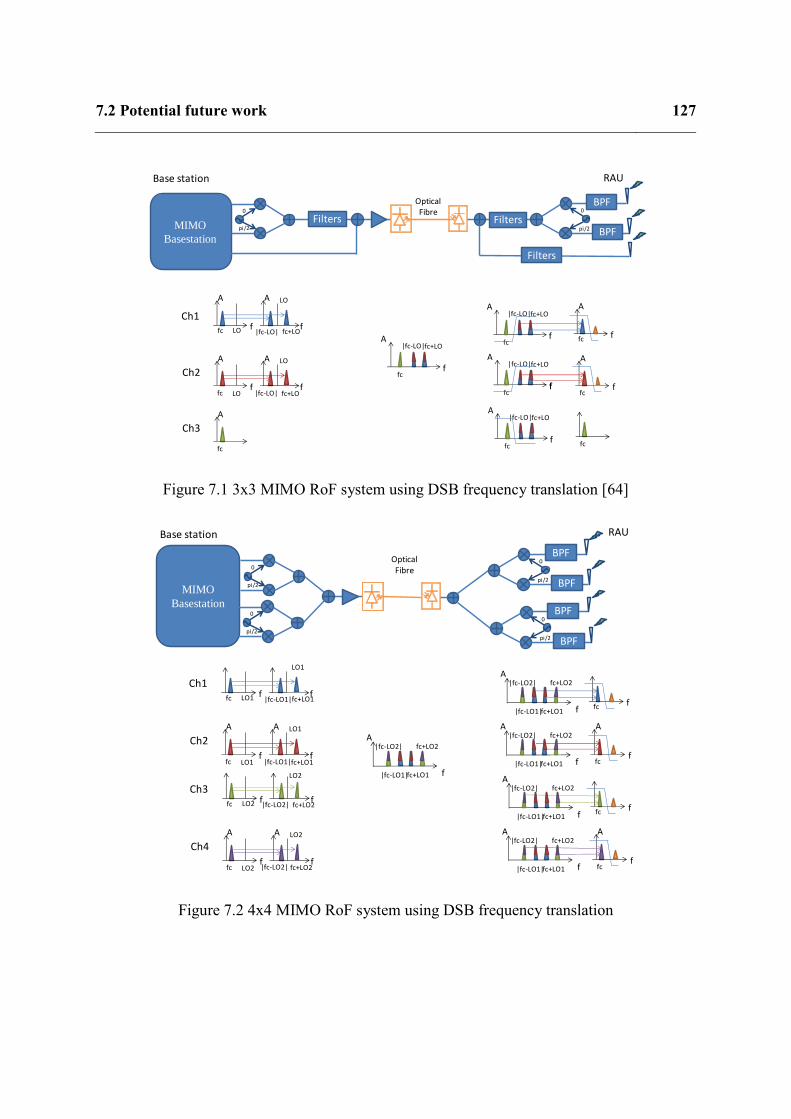
7.2 Potential future work 127
Figure 7.1 3x3 MIMO RoF system using DSB frequency translation [64]
Figure 7.2 4x4 MIMO RoF system using DSB frequency translation
MIMO
Basestation
0
pi/2
f
A
fc f
A
f
ALO
LO
|fc-LO| fc+LO
f
A
f
A
LO
LO
0
pi/2
fc |fc-LO| fc+LO
fc+LO|fc-LO|
BPF
BPF
f
f
A
fc
f
A
fc
Optical Fibre
Ch1
Ch2
Base station RAU
Filters
A
fc
Ch3
fc
Filters
Filters
f
Afc+LO|fc-LO|
fc
f
Afc+LO|fc-LO|
fc
f
Afc+LO|fc-LO|
fc fc
MIMO
Basestation
0
pi/2
ffc f
f
A
LO1 |fc-LO1|fc+LO1
f
A
f
A
LO1
LO1
0
pi/2
fc |fc-LO1|fc+LO1
fc+LO1|fc-LO1|
BPF
BPF
ffc
f
A
fc
Optical Fibre
Ch1
Ch2
Base station RAU
0
pi/2
0
pi/2
BPF
BPF
ffc fLO2 |fc-LO2| fc+LO2
f
A
f
A
LO2
LO2
fc |fc-LO2| fc+LO2
Ch3
Ch4
fc+LO2|fc-LO2|
f
A
fc+LO1|fc-LO1|
fc+LO2|fc-LO2|
f
A
fc+LO1|fc-LO1|
fc+LO2|fc-LO2|
ffc
f
A
fc
f
A
fc+LO1|fc-LO1|
fc+LO2|fc-LO2|
f
A
fc+LO1|fc-LO1|
fc+LO2|fc-LO2|
LO2
LO1

7.2 Potential future work 128
ii. For the case of 4x4 MIMO radio over fibre system, two pairs of LOs need to be
used, as shown in Figure 7.2. Each of the local oscillators translates and quadrature-
multiplex two MIMO channels. The four MIMO signals after the frequency
translation respectively occupy the frequency bands at fc+fLO1, |fc-fLO1|, fc+fLO2 and
|fc-fLO2 |.
Compared with the 2x2 system, the LOs and MIMO signal channels are more likely
to create nonlinear products in the 4x4 system. Therefore, the system needs to be
more carefully designed.
iii. As mentioned in Chapter 4, many frequency bands are not transmitted over the
DAS. 2x2 MIMO signals can be translated into these frequency bands to avoid the
overlap with other services over the DAS. However, when there is a higher number
of MIMO channels, it is harder to translate all MIMO signal channels into the
limited unoccupied frequency bands. Thus, a new frequency map needs to be
designed. For the case of massive MIMO, the techniques such as WDM and SCM
hybrid system can be used to extend the system bandwidth in the optical domain
[111].
B. The convergence of multiple networks including MIMO and IoT networks.
The next generation mobile network (5G) not only have higher capacity than the 4G network
but also provides better device-to-device (D2D) connectivity [112]. It has been predicted that
entire internet of things (IoT) market will be over $1.7trillion by 2019 [113]. The IoT
infrastructure revenue generated in 2015 was approximately $330 billion and is projected to
reach $453 billion by 2020 with a CAGR of 6.2% [114]. For the future indoor wireless signal
coverage, the traditional cellular network can no longer satisfy users’ requirements. The DAS
should be a transparent and seamless platform for various of wireless standards, including the
IoT services.
The integration of the IoT services over the DAS is necessary. This will include:
i. The integration of multiple-operator cellular networks.

7.2 Potential future work 129
ii. Analogue and digital hybrid DAS, including MIMO: In chapter 6, a hybrid analogue
and digital DAS for SISO signals have been proposed. However, as the DRoF
generates high data rate when digitising, it is a very high cost to transmit MIMO
signals using DRoF. Integrating MIMO analogue RoF system with the DRoF can
be a cost-effective way for next-generation indoor wireless coverage.
iii. The integration of the IP interfaces from the IoT services to the DAS: The analogue
DAS has many advantages in some certain scenarios. However, many IoT services
are transmitted through the IP networks [115]. Thus, it is necessary future indoor
wireless coverage infrastructure to support both the mobile cellular networks and
IP networks on the same infrastructure.

References 130
References
[1] T. S. Rappaport, Wireless Communications: Principles and Practice,, Upper Saddle
River, N.J.: Prentice Hall, 2002.
[2] mobiForge "Global mobile statistics 2014 Part A: Mobile subscribers; handset
market share; mobile operators, " may 2014. Internet: http://mobiforge.com/research-
analysis/.
[3] “GSM World Coverage Map and GSM Country List,” WorldTimeZone, 6 July 2017.
[Online]. Available: http://www.worldtimezone.com/gsm.html. [Accessed 10
September 2017].
[4] Evolutionary Study and Performance Analysis of Generations in Wireless
Technology, International Journal of Scientific & Engineering Research, Volume 4,
Issue 6, June-2013 883.
[5] Cisco, Cisco Visual Networking Index: Global Mobile Data Traffic Forecast Update,
2016–2021, [Online] Available:
http://www.cisco.com/c/en/us/solutions/collateral/service-provider/.
[6] CISCO. "Cisco Visual Networking Index: Global Mobile Data Traffic Forecast
Update, 2013–2018". Internet:
http://www.cisco.com/c/en/us/solutions/collateral/service-provider/visual-
networking-index-vni/white_paper_c11-520862.html, Feb. 5, 2015[April. 5].

References 131
[7] “Building Repeater Systems,” AlternativeWireless, 2017. [Online]. Available:
http://www.alternativewireless.com/resources/cell-signal-improvement/building-
signal-boosters-help/building-repeater-systems.html. [Accessed 10 September 2017].
[8] “Cisco Visual Networking Index: Forecast and Methodology, 2016–2021,” CISCO, 6
June 2017. [Online]. Available:
https://www.cisco.com/c/en/us/solutions/collateral/service-provider/visual-
networking-index-vni/complete-white-paper-c11-481360.pdf. [Accessed 10
September 2017].
[9] “Home Signal Support,” 3 mobile, 2002. [Online]. Available:
http://www.three.co.uk/Support/Devices/Phones/Home/Signal_Black. [Accessed 22
September 2017].
[10] “Ericsson Radio Dot System,” Ericsson, 2017. [Online]. Available:
https://www.ericsson.com/ourportfolio/networks-products/radio-dot-
system?nav=fgb_101_0561%7Cfgb_101_0516%7Cfgb_101_0526. [Accessed 10
September 2017].
[11] “LampSite,” Huawei, 2017. [Online]. Available:
http://carrier.huawei.com/en/products/wireless-network/small-cell/lampsite.
[Accessed 10 September 2017].
[12] “Qcell Future-Oriented Indoor MBB Solution,” ZTE, 2015. [Online]. Available:
http://www.zte.com.cn/global/solutions/access/flexible/Qcell. [Accessed 10
September 2017].
References 132
[13] M. Fabbri and P. Faccin, “Radio over Fiber Technologies and Systems: New
Opportunities , 2007, vol.3, pp.230-233, 1-5 July 2007,” in ICTON '07. 9th
International Conference on Transparent Optical Network, Rome, 2007.
[14] “Distributed Antenna Systems (DAS) Market worth 10.78 Billion USD by 2022,”
Markets and Markets, 2017. [Online]. Available: Distributed Antenna Systems
(DAS) Market worth 10.78 Billion USD by 2022. [Accessed 10 September 2017].
[15] “Zinwave UNITIVITY SYSTEM,” Zinwave, [Online]. Available:
https://cdn2.hubspot.net/hubfs/2702507/Data%20Sheets/UNITIVITY%20DATA%20
11.14.2017.pdf?t=1513019148075. [Accessed 12 Dec 2017].
[16] I. Charles H. Cox, Analog Optical Links: Theory and Practice, Cambridge:
Cambridge University Press, 2006.
[17] T. Li., M. J. Crisp, R. V. Penty and I. H. White,, “Low Bit Rate Digital Radio Over
Fibre System,” in International Topical Meeting on Microwave Photonics 2009,
MWP ’09, Valencia, 2009.
[18] A. Nirmalathas, P. A. Gamage, C. Lim, D. Novak, R. Waterhouse and Y. Yang,
“Digitized RF transmission over fiber,” IEEE Microwave Magazine, vol. 10, no. 4,
pp. 75-81, 2009.
[19] C. Cox, E. Ackerman, R. Helkey and G. E. Betts, “Direct-detection analog optical
links,” IEEE Transactions on Microwave Theory and Techniques, vol. 45, no. 8, pp.
1375-1383, Aug 1997.
[20] A. J. Cooper, “'Fibre/radio' for the provision of cordless/mobile telephony services in
the access network,” Electronics Letters, vol. 26, no. 24, pp. 2054-2056, 1990.
References 133
[21] “Cable Basics: Fiber Optic Cable,” BELDEN, 2016. [Online]. Available:
http://www.beldencables-emea.com/en/products/cable_basics/fiber-optic-
cable/index.phtml. [Accessed 10 September 2017].
[22] International Journal of Applied Engineering Research, ISSN 0973-4562 Vol.7
No.11 (2012).
[23] G.P.Agrawal, Fiber-optic Communication Systesm, New York: John Wiley & Sons
INC., 2002..
[24] “Data Sheet RG coaxial cable-RG214U,” Kabelwerk EUPEN, 20 March 2007.
[Online]. Available: http://www.romkatel.ro/cataloage/pdf/eupen/RG214.pdf .
[Accessed 10 Septermber 2017].
[25] “Photodiode Tutorial,” Thorlab, 2017. [Online]. Available:
https://www.thorlabs.com/tutorials.cfm?tabID=787382ff-26eb-4a7e-b021-
bf65c5bf164b. [Accessed 10 September 2017].
[26] G. Ducournau et al., "Ultrawide-Bandwidth Single-Channel 0.4-THz Wireless Link
Combining Broadband Quasi-Optic Photomixer and Coherent Detection," in IEEE
Transactions on Terahertz Science and Technology, vol. 4, no. 3, pp. 328-337, May
2014.
[27] G. Abbas, V. Chan and Ting Yee, "A dual-detector optical heterodyne receiver for
local oscillator noise suppression," in Journal of Lightwave Technology, vol. 3, no. 5,
pp. 1110-1122, October 1985.
[28] Fuada, Syifaul & Adiono, Trio. (2017). Analysis of Received Power Characteristics
of Commercial Photodiodes in Indoor Los Channel Visible Light Communication.
References 134
International Journal of Advanced Computer Science and Applications. 8. 2017.
10.14569/IJACSA.20.
[29] G.Keiser, Optical Fiber Communications, 3rd Ed. London: McGraw-Hill, 2004..
[30] G. P. Agrawalm , “Fiber-Optic Communciation Systems,” in ch. 4: Optical receivers,
2002.
[31] J. C. Campbell, "Recent Advances in Telecommunications Avalanche Photodiodes,"
in Journal of Lightwave Technology, vol. 25, no. 1, pp. 109-121, Jan. 2007..
[32] W. Wang, “Optical Detectors,” National Tsinghua University, [Online]. Available:
https://depts.washington.edu/mictech/optics/me557/detector.pdf. [Accessed 10
September 2017].
[33] C. Cox III, E. Ackerman, R. Helkey and G. E. Betts, “Techniques and Performance
of Intensity-Modulation Direct-Detection Analog Optical Links,” IEEE
TRANSACTIONS ON MICROWAVE THEORY AND TECHNIQUES, vol. 1383, no.
45, p. 1375, 1997.
[34] A. Goutzoulis, J. Zomp and A. Johnson, “An eight-element, optically powered,
directly modulated receive UHF fiber-optic manifold,” Lightwave Technology,
Journal of, vol. 39, pp. 74-86, Feb. 1996.
[35] E. Ackerman, C. Cox, G. Betts, H. Roussell, K. Ray, and F.O’Donnell, “Input
impedance conditions for minimizing the noise figure of an analog optical link,”
IEEE Trans. Microwave Theory Tech., vol. 46, pp. 2025-2031, Dec. 1998.
References 135
[36] S. Pappert, C. Sun, R. Orazi and T. Weiner, “Microwave fiber optic links for
shipboard antenna applications,” in IEEE Int. Conf. Phased Array Systems and
Technology, Dana Point, CA, 2000.
[37] G. Betts, “Linearized modulator for suboctave-bandpass optical analog links,” IEEE
Trans. Microwave Theory Tech. , vol. 42, pp. 2642-2649, 1994.
[38] D. Tauber, G. Wang, R. Geels, J. Bowers and L. Coldren, “Large and small signal
dynamics of vertical cavity surface emitting lasers,” Applied Physics Letters, vol. 62,
pp. 325-327, Jan. 1993.
[39] S. Weisser, E. Larkins, W. Benz, J. Daleiden, I. Espivias, J. Fleissner, J. Ralston, B.
Romero, R. Sah, A. Schonfelder and J. Rosenzweig, “Damping-limited modulation
bandwidths up to 40 GHz in undoped short-cavity In/sub 0.35/Ga/sub 0.65/As-GaAs
multiple-quantum-well lasers,” IEEE Photonics Technology Letters, vol. 8, no. 5, pp.
608-610, 1996.
[40] T. Chen, J. Ungar, X. Yeh and N. Bar-Chaim, “Very large bandwidth strained MQW
DFB laser at 1.3 mm,” IEEE Photon. Technol. Lett., vol. 7, pp. 458-460, 1995.
[41] K. Noguchi, O. Mitomi, and H. Miyazawa, “Millimeter-wave Ti:LiNbO3 optical
modulators,” J. Lightwave Technol., vol. 16, pp.615-617, Apr. 1998..
[42] W. Bridges and F. Sheehy, “Velocity-matched electro-optic modulator,” SPIE, , vol.
1371, pp. 68-77, 1990.
[43] Finisar, “FP-1310-4I-LCB,” Arrow Electronics, 2017. [Online]. Available:
https://www.arrow.com/en/products/fp-1310-4i-lcb/finisar. [Accessed 10 September
2017].
References 136
[44] E. Ackerman and C. Cox, “RF fiber-optic link performance,” IEEE Micrw. Mag.,
vol. 2, no. 4, pp. 50-58, 2001.
[45] E. Ackerman and C. Cox, “RF fiber-optic link performance,” IEEE Micrw. Mag.,
vol. 2, no. 4, pp. 50-58, 2001.
[46] E. Meland, R. Holmstrom, J. Schlafer, R. Lauer and W. Powazinik, “Extremely high-
frequency (24 GHz) InGaAsP diode lasers with excellent modulation efficiency,”
Electron. Lett., vol. 26, pp. 1827-1829, 1990.
[47] D. Young, J. Scott, M. Peters, M. Majewski, B. Thiebeault, S. Corzine and L.
Coldren, “Enhanced performance of offset-gain high-barrier vertical-cavity surface-
emitting lasers,” IEEE J. Quantum Electron., vol. 29, pp. 2013-2022, 1993..
[48] S. Weisser, E. C. Larkins, K. Czotscher and W. Benz, “Damping-limited modulation
bandwidths up to 40GHz in undoped short-cavity In0.35Ga0.65As–GaAs multiple-
quantum-well lasers,” Photonics Technology Letters IEEE, vol. 8, no. 5, pp. 608-610,
1996.
[49] J. Ingham, M. Websterm, A. Wonfer, R. Penty, I. White and K. White, “Wide-
frequency-range operation of a high-linearity uncooled FDB laser for next generation
radio-over fiber,” Optical Fiber Communications OFC, vol. 2, pp. 754-756, 2003.
[50] A. Larsson, C. Carlsson, J. Gustavsson and A. Haglund, “Broadband direct
modulation of VCSELs and applications in fiber optic RF links,” in IEEE
International Topical Meeting on Microwave Photonics (MWP 2004), Ogunquit,
2004.

References 137
[51] “Single Mode vs. Multi-Mode Fiber Optic Cable,” Multicom, 2017. [Online].
Available: https://www.multicominc.com/training/technical-resources/single-mode-
vs-multi-mode-fiber-optic-cable/. [Accessed 10 September 2017].
[52] L. Pavesi and D. J. Lockwood, Silicon Photonics III: Systems and Applications,
Springer, 2016.
[53] M. Rumny, LTE and the Evolution to 4G Wireless - Design and Measurement
Challenges, John Wiley & Sons Ltd, 2nd edn, 2013..
[54] “3GPP TS 36.104 V11.2.0 (2012-09) Base Station Radio Transmission and
Reception,” 3rd Generation Partnership Project (3GPP), 2012.
[55] “Practical Manufacturing Testing of 802.11 OFDM Wireless Devices,” Litepoint,
2012. [Online]. Available: http://www.litepoint.com/wp-
content/uploads/2014/02/Testing-802.11-OFDM-Wireless-Devices_WhitePaper-
1.pdf. [Accessed 10 September 2017].
[56] “ETSI TS 136.101 V13.3.0 (2016-05) - LTE; Evolved Universal Terrestrial Radio
Access (E-UTRA); User Equipment (UE) radio transmission and reception (3GPP TS
36.101 version 13.3.0 Release 13,” 2016.
[57] X. Ge, H. Cheng, M. Guizani and T. Han, “5G wireless backhaul networks:
challenges and research advances,” IEEE Network, vol. 28, no. 6, pp. 6-11, 2014.
[58] “Distributed Antenna Systems Portfolio,” i3 integrated installation inc., 2015.
[Online]. Available: http://www.i3install.com/portfolio/das/. [Accessed 10
September 2017].

References 138
[59] C. H. Cox, E. I. Ackerman, G. E. Betts and J. L. Prince, “Limits on the performance
of RF-over-fiber links and their impact on device design,” IEEE Transactions on
Microwave Theory and Techniques, vol. 54, no. 2, pp. 906-920, 2006.
[60] E. Ackerman, S. Wanuga, D. Kasemset, A. S. Daryoush and N. R. Samant,
“Maximum dynamic range operation of a microwave external modulation fiber-optic
link,” IEEE Transactions on Microwave Theory and Techniques, vol. 41, no. 8, pp.
1299-1306, 1993.
[61] Commscope, “Interleaved MIMO: Near-full MIMO performance, nearly half the
costs,” Feb. 2017. [Online]. Available:
https://www.google.co.uk/url?sa=t&rct=j&q=&esrc=s&source=web&cd=1&ved=0a
hUKEwiYprny0cfWAhWLJVAKHdAfCy4QFggoMAA&url=http%3A%2F%2Fww
w.commscope.com%2FDocs%2FInterleaved_MIMO_white_paper_WP-
109965.pdf&usg=AFQjCNH_frMZiZqbpJdSkcsIiqKXdtL-9Q. [Accessed 10
September 2017].
[62] G. Gordon, M. J. Crisp, R. V. Penty and I. H. White, “Experimental Comparison of
Antenna Clustering Strategies in MIMO Distributed Antenna Systems,” 2014 IEEE
80th Vehicular Technology Conference (VTC2014-Fall), pp. 1-5, 2014.
[63] E. M. Vitucci, L. Tarlazzi, P. Faccin and V. Degli-Esposti, “Analysis of the
performance of LTE systems in an Interleaved F-DAS MIMO indoor environment,”
in The 5th European Conference on Antennas and Propagation (EUCAP), Rome,
2011.
[64] Z. Zhang, X. Wang, K. Long, A. Vasilakos and L. Hanzo, “Large-scale MIMO-based
wireless backhaul in 5G networks,” IEEE Wireless Communications, vol. 22, no. 5,
pp. 58 - 66, 2015.

References 139
[65] J. Capmany, B. Ortega, A. Martinez, D. Pastor, M. Popv and P. Fonjall,
“Multiwavelength single sideband modulation for WDM radio-over-fiber systems
using a fiber grating array tandem device,” Photonics Technology Letters, IEEE, vol.
17, no. 2, pp. 471-473, 2005.
[66] I. Seto and e. al., , “Optical subcarrier multiplexing transmission for base station with
adaptive array antenna,” IEEE Trans. Microw. Theory Tech., vol. 49, no. 10, pp.
2036-2041, 2001.
[67] G. Gordon, J. Carpenter, M. Crisp, T. Wilkinson, R. Penty and I. White,
“Demonstration of radio-over-fibre transmission of broadband MIMO over
multimode fibre using mode division multiplexing,” in European Conference and
Exhibition on Optical Communication., Optical Society of America, Amsterdam,
2012.
[68] G. S. Gordon and e. al, “Demonstration of radio-over-fibre transmission of
broadband MIMO over multimode fibre using mode division multiplexing.,” in
European Conference and Exhibition on Optical Communication., Optical Society of
America, 2012..
[69] J. Capmany, B. Ortega, A. Martinez, D. Pastor, M. Popov and P. Fonjallza,
“Multiwavelength single sideband modulation for WDM radio-over-fiber systems
using a fiber grating array tandem device,” IEEE Photonics Technology Letters, vol.
17, no. 2, pp. 471-474, 2005.
[70] T. Li, M. Crisp, R. V. Penty and I. H. White, “Low bit rate digital radio over fibre
system,” in 2009 International Topical Meeting on Microwave Photonics, Valencia,
2009.
References 140
[71] Chin-Pang Liu; A. Seeds, "Transmission of MIMO radio signals over fibre using a
novel phase quadrature double sideband frequency translation technique,"
Microwave photonics, 2008. jointly held with the 2008 asia-pacific microwave
photonics conference.
[72] Chin-Pang Liu; Seeds, A.J. "Transmission of Wireless MIMO-Type Signals Over a
Single Optical Fiber Without WDM", Microwave Theory and Techniques, IEEE
Transactions on, On page(s): 3094 - 3102 Volume: 58, Issue: 11, Nov. 2010.
[73] A. Chowdhury, H. Chien, S. Fan, J. Yu and G. Chang,, “Multi-Band Transport
Technologies for In-Building Host-Neutral Wireless Over Fiber Access Systems,”
Lightwave Technology, Journal of, vol. 28, no. 16, pp. 2406-2415, Aug.15, 2010.
[74] J. Zou; H. Chen; F. Huijskens, Z. Cao; E. Tangdiongga, and T. Koonen,
"Demonstration of fully functional MIMO wireless LAN transmission over GI-MMF
for in-building networks," Optical Fiber Communication Conference and Exposition
and the National Fibe.
[75] M. Othman, L. Deng, X. Pang, J. Caminos, W. Kozuch, K. Prince, J. Jensen and I. T.
Monroy, “Directly-modulated VCSELs for 2×2 MIMO-OFDM radio over fiber in
WDM-PON,” in 2011 37th European Conference and Exhibition on Optical
Communication (ECOC), Geneva, 2011.
[76] L. Maksymiuk; J. Siuzdak, "Successful IEEE 802.11n 2-channel MIMO transmission
over standard graded index multimode fiber in passband," Communications (QBSC),
2012 26th Biennial Symposium on, pp.15-18, 28-29 May 2012.
References 141
[77] M. Morant, J. Prat and R. Llorente,, “Radio-Over-Fiber Optical Polarization-
Multiplexed Networks for 3GPP Wireless Carrier-Aggregated MIMO Provision,”
Lightwave Technology, Journal of, vol. 32, no. 20, pp. 3721-3727, 2014.
[78] G. Gordon, M. Crisp, R. Penty, T. Wilkinson and I. and I. White, “Feasibility
Demonstration of a Mode-Division Multiplexed MIMO-Enabled Radio-Over-Fiber
Distributed Antenna System,” Journal of Lightwave Technology, vol. 32, no. 20, pp.
3521-3528, 2014.
[79] Y. Yang, M. J. Crisp, R. V. Penty and I. H. White, “Low-Cost MIMO Radio Over
Fiber System for Multiservice DAS Using Double Sideband Frequency Translation,”
Journal of Lightwave Technology, vol. 34, no. 16, pp. 3818-3824, Aug. 15 2016.
[80] Marpaung, David & Roeloffzen, Chris & Heideman, R.G. & Leinse, Arne & Sales,
Salvador & Capmany, J. (2013). Integrated Microwave Photonics. Laser & Photonics
Review. 7. . 10.1002/lpor.201200032..
[81] “Amplifier ZHL-42W+,” Minicircuits, 2017. [Online]. Available:
https://www.minicircuits.com/pdfs/ZHL-42W+.pdf. [Accessed 10 September 2017].
[82] “Low Noise Bypass Amplifier ZX60-53LNB+,” Minicircuits, 2017. [Online].
Available: https://www.minicircuits.com/pdfs/ZX60-53LNB+.pdf. [Accessed 10
September 2017].
[83] “Power Combiner ZX10Q-2-25.pdf,” Minicircuits, 2017. [Online]. Available:
https://ww2.minicircuits.com/pdfs/ZX10Q-2-25.pdf. [Accessed 10 September 2017].
[84] A. Flatman, “In-Premises Optical Fibre In-Premises Optical Fibre Installed Base
Analysis to Installed Base Analysis to 2007,” LAN Technologies UK, 2007.
[Online]. Available:
References 142
http://ieee802.org/3/10GMMFSG/public/mar04/flatman_1_0304.pdf. [Accessed 10
September 2017].
[85] “MIMO Performance and Condition Number in LTE,” keysight, 31 July 2014.
[Online]. Available: http://literature.cdn.keysight.com/litweb/pdf/5990-4759EN.pdf.
[Accessed 10 September 2017].
[86] M. Jackson, “ISP News,” 15 10 2014. [Online]. Available:
https://www.ispreview.co.uk/index.php/2014/10/vodafone-uk-deploy-lte-advanced-
ultra-fast-4g-mobile-broadband-speed.html. [Accessed 13 09 2017].
[87] “3 (Three) (United Kingdom) uses 1 UMTS band and 2 LTE bands,” Frequency
Check, 2017. [Online]. Available: https://www.frequencycheck.com/carriers/3-three-
united-kingdom. [Accessed 13 09 2018].
[88] “EE (Everything Everywhere) (United Kingdom) uses 1 GSM band, 1 UMTS band,
and 3 LTE bands. Find out if your unlocked phone or mobile device will work with
EE (Everything Everywhere) (United Kingdom),” Frequency check, 2017. [Online].
Available: https://www.frequencycheck.com/carriers/ee-everything-everywhere-
united-kingdom. [Accessed 13 09 2018].
[89] “O2 (United Kingdom) uses 2 GSM bands, 2 UMTS bands, and 2 LTE bands.,”
Frequency check, 2017. [Online]. Available:
https://www.frequencycheck.com/carriers/o2-united-kingdom. [Accessed 13 09
2018].
[90] “Vodafone (United Kingdom) uses 2 GSM bands, 2 UMTS bands, and 2 LTE
bands.,” Frequency check, 2017. [Online]. Available:

References 143
https://www.frequencycheck.com/carriers/vodafone-united-kingdom. [Accessed 13
09 2018].
[91] “UK frequency allocation table,” Ofcom, 12 01 2017. [Online]. Available:
https://www.ofcom.org.uk/__data/assets/pdf_file/0016/103309/uk-fat-2017.pdf.
[Accessed 13 09 2018].
[92] “LTE;Evolved Universal Terrestrial Radio Access (E-UTRA); User Equipment (UE)
radio transmission and reception (3GPP TS 36.101 version 14.3.0 Release 14),”
ETSI, 04 2017. [Online]. Available:
http://www.etsi.org/deliver/etsi_ts/136100_136199/136101/14.03.00_60/ts_136101v
140300p.pdf. [Accessed 13 09 2018].
[93] “Nex-Tech set to deploy LTE in Kansas using 1900MHz spectrum,” TeleGeography,
05 09 2013. [Online]. Available:
https://www.telegeography.com/products/commsupdate/articles/2013/09/05/nex-
tech-set-to-deploy-lte-in-kansas-using-1900mhz-spectrum/. [Accessed 13 09 2017].
[94] “FCC 700 MHz Band Auction,” Federal Communications Commission, 19 03 2008.
[Online]. Available: https://apps.fcc.gov/edocs_public/attachmatch/DA-08-
595A2.pdf. [Accessed 13 09 2017].
[95] “700 MHz Lower Band (Blocks C, D) License - WPWU903 - T-Mobile License
LLC,” Federal Communications Commission , 24 01 2003. [Online]. Available:
http://wireless2.fcc.gov/UlsApp/UlsSearch/license.jsp?licKey=2479842. [Accessed
13 09 0013].
[96] 2. U. b. a. 3. L. b. China Mobile (China) uses 2 GSM bands, "China Mobile (China)
uses 2 GSM bands, 2 UMTS bands, and 3 LTE bands," Frequency check, 2017.

References 144
[Online]. Available: https://www.frequencycheck.com/carriers/china-mobile-china.
[Accessed 20 09 2018].
[97] “China Unicom (China) uses 2 GSM bands, 1 UMTS band, and 2 LTE bands.,”
Frequency check, 2017. [Online]. Available:
https://www.frequencycheck.com/carriers/china-unicom-china. [Accessed 20 09
2017].
[98] “China Telecom (China) uses 2 LTE bands and 2 CDMA bands,” Frequency check,
2017. [Online]. Available: https://www.frequencycheck.com/carriers/china-telecom-
china. [Accessed 20 9 2017].
[99] Y. Yang, M. J. Crisp, T. Li, R. V. Penty and I. H. White, “MIMO Capable RoF
System with Improved SFDR using Quadruple Sidebands,” in 2017 IEEE
International Topical Meeting on Microwave Photonics (MWP), Beijing, China,
2017.
[100] D. Wake, A. Nkansah and N. J. Gomes, “Radio Over Fiber Link Design for Next
Generation Wireless Systems,” Journal of Lightwave Technology, pp. 2456-2464, 15
August 2010.
[101] S. R. Abdollahi, A. Raweshidy, S. M. Fakhraie and R. Nilavalan, “Digital Radio over
Fibre for Future Broadband Wireless Access Network Solution,” in 2010 6th
International Conference on Wireless and Mobile Communications, Valencia, 2010.
[102] “Cisco SFP-10G-LRM Compatible 10GBASE-LRM SFP+ 1310nm 220m DOM
Transceiver,” Fiber Store, 2017. [Online]. Available:
http://www.fs.com/products/11556.html. [Accessed 20 09 2017].

References 145
[103] M. Hinrichs, L. F. del Rosal, C. Kottke and V. Jungnickel, “Analog vs. next-
generation digital fronthaul: How to minimize optical bandwidth utilization,” in 2017
International Conference on Optical Network Design and Modeling (ONDM),
Budapest, 2017.
[104] T. Li, Y. Yang, R. Penty and I. White, “Digital and Analogue Hybrid Radio over
Fiber System for Indoor Wireless Coverage,” in IEEE International Conference on
Communications (ICC), Kansas City, 2018.
[105] 3GPP, “Technical Specifications and Technical Reports for a UTRAN-based 3GPP
system, Specification #: 21.101,” 2015 .
[106] “ CPRI specification 6.1 [available: www.cpri.info],” Ericsson AB et al., Jul. 2014.
[107] T. Li, R. Penty and I. White, “Novel digital radio over fibre for 4G-LTE,” in 2015
IEEE International Conference on Communication Workshop (ICCW), London,
2015.
[108] T. Norman, “Research forecast report—Wireless network traffic 2010–2015:
forecasts and analysis,” AnalysysMason, London, 2010.
[109] “ZTE Releases World’s First Pre5G FDD Massive MIMO Solution, Verified by Joint
Field Tests with China Unicom,” ZTE, 30 December 2016. [Online]. Available:
http://www.zte.com.cn/global/about/press-center/news/201612ma/1230. [Accessed
20 September 2017].
[110] “ZTE Unveils Forward-looking “5uper Generation” Smartphone with Download
Speeds Reaching up to 1Gbps,” ZTE, 26 Febrary 2017. [Online]. Available:
References 146
http://www.zte.com.cn/global/about/press-center/news/201702Ma/0227ma2.
[Accessed 20 September 2017].
[111] A. Kaszubowska, L. P. Barry, . P. Anandarajah and L. Hu, “Characterization of
wavelength interleaving in radio-over-fiber systems employing WDM/SCM,” Optics
Communications, vol. 260, no. 1, pp. 144-149, 2006.
[112] O. Said and M. Masud, “Towards Internet of Things: Survey and Future Vision,”
International Journal of Computer Networks (IJCN), 2013.
[113] “The 'Internet of Things' will be the world's most massive device market and save
companies billions of dollars,” Business Insider, 18 February 2015. [Online].
Available: http://uk.businessinsider.com/the-internet-of-things-market-growth-and-
trends-2015-2. [Accessed 20 September 2017].
[114] “Internet of Things (IoT) Infrastructure: Market for IoT Platforms, Hardware, and
Software 2015 - 2020,” CISION, 19 January 2016. [Online]. Available:
http://www.prnewswire.com/news-releases/internet-of-things-iot-infrastructure-
market-for-iot-platforms-hardware-and-software-2015---2020-300206623.html.
[Accessed 20 Spetember 2017].
[115] A. Zanella, N. Bui, A. Castellani, L. Vangelista and M. Zorzi, “Internet of Things for
Smart Cities,” IEEE Internet of Things Journal, vol. 1, no. 1, pp. 22-32, 2014.