Embed Size (px)
Citation preview

Journal of Food Engineering 97 (2010) 329–334
Contents lists available at ScienceDirect
Journal of Food Engineering
journal homepage: www.elsevier .com/ locate / j foodeng
Milling behavior of hulled barley and its thermal and pasting properties
Paras Sharma, Hardeep Singh Gujral *
Department of Food Science and Technology, Guru Nanak Dev University, Amritsar, 143005 Punjab, India
a r t i c l e i n f o
Article history:Received 2 June 2009Received in revised form 21 October 2009Accepted 22 October 2009Available online 27 October 2009
Keywords:Barleyb-GlucanDehuskingPearling
0260-8774/$ - see front matter � 2009 Elsevier Ltd. Adoi:10.1016/j.jfoodeng.2009.10.025
* Corresponding author.E-mail address: [email protected] (H.S. Gujral
a b s t r a c t
Eight commonly grown Indian hulled barley cultivars were studied for their dehusking, pearling, physico-chemical, b-glucan, pasting and thermal behavior. Milling of the hulled barley at 14% moisture signifi-cantly lowered the dehusking and pearling time as compared to milling at 10% moisture content. Theextraction rate ranged from 55.05% to 62.35% and significantly (p < 0.05) differed among the cultivars.Particle size distribution of flours was significantly different among the cultivars with flour from RD-2552 and RD-2035 cultivars having the most even particle size distribution. The colour difference (DE)was not significantly different among cultivars. The extractable b-glucan content varied from 1.93% to3.81% among the cultivars and was highest in PL-172. The final pasting viscosity was significantly differ-ent among cultivars while the pasting temperature did not vary significantly. The enthalpy (DH) of gela-tinization of barley flour varied from 4.45 to 7.08 J/g and gelatinization temperature (Tp) varied from64.23 to 66.26 �C.
� 2009 Elsevier Ltd. All rights reserved.
1. Introduction
Barley (Hordeum vulgare) is an ancient and important cerealgrain and occupies about 9.4% of the total world area under cerealproduction and ranks fifth in the world (FAO, 2007). It is a func-tional grain and an excellent source of b-glucan, B-complex vita-mins, tocotrienols and tocopherols. In India barley is the mostimportant cereal crop in winter after wheat occupying an area ofnearly 0.7 million hectares with total production of 1.4 milliontones.
The predominant type of barley cultivated is hulled having atough fibrous husk and is used as a malting and brewing grain.The other type is the hulless or naked barley in which the hull iseasily removed during threshing similar to wheat. In India thenaked barley is rarely grown due to low yield, weak straw and be-cause of its unsuitability as a malting grain. The highest per capitaconsumption of barley (68 kg barley per year) in Morocco has beenreported by Bhatty (1991). At present only 2% of the barley is usedas human food (Baik and Ullrich, 2008). The reasons that make bar-ley unpopular as human food are: (i) presence of a husk that is dif-ficult to remove, (ii) most of the barley is used up by the maltingand brewing industry, (iii) barley lacks the gluten proteins there-fore cannot be used in leavened bakery products and (iv) strongtaste and gummy mouthfeel of whole barley kernels. Barley shouldbe used as a human food because it has one of the highest levels(up to 6%) of b-glucan, a water-soluble polysaccharide, nutrition-
ll rights reserved.
).
ally classified as soluble dietary fiber (Dandey and Bobraszczyk,2001). b-Glucan has become commercially important because ofits effectiveness in reducing postprandial serum glucose levels,insulin response and serum cholesterol concentrations (Cavalleroet al., 2002; Behall et al., 2004). Review of literature revealed thatthere was little information on the methods of milling of this cer-eal. The barley flour available in the local market in India is stonemilled and is heavily contaminated with the husk as it is not sub-jected to any dehusking process. Barley flour because of its nutra-ceutical advantage should be made available for use in foodproducts. Barley meals and fractions are now gaining renewedinterest for the production of functional foods due to their contentof bioactive compounds.
The objective of the present investigation was to study: (a) thepossibility of using a rice polisher to remove husk and bran frombarley grain, (b) the extraction rate of flour by milling dehuskedbarley (brown barley) in a roller mill (Brabender Quadrument Ju-nior Mill) and (c) the physico-chemical, pasting and thermal prop-erties of whole barley flour from different hulled barley.
2. Materials and methods
Eight common hulled barley cultivars namely PL-172, PL-426,RD-2503, RD-2508, RD-2035, RD-2052, RD-2552 (six rowed) andDWR-28 (two rowed) grown in different locations in the states ofPunjab, Haryana, Uttar Pradesh and Rajasthan were collected fromCentral State Seed Farm, Sriganganagar, India. The grain wascleaned and stored for further evaluation. All chemicals were usedanalytical grade.

330 P. Sharma, H.S. Gujral / Journal of Food Engineering 97 (2010) 329–334
2.1. Dehusking and pearling of hulled barley
Barley cultivars were conditioned to 10% and 14% moisture con-tent before dehusking. The dehusking was carried out in a McGillRice Miller No. 2 (Rapsco Brookshire TX, USA). The conditioned bar-ley (150 g) was placed in the polisher chamber and pressure on thegrain during dehusking was controlled by the placing a weight of660 g on the mill lever arm at a distance of 25.5 cm from the centerof the saddle to the center of the weight as reported by Singh et al.(2000). The percent husk removed was calculated every 30 s till theentire husk was removed. A polynomial equation was used to de-scribe the relationship between dehusking time and percentagehusk removed
y ¼ ax2 þ bxþ c
where, y is dehusking time (s), x2 and x are the % husk removed insquare and linear terms.
The pearling of dehusked barley was carried out in the samepolisher at moisture levels of 10% and 14%. The percentage bran re-moved was determined at every 1 min interval. The relationshipbetween percentage bran removed and pearling time was de-scribed by a linear equation
p ¼ aqþ b
where, p is pearling time (s) and q is the % bran removed. Thedehusking and pearling was carried out in triplicate (n = 3) andmean was used to develop the polynomial equations.
The dehusked barley (100 g) was roller milled using the Brab-ender Quadrument Junior Mill (Brabender, Germany) and amountof white flour weighed and extraction rate was reported. The de-husked barley was ground in the Newport Super Mill (Newport,Australia) to pass through 60 BSS sieve to obtain whole barleyflour.
2.2. Physical and chemical characteristics of dehusked barley
The bulk density, thousand kernel weight, husk content and L/Bratio of the dehusked barley was determined. The husk contentwas determined by removing the husk manually as reported byKnuckle et al. (1992). Flour samples were analyzed for their mois-ture, fat, ash, protein (%N � 6.25) and crude fiber content byemploying standard methods of analysis (AOAC, 1990). Each testwas performed in triplicates on dry weight basis.
2.3. Colour characteristics of flour
Colour measurement of flour samples was carried using a Hun-ter Colorimeter fitted with optical sensor (Hunter Associates Labo-ratory Inc., Restan, VA, USA) on the basis of CIE L*, a*, b* coloursystem as describe by Edney et al. (2002). The total colour differ-ence (DE) was calculated by applying the following equation:
DE ¼ ðDL�Þ þ ðDa�Þ þ ðDb�Þ½ �1=2:
2.4. Particle size distribution of flour
The particle size distribution of flour was carried out as re-ported by Phillips et al. (1988). Flour (100 g) was sifted with aset of graded standard British sieves (Nos. 72, 85, 100, 120, 150,200 BSS and collection pan) for 2 min in a shaker (Narang ScientificSieve Shaker, New Delhi). The retained flour on each sieve wasweighed and expressed as percentage retention.
2.5. Extractable b-glucan
Extraction of b-glucan was carried out as reported by Temelli(1997). Whole barley flour (50 g) was suspended in 500 ml dis-tilled water, pH was adjusted to 7 with sodium carbonate (20%,w/v) and stirred vigorously for 30 min at 55 �C. The mixture wascentrifuged (REMI cooling centrifuge model No. C 24) for 15 minat 15,000�g and 4 �C to remove solids. The supernatant was ad-justed to pH 4.5 with 2 M HCl and centrifuged again (20 min at19,000�g, 4 �C) to separate precipitated protein, which was dis-carded. b-Glucan was precipitated by addition of an equal volumeof ethanol (99.9%) to the supernatant slowly with stirring. The pre-cipitate was recovered by centrifugation (10 min at 3300�g) afterallowing it to settle over night at 4 �C. The rubbery pellet wasresuspended in ethanol and the mixture was homogenized at roomtemperature until uniform dispersion was obtained. The samplewas filtered and washed with 100 mL ethanol (99.9%) and air driedto a constant weight.
2.6. Water absorption capacity, water solubility index and oilabsorption capacity of flour
Water absorption capacity of flour was measured by the centri-fugation method of Sosulski (1962). Flour (3 g) was dispersed in25 mL of distilled water and placed in pre-weighed centrifugetubes. The dispersion was stirrer for 10 min followed by centrifu-gation for 25 min at 3000�g. The supernatant was drained off byallowing the tube to stand inverted for 10 min. The supernatantobtained from water absorption capacity were collected in pre-weighed and dry petri plates and dried in hot air oven for 24 h at105 �C temperature. The results were expressed as % water solubil-ity index.
The oil absorption capacity was determined according to meth-od of Lin et al. (1974). Flour (0.5 g) was mixed with 10 ml of refinedoil (Soybean Refined Oil, Fortune Brand, India) in pre-weighed cen-trifugal tube and vortexed for 10 min. The tubes were centrifugedfor 25 min at 3000�g. The oil was drained off by inverting for10 min and centrifuge tubes were weighed.
2.7. Pasting properties
Pasting properties of flours were studied using a Rapid ViscoAnalyzer (Newport Scientific Pty Ltd., Australia) using the StandardProfile 1. Flour (3 g on 14% moisture basis) was taken in the canis-ter and 25 ml water was added. The suspension was mixed thor-oughly with plastic paddle to prevent lump formation beforeRVA analysis that involved a heating step of 50–95 �C at 6 �C/min, a holding phase at 95 �C for 5 min, a cooling step from 95 �Cto 50 �C at 6 �C/min and a holding phase at 50 �C for 2 min. Thepeak viscosity, breakdown viscosity, final viscosity, setback viscos-ity, peak time and pasting temperature were reported.
2.8. Thermal properties
The thermal characteristics of barley flour were analyzed byusing a Differential Scanning Calorimeter (Mettler Toledo, Switzer-land) equipped with a thermal analysis data station. The sample(5 mg, dry weight basis) was loaded into a 40 ll aluminium panand distilled water was added (flour to distilled water ratio was1:2.3). The sample was hermetically sealed and allowed to standfor 1 h at room temperature before heating in DSC. The DSC ana-lyzer was calibrated using indium and an empty aluminium panwas used as reference. The sample was heated at a rate of 10 �C/min from 30 to 100 �C, onset temperature (To), peak temperature(Tp), endset temperature (Tc) and enthalpy of gelatinization (DHgel)was calculated automatically. The gelatinization range (R) was

P. Sharma, H.S. Gujral / Journal of Food Engineering 97 (2010) 329–334 331
(Tc � To), the peak height index (PHI) was calculated by the ratioDHgel/(Tp � To) as describe by Kruger et al. (1987).
2.9. Statistical analysis
Analysis of variance was carried out and Fishers least significantdifference test was used to describe means with 95% confidence.
3. Result and discussion
3.1. Dehusking and pearling behavior of husked barley
The polynomial equations used to describe the relationship be-tween dehusking time and percentage husk removed for differentbarley cultivars are shown in Table 1. The equations had high R2
value and the predicted dehusking time ranged from 46 to 84 sfor different barley cultivars (Table 1). The maximum dehuskingtime required was for RD-2508 whereas lowest time requiredwas for RD-2503. The difference in dehusking time may be attrib-uted to the difference in cultivars and adhesiveness of husk toendosperm. The conditioning to 14% moisture lowered the dehusk-ing time with the highest being for RD-2035 and lowest for RD-2052 cultivars. This decrease could be attributed to softening ofhusk at higher moisture content and due to weakening of the bondbetween endosperm and husk.
The relationship between pearling time and percentage bran re-moved was described by linear equations (Table 1). The barley cul-tivars at 10% moisture content showed pearling time ranging from
Table 1Regression equations for the dehusking and pearling behavior of hulled barley.
Cultivar Regression equation (10% moisture) R2 Predicted dehusking time (
Dehusking behaviorDWR-28 y = �0.001x2 � 0.285x � 0.288 0.99 54RD-2503 y = �0.001x2 � 0.274x � 0.337 0.99 46RD-2508 y = �0.001x2 � 0.183x � 0.215 0.99 84RD-2035 y = �0.001x2 � 0.215x � 0.082 0.99 81RD-2052 y = 0.001x2 � 0.269x � 0.300 0.99 65RD-2552 y = 0.001x2 � 0.249x � 0.142 0.98 58PL-172 y = 0.001x2 � 0.229x � 0.342 0.98 61PL-426 y = 0.001x2 � 0.274x � 0.354 0.99 61
Pearling behaviorDWR-28 p = 0.014q + 0.667 0.99 666RD-2503 p = 0.024q � 0.082 0.99 420RD-2508 p = 0.042q � 0.177 0.99 242RD-2035 p = 0.010q + 0.297 0.99 970RD-2052 p = 0.021q � 0.225 0.99 487RD-2552 p = 0.009q + 0.285 0.99 1079PL-172 p = 0.013q + 0.239 0.99 750PL-426 p = 0.042q � 0.573 0.99 252
Where y is predicted dehusking or pearling time (s) and x2 and x are the % husk or bran
Table 2Physical properties of barley and their proximate composition.
Cultivar % Husk Bulk density(ml/g)
L/B ratio Thousand kernelweight (g)
Extrrate
DWR-28 11.1c 0.6c 2.2a 54.5f 56.2RD-2503 9.6a 0.6c 2.5a 43.0c 58.5RD-2508 11.3c 0.6b 2.3a 40.4b 55.0RD-2035 11.5c 0.6c 2.4a 41.6b 60.6RD-2052 12.3d 0.6c 2.4a 44.4d 62.2RD-2552 10.8c 0.6d 2.3a 47.9e 62.3PL-172 10.2b 0.6d 2.5a 40.7b 61.4PL-426 13.0e 0.5a 2.3a 38.2a 57.9
a, b, c, d, e and f superscripts are significantly different (p < 0.05) column wise within cu
242 to 1079 s. The longest time required for 10% bran removal wasfor RD-2552 and least time required was for RD-2508. Increasingthe moisture content to 14% lowered the pearling time that rangedfrom 228 to 1068 s with longest observed for RD-2552 and shortestfor RD-2508. The highest decrease (16.70%) in pearling time wasobserved in the RD-2035 while minimum reduction (1.60%) wasobserved in PL-426 cultivar. The coefficient of percent bran re-moved in linear terms both at 10% and 14% moisture contentshowed a negative correlation coefficient of �0.94 with bulk den-sity of barley grain. Bhatty and Rossnagel (1998) reported the po-sitive relationship between hardness of barley and pearling time.
3.2. Physical characteristics of barley
The husk content was significantly (p < 0.05) different for allcultivars and varied from 9.57% to 13% (Table 2). The barley culti-var PL-426 showed highest husk content where as RD-2503 hadleast husk content. Bhatty et al. (1975) reported husk content rang-ing from 10% to 13% where as Zielinski and Kozlowska (2000) re-ported husk content ranging from 7.6% to 9.8%. The thousandkernel weight was significantly (p < 0.05) different within cultivarswith maximum being observed in DWR-28 (two row barley) due totheir large size and compact filled grain where as minimum thou-sand kernel weight was observed for PL-426 (six row barley). Thedifference in variety, filling characteristics of grains during devel-opment and agricultural practices are responsible for these differ-ences. Bhatty and Rossnagel (1998) reported 27–40 g of thousandkernel weight for Japanese and Canadian barley, respectively.
s) Regression equation (14% moisture) R2 Predicted dehusking time (s)
y = �0.001x2 � 0.218x � 0.097 0.99 39y = 0.001x2 � 0.249x � 0.238 0.98 50y = 0.00x2 � 0.196x � 0.053 0.99 69y = 0.001x2 � 0.196x � 0.138 0.99 87y = 0.001x2 � 0.277x � 0.152 0.99 37y = 0.001x2 � 0.246x � 0.137 0.99 58y = 0.001x2 � 0.257x � 0.123 0.99 49y = 0.001x2 � 0.337x � 0.455 0.99 48
p = 0.020q + 0.153 0.99 492p = 0.027q + 0.102 0.99 367p = 0.044q � 0.014 0.99 228p = 0.012q + 0.304 0.99 808p = 0.020q � 0.080 0.99 504p = 0.009q + 0.384 0.99 1068p = 0.011q + 0.111 0.99 899p = 0.040q + 0.043 0.99 248
removed in square and linear terms.
action(%)
% Protein % Ash % Fat % Crude fiber Extractableb-glucan (%)
b 13.4b 1.5d 3.4a 1.5b 2.8a
d 11.7a 1.4c 3.0a 1.5b 2.3a
a 12.5b 1.4b 5.2b 1.7b 2.0a
e 13.1b 1.1a 3.9a 1.6b 3.1a
g 11.4a 1.3b 2.9a 1.0a 2.4a
g 8.7a 1.4b 6.1c 1.5b 2.4a
f 11.4a 1.3b 3.7a 0.9a 3.8b
c 9.6a 1.5d 3.3a 1.1a 1.9a
ltivars.

332 P. Sharma, H.S. Gujral / Journal of Food Engineering 97 (2010) 329–334
3.3. Milling of dehusked barley
Roller milling revealed that the different barley cultivars weresignificantly (p < 0.05) different in their extraction rate (Table 2).The highest and lowest extraction rate was observed for RD-2552(62.35%) and RD-2508 (55.05%), respectively. Izydorczyk et al.(2003) reported extraction rate ranging from 51.1% to 63.1% forroller milled barley cultivars. Bhatty (1999) roller milled the barleyand reported that average extraction rate ranged from 43% to 60%for different barley cultivars.
The protein content ranged from 8.75% to 13.45% and signifi-cantly varied among the cultivars (Table 2) with DWR-28 andRD-2552 having highest and lowest protein content, respectively.The fat content significantly differed for all cultivars and it rangedfrom 2.99% to 6.17%. Jood and Kalra (2001) reported protein con-tent ranging from 7.50% to 11.5% and fat content ranging from2.83% to 3.98% for different Indian hulled barley cultivars. Ander-son et al. (1999) reported the fat and protein content ranged from2.9–6.2% and 11.4–18.1%, respectively in barley. RD-2508 hadhighest crude fiber content of 1.74% and PL-172 had lowest with0.92%. The ash content ranged from 1.15% to 1.51% with DWR-28and PL-426 having maximum ash content whereas RD-2035 hav-ing minimum ash content. Oscarsson et al. (1996) also observedthe ash content ranging from 1.9% to 2.3% for different hulled bar-ley cultivars.
3.4. Particle size distribution of flour
The percentage retention of flour on different sieves revealedthat the particle size distribution were significantly (<0.05) differ-ent for all cultivars (Table 3). All of the flour passed through 60 BSSsieve but 42.8% to 51.3% was retained on 72 BSS sieve. The RD-2552 had highest retention on 72 BSS while DWR-28 had lowestretention indicating that the RD-2552 had the largest amount ofcoarse fraction. The flour that passes through 200 BSS was very fineflour (particle size < 75 lm) and the data was significantly (<0.05)different and ranged from 15.67% to 23%. RD-2503 contained thelargest amount of very fine flour whereas RD-2552 contained the
Table 4Colour characteristics and physico-chemical properties of barley flours.
Cultivar L* a* b* Colour difference (DE) Water solub
DWR-28 89.0 0.9b 8.7c 89.5a 11.7b
RD-2503 88.7 0.9b 8.0b 89.1a 9.6a
RD-2508 88.6 0.7a 7.6a 88.9a 9.2a
RD-2035 89.0 1.0c 8.0b 89.4a 10.4a
RD-2052 88.6 0.7a 7.8b 88.9a 10.2a
RD-2552 89.1 0.9b 8.6c 90.0a 9.2a
PL-172 89.6 0.9b 8.5c 90.0a 10.0a
PL-426 89.5 0.7a 8.5c 89.9a 9.9a
a, b, c d, e and f superscripts are significantly (p < 0.05) different column wise within cu
Table 3Particle size distribution of whole barley flour.
Cultivar % Retention 72BSS (211 lm)
% Retention 85BSS (178 lm)
% Retention 100BSS (152 lm)
% RetentioBSS (125 l
DWR-28 42.8a 2.0c 3.7a 11.3g
RD-2503 47.2d 1.7b 5.3a 6.3 b
RD-2508 46.7d 0.7a 6.8b 7.5d
RD-2035 49.7e 1.4b 3.3a 8.8f
RD-2052 44.7b 1.0a 8.2c 8.4e
RD-2552 51.3f 0.9a 3.9a 6.2c
PL-172 47.3d 1.5b 5.1a 7.2c
PL-426 45.4c 1.0a 10.2d 2.7a
a, b, c, d, e, f and g superscripts are significantly different (p < 0.05) column wise within
least amount. The average particle size indicated that the DWR-28 had the finest flour among the flour whereas PL-426 and RD-2552 had the largest average particle size. DWR-28 is two-rowedvariety and had highest thousand kernel weight also resulted inflour with least average particle size. The particle size of flour is af-fected by milling and softness of grain endosperm (Rogers et al.,1993). The percentage flour retention on 100 BSS sieve showed po-sitive correlation coefficient of 0.77 with protein content of barleygrain. Flour particle size distribution influences dry flour flow char-acteristics, water absorption rate during mixing and final foodproduct sensory qualities (McWatters, 1983).
3.5. Colour characteristics of flour
The colour of flour was evaluated by CIE colour system. The L*value indicates the lightness, 0–100 representing dark to light.The statistical analysis revealed that the L* value was not signifi-cantly affected with change in cultivar (Table 4). Bhatty (1993) alsoreported similar values for lightness for barley flour. The a* valuegives the degree of the red green colour, with a higher positivea* value indicating more redness. Redness (a*) of flour significantlychanged with cultivars and ranged from 0.73 to 1.06. The highesta* value was observed for RD-2035 while RD-2508 had lowest.The b* value indicates the degree of yellow blue colour, with higherpositive b* value indicating more yellow. The b* significantly variedamong cultivars. The b* value ranged from 7.60 to 8.78 with high-est observed was for DWR-28 and lowest for RD-2508 cultivar. Thetotal colour difference (DE) was not significantly affected bychange in cultivar.
3.6. Extractable b-glucan
The extractable b-glucan ranged from 1.93% to 3.81% among theeight barley cultivars, PL-172 contained highest extractable b-glu-can which was significantly higher as compared to other cultivars(Table 2). Temelli (1997) reported the b-glucan yield of 5.54% frombarley. Saulnier et al. (1994) reported that yield of b-glucan ranged
ility index (%) Water holding capacity (g/g) Oil holding capacity (g/g)
1.4d 1.6c
1.3a 1.5a
1.4b 1.5a
1.6e 1.6b
1.3a 1.5a
1.4b 1.6b
1.6f 1.5a
1.4c 1.5a
ltivars.
n 120m)
% Retention 150BSS (104 lm)
% Retention 200BSS (75 lm)
Through(200 BSS)
Averageparticle size
7.0g 10.7a 21.6c 0.3a
3.2c 11.5b 23.0d 0.4b
5.2e 11.6b 20.8b 0.4c
2.7b 11.2b 16.7a 0.4c
4.2d 16.4e 16.4a 0.4c
6.0f 13.4c 15.6a 0.4d
6.3f 11.4b 20.2b 0.4c
2.0a 15.8d 21.8c 0.4d
cultivars.
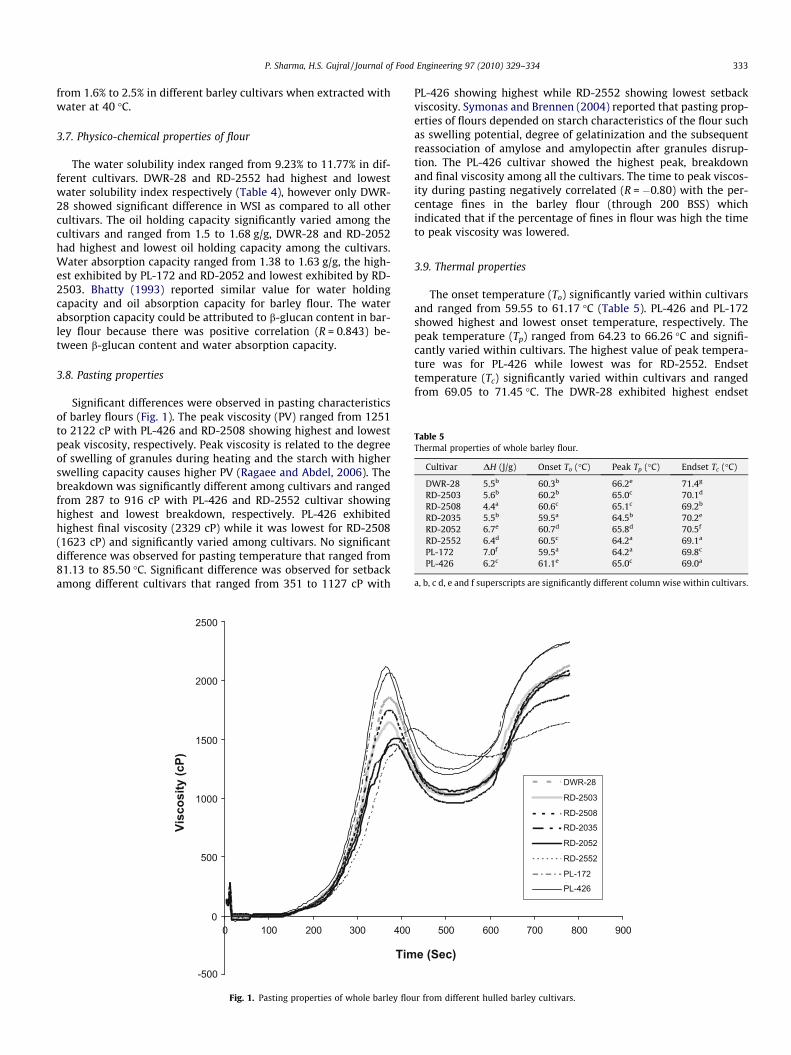
Table 5Thermal properties of whole barley flour.
Cultivar DH (J/g) Onset To (�C) Peak Tp (�C) Endset Tc (�C)
DWR-28 5.5b 60.3b 66.2e 71.4g
RD-2503 5.6b 60.2b 65.0c 70.1d
RD-2508 4.4a 60.6c 65.1c 69.2b
RD-2035 5.5b 59.5a 64.5b 70.2e
RD-2052 6.7e 60.7d 65.8d 70.5f
RD-2552 6.4d 60.5c 64.2a 69.1a
PL-172 7.0f 59.5a 64.2a 69.8c
PL-426 6.2c 61.1e 65.0c 69.0a
a, b, c d, e and f superscripts are significantly different column wise within cultivars.
P. Sharma, H.S. Gujral / Journal of Food Engineering 97 (2010) 329–334 333
from 1.6% to 2.5% in different barley cultivars when extracted withwater at 40 �C.
3.7. Physico-chemical properties of flour
The water solubility index ranged from 9.23% to 11.77% in dif-ferent cultivars. DWR-28 and RD-2552 had highest and lowestwater solubility index respectively (Table 4), however only DWR-28 showed significant difference in WSI as compared to all othercultivars. The oil holding capacity significantly varied among thecultivars and ranged from 1.5 to 1.68 g/g, DWR-28 and RD-2052had highest and lowest oil holding capacity among the cultivars.Water absorption capacity ranged from 1.38 to 1.63 g/g, the high-est exhibited by PL-172 and RD-2052 and lowest exhibited by RD-2503. Bhatty (1993) reported similar value for water holdingcapacity and oil absorption capacity for barley flour. The waterabsorption capacity could be attributed to b-glucan content in bar-ley flour because there was positive correlation (R = 0.843) be-tween b-glucan content and water absorption capacity.
3.8. Pasting properties
Significant differences were observed in pasting characteristicsof barley flours (Fig. 1). The peak viscosity (PV) ranged from 1251to 2122 cP with PL-426 and RD-2508 showing highest and lowestpeak viscosity, respectively. Peak viscosity is related to the degreeof swelling of granules during heating and the starch with higherswelling capacity causes higher PV (Ragaee and Abdel, 2006). Thebreakdown was significantly different among cultivars and rangedfrom 287 to 916 cP with PL-426 and RD-2552 cultivar showinghighest and lowest breakdown, respectively. PL-426 exhibitedhighest final viscosity (2329 cP) while it was lowest for RD-2508(1623 cP) and significantly varied among cultivars. No significantdifference was observed for pasting temperature that ranged from81.13 to 85.50 �C. Significant difference was observed for setbackamong different cultivars that ranged from 351 to 1127 cP with
-500
0
500
1000
1500
2000
2500
0 100 200 300 400
Tim
Visc
osity
(cP)
Fig. 1. Pasting properties of whole barley flo
PL-426 showing highest while RD-2552 showing lowest setbackviscosity. Symonas and Brennen (2004) reported that pasting prop-erties of flours depended on starch characteristics of the flour suchas swelling potential, degree of gelatinization and the subsequentreassociation of amylose and amylopectin after granules disrup-tion. The PL-426 cultivar showed the highest peak, breakdownand final viscosity among all the cultivars. The time to peak viscos-ity during pasting negatively correlated (R = �0.80) with the per-centage fines in the barley flour (through 200 BSS) whichindicated that if the percentage of fines in flour was high the timeto peak viscosity was lowered.
3.9. Thermal properties
The onset temperature (To) significantly varied within cultivarsand ranged from 59.55 to 61.17 �C (Table 5). PL-426 and PL-172showed highest and lowest onset temperature, respectively. Thepeak temperature (Tp) ranged from 64.23 to 66.26 �C and signifi-cantly varied within cultivars. The highest value of peak tempera-ture was for PL-426 while lowest was for RD-2552. Endsettemperature (Tc) significantly varied within cultivars and rangedfrom 69.05 to 71.45 �C. The DWR-28 exhibited highest endset
500 600 700 800 900
e (Sec)
DWR-28
RD-2503
RD-2508
RD-2035
RD-2052
RD-2552
PL-172
PL-426
ur from different hulled barley cultivars.
334 P. Sharma, H.S. Gujral / Journal of Food Engineering 97 (2010) 329–334
temperature whereas lowest was for PL-426. Difference in gelatini-zation temperature among the different barley flours may beattributed to differences in size, form and distribution of starchgranules in the flour and to the internal arrangement of starch frac-tion within the granules. The enthalpy of gelatinization (DHgel)ranged from 4.45 to 7.08 J/g and significantly changed within cul-tivars. A positive correlation (R = 0.60) between DHgel and pastingpeak viscosity was observed. The highest DHgel recorded was forPL-172 while lowest for RD-2508. A positive correlation(R = 0.54) was also observed with final pasting viscosity. A signifi-cant (p < 0.05) negative correlation (R = �0.88) was observed be-tween onset temperature (To) and extractable b-glucan. Thegelatinization range (R) varied from 7.88 to 11.11 and was signifi-cantly different among cultivars. DWR-28 exhibited the highest va-lue of gelatinization range and PL-426 exhibited lowest. Ahn et al.(2005) and Szczodark and Pomeranz (1992) have reported similarvalue for onset temperature, peak temperature, endset tempera-ture and enthalpy of gelatinization. When the percentage coarseparticles (percentage retention on 72 BSS sieve) in the barley flourwas high the peak gelatinization temperature (Tp) of the DSC ther-mogram was lowered which was evident from the negative corre-lation (R = �0.89) between percentage retention of flour on 72 BSSsieve and Tp.
4. Conclusions
The barley cultivars evaluated in this study were from differentlocations but from one cropping year only. The study reveled thathulled barley can be dehusked and pearled using a rice polisherand moisture content influences the dehusking and pearling time.The extraction rate of roller milled flour varied significantly amongthe cultivars. The total colour difference (DE) among whole barleyflours was not significantly different. The extractable b-glucan washighest for PL-172 cultivar. The barley flour obtained from the dif-ferent cultivars varied in their pasting and thermal behavior.
References
Ahn, H.J., Kim, J.H., Ng, P.K.W., 2005. Functional and thermal properties of wheat,barley and soy flour and their blends with a microbial transglutaminase. Journalof Cereal Science 70, 380–386.
Anderson, A.A.M., Elfverson, C., Anderson, R., Ragner, S., Aman, P., 1999. Chemicaland physical characteristics of different barley samples. Journal of Science of theFood and Agriculture 79, 979–986.
AOAC, 1990. Official Methods of Analysis of the Association of Official AnalyticalChemist, 15th ed. AOAC, Washington, DC.
Baik, B.K., Ullrich, S.E., 2008. Barley for food: characteristics, improvement, andrenewed interest. Critical review. Journal of Cereal Science 30, 1–10.
Behall, K.M., Scholfield, D.J., Hallfrisch, J., 2004. Diets containing barley significantlyreduce lipid in mildly hypercholesterolemic men and women. American Journalof Clinical Nutrition 80, 1185–1193.
Bhatty, R.S., 1991. Dietary and nutritional aspects of barley in human foods. In:Proceedings International Barley Genetics Symposium, sixth ed., Helsingoorg,Sweden.
Bhatty, R.S., 1993. Physicochemical properties of roller milled bran flour and bran.Cereal Chemistry 70, 397–402.
Bhatty, R.S., 1999. b-Glucan and flour yield of hull-less barley. Cereal Chemistry 76,314–315.
Bhatty, R.S., Rossnagel, B.G., 1998. Comparison of pearled and unpearled Canadianand Japanese barleys. Cereal Chemistry 75, 5–21.
Bhatty, R.S., Bardahl, J.D., Christison, G.I., 1975. Chemical composition and digestibleenergy of barley. Canadian Journal of Animal Science 55, 759–764.
Cavallero, A., Empilli, S., Brighenti, F., Stanco, A.M., 2002. High (1 ? 3, 1 ? 4) b-glucan barley fractions in bread making and their effects on human glycemicresponse. Journal of Cereal Science 36, 56–59.
Dandey, D., Bobraszczyk, B.J., 2001. Cereals and Cereal Products Chemistry andTechnology. Aspen Publication, Maryland.
Edney, M.J., Rossnagel, B.G., Ozawa, S., Brophy, M., 2002. Pearling quality ofCanadian barley varieties and the potential use as rice extenders. Journal ofCereal Science 36, 295–305.
FAO, 2007. <http://www.fao.org>.Izydorczyk, M.S., Dexter, J.E., Desjardins, R.G., Rossnagel, B.G., Lagasse, S.L., Hatcher,
D.W., 2003. Roller milling of Canadian hull-less barley: optimization of rollermilling conditions and composition of mill stream. Cereal Chemistry 86, 637–644.
Jood, S., Kalra, S., 2001. Chemical composition and nutritional characteristics ofsome hull-less and hulled barley cultivars grown in India. Nahrung 45, 35–39.
Knuckle, B.E., Chiu, M.M., Betschart, A.A., 1992. b-Glucan enriched fractions fromlaboratory-scale dry milling and sieving of barley and oats. Cereal Chemistry 69,198–202.
Kruger, B.R., Knuston, C.A., Inglett, G.E., Walker, C.E., 1987. A differential scanningcalorimetry study on the effect of annealing on gelatinization behavior of cornstarch. Journal of Food Science 52, 715–718.
Lin, M.J.Y., Humbert, E.S., Sosulski, F.W., 1974. Certain functional properties ofsunflower meal products. Journal of Food Science 39, 368–370.
McWatters, K.H., 1983. Compositional, physical and sensory attributes of akaraprocessed from cowpea paste and Nigerian cowpea flour. Cereal Chemistry 60,333–336.
Oscarsson, M., Anderson, R., Salomonsson, A.C., Aman, P., 1996. Chemicalcomposition of barley sample focusing on dietary fiber component. Journal ofCereal Science 24, 161–170.
Phillips, R.D., Chinnan, M.S., Branch, A.L., McWatters, K.H., 1988. Effect ofpretreatment on functional and nutritional properties of cowpea meal.Journal of Food Science 53, 805–809.
Ragaee, S., Abdel, S.M., 2006. Pasting properties of starch and in selected cerealquality of their food products. Food Chemistry 95, 9–18.
Rogers, D.E., Hoseney, R.C., Lookhart, G.L., Curral, S.O., Lin, W.D.A., Sears, R.G., 1993.Milling and cookie baking quality of near-isogenic lines of wheat differing inkernel hardness. Cereal Chemistry 70, 181–189.
Saulnier, L., Gevaudan, S., Thibault, J.F., 1994. Extraction and partial characterizationof b-glucan from the endosperm of two barley cultivars. Journal of CerealScience 19, 171–178.
Singh, N., Singh, H., Kaur, K., Bakshi, M.S., 2000. Relationship between the degree ofmilling, ash distribution pattern and conductivity in brown rice. Food Chemistry69, 147–151.
Sosulski, F.W., 1962. The centrifuge method for determining flour absorption inhard red spring wheat. Cereal Chemistry 39, 344–350.
Symonas, L.J., Brennen, C.S., 2004. The effect of b-glucan fiber fraction onstarch gelatinization and pasting characteristics. Journal of Food Science 69,257–261.
Szczodark, J., Pomeranz, Y., 1992. Starch–lipid interaction and formation ofresistance starch in high amylose barley. Cereal Chemistry 69, 626–632.
Temelli, F., 1997. Extraction and functional properties of barley b-glucan as affectedby temperature and pH. Journal of Food Science 62, 1194–1201.
Zielinski, H., Kozlowska, H., 2000. Antioxidant activity and total phenolics inselected grains and their different morphological fractions. Journal ofAgriculture and Food Chemistry 48, 2008–2016.