Embed Size (px)
Citation preview
lable at ScienceDirect
Food Hydrocolloids 25 (2011) 983e990
Contents lists avai
Food Hydrocolloids
journal homepage: www.elsevier .com/locate/ foodhyd
Milk proteins differentiation and competitive adsorption during spray-drying
C. Gaiani a,*, M. Mullet b, E. Arab-Tehrany a, M. Jacquot a, C. Perroud a, A. Renard b, J. Scher a
a LIBio, Nancy Université, Laboratoire d’Ingénierie des Biomolécules, 2 avenue de la Forêt de Haye, B.P. 172, 54505 Vandoeuvre Lès Nancy Cedex, Franceb LCPME, Nancy Université, Laboratoire de Chimie Physique et de Microbiologie pour l’Environnement, UMR 7564 CNRS e Nancy Université, 405 rue de Vandoeuvre,54600 Villers Lès Nancy, France
a r t i c l e i n f o
Article history:Received 24 February 2010Accepted 27 September 2010
Keywords:CaseinWhey proteinsX-ray Photoelectron spectroscopySpray-dryingInterface
Abbreviations: NMC, native micellar casein; NWI,ray Photoelectron Spectroscopy; CLSM, Confocal Laseoutlet air temperature; P, phosphorus; Ca, calcium; S* Corresponding author. Tel.: þ33 (0) 383 59 58 78
E-mail address: [email protected]
0268-005X/$ e see front matter � 2010 Elsevier Ltd.doi:10.1016/j.foodhyd.2010.09.013
a b s t r a c t
A non invasive method was developed to differentiate native whey proteins (NWI) and native micellarcasein (NMC) at the surface of high protein milk powder. Surface analyses of the powders were per-formed by X-ray Photoelectron Spectroscopy (XPS). With this tool, it was impossible to differentiatecasein and whey proteins by their C1s, O1s and N1s signature; the atomic percentage being similar. But,minerals at the surface of these proteins were significantly different. As a consequence, a calibrationcurve was obtained with known mixes of both proteins and was used for their differentiation.
Competitive adsorption between casein and whey proteins during spray-drying was studied bya combination of different analytical methodologies (XPS, FTIR, zetasizer). The influence of the outlet airtemperature on dairy proteins competition at the surface of the particle was investigated. For thispurpose, three formulations were studied: 80/20, 50/50 and 20/80 (casein/whey proteins) and spray-dried at 80 and 130 �C (outlet air temperature). In formulations spray-dried at 80 �C, caseins were foundoverrepresented at the surface in comparison with the bulk composition. At 130 �C, the repartitionbetween caseins and whey proteins was mostly the same at the surface and in the bulk. It was concludedthat low outlet air temperatures allow the migration of surface-active components at the surface. As thespray-drying temperature increased, the surface may solidify and immobilize the proteins quickly, thesurface being closer to the bulk composition.
� 2010 Elsevier Ltd. All rights reserved.
1. Introduction
Milkproteins are important proteinswidely used as ingredient inthe food and dairy industries. Their functional characteristics andnutritionalqualitiesmake themvery interesting components (Bart&Schlimme, 1988). Milk proteins can be classified in two categoriesaccording to their structure: flexible proteins for caseins and glob-ular proteins for whey proteins (Dickinson, 2001). Caseins presenta disordered structure and include proteins a, b, k-casein, themixtures sodium caseinate, micellar casein.. Whey proteinscontain disulphide bridges, tertiary structure, and preserve theirglobular molecular shape even after adsorption on an interface.Therefore, their very different molecular structure had a strongimpact on their physicochemical and interfacial properties. Caseinsare prompt to adsorb at liquid/air interfaces,whereas,wheyproteinsare less surface-active due to their close-packed globular
native whey isolate; XPS, X-r Scanning Microscopy; Tout,, sulfur.; fax: þ33 (0) 383 59 58 04.(C. Gaiani).
All rights reserved.
organization (Fox & McSweeney, 1998). Moreover, whey proteinsshow important denaturation at temperatures above 70 �C,whereascaseins are not sensitive to temperature. As milk proteins are veryperishable products, there are often converted by spray-drying intostable products such as powders. Milk proteins are also spray-driedto reduce transport cost and/or to facilitate handling. Nowadays,milk protein powders have achieved great economic importanceand present a wide range of tailor-made applications.
During spray-drying, the liquid protein preparation is changedinto a powder by removing almost all of its water content. Theinfluence of the drying liquid composition on the powder surfacecomposition has been extensively studied by X-ray PhotoelectronSpectroscopy (XPS) (Fäldt & Bergenstahl, 1996a; Gaiani et al., 2006;Kim, 2008). All these authors show that the composition of thepowder surface is highly different from the bulk composition.Indeed, when a surface-active component is present in the dryingliquid (such as a protein, a phospholipid.) the powder surface wascovered by this component to a large extent (Gaiani, Scher et al.,2007; Kim, 2008). From these results, some authors suggested thatthe powder surface reflects the airewater interface of the dryingdroplet (Fäldt, 1995; Landström, Alsins, & Bergenstahl, 2000;Landström, Arnebrant, Alsins, & Bergenstahl, 2003). The spray-
C. Gaiani et al. / Food Hydrocolloids 25 (2011) 983e990984
drying process causes also a range of structural and physicochemicaltransformations which in turn may influences some functionalproperties of the powders: the wettability (Fäldt & Bergenstahl,1996b; Gaiani et al., 2009), caking (Nijdam & Langrish, 2006),flowability (Onwulata, Konstance, & Holsinger, 1996) or also oxida-tive stability (Hardas, Danviriyakul, Foley, Nawar, & Chinachoti,2000). When a mixture of surface-active components (proteins) ismixed, competitive adsorption is a common phenomenon. It hasbeen shown that caseins with a high surface activity and a flexibledisordered structure absorb and spread at the air interface quickly incomparison with a more compact and globular protein like wheyproteins (b-lactoglobulin). The adsorption process at the interfaceshas been suggested to include three main steps. The transport ofproteins toward the interface happened first, and then an attach-ment of the protein at the interface occurred. Finally, structuralrearrangements in the adsorbed statemay follow (Dickinson, 2001).This phenomenon is well documented and a rich amount of infor-mation is available in the field of emulsions (Dickinson, Murray, &Stainsby, 1988; McClements, 2004) and foams (Marinova et al.,2009; Zhang & Goff, 2004). Commonly, when it is adsorbing atairewater and oilewater interfaces, casein has been found to bemore competitive than aglobular protein (wheyproteins).However,it is complex to compare studies where the adsorption has reachedequilibrium (emulsion, foam.)with resultswhere the adsorption isinterrupted (during spray-drying) after a fraction of a second (Fäldt,1995). As a consequence, very little is known on competitive proteinadsorption in the drying droplet (Landström et al., 2003). Someauthors developed an original fluorescence quenching method todetermine the fraction of protein at the powder surface (Landström,Bergenstahl, Alsins, & Almgren,1999; Landström et al., 2000; 2003).Nevertheless, the surface properties of the proteinsmaybemodifiedby the quenching introducing a bias in the results.
The objectives of this paper are first to develop a non invasivemethod allowing the discrimination of caseins and whey proteins atthe powder surface. Then, the influence of the spray-drying temper-ature on powder surface composition was investigated by analyzingmixes containing different ratios of casein and whey proteins.Concurrently, some physicochemical properties of the powders weredetermined in order to a better understanding of the mechanismsbetweencaseinandwheyproteins competitionat thepowder surface.
2. Experimental
2.1. Materials
Native micellar casein powder (NMC) was purchased to Ingredia(Arras, France). Native whey isolate powder (NWI e Prolacta 90)was provided by Lactalis (Laval, France). NMC was obtained fromtangential membrane microfiltration of skimmed milk followed bypurification through water diafiltration. NWI was obtained bymembrane tangential ultrafiltration and diafiltration of micro-filtrate collected during NMC production. Both powders arecommercial products, freshly manufactured and packed.
In order to get the calibration curve, nine blends were preparedby gently dry-mixing NMC and NWI powders: 100/0, 20/80, 30/70,40/60, 50/50, 60/40, 70/30, 80/20 and 0/100 (NMC/NWI, w/w). Thehomogeneity of the blends was verified by casein and wheyproteins content by Kjeldahl analyses (data not shown).
2.2. Laboratory-scale production of powders
NMC and NWI powders were first rehydrated to a solid contentof 15% (w/w) the day before spray-drying and were left understirring overnight (20 �C) in order to totally rehydrate each protein.Sodium azide (0.2% w/v) was also added the day before to avoid
microbial development. Three blends were then prepared bycombining NMC and NWI dispersions: 80/20, 50/50 and 20/80(NMC/NWI). Finally, each blend was spray-dried using a Mini SprayDrier Buchi B290 (Buchi SARL, Rungis, France) at the followingoutlet air temperatures (Tout): 80 and 130 �C.
2.3. Physicochemical analyses of the powders
2.3.1. Chemical analysesThe water content of powders was determined by weight loss
after drying 1 g of powder at 105 �C for 5 h. The total nitrogen (TN),the soluble nitrogen at pH¼ 4.6 (non casein nitrogen, NCN) and the12% TCA soluble nitrogen (NPN) were determined by Kjeldahl.Casein and whey protein contents were determined as follows:(TN � NCN) � 6.38 and (NCN � NPN) � 6.38, respectively. Lactosecontent was measured with an enzymatic method using an EnzytecLactose/D-Galactose kit. Lipids were determined according to theFolch method. Ashes were calculated after incineration at 550 �Cduring 5 h. All the experiments were done in triplicate.
2.3.2. Wetting propertiesThe wetting properties of powders were determined by static
wetting as described by the International Dairy Federation methodwith some modification (due to the limited quantities of powders).The powder (1 g) was poured into 10 mLwater. The time in secondsrequired for all the particles to be submersed is recorded and called“the wetting time”. Each wetting measurement was performed intriplicate.
2.3.3. SizeA Nanosizer ZS (HPPS 5001, Malvern Instrument, England) was
used to follow the evolution of the hydrodynamic diameter (alsocalled “z-averaged” diameter) of the rehydrated powders at 5% (w/v). Eachmeasurement was performed in triplicate. The apparatus isequipped with a 4 mW He/Ne laser emitting 633 nm, a measure-ment cell, a photomultiplier and a correlator. The samples wereplaced in vertical cylindrical cells (10 mm diameter) for sizemeasurements. Scattering intensity was measured at a scatteringangle of 173� relative to the source using an avalanche of photo-diode detector. This setup allows considerable reduction of thesignal due to multiple scattering events and enables working inslightly turbid media. Intensity autocorrelation functions wereanalyzed by a CONTIN algorithm (integrated in the Malvern Zeta-sizer software) to determine the distribution of translational z-averaged diffusion coefficient of the particles, DT (m2 s�1). The DTparameter is related to the hydrodynamic radius (Rh) of particlesthrough the StokeseEinstein relationship (1):
DT ¼ kBT=6pmRh (1)
where m is the solvent viscosity (Pa s), kB is the Boltzmann constant,T is the absolute temperature (K) and Rh is the equivalent hydro-dynamic radius of sphere having the same diffusion coefficient asthe particles (nm).
2.3.4. Surface tension measurementsThe surface tension of the solutions (rehydrated powders at 5%
(w/v)) was measured with a Krüss tensiometer (model K12, KrüssGmbh, Hamburg, Germany), which uses the Wilhelmy plate(width¼ 19.900mm; thickness¼ 0.200mm)method. The accuracyof this tensiometer was �0.1 mN m�1. The temperature was keptconstant to an accuracy of �0.1 �C. The tensiometer was calibratedwith dezionised water before each measurement and the platecleaned with acetone, air-dried and flamed between each sampletrial. The measurements were repeated four times.
C. Gaiani et al. / Food Hydrocolloids 25 (2011) 983e990 985
2.4. XPS analyses
2.4.1. EquipmentThe XPS analyses were performed with a Kratos Axis Ultra
spectrometer (Kratos Analytical, Manchester, UK) using a mono-chromatic AlKa source. The powder samples were spread to thesample holder using a double side conductive adhesive tape andthen degassed overnight prior analyses. The power applied to theX-ray anode was reduced to 90 W in order to avoid the X-rayinduced degradation of the sample. All spectra were recorded at90� take-off angle and the analyzed area was about 700 � 300 mm.Survey spectra were recorded with 1.0 eV step and 160 eV analyzerpass energy. The high resolution regions were analyzed with0.05 eV step (for C1s) or 0.1 eV step (for other elements) and 20 eVpass energy. In both cases, the hybrid lens mode was employed.During the data acquisition the Kratos charge neutralizer systemwas used on all specimens with the following settings: filamentcurrent 2 A, charge balance 3.5 V, filament bias 1.0 V and magneticlens trim coil 0.34 A. The C-(C,H) carbon was set to 284.60 eV andtherefore used as an internal energy reference.
2.4.2. Data treatmentSpectra were analyzed using the Vision software from Kratos
(Vision 2.2.2). A Shirley baseline was used for the subtraction of thebackground. Quantification was performed using the photoemis-sion cross sections and the transmission coefficients given in theVision package.
2.5. FTIR
2.5.1. EquipmentProteins denaturation and aggregation during spray-drying was
evaluated by FTIR in Total Attenuated Reflection mode (ATR) onrehydrated powders (5%, w/v). A Tensor 27 mid-FTIR Bruker spec-trometer (Bruker, Karlsruhe, Germany) was equipped with an ATRcell and an MCT (MercuryecadmiumeTelluride) detector cooledwith liquid N2. Scanning rate was 20 kHz and 256 scans were usedfor both reference and sample between 4000 and 850 cm�1 at2 cm�1 resolution.
2.5.2. ExperimentsReference was first recorded at 25 �C on dezionised water. Then,
2mL of the rehydrated dispersionwas put on the ZnSe crystal of theoptical cell and left 5 min at 25 �C allowing for proteins adsorptiononto the crystal. This considerably ameliorates the signal to noiseratio of FTIR spectra.
2.5.3. Data treatmentsAll treatments were carried out using OPUS software (Bruker,
Karlsruhe, Germany). Raw absorbance spectra were smoothedusing a 9 points SavitskyeGolay smoothing function to reduce the
Table 1Chemical composition of the powders obtained after spray-drying at 80 and 130 �C (me
Theoretical NMC/NWI protein ratio 80/20 ¼ 4.00
Outlet air temperature (�C) 80 130
COMPOSITION Casein 72.5 � 1.1 73.1 � 1.0Whey 17.1 � 0.6 17.7 � 0.5Lactose 0.2 � 0.0 0.1 � 0.0Ashes 6.7 � 0.2 6.4 � 0.4Lipids Traces TracesMoisture 3.5 � 0.0 2.7 � 0.1
Experimental NMC/NWI protein ratio 4.23 4.12
NMC: native micellar casein; NWI: native whey isolate.
white noise and cut between 1720 and 1580 cm�1. Elastic baselinecorrection using 200 points was applied to spectra. Spectra werethen centered and normalized using OPUS software. After that,second derivative spectra were calculated on centered andnormalized spectra with an additional 9 points SavitskyeGolaysmoothing function.
2.6. Statistical analyses
Statistical analyses were carried out by using the softwareKyPlot version 2.0. For comparison between casein/whey proteinsurfaces a parametric multiple test (pairwise) was performed. Thesignificance level was: ***P < 0.001, **P < 0.01, *P < 0.05 and NSP >
0.05.
3. Results and discussion
3.1. Characterization of the powders
Table 1 presents the chemical composition of the six powdersstudied. All the powders are high proteins content with more orless casein and/or whey proteins depending on the protein ratiostudied. The experimental ratio (4.17, 1.01 and 0.26) agreedreasonably well with the theoretical ratio (4.00, 1.00 and 0.25)obtained from the different mixes realized respectively for 80/20,50/50 and 20/80 (NMC/NWI). Lactose and lipids traces were foundin all powders as already noticed by Gaiani et al. (2010) for 80/20(NMC/NWI) powders. As expected, ashes were systematicallyhigher for casein containing powders which are rich in minerals(Ca, P) originated from the colloidal fraction. The moisture contentwas influenced by the outlet air temperature. Humidity was foundaround 3% for powders spray-dried at 80 �C and was slightly lowerfor powders spray-dried at 130 �C (around 2.7%).
3.2. Physicochemical characterization of the rehydrated powders
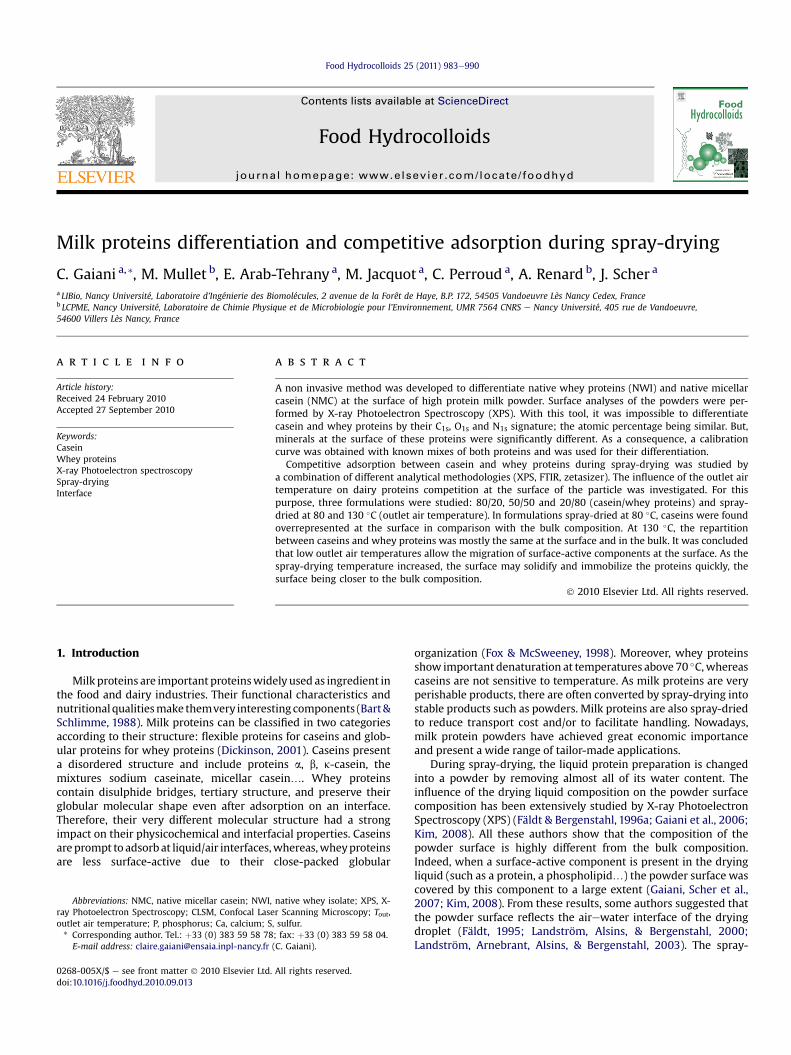
Powders were rehydrated at 5% (w/v) in order to performedFTIR, size and surface tension measurements. The influence of thespray-drying outlet air temperature on proteins denaturation andaggregationwas investigated by FTIR (Fig. 1). Significant differenceswere observed for subset of samples with different formulations.Infrared spectra obtained for powders containing the highest ratioin whey proteins (red curves) displayed a broad band centered on1628 cm�1 which is typical of predominantly b-sheet proteins (Qiet al., 1997). The presence of the shoulders at 1618 and1675 cm�1 may be attributed to aggregated structures morepronounced for powders presenting a high percentage of wheyproteins. On the contrary, powders with high ratio in casein (greencurves) were characterized by slightly more unordered structures(1645 cm�1) and less b-sheet structures. As expected, an interme-diate curve was found for samples containing 50% of each protein
an of three analyses).
50/50 ¼ 1.00 20/80 ¼ 0.25
80 130 80 130
46.3 � 0.9 46.7 � 0.6 19.1 � 0.6 19.9 � 0.545.9 � 0.3 45.9 � 0.6 74.8 � 1.1 73.7 � 1.40.1 � 0.1 0.1 � 0.1 0.1 � 0.0 0.2 � 0.14.4 � 0.3 4.3 � 0.3 2.8 � 0.1 3.3 � 0.20.2 � 0.0 0.2 � 0.0 0.3 � 0.1 0.4 � 0.13.1 � 0.2 2.8 � 0.0 2.9 � 0.1 2.5 � 0.3
1.00 1.02 0.25 0.27
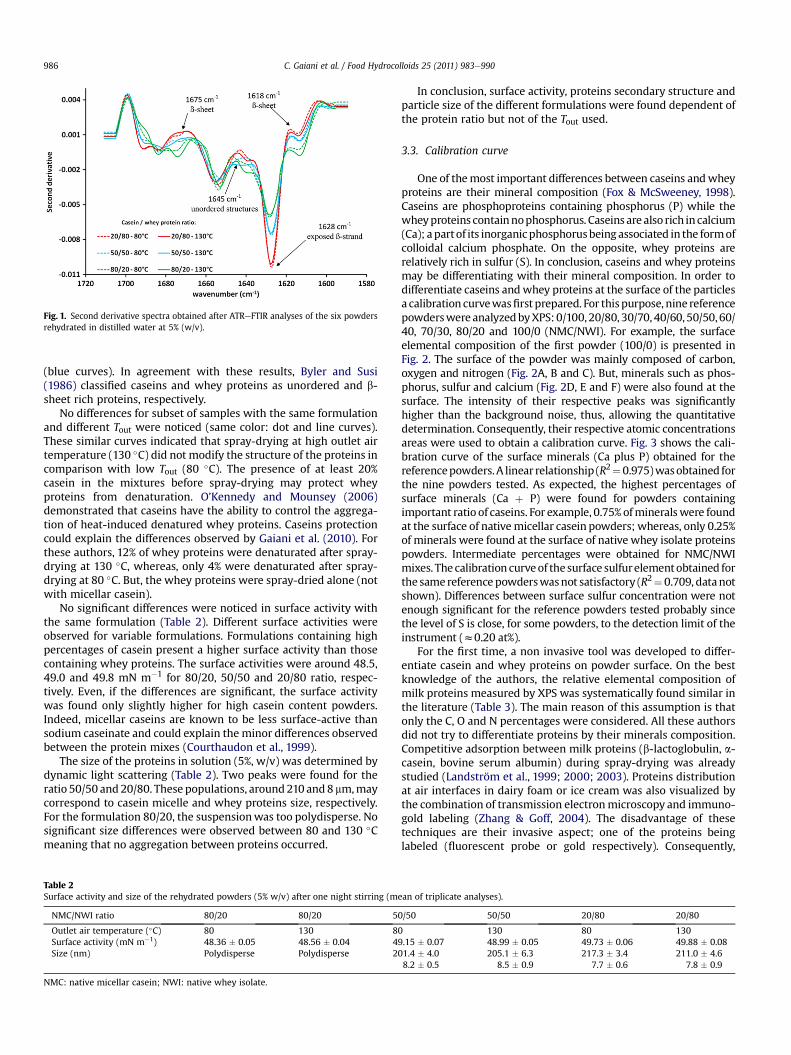
Fig. 1. Second derivative spectra obtained after ATReFTIR analyses of the six powdersrehydrated in distilled water at 5% (w/v).
C. Gaiani et al. / Food Hydrocolloids 25 (2011) 983e990986
(blue curves). In agreement with these results, Byler and Susi(1986) classified caseins and whey proteins as unordered and b-sheet rich proteins, respectively.
No differences for subset of samples with the same formulationand different Tout were noticed (same color: dot and line curves).These similar curves indicated that spray-drying at high outlet airtemperature (130 �C) did not modify the structure of the proteins incomparison with low Tout (80 �C). The presence of at least 20%casein in the mixtures before spray-drying may protect wheyproteins from denaturation. O’Kennedy and Mounsey (2006)demonstrated that caseins have the ability to control the aggrega-tion of heat-induced denatured whey proteins. Caseins protectioncould explain the differences observed by Gaiani et al. (2010). Forthese authors, 12% of whey proteins were denaturated after spray-drying at 130 �C, whereas, only 4% were denaturated after spray-drying at 80 �C. But, the whey proteins were spray-dried alone (notwith micellar casein).
No significant differences were noticed in surface activity withthe same formulation (Table 2). Different surface activities wereobserved for variable formulations. Formulations containing highpercentages of casein present a higher surface activity than thosecontaining whey proteins. The surface activities were around 48.5,49.0 and 49.8 mN m�1 for 80/20, 50/50 and 20/80 ratio, respec-tively. Even, if the differences are significant, the surface activitywas found only slightly higher for high casein content powders.Indeed, micellar caseins are known to be less surface-active thansodium caseinate and could explain the minor differences observedbetween the protein mixes (Courthaudon et al., 1999).
The size of the proteins in solution (5%, w/v) was determined bydynamic light scattering (Table 2). Two peaks were found for theratio 50/50 and 20/80. These populations, around210 and 8 mm,maycorrespond to casein micelle and whey proteins size, respectively.For the formulation 80/20, the suspensionwas too polydisperse. Nosignificant size differences were observed between 80 and 130 �Cmeaning that no aggregation between proteins occurred.
Table 2Surface activity and size of the rehydrated powders (5% w/v) after one night stirring (m
NMC/NWI ratio 80/20 80/20 5
Outlet air temperature (�C) 80 130 8Surface activity (mN m�1) 48.36 � 0.05 48.56 � 0.04 4Size (nm) Polydisperse Polydisperse 2
NMC: native micellar casein; NWI: native whey isolate.
In conclusion, surface activity, proteins secondary structure andparticle size of the different formulations were found dependent ofthe protein ratio but not of the Tout used.
3.3. Calibration curve
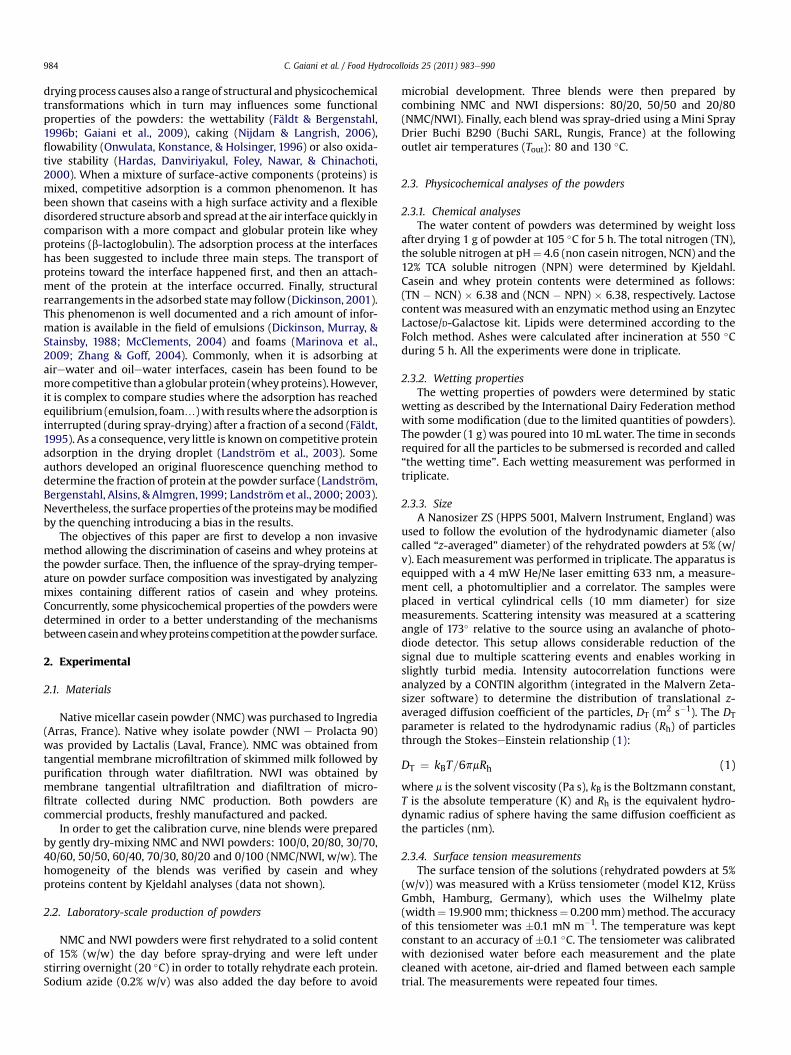
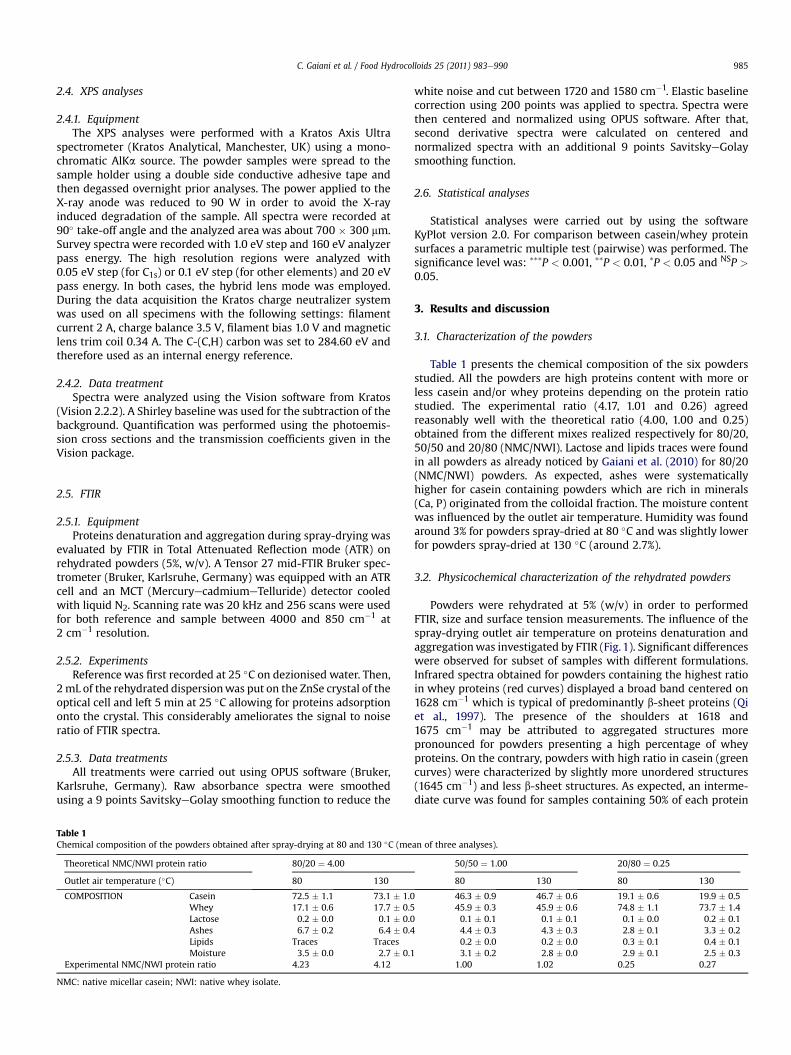
One of themost important differences between caseins andwheyproteins are their mineral composition (Fox & McSweeney, 1998).Caseins are phosphoproteins containing phosphorus (P) while thewheyproteins containnophosphorus. Caseins are also rich incalcium(Ca); apartof its inorganicphosphorusbeing associated in the formofcolloidal calcium phosphate. On the opposite, whey proteins arerelatively rich in sulfur (S). In conclusion, caseins and whey proteinsmay be differentiating with their mineral composition. In order todifferentiate caseins andwhey proteins at the surface of the particlesa calibration curvewasfirst prepared. For thispurpose, nine referencepowderswereanalyzedbyXPS:0/100,20/80, 30/70, 40/60,50/50,60/40, 70/30, 80/20 and 100/0 (NMC/NWI). For example, the surfaceelemental composition of the first powder (100/0) is presented inFig. 2. The surface of the powder was mainly composed of carbon,oxygen and nitrogen (Fig. 2A, B and C). But, minerals such as phos-phorus, sulfur and calcium (Fig. 2D, E and F) were also found at thesurface. The intensity of their respective peaks was significantlyhigher than the background noise, thus, allowing the quantitativedetermination. Consequently, their respective atomic concentrationsareas were used to obtain a calibration curve. Fig. 3 shows the cali-bration curve of the surface minerals (Ca plus P) obtained for thereferencepowders.A linear relationship (R2¼0.975)wasobtained forthe nine powders tested. As expected, the highest percentages ofsurface minerals (Ca þ P) were found for powders containingimportant ratio of caseins. For example, 0.75% ofmineralswere foundat the surface of nativemicellar casein powders; whereas, only 0.25%of minerals were found at the surface of native whey isolate proteinspowders. Intermediate percentages were obtained for NMC/NWImixes. The calibration curveof thesurface sulfurelementobtained forthe samereferencepowderswasnot satisfactory (R2¼0.709, datanotshown). Differences between surface sulfur concentration were notenough significant for the reference powders tested probably sincethe level of S is close, for some powders, to the detection limit of theinstrument (z0.20 at%).
For the first time, a non invasive tool was developed to differ-entiate casein and whey proteins on powder surface. On the bestknowledge of the authors, the relative elemental composition ofmilk proteins measured by XPS was systematically found similar inthe literature (Table 3). The main reason of this assumption is thatonly the C, O and N percentages were considered. All these authorsdid not try to differentiate proteins by their minerals composition.Competitive adsorption between milk proteins (b-lactoglobulin, a-casein, bovine serum albumin) during spray-drying was alreadystudied (Landström et al., 1999; 2000; 2003). Proteins distributionat air interfaces in dairy foam or ice cream was also visualized bythe combination of transmission electronmicroscopy and immuno-gold labeling (Zhang & Goff, 2004). The disadvantage of thesetechniques are their invasive aspect; one of the proteins beinglabeled (fluorescent probe or gold respectively). Consequently,
ean of triplicate analyses).
0/50 50/50 20/80 20/80
0 130 80 1309.15 � 0.07 48.99 � 0.05 49.73 � 0.06 49.88 � 0.0801.4 � 4.0 205.1 � 6.3 217.3 � 3.4 211.0 � 4.68.2 � 0.5 8.5 � 0.9 7.7 � 0.6 7.8 � 0.9
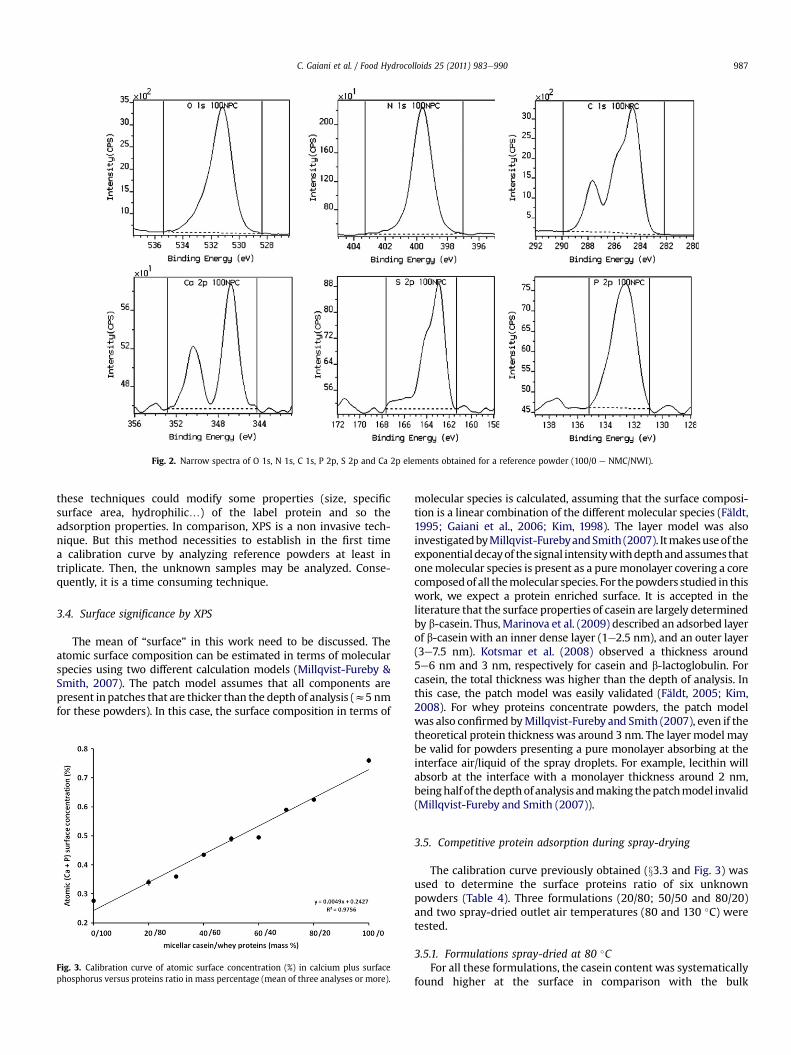
Fig. 2. Narrow spectra of O 1s, N 1s, C 1s, P 2p, S 2p and Ca 2p elements obtained for a reference powder (100/0 e NMC/NWI).
C. Gaiani et al. / Food Hydrocolloids 25 (2011) 983e990 987
these techniques could modify some properties (size, specificsurface area, hydrophilic.) of the label protein and so theadsorption properties. In comparison, XPS is a non invasive tech-nique. But this method necessities to establish in the first timea calibration curve by analyzing reference powders at least intriplicate. Then, the unknown samples may be analyzed. Conse-quently, it is a time consuming technique.
3.4. Surface significance by XPS
The mean of “surface” in this work need to be discussed. Theatomic surface composition can be estimated in terms of molecularspecies using two different calculation models (Millqvist-Fureby &Smith, 2007). The patch model assumes that all components arepresent inpatches that are thicker than the depth of analysis (z5 nmfor these powders). In this case, the surface composition in terms of
Fig. 3. Calibration curve of atomic surface concentration (%) in calcium plus surfacephosphorus versus proteins ratio in mass percentage (mean of three analyses or more).
molecular species is calculated, assuming that the surface composi-tion is a linear combination of the different molecular species (Fäldt,1995; Gaiani et al., 2006; Kim, 1998). The layer model was alsoinvestigatedbyMillqvist-FurebyandSmith (2007). Itmakesuseof theexponentialdecayof the signal intensitywithdepthandassumes thatonemolecular species is present as a puremonolayer covering a corecomposedof all themolecular species. For thepowders studied in thiswork, we expect a protein enriched surface. It is accepted in theliterature that the surface properties of casein are largely determinedby b-casein. Thus, Marinova et al. (2009) described an adsorbed layerof b-casein with an inner dense layer (1e2.5 nm), and an outer layer(3e7.5 nm). Kotsmar et al. (2008) observed a thickness around5e6 nm and 3 nm, respectively for casein and b-lactoglobulin. Forcasein, the total thickness was higher than the depth of analysis. Inthis case, the patch model was easily validated (Fäldt, 2005; Kim,2008). For whey proteins concentrate powders, the patch modelwas also confirmed byMillqvist-Fureby and Smith (2007), even if thetheoretical protein thickness was around 3 nm. The layer model maybe valid for powders presenting a pure monolayer absorbing at theinterface air/liquid of the spray droplets. For example, lecithin willabsorb at the interface with a monolayer thickness around 2 nm,beinghalfof thedepthof analysis andmaking thepatchmodel invalid(Millqvist-Fureby and Smith (2007)).
3.5. Competitive protein adsorption during spray-drying
The calibration curve previously obtained (x3.3 and Fig. 3) wasused to determine the surface proteins ratio of six unknownpowders (Table 4). Three formulations (20/80; 50/50 and 80/20)and two spray-dried outlet air temperatures (80 and 130 �C) weretested.
3.5.1. Formulations spray-dried at 80 �CFor all these formulations, the casein content was systematically
found higher at the surface in comparison with the bulk
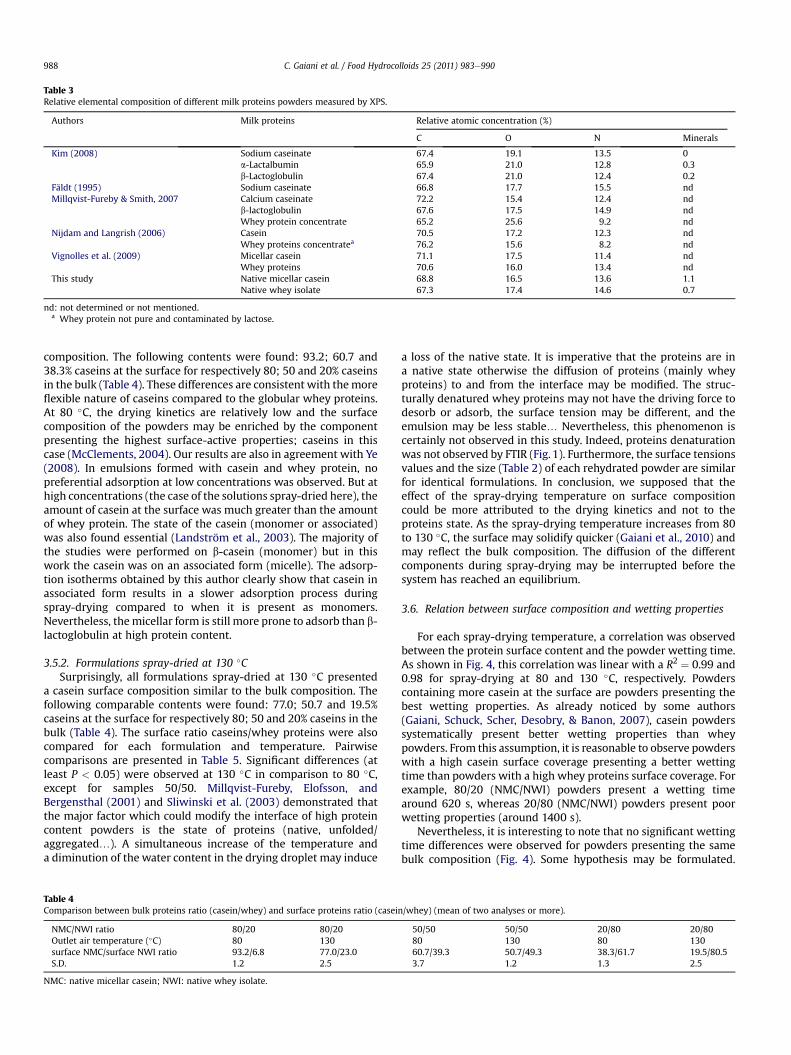
Table 3Relative elemental composition of different milk proteins powders measured by XPS.
Authors Milk proteins Relative atomic concentration (%)
C O N Minerals
Kim (2008) Sodium caseinate 67.4 19.1 13.5 0a-Lactalbumin 65.9 21.0 12.8 0.3b-Lactoglobulin 67.4 21.0 12.4 0.2
Fäldt (1995) Sodium caseinate 66.8 17.7 15.5 ndMillqvist-Fureby & Smith, 2007 Calcium caseinate 72.2 15.4 12.4 nd
b-lactoglobulin 67.6 17.5 14.9 ndWhey protein concentrate 65.2 25.6 9.2 nd
Nijdam and Langrish (2006) Casein 70.5 17.2 12.3 ndWhey proteins concentratea 76.2 15.6 8.2 nd
Vignolles et al. (2009) Micellar casein 71.1 17.5 11.4 ndWhey proteins 70.6 16.0 13.4 nd
This study Native micellar casein 68.8 16.5 13.6 1.1Native whey isolate 67.3 17.4 14.6 0.7
nd: not determined or not mentioned.a Whey protein not pure and contaminated by lactose.
C. Gaiani et al. / Food Hydrocolloids 25 (2011) 983e990988
composition. The following contents were found: 93.2; 60.7 and38.3% caseins at the surface for respectively 80; 50 and 20% caseinsin the bulk (Table 4). These differences are consistent with themoreflexible nature of caseins compared to the globular whey proteins.At 80 �C, the drying kinetics are relatively low and the surfacecomposition of the powders may be enriched by the componentpresenting the highest surface-active properties; caseins in thiscase (McClements, 2004). Our results are also in agreement with Ye(2008). In emulsions formed with casein and whey protein, nopreferential adsorption at low concentrations was observed. But athigh concentrations (the case of the solutions spray-dried here), theamount of casein at the surface was much greater than the amountof whey protein. The state of the casein (monomer or associated)was also found essential (Landström et al., 2003). The majority ofthe studies were performed on b-casein (monomer) but in thiswork the casein was on an associated form (micelle). The adsorp-tion isotherms obtained by this author clearly show that casein inassociated form results in a slower adsorption process duringspray-drying compared to when it is present as monomers.Nevertheless, themicellar form is still more prone to adsorb than b-lactoglobulin at high protein content.
3.5.2. Formulations spray-dried at 130 �CSurprisingly, all formulations spray-dried at 130 �C presented
a casein surface composition similar to the bulk composition. Thefollowing comparable contents were found: 77.0; 50.7 and 19.5%caseins at the surface for respectively 80; 50 and 20% caseins in thebulk (Table 4). The surface ratio caseins/whey proteins were alsocompared for each formulation and temperature. Pairwisecomparisons are presented in Table 5. Significant differences (atleast P < 0.05) were observed at 130 �C in comparison to 80 �C,except for samples 50/50. Millqvist-Fureby, Elofsson, andBergensthal (2001) and Sliwinski et al. (2003) demonstrated thatthe major factor which could modify the interface of high proteincontent powders is the state of proteins (native, unfolded/aggregated.). A simultaneous increase of the temperature anda diminution of the water content in the drying droplet may induce
Table 4Comparison between bulk proteins ratio (casein/whey) and surface proteins ratio (casein
NMC/NWI ratio 80/20 80/20Outlet air temperature (�C) 80 130surface NMC/surface NWI ratio 93.2/6.8 77.0/23.0S.D. 1.2 2.5
NMC: native micellar casein; NWI: native whey isolate.
a loss of the native state. It is imperative that the proteins are ina native state otherwise the diffusion of proteins (mainly wheyproteins) to and from the interface may be modified. The struc-turally denatured whey proteins may not have the driving force todesorb or adsorb, the surface tension may be different, and theemulsion may be less stable. Nevertheless, this phenomenon iscertainly not observed in this study. Indeed, proteins denaturationwas not observed by FTIR (Fig. 1). Furthermore, the surface tensionsvalues and the size (Table 2) of each rehydrated powder are similarfor identical formulations. In conclusion, we supposed that theeffect of the spray-drying temperature on surface compositioncould be more attributed to the drying kinetics and not to theproteins state. As the spray-drying temperature increases from 80to 130 �C, the surface may solidify quicker (Gaiani et al., 2010) andmay reflect the bulk composition. The diffusion of the differentcomponents during spray-drying may be interrupted before thesystem has reached an equilibrium.
3.6. Relation between surface composition and wetting properties
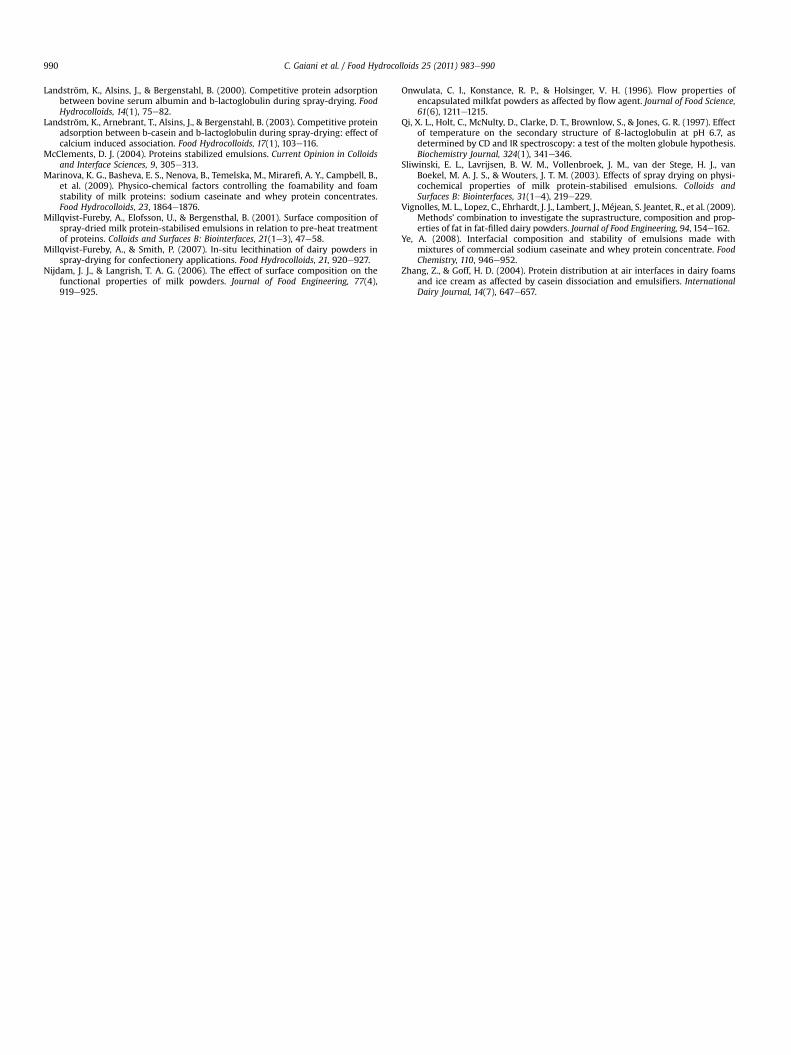
For each spray-drying temperature, a correlation was observedbetween the protein surface content and the powder wetting time.As shown in Fig. 4, this correlation was linear with a R2 ¼ 0.99 and0.98 for spray-drying at 80 and 130 �C, respectively. Powderscontaining more casein at the surface are powders presenting thebest wetting properties. As already noticed by some authors(Gaiani, Schuck, Scher, Desobry, & Banon, 2007), casein powderssystematically present better wetting properties than wheypowders. From this assumption, it is reasonable to observe powderswith a high casein surface coverage presenting a better wettingtime than powders with a high whey proteins surface coverage. Forexample, 80/20 (NMC/NWI) powders present a wetting timearound 620 s, whereas 20/80 (NMC/NWI) powders present poorwetting properties (around 1400 s).
Nevertheless, it is interesting to note that no significant wettingtime differences were observed for powders presenting the samebulk composition (Fig. 4). Some hypothesis may be formulated.
/whey) (mean of two analyses or more).
50/50 50/50 20/80 20/8080 130 80 13060.7/39.3 50.7/49.3 38.3/61.7 19.5/80.53.7 1.2 1.3 2.5
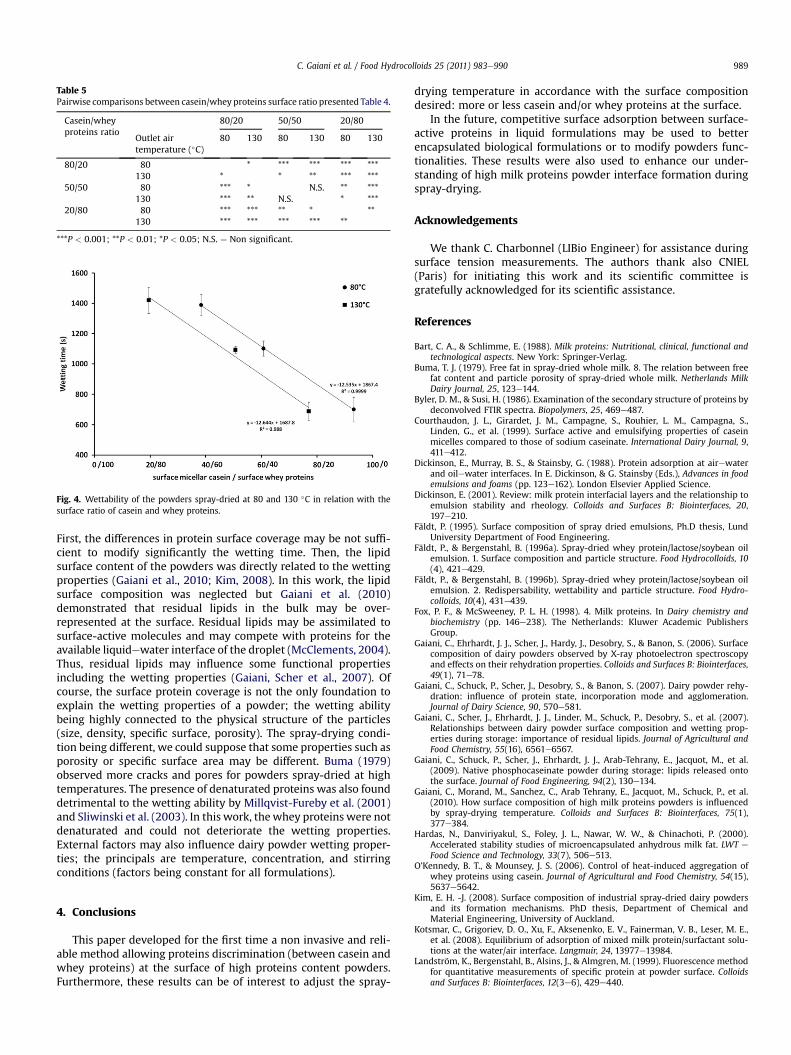
Fig. 4. Wettability of the powders spray-dried at 80 and 130 �C in relation with thesurface ratio of casein and whey proteins.
Table 5Pairwise comparisons between casein/whey proteins surface ratio presented Table 4.
Casein/wheyproteins ratio
80/20 50/50 20/80
Outlet airtemperature (�C)
80 130 80 130 80 130
80/20 80 * *** *** *** ***130 * * ** *** ***
50/50 80 *** * N.S. ** ***130 *** ** N.S. * ***
20/80 80 *** *** ** * **130 *** *** *** *** **
***P < 0.001; **P < 0.01; *P < 0.05; N.S. ¼ Non significant.
C. Gaiani et al. / Food Hydrocolloids 25 (2011) 983e990 989
First, the differences in protein surface coverage may be not suffi-cient to modify significantly the wetting time. Then, the lipidsurface content of the powders was directly related to the wettingproperties (Gaiani et al., 2010; Kim, 2008). In this work, the lipidsurface composition was neglected but Gaiani et al. (2010)demonstrated that residual lipids in the bulk may be over-represented at the surface. Residual lipids may be assimilated tosurface-active molecules and may compete with proteins for theavailable liquidewater interface of the droplet (McClements, 2004).Thus, residual lipids may influence some functional propertiesincluding the wetting properties (Gaiani, Scher et al., 2007). Ofcourse, the surface protein coverage is not the only foundation toexplain the wetting properties of a powder; the wetting abilitybeing highly connected to the physical structure of the particles(size, density, specific surface, porosity). The spray-drying condi-tion being different, we could suppose that some properties such asporosity or specific surface area may be different. Buma (1979)observed more cracks and pores for powders spray-dried at hightemperatures. The presence of denaturated proteins was also founddetrimental to the wetting ability by Millqvist-Fureby et al. (2001)and Sliwinski et al. (2003). In this work, thewhey proteins were notdenaturated and could not deteriorate the wetting properties.External factors may also influence dairy powder wetting proper-ties; the principals are temperature, concentration, and stirringconditions (factors being constant for all formulations).
4. Conclusions
This paper developed for the first time a non invasive and reli-able method allowing proteins discrimination (between casein andwhey proteins) at the surface of high proteins content powders.Furthermore, these results can be of interest to adjust the spray-
drying temperature in accordance with the surface compositiondesired: more or less casein and/or whey proteins at the surface.
In the future, competitive surface adsorption between surface-active proteins in liquid formulations may be used to betterencapsulated biological formulations or to modify powders func-tionalities. These results were also used to enhance our under-standing of high milk proteins powder interface formation duringspray-drying.
Acknowledgements
We thank C. Charbonnel (LIBio Engineer) for assistance duringsurface tension measurements. The authors thank also CNIEL(Paris) for initiating this work and its scientific committee isgratefully acknowledged for its scientific assistance.
References
Bart, C. A., & Schlimme, E. (1988). Milk proteins: Nutritional, clinical, functional andtechnological aspects. New York: Springer-Verlag.
Buma, T. J. (1979). Free fat in spray-dried whole milk. 8. The relation between freefat content and particle porosity of spray-dried whole milk. Netherlands MilkDairy Journal, 25, 123e144.
Byler, D. M., & Susi, H. (1986). Examination of the secondary structure of proteins bydeconvolved FTIR spectra. Biopolymers, 25, 469e487.
Courthaudon, J. L., Girardet, J. M., Campagne, S., Rouhier, L. M., Campagna, S.,Linden, G., et al. (1999). Surface active and emulsifying properties of caseinmicelles compared to those of sodium caseinate. International Dairy Journal, 9,411e412.
Dickinson, E., Murray, B. S., & Stainsby, G. (1988). Protein adsorption at airewaterand oilewater interfaces. In E. Dickinson, & G. Stainsby (Eds.), Advances in foodemulsions and foams (pp. 123e162). London Elsevier Applied Science.
Dickinson, E. (2001). Review: milk protein interfacial layers and the relationship toemulsion stability and rheology. Colloids and Surfaces B: Biointerfaces, 20,197e210.
Fäldt, P. (1995). Surface composition of spray dried emulsions, Ph.D thesis, LundUniversity Department of Food Engineering.
Fäldt, P., & Bergenstahl, B. (1996a). Spray-dried whey protein/lactose/soybean oilemulsion. 1. Surface composition and particle structure. Food Hydrocolloids, 10(4), 421e429.
Fäldt, P., & Bergenstahl, B. (1996b). Spray-dried whey protein/lactose/soybean oilemulsion. 2. Redispersability, wettability and particle structure. Food Hydro-colloids, 10(4), 431e439.
Fox, P. F., & McSweeney, P. L. H. (1998). 4. Milk proteins. In Dairy chemistry andbiochemistry (pp. 146e238). The Netherlands: Kluwer Academic PublishersGroup.
Gaiani, C., Ehrhardt, J. J., Scher, J., Hardy, J., Desobry, S., & Banon, S. (2006). Surfacecomposition of dairy powders observed by X-ray photoelectron spectroscopyand effects on their rehydration properties. Colloids and Surfaces B: Biointerfaces,49(1), 71e78.
Gaiani, C., Schuck, P., Scher, J., Desobry, S., & Banon, S. (2007). Dairy powder rehy-dration: influence of protein state, incorporation mode and agglomeration.Journal of Dairy Science, 90, 570e581.
Gaiani, C., Scher, J., Ehrhardt, J. J., Linder, M., Schuck, P., Desobry, S., et al. (2007).Relationships between dairy powder surface composition and wetting prop-erties during storage: importance of residual lipids. Journal of Agricultural andFood Chemistry, 55(16), 6561e6567.
Gaiani, C., Schuck, P., Scher, J., Ehrhardt, J. J., Arab-Tehrany, E., Jacquot, M., et al.(2009). Native phosphocaseinate powder during storage: lipids released ontothe surface. Journal of Food Engineering, 94(2), 130e134.
Gaiani, C., Morand, M., Sanchez, C., Arab Tehrany, E., Jacquot, M., Schuck, P., et al.(2010). How surface composition of high milk proteins powders is influencedby spray-drying temperature. Colloids and Surfaces B: Biointerfaces, 75(1),377e384.
Hardas, N., Danviriyakul, S., Foley, J. L., Nawar, W. W., & Chinachoti, P. (2000).Accelerated stability studies of microencapsulated anhydrous milk fat. LWT e
Food Science and Technology, 33(7), 506e513.O’Kennedy, B. T., & Mounsey, J. S. (2006). Control of heat-induced aggregation of
whey proteins using casein. Journal of Agricultural and Food Chemistry, 54(15),5637e5642.
Kim, E. H. -J. (2008). Surface composition of industrial spray-dried dairy powdersand its formation mechanisms. PhD thesis, Department of Chemical andMaterial Engineering, University of Auckland.
Kotsmar, C., Grigoriev, D. O., Xu, F., Aksenenko, E. V., Fainerman, V. B., Leser, M. E.,et al. (2008). Equilibrium of adsorption of mixed milk protein/surfactant solu-tions at the water/air interface. Langmuir, 24, 13977e13984.
Landström, K., Bergenstahl, B., Alsins, J., & Almgren, M. (1999). Fluorescence methodfor quantitative measurements of specific protein at powder surface. Colloidsand Surfaces B: Biointerfaces, 12(3e6), 429e440.
C. Gaiani et al. / Food Hydrocolloids 25 (2011) 983e990990
Landström, K., Alsins, J., & Bergenstahl, B. (2000). Competitive protein adsorptionbetween bovine serum albumin and b-lactoglobulin during spray-drying. FoodHydrocolloids, 14(1), 75e82.
Landström, K., Arnebrant, T., Alsins, J., & Bergenstahl, B. (2003). Competitive proteinadsorption between b-casein and b-lactoglobulin during spray-drying: effect ofcalcium induced association. Food Hydrocolloids, 17(1), 103e116.
McClements, D. J. (2004). Proteins stabilized emulsions. Current Opinion in Colloidsand Interface Sciences, 9, 305e313.
Marinova, K. G., Basheva, E. S., Nenova, B., Temelska, M., Mirarefi, A. Y., Campbell, B.,et al. (2009). Physico-chemical factors controlling the foamability and foamstability of milk proteins: sodium caseinate and whey protein concentrates.Food Hydrocolloids, 23, 1864e1876.
Millqvist-Fureby, A., Elofsson, U., & Bergensthal, B. (2001). Surface composition ofspray-dried milk protein-stabilised emulsions in relation to pre-heat treatmentof proteins. Colloids and Surfaces B: Biointerfaces, 21(1e3), 47e58.
Millqvist-Fureby, A., & Smith, P. (2007). In-situ lecithination of dairy powders inspray-drying for confectionery applications. Food Hydrocolloids, 21, 920e927.
Nijdam, J. J., & Langrish, T. A. G. (2006). The effect of surface composition on thefunctional properties of milk powders. Journal of Food Engineering, 77(4),919e925.
Onwulata, C. I., Konstance, R. P., & Holsinger, V. H. (1996). Flow properties ofencapsulated milkfat powders as affected by flow agent. Journal of Food Science,61(6), 1211e1215.
Qi, X. L., Holt, C., McNulty, D., Clarke, D. T., Brownlow, S., & Jones, G. R. (1997). Effectof temperature on the secondary structure of ß-lactoglobulin at pH 6.7, asdetermined by CD and IR spectroscopy: a test of the molten globule hypothesis.Biochemistry Journal, 324(1), 341e346.
Sliwinski, E. L., Lavrijsen, B. W. M., Vollenbroek, J. M., van der Stege, H. J., vanBoekel, M. A. J. S., & Wouters, J. T. M. (2003). Effects of spray drying on physi-cochemical properties of milk protein-stabilised emulsions. Colloids andSurfaces B: Biointerfaces, 31(1e4), 219e229.
Vignolles, M. L., Lopez, C., Ehrhardt, J. J., Lambert, J., Méjean, S. Jeantet, R., et al. (2009).Methods’ combination to investigate the suprastructure, composition and prop-erties of fat in fat-filled dairy powders. Journal of Food Engineering, 94, 154e162.
Ye, A. (2008). Interfacial composition and stability of emulsions made withmixtures of commercial sodium caseinate and whey protein concentrate. FoodChemistry, 110, 946e952.
Zhang, Z., & Goff, H. D. (2004). Protein distribution at air interfaces in dairy foamsand ice cream as affected by casein dissociation and emulsifiers. InternationalDairy Journal, 14(7), 647e657.