Embed Size (px)
Citation preview

Milestone Evaluations and Long Term Water Quality Monitoring
Trends:
What are They Telling Us About Where We are and Where We are Heading
Chesapeake Bay Program Partnership’s Citizen Advisory CommitteeSeptember 16, 2015

2
Milestone Evaluations

3
By Jurisdiction

Status of Trajectory Towards Achieving 2017 Interim Targets: Nitrogen
Agriculture
Wastewater
Stormwater
Septic Overall
Delaware
District
Maryland
New York
Pennsylvania
Virginia
West Virginia

Status of Trajectory Towards Achieving 2017 Interim Targets: Phosphorus
Agriculture Wastewater Stormwater Overall
Delaware
District
Maryland
New York
Pennsylvania
Virginia
West Virginia
2014-2015 EPA Oversight Status

7
By Sector


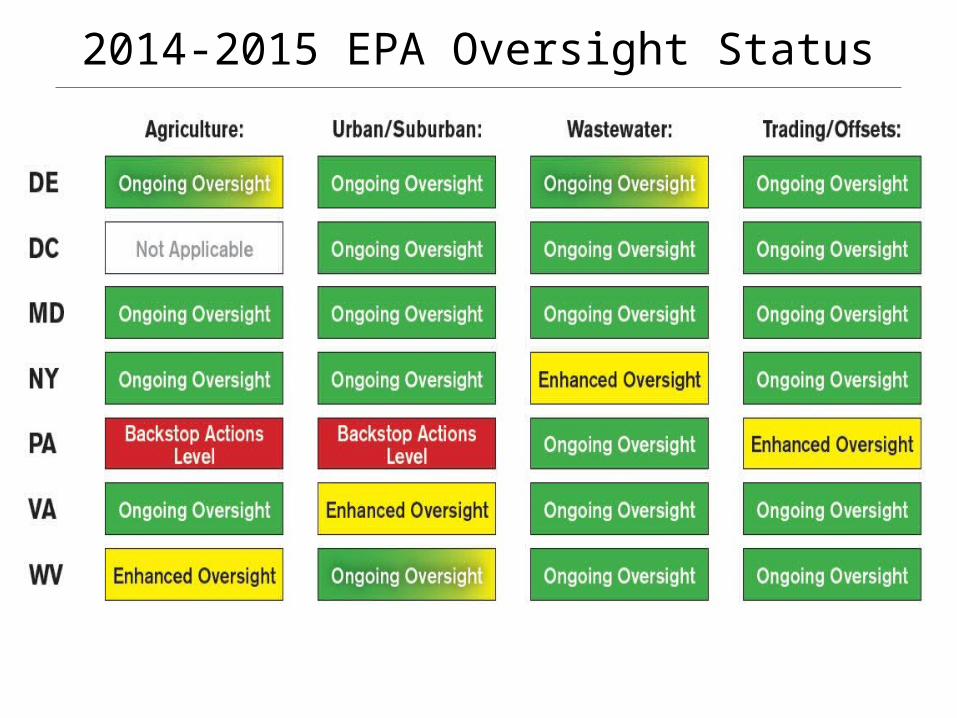
Status of Trajectory Towards Achieving 2017 Interim Targets: Nitrogen/Phosphorus/Sediment
Nitrogen Phosphorus Sediment
Agriculture
Wastewater
Stormwater
Septic
All Sources


Wastewater TN Load Reduction Progress
0
20
40
60
80
100
120
0
5
10
15
20
25TN EOS Load (mil lbs/yr) vs Population Trend in the Chesapeake Bay Watershed
IndustrialMunicipalPopulation
TN
EO
S L
oad (
mil
lion l
bs/
yr)
Popula
tion (
mil
lion)

Wastewater• Status: Well down the road to achieving the states’
WIP goals for reductions
• Red flags: MD, VA depending on wastewater reductions below their allocations being used to ‘make up’ for other sectors’ reduction shortfalls
• Watch List: New York; possible need for further reductions from PA significant, non-significant facilities
• Kudos: District, WV, MD, VA 13

Stormwater• Status: Nitrogen, sediment load estimated to
increase since 2009
• Red flags: getting the states’ MS4 programs and permits in place and fully functional; ensuring local funding sources/financing is in place
• Watch List: PA current Phase II WIP commitments well beyond achievement levels by 2025
• Kudos: District, MD, VA 14

Agriculture• Status: very mixed picture within and across
states heading into the midpoint assessment
• Red flags: PA: needs to reduce 19 million lbs. nitrogen to achieve their 2017 interim target; responsible for 72% of ag reductions by 2025
• Watch List: how the states deals with phosphorus saturated soils, BMP verification
• Kudos: MD (PMT), VA (RMP), WV (on target) 15

16
Long Term Water Quality Monitoring
Trends

17
Using Monitoring Data To Measure Progress and Explain Change
Foundation: Monitoring networks

Total Nitrogen: Flow Adjusted Concentration Trends
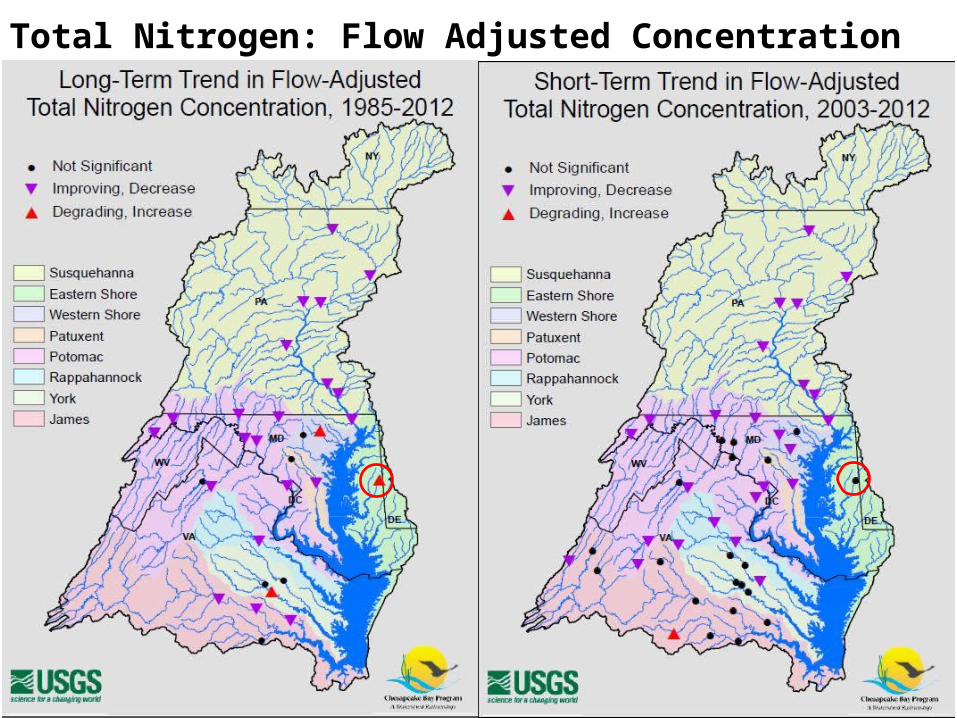
Total Nitrogen: Flow Adjusted Concentration Trends

Total Nitrogen: Flow Adjusted Concentration Trends

Changes in Total Nitrogen
Delivered to the Bay Estuary
from the 9 RIM Stations
Total reduction in RIM total nitrogen:1985 to 2014 = 16%2005 to 2014 = 2%
16% reduction
2% reduction
Annual Load
Trend, Flow-Normalized Load

What is the Percent
Contribution of Total Nitrogen
from each of the 9 RIM Tributaries?

Changes in Total Nitrogen Delivered to the Bay Estuary from the 9 RIM Stations

Changes in Nitrogen Yields: 2003-2012

Changes in Nitrogen Yields: 2003-2012

26

Total Phosphorus: Flow Adjusted Concentration Trends

Total Phosphorus: Flow Adjusted Concentration Trends
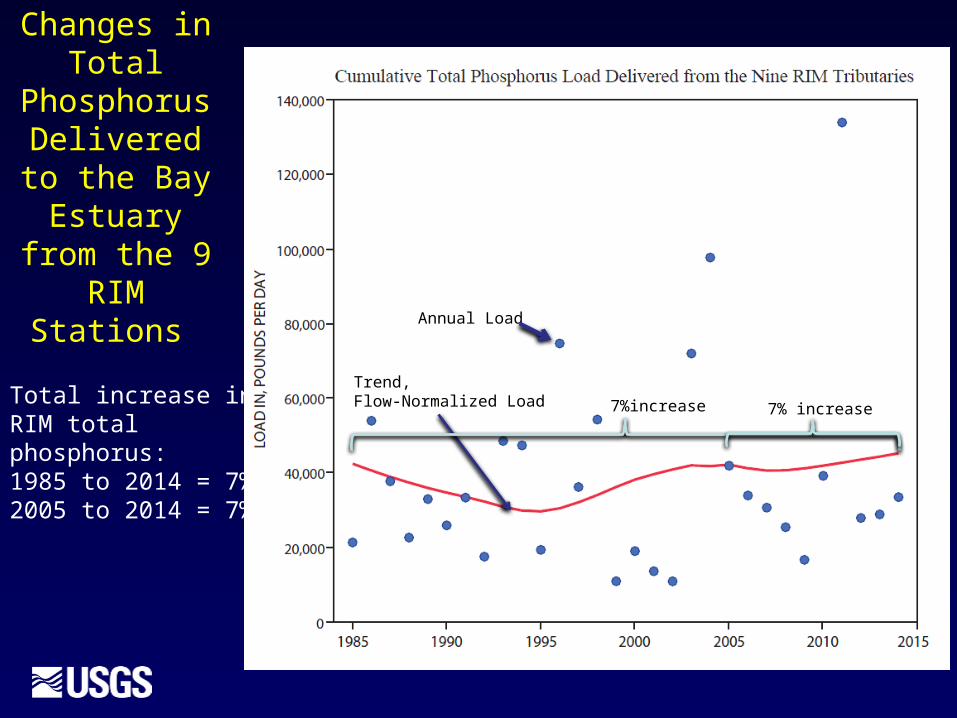
Total increase in RIM total phosphorus:1985 to 2014 = 7%2005 to 2014 = 7%
Changes in Total
Phosphorus Delivered to the
Bay Estuary from the 9 RIM
Stations
7%increase
Annual Load
Trend, Flow-Normalized Load 7% increase

What is the Percent
Contribution of Total Phosphorus from each of the 9 RIM Tributaries?

Recent Changes in Total Phosphorus
Delivered to the Bay Estuary from the 9
RIM Stations

32

33

Changes in Suspended Sediment
Loads: 2003-2012Of the 30 long-term NTN stations• 8 improving
• 18 degrading
• 3 exhibit no discernable change in SSC loading
• All Susquehanna stations above Conowingo are showing decreased SSC loading

Changes in Suspended Sediment
Loads: 2003-2012Of the 30 long-term NTN stations• 8 improving
• 18 degrading
• 3 exhibit no discernable change in SSC loading
• All Susquehanna stations above Conowingo are showing decreased SSC loading

Changes in Suspended Sediment Loads: 2003-2012

37

Restoration of Mattawoman Creek: Potomac River estuary tributary
• strongly impacted by nutrients from 1970 – mid-1990s• large and persistent algal blooms, sea grasses rare
• WWTP load reductions stimulated restoration
Photo from Elena Gilroy
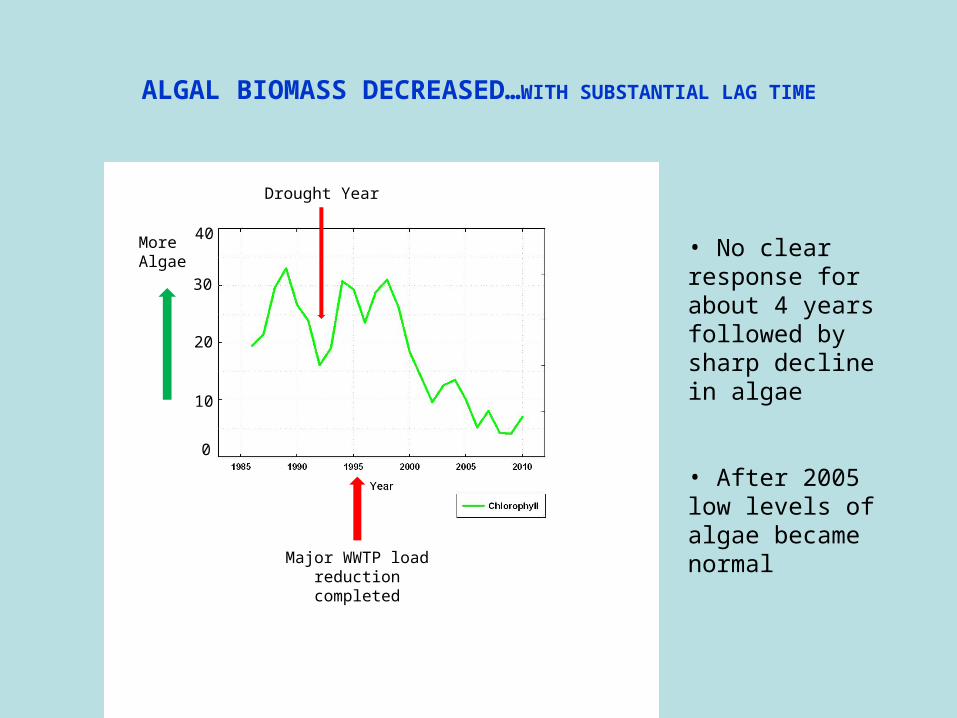
Major WWTP load reduction completed
More Algae
Drought Year
• No clear response for about 4 years followed by sharp decline in algae
• After 2005 low levels of algae became normal
ALGAL BIOMASS DECREASED…WITH SUBSTANTIAL LAG TIME
10
0
20
30
40

Major WWTP load reduction
More Algae
Cle
are
r W
ate
r
Major WWTP load reduction completed
Drought Year
• No clear increase for about 8 years followed by sharp increase in clarity
• Water clarity and algae highly correlated shallow Chesapeake Bay systems
WATER CLARITY INCREASED…ALSO WITH A LAG TIME

Major WWTP load reduction completed
1971
0 ha SAV
More Algae
Cle
are
r W
ate
r
Drought YearM
ore
SAV
• Very low levels of SAV were present prior to nutrient load reductions
• Major expansion of SAV in 2002, a severe drought year
• SAV relatively stable after 2002; lag in SAV relatively short
SAV INCREASED…SHORTER LAG WITH THRESHOLD RESPONSE

Susquehanna Flats SAV at the Head of the Bay
• An unexpected piece of very good news
• A clear example of why long-term monitoring is so valuable for both trends and explanations
• This example also reminds us that once these habitats start to “ get better” strong positive feedbacks can accelerate the restoration process
Adapted from Gurbisz and Kemp 2014

(Gurbisz & Kemp 2011)
Maps of SAV Cover and Density: Susquehanna Flats (1984 – 2010)
(http://web.vims.edu/bio/sav/maps.html)

Now…this is a SAV bed!• Huge expanse ~ 20 square miles (13,000 acres)• Clear water• Resilient to major storms; recovery from major storm = several years (not decades!)
C. Gurbisz, UMCES
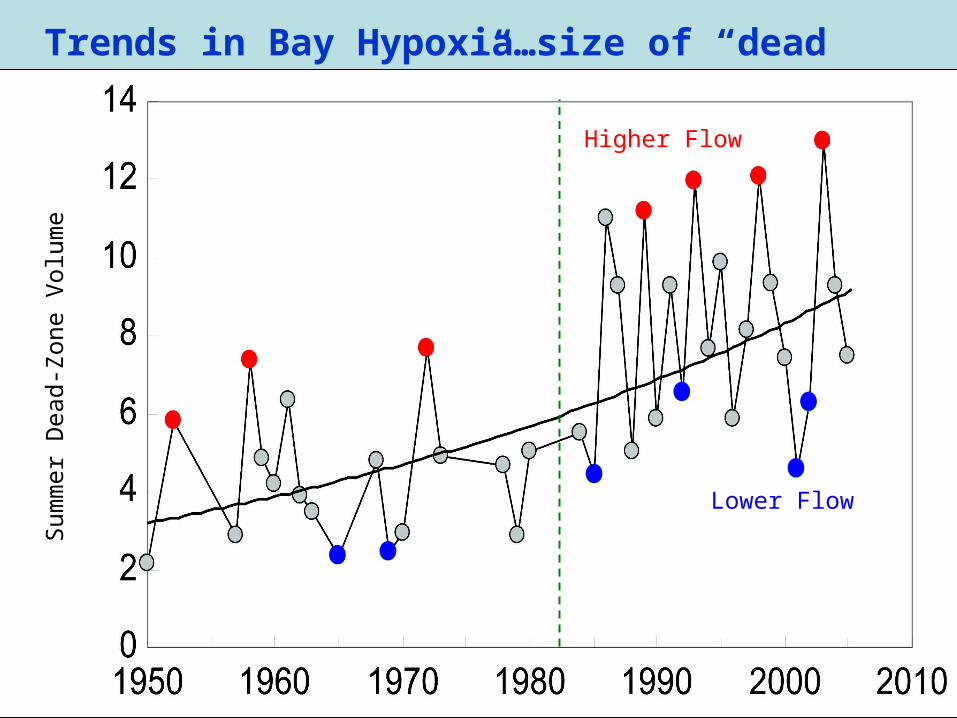
Trends in Bay Hypoxia…size of “dead zone”
Lower Flow
Higher Flow
Sum
mer
Dea
d-Z
one
Vol
ume

0
200
400
600
800
1000
1200
1400
1600
MD Bay Anoxia: September Data(0 - 0.2 mg/L)
Year
Average Marylandlate September anoxicvolume
An
oxic
Volu
me,
10
6
m3

WQ Monitoring Trends• The Great: Susquehanna Flats, Lynnhaven River,
Mattawoman Creek, Gunston Cove, late summer mainstem Bay dead zone, the list goes on…
• The Good: widespread decreasing nitrogen trends in streams, rivers
• The Bad: phosphorus trends flattening out, reversing in streams, rivers
• The Ugly: clarity in the tidal waters47

Take Home Messages• Clear evidence that actions to date are making a
real difference in better water quality, improved ecosystem health, more resilience
• Pennsylvania is still the key to Bay restoration
• Comparison of long and short term trend indicate we are losing past gains in some areas
• Explaining trends then adapting programs as a result must be a Partnership priority
48
49
Rich Batiuk
Associate Director for Science, Analysis and ImplementationU.S. Environmental Protection Agency
Chesapeake Bay Program Office410 Severn Avenue, Suite 307
Annapolis, Maryland 21403
410-267-5731 Work443-223-7823 Mobile

Questions
50