Embed Size (px)
Citation preview

Mikael Epstein
RISK MANAGEMENT OF INNOVATIVE
R&D PROJECT
DEVELOPMENT OF ANALYSYS MODEL
A SYSTEMATIC APPROACH FOR THE EARLY DETECTION OF COMPLEX PROBLEMS
(EDCP) IN R&D PROJECTS IN ORDER TO INCREASE SUCCESS IN ENTERPRISES
MIK
AEL EPSTEIN
RISK
MA
NA
GEM
ENT O
F INN
OV
ATIVE R
&D
PRO
JECT
A-209
HELSINKI SCHOOL OF ECONOMICS
ACTA UNIVERSITATIS OECONOMICAE HELSINGIENSIS
A-209
ISSN 1237-556XISBN 951-791-727-9
2002

HELSINKI SCHOOL OF ECONOMICS
ACTA UNIVERSITATIS OECONOMICAE HELSINGIENSIS
A-209
Mikael Epstein
RISK MANAGEMENT OF INNOVATIVE
R&D PROJECT
DEVELOPMENT OF ANALYSYS MODEL
A SYSTEMATIC APPROACH FOR THE EARLY DETECTION OF COMPLEX PROBLEMS
(EDCP) IN R&D PROJECTS IN ORDER TO INCREASE SUCCESS IN ENTERPRISES

© Mikael Epstein and
Helsinki School of Economics
ISSN 1237-556X
ISBN 951-791-727-9
ISBN 951-791-919-0 (Electronic dissertation)
Helsinki School of Economics -
HeSE print 2002

ACKNOWLEDGEMENTSThe research topic emerged as the experience by the author from approximatelythirty years' technical and commercial innovation in industrial and researchprojects. It became apparent that success of projects ought to be improved througha systematic analysis of the preconditions on beforehand.
The Technical Research Institute of Finland offered a fertile ground for thepreparatory work in defining the analysis system. Particularly the author isthankful to director Markku Auer and Drs Juha Sarlin and Antero Aspiala forencouragement and facilities to perform this defining work that was ofconsiderable size.
The National Technology Agency of Finland (TEKES) provided funds for thefurther development of the analysis system in the organization of Oy SesamConsulting Ab. The author is thankful to Anders Finskas of Sesam Consulting aswell as to TEKES. The work was then performed in cooperation with 16 pilotfirms involving over 40 individual persons. The author is thankful to all therse. Atotal of 44 projects were analyzed.
Lastly but not leastly the Helsinki School of Economics and BusinessAdministration provided a fruitful lucus for concluding the practical experiencesof the development work and reporting the findings in a scientific form. I amparticularly grateful to my advisor prof. Arto Lahti and to prof. Niilo Home fortheir guidance of this process of preparing practical findings into academic form.

ABSTRACTThis dissertation is positioned in the theoretical framework of innovationmanagement and risk management. The study aims at increasing theunderstanding of the development of a risk analysis tool for innovation projectsand of such development work in cooperation with several pilot firms duringanalysis of their real innovation projects.
The research questions covered the building of an analysis system for risk ininnovation projects and the integration of knowledge and resource based theoryinto the theories of risk, management and innovation.
The basic idea of the project and the resources intended to realize the project areanalyzed in parallel. The idea and the resources are analyzed by systematicallydescribing their essential attributes and components. The attributes describe thoseproperties that one intends to improve. The components represent those factors bythe help of which the properties will be improved. The attributes in combinationwith the components constitute pairs and determine which knowledge areas mustbe used to obtain the attributes. The attributes of the resources represent thoseabilities that the resources components possess and use when the attributes of theideas of the project are realized. The resource components represent the resourcesavailable to realize the project.
After the attributes and components have been properly described the attributecomponent pairs are rated in relation to the knowledge areas. Risk factors arecalculated based on the rating numbers. The risk factors relate to the attributecomponent pairs of the idea and the resources, respectively, and to the knowledgeareas. Finally the risk factors pertaining to the idea and the resources are comparedand the decision maker can see how well the resources are suited to realize theproject based on the idea. With this system the knowledge and resourcebasedtheory into the theories of risk, management and innovation were integrated.
A computer program was developed in order to facilitate the analysis process andthe documentation as well as the reporting. Emphasis was put to improve the userfriendliness through developing the interface in cooperation with several pilotfirms. It proved advantageous to perform the development work in clearly definedstages. The pilot firms were encouraged to participate in the development workbecause thy felt their projects benefited from the analysis results.
Keywords: detection, problem, innovation, project, concept, resources, attribute,rating

1
1. Introduction 71.1. Identification of the Problem Area 7
1.2. Research Problem 8Research Questions 10
1.3. Central Concepts 111.3.1 Knight’s Concept of Risk, and its Modifications 111.3.2. Schumpeter’s and other Writers’ Views on Innovation 18
Some Types of Innovation 18Strategy Concept as an Extension of the Schumpeterian Notion 25
1.3.3. Project Management and Analysis 30Analysis 35
1.3.4. Framework 37
1.5. Research Method 40
2. Methods for Generation and for Analysis in Innovation Projects 442.1. Methods for Risk Analysis and Risk Management 442.2. Description of project analysis methods 472.2.1. Decision theoretical analyses 502.2.2. Nonfinancial Risk management methods 562.2.3 Project Management Methods 60
2.3. Characteristics of different Methods 67
2.4. Voids in the Fields of Risk Detection in Innovation Projects, aPlace for Contributions to Science
77
3. A Theoretical Model for Early Detection of Complex Problems(EDCP) in Innovation Projects
79
3.1 Basic Elements in characterizing an Innovative Project 793.1.1. Background 793.1.2. Attribute and Component 81

2
3.1.3. Knowledge, Resources 833.1.4. Rating 883.1.4. Deliverables 88
3.2 The Basic Model 90Why is the EDCP Model better than other Methods availablefor Risk Analysis of Innovation Projects
96
3.3 The Extended Model 98Structure of EDCP Analysis System 99
4. The empirical Work 1014.1. Development of the EDCP Analysis System 1014.2. Progress during the Development Work 1034.2.1. Extension Structuring and Pretesting 1044.2.2. Selection of Pilot Firms 1084.2.3. The Analysis Sessions 1104.2.4. Pilot analyses, first sequence 1134.2.5. Intermediate development 1164.2.6. Pilot analyses, second sequence 121
4.2.7. Development of the final Bases and the final Analysis System 122The Tables 122Deliverables 124Interpretation of the Analysis Results 131Analysis Report 133Conclusions of Analysis 134Presentations 134
4.2.8. Risk analysis without mentioning the Word Risk 134
4.3. Summary of the base development work 135Introduction of Items into the Bases 136Conclusions about the Base Development Work 139
4.4. Description of the Analysis Work with the Case Projects of thePilot Firms
140
4.4.1. Categorization of the cases 142
4.5. Outcome of the Analyses 1494.5.1. Usefulness of the Analyses to the Development Work of EDCP 1494.5.2. Usefulness of the Analyses to the Pilot Firms 1544.5.3. Conclusions about the Usefulness of the Analyses 156

3
4.6. The Influence of the Characteristics of the Projects on theDevelopment of EDCP
158
4.7. Conclusions from the analyses of the case projects 1604.8. Commercial Analyses of Projects 163
5. Discussion 1645.1. The Structure of the Work 1645.2. Reliability and Validity 1645.3. Relation to the Research Questions 166
How build an EDCP Model that can be applied in Innovationand R&D Projects in Firms
166
Relation of the Model to Management Theory, Knowledgebased Theories and Risk Theory
166
Comparison of EDCP with some other Methods 169How does Project Management assess the Constructed Model? 171Items introduced into the Analysis (Input) 171Items pointed out 176Savings 176Decision aid 177
5.4. How did the Research Questions got answered? 177How to develop a Usable and Useful Analysis Tool? 177How can we select pilot firms that are best suited for thedevelopment of an EDCP analysis method
181
How can we help the pilots select the most suitable projects? 182
6. Theoretical Implications and Conclusions 1836.1. Theoretical Implications 1836.2. Contributions 185
7. Suggestions for further research 187
References 188
Appendix 199Appendix 1 199Appendix 2 200Appendix 3 206Appendix 4 224Appendix 5 229Appendix 6 230Appendix 7 232

4
Appendix 8 245Appendix 9 246Appendix 10 249Appendix 11 250Appendix 12 262Appendix 13 268
Microsoft Excel â, MS Excel â, MS Word â, MS Visual Basic â and MicrosoftVisual Basic â are proprietary trade names of Microsoft Corporation.

5
Figure No. Figure text Page
Figure 11 Action Cycle in Strategic Development 27Figure 12 Connection between institutional, corporate and
functional strategy30
Figure 13 Expenditures for R&D during the course of a project 33Figure 14 Composition of an Innovation Project 33Figure 15 Theories that relate to a method for definition of failure
risks in innovations39
Figure 16 Illustration of the Structure of this Work 41Figure 21 Prediction of project completion 61Figure 22 The House of Quality 64Figure 23 The four stages of QFD 65Figure 31 Interconnection between the elements of an EDCP
analysis model, management and analysis team80
Figure 32 The structure of the analysis process 91Figure 33 The “Conceptanalysis” table of the primary model 92Figure 34 The Resources Analysis Table 95Figure 41 “Concept” and “Resource analysis” tables in Stage 5 106Figure 42 Report form, Stage 5 107Figure 43 The figure shows how the guidance system presents
answers117
Figure 44 “Conceptanalysis” table, and to the right an excerpt ofthe Resources table
120
Figure 45 The profile diagram and adjustment table of thesensitivity of the analysis
123
Figure 46 The “Conceptanalysis” table 124Figure 47 The “Resource Analysis Table” 125Figure 48 Collation Table for Analysis Results 127Figure 49 Collation Table for Knowledge Areas 129Figure 410 Diagram showing the risk factors for the attribute
component pairs of the “Conceptanalysis” in a project130
Figure 411 Top part of “Collation Table for Analysis Results” aftersorting to investigate risk concentrations for the wholeproject
131
Figure 412 Top part of “Collation Table for Knowledge Areas”, aftersorting the column for “Weighted risks of KnowledgeAreas relative to Project”
133

6
Table No. Title Page
Table 21 Considerations for risk management method 46Table 22 Typification of project analysis methods 48Table 23 Table of stages and methods 50Table 24 Analysis Criteria 70Table 25 Number of Items per Analysis Criteria covered by
different Analysis Methods75
Table 26 Intemediates of Analysis 77Table 31 Number of items per analysis criteria covered by EDCP 97Table 32 Intermediates of analysis covered by EDCP 97Table 41 Phases in the development of EDCP bases 103Table 42 Types of changes in the EDCP bases during the
development work104
Table 43 Selection of Pilot Firms for the EDCP Project 108Table 44 Categories of Pilot Firms 109Table 45 Items listed and rated during EDCP Analysis 112Table 46 New items and changes to bases in each stage 137Table 47 The Distribution of Items to the different parts of the
Model138
Table 48 The Pilot Cases 141Table 49 Categories of Cases 143Table 410 Projects that were useful to the development of EDCP 150Table 411 Deetails of Projects and Pilot firms that contributed to
EDCP152
Table 412 Projects that were useful to Firms only 154Table 413 Pilot firms that gave nothing to EDCP 155Table 414 Comparison between contributive and noncontributive
Firms of Input per Pilot Firm155
Table 415 Comparison of activities for contributing and noncontributing pilot firms
156
Table 416 How of firms benefited from EDCP 157Table 417 Character of the analysis Projects 158Table 418 Influence of Innovation Type on Usefulness 159Table 419 Influence of Innovation Size on Usefulness 160

7
1. Introduction
1.1 Identification of the Problem Area
The research area for this work is the development of tools for minimizing the
hazards from risks in innovation projects. It involves innovation management
and risk management as well as methods used in these functions. Technological
knowledge is developing so rapidly that any one firm will have trouble staying
among the leaders of innovation and the technological evolution is likely to be
unpredictable, complex, and difficult to understand. Because the situations for
the firms change continuously, they must accommodate to the various markets,
to the technologies, to the industry environment, to social terms and to political
facts. This increases the demand for flexibility that means the ability to change
and the readiness to act. Pursuing such rapidly developing technologies creates
technological uncertainty that is greater than it was previously when the firms
used to work with more mature technologies that were available and more
stable (Andersson and Laurila 1983, p. 3940; Green 1995, p. 204). In order to
manage this situation firms are increasingly forced to apply innovations in their
operations and processes.
Innovation has been regarded as risky and hazardous e. g., by Schumpeter
(1934, p. 89). Many investigators report empirical data about risks in
innovation processes: only one of sixty product ideas brought into the
innovation process reached commercial success, and five manhours out of six
are used on unsuccessful products in innovation ventures (Andersson and
Laurila 1983, p.33). Furthermore, ca. 35% of products launched fail
commercially, and approximately 45% of total newproduct expenditures are
allocated to unsuccessful projects (Halman and Keizer 1994, p. 75).

8
Merrifield (1981) and Kerzner and Hostelly (1984) state that innovation
ventures carry considerable risks that cause more than one half of the individual
innovation undertakings to fail, in certain classes of innovation fields the failure
rate is still larger. The references that cover the most recent decades do not
indicate any improvement in this relation.
In order to minimize the risk in innovation projects firms ought to investigate
the propensity for success in their projects. Early and wellfocused
investigation of the projects that the firms want to engage in will save money.
1.2. Research Problem
This work is a constructive analysis of the building of a model for the early
detection of complex problems (EDCP) in innovation projects. The developed
model was based on the propositions of innovation management and risk
management. Literature findings about project and about analysis were also
regarded in connection to the model. The findings involve innovation as
described by Schumpeter (1934, 1939, 1942, 1946, 1947, 1949)and Mintzberg
(1999), they also include propositions on strategic action as interpreted by
Ansoff (1974, 1989), Schumpeter and Zalenzik (1977). Furthermore
propositions e.g., by Harrison (1993), Turner (1993,Duncan (1994), and Lundin
(1999) about projects were regarded, as well as theories by Ansell and Wharton
(1992), Virkkala (1994), Ansoff (1987, 1995) and others about analysis.
Theories regarding risk and risk management are described in Chapter 1.3., and
theories about innovation and about strategy in Chapter 1.4. Theories for
project and about analysis are described in Chapter 1.5.
Risk management focuses on a risk analysis to answer different questions and
the analysis method must possess a number of qualities. Some required
qualities are condensed from Ansell and Wharton (1992, p. 37), Halman and

9
Keizer (1994, p. 79, 77), and Chapman and Ward (1997, p. 67, 80, 3738). The
essential purpose of risk management is to improve project performance via
systematic identification, appraisal and management of projectrelated risk
(Chapman and Ward, 1997, p. 9).
The literature further lists a number of analysis methods for innovation projects
(Andersson and Laurila 1983, p. 8, 2224, 4849, Klus 1996, 2000). The
literature also lists a large number of methods for risk management (Ansell and
Wharton 1992, p. 109, Halman and Keizer 1994, p.7679, Chapman and Ward
1997, p.93 1089 136), Virkkala 1994,p. 219). The analysis methods involve
risk analysis in connection with innovation projects (Andersson and Laurila
1983, p. 19, Ansell and Wharton 1992, p. 1078, Halman and Keizer 1994, p.
77). Furthermore, methods that are intended for project management have been
used for the analysis of innovation projects (Turunen 1991, p. 2124, Urban and
Hauser 1993, p. 3408, Chapman and Ward 1997, p. 8991). Project analysis
methods are also mentioned (Andersson and Laurila 1983, p. 122 124 1279;
CEIIEC 1160 1992, p. 927; Virkkala 1994, p. 217).
The terminology that will be used can be defined in accordance to some of the
following key writers: The terms innovation, entrepreneur, entrepreneurial
leadership and creative destruction will predominately be used here in the form
presented by Schumpeter, and the terms risk and uncertainty as defined by
Knight, Urban and Hauser, and Cooper. The terms attribute and component will
be used as defined by Levitt and the term knowledge as defined by Nonaka and
Takeushi, Mahoney and Panjan, Penrose, and Barney. The term resource will
define those resources available to the firm for the realization of the project.
Other frequently used terms are project, concept, firm, analysis, and
deliverable, for these terms the conventional definitions found in dictionaries of
the English language are used if not defined separately.

10
The literature study will be used to show voids in the field of methods for risk
detection in innovation projects. Then a model will be constructed that covers
these voids, and useful elements from models revealed in the literature study
will be applied into the model.
This work is part of the scientific discussion about the management of
innovation and about the development of tools for innovation management. The
work aims at bringing a new aspect to the minimizing of risks connected to
innovation projects.
Research Questions
The research problem presented as a question is how to build an EDCP model
that can be applied in innovation and R&D projects in firms?
The following subproblems are presented:
1. How are knowledge and resource based theories integrated into risk
theory, innovation theory, and management theory?
2. How to develop a usable and useful analysis tool?
2.1. How can we select the firms that are best suited as pilots to serve the
development of such an analysis method?
2.2. How can we help the pilot firms to select the most suitable projects
for the development of such an analysis method?
The term usable means that the model can be easily used in the practice, the
term useful means that the results from applying the model are of use to the
user.

11
The endeavor of the study is to develop a method that
presents the concept of an innovation project in a form that allows
analysis
analyzes the concept in order to find the concentrations of requirements
or demands within the concept
analyzes the resources in order to find the lack or shortages in the
resources that are employed to realize the project
presents the risk concentrations of the project
A further endeavor is to find appropriate ways to develop an analysis model incooperation with pilot firms that have innovative projects.The work is also an analytic study of interactive development of a model in
cooperation with pilot firms in practical application on the firms’ innovation
projects.
1.3. Central Concepts
1.3.1. Knight’s Concept of Risk, and its Modifications
The essential fact, according to Knight, is that the word "risk" means, in some
cases a quantity susceptible of measurement. At other times, however, its
meaning is something distinctly not of this character, for instance Andersson
and Laurila (1983, p. 8) as well as Knight (1985, p. 19) state that risk is when
one cannot give a specific value to an occurrence.
Knight defines the term for a measurable uncertainty as " risk proper” and he
regards it to be so far different from an unmeasurable one that it is not in effect
an uncertainty at all. Knight, consequently restricts the term "uncertainty" to
cases of the nonquantitive type (Knight 1985, p. 19). Knight thus uses the term
“risk” when he describes the measurable quantity, and the term “uncertainty”
for the nonquantitative.
12
Knight regards that it is this "true" uncertainty, and not risk that forms the basis
of a valid theory of profit(s) and accounts for the divergence between actual
and theoretical competition (Knight 1985, p. 19, Barreto 1989, p. 40). Both the
degrees of risk and the genetic types of risk have been objects for research.
Knight distinguishes between measurable and unmeasurable uncertainty. He
uses the term " risk " to designate the former and the term "uncertainty" for the
latter. He writes that the word " risk " ordinarily is used in a loose way to refer
to any sort of uncertainty viewed from the standpoint of the unfavorable
contingency. The term "uncertainty" is similarly used with reference to the
favorable outcome; he speaks of the " risk " of a loss, the " uncertainty " of a
gain (Knight 1985, p. 24).
According to the Random House Dictionary the word risk means exposure to
the chance of injury or loss, a hazard or dangerous chance. In the insurance
business risk means the hazard or chance of loss, or the degree of probability of
such loss, or the amount that the insurance company may lose. The word risk
came to use in the English language ca. 165565 (Random 1987). The origin of
the word risk is thought to be either, the Arabic word risq or the Latin word
risicum. (Kedar 1970). In the literature on the subject the word risk is used to
imply a measurement of the chance of an outcome, the size of the outcome or a
combination of both (Ansell and Wharton 1992, p. 4).
Riskfreeness has been defined primarily in the financial meaning. In the
faculty of financial science the riskfree rate is defined as a defaultfree interest
rate i.e., the interest rate for an asset that will not default or disappear.
According to Pike and Neale (1993), no asset is totally risk free. Even
governments default on loans and defer interest payments, but in a stable
economic and political environment, government securities are about the
nearest one can come to a risk free asset.

13
In financial considerations a measure of risk has been the equity risk premium,
i.e., the difference between the return on common stocks and on government
securities. In practice only two securities are used for this purpose, namely
shortterm treasury bills that are considered closest to a riskfree security, and
longterm treasury bonds. Although longterm treasury bonds are free from
default they are not riskfree securities. (Cornell 1999) Several researchers,
Schumpeter (1928, 1934, 1939, 1942, 1946, 1947, 1949), Knight (1985, p. 24),
as well as Andersson and Laurila (1983, p. 8) relate profit to the management
of risk in business, at the same time they relate profit to offering of innovations
before any of the firm’s competitors. Thus profit can be seen as a link between
innovation and risk, i.e., people undertake risk of innovation in the expectation
of profit.
Ansoff linked innovation to risk through the entrepreneur, he used the term
"entrepreneurial" to indicate an attitude to risk (Ansoff 1968 134). In Ansoffs
view, "entrepreneurs" anticipate both problems and opportunities by
conducting a continual search for strategic opportunities (Ansoff 1968, 208,
Barreto 1989, p. 38). Schumpeter distinguished the entrepreneurial function
from the function of the riskbearing capitalist or the administrative direction of
existing firms by the manager (Lintunen 2000, p. 211, Barreto 1989, p.30).
Many writers have presented studies about risks connected with innovation in
different business activities e.g., product innovation has been proven to be one
of the riskiest endeavors of the modern corporation. Kerzner and Hostelly
(1984, p611) report an average success ratio for product development of 1:64,
and Merrifield (1981, p. 1318) estimates that one of twenty major started
projects will produce positive cash flow.
Exposure to financial risks can be optimized carefully so that firms can
concentrate on what they do best – manage their exposure to business risks.
Considerable effort has been put into the management of financial risks, and

14
many methods have been developed to assist management in managing these
risks. Operational risks can vary from very minor ones to the critical. Legal
Risk type CharacterizationBusiness risks firm willingly assumes in order to create a competitive advantage
within its own industry. product market technological innovations product design marketing.Furthermore business risk includes exposure to macroeconomic riskthat results e.g., from macroeconomic cycles.
Nonbusiness risks strategic risks e.g., fundamental shifts in the economy or politicalenvironment
Financial risks relate to possible losses in financial markets, e.g., due to adversemovements in market prices credit risks liquidity risks
Operational risks Failures of internal systems or people operating themLegal risks Arise from the prospect that contracts may not be reinforced
health or environmental risksFrom Jorion (2000, p. 4) and Dowd (1999, p. 3)
Jorion (2000, p. 4) and Dowd (1999, p. 3) group risks into business risks, non
business, financial risks, operational risks and legal risks. The risk types are
characterized in the table above.
risks arise from the prospect that contracts may not be reinforced.
Consequences of business activities may also cause legal risks (Dowd 1999, p.
4).
Examples of risks connected to the securities business are three fundamental
risks: credit or counterpart risk, liquidity risk, and settlement risk (Stehm 1996,
p. 19). Counterpart risk is connected to the creditworthiness of the counterpart
(VM 1991, p. 10). Liquidity risk means that the other party of the deal does not
commit itself to the delivery or payment in time (Stehm 1996, p. 1617).
Settlement risk deals with the situation when the delivery of the securities or
the payment is annulled just before the planned realization time. It occurs when

15
the seller can deliver the security but does not get paid by the buyer, or when
the buyer can pay but does not get delivery (Stehm 1996, p. 19). Individuals
perceive differences in the risks involved in the purchase of new products.
These risks are in some way related both to the personal characteristics of the
person perceiving this product, and to the newness of the product (Midgley
1977, p. 66). An important part of corporative activity is to manage risks. The
risks should be monitored carefully because of their potential camage. Some
firms passively accept risks others attempt to create a competitive advantage by
judicious exposure to financial risk (Jorion, 2000, p.3).
Urban and Hauser (1993, p. 67) found that upfront investments pay back
handsomely when trying to lower expected costs. Upfront strategy means that
you take your risks when less is at stake. As proof the authors refer to results
from studies by Booz, Allen, and Hamilton (1971) who found that firms must
produce on an average 58 ideas for every success. When Booz et. al. they did a
similar study eleven years later the authors found that the number had been
reduced to seven ideas per success. Moore (1988) found upfront attention was
paid to several management aspects in the firms. These aspects included
strategically based idea search, preliminary market research, initial screening,
etc.
According to Leskinen the entrepreneur carries a risk that can be e.g., business
risk, social risk, psychological risk, or family risk and generally, entrepreneurs
have a more optimal view on risk than the population generally. Leskinen also
refers to two kinds of risks: “sinking the boat” and “being left behind”.
Entrepreneurs tend to be “left behind” because the first opportunity is often the
last possibility (Leskinen, 1999, p. 5455).#2114#
Common pitfalls or risks in the management of projects include nonfulfillment
of technical requirements, encountering of unexpected scientific, technical or
commercial difficulties, time schedule delay, overrun of budget, and
communication problems. Often pitfalls are due to unexpected complexities

16
encountered in some of the disciplines involved in the project. A decisive
question is how many of the pitfalls could have been foreseen prior to
embarking on the project and how the course of the project could have been re
directed, had these pitfalls been made evident in due time (Szakonyi 1988, p.
126127, Wilkinson 1991, p. 1929, Silverberg 1991, p. 4649).
Efficient innovation management requires identifying of risks. Chapman and
Ward (1997, p. 9596) identified two specific tasks for the purpose of
responding to risks. Firstly, searching for sources of risk and response,
employing a range of techniques such as pondering, interviewing,
brainstorming and checklists. Secondly, classifying to provide a suitable
structure for defining risks and responses, aggregating/disaggregating as
appropriate.
Urban and Hauser (1993, p. 57) like to achieve a balance between avoiding risk
altogether (e. g., by doing nothing), and controlling risk while seeking to
succeed. They refer to a study by Cooper (1984a, p. 518 and 1984b, p. 151
164) that identified roughly five types of strategies. Of these strategies Urban
and Hauser found one winner strategy, namely the strategy that integrates
marketing and technology by focusing on the customer and delivering benefits
with the stateoftheart technology.
Every firm, and particularly new growth enterprises are exposed to big risks.
When a risk evaluation is included in the business plan, the potential investors
see that the business plan is considered thoroughly, and that the plans are not
founded on too optimistic a base. However, it is not good for the firm to be too
pessimistic, and give the risks too much space in the business plan. Thus it is
important to recognize and evaluate the risks. Typical business risks occur
either because of the firm’s own activities or from changes in the business
environment. Examples of risks within the firm are difficulties in finding key
resources, keyemployees leaving the firm, or the unsuccessful prototype of an
innovation. Environmental risks may include unfulfilled sales expectations, the

17
sudden destruction of supplier’s facilities through fire, the entrance of a
superior competitive product into the market, the impossibility of obtaining a
patent, or a distributor breaking an agreement. Risk evaluation usually involves
foreseeing, because the evaluation can always be based on certain assumptions.
The most important risks can be identified by means of sensitivity analysis, and
the firm can then concentrate on eliminating the risks. (McKinsey, 2000, p.
1234)
Urban and Hauser (1993, p. 425426) further discuss reduction of risk, and
suggest sequential testing. First the components of the product are tested, then
the product design. Their key concept is to delay large testing expenditures
until component risks are minimized. Urban and Hauser propose pretest
Risks can be characterized according to different writers as shown below:
Writer CharacterSchumpeter (1928, 1934,
1939, 1942, 1946, 1947, 1949)
Risk is carried by the capitalist, not (primarily) bythe entrepreneur
Ansoff (1968) Relates risk through the entrepreneur
Kerzner and Hostelly (1984) Estimation of success ratios or risk ratios
Knight (1985) Measurable risk versus nonmeasurable uncertainty
Wilkinson (1991), Szakonyi
(1988, Silverberg (1981)
Project risks include nonfulfillment of requisitions,unexpected difficulties, delay of schedule, overrunof budget
Stehm (1996), Jorion (2000) Financial risk relate to losses in financial markets
Leskinen (1999) Entrepreneur carries riskDifferentiates between business, social,psychological and family risks
marketlaboratory to reduce chances of failure in launch. After the components
are rested the following step in the sequential testing the integrated product is
tested through laboratory simulations and consumer panels. Urban and Hauser
(1993, 2728) further present proactive and reactive strategies to reduce risk.

18
Reactive strategy involves countering competitive new products, and in the
proactive strategy the firm initiates change and takes an active role in the
development of new products.
1.3.2. Schumpeter’s, Ansoff’s and other Writer’s View’s of Innovation
Some Types of Innovation
Innovation is one of the prerequisites for the development of business. Joseph
Schumpeter (18831950) pioneered the scientific research of innovation in
economic development. The most prominent factors he introduced to the
scientific discussion were the entrepreneur and entrepreneurial leadership. The
word entrepreneur entered the English language ca 187580 (Random 1987)
i.e., not very long before Schumpeter started his research work.
Schumpeter (1939, p. 86) declared that innovation cannot be anything else than
an effort to cope with a given economic situation. One can conclude that he
linked innovation to profit(s), and thus to success in business.
Schumpeter defined innovation primarily with the statement that new
combinations in the form of "the introduction of new good ... or a new quality
of a good ... a new method of production... the opening up a new markets ... a
new source of raw materials... the carrying out of new organization of any
industry" (Schumpeter 1934, 66, Barreto, 1989, p. 28). He also distinguished
innovation as the function of the entrepreneur as separated from the
administrative function of the manager and from the risk bearing functions.
Ansoff (1984, p. 224), again, regarded innovation as being a part of strategy
where it represented the aggressiveness in strategic entrepreneurial
management (Lintunen 2000, p. 267, 44; Virkkala, 1994, p. 7).
Schumpeter was of the opinion that the prerequisites for innovation are
economic leadership, will power and energetic action. Consequently,

19
Schumpeter introduced the idea of entrepreneurial leadership as being the
source of creative energy for innovation and evolution (Schumpeter 1949,
1947, 1946, 1942, 1939, 1934). Economic leadership involves leading the
process of innovation and conducting the entrepreneur's own energy and
capacity, rather than that of others, toward fulfilment of the entrepreneurial
function in various forms in an economy (Schumpeter 1934, p 93 in Lintunen
2000, p. 39)
Mintzberg's concept of visionary leadership, like Schumpeter's entrepreneurial
leadership, makes human creativity the ultimate source of innovation.
Schumpeter (1934, p 93 in Lintunen 2000, p. 39) saw that the entrepreneurial
leadership quality may be built into the company personality, so that the
entrepreneurial function may be fulfilled by the entrepreneurial team or group.
In comparison, Mintzberg's concept of visionary leadership indicates leadership
mainly through the activity of a single visionary leader (Mintzberg and Lampel
1999, p. 23).
What was distinctive about Schumpeter was his emphasis on discontinuous
rather than continuous change. New combinations represent a sharp break from
the past and bear no comprehensible connection to previous achievements
(Schumpeter, 1934, p. 85).
Schumpeter introduced the concept of creative destruction as part of the
innovation process. Shionoya (1997) proposes that creative destruction gives
rise to the process of innovation, because innovation destroys old things and
creates new ones (Shionoya 1997, 163). Steinbock interprets Schumpeter’s
creative destruction as simultaneously being creative renewing, a regeneration
that then translates into innovation (Steinbock 2001). Renewing may seem a
more pleasant metaphor for innovation than destruction.
Schumpeter personified the entrepreneur as a generator of novel opportunities
(an innovator), in opposition to the Austrian economists, whose theory rests on

20
the search for opportunities (Dopfer 1994, 136, ed. Magnusson 1994, p. 125).
He proposed that an entrepreneurial function is an act of will by an
entrepreneur to introduce innovation into an economy, and a source of
evolution into an entire society (Lintunen 2000, p. 16).
Schumpeter (1912, 1934, 1939, 1947, 1949,1954) stated that temporary
monopoly profits are the reward to the entrepreneur for successful innovation.
He defined entrepreneurial profits as the premium put on successful innovation
in capitalist society (Schumpeter 1939, p. 105), and he stated that
entrepreneurial profits are the temporary monopoly return on the personal
activity of the entrepreneur (Schumpeter 1949, 1928, 1934, 1939, 1942, 1947,
1949,1954). Consequently, he distinguished the entrepreneurial return from
wages of managements and interest on owned capital or capital gains
(Schumpeter 1954, 89598, 1939, 105, 1934). Chantillon even uses a risk
theory of profit as a means to identify entrepreneurship (Barreto, 1989, p. 35).
A conventional definition says that innovation is the making of a change in
something established, a novelty (Webster 1999). The word innovation came to
the English language ca. 154050 (Random 1987). According to Kotler (1991)
“an innovation refers to any good, service or idea that is perceived by someone
as new”. Thus a new product or process may be an innovation to one person but
not to another. Innovation can be viewed either as closely related to
technological change and R&D, or mainly associated with the marketing
process. Innovation can be regarded as the detection and fulfillment of unfilled
needs and wants of potential customers. (Roman and Puett 1983). Another
definition is to group innovation into product and process innovations. Product
innovation is embedded in the product itself, process innovation is part of the
production system (Kosnik 1990). Commercially discontinuous innovations
bring about new ways to structure the markets as far as customer needs, or
market segmentation, or the entire value system is concerned. Discontinuous

21
innovation can be produced by the use of an iterative probing process of trial
and error (Christensen 1997, Lynn et al., 1997, Norling and Statz 1998).
A large number of methods have been developed for the management of
innovation projects. Many of them will be presented in Chapter 2. The methods
can be grouped in idea generation methods (Virkkala 1994), risk management
methods (Ansell and Wharton 1992, Virkkala 1994, Chapman and Ward 1997),
decision theoretical methods (Andersson and Laurila 1983, KlusTest home
page 1996, Virkkala 1994), and general project management methods (CEIIEC
1160 1992, Urban and Hauser 1993). Econometric methods and operation
analysis methods have also been used for management of innovation projects
(Andersson and Laurila 1983, Levitt 1980). Drucker (1986, p. 30) defines
innovation as an economic or social rather than a technical term. He focuses on
demand rather than on supply terms i.e., changing the value and satisfaction
obtained from resources by the consumer. Drucker (1986, p. 27) also sees
innovation as the specific instrument of entrepreneurship, through it the
entrepreneur endows resources with new capacity to create wealth. Innovation
does not have to be technical, it does not need to be a thing at all. Social
innovations e.g., the newspaper, insurance and installment buying have
transformed whole economies.
Innovation involves the use of new ideas. A number of methods have been
developed for idea generation. Apparently the methods used for idea generation
may include elements that can be of use in the development of risk analysis
methods, and will be presented below. An innovation project may start by an
observation of a possible coincidence of a need and a possibility. This
coincidence is usually called an idea. Capability and willingness to create
something useful of the idea will be necessary, in order to make the idea come
true. (Virkkala 1994, p. 30) Besides the theoretical approach to innovations

22
many writers have presented practical solutions to innovation problems. Much
of the literature deals with creativity and the creative process. The word
creativity entered the English language ca. 187075 (Random 1987), it was
used first time in scientific context ca. 1955 (Ekvall, 1979 p. 7).
Harisalo and Miettinen (2000, p. 101) conclude that the creative process is a
decision process, a creative individual tries to solve his problem by finding a
solution of creative products. The creative process starts with discovering the
problem. Forethought is the second stage of the process. A solution to the
problem is sought for using subconscious thinking methods. By combining
subconscious and conscious thinking methods the creative individual arrives at
an insight of the solution to the problem. He will them be able to convince
himself about the usefulness of the insight. (Harisalo and Miettinen 2000, p.
1012; Osborn 1957, p. 21228) Harisalo and Miettinen derive a number of
factors within the creative processes (Harisalo and Miettinen (2000, p. 102),
these factors can be organized into groups. The first group consists of
preparation, forethought, insight, problem identification, problem perceiving
and problem formulation. The second group covers fact finding, solution
search, solution pondering, perception and synthesis of ideas. The third group
contains idea evaluation, convincing, idea selection and idea utilization. The
first group can be called problem presentation, the second solution processing
and the third idea processing.
According to Sjölander (1985) as well as to Cooper and Kleinschmidt (1987, p.
175189) one can distinguish between two basic models of the innovation
process: the processphase model preferred by scholars of economics and the
idea and information flow models preferred by scholars of engineering.
Another classification method in the scientific discussion characterizes
innovations as radical or incremental. Green distinguishes four dimensions of
23
radicalness: technological uncertainty, technical inexperience, business
inexperience, and technology costs. He further classifies radicalness in terms of
four basic issues (Green, 1985, p. 203):
1)the extent to which an innovation incorporates technology that is
embryonic and rapidly developing in the general scientific community;
2) the extent to which an innovation incorporates technology that is new to a
firm, but may be well understood by others;
3) the extent to which the innovation represents a departure from the firm's
existing management or business practices;
4) the extent to which an innovation requires a sizable financial risk.
According to Lintunen (2000, p. 298), Mintzberg's concept of the entrepreneur
is ingrained in Schumpeter's concept of the entrepreneur i. e., human creativity,
intuition, vision and hence entrepreneurial leadership. Furthermore, Mintzberg's
concept of the entrepreneur is connected with Hamel and Prahalad's concepts of
core competence, strategic intent and stretch through their common roots in
Schumpeter's thesis of leadership, or creative destruction.
Projects in their conception stage usually are not properly specified, their scope
is not stabilized, and the interested parties have not yet found a consensus. No
implementation methods have been selected, and part of the project may need
further research. Projects have also developed into larger and more complex
systems including elements of software, social impact and high technology.
(Lichtenberg 1989, p. 4651) An innovation in the economic sense is
accomplished only when the first commercial transaction is performed that
involves the new product, service, or process that has been innovated (Freeman
1974, p. 22). A project that is undertaken intending to accomplish such an
innovation may be termed an innovation project or an innovative project.

24
Innovation can be characterized according to different writers as shown below:
Writer CharacteristicsSchumpeter (1928, 1934,
1939, 1942, 1946, 1947,
1949)
Involves the entrepreneurLinked to profitInnovation requires economic leadership, willpower, and energeticactionEfforts to cope with the economic situation through new combinationsInnovation is the generation of novel opportunities (through theentrepreneur)Innovation involves discontinuous change, creative destructionInnovation gives temporary monopoly that produces profit (to theentrepreneur)
Freeman (1974) Innovation in economic sense is accomplished with the firstcommercial transaction
Roman and Pruett (1983) Innovation is the detection and fulfillment of unfilled needs and wantsof potential customers
Sjölander (1985), Cooper
and Kleinschmidt (1987)
Present processphase model and information flow model forinnovation
Drucker (1986) Innovation is a social or economical term, value changingInnovation is a special instrument of entrepreneurship
Ansoff Innovation is part of strategy, represents aggression
Tirole (1988) Innovation can be classified into drastic or nondrastic types (relatedto managerial cost)
Kotler (1991) Innovation refers to any good, service, or idea that is perceived as new
Virkkala (1994) Innovation involves use of ideas that can be generated systematicallywith the help of methods
Mintzberg (1999) Human creativity is the ultimate source of innovation
Harisalo and Miettinen
(2000)
Practical solutions to innovation problems through creative decisionprocess

25
Strategy Concept as an Extension of the Ansoffian and Schumpeterian Notions
Schumpeter’s vision of longterm economic change was that the entrepreneur
incessantly introduces innovations. The adaptive managerial function covers
the administration of existing firms, whereas the creative entrepreneurial
function involves the incessant creation of new firms [innovations]
(Schumpeter (1946), ed. Clemence 1997, p. 19899) i.e., entrepreneurs create
new firms in discontinuous processes whereas managers run existing firms as
continuous processes. Ansoff and Schumpeter viewed strategy differently,
Ansoff described strategy, first and foremost, as a system concept that gives
coherence and direction to the growth of a complex organization (Ansoff 1968,
p. 105). Ansoff’s early concept of strategy as the productmarket matrix, and
the pattern of aggressiveness of innovation and marketing strategies in strategic
management, parallels Schumpeter's concept of innovation or new
combinations (Lintunen 2000, p. 267).
For Schumpeter, in his historyled theory construction, vision was the
successful tool for describing and explaining economic life and its essentially
evolutionary process of change (Schumpeter 1954, p.570). Thus one can
conclude that Schumpeter’s vision largely corresponds to Ansoff’s strategy.
Ansoff’s concept of strategy is meant to provide management with a practical
tool for longterm corporate planning (Lahti 1991, p. 149, ed. Näsi 1994). This
management tool contains many elements of an analysis, for instance
perception of problems and opportunities, diagnosis of problems and
opportunities and their effect on the firm, measurement of performance in
relation to the objectives, and analysis of the probable consequences of the
courses of action (Ansoff 1984, p. 241).
Ansoff (1984, p. 241) defined management as a problemsolving activity of a
complex information process. Ansoff admitted that complex problems have
important systemic properties, and the complexity of the real world is many
times greater than the complexityhandling capacity of the human brain (Ansoff

26
1979, p. 218). Ansoff maintained that through a connected chain of activities
the manager sets objectives, generates responses to problems and opportunities,
and selects the preferred alternative. Ansoff further involves programming and
budgeting of a selected alternative into the manager’s duties. He further
includes leadership in implementation including communication and
motivation, observation of significant trends and possible discontinuities both
inside and outside the firm, and recycling some or all of the preceding steps
(Ansoff 1984, p. 241). From the above one can conclude that Ansoff sees
management as a continuous process.
Ansoff (1987, p. 45) proposes a ‘cascade’ approach to a search procedure in
arriving at a strategy. At the start the possible decision rules are formulated in
gross terms and are then successively refined through several stages in the
strategy making process. The procedure within each step of the cascade
consists of first establishing a set of objectives, then the difference (“gap”)
between the firm’s current position and the objectives is estimated, then one or
several courses of action (strategy) are proposed, and, finally, the actions are
tested for their “gapreducing” properties. Figure 11 illustrates the overall
decision and implementation flow in strategic activity. The ‘cascade’ property
is represented by the progressive convergence of the decision process that starts
with a broad choice of the firm’s future business areas. It then progresses
towards the selection of specific products or markets with which the firm will
serve these market areas (Ansoff, 1987, p. 177178). The dotted oval in the
areas of generation of project alternatives and project selection indicates the
position or place for a risk analysis in the course of the implementation of a
strategic activity.

27
Figure 11. Action Cycle in Strategic Development (from Ansoff, 1987, p.178), The dotted Oval indicates Position of a Risk Analysis Process forProjects.
Ansoff (1965, p. 38) also identified the strategic problem as the "misfit or
imbalance between products of the firm and the demand of its environment."
He sees the strategic decisions to be primarily concerned with the external,
rather than the internal problems of the firm, specifically, when selecting the
productmix that the firm will produce and the markets to which it will sell
(Ansoff 1968, p. 234). The firm can be seen as a part of its enviromnent, and
in strategic planning the firm is then analysed from the external point of view.
The goal of the firm is to find the niche in which its profit is the best possible
(Lahti 1987, p. 1621).
Make Profits from NewProducts/Services #2149#
Start
(1) Decide where to do Business(Portfolio Strategy)
Select Projects
Implement Projects
(2) Decide how to do Business inEach Business Area
(Competitive Strategy)
(3) Generate Project Alternatives(New Products/Services/Markets/Technologies)
StrategicFeedback
OperatingFeedback

28
Simon states that complex systems are hierarchic. One reason for this is
hierarchic systems composed of subsystems are the most likely to appear
through evolutionary processes. The mechanisms of natural selection will
produce hierarchies more rapidly than nonhierarchic systems because the
components of hierarchies themselves make up stable systems. Furthermore,
among systems of a given size and complexity, hierarchic systems require
much less information transmission among their parts than do systems of other
kinds. Simon sees a third reason for complex systems being hierarchic, the
complexity of an organization as viewed from any particular position within it
becomes almost independent of its total size when the organization has a
hierarchic structure (Simon 1977, p. 111113).
Also the need for the firm to take on challenges presents a need for analysis of
projects. Prahalad points out that strategic intent must cause a "misfit' between
aspirations and current resources and current approaches to using resources
(Prahalad 1997, 175, ed. Tushman and Anderson). Creating stretch, ie. a misfit
between resources and aspirations, is the single most important task senior
management faces (Hamel and Prahalad 1993, p. 78). Strategic intent focuses
on carrying out innovations; an obsession with winning means an obsession
with innovations (Lintunen 2000, p. 146). One may conclude that Prahalad’s
request for “misfit” within the firm is to be seen as an invitation to the firm to
take on challenges. It can also be termed as an urge to management to find
challenges for the firm. This activity can be seen as a search for opportunities
in line with the Austrian school. A risk analysis for innovation ought to
consider the gap or misfit between the aspirations of the environment and the
resources or products of the firm. The risks connected to the misfits require
analysis in order to make the firms’ management aware of the existence and
amount of such risks.

29
Zaleznik explained that the management process consists of the rational
assessment of a situation and the systematic selection of goals and purposes
i.e., to answer the question: what is to be done? Furthermore it involves the
systematic development of strategies to achieve these goals, and the
marshalling of the required resources. Management process includes the
rational design, organization, direction, and control of the activities required for
attaining the selected purposes, and, finally, the motivating and rewarding of
people to do the work (Zaleznik 1977, p. 68). Management is thus linked to the
building of the firm’s strategy through systematic and rational activities.
An entrepreneur must often make decisions when consequences are
unforeseeable, because he operates in an uncertain environment (Knight in
Barreto 1989, p. 34). Uncertainty, as defined by Knight, forces decisions to be
made under ignorance, as actions are based on opinions rather than knowledge.
Knight’s entrepreneur never really knows in advance if his plans and
expectations are correct, but yet he must decide what to do and be responsible
for the decision. Knight even goes so far that he considers the entrepreneur
responsible in a case where he did not make a particular decision (Barreto
1989, p. 40).
Danila (1989) distinguished between different types of strategies: institutional
strategy, corporate strategy, business strategy, technological strategy and
functional strategy (Fig. 12). The first two strategies refer to how the company
defines and shapes its basic shape and vision and how it defines its longterm
goal, respectively. The business strategy refers to productmarket technology
choices made by division or productline management. The technological
strategy covers several functional strategies such as R&D, engineering, process
improvement and new product development.

30
Figure 12. Connection between institutional, corporate and functional strategy
(Danila 1989)
1.3.3. Project Management and Analysis
Management historians would probably point to the 1950s and 1960s as the
birth era of the current approach to project management and to several large
defense programs executed at that time (Fondahl 1987, Snyder, 1987, in
Shenhar and Dvir). During those years, the project management procedures
were established. (Moder 1988, p. 324, Shenhar and Dvir 1996, p. 608)
Harrison (1993, p. 10) states that there exists no standard or universal definition
for a project. The definition of projects varies according to the definer and the
actual project type. Project Management Institute suggests as an official
definition that a project is any undertaking that has a defined starting point and
defined objectives by which completion is defined. Further, most projects have
a limited amount of resources by which the objectives are to be accomplished
(Duncan, 1994, p. 4).
c:\wp\Dr\Avh\Wkb\WkbPict1.doc #6#
TECHNOLOGICALSTRATEGY
ENGINEERINGSTRATEGY
INSTITUTIONAL STRATEGY
R&D STRATEGY
MANUFACTURINGSTRATEGY
MARKETINGSTRATEGY
CORPORATE STRATEGY
BUSINESSSTRATEGY
A
BUSINESSSTRATEGY
C
BUSINESSSTRATEGY
B
R&DPLANNING
R&D.......
R&D........ #899#

31
Turner (1993, p. 8) proposes a definition, according to which a project is an
endeavor in which human, material and financial resources are organized in a
novel way, to undertake a new scope of work, of given specifications, within
constraints of time and cost. The purpose of the project is to achieve beneficial
change by quantitative and qualitative objectives. Projects within organizations
are often divided into several project phases in order to provide better
management control. These project phases are collectively known as the project
life cycle (Duncan, 1996, p. 11). “Projectization” has been defined as the
spreading of project usage into almost all facets of human lives (Lundin 1999,
p. 190). According to Decom (1991, p. 1316) a project passes through five
phases, namely the conception, the definition or design, the realization, the
acceptance and, finally, the operation phase. In order to understand project
management one must first comprehend that which the project manager is
managing. A number of academic explanations have been put forward.
Wysocki et al. (1995, i. Shenhar and Dvir 1996, p. 607632) and Artto (1998, p.
19) specify a project as a sequence of unique, complex, and connected activities
having one goal or purpose or scope and that must be completed by a specific
time, within budget, and according to specification. Turner (1993, p. 5) defines
a project as a onetime unique endeavor by people to do something that has not
been done that way before. He also separates the definition of project from that
of operations saying that projects are unique but operations are repetitive.
Many writers have proposed a variety of typologies to distinguish among
projects. Most of these typologies have classified projects according their level
of change. For example, Blake (1978) suggested a normative distinction
between minor change (alpha) projects, and major change (beta) projects.
Wheelwright and Clark (1992), in a study on inhouse product development
projects, mapped such projects according to the degree of change achieved by

32
their outcome within the company's product portfolio. Their typology included
derivative, platform breakthrough, and R&D projects, and Pinto and Covin
(1989, p. 4962) addressed the differences in success factors between R&D and
construction projects (Shenhar and Dvir, 1996, p. 609). The organization that
undertakes the project is often referred to as the project owner. The project
owner usually acts as the client for project management analysis activities
(Chapman and Ward, 1997, p. 48).
Ansoff includes projects in his development plan that constitutes a part of his
strategic approach to management. The projects make up the Development
Planning part of the Strategic plan. Each project has its time horizon and
duration, and the projects are impermanent. Different projects are often
launched when needed at different times during the year. The projects are
problemfocused, not (business) unitfocused and they usually require
contribution from all key functions of the firm. Each project is disbanded when
its strategic goal is achieved (Ansoff, 1987, p. 226).
Companies often apply a procedure that first generates ideas for building an
idea portfolio, then, as part of the Exploration stage (see Fig. 13) select
appropriate ideas often using some of the evaluation methods available. The
ideas selected this way are then used, during the prototype stage as a base for
R&D projects that are then managed in the more or less conventional way of
project management. Figure (Fig. 13) shows how the level of R&D
expenditures increase sharply throughout the different R&D stages (Wilkinson,
1991, p. 1929). Therefore our model for the Early Detection of Complex
Problems (EDCP) in R&D projects would be useful.

33
Figure 13. Expenditures for R&D during the course of a project (elaboratedfrom Wilkinson 1991)
Based on the definitions by many researchers (e.g., Virkkala, Levitt) a project
may be described as a composition put forward in the Figure 14 below.
Figure 14. Composition of an innovation project (from Virkkala, 1994, p. 30)
Certain needs emerge from customers, users, society and others; the needs form
the basis for an idea. There are a number of possibilities to develop the idea into
NEEDScustomers, users, society...
ABILITIES or POSSIBILITIESpartial systems, components,legal, financial,…known principles#1142#
Innovation Project
Ability todevelop theidea tofunctioningcondition
Usable result
c:\wp\Dr\Avh\Wkb\WkbPict1.doc #7#
EXPENDITURES
Innovation or R&D #900#
Idea Exploration Developmnt Prototype Production Maintenance
c:\wp\Dr\Avh\Wkb\WkbPict1.doc #1#

34
a usable result with the aid of different partial systems that contain known
principles. By applying abilities or possibilities in the form of partial systems,
components, legal, financial and other known principles, the idea can be
developed into a usable result. (Virkkala 1994, p. 30)
For the purpose of management the structure of the concept, the project
boundaries, and the activities are examples of items that must be clarified, as
will also the interrelations between them. The risk diagnosis can be enhanced
by a project presentation that involves identification and description phases
(Halman and Keizer 1994, p. 76). For instance, a define phase is useful for the
purpose to consolidate and elaborate the nature of the project effort in order to
define the project in a form suitable for the rest of the project risk management
process (Chapman and Ward 1997, p. 68) According to Lichtenberg (1989, p.
47) project management has developed in three waves of generations. First
came the manual, highly intuitive Gantt chart based generation. Then followed
the computerized and highly detailed and logical networkbased generation that
disregarded the real world fuzziness, uncertainty as well as human lack of
logic. The third wave was “humanized” and focused on personal management
control and overview. It also involved consensus and flexibility, and it accepted
uncertainty. It applied earlier generation tools to the extent that it served the
above overall goals.
Analysis
Analysis is the separation of a whole into its component parts (Ansell and
Wharton 1992, p. 6) and a statement of the results (Webster, 1999). Problem
detection involves analysis of the circumstances connected to the project.
Ansoff attempted to make a practical analytic framework for strategic or
external decisions of the firm, compromising between mathematical precision

35
and realism in the problem statement. Ansoff argued that the framework that
emerged was "directly usable for solving realworld business problems”
(Ansoff 1965, vii and ix). According to Virkkala, scientific problems, however
are usually analyzed according to the sequence:
preparation
incubation
illumination
verification, proving.
In such a process no functioning entities are produced. The scientific analysis
work is considered to be finished when the evidence is proved (Virkkala 1994,
p.21). The analysis method must be so general that it can fit all firms or must be
such that it can be applied for a certain firm. The method must be so simple that
users are not repelled from it. The evaluation methodology must be simple and
yet cover all aspects, the evaluation could preferably be done in a couple of
sequences. Finally the method must not require more time than what simple
intuition takes for a person to do. The method must also point out items that
shall be improved rather than just reject projects. (Andersson and Laurila 1983,
p. 61)
The evaluation at an early stage must be qualitatively directed but some type of
rating numbers that tell whether to stake or not, can also be used. The output
must be as qualitative as possible, and in some cases a checklist may replace
the output. The method must be useful as a communication aid, and the
communication can be formed into a meeting with a base (agenda) and a
chairman who steers the discussion. It is important to get a wide view in the
opinions, and it is important that the analysis is systematized and that it
analyzes strong and weak sides in the product idea (Andersson and Laurila
1983, p. 191). Time requirement from inauguration to launching of a project

36
must also be judged and comparable to other methods (Andersson and Laurila
1983, p. 86). A reference group is more useful than an evaluator group for
steering the idea for continued work. The composition of the team shall be
crossfunctional with knowledge from marketing, production, product
development, and economy, the team members shall have very little with the
decisions to make, they give opinions. It is good to evaluate the persons who
shall be included in the team. An evaluation method may, besides evaluating,
help the firm to solve important problems by anchoring the project with the co
workers and it may reduce uncertainty during early stages. (Andersson and
Laurila, 1983, p. 108)
The use of computer programs offers a number of advantages in idea
generation processes, text alterations, zooming, grouping of features can be
made, meeting notes are produced automatically. The program may act as a
tutor because guidance features can be integrated into the computer program.
Guidance principles in analysis methods can be grouped into describing and
questioning principles. Explaining guidance describes the operating principles
in general or in detail, questioning guidance contains questions either so that
the method asks the analyzer to present the answer to a question or so that the
analyzer asks the method a question and gets an answer. A typical example of
explaining guidance is manuals for analysis systems that are part of practically
all analysis methods. Another example of explaining guidance occurs in
checking list methods that involve rating according to different scales ranging
from yesno to different numerical or verbal scales. Here the guidance involves
information on the type of answer e.g., yesno, or scale and range of scale
(Andersson and Laurila 1983, p. 124).

37
1.4. Framework
In his general “decision theory” Ansoff referred to Simon's four steps of
problem solving in business: i) perception of decision need or opportunity, ii)
formulation of alternative courses of action, iii) evaluation of the alternatives
for their respective contributions, iv) choice of one or more alternative for
implementation. Perception of need is a major issue in strategic decision
making. Different alternatives will present themselves during the planning
period, and may cause conditions of partial ignorance about future
opportunities. Thus such alternatives need to be evaluated. Ansoff criticizes the
Capital Investment Theory (CIT) for a number of reasons. The CITmethod
does not provide continuing intelligence activity needed for strategic action.
CIT uses longterm profitability over the lifetime of a project as yardstick for
evaluation, but this cannot handle the multiplicity of objectives or the problem
of conflict between them (Ansoff 1987, p.3840). Furthermore, Ansoff
explained that the development of a strategic decision method must handle
allocation of the firm's resources between opportunities in hand and probable
future opportunities under conditions of partial ignorance, and it must evaluate
joint effects (synergy) resulting from addition of new productmarkets to the
firm. The decision method must also single out opportunities with outstanding
competitive advantages, and handle a vector of potentially antagonistic
objectives (Ansoff 1987, p. 23).
Ansoff also described what he calls the adaptive search method for strategy
formulation (Ansoff 1979, p. 6), that is based on a feedback procedure called
cascade. The cascade is a process that searches for the best solution;
information may develop at later stages that cast doubt on earlier decisions. The
procedure within each step of the cascade is similar. First a set of objectives is
established, then the difference (the "gap") between the current position of the

38
firm and the objectives is estimated. Thirdly one or more courses of action
(strategy) is proposed and, finally, these are tested for their "gapreducing
properties." A course is accepted if it substantially closes the gap; if it does not,
new alternatives are tried. (Ansoff 1965, 246, Lintunen 2000, p. 2523). The
research problem that is connected to the question of detecting failure causes
early, obviously it regards a method by which the detection can be done. Such a
method would be related to risk theories because failure causes involve risk.
Business and society make up the environment for many innovation ventures.
The method will consequently also be related to theories regarding business
and society.
Fields of interest will thus include theories of innovation, enterprise, and
knowledge and resources based theories. A study of these fields of theory will
reveal how they link to each other, and these revelations will guide the
development of a method that detects risks of failure early in innovation
ventures that are typical in business and society. In order to become beneficial
for business firms and society in general, the theoretically derived model needs
to be made usable for firms and organizations. An analysis method must be
generated that is based on the model. The generation of such a usable method
will require testing in actual conditions within firms and organizations. This
circumstance brings forward the following question: how shall a usable method
for early detection of risks in innovation be created, which techniques ought to
be used? The outcomes of the testing can be made to influence the further
development of the model and thus generate an interactive process for the
method development. Such a process can be managed to proceed in stages via
successive phases towards a final practically usable analysis method. As a side
effect the firms and organizations that take part in the testing will act as pilot
firms and they may benefit from the outcomes of the test through the analysis
results that the model produces.

39
The work involved the study of the literature. A theoretical structure of an ideal
model for early detection of risks in innovation ventures will then be derived
based on the literature. This theoretical model will then be gradually refined to
form a practically usable method through interactive cooperation with pilot
firms in analyses with their actual innovation ventures.
Figure 14 illustrates the main groups of theories that relate to a method for
definition of failure risks in innovations.
Figure 15. Theories that relate to a Method for Definition of Failure Risks inInnovations (Ex Ante model).
This work first presents in Chapter 1 those parts of innovation and risk
management literature, as well as their relations that pertain to the development
of a model for early detection of risk in innovation projects. From the relevant
literature were found items that constitute a model for early detection of risks in
innovation projects. In Chapter 2 current methods for the analysis of innovative
projects and for risk analysis in projects are presented as well as some methods
for idea generation. Shortcomings in these methods are presented as voids in
the field of risk detection in innovative projects. Chapters 1. and 2. are based on
Model for early detection ofrisks in innovations
Risk and project management
Ansoffian and Schumpeterian view of Innovation
Penrose’s and Nonaka’s views Knowledge andresource based management theories #1866#

40
findings from the literature study. Then the theoretical findings from the
literature were used for the construction of a theorybased model for early risk
detection in innovative projects (exante model). This part is described in
Chapter 3. Finally, the linkage of the above mentioned theories into a model for
early detection of risks in innovation are described in Chapter 4, the empirical
work.
1.5. Research Method
The selected viewpoints are those of the management of the innovative firm
and the viewpoint of the model developer or analyst who will develop the
analysis system. Furthermore, the knowledge of the management of
contributing firms will benefit from the outcomes of the development process
to construct an expost model. The framework will be based on the scientific
discussions around the concepts: innovation theory and risk management. It
also involves the management and analysis of projects. Furthermore the
reference framework is based on the discussion in the fields of learning, of
information transfer into and out of the model (interface, presentation) and of
information transfer inside the model (guidance and computing). The research
problem is to construct a model for early detection of problems in innovation
projects and to create an analysis method based in this model that can be
applied in innovation projects in firms.
An appropriate way to structure this work, which consists of a constructive
model building, is to relate the work to both theory and praxis. The work will
be structured into four main parts of which the first two deal with theoretical
aspects, and the third with practical development and application and, finally,
the fourth part compares the theoretical aspects and the findings from the
practical work. Figure 16 illustrates this structure. #1888#

41
Figure 16. Illustration of the Structure of this Work.
The introduction, part (1), starts at the theory level and considers the literature
study of existing theoretical background, and thus presents the fundamental
theoretical base for the research work. The introduction is followed by a
theoretical study based on the literature investigation of methods. Then follows
the constructmaking process, part (2), that produces the ex ante model that is
based on the theoretical facts. After this follows the description of the
development of a practically usable analysis method based on the ideal model.
This development was continued in interaction with a number of pilot firms
that provided real projects for analysis, and in the praxis level the model was
developed into an analysis model in analyses of pilot firms’ projects and in
other practical activities (3). The practical work resulted in an interactive model
of an analysis method. Finally, in the fourth part the summary and discussion
(4) brings the work back to the theory level where the practical findings are
related to statements from theory.
The study was done as a constructive multicase research, qualitative as well as
quantitative material was used (Kasanen et al. 1991). According to Kasanen et
al. the construct is defined as an entity that gives the solution to some explicit
problem. The development of a construct consists of problem solving that
results in something clearly new and divergent compared to the earlier known
Theory
Praxis
Ex antemodel
Ex postmodel1
Introduction
theoretical backgrounddiscovering of voids
2Construct
Constructive
modelling
Indu
ctiv
em
odel
3Pilot cases etc. #1889#
4Summary, Discussion
c:\wp\Dr\Wbook\WkbPict1.doc #12#

42
e.g., by building a model, a diagram, a plan, an organization, or a machine. The
problem ought to be connected to earlier knowledge, another specific property
of the construct is that its function and newness must be verified. Kasanen et al.
also consider constructive research as a form of applicable research that
generates such new knowledge that aims at some application or purpose
(Kasanen et al., 1991, p. 302304). This view places constructive research in a
central position surrounded by fundamental research, scientific problem
solving, technology, and consulting (Kasanen et al., 1991, p. 303). When
reporting constructive research answers must be presented about the intention
of the constructive research, about where in the methodological field of
business science the research is located, and about under which conditions the
research can produce scientific knowledge (Kasanen et al., p. 304). Within the
fourfield of conceptanalytic, decisionmethodological, actionanalytic, and
nomotetic research grips (Kasanen et al., 1991, p. 315) constructive research is
placed connected to the decisionmethodological and actionanalytical research
grips, in the combined normative and empirical field, (Kasanen et al. 1991, p.
317).
In practice constructive research work can be divided into specific sequences
(Kasanen et al., 1991, p. 306) e. g.,
1. problemfinding
2. prestudy of the research area
3. innovationstage, model construction
4. testing of the model and demonstration of its rightness
5. demonstration of the connections to theory and the scientific newness
6. verification of the area of application for the model.
The constructive research work often first proceeds stagewise (stages 1. 3.
above), then follows reliability testing (stage 3. above), and finally verification

43
of the model (stages 5. – 6.above) (Kasanen, et al. 1991, p. 320). In an
analytical study on how expert knowledge could be relevant for foresight on
innovations Kuusi (1999, p. 231) concludes that a study can have its “practical
side” and its “theoretical side”. He is also of the opinion that it is impossible to
develop the practical side without good background theories. However, Kuusi
states, one must not trust nice theories too much.

44
2. Methods for Generation and for Analysis in Innovation Projects
2.1 Methods for Risk Analysis and Risk Management
Risk management requires a risk analysis to answer different questions and the
analysis method must possess a number of qualities. Halman and Keizer (1994,
p. 7576) developed the Risk Diagnosis and Management (RDM) method at the
Philips corporation, and it represents an example of the outline for a risk
analysis method. It was developed to be executed by a project consultant and
by the project management, and to be carried out by a risk team. The key
assumptions for the use of a risk analysis process are exemplified by Chapman
and Ward (1997, p. 67) in their description of the formal risk management
process (RMP). This process can be applied at all steps of a project cycle by
clients, by contractors and by other parties associated with a project. Chapman
and Ward (1997, p. 80), when pondering the considerations for risk analysis,
suggest considering the risk management action as a project in its own right.
Ansell and Wharton (1992, p. 207208) describe experiences from risk
management in connection with offshore North Sea projects. They list
necessary constituents for models and they point out that the implications of the
use of the model must be understood in detail. In his description of an idea
generating program Virkkala (1994, p. 219) presents an outline of evaluation
criteria that enhance the development of innovative ideas and promotes their
acceptance in organizations simultaneously with guidance towards appropriate
criticalness. When dealing with the key assumptions for a risk analysis process
Chapman and Ward (1997, p. 3738) observe that risk analysis can serve
separate roles in relation to tradeoffs between risks and expected performance.
They also mention (on p. 9596) two tasks to do (search and classify) and other

45
actions to avoid in risk analysis processes. Finally they point out (on p. 83) the
key players in the focusing phase of the analysis.
Some required qualities mentioned by these writers are condensed in Table 21.
The table discerns the requirements for, and the qualities of a risk management
method. Eight requirements are listed and between two and seven qualities for
each requirement. The table gives an overview of the most important
considerations for risk management in an organization. The content of the table
is also supported by Ansoff’s reference to decision theory, particularly by the
considerations for risk analysis and by the outline of analysis criteria. The
essential purpose of risk management is to improve project performance via
systematic identification, appraisal and management of projectrelated risk
(Chapman and Ward 1997, p. 9).
Ansoff’s methods contain several constituents that are applicable in a risk
analysis method for innovation projects i.e., Simon’s four steps, resource
allocation, vectors of antagonistic objectives, and constituents of the cascade
process. Successful risk management requires linked and integrated models, it
needs expertise and also special skills. Risk perception is recognized as the first
step in risk analysis (Ansell and Wharton 1992, p. 37). Once the potential
technological, organizational and commercial risk factors have been identified,
the focus in the riskdiagnosing process changes from identification to
valuation of the projectrisks (Halman and Keizer 1994, p. 77). This can be
considered as a part of the “gap”reducing steps in the cascade process of
Ansoff.
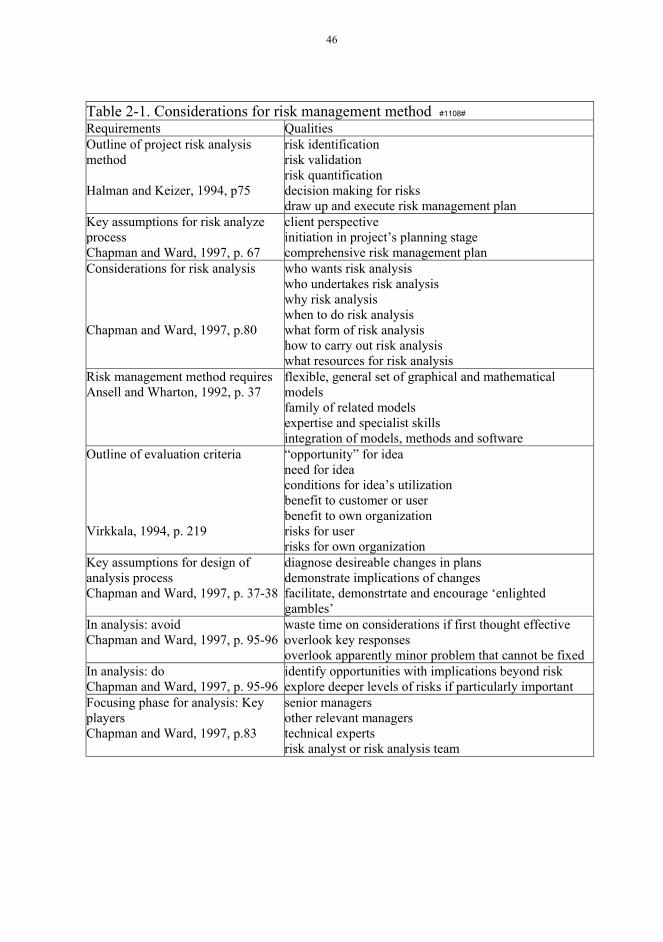
46
Table 21. Considerations for risk management method #1108#
Requirements QualitiesOutline of project risk analysismethod
Halman and Keizer, 1994, p75
risk identificationrisk validationrisk quantificationdecision making for risksdraw up and execute risk management plan
Key assumptions for risk analyzeprocessChapman and Ward, 1997, p. 67
client perspectiveinitiation in project’s planning stagecomprehensive risk management plan
Considerations for risk analysis
Chapman and Ward, 1997, p.80
who wants risk analysiswho undertakes risk analysiswhy risk analysiswhen to do risk analysiswhat form of risk analysishow to carry out risk analysiswhat resources for risk analysis
Risk management method requiresAnsell and Wharton, 1992, p. 37
flexible, general set of graphical and mathematicalmodelsfamily of related modelsexpertise and specialist skillsintegration of models, methods and software
Outline of evaluation criteria
Virkkala, 1994, p. 219
“opportunity” for ideaneed for ideaconditions for idea’s utilizationbenefit to customer or userbenefit to own organizationrisks for userrisks for own organization
Key assumptions for design ofanalysis processChapman and Ward, 1997, p. 3738
diagnose desireable changes in plansdemonstrate implications of changesfacilitate, demonstrtate and encourage ‘enlightedgambles’
In analysis: avoidChapman and Ward, 1997, p. 9596
waste time on considerations if first thought effectiveoverlook key responsesoverlook apparently minor problem that cannot be fixed
In analysis: doChapman and Ward, 1997, p. 9596
identify opportunities with implications beyond riskexplore deeper levels of risks if particularly important
Focusing phase for analysis: KeyplayersChapman and Ward, 1997, p.83
senior managersother relevant managerstechnical expertsrisk analyst or risk analysis team
47
A common feature of brainstorm sessions is that the members are suggested to
let their ideas flow freely without allowing critique or any other hampering
activity during the session (Osborn 1965, p. 176179). Consultants can have a
very important role in the implementation of risk management processes and
the execution of specific studies. Most organizations cannot effectively self
start in this area. However, project managers and project teams more generally
cannot simply buy a risk analysis from a consultant, nor should they attempt to
do so (Chapman and Ward 1997, p. 92). In most methods, a lot of time is spent
in groupsessions to identify the risks of a project. In groupsessions negative
group effects are likely to occur. In a group differences between the
participants in terms of seniority and reputation can, not necessarily explicitly,
severely disturb the free exchange of thoughts and ideas about what can go
wrong in a project. In order to prevent the group effects e.g., in the Risk
Diagnosis and Management (RDM) method, the members of the risk analysis
team are individually interviewed to determine potential factors (Halman and
Keizer 1994, p. 7980). Consultants can also have a “neutralizing effect in
sessions”.
2.2. Description of Project Analysis Methods
For the purpose of this work a typifying according to use and function seems
most appropriate. It is presented in Table 22 and it will be used in the
following description of methods found in the literature search. However, many
analysis methods cannot be unambiguously assigned to one certain method type
because simultaneously they have properties that are characteristic of several
types. Primary requirements are that the method is easy to use and to
understand for the users, it must be flexible, fast and selective. The method

48
must further analyze strengths and weaknesses in the project, it must counteract
locking in the work and it must project the prerequisites of the project. The
method shall also make possible steering, adjustments and reformulations of
the project.(Andersson and Laurila 1983, p. 57)
Table 22. Typification of project analysis methods #1557#
Decision theoretical methods
Check list
Profile scheme
Ranging methods
Klustest
Design reviews
Idemap
Project management methods
Program evaluation and review technique (PERT)
Graphical evaluation and review technique (GERT)
Program evaluation and review technique (SCERT)
Quality Function Deployment 1 stage (QFD1)
Quality Function Deployment 2 stage QFD2
Quality Function Deployment 3 stage QFD3
Quality Function Deployment 4 stage QFD4
Risk Management methods
Fault modes and effect analysis (FMEA)
Fault modes, effect and criticality an. (FMECA)
Risk evaluation
Iderisk
Fault tree
Econometric models
Profitability methods
Index methods
Operation Analysis
Mathematical programming
methods
A number of analysis methods for innovation projects are described in the
literature, we have typified them as shown in Table 22. Some of them will be
shortly described below. First will be presented decision theoretical methods,
then risk directed methods, and finally project management methods. Analysis
for innovation projects has additional requirements compared to general project
analysis. It must consider the important constituents of innovation and
innovation management, such as new combinations, entrepreneurship,
entepreneurial leadership, creative destruction or renewal, and strategy.
Qualitative evaluation is based on knowledge, experience and intuition.
49
Methods based on decision theory in descriptive form are often used for this
purpose. Quantitative methods involve a judgment based on calculations, and
they produce some sort of numerical values. (Andersson and Laurila 1983, p. 8)
Many of the evaluation methods are directed towards analysis of risk. Within
both of the groups mentioned above representatives of the different structural
types can be found.
In the following paragraph are descriptions of decision theoretical methods,
risk management methods, project management methods, and econometric
methods.
Decision theory methods often consist of a number of criteria of dimensions by
the means of which ideas or project suggestions are evaluated. The evaluation
can be qualitative, quantitative or a combination of these. Risk management
methods focus on finding risk within projects, and on managing these risks.
Project management methods deal with aspects regarding management of
projects.
Econometric methods are used to measure the economy for something. They
are based on assessment of future incomes and costs and they may be combined
with some sort of risk or unsafety analysis (Andersson and Laurila 1983, p. 22
24).
The firm must see the evaluation process as a component of a larger system that
can be called the product development process. This is a prerequisite for the
idea evaluation to function effectively in the firm. In analysis of the
performance of a project, e.g., of an R&D project it is important to define
clearly what aspect of the performance will be dealt with in the analysis and
define the levels and units of the analysis. Andersson and Laurila conclude that

50
the type of method to select depends on the stage of the project at the time for
evaluation. They refer to Albala who says that “the tool must fit the need”.
Thus the following table of stages and methods (Table 23):
Table 23. Table of stages and methods #2079#
Idea stage checking lists
Pre study stage profile or ranking methods
development stage Econometric methods and index
methods
commercialization stage economic evaluation, sensitivity
analysis
(from Andersson and Laurila, 1983, p. 4849).
2.2.1. Decision Theoretical Analyses
Andersson and Laurila (1983, p. 2224) refer to certain analysis methods as
decision theoretical methods, and they state that these methods are based on
decision theory. Examples of these models are checking lists, ranging methods,
the KlusTest, design reviews, Fluvius and Idemap methods.
Checking lists include
· checking list
· profile scheme
· Idemap
Checking list
A number of questions are posted. They can be answered according to different
scales ranging from yesno to different numerical or verbal scales. Checking
lists may also be used successively according to scales that gradually become
more requiring (Andersson and Laurila 1983, p. 122). These questions often

51
appear in standardized question lists, this makes the method quite inflexible.
The outcome of the analysis may become dependent on whether an appropriate
list has been selected.
Profile scheme
A profile scheme can be defined as a structured checklist, each factor is
assigned a value on a scale. The values are presented visually as a profile line.
A profile scheme is an explanation in order to guarantee a fair comparison for
the different projects in a project evaluation process. The factors can be divided
into different groups e.g., marketrelated, technical etc. The advantages of
profile schemes are assurance that the most important aspects of the project are
regarded, profile schemes point out the strong and weak sides of the project and
they offer discussion bases as aids for decisionmaking. The method gives an
average of subjective evaluations, this is regarded as a disadvantage. Andersson
and Laurila refer to experiences in which profile schemes have been
successfully used as discussion bases for decision making and as prioritizing
instruments in the evaluation work (Andersson and Laurila 1983, p. 124).
Ranging methods
Ranging methods pass judgment on products and project ideas according to a
number of factors that have significance for the selection and evaluation. The
number of factors must be limited mainly to critical factors. Then a value scale
for each factor is decided. It can be either numerical or verbal (Andersson and
Laurila, 1983, p. 127129).
KlusTest
The KlusTest was developed by John Klus of the University of Wisconsin
under an industry supported grant. It is a wholly computer based decision
support tool providing expert diagnostic information for new product
evaluation. The software tool provides a structured procedure for “concept”

52
stage product evaluation where uncertainty is high. The program has the
following functions:
assists product evaluators
identifies contributing factors to product success
provides consultation rather than specific recommendations
develops an understanding of the company’s success and failure
characteristics
The KlusTest evaluation tool incorporates multiple methodologies, identifying
critical issues that contribute to making the overall evaluation decision. A
company knowledge base is created from the three existing models that
comprise the KlusTest:
ProCon Evaluation model, a product screening model that combines the
opinions of multiple evaluators; ProCon is based on an internal database of
industry wide success parameters arranged much like a preset questions list
Market/Technology Analysis tool that profiles the newness of the market
and technology to the firm as a graphics presentation. It also details the
course of action that the firm ought to take
Competitive Advantage Ratings instrument that examines the relative
protectability of the product concept. It is arranged around a number of pre
set questions
This test produces a diagnostic recommendation, but does not produce the
complete answer. It presents more information within a systematic framework
to better understand the relationships between market, technology, business and
competitive advantage factors within the context of the companyspecific
considerations in determining product success. However, it involves no
creativity, it does not allow item combinations or interinfluence analysis.
Klustest is composed of 63 preset questions that are answered by rating on a

53
scale 110, that makes it inflexible. Once the analysis is performed the
computer program does not allow any adjustments without performing the
whole analysis from the beginning. The test is to be operated on one, or several
computers. Each evaluator answers questions displayed on the screen. When all
evaluators have responded, all data can be consolidated on one computer for
generating the analysis. The final report is produced to a disk file and can also
be printed. The KlusTest program is recommended at the concept stage but it
may also be used at other stages of the development cycle. Company specific
advantages of the test are that the opinions are reviewed within a standard
framework and that company knowledge and experience is retained in the
database after the company “experts” have left the organization. KlusTest also
acts as a “learning tool” to help new srtaff develop experience faster. (KlusTest
home page 1996, private discussions with John Klus, May 2000)
Design reviews
The principal objective of a design review program is to ensure that the
requirements of the product are correct and will be met, and will result in a
reliable, useful and saleable product.
Particularly the design review process is designed to ensure:
the product meets specified requirements costeffectively
the product satisfies customer needs
the product and its elements can be safely and economically analyzed
required design, manufacturing and installation methods are being used
costs have been optimized after considering all product requirements
scheduling considerations are taken into account
components are used within their specified performance and stress ratings
Design review facilitates assessment of the status of the design. It identifies
weaknesses and guides the project team toward appropriate corrective action.

54
It further accelerates maturing of the product or process by reducing the time
needed to stabilize design details, and allows production to proceed without
frequent interruptions. Design review also stimulates early improvement of the
product (CEI IEC 1160 1992, p. 15).
There are different design reviews that depend on the stage of the project (CEI
IEC 1160 1992, p. 13):
· preliminary design review
· detailed design review
· final design review
· manufacturing design review
· installation design review
· use design review
Design reviews are separate from planning and scheduling reviews. They
should complete one another. The persons executing a design review are
assigned clearly specified task jobs to perform during the analysis process. The
task jobs include chairman, secretary and a number of specialists. A project
manager should not conduct Design reviews. Consequently, the chairperson
should consult the project manager to plan and schedule design review
activities of the project. Design reviews should be conducted just before taking
major decisions, which may prove costly, timeconsuming, or difficult to
reverse. (CEI IEC 1160 1992, p. 27)
Design review facilitates assessment of the status of the design, it identifies
weaknesses and guides the project team toward appropriate corrective action.
It accelerates maturing of the product or process by reducing the time needed to
stabilize design details, and allows production to proceed without frequent
interruptions. Design review also stimulates early product improvement (CEI
IEC 1160 1992, p. 13). Another analysis method is the formal design review, a
formal and independent examination of an existing or proposed design for the

55
purpose of detection and remedy of deficiencies in the requirements and the
design which could affect such things as reliability performance,
maintainability performance maintenance support performance requirements,
fitness for the purpose and the identification of potential improvements (CEI
IEC 1160 1992, p. 9).
Fluvius
Fluvius is a program that has been developed particularly for teamwork. In this
program the use of a distant thought model has the central part. This program
also includes idea evaluation with weighted rating points and it calculates the
correlations between ratings made by different evaluators. The use of this
program is rather time consuming partly because of the evaluation process.
Normally the analysis of one problem requires two full workdays. (Virkkala
1994, p. 217)
Idemap
The program Idemap enhances the formation of a total mapping of a problem
situation. The problem situation is described, the pertaining facts as well as
opinions, visions or wishes are listed, a number of alternative ways of
approaching the problem are suggested. Based on these items a number of ideas
are generated and evaluated. The program contains forms to guide the analyzers
in their work. Each object of mapping is written in two forms, as a short
summary and as a larger presentation. This helps the analyzers to apply a
distant view as well as a detailed view of the problem. Idemap is, in the first
hand, intended for the guidance of innovation projects to a better direction at
the early stage. A computer combined with a projector is used in teamwork
sessions. (Virkkala 1994, p. 218)

56
2.2.2. Nonfinancial Risk Management Methods
Risk management process (RMP) can be considered a collective name for
certain methods. The methods are characterized by certain properties. RMPs
are highly structured, but they do not imply a rigid 'paint by numbers' approach.
The process ought to stimulate Creativity, lateral thinking and imagination, and
not discourage. RMPs are, in many important respects, largely a formalization
of the common sense that project managers have applied for centuries. RMP is
not a new way of thinking, or the engine of an intellectual revolution, which
requires a significant change in mindset to be appreciated (Chapman and Ward
1997, p. 64). Risk management methods will include verbal, graphical and
mathematical models; often several models will combine one method. Different
models frequently need to be linked together by means of computer programs.
Risk management processes further require expertise and specialist skills and
the experience in leadership.
Undertaking risk management is a highrisk project in itself, especially if
embedding effective risk management in the organization as well as in the
project in question is the objective (Chapman and Ward 1997, p. 93). The
formalization involved in RMPs is a central part of the communication
processes involved. The level and kind of communication RMP can generate
can lead to significant culture complex and fundamental changes within
organizations. Because RMPs can be concerned with very complex issues, it is
very important to have “keep it simple” as a guiding principle, adding
complication only when benefit from doing so is perceived. The iterative nature
of RMP is central to 'keeping it simple', using early passes of the process to
identify the areas that need more detailed assessment in later passes (Chapman
and Ward 1997, p. 64). In this respect the RMPs remind one of Ansoff’s
cascade process (Ansoff 1965, 246).

57
Failure mode analyses
A failure mode is the effect by which a failure is observed in a system
component
There are two common ways of classifying failure modes:
a) identification of general failure modes, as derived from the definition of
reliabily
b) by listing, as completely as possible, all generic failure modes
The most important failure modes are common mode failure (CMF), human
factors and software errors (FMEA 1985, p 19).
The Fault Modes and Effects Analysis (FMEA) investigates for every
component the consequences of all defined modes of failure. The investigation
is usually carried out for each component in isolation from the analysis of other
components, since if combinations were considered the task would become
intractable. This analysis method has the drawback that specific combinations
of basic events or component failures, which may cause failure of a system,
may be overlooked. The outcome of the study will usually be a report for each
component giving details of failure modes, consequences and, where
appropriate, action to be taken (Ansell and Wharton 1992, p. 109). This limits
the use of the FMEA method predominately to analysis of products. Examples
are material and equipment failures and categories of systems based on
different technologies (electrical, mechanical, hydraulic, etc.), and
combinations of technologies. FMEA is extremely efficient when it is applied
to the analysis of the elements that cause a failure of the entire system (FMEA
1985, p13). FMEA may also be used for the study of software and human
performance (FMEA 1985, p9). Marketing or administration issues cannot
easily be analyzed (Ansell and Wharton 1992, p. 109). FMEA and other system
reliability and availability analyses may be combined within a project, or
FMEA (or FMECA) can be used alone. FMEA is often used to complement

58
other approaches, especially deductive ones, because it is systematic. At the
design stage both inductive and deductive approaches are combined in
processes of thought and analysis. For risk identification in industrial systems
the inductive approach is preferred and therefore FMEA is an essential design
tool. It is recommended to supplement FMEA with other methods e.g., where
multiple failures and sequential effects must be studied (FMEA 1985, p 23).
However, FMEA may be difficult and tedious for the case of complex systems
that have multiple functions consisting of a number of components. This is
because of the quantity of detailed system information that must be considered.
This difficulty can be increased by the number of possible operating modes, as
well as by considerations of the repair and maintenance policies (FMEA 1985,
p 13). A logical extension of the FMEA is the consideration of the criticality
and probability of occurrence of the failure mode. This criticality analysis of
the identified failure modes is widely known as FMECA (Fault Modes, Effects
and Criticality Analysis)(FMEA 1985, p 9).
Risk diagnostics methods
A frequently used method is the Risk Diagnosis & Management method
(RDM). This method consists of four parts: project identification, validation of
project risks, decision making for diagnosed risks and executing a risk
management plan. The purpose of a risk diagnosis is to detect those factors that
may jeopardize the successful realization of the project objectives. In product
innovation projects, these risks can be differentiated in terms of their
technological, organizational and commercial factors. Specific to the approach
in the Risk Diagnosis & Management Method (RDM) is the focus on the
detection of gaps between available and required technological, organizational
and commercial knowledge, skills and experiences. A specific virtue is also,
that in RDM data is gathered by the projectconsultant, so that he individually
interviews the members of the risk team. The RDM is so far perceived as being

59
a valuable tool to detect the key risks in technologically complex product
innovation projects. The assumption is made in RDM that the impact of a risk
not only depends on the likelihood of its occurrence but also of the ability or
the inability to influence the situation. The impact does not either depend on the
consequences of occurred risk. Thus Halman and Keizer (1994, p. 7679)
characterized risky activities by:
· The likelihood of it occurring is great
· The ability to influence the course of action is small
· The potential consequences are severe
The Risk Diagnosis & Management (RDM) method also diagnoses possibly
desirable changes in plans, demonstrates the implications of such changes in
plans and facilitates, demonstrates and encourages ‘enlightened gambles’
(Chapman and Ward 1997, p. 3738).
Iderisk
Iderisk is a program for minimizing risks in innovation projects. It is based on
an analysis of propensity to disturbances, i.e., potential problem analysis. The
team should include external experts. The program guides the team to firstly
ponder systematically which disturbance might occur in connection to the idea,
secondly how each disturbance could be avoided and, thirdly how to prepare
the salvation of the situation should the disturbance appear. The program is
computer based, and it lists the possible disturbances; the likelihood and the
seriousness of each disturbance is rated on a numerical scale, the means to
avoid the disturbance is rated on a numerical scale and, finally the ways of
salvation are listed. The computer program makes changes in the texts easy, it
automatically presents a document and it makes it easy to continue the meeting
after a break or after the project has proceeded and new situations occur. The

60
program further offers a Helpfunction that provides the analyzers with advice
on how to proceed in the analysis. Iderisk also attempts to record cases in
which it is particularly important to continue to create ideas for remedies and
preservations. (Virkkala 1994, p. 219)
Faulttree and event tree analysis
Two common approaches used in a systemfailure analysis context, namely
Faulttree analysis and Eventtree analysis (Chapman and Ward 1997, p. 136).
Fussell pioneered Faulttree analyses. It produces a description of the
relationship between the set of basic events and some specified top event. The
top event is the event of interest, in a risk analysis it would be the particular
risk under study. Starting with this risk, the next stage would be to explore
how the event could have arisen from contributing events (Fussell 1976, p. 133
162). Event tree analysis involves identifying a sequence of events that could
follow from the occurrence of particular risk driver configurations, and
representing the possible scenarios in a tree diagram where each branch
represents an alternative possibility (Chapman and Ward 1997, p. 136). Event
tree analysis is often used in project planning activities that do not necessarily
involve risk analysis.
2.2.3. Project Management Methods
Activity planning methods
Several methods have been presented for use in project planning and control.
The most known are the critical path method (CPM), the program evaluation
and review technique (PERT), the graphic evaluation and review technique
(GERT) and the Gantt chart. According to Elmaghraby (1983, p. 2657)
numerous computer programs are available for application of these methods.
Analysis can be made for possible project overruns and accelerations.
Silverberg (1991, p.4649) presents a graphical process to predict R&D project

61
events and assign error bars to the predictions. The process is based on the
same basic presumptions as GERT, i.e., projection from past events. The
prediction dates of the key project milestones, like first product ship date,
against the date of projection (Figure 21). A very important element of the
graph is the completion line where the predicted date of completion equals the
actual date of completion. Wellmanaged projects approach the completion line
horizontally, i.e., they do not change their schedules. Poorly behaving projects
approach erratically or nearly parallel to the completion line for long periods of
time. One notable feature is a kink that can often be detected in the line for
some projects, e.g., Project 2 in Figure 21.
The project planning team may provide a highrisk environment for risk
analysis because e.g., if project management is ineffective. The project team
members may not be familiar with effective project risk management
processes, are familiar with inappropriate risk management processes, come
from very difficult cultures or they come from competing organizations or
Figure 21. Prediction of project completion (Silverberg 1991).
Date of Prediction
Pred
icte
d C
ompl
etio
n D
ate
mar
jan
nov
sep
jul
may
mar
jan
nov
sep
jul
may
marmar may jul sep nov jan mar may jul nov jan mar may jul nov jan mar may jul nov jan mar may
Project 2
Project
CompletionLine #1164#
Prob
lem
s
c:\wp\Dr\Avh\Wkb\WkbPict1.doc #2##1164

62
departments (Chapman and Ward 1997, p. 93). The EDCP must therefore also
examine the analysis team.
The simplest project activity planning models, which explicitly consider risk
are PERT (Programme Evaluation and Review Technique) models. They
portray project activity structure via an activityonarrow or activity –onnode
diagram representing precedence constraints and uncertainty associated with
the duration of each activity directly via a probability distribution, which may
be pictured as a cumulative probability curve. First introduced in the late 1950s
(Moder and Philips, 1970), these models are still the basis of much of the
current project risk management. A key shortcoming of basic PERT models is
the assumption that activity probability distributions are independent, both
causally and statistically. PERT estimates time requirement of project
activities. However, it does not consider the state of the project system nor does
it address the transition between time periods. PERT did not consider risk.
A second shortcoming of basic PERT models is the need for direct estimates of
how long an activity will take. Some further developments were made to
overcome the shortcomings.
The shortcomings of PERT were recognized and partly resolved as part of the
GERT (Graphical Evaluation and Review Technique) approach. It uses a
Markov or semiMarkov process model, which can be embedded in a
generalized PERT model. In a Markovian process one probability distribution
defines the ‘state’ the system is in (how much of the activity has been
completed) and another defines the ‘transitions’ between time periods (activity
rates of progress) that are used to upgrade the ‘state’. Graphical PERT or
GERT defines the state of the project system as well as the transitions between
different time periods. Synergistic PERT or SCERT involves a fault tree or
event tree model embedded in a GERT model. The shortcoming of GERT is the

63
need to understand the nature of the risk realized before considering effective
responses. The shortcoming of the need to understand the nature of the risk
realized before considering effective responses was recognized and resolved in
the mid 1970s as part of the SCERT (Synergistic Contingency Evaluation and
Review Technique) approach (Chapman 1979, in Chapman and Ward 1997).
The SCERT approach involves a fault tree or event tree model embedded in a
GERT model (Chapman and Ward 1997, p. 8991).
Quality Function Deployment (QFD) consists of a series of four different
analyses of which QFD1 focuses on the concept. QFD2 focuses on product
structure, QFD3 on the production process, and QFD4 on production. The
analyses depend on each other in a consecutive way. QFD is characterized as a
fairly simple tool, but it requires processing of quite large amounts of data.
(Turunen 1991, p. 2122) A comprehensive analysis of a project requires all
four analyses and means a time consuming work.
The use of a QFDapproach links customers to engineering and manufacturing
decisions so that products can be manufactured efficiently and exactly. By
linking houses, the newproduct team assures that the voice of the customer is
deployed through to manufacturing. Some organizations find QFD overall
formal and burdensome. This may be true because construction of a set of
houses for QFD can take a tremendous amount of time (Urban and Hauser
1993, p. 347348). The advantage of the House of Quality is that it displays the
key information that the new product team needs for a successful design. By
making this information explicit it removes hidden agendas and helps the team
avoid unnecessary mistakes (Urban and Hauser 1993, p. 347348). By various
claims QFD has reduced design time by 40% and design costs by 60% while
maintaining or enhancing the quality of the design (Hauser and Clausing 1988
in Urban and Hauser 1993, p. 340).

64
Figure 22. The House of Quality.
Technical difficultyImputed importance (%)Estimated cost (%)Targets
+ + + + + ++ ++ ++ ++
+ + ++ ++ +
ftlb lb lb ftlb lb lb/ft dbpsl
1 4 1 2 6 10 18 3 .10 35
8 5 4 2 7 4 . 3 2 2 4 5 1 1 3 1 .3 3 54 5 1 1 3 1 3 3 5 9 2 6 5 8 3 3 7 1
8 4 2 2 9 1 6 6 9 2
Easy close from outside 7Stays open on hill 5Easy open from outside 3Doesn’t kick open 3
Doesn’t leak in rain 3No road noise 2
Measurement units Our car door A’s car door B’s car door
Easy
to
close
Ceck
force
slop
Peak
clos
force
Easy
to
close
Acoust
trsm
window
Door
seal
resist
Road
noise
reduc
Water
resistance
Check
force
level
Relative importance
ENGINEERINGCHARACTERISTICS
CUSTOMERATTRIBUTES
Relationships++ strong positive+ medium positive medium negative strong negativeCustomer perceptions<1 2 3 4 5>our ABBourA our B
A
AourB B A
our
our = our carA = A’s carB = B’s car
c:\wp\Dr\Avh\Wkb\#901#
Easytoopen&Isolation
Objectivemeasure
Openclose effort Sealinginsulation
+ + ++ +
+
© Mikael Epstein 2001

65
The linking of Customer Needs to Engineering Characteristics marks the House
of Quality Approach. One convenient diagram to help in linking engineering
variables to the detailed customer needs is shown in Figure 22. Because of the
distinctive shape it is called the "House of Quality." The interfunctional team
i.e., marketing, engineering, R&D, production and so on puts the house
together. (Urban and Hauser 1993, p. 340) The House of Quality links the
"whats," the customer needs, to the "hows," the engineering characteristics.
The following task is to take the engineering characteristics as the "whats", and
link them to another set of "hows"parts characteristics or product features.
Thus a repetitive changing of the “how” to “what” produces an analysis chain
(Turunen 1991, p. 33). One approach to this task is to us the house diagram
gain, but in a revised manner. The engineering characteristics become the rows
of the next house, while parts characteristics become the columns as shown in
Figure 23 (Urban and Hauser 1993, p. 347348).
Figure 23. The four stages of QFD are linked together by repetitive changefrom the “how” to the “what” when transferring from one House of Quality tothe next.
HOUSEOF QUALITY
PARTSDEPARTMENT
PROCESSPLANNING
PRODUCTIONPLANNING
Productionrequirements
Key processoperations
Partscharacteristics
Engineeringcharacteristics
I II III IV
Customerattributes
Engineeri
ngcharacteristics
Partscharacterisrics
Keyproce
ssoperations
c:\wp\Dr\Avh\Wkb\WkbPict1.doc #1560#

66
Econometric models
Over the years a large number of econometric evaluation methods have been
developed. Econometric models are primarily used to evaluate projects. They
do not focus on risk, but risks may become apparent through indications of low
economic performance. They include commercial estimation, as well as
technical and financial estimations. A common property for most econometric
methods is that they involve various degrees of calculation work, but some
basical factor must be estimated. Often this estimated factor has a big,
sometimes decisive impact on the analysis result. Econometric methods
consider the time factor separately, they are simple to use, they can be
combined with risk evaluation and they can give an indication of the sales
volume for breakeven. However, the econometric methods do not consider non
quantifiable factors, they require information that is difficult to obtain at early
stages and they cannot consider multiples of evaluation dimensions
simultaneously. They do not optimize or maximize. They produce numerical
values that can steer the thinking. Econometric methods express the output as
one single value and they are suitable for use at later stages. (Andersson and
Laurila 1983, p. 27) Econometric methods involve calculation work, based on
data that may be difficult to obtain at early project stage. Therefore some basic
factors must be estimated, and they often have a big impact on the analysis
result. Literature offers at least 14 different econometric methods.
Econometeric models use concepts and methods from accounting. A number of
econometric methods are listed in Appendix 1.
Operation analysis method
Operational analysis models are often based on exact economical data that is
difficult to obtain at an early stage. Operation analysis methods are based on
mathematical program models. They consider the time factor as well as
multiples of evaluation dimensions simultaneously. They consider resource
limitations and they allow testing of several strategies. However, operation

67
analysis methods require hardtoget data, they are costly, they put high
demand on the user and they require a computer. Operation analysis methods
have the advantage that they consider the time factor separately, they consider
multiples of evaluation dimensions simultaneously and they consider resource
limitations. They allow testing of several strategies (Andersson and Laurila
1983, p. 11 and 27).
2.3. Characteristics of Different Methods
Findings from the literature
Andersson and Laurila made an examination about the use of idea and project
evaluation methods in Swedish industrial firms. Their investigations show that
circa 50% of the investigated firms use some sort of product evaluation
method. In Sweden 68% of 125 examined large firms used some evaluation
method(Andersson and Laurila 1983, p. 18).
They also found that the order of priority when choosing analysis method is as
follows:
1. degree of commercial reduction of insecurity
2. degree of overrun
3. degree of technical reduction of insecurity
(Andersson and Laurila 1983, p. 108)
Fahmi and Spätig (1990) suggest a set of guidelines for the choice of project
evaluation and selection models and identify five key issues that make a route
to the appropriate project selection method. The issues are: concentration on
most critical problems; degree of quantification of relevant factors; degree of
interdependence between projects; consideration of single or multiple
objectives; and, finally, degree of risk.

68
The extent of use of project evaluation methods depends on the influence of
background variables. The variables include inter company environment,
company structure, surroundings, extent of R&D activity. Therefore the
evaluation system must be designed to take into accountancy the special
circumstances in the company (Andrén 1980). Danila lists the following 13
main types of R&D evaluation methods: ratio, score index, programming,
portfolio, matrices, systemic, checklist, relevance trees, table, multicriteria,
consensus, graphic and integrative. On the basis of the description of the
methods and on discussions with representatives of French and Japanese
industries Danila rated the methods for use for R&D planning and for R&D
strategy with respect to their formulation and implementation. He found that
excellent to very good rating for use in R&D planning can be obtained by one
of the matrix methods, and that checklists and consensus methods offer very
good rating. Danila further noticed an excellent to very good rating in one
integrative method, and very good rating in one consensus and one integrative
method. Both for R&D planning and strategy the excellent ratings occurred in
the formulation process, none for project implementation (Danila 1989). A risk
analysis system is part of strategy development, as it fits into the project
generation and selection step of the action cycle in strategic development
(Ansoff, 1987, p. 178). Chapman (in Ansell and Wharton 1992, p 3539) states
that the design of a method e. g., an analysis method, involves choosing or
developing an appropriate model/method/ software combination. This is also
true when developing a risk analysis method for a particular kind of risk
management in a particular context, for instance to analyze risk in innovation
projects. He further mentions that the time and money available to perform the
analysis, and the expected future use, are obviously important considerations,
as well as the immediate task. The design of a method is also necessarily a
process, which is dependent upon experience and intuition.

69
A very detailed treatment of sources of risk and responses involves
considerable expenditure in terms of staff effort and information requirements.
It has important benefits, however. A method for project planning can yet be
designed to make use of simpler models, following a fairly obvious sequence of
simplifications (Chapman in Ansell and Wharton 1992, p. 36). This suggests
that a model for risk detection also can be developed as a combination of
several simple models. Because the result of a risk analysis in an innovation
project may influence the project planning the design of a risk analysis method
for innovation projects must strike a balance between detailed treatment and
use of simpler methods. The analysis criteria can be classified or grouped in
several ways. Andersson and Laurila (1983, p 25) group them according to
three main groups of characteristics: properties of the method, application of
the method and area of use. The groups are further divided into subgroups.
A purposeful way to group the criteria for the analysis process is to first
determine appropriate main groups and then, within them subgroups. The five
main groups are:
i. application
ii. deliverables
iii. inputs
iv. intermediates of analysis (concept and resources)
v. uses
This grouping will be used in this work.
Application covers the type of activity in the project that shall be analyzed,
deliverables describe the types of result or outcome that the analysis is required
to produce and inputs represent the types of data entered into the analysis, and
the way they are entered. Intermediates of analysis include the individual items
of the project that will be subject to examination during the analysis. Finally,

70
Table 24. Analysis Criteria #1561#
CRITERIA GROUPS CRITERIA SUBGOUPSA P P L I C A T I O N Possible to test several strategies
PreprojectingProduct developmentAdministrationProduction planningMarket introductionThe method expresses value in absolute numbers
DELIVERABLES The method expresses value in relative numbersVerbal tableGraphical presentationReport
INPUTS Brainstorm typeIncludes nonquantifiable factorsGuidanceRatingRequirements on indata
INTERMEDIATES OFANALYSIS
Project character, environment and boundaries
Concept, generallyConcept attributesConcept componentsKnowledgeResources, explicitly, generallyResource componentsResource abilityOptimal resource allocataion considering resourcelimitationsTime factor treated explicitelyIncludes multiple criteriaConsiders insecurity explicitely
U S E S Requirements on userCost of introductionCost of useRequires computerTeamworkGuidanceRequires database
the group called uses deals with items connected with the use of the different
methods. Totally 35 analysis criteria were found in the literature study. Table 2
4 lists the groups and subgroups of analysis criteria. There are five groups, the
number of subgroups within each group of analysis criteria varies between
four and twelve.

71
Within the applicationgroup the subcriteria strategy testing, preprojecting,
product development and market introduction are related to innovation. The
subcriteria administration, and production planning relate to management.
Within the intermediates of analysisgroup the subcriteria concept, concept
attributes, and components relate to the theories of Levitt, the subcriteria
knowledge and resources relate to the theories of Hedlund, Penrose, Nonaka
and Takeuchi.
The majority of technical innovation projects were initiated by “need pull”. The
opposite, “need push”, that stems from new technical inventions seeking
application is scarce. Also the success of “need pull” projects has been better
(Virkkala 1994, p. 28).
Most of the literature about innovation describes technical innovations.
Innovations in other business fields are much less frequently described.
Sjölander (1985) indicates that in an analysis of the performance, e.g., of a
R&D project, it is important to define clearly what aspect of the performance
will be dealt with in the analysis. One must also define the levels and units of
the analysis. Innovation performance may, e.g., be related to two dimensions:
frequency and value. Two independent measures can be applied: degree of
innovation and economic value.

72
Frequently many of the methods are referred to by means of acronyms. A list of
some common method names and acronyms is presented below.
Risk directed methods
formal design review FDR
preliminary design review PDR
manufacturing design review MDR
use design review UDR
detailed design review DDR
installation design review IDR
final design review FDR
fault modes and effect analysis FMEA
fault modes, effect and criticality analysis FMECA
common mode failure analysis CMF
risk diagnosis and management method RDM
risk management process RMP
Management directed methods
quality function deployment QFD
programme evaluation and review technique PERT
graphical evaluation and review technique GERT
programme evaluation and review technique SCERT
Conclusions about different methods
A project analysis model can be characterized by the item within the project
that it focuses on, or by the aim that the analysis results are being used for.
Examples are methods that focus on activity, on components of existing
products, on the relation between products and market, on product structure, or

73
on production process. Other examples are analyses where the results are going
to be used as risk indicators for financiers, or where the results will be used for
developing a firm’s strategy.
The methods can also be classified according to their structure. The structure
may involve lists, tables, and graphs. The analysis may approach the project
starting from its details, working towards larger entities i.e., a bottomup
approach, or oppositely, the project may be approached from the top working
towards the details i.e., the topdownapproach (Ansell and Wharton, 1992, p.
107108). The structure also depends on the manner or execution of analysis
e.g., whether the analysis is done by a team or by individual analyzers, whether
the analysis is done in writing or verbally. The method of the presentation of
analysis results has a big influence on the conception of the model e.g., whether
it shall be presented in report form, to an auditorium, or whether the results
shall be distributed to a large number of receivers. The presentation is usually
composed of different deliverables e.g., text, lists, tables, graphs or reports. The
medium in which the analysis is performed has a big influence on the
composition of the model. For instance an analysis done in writing e.g., with
paper and pencil, may require a different structure than an analysis performed
with the aid of a computer, its peripherals and program. The latter make up a
carrier for the analysis model. Most of the analysis methods found in the
literature are performed in writing. Many of them are structured as lists, tables
and graphs, some also use rating and algorithms.
Common structural constituents of an analysis model are inputs, research
objects, intermediates of analysis, model carrier, and deliverables. The results
of the literature study were used to examine in what respect each method
covered the different criteria of analysis. The study involved a total of 24
different methods involving risk management methods, decision theoretical

74
methods, project management methods, econometric models, and idea
generators The number of analysis criteria covered by each method was
counted. Table 25 exhibits how many criteria for each analysis were covered
within each one of the five criteria groups. The table shows that of the 24
individual test methods only six methods covered more than 15 analysis
criteria. Seven methods left at least one entire criteria group without coverage,
of these four methods left two or more entire groups uncovered. The largest
coverage (24 individual criteria) was reported for Klustest, the risk evaluation
method covered 19 criteria. All the method types exhibited quite a large
dispersion in the number of criteria covered by the individual analysis
procedures within each type group. Five separate tables that show which
methods deal with different criteria subgroups within the groups of criteria are
presented in Appendix 2. There is one table for each group of criteria. Also the
project management methods, as well as the econometric, operation analysis
and idea generation methods were analyzed in a similar way. They are
tabulated in Appendix 1. The results from the literature study further reveal
that the different analysis methods deal with quite different analysis criteria
within the criteriagroup intermediates of analysis. Table 25 (Intermediates of
analysis) is an example of a table that shows which method deals with sub
criteria within the criteriagroup of intermediates of analysis. The table shows
that most of the analysis methods cover conceptrelated criteria. Only four
methods, Klustest, Risk evaluation, QFD3 and Profitability method cover also
resourcerelated
criteria. The table also shows that six methods consider only one or none of the
subcriteria. Apparently such methods cannot penetrate either the concept or
the resources of a project too thoroughly. Most of the methods can be applied
for product development, production planning and preprojecting.
Administration and marketing innovation can be analyzed only by a few of the

75
Table 25.Number of Items per Analysis Criteria covered by differentAnalysis Methods #1572#
Criteria groups
Methods Number of items covered
Application
DeliveRables
Inputs Intermediates ofanalysis
Uses Totalnumberitemscovered
Decision theoretical methods Check list 1 1 2 1 3 8 Profile scheme 1 1 2 1 3 8 Ranging methods 1 1 2 2 3 9 Klustest 4 4 4 7 5 24 Idemap 2 2 4 1 3 12Risk Management PERT 1 2 3 5 4 15 GERT 1 3 3 5 4 16 SCERT 1 3 3 5 4 16 FMEA 1 2 0 3 3 9 FMECA 1 2 1 3 3 10 Risk evaluation 5 2 1 7 4 19 Iderisk 1 1 1 1 4 8 Fault tree 2 1 1 1 3 8Idea generators Idegen 3 2 3 1 7 16 TRIZ 3 0 1 0 6 10 CyberQuest 3 1 1 0 2 7Project Management
Design reviews 1 1 1 2 4 9 QFD1 2 3 1 3 5 14 QFD2 0 0 0 2 0 2 QFD3 0 0 0 3 0 3 QFD4 0 0 0 1 0 1Econometric models Profitability methods 4 2 1 3 4 14 Index methods 2 0 1 3 3 9Operation analysis Mathematical programing
methods2 1 1 4 4 12
c:\wp\Dr\Avh\Wbook\WkbTab03.xls Sheet Methods1der. fr. WkbTab02.xls Anlafig6.xls &Bascol13.xls 7.4.00 Updated: 17.4.00; 2.5.00; 25.9.00; 30.9.00; 2.10.00
methods. Very few of the individual methods cover several objects of analysis
in the same method. Klustest covers most of the concept and resource related
characteristics as well as knowledge. Klustest can be characterized by being
quick and selfexplanatory (requires little guiding), but with its preset questions

76
it is inflexible and does not allow item combination or interinfluence in the
analysis process. However, QFD is flexible, allows interinfluence between
intermediates of analysis and intercomparison of items (correlation). It focuses
on product/market/production relation, and is less applicable for services or
administration projects. However, a comprehensive analysis including all four
stages is a very time consuming task. There is no information on guidance in
QFDanalysis methods in the literature.
Only Klustest and Idemap offer guidance during input; PERT, GERT and
SCERT have limited guidance in some applications. Klustest and QFD offer
deliverables as absolute and relative numbers, it also presents tabular lists as
well as a report. Profile schemes, the profitability method, FMEA, FMECA and
the risk evaluation methods offer graphical presentation. Also the project
management methods, as well as the econometric, operation analysis and idea
generation methods were analyzed in a similar way. They are tabulated in
Appendix 1. The risk management methods are primarily intended for risk
management in connection to product design or project planning. Each one of
the decision theoretical methods depends on fixed questions or question lists
that must be answered, respectively. Each one of the project management
methods focuses on components of product or on fault, on productmarket
relation, product structure, or production, respectively. The econometric
methods are based on economical factors only.
An internetinvestigation indicated that computer based versions of analysis
methods presently can be obtained. QFD, FMEA and certain FDRanalyses are
examples of this.

77
2.4. Voids in the Field of Risk Detection in Innovation Projects, a Place
for Contributions to Science
As seen from the Tables 25 and 26, the literature survey revealed that no one
single method was encountered in the literature that covered a combined
analysis of concept attributes and components, knowledge, and resources
attributes and components. No method could, in addition to this offer the
possibility to correlate different items during the analysis process. Furthermore
no method was available that could accommodate the guidance functions to the
nature of the project. These shortcomings represent the knowledge voids
detected in the research object.
Table 26. Intermediates of Analysis#1574#
Analysiscriteria
Methods Proj
ect c
hara
cter
,en
viro
nmen
t and
boun
darie
s
Con
cept
, gen
eral
ly
Con
cept
attr
ibut
esC
once
ptco
mpo
nent
sK
now
ledg
eR
esou
rces
, exp
licitl
y,ge
nera
lly
Res
ourc
eco
mpo
nent
sR
esou
rce
abili
tyTi
me
fact
or tr
eate
dex
plic
itely
Incl
udes
mul
tiple
crit
eria
Con
side
rs in
secu
rity
expl
icite
ly
Inte
rmed
iate
sco
vere
d
Intermediates covered *)
Decision theoretical methodsCheck list x X 1Profile scheme X 1Ranging methods X X 2Klustest X X X X X X X 7Design reviews X X 2Idemap X 1
Risk management methodsFMEA x X X X 3FMECA X X X 3Risk evaluation X X (X
)X X (X
)X 7
Iderisk X 1Fault tree X 1# items covered 3 6 1 3 (4) 2 1 1 1 (5
)2
*) (X) indicates that criterion regarded to a limited extent

78
The fundamental void in the field of methods for risk detection in innovation
projects was the lack of a model and an analysis method that satisfactorily
analyses both the concept of the project and the resources available to realize
the project in one analysis process. This void represents shortcomings that
necessitate the use of several analysis methods for a good coverage in the risk
analysis of innovation projects.
No reports were found that describe the creation of a method that analyses both
the concept of the project and the resources available to realize the project. The
development of such a risk analysis method would include a contribution to the
science of risk analysis methods for innovation and R&D projects. Such a
method would also be an answer to the research questions presented in
connection with the research problem in Chapter 1.2.

79
3. A theoretical Model for Early Detection of Complex Problems (EDCP)
in Innovation Projects
3.1. Basic Elements in Characterizing an Innovative Project
3.1.1. Background
A theoretical model for Early Detection of Complex Problems (EDCP) in
Innovation Projects was developed, partly based on certain theories of
management and innovation, and partly on the writer’s personal experience.
The fundamental theories are Levitt’s (1980, 1977) theory about attribute and
component, the knowledge and resource based theories of Nonaka and
Takeushi (1995), Mahoney and Panjan (1992), Majumdar (1998), Penrose
(1959), and Barney (1991). Also the theories of risk by Knight (1985)
contribute to the fundamental base for the model. #2021#
For analysis purpose, the project can be the disintegrated into attributes and
components i.e., attributecomponentpairs, and thus the EDCP directs the
attention towards specific needs of the project, during the resource selection
process. This way the most valued resources get selected for the project (Oliver
1997, p. 703). Successful risk management requires linked and integrated
models, expertise and special skills. Risk perception is recognized as the first
step in risk analysis. Data arranged in a matrix pattern in a table helps the
analyst or a team of analysts in the second step to balance changes to ensure
that important customer benefits are not inadvertently adversely affected
(Urban and Hauser, 1993, p. 344). Such an arrangement may also help to
enhance customer benefits. Kotler states that attractive ideas need to be
developed into finer product concepts if they are to be tested. A product
concept is an elaborated version of an idea expressed in meaningful consumer
terms. A product image is the particular picture that customers acquire of an

80
actual or potential product (Kotler 1988, p. 418). In the analysis the concept,
and resources parts of the project can be interconnected by the knowledge areas
that represent the knowledge required when the resources realize the concept of
the project. The structure of the EDCP analysis system and the interconnection
between the elements are seen in Figure 31.
Figure 31. Interconnection between the elements of an EDCPanalysis model,management and analysis team.
The involvement of the management and the analysis team in the operation of
the analysis work represents influence of project management theories. They
apply e.g., Ansoff’s theory about strategy development in defining the project.
The concept presentation involves the use of attributes and components and it
thus relates to innovation theories e.g., by Levitt and Schumpeter. The
combination of the knowledge areas and the resources represent the knowledge
and resource based theories of Penrose and Nonaka and Takeushi. The risk
theories e.g., of Knight are introduced into the model through the algorithm
formulas that produce measures for the risk in the analysis results.
MANAGEMENT
ANALYSIS TEAM
INTERFACE, GUIDANCE
PROJECT PRESENTATION
CONCEPT KNOWLEDGEAREAS
RESOURCES ANALYSISRESULTS
ALGORITHMFORMULAS, PROGRAM #1553#
c:\wp\Dr\Wbook\WkbPict1.doc #13#
53#MODEL CARRIER
MODEL CARRIER
MO
DEL
CA
RR
IER
MO
DEL
CA
RR
IER

81
Management corresponds with the analysis team that is familiar with the
project. The analysis team interacts with the model via an interface to perform
the analysis. The EDCP model consists of a primary model by means of which
a representation of the project is formed, and of an extended model that
enhances the analysis of the project. The primary model integrates knowledge
and resource based theories into risk theory, management theory and
innovation theory. The extended model is an extension of the primary model
into a usable and useful tool. In the following the construct of a basic analysis
model will be described. First we describe the construction of the concept and
resource analysis tools that consist of attributes and components as well as of
knowledge areas. Then the constituents of the analysis process and the
deliverables will be presented. The analysis process deals with the rating for the
evaluation process and the deliverables deal with how the analysis results are
presented to management.
3.1.2. Attributes and Components
Products are combinations of the tangible and the intangible. For example an
automobile is more than just a machine, it is differentiated by a number of
attributes e.g., color, design, size. It may be even a symbol denoting status,
taste or rank, these are also attributes of the product. The customer never just
buys the “generic” product like steel, or wheat, or subassemblies, or
engineering consultancy. He buys something that transcends these designations
and what that “something” is, helps determine from where he will buy.
Attributes cause characteristics or distinctions that differentiate products from
each other. (Levitt 1980)

82
The “marketing concept” explains that business success is customer oriented
rather than product oriented. A business ought to view itself as buying
customers rather than as selling goods. Selling is to make the customer want
what the seller has. Marketing is to offer what the customer wants. Marketing
means thinking of customers’ needs; customers do not buy goods or services,
they buy expectations or promises to solve the problem (Levitt 1977). Levitt
(1980) states that the satisfaction that determines the customer’s minimal
purchase conditions is represented by the attributes of the product. The
attributes are realized in the product or service through different components,
or media e.g., packaging, stationery etc. The “wants” of Knight thus correspond
to the attributes of Levitt, and Knight’s means or resources correspond to
Levitt’s media or components. Stewart defines a product feature as a physical
and functional characteristic or component of the basic product that can be used
to distinguish it from competing products. As examples Stewart proposes
materials or methods of construction, kind or method of performance, or
construction of a part (Stewart 1959). Also the needs of customers, users,
society, etc. mentioned by Virkkala (1994, p. 30) can be regarded as attributes,
and the possibilities of Virkkala represent the components (Fig. 14).
Webster (1999) defines attribute as that which is assigned or ascribed, a
characteristic. Synonyms are property and quality. An attribute is what we
conceive a thing to be, a quality is what it ought to be. A property is what
belongs to one thing as its own particular possession. Webster (1999) defines a
component as a constituent part, and medium as means, agency, instrument, or
intermediate means. Lists of important attributes are important models for
individuals to form judgments and preferences about objects. A list of
important attributes is also a useful help in multiperson, extensive problem
solving situations (Lilien et al. 1992, p. 2223). This is because the consumer
considers various product attributes, and each consumer sees a given product as
a bundle of attributes (Kotler 1988, p. 197).

83
A product can be described by its performance of multiple attributes. The
multiple attributes of a product can be classified according to two classes;
monotone attributes and nonmonotone attributes. Monotone attributes are
attributes for which all consumers agree in their preference ranking of the
various attribute levels. A nonmonotone attribute can be ordered so that the
prices that the consumers’ are willing to pay (reservation prices) are increasing
in the level of the attribute. Monotone attributes are attributes on which people
have different preference orderings. A nonmonotone attribute cannot be
ordered so that all consumers’ utilityfunctions are increased in the level of the
attribute (Lilien et al. 1992, p. 222223). The term attribute has been used in
marketing literature in connection with the relationship between producer and
customer as an instrument for characterizing a product or service. Willkie
(1986, p. 57) states that all products can be described in terms of some number
of characteristics or features. These he terms, technically, attributes. The
attributes represent the characteristics that the consumers are seeking from a
product, and so they form an important means for the customer to realize his
wants.
3.1.3. Knowledge and Resources
Webster (1994) defines knowledge as acquaintance with facts, truths,
principles, or branch of learning as for study, investigation, sight, experience or
report, and resources as available means afforded by the minds of personal
capabilities; source of supply, support, or aid. The combination of existing facts
into new combinations (Schumpeter 1934, p. 66) requires knowledge about the
facts. For characterization purpose knowledge has been grouped into two main
categories, explicit and tacit knowledge (Nonaka and Takeuchi 1995). Hedlund

84
(1994, p. 7475) refers to articulate knowledge that can be equalled with
explicit knowledge. Explicit or articulate knowledge can be communicated in
text, drawings or computer programs. Tacit knowledge, however, dwells within
people as a kind of experience gained through practice or intuition. When tacit
and explicit knowledge interact, an innovation emerges. Organizational
knowledge creation is a continuous and dynamic interaction between tacit and
explicit knowledge. This interaction is shaped by shifts between different
modes of knowledge conversion, which are in turn induced by several triggers
(Nonaka and Takeuchi 1995, p. 7071).
Several researchers relate knowledge to resources. Penrose (1959, p. 25) as
well as Nonaka and Takeushi (1995, p. 34) link knowledge with the firm.
Barney (1991, p. 1012) equals the attributes of resources with resource
abilities. Distinctive competence is a function of the resources that a firm
possesses at any point in time (Mahoney and Panjan (1992), p. 365). This is an
example of how knowledge is bonded to a firm’s resources. In order to improve
its competitiveness the firm must also be able to generate distinctive
competences. Firms accumulate knowledge as a strategic asset through research
and development and learning, some of it incidentally in their production
process. Strategy formulation concerns a constant search for ways in which a
firm’s unique resources can be redeployed during changing circumstances.
This way Rumelt (1981) combined the Schumpeterian perspective with the
resourcebased view. (Mahoney and Panjan (1992), p. 369)
Schumpeter, in connection with defininig innovation as “new combinations”,
emphasizes the importance of combining explicit knowledge. In fact, he
pointed out that the emergence of new products, production methods, markets,
materials, and organizations results from new “combinations" of knowledge.
However, "combination" is only one mode of knowledge creation (Schumpeter
85
1951, p. 66 in Nonaka and Takeuchi 1995, p.3233). When specifying a
knowledge area a decision maker or analyzer moves the basis for decision
making from the state of opinion towards a state of knowledge i.e., from
uncertainty towards risk in Knight’s terms, and thus brings risk management
into the decision making. Even if the decision maker or analyzer does not
possess the proper knowledge he attempts to show the direction where it can be
found (Barreto, 1989, p. 3940, Knight, 1985, p. 19)
Hamel and Prahalad relate skills and technologies to a core competence that
offers means for firms to compete in the market (Hamel and Prahalad 1994,
22324 in Lintunen 2000, p. 139). Ansoff, again, relates the competence
components to strategic thrust in order to meet the market’s demand. Hamel
and Prahalad (1990, 7991) described the core competencies as a bundle of
skills and technologies. The core competencies of the company represent the
collective learning of the organization i.e., how are its skills and technologies
coordinated and integrated. Hamel and Prahalad (1994, 22428, 1990, 834)
propose three tests for identifying the core competencies. The core
competencies
i. provide "potential access to a wide variety of markets"
ii. "should make a significant contribution to the perceived customer
benefits of the endproduct
iii. "should be difficult for competitors to imitate"
(ref. Mintzberg et al. 1998, 218 in Lintunen 2000, p. 177)#1255#
According to Penrose, "it is never resources themselves that are the 'inputs' in
the production process, but only the services that resources can render (Penrose
(1959)p. 25). Services are a function of the experience and knowledge
accumulated within the firm, and thus firm specific. In essence, the firm is a

86
repository of knowledge (Nonaka and Takeuchi (1995), p. 34). Thus the
statements of Penrose and Nonaka and Takeuchi link knowledge to resources
as indicated also by the definition of capabilities and resources. Barney’s
conception is that a resource component that owns the potential of sustained
competitive advantage must possess four attributes: it must be valuable, it must
be rare among the firm’s competitors, it must be inimitable and there must not
be substitutes for it. These represent general attributes of a resource component.
Other important abilities include availability and special abilities related to
different knowledge areas (Barney, 1991 p. 105). In his article Barney specifies
firm resources with those attributes of the physical, human, and organizational
capital resources that enable the firm to conceive of and implement strategies
that improve its efficiency and effectiveness (Barney 1991 p. 101102). Thus
Barney equals the attributes of the resources with the resource abilities
mentioned above. Majumdar represents a somewhat narrower view when
stating that resources include physical, intangible human and organizational
resources. The resources are transformed into tangible outputs via identification
of activities and contribution of resources (Majumdar, 1998 p. 811). Selection
of appropriate resources to realize a concept is of decisive importance for a
successful outcome of a project. Majumdar thus states that analysis efficiency
in resource analysis reveals skills in the use of the resources. Such skills
produce lasting benefits in terms of outcomes such as new product
introductions or investment that can be made with the resources that are
accumulated because of competent usage. Superior firms are likely to have
better strategies for resource utilization (Majumdar (1998) p. 810).
Resource abilities determine the value of the resources to the firm. According
to Oliver valued resources are those with the greatest rent potential among the
resources currently available for acquisition by firms. Valued resources refer to
the firm’s strategic assets i.e., those assets that are valued for their potential to

87
create the firm’s competitive advantage (Oliver (1997) p. 703). Competition for
resources, such as and "knowledge" means that agents operate under conditions
of "radical," "paradigmatic," and/or "structural" uncertainty. At the same time
an agent's economic behavior is better understood as being part of a learning
process over time than as being a static function of mere maximization
(Magnusson, ed. 1994, p. 5). Thus Magnusson links resources to knowledge
and innovation. The firm is dependent on the resources in its expansion and
thus also in its innovation activities. For instance, Mahoney and Panjan note
that fundamentally the resources of the firm limit the markets that the firm may
enter, and the profit it may expect. Shortage of labor, shortage of finance, lack
of suitable investment opportunities, and lack of sufficient managerial capacity
are important resource restrains (Mahoney and Panjan (1992), p. 365). Ansoff’s
requirements for making strategic decisions also include the allocation of the
firm's resources e.g., between opportunities in hand and probable future
opportunities under conditions of partial ignorance (Ansoff, 1987, p. 41).
Analyzers create a mental picture of the innovation concept by listing attribute
component pairs that characterize the innovation according to the theories. By
listing the necessary knowledge areas the analyzers identify the requirements
for realizing the concept. Simultaneously they identify the knowledge areas as
links to the resources that shall realize the project. By rating certain items an
evaluation of the propensity for success or failure of the innovation can be
carried out. This indicates that an analysis for early detection of complex
problems (EDCP) in innovation projects is possible by systematic tabulation of
items related to the innovation and its realization.

88
3.1.4. Rating
In customer analysis selfrated importance is performed so that each customer
rates the importance on a given scale, usually a 5, 7 or 9point scale. The
additive model is probably the most commonly used utility model, but many
other models have been suggested and implemented (Tell and Wallenius 1979,
p. 56). For instance, in ranging methods judgement of product and project
ideas is passed according to a number of factors that have significance for the
selection and evaluation. The number of factors must be limited mainly to
critical factors. Then a value scale for each factor is decided. It can be either
numerical or verbal. The criteria are assigned weights according to their
significance for the firm. Ranging is then performed for each project by passing
judging the different factors, then a ranging number is calculated (Andersson
and Laurila 1983, p. 127129). The lexicographic approach assumes the
decision maker to be able to rank the criteria in a descending order of
importance. The most important criterion is first to rank the actions. Only if
any two actions are nonseparable according to this criterion is the second,
third, etc. criterion used to rank the nonseparable actions. The ranking method
may suggest certain ranges (13, 15, 17, etc.) inside which the evaluators must
select their rating number. Often the numbers must be digits (Tell and
Wallenius 1979, p. 5).
3.1.5. Deliverables
An analysis produces information that must be prepared into deliverables that
have a form appropriate to the recipients within the firm. The presentation must
report the analysis results in a form that allows written as well as oral
presentation.

89
The report shall contain logically organized verbal and numerical data,
preferably in the form of lists or paragraphs, separate or combined.
Furthermore, paragraphs for comments about the results as well as for
conclusions of the analysis are needed for a useful presentation. The model
must provide for easy and clear verification of the analysis results. It must be
possible to trace the logic of how the analysis results are arrived at and how
they are organized. If the model contains calculation operations, the
calculations must be easy to trace back to the entered data e.g., to rated
numbers. The mathematical formulas used in calculations must be visible for
verification to the project owner. The report shall present a qualitative model of
project risk, ideally summarized in diagrams, with underlying computerbased
models, to handle changes where appropriate and feasible. The richer the
information generated in the Identify phase, the greater the need for care in the
Structure phase, to provide a sound basis for inferences to follow (Chapman
and Ward 1997, p. 141).
Risk analysis can serve three separate roles in relation to tradeoffs between
risk and expected performance. Two roles are almost (but not quite) directly
analogous to those associated with risk efficiency, the third somewhat different
(but complementary):
1. diagnose possibly desirable changes in plans
2. demonstrate the implications of such changes in plans
3. facilitate, demonstrate and encourage ‘enlightened gambles’.(Chapman and
Ward 1997, p. 3738)
The Review stage of the Project Life Cycle (PLC) method involves a
documented audit after delivery of the product. Missing important lessons
means mistakes will be made again. Not having such a stage explicitly

90
identified almost guarantees the realization of this risk (Chapman and Ward
1997, p. 21). There are two primary purposes for documentation of activities.
The first is to provide a means for followingup of action items and
recommendations. The second is to create a record to assist in establishing the
stateoftheart and development history of the product (CEI IEC 1160 1992, p.
39). The documentation can include information in a wide variety of forms,
describing activities, risks, responses, decisions taken, and identified trigger
points (Chapman and Ward 1997, p. 44). A report shall present a qualitative
model of project risk, ideally summarized in diagrams, with underlying
computerbased models, to handle changes where appropriate and feasible
(Chapman and Ward 1997, p. 141).
3.2. The Basic Model
An innovation project is an undertaking by which an organization wants to
serve its customers, its own activities, society or any other entity by adding
value. The organization that undertakes the project is regarded as the project
owner. The firm, or the organization often appear as project owner.
The primary model for early detection of complex problems in innovation
projects (EDCP) is based on an analysis of the concept together with an
analysis of the resources. Both analyses are performed using one system. The
concept involves the elements of innovation in the project, and the resources
are those that are available to the firm for the solution of the problems of the
concept. An analysis of the knowledge areas involved in the concept links
together the two analyses mentioned above. The presentation of the concept
utilizes the attribute and the component as defined by Levitt (1977) and the
knowledge according to Majumdar (1998) and Penrose (1959).

91
A team of analyzers performs the analysis. The EDCP model organizes the
elements of the project in tabular form appropriately for a systematic analysis
of the project. Figure 32 illustrates the structure of the analysis process. First
the concept of the innovation is presented as inputs and then the resources are
also presented as inputs. The analysis results are processed from the presented
inputs.
Figure 32. The structure of the analysis process
The table for concept analysis organizes the attributes and components by
listing them into their respective column in the “Conceptanalysis” table (Fig.
33). First, the team lists the attributes and then the components that realize the
attribute. One attribute may require several components and thus is a member
of several attributecomponent pairs. In the table they form attributecomponent
pairs; each component is joined to the attribute that it realizes. The analyzers
can then conclude from the attributecomponent pairs what knowledge will be
needed to realize each attribute and the necessary knowledge areas are then
listed in their column in the “Conceptanalysis” table. The listings in the
“Conceptanalysis” table consist of answers to particular questions e.g., the
attributes are listed as answers to a prompt or requirement to list properties that
make the product or service or activity better for the user, the customer. The
components are listed as answers to the question “whereby or how do we carry
the attribute into effect”, the attribute being to the left of the component in
question. The knowledge areas are listed as answers to the question “what
(additional) knowledge area can contribute knowledge to realize the attributes
PresentandanalyzeConcept
PresentandanalyzeResources
Analysis resultsproduced(Deliverables)
Concept andResources matchedby the AnalysisSystem#2135#

92
by means of the components”?. The method of deducting the necessary
knowledge areas from the attributecomponent pairs of the concept is new, and
was not encountered in any of the literature sources. The attributecomponent
pairs and the knowledge areas provide a representation of the concept in the
project, and they are organized in tabular form appropriately for analysis.
Starting from the contents of the “Conceptanalysis” table an analysis of the
resources is performed. The analyzers conclude from the attributecomponent
pairs what resources will be needed to realize the attributes by means of the
components. The resources i.e., the resource components are then listed in the
“Conceptanalysis” for analysis.
An example of the “Conceptanalysis” table is shown in Figure 34 below. The
table is structured into separate columns for attributes and components, and
these are placed so that attributecomponent pairs are formed, each attribute
CONCEPT ANALYSIS #2038#
Knowledge areasAttributes Components Knowledge
areasdurabilitycalculus
plasticsmatl.technol.
plasticsseamtechnol.
Testingtechnol.
Machinedesign
Durability Geometry durability calculus 4 3 4 3Durability support plate material plastics matl. technol. 2 5Durability surface film plastics seam technol. 4 3 3Durability Seam method testing technol. 4 1Replaceability Geometry machine design 5 2 1Replaceability Seams plastics processing 4space effectiveness Geometry Wood processing 4 3 4 2space effectiveness Surface film industrial design 4Functionality Geometry quality technol. 5 5 5Functionality Surface film Networking 5Outlook Geometry patent law 2 2 5Outlook Finish Knowledge area 2Cost Material selection Knowledge area 2
ãMikael Epstein 1997, 1998, 2001
This is an excerpt from a larger table!
Figure 33. The “Conceptanalysis” table of the primary model.
and corresponding component is located sidebyside. The pairs can be readily
observed in the table. There is also a separate column where the knowledge
Attributecomponent
Knowledge
Grid

93
areas are listed. As seen from the figure the same knowledge areas that are
listed in the column also appear listed in a horizontal row in the upper part of
the table. This row allows the formation of a matrix grid that offers the
possibility to analyze each attributecomponent pair relative to each knowledge
area.
In the “Conceptanalysis” table the primary EDCP model creates a
representation of the concept of the project by listing the attributes, components
and knowledge areas that relate to the project and arranges them in tabular form
appropriate for analysis. The analysis results show risk concentrations to
certain attributecomponent pairs and to certain knowledge areas.
The resources of the firm include all assets, capabilities, organizational
processes, firm attributes, information, knowledge etc. that are controlled by
the firm. The firm resources can be classified into three categories: physical
capital resources, human capital resources, and organizational capital resources.
The resource components represent the carriers of the abilities of the resources.
The resource components use their abilities, or they put their abilities to the use
of the firm to attain the concept attributes of the project. The resource abilities
represent the abilities evaluated for the respective categories of resource
components e.g., human abilities, properties of machinery, services etc.
The resource analysis is performed in the “Resourceanalysis” table (Figure 3
4). The attributecomponent pairs from the “Conceptanalysis” table appear in a
column in the left part of the table. Immediately to the right of this column a
separate column is provided for listing the resource components that will
realize the attributes by means of the components of the concept table. The
analyzers list the resources as answers to the question, “what resources shall
create the attribute by means of the component”?. The attribute and component

94
in the question are taken individually from the attributecomponent pair left of
the actual resource in the “Resourceanalysis” table. When completed, the table
thus exposes the attributecomponentresource groups that realize the project.
The groups are formed by those attributes, components, and resources, which
are located sidebyside in the columns of the table. The groups can be readily
viewed in the table. Similar to the “Conceptanalysis” table, the “Concept
analysis” has a row that lists the same knowledge areas as in the “Concept
analysis” table. This row appears in the upper right of the table, and it allows
the formation of a matrix grid for analysis of each attributecomponent
resource group relative to each knowledge area.
In the “Resourceanalysis” table the primary model further includes the
resources in the representation so that the representation finally includes the
whole project. In the resourceanalysis the analysis results show risk
concentrations in certain resource groups and knowledge areas. Finally, the
analysis results for the concept and resource analyses are compounded to show
the risk concentrations for the attributecomponentresource groups and the
knowledge areas of the whole project.
The EDCP analysis procedure is described more in detail later in the text. The
EDCP model assumes that the risks in the “Conceptanalysis” table are directly
proportional to the significance of the attribute to the project. The risk in EDCP
is understood in the sense defined by Knight’s (1985) proposals. It also
assumes that the risk is directly proportional to the significance of each of the
knowledge areas in realizing the attribute by means of the component. This is
logical since the more significant an attribute is to a project, the more risk it is
likely to bring into the project. A significant knowledge area also likely brings
more risk to the project than a less significant one. The risks are appreciated for
each attributecomponent pair in the “Conceptanalysis” table.

95
An example of the “Resourceanalysis” table is shown in Figure 34 below.
RESOURCE ANALYSIS #2039#
Knowledge areasAttributecomponent pairs Resource components
(persons, machines, contractors,etc. that realize Attributes)
durabilitycalculus
plasticsmatl.technol.
plasticsseamtechnol.
Testingtechnol.
Machinedesign
R1 durability & geometry KV, PJ, PK, JM, TV, VT, Varo Co, Kotay 2 3 3 2R2 durability & support plate material Varo Co, 2 5R3 durability & surface film KV, PJ, PK, JM, TV, VT, Varo Co., Kotay 2 3 2R4 durability & seam method KV, JM, TV, SR, Varo Co., Kotay, TKK, 3 1R5 replaceability & geometry KV 5 5 1R6 replaceability & seams KV, JM, VT, PJ, JS, SR, PS, KM, 3R7 space effectiveness & geometry KV, JM, VT, PJ, JS, SR, PS, KM, PK, 4 2 4 2R8 space effectiveness & surface film KV, JM, VT, PJ, PK, TV., Kotay 3R9 functionality & geometry KV, JM, VT, PJ, PK, TV., Kotay, Varo Co. 3 4 2R10 functionality & surface film KV, JM, VT, PJ, TV., Kotay, Varo Co., TKK 5R11 outlook & geometry EK 4 4 5R12 outlook & finish EK, CEW, 2R13 cost & material selection KR, CEW, PH, TV, JM, Kota Ky, Varo Co., 2R14 cost & contractors KR, CEW, PH, TV, Kota Ky, Varo Co.,R15 cost & size of series KR, CEW, PH, JM, Kota Ky, Varo Co., 4 5 2
Mikael Epstein 1997, 1998, 2001This is an excerpt from a larger table!
Figure 34. The “Resource analysis” Table.
The risks in the “Resourceanalysis” table are directly proportional to the
significance of the concept attribute. It is inversely proportional to the
availability as well as to the ability of the resource component. This is logical
since also from the point of view of the resources a more significant concept
attribute brings more risk to the project than a less significant one. Better
availability and better ability of resource components lowers the risk brought
into the project, hence the inverse proportionality to the risk. The risks are
appreciated for each resource component in the “Resourceanalysis” table. The
risks of the whole project are appreciated by compounding the risk of each
attributecomponent pair in the “Conceptanalysis” table and the risk of the
corresponding resource component in the “Resourceanalysis” table. Thus the
risks are appreciated for each attributecomponentresource group. The risks
connected to the knowledge areas are appreciated separately in the “Concept
analysis” table and in the “Resourceanalysis” table. In the “Conceptanalysis”
table the risk is proportional to the significances of each knowledge area with
Attributecomponentresource groups

96
respect to the attributecomponent pairs, in the “Resourceanalysis” table it is
inversely proportional to the ability of the resource components with respect to
the attributecomponent pairs. The risks are expressed by introducing numerical
ratings for significances, availability, and ability into the EDCP model and the
resulting risk values are calculated by formulas so that direct proportionality is
represented by additional type functions, and inverse proportionality by
division. In EDCP the risks are regarded independently of each other, no
consideration is made to their interdependence.
The tables form an illustration of how the primary model links together the
knowledge and resource based theories into management and risk theories in
the analysis of the project, and presents an answer to the first research question.
Why is the EDCP Model better than other Methods available for Risk
Analysis of Innovation Projects?
A comparison was made between EDCP and the methods investigated in the
literature. Table 31 shows the number of items per analysis criteria covered by
EDCP. It is collected in a similar way to Table 25. It can be seen that the
number of items per analysis criteria covered by EDCP exceeds the number of
items covered by any of the methods reported in Table 25. This is the case for
each different group of criteria as well as for total number of items covered per
criterion. Most of these methods cover only a fraction of the number of items
compared to those covered by EDCP, as can be seen from Table 25.

97
Table 31. Number of items per analysiscriteria covered by EDCP #2019#
Group of criteria Items coveredfor eachcriterion
Application 5Deliverables 4Inputs 5Objects of analysis 10Uses 6Total number of items covered 30
Table 32 lists the number of intermediates of analysis covered by EDCP, it is
collated similarly to Table 26. Table 32 shows that EDCP covers nine
intermediates of analysis, and this exceeds the number of intermediates covered
by any one of the compared methods. From Table 26 it can be seen that the
two methods that came closest (fulfilling seven criteria) are more limited as to
their analysis flexibility or to their extent of analysis.
Table 32.Intermediates of analysis covered byEDCP #2020#
Concept, generally X
Concept attributes XConcept components XKnowledge XResources, explicitly, generally XResource components XResource ability XOptimal resource allocataionConsidering resource limitations
X
Time factor treated explicitelyIncludes multiple criteria XConsiders insecurity explicitely
Total number of intermediates covered 9

98
Thus no one single method was available in the literature that covered as many
analysis criteria as EDCP, not to speak of ability to analyze the concept as well
as the resources, in the same process, in a flexible manner.
The primary model constitutes the main contribution to this work. It helps the
project owner to structure the project in such a way that an analysis can be
performed in order to detect the risks of the project by pointing out the risk
concentrations. The model integrates the knowledge and resource based
theories into risk theory, innovation theory, and management theory.
3.3. The Extended Model
However, the primary model as such is not sufficient to offer a usable and
useful analysis tool for risk detection in innovation projects. In order to present
an answer to the second research question the primary model must be enhanced
with extensions. In order to form an extended model for the technical analysis
tool, procedures and methods familiar to aspects from other analysis systems
are combined in new ways and integrated into the primary model in appropriate
ways. This extended model will enhance the use of the model thus making it
usable. It will also present analysis results in such a form that they will be
clearly and easily presented to the project owner, thus making the model useful.
The proceeding of the analysis process is illustrated in the scheme below. First
the project is defined, then follow presentation of concept and resources.
The EDCP analysis process:
SelectanddefineProject
PresentandanalyzeConcept
PresentandanalyzeResources
ConceptandResourcesmatchedby EDCPSystem#2135#
Deliverablesproduced byEDCPsystem
Deliverablesappreciatedand sorted
Reportprepared
Conclusions fromAnalysisReport

99
The EDCP analysis system matches the analyses of concept and resources, and
produces deliverables. The deliverables are then appreciated and sorted, and an
analysis report is prepared on the basis of the sorted deliverables. Finally,
conclusions are made about the risks in the project.
The Structure of the EDCP Analysis System
The EDCP analysis involves both internal and external actors. Internal actors
are, on one side the analyzers i.e., the team that performs the analysis and, on
the other side the resource components that will realize the Concept. Part or all
of the resource components may be the analyzers themselves. The customers,
the users and the suppliers constitute external actors that must be taken into
consideration when performing the analysis.
The EDCP analysis system is structured into an input part, a processing part
and an deliverables part. The input part describes the project and it consists of
intermediates and guidance. The intermediates define the project and the
guidance system instructs the analyzers by means of questions to find
appropriate intermediates. The processing part consists of the rating processes
and algorithms. The rating is performed according to one numerical scale in all
rating applications throughout the entire analysis. The questions guide the
analyzers when rating singular intermediates and combinations of
intermediates. The output part exhibits the results of the analysis. It consists of
a presentation part and an editing part. The presentation part contains tables and
graphs, and in the editing part a report of the analysis is prepared according to
the formal requirements agreed to with the firm for which the EDCP analysis is
made i.e., the project owner. Thus the main constituents of the analysis system
are the project presentation, and the analysis of the concept and the resources
under guidance of the guidance system. The deliverables that present the

100
outcome of the analysis to the project owner are also constituents of the
analysis system.
The analysis is performed by a team of persons who must be familiar with the
project as well as with the firm. The team must have the support and the
backing of the top management of the firm. Sometimes the analysis indicates
that representatives of external actors ought to be included in the analyzing
team. In the analysis process analyzers must process different items connected
to the project. These items must be characterized and grouped appropriately for
use in the analysis process. They form intermediates of the analysis.

101
4. The Empirical Work
The presentation of the empirical work consists of three main parts. First, the
development of the EDCP model is described practically, in chronological
order. Then follows a description of the analysis work with the pilot firms.
Finally, the results from the empirical work i.e., on one hand the impact of the
research work on the development of the model, and on the other hand the
benefit of the results from analyses for the case projects and the pilot firms. A
considerable part of the development work involved changes to the tables and
graphs that constitute the main part of the analysis system. The most important
changes to the tables are illustrated in Appendix 3.
A scheme of the empirical work is presented below:
4.1 Development of the EDCP Analysis System
The improvements to the extended model included the development of means
to characterize the project in terms appropriate for analysis, and the
improvement of the “Concept“ and “Resourceanalysis” tables to suit practical
analysis work. Another important improvement was the means to present the
analysis results to the project owner.
This study can be said to have its “theoretical side” and its “practical side”. The
theoretical side was described earlier, the practical side that will be described
below and follows by some basic theories. A large part of the finished model,
Selectionof PilotFirms
IntermediateDevelopment,three stages
Pilotanalyses2nd
sequence,one stage
Development ofFinal Bases,One stage
Summary andConclusions of Basedevelopment work#2134#
Summary andConclusions ofcooperation withPilot Firms
Pilotanalyses1st sequence,two stages

102
however, came to consist of matter added the “practical way”. In this respect
the development work can be said to follow Kuusi’s (1999, p. 231) advice of
“not trusting nice theories too much”. The description of the practical work, in
which the primary model was extended, presents the answer to the research
question about how to develop a usable and useful analysis tool for early
detection of risks in innovation projects.
The spreadsheet program Microsoft Excelâ , later referred to as Excel, was
chosen as the model carrier for EDCP at a very early stage in the development
process, all practical development work using the EDCP model was carried out
using Excel. In the beginning version Excel 4 was used, later Excel 5. The
tables or groups of tables that composed the model carrier in the various
versions of development are called base. In most other respects the prevalent
vocabulary for spreadsheets is used: column, row, cell and formula refer to the
corresponding items in the spreadsheets. The word grid refers to a rectangle
containing many cells of similar form and content.
Documentation of the empirical work was done in three different ways.
Firstly, the whole development work for the model, and all analysis cases were
done using the computer, and each different stage in the development work was
filed individually. The files thus formed the basic documentation source. In the
first three pilot analyses the analysis work was started using paper forms of the
“Concept“ and “Resourceanalysis” tables. These forms documented activities
during the start of the analysis work in these first analyses.
Secondly, printouts were made of individual stages and analyses, and
comments were made on these printouts, particularly during and immediately
after the analysis sessions.

103
Thirdly, interviews were held with the individuals involved in the development
work after the conclusion of the development project. A standard form was
used in the interviews. Samples of notations and interview forms appear in
Appendix 4.
4.2. Progress During the Development Work
The presentation of the development work is divided chronologically into
phases. Each base is then divided into stages. The phases involve preliminary
structuring, pretesting and the selection of pilot firms and next the first phase
of interactive development through testing with pilot cases. Then followed
intermediate development work, the second phase of interactive development
through testing with pilot cases, and finally the development of the commercial
EDCP analysis system. In the analysis system the EDCP model was applied
into the model carrier in the form of tables in a spreadsheet computer program.
The files of the spreadsheet program are referred to as bases. Each base
represents a development stage of the tables. All significant development stages
are presented in consecutive order in Appendix 3.
Table 41. Phases in the development of EDCP bases #1736#
Phase Number ofstages in
phaseExtension structuring and Prepilot analyses 5Pilot analyses, 1. sequence 2Intermediate development 3Pilot analyses, 2. sequence 1Development of final bases 1
Each phase is divided into several stages that describe the changes during the
phase. The changes are typified according to one of two main groups: structural
changes and functional changes. Structural changes relate to the model itself

104
Table 42. Types of changes in the EDCP bases during the developmentwork #1737#
Structural changes Functional changesWhole analysis ListingProject Presentation table RatingConcept table Use/InterfaceResources table Result valueResult table Manual transfer/automatic transferDeliverable Intermediate process
e.g., tables or spreadsheet functions. Functional changes deal with activities
during the analysis process e.g., listing, rating, or data transfer. The phases are
presented in the Table 41 and the types of changes in the Table 42.
4.2.1. Extension Structuring and Pretesting
In the phase called “Extension structuring and Prepilot analyses” the
“Concept“ and “Resourceanalysis” tables were enhanced with facilities to
express risk concentrations by means of result presentation facilities and
structuring facilities for report preparation. This phase involved the four first
development stages.
The facilities for presenting risk concentrations include numerical rating for
certain intermediates, as well as the calculation of numerical risk factors from
the ratings. These factors express risk concentrations. Rating in the “Concept
analysis” table included significance (to the project), marketing benefit and
technical problems for each attribute. Further rating was performed for the
significance, difficulty and newness of each knowledge area in connection to
each attributeconcept pair. In the “Resource analysis” table the significance,
ability and experience of each resource component in each knowledge area was
rated for each attributecomponent pair. Risk factors for attributecomponent
pairs were calculated separately in the “Conceptanalysis” table, and risk
factors for the resource components were calculated separately in the

105
“Resource analysis” table. Risk factors regarding the knowledge areas were
also calculated in the “Resource analysis” table. The “Concept” and “Resource
analysis” tables were filed as separate files (Figures 1.1. – 1.3. in Appendix 3).
The grid structure for analysis was introduced (Fig. 2.1. in Appendix 3).
Another important improvement was to incorporate all tables in the same Excel
file (Fig. 3.1. and 3.2., Appendix 3). Furthermore, weighted corresponding risk
factors were calculated for all risk factors mentioned above, the weighting was
calculated according to the number of rated items (Fig. 4.1. and 4.2. in
Appendix 3). The tables were situated either besides or on top of each other, as
seen in Figures 1.1 – 4.1, in Appendix 3. The stage 5type base was later
extended with a table for reporting analysis results (Figure 41). This table
contains columns for concept, resources and technologies and their respective
risk factors and weighted risk factors. Data and values were automatically
transferred from the “Concept” and “Resource analysis” tables to their
respective places in the table. Examples of transferring formulas are shown in
the figure.
The phase of “Extension structuring and Prepilot analyses” took place in five
consecutive stages during which the tables and facilities were gradually
developed. The model was tested in analyses of a small number of projects,
some of which were fictive. Figures 41 and 42 show the state of development
when the pilot firms were introduced into the project of model development.
The improvements are indicated by means of arrows and text boxes in the
figures. Figure 41 also indicates terms used in the description of the
development work. The term table refers to a table usually of a spreadsheet that
is used either for analysis work or to display results of the analysis. Column
refers to a column in the table, and group refers to a group of tables. Cell means
a single cell of the table and grid means a rectangular group of cells. The
algorithm or formula is located in a cell and it calculates a value of numbers
entered into other cells.

106
conres42.xls CONCEPT #1678#
Project name:
CONCEPTATTRIBUTES
CONCEPTCOMPONENTS
TECHNOLOGY OR KNOWLEDGE AREAPRESENTATION
RISK FACTORSOF CONCEPT
Sig
nific
anc
eM
arke
tbe
nefit
Tech
n.P
robl
ems
Tech
nolo
gy Tech
nolo
gy Tech
nolo
gy Tech
nolo
gy Tech
nolo
gy
technol. tested
Xxxxxxxxxxxxxxxxxxxxxxxx Xx xx Xx Xxxxxxxx
Sig
n.A
bilit
y Exp
er. S
ign.
Abi
lity E
xpe
r. Sig
n.A
bilit
y Exp
er. S
ign.
Abi
lity E
xpe
r. Sig
n.A
bilit
y Exp
er. #
ofte
ch.
rate
dRiskfactors
Weighedriskfactors
1 1 11 1 1
1 1 11 1 11 1 1
1 1 1
EDCP analysis formPage 2
The lower part of thistable is omitted!
R E S O U R C E SProject name:H I J L
RESOURCESPRESENTATION
RESOURCEANALYSIS
RESOURCECOMPONENTS
TECHNOLOGY OR KNOWLEDGE AREAPRESENTATION # of tech.rated
RISK FACTORSOF RESOURCES
Resource attributes Significance
Tech
nolo
gy 0 0
Tech
nolo
gy 0 0
Tech
nolo
gy 0 0
Tech
nolo
gy 0 0 0Te
chno
logy 0 0 technol. Tested
Xxxxxxxxxxxxxxxxxxxxxxxx Xx xxxxxxxxxxxxxxxxxxxxxxxx
Sig
n.A
bilit
yE
xper
.
Sig
n.A
bilit
yE
xper
.
Sig
n.A
bilit
yE
xper
.
Sig
n.A
bilit
yE
xper
.
Sig
n.A
bilit
yE
xper
.
# of
tech
.rate
d Riskfactors
Weighedriskfactors
1 1 1 1 1 1
1 1 1 1 1 11 1 1 1 1 11 1 1 1 1 1 =C28*J28*
K281 1 1 1 1 1
1 1 1 1 1 1
# attr/comppairs
This is an excerpt of a largertable!
M Risk factors/ /weighedrf:s related totechnologies
Figure 41. “Concept” and “Resource analysis” tables in Stage 5.
NEWN
EW: C
once
pt a
nd R
esou
rces
anal
ysis
tabl
es b
elow
eac
h ot
her
NEW
Ne
Ne
NEW
TableGroupColumn
Cell Algorithm orformula
Grid

107
ED
CP
RA
POR
TT
ILO
MA
KE
Proj
ektin
nim
i: (f
ile ..
..\co
resu
51.x
ls)
Päiv
ämää
rä ja
aik
a:
KO
NSE
PTI
#179
7#R
ESU
RSS
ITO
SAA
MIS
AL
UE
ET
Kon
sept
iR
esur
ssit
Om
inai
suus
/osa
Pa
riTe
stat
t.os
.al.
lkm
Ris
kin
te
kijä
t
Punn
itut
riski
ntek
Om
inai
suus
/osa
pa
ritTe
stat
t.os
.al.
lkm
Ris
kin
te
kijä
t
Punn
itut
riski
ntek
Tech
nolo
gyom
in/o
sapa
rilk
mR
iski
n
teki
jät
Punn
itut
riski
ntek
omin
/osa
pari
lkm
Ris
kin
teki
jät
Punn
itu tris
kint
ek
=BJ1
8 =B
K18
=B72
=BI7
2=B
J72
=BK
72=A
G51
=AG
101
Figu
re 4
2. R
epor
t for
m, S
tage
5, d
ata
and
valu
es a
re tr
ansf
erre
d vi
a th
e tra
nsfe
r for
mul
as fr
om th
e an
alys
is ta
bles
to th
eir
resp
ectiv
e pl
aces
in th
e re
port
tabl
e.
Tran
sfer
ring
form
ulas

108
4.2.2. Selection of Pilot Firms
The work in stages 1 – 5 revealed that further development of the EDCP model
required access to actual innovation projects that could be used as exercise
objects for the developer. This aim was approached by combining the effort in
the exercise projects with the obtaining of funds for further development of the
model.
Pilot firms were selected through contacts from Helsinki School of Economics
and Business Administration (HKKK), Innopoli Mentor Program, Technical
Research Centre of Finland (VTT), the National Technology Agency (TEKES),
and through personal contacts.
Table 43. Selection of Pilot Firms for the EDCP Project #1752#
Source Number of firmstotal selected
Innopoli Mentor Program 13 6Helsinki School of Economics and Business
Administration (HKKK)3 2
Laatutieto Oy 7 2Finnish Food Industry's Federation 10 Technical Research Centre of Finland (VTT) 2 2Sesam Consulting Oy 1 1Mikael Epstein 1 1other pilot firm 1 1TEKES 1 1
Total 39 16
Table 43 shows the sources of contacts and the number of firms involved.
Table 44 presents the firms approached through the different sources. For
reasons of confidentiality the firms’ names have been coded.

109
The selection process resulted in a group of 16 firms having annual turnover of
1 – 1200 million marks, and employing 1 12500 persons. The firms
represented manufacturing and development companies.
Contact to the firms was made first by telephone, then by telefaxing a short
description of the model (Appendix 5). After this the formal paper work for
connecting each pilot firm to TEKES’s project was undertaken. The selected
firms are categorized in Table 44.
During the selection process means were developed to present the EDCP
development project to prospective pilot firms and to financiers. The means
included a short description of EDCP (Appendix 5) and forms for fax
correspondence with the firms.
Table 44. Categories of Pilot Firms #1753#
Code *) Source Turnovermmk
Personnel
H HKKK 1,5
L Laatutieto Oy 370 600E VTT 3C Sesam Consulting Oy 2530 36M Innopoli Mentor Program 3 5 + sub
contractO VTT 1P Innopoli Mentor Program 2J Innopoli Mentor Program 11 12B ME 60 50D Innopoli Mentor Program 12 9K HKKKN Innopoli Mentor Program 1 2G Innopoli Mentor Program stays
alive1
I Laatutieto Oy 160 270A other pilot firm 55 80F TEKES 2000 12.500
*) names of pilot firms are coded because of confidentiality reasons

110
4.2.3. The Analysis Sessions
The first session in each pilot firm involved presentation of the EDCP method
and its basic principles.
The time invested for each analysis proved to be one of the most important
factors for the pilot firms. The representatives of most of the pilot firms
repeatedly pointed out the importance of a fast analysis method. Lack of time
was also a frequent reason for the postponement of analysis sessions.
EDCP analysis tables in Excel containing data of a fictive project (demo
analysis) provided a vehicle for demonstration of the different features of
EDCP analysis system. It also served as an instruction tool for the EDCP
analysis process. The first session acted as the main instruction occasion for the
analysis team. The demo analysis and the instruction occasion during the first
session were the only means needed for instruction purposes. After the
introduction procedure the first project was selected, and in some cases the
analysis work was started immediately. The analysis processes were started
with a definition of the project in the selfexplanatory “Project presentation”
table. During the first session the premises and the equipment for performing
the analysis were chosen. The first session used to follow the same pattern in
all pilot firms, the first two firms formed an exception; only a written
description of EDCP was used instead of the demo analysis.
The researcher made notes about observations regarding the development of the
model during the sessions in addition to his work as the facilitator of the
session. The notes were often done on the spot on the printouts of the analysis
tables. Appendix 6 shows some examples of tables.#1726#

111
During the second and the following sessions the analysis was continued. In the
“Conceptanalysis” table the attributes were first listed, their significance,
marketing benefit, and technical problems were rated. Then the components for
each attribute were listed and rows were added when needed. Thus the
attributeconcept pairs that identified the concept were generated. Thereafter
the knowledge areas were listed, the team members listed the knowledge areas
based on their personal experience and knowledge of the requirements of the
attributecomponent pairs. Then followed rating of the significance, difficulty
and newness of every knowledge area for each attributecomponent pair. This
rating took place in the grid below the row of listed technologies or knowledge
areas. When the rating was finished the risk factors of the concept were
available, and in many analysis cases they were discussed with the analysis
team. In some cases graphs were produced at this moment during the session if
a printer was available.
When the concept analysis was finished the resource components (resources)
were listed in the “Resource analysis” table for each attributeconcept pair. The
analysis team listed the resources based on their personal knowledge about the
firm’s own resources and external resources. Data from the attribute
component pairs was copied automatically from the “Conceptanalysis” table to
the appropriate column in the “Resource analysis” table. The availability of the
resource components was rated, and then followed rating of the resource’s
significance, ability and experience in respect to each knowledge area. This
rating was performed in the “Resource analysis” table’s grid. Table 45
presents the items listed and rated during an EDCP –analysis. They appear
practically in the order in which they were dealt with during the proceeding
analysis.

112
Table 45 Items listed and rated during EDCP Analysis#2126#
Table Item PurposeAttributes listed Characterizes conceptSignificance of attribute to project rated Rates attributeMarket benefit of attribute to project rated Rates attributeTechnical problems rated Rates attributeConcept components listed Characterizes conceptKnowledge areas rated Characterizes concept, links
concept to resourcesComments to concept listed Characterizes conceptSignificance of knowledge area forrealization of attribute rated
Rates knowledge area
Difficulty of attributecomponent pair inknowledge area rated
Rates knowledge area
Concept
Newness of attributecomponent pair inknowledge area rated
Rates knowledge area
Resource components listed Characterizes resourcesAbility of resource components inknowledge area rated
Rates resource component
Experience of resource components inknowledge area rated
Rates resource component
Availability of resource components rated Rates resource component
Resource
Comments to resources listed Characterizes resourcesBusiness area indicated Characterizes projectStage of development indicated Indicates character of projectPlace in organization indicated Indicates character of projectRelated projects listed Indicates place in organizationLimits of project listed Defines borders of analysis
Projectpresentation
Sequences of realization listed Organizes analysis
After the resource analysis was finished the data feeding part of the analysis
work was completed. The “Analysis result”tables and graphs were printed
during the final session in those pilot firms that possessed printing facilities, for
other firms the developer did the printing work. The final session also included
a concluding discussion about the consequences of the analysis results for the
project, and about necessary improvements for the analysis method.
The type of premises for the sessions varied between a negotiating room, an
office of analysis teammember or another office. In about half of the pilot

113
firms the premises varied from session to session. The equipment (computer)
was provided either by the firm or by the researcher. In about half of the
projects both the researcher’s and the firm’s computers were used. The
equipment changed from session to session in slightly less than half of the pilot
firms, two of the pilot firms used the researcher’s computer for all sessions.
The researcher operated the computer during all sessions in six of the pilot
firms. In the other firms team members learned how to operate the EDCP
system on the computer so that they could operate the program after at least the
third session. Changes occurred in the composition of the team in half of the
pilot firms. A large change, affecting approximately 60% of the members,
occurred in two pilot firms.
4.2.4. Pilot Analyses, First Sequence
Stage 6
The analysis work in the first seven sessions was done using printed paper
forms of the “Concept” and “Resource analysis” tables that were filled in by
hand. After the analysis sessions the researcher transferred the data from the
paper forms into the computer using his own facilities. This method proved
awkward because changes to the notes in the form were very difficult to
perform, as seen from Appendix 6. This prompted analysis to be made direct on
the computer. Experience was gained with the base (Figures 41, 42) from 10
different projects. Problems encountered were: difficulties in putting questions
and in sorting out unneeded items, as well as in documenting the discussion and
in coordination between different parts in the table. There were also
difficulties to define attributes and components in the “Conceptanalysis” table,
and the table also grew awkwardly big during the progress of the analyses.
Visibility in the table was also poor, when the tables appeared on computer
screens. Rating was considered dull and problems arouse about how to rate e.g.,
“resource components of the future” Awkward situations were encountered

114
with “old” knowledge areas from which unexpected problems could come.
Difficulties with manual row additions in the analysis tables became apparent.
Some members of the analysis teams presented wishes about “automated” row
addition. Important changes included improvements of the visibility by
choosing larger font, by printing practically all headings horizontally (instead
of vertically, as in Fig. 41). A translation of the headings to the Finnish
language was introduced on request by many analysis teams. The deliverables
were also improved by reporting the number of attributecomponent pairs
analyzed for each knowledge area, Figure 6.1. in Appendix 3. A separate table
of the knowledge areas and their risk factor values was also provided.
An exemplar case (Firm M) is described in chapter 4.1.1. Four more projects
were started using the stage 6type base in the commencing sessions. The
analyses were later transferred to the further developed base of stage 7. In
Appendix 7 exemplar cases of firms B, C, E, I, and K are shown as examples of
some pilot projects analyzed.
Ideas were also given by the pilots about series of questions, about the use of a
report generator, as well as of the use of multispreadsheet structure. The bases
described so far were developed in Microsoft Excel 4 â that has only one
spreadsheet, the newer MS Excel 5 â offered several sheets and became
commonly available among the pilot firms during the time of the development
work. Wishes were further made of a “lighter” program. A twostep approach
to the analysis performance was also suggested. The first step would check
whether the concept was fit for analysis, the second step would involve a
deeper analysis.
The suggestions given by the pilot firms gave guidelines for the development of
a new base. This base, representing stage 7, utilized the multispreadsheet
structure of Excel 5. Separate sheets were provided for the “Concept” and

115
“Resource analysis” tables and for the table presenting the Knowledge area risk
factors. The structures for the analysis tables and for the table of Knowledge
area analysis results were the same as those in the stage 6 base. Because each
sheet occupied only one table more space became available and visibility could
further be improved by means of larger font. Easier transfer between tables in
the multisheet structure of Excel 5 also improved the ability to quickly view
items on different tables. Separate sheets were also provided as holders of
diagrams of the analysis results for the concept, the resources and the
knowledge area.
Stage 7
Data of four unfinished project analyses were transferred from stage 6type
bases to the new base. Three new project analyses were initiated on the stage 7
base (see Figures 7.1. 7.2. in Appendix 3). Appendix 7 shows examples of
such project analyses. During the progression of these analyses columns and
rows for comments to attributeconcept pairs and for knowledge areas were
added to “Concept” and “Resource analysis” tables. To satisfy the wants of the
pilot firms, the rating work was made easier through rating two attributerelated
ratings (“difficulty for us” and “newness in general”) in only one site for each
knowledge area, the corresponding values in the rows below were filledin
automatically. Separate collating tables were created for risk factors and the
comments from “Concept” and “Resource analysis” tables. A separate table
for knowledge related risk factors was also introduced in the stage 7version. In
connection with the stage 7base a list of the algorithms was provided to the
pilot firms (see Appendix 8). Three projects were started using the Stage 6type
base. These projects are shown in more detail in Appendix 7.
Based on experiences from a number of projects, and on requests by pilot
firms, an individual sheet for project presentation was provided, it contained
one partition for characterizing the project, branch, for reporting the stage of

116
development and organizational site. Another partition was intended for pre
analysis of the project (stage one of the twostage analysis, see Figure 7.1 in
Appendix 3). A more developed version of the Project presentation table is
presented in Figure 9.1., Appendix 3.
4.2.5. Intermediate Development
Stage 8
Stage 8 involved the improvement of the interface between model and user,
achieved by the gradual development of automation using MS Visual Basic â
programmed macros that are part of the MS Excel â program. The primary
objective for developing macros was the need for the addition of rows, and for
the coordination of the rows in the “Conceptanalysis” and the “Resource
analysis” tables that were located on separate sheets. This was desired by those
pilot firms who themselves did the analysis work, and also the researcher’s own
experience prompted such improvements. By coordinating the rows of concept
attributecomponent pairs in the “Conceptanalysis” table with the
corresponding attributecomponentresource group rows in the “Resource
analysis” table computerized calculations could be done for matching
“Concept” and resource related risks. Furthermore, programmed rowaddition
and deleting enhanced inserting of additional attributes and components
between existing ones. The pilot firms’ teams appreciated this feature
immediately upon its appearance. #1693#
Guidance of the analyzers was another objective when improving the interface
between user and computer model. The MS Visual Basic â program was also
used to create macros that provided the analyzers information on how to fill in
the columns with text or rating numbers. When appropriate, this function was

117
linked to text earlier entered by the analyzers into the columns of the analysis
tables so that terms used by the analyzers became integrated into the guidance
messages (Figure 43).
CONCEPT ANALYSIS#1833#
Attributes orproperties (property by which weadd value to theconcept for our clientand for ourselves)
Significance
Componentsof theConcept(components bywhich the propertiesare realized)
COMMEN
TS
Analysis team’scompetence
Knowledge areas
durabilitycalculus
plasticsmatl.technol.
plasticsseamtechnol.
testingtechnol.
COMMENTS> plasticscours
Durability 5 Geometry 4 durability calculus 1 4 3 4 2
Durability 5 support platematerial
2 plastics matl. technol. 2 2
Durability 5 surface film 3 plastics seam technol. 3 4 3 3 4
Durability 5 seam method weldin 3 testing technol. 4
Replaceability 3 Geometry 5 machine design 5 5 2 2Replaceability 3 Seams 2 plastics processing 6
space effectiveness 4 Geometry 5 wood processing 7 4 3 4 4space effectiveness 4 surface film nylon 4 industrial design 8 5Functionality 5 Geometry 2 quality technol. 9 5 5 5 5Functionality 5 surface film 1 Networking 10 5Outlook 1 Geometry 1 patent law 11 2 2 3Outlook 1 Finish Knowledge area 12
Cost 4 material selection Knowledge area 13 3
ãMikael Epstein 1997, 1998This is an excerpt from a larger table!
Figure 43. The figure shows how the guidance system presents answers inmessage boxes depending on where the analyser has placed the cursor. Thearrows show how the answers are built up using words that the analysers haveentered into the analysis table. The leftmost message box was produced whenthe cursor was in the cell containing the word “Replacability”, the lower boxwith the cursor in the cell containing the number “5” (Note that mostspreadsheet programs can present only one answer box at each time). This is anexcerpt from a larger table!
The guidance system was first applied for the attribute, significance and
componentcolumns. Later on, the guidance was extended to the grid area for
rating the knowledge areas. This entire development was done using the stage
? R+ R
Question for components
Wherewith/how do we carry replacabilityinto effect ?
OK
Question for components
How significant is plastics matl. technol. when space effectivenessis realized by means of surface film ?
OK

118
7type base, without the preanalysis sheet and linked rows. An example of the
guidance feature is shown in Figure 43. Appendix 9 lists all the questions,
suggestions and explanations included in the guidance system.
Stage 9
The idea of a quick and simple analysis was realized in stage 9. This was the
answer to the wish of several analysis teams for a “lighter” analysis system.
One important aim of the version was to prohibit the analyses to expand
excessively and thus to become difficult to handle effectively. Two similar
tables were placed under each other, “Conceptanalysis” table on top and
Resources analysis table below (see Figures 9.2. and 9.3. in Appendix 3). The
number of ratings for the attributes was reduced so that only the significance
for the knowledge areas was rated in the “Conceptanalysis” table. The rating
for significance included both regarding of significance to customer and the
regarding of market benefit. The rating of technical problem was omitted. This
reduced the requirements of rating by two ratings for each attribute. Also in the
“Resource analysis” table the number of ratings was reduced to deal only with
the ability of the resource component. The base was gradually enhanced by
placing the “Project presentation” table on a separate sheet, and by enlarging it
with a column for sequences of the project’s progression. Ratings in the grid of
the “Conceptanalysis” table were made to copy to the “Resource analysis”
table, for indicating cells of that table to fill in. This version had no row
addition or –deletion functions. 30 rows and 20 knowledge areas were
sufficient for work with this version. This work resulted in a base as shown in
Figure 44. The development involved interaction through 13 pilot analyses.
Finally, a separate sheet was provided for presentation of the project (Figure
9.1. in Appendix 3). It contains spaces for characterizing the project’s business
area, stage of development and organizational site. Furthermore, linked projects
are listed, as well as limits to the project. Space was also provided for listing of
119
the planned sequences for project realization for cases with advanced project
planning.
During Stage 9 additional guidance macros were developed using a multisheet
base. Measures were also taken to avoid mistakes when using the macros. Such
mistakes included nonintended rowadditions or –deletions in inappropriate
rows. Macros that coordinated the structure of analysis tables on two Excel
sheets were also developed. This work was done separate from the
development of the simplified version described above.
Stage 10
The “Conceptanalysis” table and, correspondingly the “Resource analysis”
table, of the stage 7 type base were divided into four separate identical tables
situated below each other. This was done in order to facilitate the grouping of
the analysis for appropriate purposes. Each one of these tables could be used
separately so that four independent analyses could be carried out in the same
base. This type is shown in Figure 10.1. in Appendix 3. Additional features
involved sorting tables for analysis results and tables for preparing an analysis
report. These tables were located on separate sheets (Fig. 10.2. in Appendix 3).#1699#

120
#169
8#
KO
NSE
PTIN
ESI
AN
ALY
YSI
Not
eera
ttuje
nos
aam
isal
ueid
enlu
kum
äärä
tät
>
RE
SUR
SSIE
N E
SI
AN
AL
YY
SIte
kniik
ka ate
st.Ta
rve
teki
jätP
aino
tetu
tta
rve
teki
jätK
onse
ptin
PÄ
Ä
omin
aisu
udet
tai –
tunt
omer
kit
(om
inai
suus
, jol
la h
alua
mm
epa
rant
aa tu
otet
ta ta
i pal
velu
aas
iakk
aan
ja m
eidä
n ed
uksi
)
Mer
kits
evy
ysK
onse
ptin
osa
tta
i kom
pone
ntit
(avu
t, jo
illa
omin
aisu
usai
kaan
saad
aan)
EI N
IME
TÄ ID
EO
INTI
A
STE
ELL
A O
LEV
ILLE
PR
OJE
KTE
ILLE
Osaamisalue taiteknologia
Osaamisalue taiteknologia
Osaamisalue taiteknologia
Osaamisalue taiteknologia
Osaamisalue taiteknologia
Osaamisalue taiteknologia
Osaamisalue taiteknologia
Osaamisalue taiteknologia
Saatavuus
Res
urss
ien
osat
tai
kom
pone
ntit
(avu
t, jo
illa
omin
aisu
usai
kaan
saad
aan)
Osaamisalue taiteknologia
Osaamisalue taiteknologia
Osaamisalue taiteknologia
Osaamisalue taiteknologia
Osaamisalue taiteknologia
Osaamisalue taiteknologia
Osaamisalue taiteknologia
Osaamisalue taiteknologia
K
OM
MEN
TIT
>
kpl
ei täyt
etä
!
ei täyt
etä
!
ei tä
ytet
ä !
KOMMENTIT >
ÇMerkitt
ÇMerkitt
ÇMerkitt
ÇMerkitt
ÇMerkitt
ÇMerkitt
ÇMerkitt
ÇMerkitt
KOMMENTIT >
Kyvyt/KokemusVarustus/Kunto
Kyvyt/KokemusVarustus/Kunto
Kyvyt/KokemusVarustus/Kunto
Kyvyt/KokemusVarustus/Kunto
Kyvyt/KokemusVarustus/Kunto
Kyvyt/KokemusVarustus/Kunto
Kyvyt/KokemusVarustus/Kunto
Kyvyt/KokemusVarustus/Kunto
Jää
Jää
2Fi
ll!
2Fi
ll!4
Fill!
5Fi
ll
..
..
...
. .
..
..
..
..
..
Figu
re 4
4. “
Con
cept
ana
lysi
s” ta
ble,
and
to th
e rig
ht a
n ex
cerp
t of t
he R
esou
rces
tabl
e.
New
: num
ber o
f rat
ing
crite
riare
duce
d to
one
per
kno
wle
dge
New
: ind
icat
ion
for r
atin
gin
Res
ourc
es ta
ble
atco
rres
pond
ing
cells
tora
tings
in C
once
pt ta
ble

121
4.2.6 Pilot Analyses, Second Sequence
Stage 11
Trials were made to develop an individual base for one particular pilot firm. The
development was performed in interactive cooperation with several members of
the firm’s analysis team. The work was done in three steps during which parts
from the stage 7 and stage 10bases were assembled together and transformed.
The development work aimed at improving the focusing of the project definition,
at identifying challenges and important items of the project. Evaluation of the
availability of resource components and integration of the concept and resource
analysis functions were also objectives of the development. The pilot firm
furthermore strove to simplify the EDCPanalysis work. Primary targets for
improvement were the analysis tables, the deliverables, and the algorithms. The
work involved development of the input operation, the algorithms and the
deliverables. It also involved improvement of the macros to fit the interface
requirements of the firm. Starting point for the work was the stage 10base. The
changes included a column for listing all the needs of project prior to listing the
attributes. The term “Technical problems” was changed to “Technical challenges”,
furthermore, new terms were added: “Importance” (equals sum of ratings for
“Significance” and “Market benefit” of attribute), and “Criticality” (equals
“Importance” value divided with rated value for “Technical challenge”). A column
for rating the availability of each resource component was introduced. The number
of ratings for the knowledge areas in the “Resource analysis” table was reduced to
cover only the “Quality” of each resource component, and this reduced the number
of ratings by two for each attributecomponentresource group for each knowledge
area.
122
The most important contributions in Stage 11 were the reduction of the number of
ratings in the “Resource analysis” table and the introduction of the rating of the
availability of resource components.
4.2.7 Development of the Final Bases and the Final Analysis System
Stage 12
The Tables
Based particularly on the experiences from the large number of analyses with the
stage 9type base and also on the experiences from the development work in stage
11 we decided to develop a base that combines simplicity and an effective
interface. The stage 9 base type (Figure 44) formed the starting point for the
development that involved the structure, algorithms, deliverables and interface.
Structural development involved situating “Concept“ and “Resources analysis”
tables besides of each other on the same analysis sheet. The rating work was
simplified by limiting the rated items to one per attributecomponent pair for each
knowledge area in the grids of both the “Concept” and “Resources analysis”
table. The significance of each knowledge area to the realization of each attribute
through the component was rated in the “Concept analysis” table and the ability of
the resource component for each attributecomponent pair was rated in the
“Resource analysis” table. Furthermore a separate column was introduced for
listing the knowledge areas instead of listing them directly in each knowledge area
column atop of the grid. A new type of formula was developed for calculating the
risk factors related to the resources. This formula involves numeral weighing with
parameters for the different rating numbers (51) so that the sensibility of the

123
analysis can be controlled. That formula was used the “Resource analysis” table:
Here the inverse proportionality of the ratings for the goodness of the resource
components is represented by the sum of products of the rated digits in one row
and parameters. The weighting parameters represent the decrease of risk with
increasing goodness. The representation functions so that the weighting parameter
for the lowest rating digit (1) is considerably bigger (12) than the parameter (0,1)
for the highest rating digit (5). The model also allowed changing of the weighting
parameters and this made a change of the sensitivity of the evaluation of the
ratings possible. In the model the sensitivity is illustrated by a graph, and by an
Excel adjustment table below for entering the weights for ratings (Figure 45).
A list of all formulas in EDCP appears in Appendix 8.
Conc Res CG9 1 CH9 2 CI9 3 CJ9 4 CK9 5
Rating> 1 2 3 4 5Weights for ratingsà 12 3,7 1,7 0,5 0,1
Figure 45. The profile diagram and adjustment table of the sensitivity of theanalysis.
The analysis tables of stage 12 appear in the Figures 46, 47, 48, and 49. This
development required five intermediate versions of bases, seven pilot cases were
involved in the development of this base.
R e s o u rc e ra t in g w e ig h ts
05
1 01 5
W e ig h tsfo rra t in g s >
significance to projectavailability of resource
*) # = number of
lack factor= (#*) 1:s in row´ 12+# 2:s in row´ 3.7+#31:s in row´ 1,7+# 4:s in row´ 0,5+# 5:s in row´0,1)

124
CONCEPT ANALYSIS #1856#
Knowledgeareas
Attributes Significance
Components
CO
MM
ENT
Analyzers’
competence
Knowledgeareas
durabilitycalculus
plasticsmatl.technol.
plasticsseamtechnol.
COMMENTSà
plasticscours
Durability 5 Geometry 4 durability calculus 4 3 4Durability 5 support plate material 2 Plastics matl. technol.Durability 5 surface film 3 Plastics seam technol. 4 3 3Durability 5 Seam method weldi
n3 Testing technol.
Replaceability 3 Geometry 5 machine design 5 2Replaceability 3 Seams 2 Plastics processingspace effectiveness 4 Geometry 5 wood processing 4 3 4space effectiveness 4 Surface film nylon 4 industrial designFunctionality 5 Geometry 2 Quality technol. 5 5 5Functionality 5 Surface film 1 NetworkingOutlook 1 Geometry 1 Patent law 2 2Outlook 1 Finish Knowledge areaCost 4 Material selection Knowledge area
ãMikael Epstein 1997, 1998, 2001This is an excerpt from a larger table!
Figure 46. The “Conceptanalysis” table.
Deliverables
The analysis results were presented in two tables, the “Collation table for analysis
results” (Figure 48) and the “Collation table for knowledge areas” (Figure 49).
The “Collation table for analysis results presented” the risk factors for each
attributecomponentresource group, and it also presented the comments to the
attributecomponentresource groups from the concept and resource analyses. The
“Collation table for the knowledge areas” presented the risk factors for each
knowledge area as well as the comments for the knowledge areas from the
“Concept” and “Resource analysis” tables. The interface development involved
? R+
R
NEW:Knowledge areaslisted horizontallyin separate
New:Only one rating perknowledge area

125
macros for guidance, explaining calculation formulas in the “Collation table for
analysis results”. Furthermore macros were provided for narrowing and widening
the columns for abbreviations as well as the column for listing knowledge areas.
RESOURCE ANALYSIS #1857#
Knowledge areas
Attributecomponent pairs Significance
Resource components(persons, machines, contractors,etc. that realize Attributes)
Res
ourc
eav
aila
bilit
y
Com
men
ts
durabilitycalculus
plasticsmatl.technol.
plasticsseamtechnol.
COMMENTS >
R1 durability & geometry 5 KV, PJ, PK, JM, TV, VT, Varo Co, Kotay 3 depen 2 3 3R2 durability & support plate material 5 Varo Co, 5 DepeR3 durability & surface film 5 KV, PJ, PK, JM, TV, VT, Varo Co., Kotay 4 2 3 2R4 durability & seam method 5 KV, JM, TV, SR, Varo Co., Kotay, TKK, 1R5 replaceability & geometry 3 KV 1 5 5R6 replaceability & seams 3 KV, JM, VT, PJ, JS, SR, PS, KM, 3R7 space effectiveness & geometry 4 KV, JM, VT, PJ, JS, SR, PS, KM, PK, 4 Shoul 4 2 4R8 space effectiveness & surface film 4 KV, JM, VT, PJ, PK, TV., Kotay 4R9 functionality & geometry 5 KV, JM, VT, PJ, PK, TV., Kotay, Varo Co. 4 3 4 2R10 functionality & surface film 5 KV, JM, VT, PJ, TV., Kotay, Varo Co., TKK 2 DepeR11 outlook & geometry 1 EK 4 4 4R12 outlook & finish 1 EK, CEW, 2R13 cost & material selection 4 KR, CEW, PH, TV, JM, Kota Ky, Varo Co., 3R14 cost & contractors 4 KR, CEW, PH, TV, Kota Ky, Varo Co., 5R15 cost & size of series 4 KR, CEW, PH, JM, Kota Ky, Varo Co., 1 4 5 2
ãMikael Epstein 1997, 1998, 2001This is an excerpt from a larger table!
Figure 47. The “Resources Analysis” table.
The results of the concept analysis are presented as a numerical “Requirement
factor” for every attributeconcept pair, for the resource analysis the results are
expressed as a numerical “Lack factor” for each attributecomponentresource
component group. The “Requirement factor” expresses how much staking each
attribute requires for making the attribute come true. The more requirements it
poses the more potential risk it causes for the project. The “Lack factor” expresses
? R+ R

126
the shortcomings of each resource component when it realizes each attribute by
means of its component. The bigger the “Lack factor”, the bigger is the potential
risk that the resource component causes to the project. The risks of the project as a
whole are expressed as a numerical “Risk factor” for each attributecomponent
resource component group.
The risks of each knowledge area are presented as numerical “Dependency
factors” relative to the concept, and “Deficiency factors” relative to the resources
and as a “Risk factor” relative to the project as a whole. The “Dependency factor”
expresses to which extent the project depends on each Knowledge area in order to
realize. The “Deficiency factor” expresses how much deficiency in each
knowledge area the resource components have when they realize the concept of
the project. The “Risk factor” of each knowledge area combines the “Dependency
“ and “Deficiency factors”.
The EDCP analysis points out the position of each risk in the project by presenting
numerical values. The analyzer is able to see which individual attributes and
which individual attributecomponent pair contribute to the risks of the project. It
also points out which resource components cause risk. Furthermore, it indicates
which knowledge areas the concept demands for its realization and points to those
knowledge areas for which the resources are insufficient. The risk factors of the
project as well as the risk factors of the knowledge areas give a general impression
of how the risk is structured in the project. From the risk factors the analyzer may
go backwards to the requirement factors and to the lack factors as well as to the
dependency factors and the deficiency factors. The analyzer may even want to
trace back to the individual combinations of attributes, components, resources and
knowledge areas and the ratings for these.

127
To assess the risks connected to the project one first looks for those attribute
conceptresource component groups that exhibit the biggest numbers for the risk
factors in relation to the project as a whole. Then one investigates whether the
risks of these groups are related more to the concept or to the resources. For this
COLLATION TABLE FOR ANALYSIS RESULTS #1649#
AttributeComponentResourcegroups
wghtdRequire
mentfactor
Requiremen
tfactor
Wghtd
Lackfacto
r
Lackfacto
r
weighted
Riskfactor
Riskfacto
r
#know
lareasevaluated
Commentsfrom Conceptanalysis
Commentsfrom Resourceanalysis
R1 dura & geomet &design , Var,Kot
14 155 1,55 17 241 2651 11
R2 dura & suppor & Varo 8 60 3,50 28 210 1680 8 depends on edgingmachine
R3 dura & surffi & design, Var,Kot
16 175 4,88 54 854 9392 11 depends on edgingmachine
R4 dura & seammt & r&d,Var,Kot, T
10 20 30,00 60 600 1200 2 Welding, riveting
r5 repl & geomet & KV 8 48 0,30 2 14 86 6r6 repl & seams & t&d,mark
11 45 1,50 6 68 270 4
r7 spac & geomet & r&d,mark, purc
14 108 3,10 25 335 2678 8 should the groupbe splitted
r8 spac & surffi & design ,Kotay
11 56 2,13 11 119 596 5 nylon, polyester
r9 func & geomet & r&d,Var,Kot
23 180 2,92 23 525 4200 8
r10 func & surffi & r&d,Var,Kot, T
14 70 3,77 19 264 1318 5 depends on edgingmachine
r11 look & geomet & EK 3 18 0,68 5 12 86 7r12 look & finish & EK,CEW,
2 6 0,03 0 0 1 3
r13 cost & m sele &export, Kot,Var
17 84 2,80 14 235 1176 5
r14 cost & contra &export, Kot
15 60 1,50 6 90 360 4
r15 cost & si ser & export,Kot
17 84 2,34 12 197 983 5
ãMikael Epstein 1997, 1998, 2002
Figure 48. Collation Table for Analysis Results.
?

128
purpose the relative size of the concept “Requirement factor” is compared with the
resource “Lack factor” for each group. The assessment procedure is enhanced by
means of the sorting function of the spreadsheet program. The attribute
componentresource groups, as well as the knowledge areas, can be ordered
according to the different risk factors. The sorting is quickly performed in the
tables, and separate printouts can be made for different risk functions e.g.,
“Requirement factor”, “Lack factor”, or “Risk factor” for whole project.
The analysis results are presented in two stages, the first stage being the “Collation
Table for Analysis Results” and the “Collation table for the Knowledge areas”.
The “Collation Table for Analysis Results” appears filled with the output data at
the end of the analysis process. The “Collation table for Analysis Results” is
shown in Figure 48, the “Collation table for the Knowledge areas” in Figure 49.
In addition to the Collation Table the first stage contains four diagrams: a diagram
showing the requirement factors, a diagram showing the lack factors and a
diagram showing the risk factors, all in relation to the attributecomponent pairs.
The analysis program also produces nine diagrams that show the profiles of the
different risk categories. The tenth diagram shows a profile for the competence of
the analyzing team relative to the knowledge areas. These tables and diagrams
appear instantly during the analysis process and are ready for use directly at the
end of the analysis, when the team evaluates analysisresults.
The second stage of results presentation consists of a report presented by the
consultant. The data for this report is edited on the Edit sheet where different
tables can be edited according to the requirements of the project owner. The report

129
consists of a verbal part prepared on a form in MS Word â and a number of
diagrams prepared from tables edited in the editing sheet.
Collation table for the knowledge areas #1650#
Knowledgearea
Dependencyfactor
(Risk ofKnowl.area reltoConcept)
weightedDependencyfactor
Deficiency factor
(Risk ofKnowl.area reltoResources)
weightedDeficiency factor
Risks ofProjectrel toKnowl.Areas
weightedrisks ofKnowl.Areas relto Project
#Knowlareas
evaluated
Comments
Diagram No 8 9 10 11 12 13 relative toConcept
relative toResources
durability calculus 22 4 10 2 227 45 5Plastics matl.Technol.
26 4 8 1 216 31 7 plastics course
Plastics seamtechnol.
29 4 18 2 513 64 8
testing technol. 39 4 15 1 601 55 11Machine design 29 3 19 2 545 55 10Plastics processing 38 3 17 1 654 54 12 designers to
Interplasexhibition inGermany!
wood processing 30 3 25 3 762 85 9 industrial design 23 3 9 1 216 24 9 Quality technol. 22 3 23 3 515 64 8 Networking 33 3 27 2 904 82 11 Patent law 21 2 23 2 477 48 10 patent law
coursemake contractwith patentattorney
Knowledge area Knowledge area Knowledge area
ãMikael Epstein 1997, 1998, 2002
Figure 49. Collation Table for Knowledge Areas.
An example of a diagram showing the risk concentrations for certain attribute
componentresource groups in a project is shown in the Figure 410. The xaxis

130
lists each attributecomponent pair (the text is abbreviated). The pillars express the
weighted requirement factors for each attributecomponent pair, the solid line the
corresponding (nonweighted) requirement factors. Other examples of diagrams
are presented in Appendix 10.
Figure 410. Diagram showing the risk factors for the attributecomponent pairs ofthe Concept analysis in a project.
Diagram 1.Requirement factors of Concept
5
10
15
20
25
dura
~geo
met
11
dura
~sup
por
8
dura
~sur
ffi 1
1
dura
~sea
mm
t 2
repl
~geo
met
6
repl
~sea
ms
4
spac
~geo
met
8
spac
~sur
ffi 5
func
~geo
met
8
func
~sur
ffi 5
look
~geo
met
7
look
~fin
ish
3
cost
~m s
ele
5
cost
~con
tra 4
cost
~si s
er 5
cost
~few
mo
6
disp
~m s
ele
2 ~
Wei
ghte
d re
quire
men
t fac
tors
20
40
60
80
100
120
140
160
180
Req
uire
men
t fac
tors
w eighted requirement fact.
requirement factor

131
Interpretation of the Analysis Results
The analysis results were interpreted at two different occasions, during the
analysis sessions and after the project analysis was completed. At certain intervals
during the sessions copies of the analysis tables were printed and, particularly at
the end of each session graphs were also printed. This practice proved very useful
for the motivation of the analyzers to continue, as they could vision the results of
their work during the progress of the analysis. Very little attention was, however,
paid by the analyzers to the risk values in the analysis tables during the progress of
COLLATION TABLE FOR ANALYSIS RESULTS #2133#
AttributeComponentResourcegroups
wghtdRequire
mentfactor
Requireme
ntfactor
WghtdLackfactor
Lackfactor
weighted Riskfactor
Riskfactor
#knowlareas
evaluated
Comments fromConcept analysis
Comments fromResource analysis
R3 dura & surffi & design, Var,Kot
16 175 4,88 54 854 9392 11 depends on edgingmachine
R4 dura & seammt & r&d,Var,Kot, T
10 20 30,00 60 600 1200 2 welding, riveting
r9 func & geomet & r&d,Var,Kot
23 180 2,92 23 525 4200 8
r7 spac & geomet & r&d,mark, purc
14 108 3,10 25 335 2678 8 should the groupbe splitted
r10 func & surffi & r&d,Var,Kot, T
14 70 3,77 19 264 1318 5 depends on edgingmachine
R1 dura & geomet &design , Var,Kot
14 155 1,55 17 241 2651 11
r13 cost & m sele &export, Kot,Var
17 84 2,80 14 235 1176 5
r5 repl & geomet & KV 8 48 0,30 2 14 86 6r11 look & geomet & EK 3 18 0,68 5 12 86 7r12 look & finish & EK,CEW,
2 6 0,03 0 0 1 3
ãMikael Epstein 1997, 1998, 2002(This is an excerpt of a larger table)
Figure 411. The top part of “Collation Table for Analysis Results” after sorting toinvestigate risk concentrations for the whole project.
?

132
the analysis. When the analysis was completed prints were taken of the analysis
tables and all graphs. Prints were also made of the Analysis results tables as soon
as they became available in the bases due to the basis development. The prints
were made in the pilot firm using their printer. Copies of all printed material were
handed over to the pilot firm. For many of the projects an Analysis Report form
(MS Word â) was prepared.
An example of an interpretation of the analysis results is demonstrated in Figure
411, showing the “Collation table for analysis results” after a sorting procedure
(only the top part is shown in the picture). Here the weighted risks (the sixth
column of the table) have been sorted in descending order. This shows that the
three biggest risks are concentrated to obtaining durability by means of surface
film with resources Varo Co. and Kotay (R3 dura & surffi & design , Var,Kot),
followed by obtaining durability by means of seaming method with resources
Varo Co., Kotay and TKK (R4 dura & seammt & r&d, Var,Kot, T), the third
biggest risk concentration being the obtaining of functionality by means of
geometry with resources r&d, Varo C. and Kotay (r9 func & geomet & r&d,
Var,Kot).
Correspondingly, risk concentrations pertaining to the concept are shown by
sorting the weighted requirement factors (second column of the abovementioned
table, and the risks concentrations from the resources by sorting the weighted lack
factors (fourth column).
In the same manner riskconcentrations among the knowledgeareas can be shown
by sorting the “Collation table for the knowledge areas”, as illustrated in Figure 4
12. Here the column for “Weighted risks of Knowledge Areas” relative to the
project was sorted, and consequently the three most risky knowledge areas are

133
Wood processing, Networking and Plastics seam technology. Appendix 11 shows
the interpretation and report of a demonstration project.
Collation table for the knowledge areas #1650#
Knowledge area Dependencyfactor
(RiskofKnowl.area reltoConcept)
weightedDependencyfactor
Deficiencyfactor
(RiskofKnowl.area reltoResources)
weightedDeficiencyfactor
RisksofProjectrel toKnowl.Areas
weighted risksofKnowl.Areasrel toProject
#Know
lareasevaluated
Comments
Diagram No 8 9 10 11 12 13 relative toConcept
relative toResources
wood processing 30 3 25 3 762 85 9 Networking 33 3 27 2 904 82 11Plastics seamtechnol.
29 4 18 2 513 64 8
Quality technol. 22 3 23 3 515 64 8testing technol. 39 4 15 1 601 55 11Machine design 29 3 19 2 545 55 10 Knowledge area
(This is an excerpt of a larger table)ãMikael Epstein 1997, 1998, 2002
Figure 412. Top part of Collation Table for Knowledge Areas, after sorting thecolumn for Weighted risks of Knowl. Areas rel to Project.
Analysis Report
The analysis form was prepared after the final analysis session by the researcher or
by some other facilitator. This work was done in the facilitator’s premises outside
of the pilot firm. Attributes, components and attributecomponentresource groups
as well as the calculated risk values were copied from the analysis tables into the
MS Word â form of the “Analysis Report”. Counts of individual attributes,
components, resources and identical pairs and groups were performed and the
different datagroups were transferred into tables in the report form. The attribute
component pairs and the attributecomponentresource groups were sorted

134
according to largeness of their respective risk factors. After sorting the different
categories were tabulated into tables in the “Analysis Report” form. An example
of the report is available in the Appendix 12.
Conclusions of Analysis
Conclusions of the analysis were drawn based on the data from the tables. The
conclusions were written into reserved spaces in the form. The report form could
be adapted to the need of the pilot firm e. g., by adding or leaving out portions. In
some cases conclusions were made separately for the analyses of concept and
resources, and for the analysis of the whole project. In other cases comments were
presented only for the whole project.
As complements to the Analysis Report Form prints of all graphs were supplied to
the pilot firm.
Presentations
The results of the analysis were normally presented to the representatives of the
pilot firm in a concluding session, the presentation often took the form of a
discussion. A few of the project the analyses were finalized only by mailing the
Analysis Report form.
4.2.8 Risk Analysis without Mentioning the Word Risk
The listing procedures in EDCP resemble brainstorming in that the analysis team
is asked to provide attributes, components, knowledge areas and resource
components. Osborne (1965) recommends that the members of a brainstorming
team must be able to work in a relaxed environment. Because the thought of risk
might act as a disturbing element to a team of persons that are intimately involved

135
an the project they analyze, EDCP has been designed so that no reference to risk
appears to the analyzers during the whole analysis procedure.
None of the headings in the tables used during the analysis contain any words
referring to the word risk nor do any of the statements in the guidance system. The
word risk appears only in the tables for analysis results that will be used after the
analysis is completed.
4.3. Summary of the Base Development Work
The base development work took place in six phases. The character of the phases
was dictated partly by the development work of the researcher, partly on the work
with the pilot firms. The phases can be grouped into three groups, the first group
when the researcher developed the model based partly on theory, partly on
experience. The next group of phases included work with the pilot firms’ projects
involving subsequent development of the bases, the work being supported by
experience in cooperation with the pilot firms. The final group regarded testing of
the new bases in analyses with pilots’ projects and the development of the final
base.
This stepwise approach allowed continuous application of experience from the
pilot firms and also the possibility to continuously benefit the pilot firms with
analysis results.

136
Introduction of Items into the Bases
After the model was conceived, as described in Chapters 3 and 4, items were
changed, and new items were added to or removed from the model in different
phases and stages. We apportioned the changes of the model into structural items
and functional items. Structural items are visible in the model, they can be
ascribed item classes e.g., tables, columns, rows, headings, data, or changes to the
configuration of tables. Functional items deal with the function of the model e.g.,
activities like entering or transferring data, calculation of result or intermediate
data. Also changing of some structural item, for instance the vision of a table is a
functional item, as is guidance of the analyzers. The algorithms form a third class
of items that are involved in the model.
Table 46 shows how many items have been changed during the different stages
during the pilot related development work. Most of the changes involved the
addition of new items; other changes included omitting or altering items. The
number of items was counted so that each different class of item was counted as a
new item e.g., each different type of column, row, cell, table, formula, or each
different type of entering, transfer, calculation of data was counted, and them
summed. Many of the items originated in requirements, requests or wishes from
the pilot firms. Other items were created on the researcher’s own initiative.
Appendix 13 lists the individual types of improvements made in each stage.
The Preliminary structuring and the Prepilot analysis phases (stages 15)
generated the Ex Ante model. The Ex Post model emerged during the 1st and 2nd
sequences of the Pilot analyses phases, and during the Intermediate development
phase and the Development of the final bases (stages 612). All development
during the Ex Post phases occurred under the influence of the cooperation with the
pilot firms.

137
Table 46 also lists development of algorithms. Because the structural items are
connected to the appearance of the model they can be considered to represent the
interface part of the model. The functional items and the algorithms involve the
operation of the analysis tool and thus represent the model itself. The alterations
and omissions of parts within the model have been shown only to give an
impression of the nature of the development work.
As seen from Table 46 clearly more than half of both structural and functional
items were introduced during the Ex Ante development. The number of structural
items was practically twice that of the functional items, during every one of the
development phases. The two parts of the Ex Post phases produced practically
equal numbers of structural, functional and algorithm changes. The changes to
algorithms were only one third compared to the functional items. A small number
of alterations were made constantly to items during each phase of the development
work.
Table 46. New items and changes to bases in each stage #1993#
Phase
Stag
es
Stru
ctur
al
Func
tiona
l
Alg
orith
ms
Alte
ratio
ns
Om
issi
ons
Tota
l
Ex Ante 15 82 42 9 2 2 137ExPost 1st sequence 69 27 16 5 2 2 52ExPost 2nd sequence 1012 39 17 7 2 0 65Total number of improvements, ExPost1st +2nd 612 66 33 12 4 2 117Total number of items 112 148 75 21 6 4 254
In Table 46, the number of structural items is large when compared to the
numbers of functional items and algorithms. This indicates that the pilot firms

138
were able to contribute more to interface related improvement than to
development related to the model itself. The relatively small number of alterations
and omissions reveals that the development work proceeded in a regular manner
avoiding any dramatic changes.
Table 47 presents the distribution of items between the different parts of the
model. The parts represent those parts that have been described earlier in this work
(Chapters 3. and 4.2.2.). Configuration refers to changes in the appearance or in
the placement of tables and other constituents of the model.
Table 47. The Distribution of Items to the different parts of theModel #1994#
Phase
Stag
e
Con
figur
atio
nC
once
pt
Res
ourc
es
Proj
ect
pres
enta
tion
Del
iver
able
s
Alg
orith
ms
Ex Ante, total items 15 15 45 51 16 9Ex Post 1st sequence 69 1 8,5 4,5 27 6Ex Post 2nd sequence 1012 13 22 9 10 7Total number of improvements Ex Post1st +2nd 612 14 30,5 13,5 27 26 13Total number of items 112 29 75,5 64,5 27 26 22
The “Resource analysis” table of the Ex Ante model contained slightly more items
than the “Conceptanalysis” table. However, during the Ex Post development
phases, and particularly during the later phase, there was a considerable increase
of items in the “Conceptanalysis” table. Slightly less than one half of the items in
the “Conceptanalysis” table of the final model became introduced during the Ex
Post development work.

139
The other parts of the model i.e., “Projectpresentation” table, “Deliverables table”
and algorithms contained considerably fewer items than the “Concept“ and
“Resource analysis” tables. Table 47 further reveals that means for project
presentation appeared only during the Ex Post development whereas items were
introduced to deliverables parts during the Ex Ante phases and then later during
the 2nd sequence of the Ex Post phase. Introduction of algorithms proceeded
smoothly during the development process although there was a slight acceleration
during the later Ex Post phase. Changes to the configuration of the analysis tables
occurred mainly in the Ex Ante phase (one half of the items) and the second Ex
Post phase.
Conclusions about the Base Development Work
We conclude that the “Concept” and “Resource analysis” tables attracted main
attention during the whole development process. The deliverables received clearly
less development action, as did also the project presentation. The data in Table 47
indicate that attention was paid to project presentation only after the requirements
for such operation had appeared in the pilot analyses. Also the increased
development of deliverables in the second Ex Post phase indicates the need
became apparent towards the latter parts of the development process. The smooth
development pace for algorithms indicates that the logic behind the analysis
method developed as more was learned from the analysis cases about the needs for
analysis of innovative projects. The slight acceleration of algorithm development
towards the end of the development work apparently stems from wants to produce
more sophisticated formulas that produced more precise analysis results. The
changes to the configuration of the analysis tool that occurred late in the
development work indicate a concentration of effort to incorporate experiences
into the final base.

140
4.4. Description of the Analysis Work with the Case Projects of the Pilot
Firms
The cases consisted of individual innovation projects provided for analysis by the
pilot firms. The firms elected the projects from their idea portfolios, in many firms
a final selection was made together with the researcher prior to the start of each
analysis. All cases represented real projects related to the business of the pilot
firm.
The 45 pilot case projects are listed in Table 48. For confidentiality reasons, the
projects as well as the firms are coded, the firms with letters and the projects with
numbers combined with the firm’s code.
The projects are typified with regard to their technological and commercial
character. The technology is characterized as high, medium or low, there were also
a few projects that could not be characterized as technically related at all. In
commercial respect, the projects were classified as either directed towards the
external market, indirectly towards the market, or towards administrative use; a
few projects were related to the whole operation, and a few others had no
commercial connections. The projects that were directed indirectly towards the
market often regarded components of products, processes or services that were to
be integrated into one or several externally marketed products.
Both the technological and the commercial uncertainty of the projects were rated
on the scale AD, were A represented the highest degree of uncertainty, D the
lowest. Each project was further classified according to its degree of innovation,
and according to its size. Innovation was rated into the degrees radical,
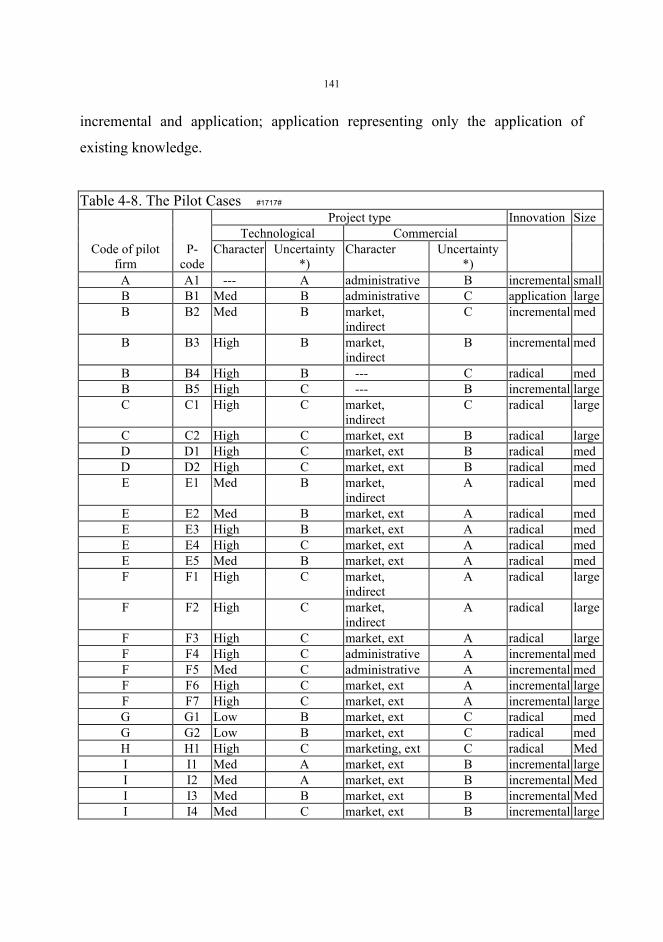
141
incremental and application; application representing only the application of
existing knowledge.
Table 48. The Pilot Cases #1717#
Project type Innovation SizeTechnological Commercial
Code of pilotfirm
Pcode
Character Uncertainty*)
Character Uncertainty*)
A A1 A administrative B incremental smallB B1 Med B administrative C application largeB B2 Med B market,
indirectC incremental med
B B3 High B market,indirect
B incremental med
B B4 High B C radical medB B5 High C B incremental largeC C1 High C market,
indirectC radical large
C C2 High C market, ext B radical largeD D1 High C market, ext B radical medD D2 High C market, ext B radical medE E1 Med B market,
indirectA radical med
E E2 Med B market, ext A radical medE E3 High B market, ext A radical medE E4 High C market, ext A radical medE E5 Med B market, ext A radical medF F1 High C market,
indirectA radical large
F F2 High C market,indirect
A radical large
F F3 High C market, ext A radical largeF F4 High C administrative A incremental medF F5 Med C administrative A incremental medF F6 High C market, ext A incremental largeF F7 High C market, ext A incremental largeG G1 Low B market, ext C radical medG G2 Low B market, ext C radical medH H1 High C marketing, ext C radical MedI I1 Med A market, ext B incremental largeI I2 Med A market, ext B incremental MedI I3 Med B market, ext B incremental MedI I4 Med C market, ext B incremental large

142
Table 48. The Pilot Cases (continuation) #1717”
J J1 A market, ext C incremental MedJ J2 Low A market, ext B incremental smallJ J3 Low B market, ext B incremental largeJ J4 Med B market, ext B incremental medJ J5 Low B administrative C incremental smallK K1 A administrative B incremental smallL L1 Med B market, ext B incremental medL L2 Med B market,
indirectB incremental med
L L3 High B B incremental largeM M1 Low B Total B incremental medM M2 A market, ext C incremental medM M3 A market, ext B incremental smallN N1 High B market, ext A radical medO O1 Med A administrative C incremental smallO O2 High C C radical smallP P1 High C Total C radical large
*) A =minimum, D =maximum for uncertainty evaluation
Projects were categorized as “large size”, over one million FMK, “medium size”,
over 100.000: FMK, and “small projects”, below 100.000: FMK. In a number of
cases the pilot firm was unable or unwilling to disclose costs for their projects, in
these cases the characterization of project size was left to the firm, using classes
large, medium or small size.
4.4.1. Categorization of the Cases
A clear majority of the 45 pilot projects analyzed can be classed as high or
medium technological projects (20 projects), six projects were of low technology
and five were not related to technology at all. The technological uncertainty was
medial for most projects (19 of class B and 17 of class C), nine projects were rated
as highly uncertain (class A). Over one half (25 of 45) of the projects were aimed

143
for direct external marketing, seven were indirectly related to marketable products
or services. Seven other projects dealt with administrative activities for use
internally within the firms. Finally, two projects dealt with the business idea of the
entire firm. The representatives of the firm appreciated the commercial uncertainty
intuitively. The commercial uncertainty was more evenly distributed between the
projects the than the technological uncertainty (13 A, 19 B and 13C, respectively).#1776#
The classification of the degree of innovation indicated that there were somewhat
more incremental (25) than radical (19) innovations, and one application among
the projects. Finally, the projects were classified according to size. There were 14
large, 23 medium sized and seven small projects.
Table 49 presents an overview of the classification of the projects.
Table 49. Categories of Cases #1712#
Technical Commercial Innovation SizeCharacter #*)
Unc
erta
inty
# Character #
Unc
erta
in # Type # #
High 20 A 9 external 25 A 13 Radical 19 large 14Medium 14 B 19 internal 7 B 19 incremental 25 medium 23Low 6 C 17 administr. 7 C 13 Application 1 small 7 5 4
Total 2
*) # = number of pilot case projects
The analysis of four of the 45 projects was not finished for different reasons, and
consequently these projects are not regarded in the further description of the

144
EDCP development process. Thus the result from the analysis of 41 pilot projects,
from 16 pilot firms forms the data for the presentation of the development work.
In the following one exemplar case is described. It is selected among the projects
that gave something to the development of EDCP. In the descriptions of other
exemplar cases the same codification is also used.
First the pilot firm is described, in terms of character, industry, structure, size, and
research background. Then a short definition of each project follows. Next the
persons (description, character) and changes in the team are described. Then
follows a paragraph about the proceedings of the analysis process: on one hand the
consecutive (calendarial) proceedings, and on the other hand the structural
proceedings of the analysis work. The latter includes descriptions of preparation
and facilities used for analysis work, the listings and the ratings used in the
analysis. The paragraph about the proceedings also presents the progress of the
listings and ratings. This part contains one table that monitors the listings and
ratings of the different items and one table that presents the progress of the
analysis. The project description further includes an explanation about which
bases were used, on the monitoring of the analysis work, on preparation of the
“Analysis Report”. Finally, the description lists the results of the analysis. The
description of some additional exemplar analysis cases in the Appendix follows
the same pattern as the above exemplar description, and the presentations are
extended with copies of the actual analysis tables and graphs used in the analysis.

145
Case DescriptionFirm M
1. Company descriptionCharacter, industry, structure, size, research background
The company was started in 1994 as a producer and developer of hightech textiles. The firmcan be defined as a R & D enterprise and classified as a small enterprise. One of the baseideas is to develop textiles from turf.
3. Project definition The project was defined as an analysis of the business idea of the firm. This wide definition
of a project was partly due to the project being the third project analyzed within the EDCPdevelopment project.
4. TeamPersons (description, character), changes
The team consisted of the managing director (md) of the firm, a marketing person withacademic degree (m), and a representative (inv) of an investing organization. The team intotal was present in the two first sessions, in the third (m) and (inv) participated, in the fourth(m) alone, in the fifth (md) and (m), and in the last two sessions (m) and (inv).
7. Proceeding of analysis processCalendar: time elapsed between sessions, postponements, number of sessions
The analysis proceeded in seven sessions, and a last recollection session. 4 weeks elapsedbetween first and second analysis, ½ week between second and third, 3 weeks between thirdand fourth, 1½ weeks between fourth and fifth, 4 weeks between fifth and sixth analysis, and6 weeks between the two last analyses. The recolecting session occurred 3 weeks after thefinal analysis.
Analysis proceeding Preparations and facilities The three first analyses were performed in the office of the investment firm using their
computer. This was the first pilot analysis, where direct data feeding into the computer wasused. The following sessions were held in the office of the firm, using their computer.
Listings: (attributes, components, knowledge areas, resources, number of items, time The first session involved a short description of the function of EDCP, then the analysis
started with work directly on the computer. All attributes 10 different attributes, 34 rows ofattributecomponent pairs and 13 knowledge areas were listed. Significance values for allattributes, one row of knowledge area values in the grid were rated to show an example of therating procedure. A printout was made of the “Conceptanalysis” table and (m) finished therating with paper and pencil, and faxed the result to the researcher who entered the data intothe computer, and also printed a diagram of the analysis results for the analyzed concept andknowledge areas.
In the second session the intermediate results were discussed. Three additional knowledgeareas and 18 more attributecomponent pairs were listed, (m) rated remaining knowledge areagroups in grid later on own computer.

146
During the third session a copy of the “Resource analysis” table was printed for later fillingin. The Concept analysis was finished with a total of 49 attributecomponent pairs. Theresults from (m)’s rating were analyzed using tables and diagrams printed.
For the fourth session (m) had prefilled the “Resource analysis” table. The ratings forattribute significance was transferred manually from the Concept to the “Resource analysis”table.
During the fifth analysis session eight rows of knowledge area groups were rated in the gridof the “Resource analysis” table, but no more progress could be made due to the absenteeismof the (md).
In the sixth session the number of resource groups in the “Resource analysis” table increasedto 69, 24 more rows of knowledge area groups were rated in the grid. Diagrams of risks fromconcept and resources were printed .
In the seventh session 31 more rows of knowledge area groups were rated in the grid. The“Resource analysis” table in this analysis contained 69 rows whereas the “Conceptanalysis”table contained 49. During the seventh session tables of the analysis results (Risks of Conceptand Risks of Resources and Risks of Knowledge areas) were printed, as well ascorresponding diagrams. Areas representing interesting items were encircled in the graphsduring the discussions.
The stage 6type base was used in all sessions.
Table 1. Listings and ratingsConcept analysis sheetListings # Sess # # Ratings # Sess #Attributes Signif / Attr 49 1Components, tot. 49 1 Market benefit Components, diff. 39 1 Technical problems Knowledge areas 15 1 Knowl. area groups
#rows & knowl. areas 49&15
total matrix grid area 735
# cell groups rated 342 2% grid area rated 46,5
Resources analysissheet
#rows & knowl. areas 69&15
#Res. Comp. groups,tot.
69 1 total grid area 1035

147
#Res. Comp. groups,diff.
38 1
# cell groups rated 412 3% grid area rated 39,81
Progress of the analysis work Four of the analysis sessions lasted four hours, one 4½ hours, and two lasted three hours. The
analyses went smoothly when they got started, and the initiative and preparedness of (m) todo much of the rating work alone contributed to the progress. Due to the wide scope of theproject the analysis grew so large that it hampered the perspicuity of the analysis. Theprogress of the analysis work was retarded when (md) was unable to participate in twosessions dealing with resources.
Table 2 shows the progress of the analysis.
Table 2.Listing & rating progress
Session # 1 2 3 4 5 6 7Stage, base 6 6 6 6 6 6 6Time per sess., h 4 4 4,5 3 3 4 4Cumulat. time , h 8 12,5 15,5 18,5 22,5 26,5Listingsattribcomp pairs 49components,diff. 39resources, diffKnowledge areas 13 16Ratingssign. etc. for attrib. 49cons.knowl.areamatrix
342
Resknowl.areamatrix
73 224 412
Monitoring of the analysis work The analysis was monitored for the team by making printouts of the Excel sheets at the end
of each session, and sometimes at the end of significant stages, totally 14 sets of printoutswere prepared.
Interpretation of analysis results A discussion of the analysis results was held with (md) and (m) during the final session.
Preparation of analysis report

148
Separately the researcher prepared an Analysis Report in the Analysis Report form (MSWord) of 3½ pages.
8. Result of analysis process in this caseResults for the benefit of the EDCP analysis process
The proceeding of the analysis is presented in Table 2 that shows dates, times used duringeach session.
Found faults Difficulties were noticed in the ability to put questions and to sort out unneeded
(unnecessary) componts i.e., rules were needed for “jumping over items”. A suggestion ofwork organization within the team was suggested so that one person reads and the other(s)answer.
Feedback from firm, solutions in interactive cooperative workThe large scope of the analysis prompted means to define the project better e.g., wide/coarseanalysis vs. projectpart analysis or analysisindetail. Also means to better document thediscussion were deemed necessary as was means to coordinate the decision of the ratingweighting of the components.
Input from this analysis, new features added to analysis base This analysis contributed to initiate the transfer of the intermediate calculating formulas out
of the grid area. It also contributed to the development of the Project presentation sheet andto the use of Excel’s commentsfunction, and later to the Commentscolumns.
Results for the benefit to the firmThe firm got a tool that enabled analysis of items and the ability to perform them. It presenteda possibility to ponder things and simultaneously to get several pointsofview on them,especially for the team. The analysis results could easily be used as an appendix toapplications for financing.

149
4.5. Outcome of the Analyses
Two aspects supported the idea of bringing case projects into the EDCP
development work. Firstly, it was necessary to test the model on real projects and
to obtain feedback from the pilot firms for the benefit of the EDCP development
work. Secondly, the analysis results were needed as a contribution to the firm, and
to act as an incentive for the management to offer money, time and personnel for
the development work. The uses or advantages were documented firstly in
notations by the researcher during, and immediately after the analysis sessions,
and secondly in interviews using a form. These interviews were conducted with
the management of the pilot firms after the EDCP development project was
concluded. Some sample interviews are shown in Appendix 4.
Consequently, the usefulness of the analyses can be characterized as usefulness for
developing the model, and usefulness to the firm.
4.5.1. Usefulness of the Analyses to the Development Work of EDCP
Table 410 presents the improvements of each of the 14 projects that contributed
to the development of the EDCP model. The projects were provided by nine of the
pilot firms. These projects represent practically one third of all the 45 pilot
projects analyzed. The table lists the starting date of each analysis, the codes of the
firm and the individual project. The table describes each individual improvement
contributed to the development of the EDCPmodel during each project. A
contributing improvement represented a structural or functional change initiated
during the analysis of a project. The table also lists the number of individual
improvements provided by each project as well as a description of the

150
improvements. The table lists those items, useful to the pilot firm that some of the
analyses produced and, finally, the median date of the analyses.
Table 410. Projects that were useful to the development of EDCP #1754#
Date ofstart ofprojectanalysis***)
Cod
e of
firm
Cod
e of
pro
ject Usefulness to EDCP
i.e., improvements
Cla
ssifi
catio
n**
)#
(**
Usefulness to firm
2.4.1996 K K1 ¤ question set introduced I 13.6.1996 M M
1¤ structural, functional change¤ direct computer feed introduced
II
2
20.1.1997 B B1 ¤structure change¤ Proj_pressheet introduced¤ quality improvement¤ team size & work improved¤ own adhoc "mutu" analysis done by pilot
IMI
MM
5
5.2.1997 I I1 ¤ connection concept ~ resources tables,"mutu"analysis, good repetitivenessachieved (unconsciously)
IM
1 ¤ anlysis on own initiative
10.2.1997 D D1 ¤ rowadd/delete, guidance message box,question definition, separate rating forevaluating criteria in each projectintroduced¤ "central rating" introduced
I
I
2
14.2.1997 E E1 ¤ step towards multitable, development ofdiagrams
I 1 ¤ Pointed out risks so thatconsiderable time savingswere acheived.
21.3.1997 F F1 ¤ Develop 2step application to see ifconcept fits for analysis.¤ 2step approach to Knowl. Areas to bedeveloped later¤ Algorithms to avoid "1:s".¤ Additional copydown for Difficulty &Newness of Knowl. Areas in Cons.Blocks of Attrib. groups with partitionheadings
M
I
II
4
*) M=model related improvement, I=interface related improvement**) # indicates number of improvements per project to EDCP development***) the median of all start dates was 22.3.1997¤ indicates individual case of usefulness

151
Projects that were useful to the development of EDCP (continuation) #1754#
Date ofstart ofprojectanalysis***)
Cod
e of
firm
Cod
e of
pro
ject Usefulness to EDCP
i.e., improvements
Cla
ssifi
catio
n**
)#
(**
Usefulness to firm
24.3.1997 C C1 ¤ added number of knowledge areas¤ “topten” diagram introduced¤ sort table introduced
IMM
3 ¤ "aha"experience.¤ EDCP became part ofproject planning process,and pointed out manythings
30.4.1997 F F2 ¤Proj_pressheet improved and enlarged¤ hints of formula coordination problems¤ two columns removed from atttributeratings (simplification)
MI
M
3
16.6.1997 O O1 ¤hints of formula problems in Sortfct:n I 14.11.1997 F F3 ¤ "Fill!" indicator needed in Res table I 122.2.1998 F F5 ¤ deliverables developm (charttypes)
¤ research on rating theory (scales 13,... 1?), and algorithms, 1 new evaluatingcriterion; team size, working mannersdeveloped
IM
2
25.2.1998 F F6 ¤ two rating columns per Knowledge arearemoved in grid (simplification)¤ name abbreviation columns for conceptattribute, component. and resourcecomponents
M
I
2
4.8.1998 F F7 ¤deviation, max. value, # groups eval. >deliverables, guidance to all columns,Analysis report
M 1
*) M=model related improvement, I=interface related improvement**) # indicates number of improvements per project to EDCP development***) the median of all start dates was 22.3.1997¤ indicates individual cases of usefulness
The contributions to EDCP considered either the model itself or the interface. The
contributions to the model included new tables e.g., “Project presentation” table,

152
sorting table, or new diagrams or new reports. The addition or the removal of
ratings was also regarded as contributions to the model, so were e.g., comparisons
to other analysis methods and changes of work methods. Contributions to the
interface included e.g., changes to the structure of tables, computer use, guidance
tools or formulas. The Table 410 also shows that three of the fourteen projects
and their pilot firms also benefited from the analyses and thus were useful for the
firms.
Table 411 presents detailed characteristics for the work with the firms that
contributed to EDCP. It also lists the number of contributions to the EDCP model
that each firm made, and it lists the contributions that the firms got from the
analyses. Furthermore, it presents the number of projects of each firm that
provided contributions to EDCP, and the total number of projects analyzed by
each firm.
Table 411. Details of Projects and Pilot firms that contributed to EDCP #1711#
Firm code E M B K I F C D O#*) contributions to EDCP 2 2 5 1 1 14 3 1 1# contributions to firm 6 2 1 1 3 # projects that contributed to EDCP 1 1 1 1 1 6 1 1 1# projects, total 5 3 5 1 4 7 2 2 2Fraction contributive projects (%) 20 33 20 100 25 86 50 50 50# sessions 14 11 14 4 7 20 10 5 4# postponements () 3 3 3 2 1 2 # analysers 2 3 6 2 5 9 6 3 2Contributive points 18 17 22 4 16 34 17 8 8*) # = number of
Table 411 additionally exhibits the fraction of contributing projects for each firm.
It lists the numbers of projects and sessions as well as the number of analyses
done with each firm. These numbers can be considered to reflect the effort that
each firm invested in the development work. The number of postponements can be

153
considered to reflect the ability or willingness of the firm to organize the
participation in the development work. The fraction of contributing projects in
each firm varies between 20 and 100% of the total number of projects processed
by each firm, the average being 48%. The table also shows that of the 16 pilot
firms nine contributed to the development of EDCP, and of these nine five firms
simultaneously benefited from the analyses.
The impact of the individual pilot firms on the EDCP development can be
characterized by a number that represents the sum of the numbers of projects,
sessions and analyzers, reduced by the number of postponements for each pilot
firm. This number is termed contributive points in Table 411, and calculated
according to the equation:
Contributive points = (#*)projects + # sessions + # analyzers # postponements) per firm*)#=number of.
The values of that number varied between four and 34 for the nine firms that
contributed to the development of the EDCP model. The average value for the
contribution points is 16,0 between all contributing firms. As seen from the table
those two firms (B and F) that gave the largest number of contributions to EDCP
also had the highest contributive points number. Table 411 indicates good
correlation between contribution to EDCP and the number of sessions and the
number of analyzers per firm. Also the correlation between contribution and the
number of projects per firm is relatively good. Among the factors that may have
an influence on the ability to contribute are the number of projects and the number
of sessions. The number of sessions may directly influence the number of
contributions because of more contact between firm and developer. Also the
number of analyzers may influence the number of contributions to EDCP.

154
4.5.2 Usefulness of the Analyses to the Pilot Firms
One half of the firms that contributed to EDCP were also able to benefit from the
analysis. There is, however, no correlation between the number of contributions to
EDCP and the number of contributions to each one among the nine firms in Table
411. Thirty of the pilot analyses did not give any specific contribution to the
development work for EDCP. However, the EDCP analyses benefited eleven of
the projects from seven pilots. Table 412 shows detailed data for the firms and
Table 412. Details of Projects that were useful to Firms #1788#
Date ofstart ofprojectanalysis*)
Code offirm
Code ofproject
Contribution to firm
24.4.1996 H H1 ¤ pointed out risk (that realized)24.2.1997 J J1 ¤ pointed out considerable risks
¤ put project on hold9.5.1997 G G1 ¤ probably used in TEKES application
7.4.1998 E E2 ¤ used in TEKES application21.4.1998 E E3 ¤ used in TEKES application21.4.1998 E E4 ¤ used in TEKES application4.5.1998 M M2 ¤ decision instrument for individual project5.5.1998 E E5 ¤ used in TEKES application4.9.1998 C C2 ¤ pointed out new things to include11.9.1998 A A1 ¤ caused change in project
¤ pointed out new items19.9.1998 B B4 ¤ reinforced opinions5.11.1998 M M3 ¤ decision instrument for projectThe median of all start dates was 30.4.1998
projects that did not contribute anything to EDCP. The table lists corresponding
items to Table 410, except stage of development of project, contributions to the
development work and number of contributions. It also lists the cases when the

155
firm benefited from the analysis, and finally, it lists the median date of the
analyses.
Table 413 illustrates the characteristics of the work with the firms that gave
something to the EDCP development project. It is structured similarly as Table 4
12. Table 413 shows that the contributive point values vary between two and 12
for the seven firms that did not contribute to the development work, the average
number being 6,3. There were three firms representing five projects that did not
give anything to the EDCP development, and who did not gain anything from the
analyses. The average of their contributive points is 3,6.
Table 413. Pilot Firms that Gave Nothing to EDCP #1710#
Firm code L P J N G A H# *) contributions to firm 2 1 2 1# projects contributive to firm 1 1 1 1# projects 2 1 5 1 2 1 1# sessions 3 4 7 1 5 2 7# postponements () 1 5 3 2 # analysers 1 3 3 1 1 1 3Contributive points 5 3 12 3 8 2 11*) # = number of
Table 414. Comparison between Contributive andNoncontributive Firms of Input per Pilot Firm
Pilots thatcontributed
Pilots thatdid’t
contributemax min max min
# *) projects 7 1 5 1# sessions 20 1 7 1# postponements 3 5 1# analyzers 9 2 3 1*) # = number of

156
Table 414 compares the input given by the firms that gave and those that did not
give something to EDCP. As seen, there are big differences between the maximum
inputs for number of sessions and number of analyzers. There is practically no
difference between the minimum inputs between the two types of firms.
4.5.3 Conclusions about the Usefulness of the Analyses
The largest number of individual improvements given by single project to the
EDCP development was five. Among the projects that gave one or two
improvements the number of large projects equaled the number of medium sized
projects (four).
Table 415 presents a comparison between the pilot firms that gave contributions
to the development work and those that did not.
Table 415. Comparison of Activities for Contributing and Noncontributing
Pilot Firms #1709#
Pilots that gave to EDCP9 firms
Pilots that did not give to EDCP7 firms
Total per firm total per firm# *) projects 31 3,4 13 1,9# sessions 89 9,9 29 4,1# postponements () 14 1,5 11 1,6# analyzers 38 4,2 13 1,9
# contributions toEDCP
30 3,3
# contributions tofirm
13 1,4 6 0,9
contributive points,average **)
16,0 6,3
*) # = number of**) according to equation in Chapter 6.2.1.

157
The number of projects per firm was ca. 44% bigger, the number of sessions ca.
60% bigger, and the number of analyzers ca. 55% bigger per firm in those pilot
firms that contributed to EDCP as compared with the firms that did not. This
indicates that the firms that took more active part in the development work
contributed to the development of EDCP. The table further indicates that the firms
that contributed to the development of EDCP also were able to benefit more from
the results of the analyses. However, the number of postponements per firm did
not differ, that indicates that their capability to organize their work did not
influence their ability to contribute to the development work. Table 416 lists the
benefits from EDCP reported by the firms in the questionnaire at the conclusion of
the EDCP development project. Between seven and five firms noted one of the
benefits. Seven pilots got “something extra” during the analysis sessions, also
seven firms were ready to use EDCP again. Six firms found that the analysis
pointed out concrete risks. Five firms found that EDCP offered help for planning
and continuation of their project, and that EDCP pointed out things to add or
remove in project; finally, five firms found that EDCP increased comfort feeling
in decision situations.
Table 416. How firms benefited from EDCP #1755#c
Benefit for firm Number of firmswho benefited
Firm got something extra during sessions 7Firm would use EDCP 7Analysis results pointed out concrete risks 6EDCP offered help for planning continuation of project 5EDCP pointed out things to add/ remove in project 5EDCP increased comfort feeling 5

158
4.6. The Influence of the Character of the Projects on the Development of
EDCP
Table 417 presents the character of all 41 projects that were involved in the
development of the EDCP model. The table lists the starting date for of analysis,
the codes of the firm and the individual project. It lists the innovation type, the
Table 417. Character of the analysis Projects #2004# Bascol13.xls
Date of start ofproject analysis
Codeof firm
Code ofproject
Innovation Size Usefulness toEDCP | Firm
2.4.1996 K K1 incremental small X24.4.1996 H H1 radical Med X3.6.1996 M M1 incremental Med X10.1.1997 P P1 radical Large20.1.1997 B B1 application Large X30.1.1997 L L1 incremental Med5.2.1997 I I1 incremental Large X X10.2.1997 D D1 radical Med X14.2.1997 E E1 radical Med X X24.2.1997 J J1 incremental Med X21.3.1997 F F1 radical Large X24.3.1997 C C1 radical Large X X30.4.1997 F F2 radical Large X9.5.1997 G G1 radical Med X13.5.1997 D D2 radical Med16.6.1997 O O1 incremental small X3.7.1997 G G2 radical Med4.11.1997 F F3 radical Large X24.11.1997 I I2 incremental Med29.12.1997 J J2 incremental small22.2.1998 F F5 incremental Med X25.2.1998 F F6 incremental Large X22.4.1998 B B2 incremental Med27.4.1998 I I3 incremental Large27.4.1998 I I3 incremental Med4.5.1998 M M2 incremental Med X5.5.1998 E E5 radical Med X14.5.1998 B B3 incremental Med20.5.1998 J J3 incremental Large7.7.1998 J J4 incremental Med4.8.1998 F F7 incremental Large X

159
Table 417. Character of the analysis Projects (continuation)11.8.1998 L L2 incremental Med18.8.1998 O O2 radical small4.9.1998 C C2 radical Large X11.9.1998 A A1 incremental small X19.9.1998 B B4 incremental Large X21.9.1998 L L3 incremental Large7.10.1998 J J5 incremental small9.10.1998 N N1 radical Med16.10.1998 B B4 radical Med5.11.1998 M M3 incremental Small X
project size and the stage of development of the project at the time of the analysis.
The table is arranged according to the date when the analysis was started.
Table 417 indicates that the majority of usefulness for EDCP development
occurred clearly in the first time period of the development course, whereas the
usefulness to the firm occurred more evenly during the development period. Table
Table 418. Influence of Innovation Type on Usefulness#2006#
Distribution of projects, %Usefulness
Total ToEDCP
to firm to none
# *)projects
41 proj. 14 proj. 12proj**) 18 proj.
Radical 16 39,0 42,9 50,0 33,3Incremental 24 58,5 50,0 50,0 66,7Application 1 2,4 7,1
N 41 100% 100% 100% 100%*) # = number of**) 3 of these projects were simultaneously useful to EDCPand to firm
418 presents the influence of innovation type on the usefulness of the analyses. It
does not indicate any big differences in the distribution of projects regarding the

160
usefulness to the development of EDCP or the usefulness to the firms. However,
there seems to be an indication towards incremental type innovations for projects
that were useful to none.
Table 419 presents the influence of the project size on the usefulness of the
analyses. There seems to be a slight inclination towards large projects among
those that were useful to the EDCP development, and a slight inclination towards
medium sized projects among those that were useful to none. The distribution
among projects useful to the firm was almost identical to distribution among all
projects.
Table 419. Influence of Innovation Size on Usefulness#2007#
Distribution of projects, %Usefulness
Total to EDCP to firm to none# *)
projects41 proj. 14 proj. 12 proj*) 18 proj.
Large 14 34,2 57,1 33,3 22,2Medium 20 48,8 28,6 50 61,1Small 7 17,1, 14,3 16,7 16,7
N 41 100% 100% 100% 100%*) # = number of**) 3 of these projects were simultaneously useful to EDCPand to firm
4.7. Conclusions from the Analyses of the Case Projects
The selected projects were real projects provided by the pilot firms. The projects
were characterized and typified according to technology, commercialization, the
degree of innovation and size. They were further classified according to technical

161
and commercial uncertainty and to stage of development at the time of analysis.
Of the totally 41 project 14 projects, or 32% of the analyzed projects, contributed
to the development of the EDCP model, as seen from Table 413. The largest
groups of projects involved technical projects and projects for the external market,
and projects of medium size.
The number of sessions and the number of projects as well as the number of
analyses reflect the ability of each pilot firm to contribute to the development of
the EDCP method. However, as seen also from Table 414, limited input from the
firm does not necessary exclude the ability to contribute to the development of an
EDCPmethod.
Contribution to method development is more likely to come from large projects of
a technical character. The type of innovation (radical or incremental) does not
seem to have an influence. There is an inverse correlation between the number of
improvements per project and the number of projects involved in the development
work per firm. Neither the commercial character of the project, nor the stage of
development of the project at the time of analysis had any considerable influence
on the contributiveness.
The firms experienced usefulness from the analyses both during the sessions and
when drawing conclusions from the analysis results. The firms’ representatives
felt they got something extra during the sessions, risks were pointed out and
advice was gained for the administration and continuation of the projects.
Table 415 presents a comparison between pilot firms that contributed to the
development of the EDCP process and the other firms. From the table one can
conclude that the contributive firms provided more than twice the number of
sessions and analyses, per firm, compared with the noncontributive firms. Also

162
the number of projects was almost double for the contributive firms. The
contributive firms also managed to utilize the results of the analysis results two
thirds more than the other firms. The average numbers of contributive points,
(16,0 for the contributive firms, 6,3 for the noncontributive firms), confirm this
case further. The number of postponements per firm was practically the same for
both category, it may indicate that the ability to organize the work does not
influence the firm’s ability to contribute to method development.
Finally, the big difference between median dates for contributive and non
contributive analyses (Tables 410 and 412) indicates that the pilot firms begun to
benefit from the analyses when the model was developed further. Probably the fact
that the analyzers in the pilot firms became more acquainted and used to the
EDCP analysis method made it possible for the firms to benefit more from the
analyses.
Information about later impact of the pilot analyses on the pilot firms proved
practically impossible to obtain. Too much time had elapsed to permit clear
enough recollections and much of the firms’ documentation had become
unavailable as employees had changed jobs.

163
4.8. Commercial Analysis of Projects
When the project of developing EDCP in cooperation with the pilot firms was
concluded a consulting firm begun to market the EDCP model as a consultant’s
tool. The Stage 12 base, with slight modifications to the Visual Basic program
part, was used.
Data from eight commercial project analyses in seven firms was made available in
this work as a comparison to the pilot analyses.
One of the customer firms was a previous pilot firm that bought the EDCP
analysis on a commercial basis, the other six firms were all new to EDCP. One
firm bought EDCPanalysis related to different aspects of the same project.
Firms as well as projects differed from those in the development work in that they
were clearly bigger. Five of the firms are classified as large firms, two as medium
sized. All projects were classified as large according to the scale used for the pilot
projects.
The sessions differed from those of the pilot analyses in that considerably more of
the analysis time (ca. 1/3 of total time) was reserved for definition of the project.
Six projects involved incremental innovations, two regarded radical ones.
Within the commercial analyses the majority of the projects concerned the first
EDCP analysis for the firm, the two repetitive analyses involved the previous pilot
firm and the firm that bought two analyses. The average size of the analyses
resembled the data for the analyses of the 2nd sequence, particularly the number of
rows, knowledge areas and, consequently the number of rating sites. The number
of ratings (403 versus 281 in the pilot analyses) and the fraction of sites rated

164
(59,3 versus 45,3) were clearly larger for the commercial analyses, the analysis
time increased slightly in the commercial analyses.
One can conclude that basically the character of the commercial analyses were
close to, or identical to the character of the pilot analyses of the 2nd sequence. The
increased analysis time and larger number of ratings may be interpreted as an
endeavor towards more thorough analysis work than in the pilot analyses, the
firms paid a consultancy fee for each analysis.
5. Discussion
5.1. The Structure of the Work
The work is structured in three parts: the theoretical background, derivation of the
ideal EDCP model and the development towards the final model in cooperation
with the pilot firms.
5.2. Reliability and Validity
Reliability expresses the repeatability of the research work. This means that
another investigator will obtain the same findings and conclusions as the primary
investigator if he follows exactly the same procedures as the primary investigator,
in conducting the same study all over again (Yin 1994, p. 36). Yin further points
out that the other investigator ought to do the same case study and not replace the
results of another case study. Good documentation enhances reliability because it
makes possible the later repetition of the research. Reliability also diminishes
faults and distortion in the research (Yin 1994, 3637). Reliability can be achieved
if the researcher consistently uses the same methods of interpretation (Uusitalo
1991, p. 84, Miles and Huberman 1994, p. 278). The reliability of conclusions can

165
be assessed in qualitative research by considering how logically conclusions
explain the results and data (Alasuutari 1994, p. 132).
The connection of the EDCP model construction to the pertinent literature has
been demonstrated so that a secondary investigator would arrive at a similar
model, if he uses the same literature sources. The development of the model was
done by means of the intense use of a computer, documenting all steps of
development in individual timeindicated data files. This provides good
documentation of the data, and thus enhances the reliability. The repetitive
function of the analyzer’s work and operation with the model is secured through
the use of given computer tables with headings. Also the computerized guidance
system secures that the inputs will be done the same way in repetitive use of the
model. Because the model calculates the analysis results with permanent formulas
the reliability of the calculations is secured.
The validity illustrates that the research work measures the correct items. Validity
can be divided into construct, internal, and external validity. Construct validity
involves the selection of a correct means to explain the matter of research. One
ought to use several different information sources in order to secure the construct
validity. Internal validity is applied primarily to investigative research work (Yin
1994, p. 3336). External validity illustrates how well the research results can be
generalized for purposes other than the actual research work (Uusitalo 1991, p. 86,
Yin 1994, p. 35). The construct of the model is valid because of the logical order
of the proceeding of the analysis process. First, the concept of the innovation is
analyzed by listing the concept attributes and components, this is followed by the
knowledge areas. Then the resources are analyzed by listing the resource
components, the concept being linked to the resources via the knowledge areas.

166
The validity of the construct is further secured through the logic of the formulas
for the calculation of the risks. The function of the model is validated externally
through the use of preset computer tables and a guidance system that makes
investigators act in the same manner in repetitive analyses even if the object or
purpose of analysis varies. The pilot analyses of different types of innovation
cases of demonstrated the external validity; the external validity of the model is
expressed when the analyzed risks materialized in some cases.
5.3. Relations to the Research Questions
How to build an EDCP Model that can be applied in Innovation and R&D
Projects in firms?
An EDCP model for the application on innovation and R&D projects in firms can
be derived in relation to risk theory, innovation theory, management theory, and
resource and knowledgebased theories. These theories are integrated to form one
model that analyses the concept of the project and the resources that realize the
project. The necessary knowledge areas link the concept and resource analyses
together and contribute to exposing the risks. Useful features from existing
methods for risk analysis, project management and idea generating can be
incorporated into the EDCP model. Disadvantageous features in existing methods
ought to be avoided and excluded.
Relation of the Model to Risk Theory, Innovation Theory, Management Theory,
and Resource and Knowledgebased Theories
The project presentation phase shall clarify project boundaries, it is often useful to
recognize pervasive activities sometimes associated with pervasive risks

167
(Chapman and Ward, 1997, p. 128). In the “Project presentation”table, the
analyzers define the project boundaries for an EDCP analysis.
An appropriate number of attributecomponent pairs can describe the concept of
an innovation project. Such a set of attributecomponent pairs form a model that
represents the customer’s needs and so defines the market requirements. The
components represent what the producer must combine in order to satisfy the
customer. Thus the statements of Levitt (1977, 1980) link the model of the
innovation project’s concept to management theory. The attributecomponent pairs
may form a link from management theory to innovation theory because they can
form a representation of new combinations, and Schumpeter defined innovation
primarily as new combinations, here represented by the list of attributecomponent
pairs.
Lintunen (2000, p. 298) presents a linkage between Mintzberg’s and Schumpeter’s
concepts of the entrepreneur, and Hamel and Prahalad’s concepts of core
competence and she thus points to a link between innovation theory and
knowledge and resource based theories.
The ability to select appropriate components in the formation of attribute
component pairs requires knowledge. Several researchers e.g., Penrose (1959, p.
25), Nonaka and Takeushi (1995, p. 34) relate knowledge to resources, either in
individuals, or as accumulated knowledge in the firms. This way management
theory, as represented by Levitt is integrated into the knowledge and resource
based theory as represented by Penrose, Nonaka and Tekeushi. In a model of an
innovation project the representation of the concept must be developed with the
aid of a list of knowledge areas necessary to select the components for the
attributecomponent pairs. The model of an innovation project further requires a
description of the resources that are intended to realize the attributes through the

168
components. Through the statements of Penrose, Nonaka and Tekeushi mentioned
above, a representation of the resources involved in the innovation project can be
created using a description of the components and attributes of the resource.
A model for an innovation project can be composed of the model of the concept
and the model of the resources. In this combination of models the knowledge areas
function as the link that unifies the two models to form the model for an
innovation project. In this combined model the knowledge areas illustrate the
interdependence between the concept and resources of the innovation project.
Thus the knowledge of the teammembers act as links between concept and
resources.
The deliverables of the EDCP analysis consist of the reports that the computerized
analysis system provides in the form of tables and graphs. The computerized
analysis system further provides means for editing the analysis results into reports
for the analysis team and for the management of the firm. This way EDCP
processes the analysis results into an appropriate form so that the firm accumulates
knowledge through learning, as mentioned by Mahoney and Panjan (1992) by
fulfilling the requirements for reporting stated by Chapman and Ward (1997) and
CEI IEC 1160, (1992).
Knight, Andersson and Laurila, Tell and Wallenius, Halman and Keizer define the
connection between risk theory and the knowledge and resource based theories.
Knight (1985, p. 24) differentiates between measurable “risk” and unmeasurable
“uncertainty”, Andersson and Laurila state that risk is when one cannot give a
specific value to an occurrence. Halman and Keizer (1994, p. 77) specify the risk

169
according to fivepoint scales. Tell and Wallenius (1979, p. 56) propose several
different types of evaluation procedures.
The rating system of the EDCP allows the evaluation of the individual risk
concentrations related to concept, resources and knowledge areas as well as to the
whole project. The individual risks are related towards the individual attribute
componentresource groups and the individual knowledge areas. Thus the model
can be designed to evaluate risks according to Tell and Wallenius’ and Halman
and Keizer’s statements. Chapman and Ward (1997, p. 93) propose that the project
planning team may provide a highrisk environment for risk analysis. In
innovation projects the team members often represent the innovator or the
innovating firm (Dopfer 1994, 136, ed. Magnusson, p. 125). They can be
considered to represent Schumpeter’s (1934, 1939, 1942, 1946, 1947, 1949) and
Ansoff’s (1968, p 134, 208) entrepreneur. Since the team members have
knowledge about the innovation project they simultaneously represent the
knowledge and resource based theories. Thus the team members create a link
between the knowledge and resource based theories and the innovation theory, and
since they also provide a risk they provide a link to risk theory. In the EDCP
analysis system the analysis team is asked to assess their own ability to perform
the EDCP analysis.
Comparison of EDCP with several other Methods
Several existing methods for project management and risk evaluation were found
in literature. Some of these methods have a few features in common with EDCP,
although most methods have considerable differences from EDCP.
The second step of the quality function deployment method (QFD2) considers
attributes, components and resources, but it requires prior analysis with the
precedent QFD1 method, that is flexible, inducible, involves rating, and allows

170
interinfluence between data. Neither method considers knowledge areas, none of
the literature sources mention any kind of guidance. Particularly QFD1 has
proved time consuming and tedious in use (Urban and Hauser 1993, p. 340348,
Turunen 1991, p. 22.24). Interviews with pilot firms that tried QFD1 confirmed
this opinion about time requirement and tediousness. Fault modes and effects
analyses (FMEA and FMECA) deal with components of existing products or
processes through breaking them down to elements. The methods produce tables
of failure modes for each element. However, FMEA focuses on failure and failure
modes and limits the analysis to the existing product or, in the case of FMECA
(Ansell and Wharton 1992, p. 109, FMEA 1985, p. 923). Design reviews focus
on existing commercial and physical components of existing products and on
customers’ requirements. They focus on fault and derive their input data from
specs, drawings, test results, photos, etc. They produce fault lists as deliverables
(CEI IEC 1160 1992, p. 927). Neither of these methods is intended for project
analysis. They do not consider resources or knowledge. Klustest includes
resources, knowledge, and ratings. It is also selfexplanatory and requires little
guidance. However, its 63 preset questions together with its lack of verbalilization
and with its structure make it inflexible and noninductive. Klustest does not allow
item combinations or interinfluence analysis. The Checklist methods involve
fixed questions and rating. They focus on product policy. The Profile scheme is a
project comparison method with a list of evaluation criteria. The above mentioned
methods are inflexible, and Klustest does not analyze attributes or component of
the idea concept, and the Checklist methods additionally do not consider
knowledge and resources (Andersson and Laurila 1983, p. 122124).
None of the methods encountered in the literature integrated knowledge and
resource based theories into risk theory. They did not integrate features from

171
innovation theory, management theories, knowledge and resource based theories,
or risk theory into their models of method.
How does Project Management Assess the Constructed Model?
Items introduced into the Analysis (Input)
The project presentation phase shall consolidate and elaborate the nature of the
project and define the project in a form suitable for the project risk management
process. This phase involves e.g., consolidation of relevant existing information
in suitable form, and elaborating the project management activities in order to fill
in any gaps uncovered in the process e. g., by stimulating the project team to
develop their plans and processes (Chapman and Ward 1997, p. 68). It shall also
describe the product, the process and the production (Halman and Keizer 1994, p.
76). The representatives of the pilot firms indicated a need for a project
presentation phase, and so the “Project presentation”table was introduced into the
model during the first sequence of pilot analyses.
The changes to evaluation principles involved the scales for rating, applying
individual rating principles for each project, and explaining the theories behind
rating principles to the representatives of the pilot firms. Direct reference to the
research by Tell and Wallenius considering evaluation techniques was conveyed
to representatives of the pilot firms. In customer analysis selfrated importance is
performed so that each customer rates the importance on a given scale, usually a
5, 7 or 9point scale. The additive model is probably the most commonly used
utility model, but many other models have been suggested and implemented (Tell
and Wallenius 1979, p. 56). In the EDCP method the scale 1 – 5 was selected for
all ratings throughout the model after a short initial period when 1 – 10 was used.#211, #179

172
Improvements to the structure of the analysis process and the analysis tool dealt
with changes to the preliminary structure that was based on Levitt’s, Knight’s,
Stehm’s, Jorion’s and Penrose’s theories that are presented in Chapters 1.3. and
1.4. The improvements involved the means and methods of connection between
the “Concept” and “Resource analysis” tables, the addition of knowledge area
columns, and the removal of rating columns.
A fault modes and effects analysis (FMEA) investigates for every component the
consequences of all defined modes of failure. Investigation is usually carried out
for each component in isolation from the analysis of other components, since if
combinations were considered the task would become intractable. Marketing or
administration issues cannot easily be analyzed (Ansell and Wharton 1992, p.
109). Representatives of the pilot firms that have experience in FMEA assessed
that EDCP considers the whole project from several aspects whereas FMEA
concentrates on analysis of details of existing products.
Methods based on decision theory are easy to use also for comparing several
strategies because they pay attention to several evaluation dimensions
simultaneously. Decision theory methods also take into consideration non
quantifiable factors and they do not necessarily require quantifiable data. Thus the
methods based on decision theory are considered suitable for early stages in the
development process (Andersson and Laurila 1983, p. 2). Therefore a good EDCP
can preferedly be decision theory based, it should allow the use of non
quantifiable factors. The QFD (House of Quality) determines the primary
customer needs i.e., customer perceptions of competitive products with respect to
those needs, and the Core Benefit Propositions (CBP). In QFD the CBP represent
a summary of the key benefits when designing a profitable product and marketing

173
strategy for the identified product (Urban and Hauser 1993, p. 164). This can be
said to be the way QFD determines the attributes of the concept. Pilot firms where
QFD had been discussed also noticed resemblance with EDCP in this respect.
However, they all recognized considerable differences in time requirement to the
advantage of EDCP. Changes were also suggested to the procedure during the
analysis sessions. These suggestions involved the brainstorming, direct feeding of
data into the computer, teamwork, documentation, and functional activities.
The selection of team members was discussed prior to the start of many pilot
project analyses. Findings from the literature were used as reference in the
selection procedure in some of the pilot firms. For instance Andersson and Laurila
(1983, p. 58, 61) notice that the evaluators must include people with competence,
experience and feeling for different areas. It is important to select the right person
for project leader.
Some writers also suggest that the team shall include a chairperson, a secretary
and several specialists not involved in the development of the product or process
under review (independent members). Furthermore, designers and developers
(members of the project team) shall be included (CEI IEC 1160 1992, p. 19). In
the EDCP sessions the developer usually took the role of secretary, although some
pilot firms assumed the duty towards the end of the EDCP development project.
Documentation of the activities during the sessions was important for the analysis
itself and also for the purpose of the research work. There are two primary
purposes for documentation of activities. The first is to provide a means for the
followingup of action items and recommendations. The second is to create a
record to assist in establishing the stateoftheart and development history of the
product (CEI IEC 1160 1992, p. 39). A report shall present a qualitative model of

174
project risk, ideally summarized in diagrams, with underlying computerbased
models, to handle changes where appropriate and feasible (Chapman and Ward
1997, p. 141). These purposes were recognized in many pilot analyses. Followup
occurred between the analysis sessions in some of those cases that involved
successive sessions with longer intermediate intervals. The results from the
previous session had been taken into consideration in the management of the
project under analyzis. Also the general documentation of the project by EDCP
was considered important by the pilot firms. The written final “Analysis report”
presented a qualitative model of the project risk with tables and diagrams that
were discussed in the final session for each project. The interface between user
and model proved an important focus for development. The interface is comprised
of the computer and its peripherals as well as of ways to use the model.
Typically, explaining guidance in the form of manuals for analysis work is part of
practically all analysis methods. One example of explaining guidance occurs in
checking list methods that involve rating according to different scales ranging
from “yesno” to different numerical or verbal scales. Here the guidance involves
information on the type of answer e.g., yesno, or scale and range of scale
(Andersson and Laurila 1983, p. 124). Some idea creating programs contain
information packages that can also serve as a quickcourse for persons who are
unfamiliar to the method (Virkkala 1994, p.215). The guidance system in EDCP
proved a most important need from the very start of the cooperation with the pilot
firms. Improved headings for the columns and rows in the analysis tables as well
as typed manuals were the first useful steps in the development of the guidance
system. They were followed by an activated guidance system that was integrated
into the computer program. This system was gradually improved so that it
eventually covered practically all columns and rows in both the analysis and the

175
result tables. It could be activated at any time during the analysis process.
Guidance included both advice on how to operate the analysis model and
explanations about the meaning and the calculation of the results.
Other items that particularly increased the convenience in using the model
included the row addition and deletion features. They made adding, moving or
deleting analysis objects easy during the analysis sessions and during the editing.
This interface improvement made the analysis work very flexible compared to
e.g., work with paper forms or with regular spreadsheets or word processing
programs. The improvement of the calculating formulas was also aimed at an
increase in the using comfort of the model. For example listings and ratings were
made to copy automatically to several places in the analysis table when needed.
Cooperation with the pilot firms also helped to reveal hidden faults in formulas
and in the function of the computer program. The presentation of the analysis
results also proved to be an important part of the analysis process. This was
accentuated by the fact that the analyzed projects were integrated with the
operation of the pilot firms, and thus the analysis results represented direct interest
to the firms.
The deliverables from the EDCP analysis includes diagrams, charts and reports.
Cooperation with the firms became still more directly involved in the development
of the instruments for the presentation of the analysis results than in the work with
the analysis tables. This is understandable because the analysis results represented
the ultimate interest to the management of the pilot firms. Particular tables for the
most important analysis results were developed, as were sorting tables for editing
the results according to the requirements of the individual pilot firms. The Excel

176
computer program fulfilled certain needs by fitting the form of tables to the
requirements of the chart drawing function. #1939#
The project management perceived their interaction with the analysis model
through the use or advantage that the pilot firms gained through the analyses.
Three types of uses could be differentiated among the answers from interviews
with representatives from the pilot firms. Firstly, the analysis results pointed out
certain items to the firms, secondly, they resulted in certain savings for the firms
and, thirdly, the analysis results acted as decision aids.
Items Pointed Out
The method pointed out risks in several analyses, it pointed out new things, and
several things to regard in the managing the project in three cases. Thus the
statements that the method must also point out items that shall be improved rather
than just reject projects (Andersson and Laurila 1983, p. 61) can be considered to
be realized by the EDCP model in practice.
Savings
The advantages included considerable time savings in the realization of several
projects, and it also aided in the attempts to put some project on hold. The results
from the analysis also made management make changes to the project. Thus
EDCP fulfils the requirements e.g., on Fault tree and Event tree analysis that is
used to find reasons for possible project overruns and means for accelerations. For
instance, Silverberg (1991) presents a graphical process to predict R&D project
events and assign error bars to the predictions. Also several of project
management methods e.g., PERT, GERT, SCERT act as methods to control the
realization of projects (Chapman and Ward 1997, p. 8991).

177
Decision Aid
The types of decision aids included the service of EDCP as a general decision
instrument for some pilot projects. EDCP also reinforced opinions and gave “aha
experiences” for the decision makers. One pilot firm experienced the analysis
model to become part of the project planning process. Finally, the analysis results
were used as part of the finance applications for several pilot projects.
Also in these respects the method fulfilled the requirements put forward e.g., by
Chapman and Ward (1997, p. 8991) and Wilkinson (1991).
5.4. How did the Research Questions got Answered?
How to Develop a Usable and Useful Analysis Tool?
The relation of the EDCP model to usability and to usefulness was tested in the
case analyses provided by the pilot firms. Usability is interpreted through the
assessment of project managers for the constructed model. Usefulness is
interpreted through management’s perception of the interaction with the analysis
model.
The development of a usable and useful analysis tool is advantageously performed
in a sequence of clearly defined stages. The initial phase ought to be the formation
of the theoretical base for building the model of the analysis tool. In the case of
EDCP this involved the study of the theoretical discussions of Levitt (1980),
Nonaka and Takeushi (1995), Penrose (1959), Knight (1985), Andersson and
Laurila (1983), Mahoney and Panjan (1992), and Majumdar (1998). Based on the
findings from the study of theory a preliminary model was structured. In the case
of EDCP this stage produced a preliminary model that was tested on hypothetical
cases or cases of old projects. The model was developed into a state that could be

178
demonstrated for potential interests. The advantage of using computers became
apparent already in the preliminary modeling stage, supporting the statements of
Virkkala (1994, p. 30). Working with paper and pencil proved utterly awkward.
The preliminary modeling stage can be succeeded by a prepilot analysis stage
where selected projects are analyzed, primarily for the purpose of testing the
analysis tool. The selected projects may be familiar to the developer. In the case of
EDCP the outcome from these analyses resulted in several improvements to the
model. For instance collation tables for analysis results, and graphs were
introduced as recommended e.g., by Chapman and Ward (1997, p. 44) and CEI
IEC 1160 (1972, p. 39). The pre pilot analysis stage indicated the usefulness of
model development in connection with continuous testing of the model in
cooperation with pilot firms. In the development process for the EDCP a selection
process for pilot firms and pilot projects was initiated and carried through. This
included arrangement for financing of the development work; evaluation of pilot
firms by academic experts was also part of this process. Development of means
for presenting the EDCP project to the potential pilot firms and to the financiers
took place during this process.
The development work for a usable and useful analysis tool should be structured
into a number of subsequent stages. The contents of the different stages must be
arranged to link to each other in a flexible manner.
The development of the EDCP model was done in three consecutive sequences,
the first sequence consists of pilot analyses, and intermediate development, and
the second sequence of pilot analyses. This arrangement allowed the developer to

179
flexibly integrate experience form the first sequence into the model for testing in
the second sequence.
Improvements during the first sequence included improvements to the interface
e.g., the direct use of computer in the analysis work that made the model easy to
use by a team as compared to other methods e.g., paper forms and subsequent
transfer into the computer, not to speak of manual computation. Thus the model
answers to Andersson and Laurila’s (1983, p. 57) request of easy use and
computer utilization. The improvements also regarded model related features e.g.,
addition of certain listing and rating items. Improvements also involved model
related means to enhance project definition, in accordance with Chapman and
Ward (1997, p. 68). The intermediate development stage involved introduction of
macrobased automation of the analysis operations during the session i.e.,
improvements to the interface. These included row addition and guidance that
made work easier, this in accordance with Virkkala’s (1994, p. 30) statement to
use computer to enhance the work with models, and with Andersson and Laurila’s
(1983, p. 57) statement that the model must be easy to use in order not to repel the
users. The intermediate development stage also included method related changes
such as simplifications to the model in order to save time in the analysis sessions.
This was an attempt to shorten the analysis time compared to those required in
other methods, as mentioned by e.g., Halman and Keizer (1994, p. 7980). In the
second pilot analysis stage, method related activities included the work on
different approaches to rating and on the sensitivity in connection to rating e.g.,
referring to Tell and Wallenius (1979, p. 56). A means for rating the analysis
team’s competence was also introduced, in relation to Chapman and Ward (1997,
p. 93), who indicate that the members themselves create a considerable risk. In the
second pilot analysis stage interface related items included the use of a computer
180
connected projector to facilitate the work during the sessions, in accordance with
Andersson and Laurila (1983, p. 57), who recommend that the method be easy to
use. In the concluding stage of the development of a usable and useful analysis
tool, the experience from the pilot analyses ought to be condensed into a final
model. In the case of the EDCP a few pilot cases were tested using the final
version of the analysis tool.
This study was performed as a constructive research work. Its construct was
defined as the explicit solution for the early detection of problems in innovation
projects. The construct involved a model for the analysis, in one single analysis
process, of the concept of the project and of the resources applied in the realization
process. Thus the study resulted in something new and divergent compared to the
analysis practices earlier known. These facts show that the model fills the
requirements for constructive research put forward e.g., by Kasanan et al. (1991,
p. 302, 304). The literature study revealed that the research problem was
connected to earlier knowledge, it filled several voids in the knowledge field of
analysis of risks in innovation projects, and this verifies the requirement of
newness put by constructive research (Kasanen et al. 1991, p. 302, 304).
The analysis work is positioned so that the literature study also anchors the study
to fundamental research, and the model is largely based on the application of
findings from this scientific literature and so represents scientific problem solving.
The application of the computer ties the model to technology, and the use of the
model in the pilot firms connects the method to consulting. This position is
another indication of the constructive character of this research work (Kasanen et
al. 1991, p. 303). Constructive research also ought to be connected to the decision
methodological and actionanalytical research grips (Kasanen et al. 1991, p. 315).

181
EDCP analysis supports decisionmaking in connection with the action in
innovative projects, and thus fulfills requirements for constructive research.
Practical constructive research work can be divided into specific sequences
(Kasanen et al. 1991, p. 317). In the case of EDCP the problem finding stage is
represented by the researcher’s own experience, the prestudy stage is represented
by the literature study of the research area and consecutive void finding in the
knowledge actual field, and the innovation stage is represented by the
constructionstage for the basic model. Further, the model was tested, and its
rightness demonstrated during the modelextension and preanalysisstages. The
connection to theory was demonstrated through the literature study, as was the
scientific newness of the model. Finally, the area of application for the model was
demonstrated through the different types of innovative projects analyzed with the
model in the pilot and the commercial analysis projects.
How can we select the Firms that are best suited as Pilots for the Development of
an EDCPMethod?
Input in the form of projects, time and analyzers by the pilot firm increased the
benefits for the development of EDCP in this work. Of the 16 pilot firms the nine
firms that contributed gave clearly more input for the aforementioned forms.
These firms also benefited from the analyses. We must therefore assure that the
firms selected as pilots are prepared to supply sufficient inputs for the
development work in the form of a sufficient number of analyzers and sufficient
number of sessions i.e., time. Furthermore it is important that the firms benefit
from the analyses.

182
How can we help the Pilot Firm to select the most suitable Projects for the
Development of an EDCP Method?
The results from this work indicate that the project should have the potential to
gain something from the analysis. The project should also be of medium or large
size rather than of small size. Furthermore projects involving only incremental
innovation should be avoided.

183
6. Theoretical Implications and Contributions
6.1. Theoretical Implications
The EDCPsystem was developed largely in cooperation with the pilot firms, yet,
as notable from earlier chapters, particularly from the discussion, it is supported
by many fundamental theories. These theories include risk theory, innovation
theory, project management theory as well as knowledge and resource based
theories.
The model itself may be considered as rather complex. However, since it was
developed on real R&D and innovation projects in close cooperation with the
pilot firms it also reflects the nature of reallife R&D and innovation projects:
they are complex.
A most important theoretical implication is that this model is in simultaneous
concordance with several of the theories listed above. This indicates that it is
possible to develop analysis models based on business science theories. On the
other hand this type of practical development work produced a working analysis
model that has been successfully commercialized. The model can also be shown to
be in accordance with rules set by the theories mentioned above. Consequently the
model also indicates that the theories agree with reality, and that several theories
simultaneously do this.
The preliminary analysis step i.e., the project presentation supports the first step in
Ansoff’s problem solving method so that the perception of decision need or
opportunity will be considered (Ansoff, 1987, p. 38). Furthermore, it is part of
strategy development, as it fits into the project generation and selection step of the
action cycle in strategic development (Ansoff, 1987, p. 178). The EDCPanalysis
supports Knight’s definition of measurable risks vs. unmeasurable uncertainty
(Knight 1985, p. 19) in that the analysis puts a measure on the risk concentrations

184
that it detects. The analysis system is also in accordance to the fourth step of
Ansoff’s (1987, p. 38) problem solving method because the classified risk
concentrations indicate which alternatives to avoid in the choice of alternatives,
for successful implementation.
The EDCPmethod also supports Levitt’s theories of definition for product or
service using attributes and components. This is a consequence of the fact that this
was the only theory that was applied to the model development work from the
start. The use of attributecomponent pairs to characterize the product or service
i.e., the concept, supports Schumpeter’s (1934, p. 66) theory of innovations being
new combinations because the pairs represent new combinations in the model. The
attributecomponent pairs also define the innovation in such a way that, in the
analysis the risks involved are detected. Such risks in innovation are predicted by
Schumpeter’s theory of innovation being risky (1934, p. 89). Even Schumpeter’s
definition of creative destruction can be considered supported by the analytical
separation of the project into its constituents i.e., into attributes, components,
knowledge areas and resources.
The guidance questions for listing attributes and components support
Schumpeter’s view of innovation (new combinations) via Levitt’s definition of
product or service. The questions for listing knowledge areas and resources
support Nonaka and Takeushi’s, Barney’s and Penrose’s knowledge and resource
based theories. They also support the statements of Ansoff (1965, p. 19) regarding
allocation of resources. The questions to guide the ratings of significances of
attribute, knowledge area and the ratings of goodness and availability of the
resources support Knight’s theory of risk vs. uncertainty. By rating these
significances the decision basis is transferred towards measured risks from un
measured uncertainty. Finally, the guided explanations for the formulas in the

185
result tables support the statements of Ansell and Wharton (1992, p. 207208) that
the model must be understood in detail.
These implications indicate that an analysis method for the detection of risks in
R&D and innovation projects can be constructed by following the theories of
risk, innovation, project management, and the knowledge and resource based
theories. The implications also show that a model can be practically constructed
that covers the wide range of items that must be considered in an R&D or
innovation project. The model will coincide with the theories mentioned above if
the practical work is performed in intimate contact with reallife projects. #2146#
The question of integrating different theories to form a model was answered by
linking together the statements of important researchers in the areas of innovation,
risk, management, knowledge and resource handling. Particularly the integration
of knowledge and resource based theories into risk theory became apparent by
linking the objects of these theories e.g., team members, entrepreneurs and
capitalists. These objects also linked knowledge and resource based theories and
risk theory to innovation theory. Risk management further links management
theory to the theories mentioned above.
6.2. Contributions
The contributions in this work relate to three levels i.e., the theoretical level, the
modeling level and the conceptual level.
The theoretical contributions consist of creating a model in a multidisciplinary
approach that incorporates constituents from risk theory, from innovation theory,
from management theory, and from knowledge and resource based theories.
Constituents from innovation theory include the concept of innovation related risk;
from management theory the constituents are attribute and component; and from

186
risk theory, the concept of rating in order to assess the value of the risk. From the
knowledge and resource based theories, the model contains the constituents of
knowledge areas and resources. The multidisciplinary character of the model is
also demonstrated by the close connection between risk theory and knowledge and
resource based theories through the measurable risk factors that make up an
important part of the outcome of the analysis with the model. #2151#
The contributions on the modeling level include the arrangement of the
constituents from the theory into appropriate groups to create a meaningful
analysis method. They also include the presentation of the project, the concept, the
knowledge areas, and the resources, including the grouping of rating activities as
well as the generating of risk factors and arranging them into proper groups.
Finally, the structure of the model determines the order in which different groups
of constituents are dealt with when the model is operating.
The contributions on the conceptual level consist of arranging the groups of
theoretical constituents into a system for appropriate for carrying out risk analysis
of innovation and R&Dprojects. The contributions also involve the appropriate
combination of the groups with instruments to create an effective interface
between the elements in model i.e., the analysis system, and the user. Examples of
individual conceptual contributions are the analyses of the concept of the project
and the resources in the same analysis procedure, and the derivation of the
knowledge areas from the concept of the project. Another example is the use of
the knowledge areas as a link between the concept and resource analyses. The
calculation of the risk factors related to individual attributecomponentresource
groups constitutes a conceptual contribution. Basing the risk evaluation on the
principle that a demanding attributecomponent pair and a weak resource combine
to a big risk, constitutes another conceptual contribution. #2153#

187
7. Suggestions for Further Research
Based on the findings in this work some suggestions for new research can be put
forward. They can be divided into two groups, theoretically inclined research and
development of applications.
Theoretical research topics include research into the influence of the character of
the project on the development work. This work was not structured from the
beginning to provide exhaustive answers to these questions. Further research
ought to follow up the impact on development work affected by a more selective
choice and classification of the size, and the stage of the development of the
project. Also the type of innovation or invention and other relevant parameters
must be regarded. Furthermore, the dependence of the analysis time on different
factors needs investigation. Knowledge of the influence of the character of the
project enhances the development work for analysis tools because it avoids the
selection of projects that are useful to neither the development work nor the
participating organizations.
The character of the participating firms and analysis teams must also be
investigated more thoroughly than in this work. The characteristics include firm’s
size and research intensity. Another factor worth investigation is the research
directedness of the analysis team. Knowledge of firm related parameters and
variables enhance the selection process so that such pilot firms will be selected
that are useful for the model development, and that can also benefit from the
analysis process and results.
Further development for the applications includes the development of methods for
more specific purposes e.g., SWOTanalyses, specific risk analyses (mentioning
the word risk), and project planning methods. The EDCP base can be used as a
platform for the development of other methods.

188
References
Alasuutari (1994) Alasuutari P: Laadullinen tutkimus, 2. uud. Pianos, Vastapaino Oy, Tampere 1994
Allardt (1990) Allardt; Arkhimedes, Vol 3, 1990, p 497
Andersson andLaurila (1983)
Andersson T and Laurila J ,Produktidévärdering i teori och praktik, 1983,Chalmers University of Technology, Gothenburg, Sweden (masters thesis)
Andrén (1973 Andrén R: Projektvärdering, värdering och val av produktutvecklingsprojekt,HermodsStudentlitteratur, Lund, Sweden (1973)
Ansell andWharton (1992)
Ansell, J, Wharton F, Risk: Analysis, Assessment and Management, 1992, JohnWiley and Sons Ltd, Chichester, England
Ansoff (1965) Ansoff I: The Corporate Strategy, McGrowHill, Inc. USA, 1965
Ansoff (1987) Ansoff I: The Corporate Strategy, Penguin Books, London, 1987
Ansoff (1979) Ansoff I, Strategic Management, The Macmillan Press Ltd, Hong Kong 1979
Ansoff (1984) Ansoff I, Implanting Strategic Management, Prentice Hall, Englewood Cliffs, NJ,USA, 1984
Baker et al (1986) Baker, Green,Bean: Why R&D Projects Succeed or Fail; Research Management,Vol 29:6, Nov – Dec 1986, p. 2934
Ballard (1992) Ballard G M, Industrial Risk: Safety by Design, Chapter 6 in Ansell, J, Wharton F,Risk: Analysis, Assessment and Management, 1992, John Wiley and Sons Ltd,Chichester, England
Barney (1996) Barney J B, Brusenitz L W, Fiet J O, Moesel D D: New Venture Teams’Assessment of Learning Assistance from Venture Capital Firms, 1996, Journal ofBusiness Venturing 11, p. 257272
Barreto (1989) Barreto H: The entrepreneur in microeconomic theory: disappearance andexplanation, Routledge, New York, 1989
Blake (1978) Blake S B, Managing for Responsive Research and Development, Freeman andCo, San Fransisco, CA, 1978
Boctor (1990) Boctor; Eurp. J. of Oper. Res. Vol 49 (1990) p.313
Booz, et. al,(1971) Booz, Allen and Hamilton, Management of New Products, (New York, Booz,

189
Allen and Hamilton, Inc., 1971)
Booz, et. al,(1982) Booz, Allen and Hamilton, New Product Management for the 1980’s, (New York,Booz, Allen and Hamilton, Inc., 1982)
CEI IEC 1160(1992)
Formal design review, CEI IEC 1160 199208
Chapman (1992) Chapman C, A Risk Engineering Approach to Risk Management, Chapter 2 inAnsell, J, Wharton F, Risk: Analysis, Assessment and Management, 1992, JohnWiley and Sons Ltd, Chichester, England
Chapman andWard (1997)
Chapman, C, Ward, S, Project Risk Management Processes, Techinques andInsights, 1997, John Wiley and Sons Ltd, Chichester, England
Christensen (1997) Christensen C: The Innovator’s Dilemma, Harvard Business School Press,Boston, Mass., 1997
Cohen (1988) Cohen: Innovation at Du Pont a RealTime Perspective; Research Management,NovDec 1988, Vol 31:6, p4752
Cooper (1984a) Cooper R G, How New Product Strategies Impact on Performance, Journal ofProduct Innovation, 1 (1), (1984a) p518
Cooper (1984b) Cooper R G, New Product Strategies – What Distinguishes the Top Performers,Journal of Product Innovation, 1 (3), (1984b) p15164
Cooper andKleinschmidt(1987)
Cooper and Kleinschmidt (1987): Cooper R G; Kleinschmidt E J:What makes anew product a winner: Success factors at the project level; R&D Management 17,3, 1987 p 175189
Coover (1986) Coover: Programmed Innovation Strategy for success; Research Management,Vol 29:6, Nov Dec 1986, p1217
Cornell (1999) Cornell B: The equity risk premium: the longrun future of the stock market, JohnWiley & Sons, Inc. 1999
Danila (1989) Danila: Strategy, evaluation and selection, literat. study of different methods, Rand D Managem. Vol 19:1, Jan 1989, p4762
Decom (1991) Decom A K: Project evaluation: bringing in the sheaves, Journal of SystemsManagement, Dec. 1991, Vol. 42:12, p. 1316
Donaldson (1992) Donaldson J, Capteer 11, Ansell, J, Wharton F, Risk: Analysis, Assessment andManagement, 1992, John Wiley and Sons Ltd, Chichester, England
Dowd (1999) Beyond value at risk: the new science of risk management, John Wiley and Sons,

190
Chichester, England, 1999
Drucker (1986) Drucker P, Innovation And entrepreneurship, Practice and Principles, Heinemann,London, 1986
Duncan (1996) Duncan W: Project Management Institute. A Guide to the Project ManagementBody of Knowledge. Automated Graphic Systems, Charlotte, NC, USA 1996
Ekvall (1979) Ekvall, G, Kreativitet och kreativ problemlösning, PArådet, Udevalla, 1979
Elmaghraby(1983)
Elmaghraby: An approach for thecontrol of res. & dev. projects; Scand. J ofMaterials Administr., Vol9 No.1, 1983, p. 2657
ESAIRS (1993) ESAIRS User Guide, ESAIRS Information Retreival Service, Frescati, Italy,1993
Fahmi and Spätig(1990)
Fahmi, Spätig; Res & Dev Mgm; Vol 20:2, 1990 p 155171
Fishburn (1974) Fishburn P C, Lexicographic Orders, Utilities and Decision Rules: A Survey,Management Science, Vol. 20, No. 11 (July 1974), pp 144271
FMEA (1985) Analysis techniques for system reliability – Procedure for failure mode analysis(FMEA) IEC Standard, Publication 812, Geneva, Switzerland, 1985
Freeman (1974) Freman C, The Economics of Industrial Innovation, Penguin, hamondsworth,1974
Fussell (1976) Fussell J B, Fault tree analysis: concepts and techniques, Generic Techniques inSystem Reliability Assessment, NATO Advanced Institute Studies, NoordhoffLeyden, 1976, pp 13362
Green (1995) Green, S G, Gavin, M B, AimanSmith, L, Assessing a Multidimensional Measureof Technological Innovation, IEEE Transactions on Engineering Management,Vol 42, No 3, August 1995
Halman andKeizer (1994)
Halman, J I M, Keizer, J A, Diagnosing risks in productinnovation projects,International Journal of Project Management, 1994 12 (2) 7580
Hamel andPrahalad (1993)
Hamel G and Prahalad C K: Strategy as Stretch and Leverage, Harvard BusinessReview, MarchApril 1993, p. 7584
Harisalo andMiettinen (2000)
Harisalo, R and Miettinen, E, Luottamus Yrittäjyyden kolmas voima, TampereUniversity Press, Tampere, 2000
Harrison (1993) Harrison F L: Advanced Project Management: A Structured Approach, ThirdEdition, Halistead Press, John Wiley & Sons Inc, NY, USA, 1993

191
Hedlund (1986) Hedlund G, The Hypermodern MNCA Heterarchy, Human ResearchManagement, 25 no 1, 1986, pp935
Hedlund (1993) Hedlund G, Assumptions of Hierarchy and Heterarchy, With Applications to theManagement of the Multinational Corporation, pp 21136 in Ghoshal andWestney (eds.), Organization Theory and the Multinational Corporation, StMartin’s Press, 1993,
Hedlund (1994) Hedlund G, A Model of Knowledge Management and the NForm Corporation,Strategic Management Journal, Vol. 15, 1994, pp 7390
Ho and Pike(1992)
Ho, S S M and Pike R H, The Use of Risk Analysis Techniques in CapitalInvestment Appraisal, Chapter 5 in Ansell, J, Wharton F, Risk: Analysis,Assessment and Management, 1992, John Wiley and Sons Ltd, Chichester,England
Jorion (2000) Jorion P: Value at risk: the new benchmark for managing financial risk, McGrawHill, USA, 2000
Kasanen et.al(1991)
Kasanen E, Luukka K, Siitonen A, Konstruktiivinen tutkimusoteliiketaloustieteessä, Liiketaloudellinen aikaakauskirja, 3/1991
Keller (1986) Keller; Academy of Mgm J. Vol 29, No.4 (1986) p 715726
Kerlinger (1977) Kerlinger F N: Foundations of Behavioral Research, A Holt InternatioalEdition,Rinehart and Winston, London, 1977
Kerzner (1984) Kerzner, Hostelly; J. of Systems Mgm, Feb 1984 p 611
Klahr (1969) Klahr D, Decision Making in a Complex Environment: The Use of SimilarityJudgements to Predict Preferences, Management Science, Vol 15 (1969), p 595618
KlusTest KlusTest home page 1996
Knight (1985) Knight F H: Risk, Uncertainty and Profit, University of Chicago Press, 1985
Kogut and Zander(!993)
Kogut B and Zander U, Knowledge of the firm and the evolutionary theory of themultinational corporation, Journal of International Business Studies, 4th Qr.,1993, pp. 62545
Kosnik (1990) Kosnik T J: Perennial Renessance: The Marketing Challenge in High TechSettings in von Glinow, M A, Mohrman S A (Ed.), Manafing Complexity in HighTechnology Organizations, New York, Oxford University Press, Inc::
Kotler (1988) Kotler P; Marketing Management: Analysis, Planning, Implementation, andControl, PrenticeHall, Inc, Englewood Cliffs, NJ, USA, 1988
192
Kotler (1991) Kotler P: Marketing Managememt – Analysis, Planning, Implementation, andControl, /th ed. London, PrenticeHall
Krogh et al. (1988) Krogh, Prager, Sorensen, Tomlinson; Res. Tech. Mfgm., Vol 31:6, NovDec 1988p1014
Kulkki (1996) Kulkki, S, Knowledge Creation of Multinational Corporations, Helsinki School ofEconomics and Business Administration 1996 (doctoral thesis)
Kuusi (1999) Kuusi, O, Expertise in the Future Use of Generic Technologies, Helsinki Schoolof Economics and Business Administration, A159, Helsinki, 1999
Lahti (1987) Lahti A: Strateginen yritysanalyysi, Espoo, AmerYhtymä Weilin + Göös, 1987
LeonardBarton(1992)
LeonardBarton D: Core capabilities and core rigidities: A paradox in managingnew product development, Strategic Management Journal, Summer Special Issues,13, p 111125
Leskinen (1999) Leskinen, PL, ”Yrittäjällä on koko elämä kiinni yrityksessä”, UniversitasWasaensis, Vaasa, 1999
Levitt (1977) Marketing when things change, Harvard Business Review, NovDec 1977
Levitt (1980) Levitt T: Marketing success through differentiationof anything, Harvard BusinessReview, JanFeb 1980
Lichtenberg (1989) Lichtenberg S: New project management principles for the conception stage:outline for a new ‘generation’, International Journal of Project Management Feb.1989, Vol 7:1, p. 4651
Lilien et al. (1992) Lilen G L, Kotler P, Sridhar Moorthy K, Marketing Models, Prentice Hall,Englewood Cliffs NJ, USA, 1992
Lintunen (2000) Lintunen L : Who is the winner entrepreneur? An epistemological study of theSchumpeterian entrepreneur, Helsinki School of Economics and Administration,Acta Universitatis Oeconomicae Helsingiensis A180, Helsinki 2000
Lundell (1988) Lindell M: Utveckling av Nya Produkter; Publications of the Swedish School ofEconomics and Business Administration No. 40, Helsingfors, Finland (1988)
Lundin (1999) Lundin R: If Projects Are So Damned Good, How Come Everything A’intProjects? Managing Business Projects, Volume 1, Project ManagementAssociation Finland and NORDNET, p. 189201, 1999
Lynn et al. (1997) Lynn S, Morone J, Paulson A: Marketing and Discontinuous Innovation: TheProbe and Learn Process, in Tushman M, Anderson P: Managing Strategical

193
Innovation and Change, Oxford University Press, Oxford, New York 1997, p.353375
Maccrimmon andWehrung (1986)
Maccrimmon K R and Wehrung D A, Taking Risks: The Management ofUncertainty, Collier Macmillan, London, 1986
Magnusson (1993) Magnusson L, editor: Evolutionary and NeoSchumpeterian Approaches toEchonomics, Kluwer Academic Publishers, USA, 1993
Mahoney andPandian (1992)
Mahoney J T; Pandian J R: The ResourceBased View within the Conversation ofStrategic Management, Strategic Management Journal, Vol. 13, 363380 (1992)
Majumdar (1998) Majumdar S K: On the Utilization of Resources: Perspectives from the U. S.Telecommunications Industry, Strategic Management Journal, 19: 809831 (1998)
March (1978) March J G: Bounded Rationality, Ambiguity and the Engineering of Choice, BellJournal of Economics, 9, p. 578608
Marshall (1965) Marshall A: Principles of Economics, London, Macmillan 1965
McKinsey (2000) McKinsey & Co: Ideasta kasvuyritykseksi, WSOY ja McKinsey & Company,Porvoo 2000
Merrifield (1981) Merrifield (1981): Merrifield D B: Selecting Projects for Commercial Succes;Research Management, Vol 24:6 (1981), p 1318
Midgley (1977) Midgley D F: Innovation and New Product Marketing, UK, 1977
Miles andHuberman (1994)
Miles M and Huberman M: Qualitative Data Analysis, Sage Publications, 1994
Mintzberg andLampel(1999)
Mintzberg H, Lampel J, Reflecting on the Strategy Process, Sloan ManagementReview, Spring 1999, p. 2130
Moder (1988) Moder J Network techniques in project management, in: D I Cleland and W RKing, Project Management Handbook, Van Nostrand Reinhold, New York, 1988,pp324373
Moder and Philips(1970)
Moder J J, and Philips C R, Project Management with CPM and PERT, VanNostrand, New York, 1970
Moore (1988) Moore, L M, Singular Factorial Designs Resulting from Missing Pairs of DesignPoints, Journal of Statistical Planning and Inference 19, p. 325340, 1988
Myers and Shocker(1981)
Myers J H, Shocker A D: The Nature of ProductRelated Attributes, Research inMarketing, Vol 5, 1981, p. 211236

194
Nicholas (1978) **kulkki
Nicholas et al.(1986)
Nicholas D; Ritchie M: Literature and Bibliometrics, Clive Bingley, London(1978)
Nonaka andTakeuchi (1995)
Nonaka, I, Takeuchi, H.: The KnowledgeCreating Company, How JapaneseCompanies Create the Dynamics of Innovation,
Norling and Statz(1998)
Norling P and Statz R: How Discontinuous Innovation Really Happens, ResearchTechnology Management, MayJune 1998, Vol 41 (4), p. 4144
Näsi (1994) Näsi J: Arenas of Strategic Thinking. Helsinki Liikesivistysrahasto, Kp SnellmanOy, 1994
Oliver (1997) Oliver Chr: Sustainable Competitive Advantage: Combining Institutional andResourceBased Views, Strategic Management Journal, Vol. 18:9, 697713 (1997)
Osborn (1965) Osborn, A: Applied Imagination, Charles Scribner’s Sons, New York, USA, 1965
Parker et al. (1986) Parker C C; Turley R V: Information Sources in Science and Technology, secondedition, Butterworths, Cambridge England (1986)
Penrose (1959) Penrose E T: The Theory of the Growth of the Firm, Oxford, Basil Blackwell(1959)
Pettigrew (1992) Pettigrew A M, The Character and Significance of Strategy Process Research,Strategic Management Journal, Vol. 13, Special Issue, Winter 1992, pp 516
Pike and Neale(1993)
Pike R and Neale B: Corporate Finance and Investment: Decisions and Strategies,Prentice Hall International (UK) Ltd, 1993
Pinto and Covin(1989)
Pinto J K and Covin J G , Critical factors in project implementation: a comparisonof construction and R&D projects, Technovation 9, 1989, pp 4962
Porter (1980) Porter M E: Competitive Strategy, New York, The Free Press (1980)
Porter (1985) Porter M E: Competitive Advantage, New York, The Free Press (1985)
Prahalad andHamel (1990)
Prahalad C K and Hamel G: The Core Competence of the Corporation, HarvardBusiness Review, MayJune 1990, p. 7991
Random (1987) The Random House Dictionary of the English Language, Random House, Inc.U.S.A., 1987
Rangone (1999) Rangone A: A ResourceBased Approach to Strategy Analysis in SmallMediumSized Enterprises, Small Business Economics 12; 233248, 1999

195
Rescher (1983) Rescher N, Risk: A Philosophical Introduction to the Theory of Risk Evaluationand Management, University Press of America, 1983
Roman and Puett,(1983)
Roman D Puett J: International Business and Technological Innovation, NewYork, NorthHolland
Russell (1961) Russell B: A History of Western Philosophy, London, Unwin Hyman, 1961
Salminen (1996) private interview with P. Salminen, Laatutieto Oy 11.4.1996
Schumpeter (1928) The Instability of Capitalism in Essays on Entrepreneurs, Business Cycles, and onthe Evolution of Capitalism, ed R V Clemence, Transaction Publishers, thirdprinting, 1977
Schumpeter (1934) The Theory of Economic Development, New York, Oxford University Press, fifthprinting 1967
Schumpeter (1935) The Analysis of Economic Change in Essays on Entrepreneurs, Business Cycles,and on the Evolution of Capitalism, ed R V Clemence, Transaction Publishers,third printing, 1977
Schumpeter (1939) Business Cycles, Philadelphai, Penn. USA, Porcupine Press 1982
Schumpeter (1943) Capitalism in the Postwar World in Essays on Entrepreneurs, Business Cycles,and on the Evolution of Capitalism, ed R V Clemence, Transaction Publishers,third printing, 1977
Schumpeter (1946) Capitalism in Essays on Entrepreneurs, Business Cycles, and on the Evolution ofCapitalism, ed R V Clemence, Transaction Publishers, third printing, 1977
Schumpeter (1947) The Theoretical Problems of Economic Growth in Essays on Entrepreneurs,Business Cycles, and on the Evolution of Capitalism, ed R V Clemence,Transaction Publishers, third printing, 1977
Schumpeter (1947) The Creative Response in Economic History in Essays on Entrepreneurs, BusinessCycles, and on the Evolution of Capitalism, ed R V Clemence, TransactionPublishers, third printing, 1977
Schumpeter (1949) Economic Theory and Entrepreneurial History in Essays on Entrepreneurs,Business Cycles, and on the Evolution of Capitalism, ed R V Clemence,Transaction Publishers, third printing, 1977
Schumpeter (1949) Science and Ideology in Essays on Entrepreneurs, Business Cycles, and on theEvolution of Capitalism, ed R V Clemence, Transaction Publishers, third printing,1977
Schumpeter (1951) Schumpeter J A The Theory of Economic Development, Cambridge, MA,

196
Harverd University Press, 1951
Schumpeter (1952) Schumpeter J A Capitalism, Socialism and Democracy, 4th edition, London,George Allen & Unwin 1952
Schumpeter (1954) History of Economic Analysis New York, Oxford University Press 1954
Shenhar and Dvir(1996)
Shenhar, A J, Dvir, D, Toward a theory of project management, Research Policy25 (1996) 607632
Shionoya (1997) Shionoya Y, Schumpeter and the Idea of Social Science, Cambridge, UniversityPress, 1997
Silverberg (1991) Silverberg: Predicting Project Completion; Research Technology Management,Vol 34:3, May – Jun 1991, p.4649
Simon (1973) Simon H A: Applying Information Technology to Organization Design, PublicAdministration Review, 33, p. 268278 1973
Simon (1977) Simon H A: The new science of management decision, PrenticeHall, EnglewoodCliffs, NJ, USA, 1977
Sjölander (1983) Sjölander S: Innovation och företagsförnyelse, idéutveckling och idéhantering iföretag; LiberFörlag, Malmö, Sweden (1983)
Sjölander (1985) Sjölander S: Early Stage Management of Innovation, Chalmers University ofTechnology, Gothenburg, Sweden (dissertation 1985)
Stehm (1996) Stehm J: Clearance and Settlement Systems for Securities, World BankDiscussion Papers, 1996
Steinbock (2000) Steinbock D: USA:n teleoperaattorit pirstoutuvat, Talouselämä, 1/2001, p.45
Stewart (1959) Stewart J B: Functional Features in Product Strategy, Harvard Business Review,March – Apr. 1959, p. 65
Szakonyi (1988) Szakonyi; Making the most of R&D; Management Today, June 1988,p.1267Szakonyi (1990) Szakonyi; 101 Tips for Managing R&D more Efficiently I , Res Tech Mgm, July
Aug 1990 p 3136 and 101 Tips for Managing R&D more Efficiently II,NovemberDecember 1990 p 4146
Taylor (1911) Taylor F W: The Principles of Scientific Management, New York: Harper andBrothers 1911
Teece, Pisano andShuen (1991)
Teece D J, Pisano G and Shuen A: Dynamic Capabilities and StrategicManagement. Working Paper, Center for Research in Management, University ofBerkeley, 1991

197
Tell and Wallenius(1979)
Tell B, Wallenius J, A Survey of MultipleCriteria Decision Methods andApplications :Utility Theory and Mathematical Programming, The FinnishJournal of Business Economics 11979
Tirole (!988) Tirole J: The Theory of Industrial Organization, MIT Press, 1988
Toffler (1990) Toffler A: Powershift: Knowledge, Wealth and Violence at the Edge of the 21stCentury, New York,Bantam Books, 1990
Turner (1993) Turner J R: The Handbook of ProjectBased Management, London, McGrawHill, UK, 1993
Turunen (1991) QFD Avain tuotteen kehittämiseen, MET, Tekninen Tiedoitus 1/91,Metalliteolliosuuden Kustannus Oy, Helsinki, Finland, 1991
Urban and Hauser(1993)
Urban G L, Hauser J R, Design and Marketing of New Products, 1993, PrenticeHall, Inc, Englewood Cliffs, NJ 07632
Uusitalo (1991) Uusitalo H: Teide, tutkimus ja tutkielma: johdatus tutkielman maailmaan, Juva,WSOY, 1991
Virkkala 1994 Vilkko Virkkala: Luova Ongelmanratkaisu ISBN 9529056990, Helsinki, 1994,issued by Vilkko Virkkala, Purjetuulenkuja 11, 00850 Helsinki
VM (1991) VM:n työryhmämuistio 1991:18 Sellllllvityslakitöyryhmän muistio,Valtiovarainministeriö, Helsinki, 1991
Webster (1992) New Webster’s Dictionary and Thesaurus of the English Language, LexiconPublications, Danbury, Ct , 1992
Webster (1994) Webster’s Encyclopedic Unabridged Dictionary of the English Language,Gramercy Books, Avenel, NJ, 1994
Webster (1999) The New International Webster’s Comprehensive Dictionary of the EnglishLanguage, Trident International, 1999, Naples, Florida
Weelwright andClark (1992)
Weelwright S C and Clark K B, Revolutioning Product Development, The FreePress, New York, NY, 1992
Wilkinson (1990) Wilkinson (1;3) Develop. Expert Syst. on Proj. Evaluation, R & D Mgm,(1): Vol21:1, Jan 1991,p1929 (3): Vol 21:4, 1991,p.309318
Wilkinson (1991) Wilkinson (1;3) Develop. Expert Syst. on Proj. Evaluation, R & D Mgm,(1): Vol21:1, Jan 1991,p1929 (3): Vol 21:4, 1991,p.309318
Willkie (1986) Willkie W L, Consumer Behavior, J Wiley & Sons, 1986

198
Wind (1973) Green P E and Wind Y, Multiattribute Decisions in Marketing: A MeasurementApproach, Hinsdale, III Dryden Press, 1973
Wysocki et al.(1995)
Wysocki R K, Beck R, Crane D B: Effective Project Management: Hoe to Plan.Manage, and Deliver Projects on Time and Within Budget, John Wiley & Sons,1995
Yin (1994) Yin R: Case Study Research: Designed Methods, Sage Publications, 1994
Zaleznik (1971) Zaleznik A, Managers and leaders: are they different? Harvard Business Review,MayJune 1971, p. 6778
C:\WP\Dr\Avh\Wkb\ Aa0_04b.doc fr. Aa0_01.doc 25.4.02 by combining Aa0Cont.doc, Aa0_1.doc, Aa0_2.doc, Aa0_3.doc, Aa0_1dRe.docUpdated: 27.4.02; 29.4.02; 4.6.02; 17.10.02
§½!”#

199
C:\WP\Dr\Avh\Appendix\Aa0_App3.doc 25.4.02££££ Updated:
Appendix 1.List of econometric methods
Pay back time
Present value method
Internal interest method
Returnoninvestment diagram (ROI)
Index methods
Pacifico’s method
Risk calculation method
Profit method
Square root method
Relative value index
Sobelman’s investment value
Insecurity and risk evaluation methods
Paybackriskanalysis
Sensitivity analysis
(Andersson and Laurila, 1983, p 134)

200
Appendix 2. Analysis Criteria covered by different Analysis Methods,Finds from literature search
A P P L I C A T I O N 11.5.01
MET
HO
DS
Poss
ible
to te
stse
vera
l stra
tegi
es
Pre
proj
ectin
g
Prod
uct d
evel
opm
ent
Adm
inis
tratio
n
Prod
uctio
n pl
anni
ng
Mar
ket i
ntro
duct
ion
# ite
ms c
over
ed
Risk Management 0PERT X 1GERT X 1SCERT X 1FMEA X 1FMECA X 1Risk evaluation
X (X) X X X 5
Iderisk X 1Fault tree X X 2
Idea generators 0Idegen X X X 3TRIZ (X) X X 3CyberQuest
X X X 3
Decision theoretical methodsCheck list X 1Profile scheme
X 1
Ranging methodsX 1
Klustest X X X X 4Idemap (X) X 2
Project management 0Design reviews
X 1
QFD1 X X 2QFD2 0QFD3 0QFD4 0
Economic models 0Profitability methods
(X) X X X 4
Index methods (X) X 2
Operation Analysis 0Mathematicalprograming methods
(X) X 2
# items covered 3 16 11 1 7 4

201
DELIVERABLES
METHODSThemethodexpressesvalue inabsolutenumbers
Themethodexpressesvalue inrelativenumbers
Verbaltable
Graphicalpresentation Report
# itemscovered
Risk ManagementPERT (X) X 2GERT (X) X X 3SCERT (X) X X 3FMEA X X 2FMECA X X 2Riskevaluation X X 2
Iderisk X 1Fault tree X 1
Idea generatorsIdegen X X 2TRIZ 0CyberQuest
X 1
Decision theoretical methodsCheck list X 1Profilescheme X 1
Rangingmethods X 1
Klustest X X X X 4Idemap X X 2
Project managementDesignreviews X 1
QFD1 X X X 3QFD2 0QFD3 0QFD4 0
Economic modelsProfitabilitymethods X X 2
Indexmethods 0
Operation AnalysisMathematicalprogramingmethods X 1
# itemscovered 8 3 13 6 5

202
I N P U T S
METHODSBrainstormtype
Includesnonquantifiablefactors Guidance Rating
Requirementson indata
# itemscovered
Risk ManagementPERT (X) (X) M 3GERT (X) (X) M 3SCERT (X) (X) M 3FMEA 0FMECA X 1Riskevaluation M 1
Iderisk X 1Fault tree M 1
Idea generatorsIdegen X X L 3TRIZ X 1CyberQuest
X 1
Decision theoretical methodsCheck list X L 2Profilescheme X L 2
Rangingmethods X L 2
Klustest X X X L 4Idemap X X X L 4
Project managementDesignreviews H 1
QFD1 X 1QFD2 0QFD3 0QFD4 0
Economic modelsProfitabilitymethods M 1
Indexmethods M 1
Operation AnalysisMathematicalprogramingmethods H 1
# itemscovered 4 5 7 6 15

203
INTERMEDIATES OF ANALYSISMETHODS
Proj
ect c
hara
cter
,en
viro
nmen
t and
boun
darie
s
Con
cept
, gen
eral
ly
Con
cept
attr
ibut
es
Con
cept
com
pone
nts
Kno
wle
dge
Res
ourc
es, e
xplic
itly,
gene
rally
Res
ourc
e co
mpo
nent
sR
e R
esou
rce
abili
tyso
urce
abi
lity
Opt
imal
reso
urce
allo
cata
ion
cons
ider
ing
reso
urce
limita
tions
Tim
e fa
ctor
trea
ted
expl
icite
ly
Incl
udes
mul
tiple
crit
eria
Con
side
rs in
secu
rity
expl
icite
ly
# ite
ms c
over
ed
RiskManagement
PERTX X (X)link X X 5
GERT X X (X)link X X 5SCERT X X (X)link X X 5FMEA X X X 3FMECA X X X 3Risk evaluation
X X (X) X X (X) X 7
Iderisk X 1Fault tree X 1Idegen X 1TRIZ 0Idea
generators CyberQuest 0
Check list X 1Profile scheme
X 1
Ranging methods X X 2
Klustest X X X X X X X 7
DecisionTheoreticalmethods
Idemap X 1ProjectManagement
Design reviewsX X 2
QFD1 X (X) (X) 3QFD2 X X 2QFD3 X X X 3QFD4 X 1
Economicmodels
Profitabilitymethods X X X 3
Index methodsX X (X) 3
OperationAnalysis
Mathematicalprogramingmethods X X X (X) 4
# items covered 3 16 5 5 4 4 5 1 1 7 6 7

204
U S E S
METHODSRequirementson user
Cost ofintroduction
Costof use
Requirescomputer
Teamwork Guidance
Requiresdatabase
# itemscovered
PERT M L L (X) 4GERT M L L (X) 4
RiskManagement SCERT M L L (X) 4
FMEA H M L 3FMECA H M L 3Risk evaluation H M M X 4Iderisk H X X X 4Fault tree M M X 3
Ideagenerators Idegen L M L X (X) X X 7
TRIZ M H H X (X) X 6CyberQuest X X 2
Check list L L L 3Profile scheme L L L 3Ranging methods L L L 3Klustest M M L X X 5
Decisiontheoreticalmethods
Idemap X X X 3
Design reviews M M M X 4Projectmanagement QFD1 H H H X X 5
QFD2 0QFD3 0QFD4 0
Econometricmodels Profitability
methods L L L (X) 4
Index methodsL L L 3
OperationAnalysis Mathematical
programingmethods
H M H X 4
# items covered 19 18 17 10 8 6 3

205
NUMBER OF ITEMS COVERD BY DIFFERENT ANALYSIS METHODS
# ite
ms c
over
ed
App
licat
ion
Del
iver
able
s
Inpu
ts
Obj
ectg
sof
ana
lysis
Use
s
Tota
l #ite
ms c
over
ed
0METHODS
Risk Management PERT 1 2 3 5 4 15GERT 1 3 3 5 4 16SCERT 1 3 3 5 4 16FMEA 1 2 0 3 3 9FMECA 1 2 1 3 3 10Risk evaluation
5 2 1 7 4 19
Iderisk 1 1 1 1 4 8Fault tree 2 1 1 1 3 8
Idea generators 0Idegen 3 2 3 1 7 16TRIZ 3 0 1 0 6 10CyberQuest
3 1 1 0 2 7
Decision theoretical methodsCheck list 1 1 2 1 3 8Profile scheme
1 1 2 1 3 8
Ranging methods1 1 2 2 3 9
Klustest 4 4 4 7 5 24Idemap 2 2 4 1 3 12
Project management 0Design reviews
1 1 1 2 4 9
QFD1 2 3 1 3 5 14QFD2 0 0 0 2 0 2QFD3 0 0 0 3 0 3QFD4 0 0 0 1 0 1
Economic models 0Profitabilitymethods 4 2 1 3 4 14
Index methods2 0 1 3 3 9
Operation Analysis 0Mathematicalprogrammingmethods 2 1 1 4 4 12
# items covered 0EDCP EDCPmethod 5 4 5 10 6 30

206
Appendix 3. Important Stages in the Development of the EDCP AnalysisSystemThe improvements are indicated by text boxes and shadowing in the figures.
C:\MyDoc\Dr\Avh\Appendix\Bases1.doc 5.2.02
skekah01.xls
#1666# CONCEPT
Project name: Kahlúte protectivegarment
A B A F G
CONCEPT CONCEPT CONCEPT TECHNOLOGY TECHNOLOGYPRESENTATION ANALYSIS COMPONENTS PRESENTATION COMPETENCE
ANALYSISConcept attributes
Sig
nific
ance
Mar
ket
bene
fitTe
chni
cal
prob
lem
s
Concept components Technologies orsciences involved
Sig
nific
ance
Diff
icul
ty
New
ness
pass cutting test 10 x Composite cutting resistknowledge
10 10 10
lighter than present 8 x x fiber,yarn,fabrictypes, materials
testing ability 10 4 2
warmer than present 8 x fiber material fabric making 8 7 5
Hygienic 8 x test methods composite making 6 5 2long life 6 x apparel making 6 2 2economic ref. topresent
7 x
A B C D E F G H I J K L
C D E
KEY ATTRIBUTES KEY COMPONENTS RISKS OF CONCEPT
Sig
nific
anc
e
Concept components Rating of technologyrisks
Diff
icul
ties
ref.
com
peto
tor
New
ness
inge
nera
l
Ris
kfa
ctor
pass cutting test 10 Composite cutting resistknowledge
10 10 1000
pass cutting test 10 test methods testing ability 4 2 80lighter than present 8 fiber material fabric making 7 5 280warmer than present 8 Composite fabric making 7 5 280
Hygienic 8 fiber,yarn,fabrictypes, materials
apparel making 2 2 =C28*J28*K28
Figure (Skekah01.xls)
Figure 1.1. The Concept analysis table. Stage 1
Base or TableGroupColumn
Row
Algorithm orformula
Cell

207
#1668# Resource analysis
Project name: Kahlúte protective garmentScembua3.xls Complexity
AbilitySignificance
Resource attributes
Abi
lity
Dim
ensi
on
Resourcecomponents
Sig
nific
ance
Technologies,sciences oractivitiesinvolved
Diff
icul
ties
ref.
com
peto
tors
New
ness
inge
nera
lD
iffic
ultie
s X
New
ness
8 Mach. developm 2 y:r Owner 10 cutting, stabbing 10 10 10010 marketing ability 20 y:r Machine man 10 testing;
stabbing,comfort
4 2 8
10 product theory 1E04 y:r 8 marketing 1 1 18 Materials knowled. 0,2 y:r 6 fabric making,
diff. fiber matl.7 5 35
10 communicat. skills 0,5 y:r 6 compositemaking
5 2 10
8 difficulty analysis 1E04 y:r apparel making 2 2 4=M15*N15
9 Testing ability 1E04 Machinery8 Machinery 0,8
A B C D E F G H I J K L M N O PSignificance
Key attributes
Abi
lity
Sig
nific
ance
Resourcerequirements
Abi
lity
Sig
nific
ance
Rating of risks fromresources, single orcombined
Diff
icul
ties
ref.
com
peto
tors
New
ness
inge
nera
lD
iffic
ultie
s X
New
ness
Riskfactor =(diff Xnewn) /ability
10 marketingability
20 10 product theory 1E04 10 cutting, stabbing 10 10 100 1000000
10 product theory 1E04 8 materials knowled. 0,2 10 cutting, stabbing 10 10 100 50010 communicat.
Skills0,5 10 communicat. Skills 0,5 10 cutting, stabbing 10 10 100 200
10 Patent 0,2 9 testing ability 1E04 10 testing; stabbing, com 4 2 8 8000010 cash flow 10 product theory 1E04 10 testing; stabbing, comf 4 2 8 8000010 Financ:l
strength8 mach. Developm 2 8 fabric mkg, diff. fib mat 7 5 35 17,5
9 Testing ability 1E04 8 Machinery 0,8 8 fabric mkg, diff. fiber m 7 5 35 43,758 Mach.
Developm2 8 Machinery 0,8 6 composite making 5 2 10 12,5
8 materialsknowled.
0,2 8 Machinery 0,8 6 apparel making 2 2 4 5
8 difficultyanalysis
1E04 10 marketing ability 20 10 marketing 1 1 1 0,05
8 Machinery 0,8 10 communicat. Skills 0,5 10 marketing 1 1 #=M38*N38
#=O38/H38
Figure 1.2. The Resources analysis table. Stage 1
M #1670#
MATCHING OF CONCEPT AND RESOURCES

208
scekah03.xls
E L K
RISKS OF CONCEPT RISKS OF RESOURCES RESOURCESREQUIREMENTS
Rating oftechnology risks
Diff
icul
ty
New
ness
Ris
k fa
ctor
Technology
Sign
ifica
nce
Diff
icul
ty
New
ness
Diff
ic. X
New
nR
isk
fact
or
Sign
ifica
nce
Abi
lity
cutting resistknowledge
10 10 1000 cutting resistanceknowledge
10 10 10 100 1E+06
product theory 10 0
Testing ability 4 2 80 cutting resistanceknowledge
10 10 10 100 500 materials knowled. 8 0,2
Fabric making,diff. fiber matl.
7 5 280 cutting resistanceknowledge
10 10 10 100 200 communicat. skills 10 0,5
Fabric making,diff. fiber matl.
7 5 280 testing ability 10 4 2 8 80000 testing ability 9 0
apparel making 2 2 32 testing ability 10 4 2 8 80000 product theory 10 0
fabric making 8 7 5 35 17,5 mach. developm 8 2fabric making 8 7 5 35 43,75 Machinery 8 0,8composite making 6 5 2 10 12,5 Machinery 8 0,8apparel making 6 2 2 4 5 Machinery 8 0,8Marketing 10 1 1 1 0,05 marketing ability 10 20Marketing 10 1 1 1 2 communicat. skills 10 0,5
Figure (Scekah03.xls)
Figure 1.3. Table for matching concept and resources. Stage 1

207
EDC
P an
alys
is fo
rmC
ON
CEP
TFo
con0
34.x
ls#1
672#
Pro
ject
nam
e: AB
AE
CO
NC
EP
TC
ON
CE
PT
CO
NC
EP
TTE
CH
NO
LOG
YR
ISK
S O
F C
ON
CE
PT
PR
ES
EN
TATI
ON
AN
ALY
SIS
C
OM
PO
NE
NTS
PR
ES
EN
TATI
ON
Difficultiesref.Competitors
Newnessin general
Con
cept
attri
bute
s
SignificanceMarketbenefitTechnicalproblems
Con
cept
com
pone
nts
Technology
Technology
Technology
Technology
Technology
Technology
Rat
ing
of te
chno
logy
risk
s
Xxx
xxxx
xxxx
xxX
x X
x X
xX
xxxx
xxxx
xxx
x
Significance
Difficulty
Newnwss
Significance
Difficulty
Newnwss
Significance
Difficulty
Newnwss
Significance
Difficulty
Newnwss
Significance
Difficulty
Newnwss
Significance
Difficulty
Newnwss
..
..
..
..
..
..
..
..
..
CD
E
KE
Y A
TTR
IBU
TES
KE
Y C
OM
PO
NE
NTS
RIS
KS
OF
CO
NC
EP
T
Sig
nific
ance
C
once
pt c
ompo
nent
sR
atin
g of
tech
nolo
gy ri
sks
Diff
icul
ties
ref.
com
pet
oto
rs
New
ness
in g
ener
al
Figu
re 2
.1. C
once
pt a
naly
sis t
able
, Sta
ge 2
.G
reye
d te
xt in
dica
tes f
eatu
res f
rom
old
er b
ase,
shad
owin
g an
d bl
ack
text
indi
cate
impr
ovem
ent.
NEW
: Grid

208 ED
CP
anal
ysis
form
Pag
e 1
EDC
P an
alys
is fo
rmPa
ge 2
CO
NC
EPT
R E
S O
U R
C E
SC
onre
s34.
xl s#1
675#
Pro
ject
nam
e:P
roje
ctna
me:
CO
NC
EP
TC
ON
CE
PT
CO
NC
EP
TTE
CH
NO
LOG
YR
ISK
FAC
TOR
STE
CH
NO
LOG
YR
ES
OU
RC
ES
RE
SO
UR
CE
PR
ES
EN
TATI
ON
A
NA
LYS
IS
CO
MP
ON
EN
TSPR
ESEN
TATI
ON
OF
CO
NC
EP
TPR
ESEN
TATI
ON
PR
ES
EN
TATI
ON
CO
MP
ON
ENTS
Con
cept
attri
bute
s
Significance
Market benefit
Technicalproblems
Con
cept
com
pone
nts
Technology
Technology
Technology
Technology
Technology
Technology
0
0
Technology
0
0
Technology
0
0
Technology
0
0
Technology
00
Res
ourc
eat
tribu
tes
Sign
ifica
nce
Res
ourc
eco
mpo
nent
s
Ris
kfa
ctor
s of
reso
urce
s
Xxx
xxxx
xxx
xxxx
X xX
xxxx
xxxx
Significance
Difficulty
Newnwss
Significance
Difficulty
Newnwss
Significance
Difficulty
Newnwss
Significance
Difficulty
Newnwss
Significance
Difficulty
Newnwss
Significance
Ability
Experience
Significance
Ability
Experience
Significance
Ability
Experience
Significance
Ability
Experience
Significance
Abi
lity
Expe
rienc
exx
xxxx
xxxx
xx
xxxx
xxxx
x
11
10
11
11
11
01
11
01
11
11
10
11
10
11
11
11
01
11
01
11
11
10
11
10
11
11
11
01
11
01
11
11
10
Con
tinue
s on
next
pag
e!
Figu
re 3
.1. T
he c
ombi
ned
Con
cept
and
Res
ourc
e an
alys
is ta
bles
deve
lope
d in
Sta
ge 3
.

209
Con
tinua
tion
from
pre
viou
s pag
e!ED
CP
anal
ysis
form
Page
3C
ON
CEP
T ke
y fa
ctor
anal
ysis
R E
S O
U R
C E
S, k
ey fa
ctor
ana
lysi
s
Pro
ject
nam
e:C
ON
CE
PT
CO
NC
EP
TC
ON
CE
PT
TEC
HN
OLO
GY
RIS
KFA
CTO
RS
TEC
HN
OLO
GY
RE
SO
UR
CE
SR
ES
OU
RC
E
RE
SO
UR
CE
PR
ES
EN
TATI
ON
A
NA
LYS
ISC
OM
PO
NEN
TSP
RE
SE
NTA
TIO
NO
FK
EY
PR
ES
EN
TATI
ON
PR
ES
EN
TATI
ON
AN
AL
YS
ISC
OM
PO
NEN
TS
CO
NC
EP
TS
Key
con
cept
attri
bute
s
Significance
Market benefit
Technicalproblems
Key
conc
ept
com
pone
nts
Technology
Technology
Technology
Technology
Technology
Technology
0
0
Te chn
olo
gy
0
Key
reso
urce
attri
bute
s
Sig
nifi
canc
e
Key
reso
urce
com
pone
nts
Ris
kfa
ctor
s of
xxxx
xxxx
xxx
X xxx
X xX
xxxx
xxx
Significance
Difficulty
Newnwss
Significance
Difficulty
Newnwss
Significance
Difficulty
Newnwss
Significance
Difficulty
Newnwss
Significance
Difficulty
Newnwss
Significance
Difficulty
Newnwss
Sig
nifi
can
ce
Diff
icul
ty
New
nws
sxx
xxxx
xxxx
xx
xxxx
xxxx
xke
yre
sour
ces
00
00
00
00
NEW
: Con
cept
and
Res
ourc
e an
alys
is ta
bles
in o
ne sp
read
shee
t, in
one
Exc
elf
ile
Figu
re 3
.2. T
he c
ombi
ned
Con
cept
and
Res
ourc
e an
alys
is ta
bles
dev
elop
ed in
Sta
ge 3
, Key
fact
or a
naly
sis t
able
s.

210
conres42.xls CONCEPTProject name:CONCEPTPRESENTATION
CONCEPTANALYSIS
CONCEPTCOMPONENTS
RISK FACTORSOF PROJECT
Conceptattributes
Significance
Marketbenefit
Techn. problems Technology Technology Technology Technology technol. tested
Xxxxxxxxxxxxxxxxx
xx xx Xx
xxxxxxxx
Sign. Ability
Exper.
Sign.
Ability
Exper.
Sign.
Ability
Exper.
Sign.
Ability
Exper.
#of
Risk factors Weighed riskfactors
1 1 11 1 11 1 11 1 11 1 11 1 11 1 11 1 11 1 11 1 11 1 11 1 1
F Risk factors/ /weighedrf:s related totechnologies
#REF!
#REF!
Updated: 19.9.94; 23.11.94; 8.9.95; 27.9.95; 28.9.95;9.3.96 Ekon 6' a:\conres 42, der. fr. remxf_s1.xls 59.3.96 < conres40.xls, der. fr.tuubxls 3.11.95 <conres34.xls der. 27.9.95 by combining. ...\focon034.xls and ....\fores034.xls
Figure 4.1. Concept analysis table, Stage 4
EDCP analysis form Page 2R E S O U R C E S
Project name:H I J L
RESOURCESPRESENTATION
RESOURCEANALYSIS
RESOURC.COMPONENTS
TECHNOLOGY ORKNOWLEDGE AREAPRESENTATION
RISK FACTORSOF RESOURCES
Resourceattributes
Significance Technology
0 0 Technology
0 0 Technology
0 0 0 Technology
0 0 technol. Tested
Xxxxxxxxxxxxxxxxxxxxxxxx
Xx
Xxxxxxxxxxxxxxxxxxxxxxxx
Sign.
Ability
Exper.
Sign.
Ability
Exper.
Sign.
Ability
Exper.
Sign.
Ability
Exper.
#of
Risk factors Weighed riskfactors
1 1 1 1 11 1 1 1 11 1 1 1 11 1 1 1 11 1 1 1 11 1 1 1 11 1 1 1 11 1 1 1 11 1 1 1 11 1 1 1 11 1 1 1 11 1 1 1 11 1 1 1 11 1 1 1 1
# attr/comppairs
M Risk factors/ /weighed rf:s related totechnologies
#REF!
#REF!
Figure 4.2. Resource analysis table, Stage 4
conres42.xls CONCEPT #1678#
Project name:
NEW: riskandweightedrisk factorsfor knowl.areas
NEW: weightedrisk factors
NEW: numberof groups rated

211
CONCEPTATTRIBUTES
CONCEPTCOMPONENTS
TECHNOLOGY OR KNOWLEDGE AREAPRESENTATION
RISK FACTORSOF CONCEPT
Sig
nific
anc
eM
arke
tbe
nefit
Tech
n.P
robl
ems
Tech
nolo
gy Tech
nolo
gy Tech
nolo
gy Tech
nolo
gy Tech
nolo
gy
technol. Tested
Xxxxxxxxxxxxxxxxxxxxxxxx Xx Xx xx xxxxxxxx
Sig
n.A
bilit
y Exp
er. S
ign.
Abi
lity E
xpe
r. Sig
n.A
bilit
y Exp
er. S
ign.
Abi
lity E
xpe
r. Sig
n.A
bilit
y Exp
er. #
ofte
ch.Risk
factorsWeighedrisk factors
1 1 11 1 11 1 11 1 11 1 11 1 1
EDCP analysis formPage 2
The lower part of thistable is omitted!
R E S O U R C E SProject name:
H I J LRESOURCESPRESENTATION
RESOURCEANALYSIS
RESOURCE
COMPONENTS
TECHNOLOGY OR KNOWLEDGE AREAPRESENTATION
RISK FACTORSOF RESOURCES
Resource attributes SignificanceTe
chno
logy 0 0
Tech
nolo
gy 0 0
Tech
nolo
gy 0 0
Tech
nolo
gy 0 0 0Te
chno
logy 0 0 technol. Tested
Xxxxxxxxxxxxxxxxxxxxxxxx Xx xxxxxxxxxxxxxxxxxxxxxxxx
Sig
n.A
bilit
yE
xper
.
Sig
n.A
bilit
yE
xper
.
Sig
n.A
bilit
yE
xper
.
Sig
n.A
bilit
yE
xper
.
Sig
n.A
bilit
yE
xper
.
# of
tech
.rate
dRiskfactors
Weighedriskfactors
1 1 1 1 1 11 1 1 1 1 11 1 1 1 1 11 1 1 1 1 11 1 1 1 1 11 1 1 1 1 1
# attr/comppairs
This is an excerpt of a largertable!
M Risk factors/ /weighedrf:s related totechnologies
Figure 5.1. Concept and Resource analysis tables in Stage 5.
NEW
: Con
cept
and
Res
ourc
esan
alys
is ta
bles
bel
ow e
ach
othe
r
Ne

212
ED
CP
RA
POR
TT
ILO
MA
KE
Proj
ektin
nim
i: (f
ile ..
..\co
resu
51.x
ls)
Päiv
ämää
rä ja
aik
a:
KO
NSE
PTI
#179
7#R
ESU
RSS
ITO
SAA
MIS
AL
UE
ET
Kon
sept
iR
esur
ssit
Om
inai
suus
/osa
pa
riTe
stat
t.os
.al.
lkm
Ris
kin
te
kijä
t
Punn
itut
riski
ntek
Om
inai
suus
/osa
pa
ritTe
stat
t.os
.al.
lkm
Ris
kin
te
kijä
t
Punn
itut
riski
ntek
Tech
nolo
gyom
in/o
sapa
rilk
mR
iski
n
teki
jät
Punn
itut
riski
ntek
omin
/osa
pari
lkm
Ris
kin
teki
jät
Punn
itu tris
kint
ek
=BJ1
8 =B
K18
=B72
=BI7
2=B
J72
=BK
72=A
G51
=AG
101
Figu
re 5
.2. R
epor
t for
m, S
tage
5, d
ata
and
valu
es a
re tr
ansf
erre
d vi
a th
e tra
nsfe
r for
mul
as fr
om th
e an
alys
is ta
bles
to th
eir r
espe
ctiv
e pl
aces
in th
e re
port
tabl
e.
Tran
sfer
ring
form
ulas
NEW
: Rep
ort t
able

213
#1682# Sivu 1 11cordev1.xlsEDCP analyysilomake SUUNNITELMA
E A B C
RISKINTEKIJÄT ESITTELY ANALYYYSI
OSAT ESITTELYT
SUUNNITELMAN SUUNNITELMAN SUUNNITELMAN
KONSEPTIN TEKNOLOGIOIDEN taiOSAAMISALUEIDEN
F kpl omin./osaparie test._
Riskintekijät_
punnitut riskintekijät
16 1041
61 24 1386
55 3 45 11 5 372
62
tekniikka
atest.
Riskintekijät Painotetutriskintekijät Suunnitelman
(Konseptin)tuntomerkittai ominaisuudet
Mer
kits
evyy
s
Mae
kkin
aetu
Tekn
.ong
elm
ia
Osa
amis
alue
tai
tekn
olog
iahi
nom
ekan
iikka
Osa
amis
alue
tai
tekn
olog
iam
uoto
ilu
Osa
amis
alue
tai
tekn
olog
iaof
talm
olog
ia
Osa
amis
alue
tai
tekn
olog
iala
atuo
saam
inen
kpl xxxxxxxxxxxxxxxxxxxxxxxx
xx xx xx xxxxxxxxxxxxxxxxxxxxxxxx M
erki
tt
Vai
keu
s Uut
uus
Mer
kitt
Vai
keu
s Uut
uus
Mer
kitt
Vai
keu
s Uut
uus
Mer
kitt
Vai
keu
s Uut
uus
~Business 1 ~
4 7900 1975 helppokäyttöisyys 5 5 2 ~ design 5 4 2 5 4 22 2350 1175 helppokäyttöisyys 5 5 2 ~ kuljetettavuus 4 4 2 5 3 13 13000 4333 helppokäyttöisyys 5 5 2 ~ keveys 5 4 3 5 5 43 14000 4667 helppokäyttöisyys 5 5 2 ~ kiinnitettävyys 5 5 4 5 5 42 1408 704 osoitettava hyöty 4 4 4 ~ koekäyttäjät2 6080 3040 osoitettava hyöty 4 4 4 ~ ergonomit
. #1683# R E S U R S S I T
11 EDCP Spreadsheet development 3.1.97 6.1.97 16.26 s.82321411cordev1.xlsL H I J
RISKINTEKIJÄT ESITTELY ANALYYYSI OSAT ESITTELYTM kpl omin./osaparie test.
_Riskintekijät
_punnitut riskintekijät
0 28 13 0 25 29 1 20 6 0
tekniikka
atest.
Riskintekijät Painotetutriskintekijät Resurssien
tuntomerkittai ominaisuudet M
erki
tsev
yys O
saam
isal
ue ta
ihi
nom
ekan
iikka
0
Osa
amis
alue
tai
muo
toilu
0
Osa
amis
alue
tai
laat
uosa
am
inen
0
kpl xxxxxxxxxxxxxxxxxxxxxxxx
xx xxxxxxxxxxxxxxxxxxxxxxxx
Mer
kitt
Kyv
yt
Koke
m.
Mer
kitt
Kyv
yt
Koke
m.
Mer
kitt
Kyv
yt
Koke
m.
~ 1 1 1 1 1 1
Business 1 ~ 1 1 1 1 1 1
16 71 4 helppokäyttöisyys 5 ~ ME 3 3 3 4 3 3 5 4 4
10 32 3 helppokäyttöisyys 5 ~ designer 1 5 4 4 5 4 4 3 3 3
helppokäyttöisyys 5 ~ 1 1 1 1 1 1
helppokäyttöisyys 5 ~ 1 1 1 1 1 1
10 61 6 osoitettava hyöty 4 ~ ME 1 1 4 1 1 3 3 3
Figure 6.1. Concept and Resource analysis table, Stage 6.
New
: hea
ding
s in
Finn
ish
New: risk valuesand number ofattr.comp. pairsrated
New: formulas transferredfrom grid


215
krxx
0004
.xls
#168
7#PR
OJE
KT
INE
SIA
NA
LY
YSI
FN
otee
rattu
jen
osaa
mis
alue
iden
luku
mää
rätä
t
>PR
OJE
KT
INE
SIT
TE
LY
tekn
iikk
aate
st.
Ris
kint
ekij
ätP
aino
tetu
tris
kint
ekijä
tK
onse
ptin
PÄ
Ä
omin
aisu
udet
tai –
tunt
omer
kit
(om
inai
suus
, jol
la h
alua
mm
e pa
rant
aatu
otet
ta ta
i pal
velu
a as
iakk
aan
ja m
eidä
ned
uksi
)
Mer
kits
evy
ysK
onse
ptin
osa
tta
i kom
pone
ntit
(avu
t, jo
illa
omin
aisu
us a
ikaa
nsaa
daan
)
EI N
IME
TÄ ID
EO
INTI
AS
TEE
LLA
OLE
VIL
LEP
RO
JEK
TEIL
LE
Osa
am
isal
ue ta
ite
knol
ogia
Osa
am
isal
ue ta
ite
knol
ogia
Osa
am
isal
ue ta
ite
knol
ogia
Osa
am
isal
ue ta
ite
knol
ogia
Osa
am
isal
ue ta
ite
knol
ogia
K
OM
MR
NTI
T
>
kpl
ei täyt
etä
!ei tä
ytet
ä !
ei tä
ytet
ä !
ei tä
ytet
ä!Ç
Mer
kit
tÇ
Mer
kit
tÇ
Mer
kit
tÇ
Mer
kit
tÇ
Mer
kit
t
Proj
ektin
luon
nehd
inta
Ala
tekn
inen
kaup
allin
enra
hoitu
ksel
linen
Keh
itysa
ste
peru
sid
eoin
tipä
äide
at se
lvill
äko
mpo
nent
it ha
hmot
eltu
olem
assa
olev
an m
uunt
elu
EDC
Pan
lyys
in u
usin
ta
Org
anis
atoo
rine
n si
jain
tim
arkk
inoi
tava
tuot
e/pa
lvel
upa
lvel
u/tu
ote
sisä
isee
nkä
yttö
ön
Figu
re 7
.1. P
rea
naly
sis s
heet
, Sta
ge 7
.
NEW
: Pre
ana
lysi
s tab
le

215
#1690# krxx0004.xls KONSEPTIProjektin nimi: xxx (tiedosto krxx0004.XLS, johdettuecdpkoe3.xls:sta 3.5.97)
E A B C
SUUNNITELMAN
SUUNNITELMAN SUUNNITELMAN TEKNOLOGIOIDEN taiOSAAMISALUEIDEN
RISKINTEKIJÄT
ESITTELY ANALYYYSI ESITTELYT (seosaamisalue tai/eli tekniikka, jotatarvitaan kunkin ominaisuuden a
F1
F2
F3
kpl omin./osapar test.Riskintekijät
punnitut riskintekijät
tekniikkaatest.
Riskintekijät
Painotetutriskintekijät
Konseptinominaisuudet taituntomerkit(ominaisuus, jolla haluamme
parantaa tuotetta tai palveluaasiakkaan ja meidän eduksi) M
erki
tsev
yys
asia
kk:ll
eM
arkk
inae
tu
Tekn
.ong
elm
ia
Konseptin osattai komponentit (avut, joillaominaisuus aikaansaadaan)
Osaamisalue tai
teknologia
Osaamisalue tai
teknologia
Osaamisalue tai
teknologia
KOMMRNTIT > 0 0 0
kpleitäytetä !
eitäytetä !
ei täytetä ! ei täytetä !
KO
MM
ENTIT >
ÇM
erki
ttV
aike
us m
eille
Uut
uus
ylee
nsä
ÇM
erki
tt
Vai
keus
mei
lle
Uut
uus
ylee
nsä
ÇM
erki
tt
Vai
keus
mei
lle
Uut
uus
ylee
nsä
Osaamisalueiden vaikeus ja uutuus täytetään tälle riville >
More speed <
0 0 0 0 0 0
<
0 0 0 0 0 0
<
0 0 0 0 0 0
<
0 0 0 0 0 0
<
0 0 0 0 0 0
<
0 0 0 0 0 0
<
0 0 0 0 0 0
<
0 0 0 0 0 0
Figure 7.2. Concept analysis sheet with rows linked to preanalysissheet. Stage 7
New: rows linked to preanalysis table
R+ R
New: row addition anddeletion using buttons
?
Question for components
Wherewith/how do we carry more speed intoeffect ?
Guidance, Message box
Cursor was here when“?”button waspressed

216
CONCEPT ANALYSIS#1833#
Attributes orproperties (property by which weadd value to theconcept for our clientand for ourselves)
Significance
Componentsof theConcept(components bywhich the propertiesare realized)
COMMEN
TS
Analysis team’scompetence
Knowledge areas
durabilitycalculus
plasticsmatl.technol.
plasticsseamtechnol.
testingtechnol.
COMMENTS> plasticscours
Durability 5 Geometry 4 durability calculus 1 4 3 4 2
Durability 5 support platematerial
2 plastics matl. technol. 2 2
Durability 5 surface film 3 plastics seam technol. 3 4 3 3 4
Durability 5 seam method weldin 3 testing technol. 4
Replaceability 3 Geometry 5 machine design 5 5 2 2Replaceability 3 Seams 2 plastics processing 6
space effectiveness 4 Geometry 5 wood processing 7 4 3 4 4space effectiveness 4 surface film nylon 4 industrial design 8 5Functionality 5 Geometry 2 quality technol. 9 5 5 5 5Functionality 5 surface film 1 Networking 10 5Outlook 1 Geometry 1 patent law 11 2 2 3Outlook 1 Finish Knowledge area 12
Cost 4 material selection Knowledge area 13 3
ãMikael Epstein 1997, 1998This is an excerpt from a larger table!
Figure 8.1. The figure shows how the guidance system presents answers in messageboxes depending on where the analyser has placed the cursor. The arrows show howthe answers are built up using words that the analysers have entered into the analysistable. (Note that most spreadsheet programs can present only one answer box at eachtime). Part of base of Stage 8. This is an excerpt from a larger table!
? R+ R
Question for components
Wherewith/how do we carry replacabilityinto effect ?
OK
Question for components
How significant is plastics matl. technol. when space effectivenessis realized by means of surface film ?
OK
Cursor was here when“?”button waspressed
Cursor was here when“?”button waspressed

217
PRO
JEK
TIN
ESI
TT
EL
Y
light
007.
xls
#169
6#Pr
ojec
t Seq
uenc
esPr
ojek
tin v
aihe
istu
s
Proj
ektin
nim
iL
iitty
vien
pro
jekt
ien
kart
oitu
s
Proj
ektin
koo
di
Proj
ektin
luon
nehd
inta
Ala
Tekn
inen
Kau
palli
nen
Rah
oitu
ksel
linen
Keh
itysa
ste
peru
sid
eoin
tiPr
ojek
tin r
ajau
kset
pääi
deat
selv
illä
kom
pone
ntit
hahm
otel
tuol
emas
saol
evan
muu
ntel
uED
CP
anly
ysin
uus
inta
Org
anis
atoo
rine
n si
jain
tim
arkk
inoi
tava
tuot
e/pa
lvel
upa
lvel
u/tu
ote
sisä
isee
n kä
yttö
ön
Figu
re 9
.1. P
roje
ct p
rese
ntat
ion
tabl
e, S
tage
9.
NEW
: Pro
ject
map
ping
, lim
its, s
eque
nce

218
#1697#
KONSEPTINESIANALYYSI
Noteerattujenosaamisalueiden
lukumäärätät>
tekniikka
atest.
Tarvetekijät
Painotetuttarvetekijät
Konseptin PÄÄominaisuudet tai –tuntomerkit(ominaisuus, jolla haluamme parantaa
tuotetta tai palvelua asiakkaan jameidän eduksi)
Merkitsevyys Konseptin osat
tai komponentit(avut, joilla ominaisuusaikaansaadaan)
EI NIMETÄ IDEOINTIASTEELLA OLEVILLEPROJEKTEILLE
Osa
amis
alue
tai
tekn
olog
iaO
saam
isal
ue ta
ite
knol
ogia
Osa
amis
alue
tai
tekn
olog
iaO
saam
isal
ue ta
ite
knol
ogia
Osa
amis
alue
tai
tekn
olog
iaO
saam
isal
ue ta
ite
knol
ogia
Osa
amis
alue
tai
tekn
olog
iaO
saam
isal
ue ta
ite
knol
ogia
KOMMENTIT >
kpleitäytetä !
eitäytetä !
ei täytetä !
KO
MM
ENTIT
>
ÇM
erki
tt
ÇM
erki
tt
ÇM
erki
tt
ÇM
erki
tt
ÇM
erki
tt
ÇM
erki
tt
ÇM
erki
tt
ÇM
erki
tt
Jää
2
. . . . . . . . . . . . . . . . . .
Figure 9.2. Concept analysis sheet, Stage 9.
38 c:\wp\delivery\light007.xls 8.5.98light007.xls #1698# 38light7.xlsRESURSSIEN ESIANALYYSI Noteerattujen osaamisalueiden lukumäärätät
>tekniikkaatest
.
Puutetekijät
Painotetutpuutetekijät
PÄÄominaisuudet tai–tuntomerkit (kopioitutaulukolta yllä)(ominaisuus, jolla haluamme parantaa
tuotetta tai palvelua asiakkaan jameidän eduksi)
Merkitsevyys Resurssiein
osattaikomponentit(avut, joilla ominaisuusaikaansaadaan) O
saam
isal
ue ta
ite
knol
ogia
Osa
amis
alue
tai
tekn
olog
iaO
saam
isal
ue ta
ite
knol
ogia
Osa
amis
alue
tai
tekn
olog
iaO
saam
isal
ue ta
ite
knol
ogia
Osa
amis
alue
tai
tekn
olog
iaO
saam
isal
ue ta
ite
knol
ogia
Osa
amis
alue
tai
tekn
olog
ia
KOMMENTIT >
kpleitäytetä !
eitäytetä !
Saatavuus
ei täytetä ! KO
MM
ENTIT >
Kyvyt/Kokem
usV
arustus/Kunto
Kyvyt/Kokem
usV
arustus/Kunto
Kyvyt/Kokem
usV
arustus/Kunto
Kyvyt/Kokem
usV
arustus/Kunto
Kyvyt/Kokem
usV
arustus/Kunto
Kyvyt/Kokem
usV
arustus/Kunto
Kyvyt/Kokem
usV
arustus/Kunto
Kyvyt/Kokem
usV
arustus/Kunto
Jää
& & & & & & & & & &
&
Figure 9.3. Resource analysis sheet, Stage 9.
New: number of rating criteriareduced to one per knowledgearea

219
#1700# kpl omin./osaparie test.
Riskintekijät
punnitut riskintekijät
1 3 3,2
1 1 1 1
tekniikkaatest.
Putetekijät
Painotetutpuutetekijät
Resurssien tuntomerkittai ominaisuudet (ominaisuus, jolla haluammeparantaa tuotetta tai palvelua asiakkaan ja meidän deuksi)
Resurssienosattai komponentit(avut, joilla ominaisuusaikaansaadaan)
stabiliteettitekniikka
. . . .
KOMMRNTIT >PK,TVselvittääTKK:nuusintatutkimusta
TV,VTTKK:n mu
JS, SRhitsauskurssille,
kpl Analyysi1
Mer
kits
evyy
s
Saa
tavu
uus
Resurssin osattai komponentit (tekija, jollaominaisuus aikaansaadaan)
KO
MM
RN
TIT
ÇM
erki
tt
Kyv
yt/V
arus
tus
Kok
em./K
unto
ÇM
erki
ttK
yvyt
/Var
ustu
sK
okem
./Kun
to
ÇM
erki
ttK
yvyt
/Var
ustu
sK
okem
./Kun
toÇ
Mer
kitt
Kyv
yt/V
arus
tus
Kok
em./K
unto
ÇM
erki
ttK
yvyt
/Var
ustu
sK
okem
./Kun
to
<<
8 1,9 0,2 kestävyys<rakenne 5 4 FÖ, PJ, PK, JM, TV, VT, 3 2 3 3 4 2 2 4 4 3 3< 2
multi006.xlsRESURSSIENRISKINTEKIJÄT
RESURSSIENESITTELY
RESURSSIENANALYYYSI
RESURSSIOSAT
TEKNOLOGIOIDEN taiOSAAMISALUEIDEN
ESITTELYT
kpl omin./osaparie test.
Riskintekijät
punnitut riskintekijät
1 3 3,2
1 1 1 1
tekniikkaatest.
Putetekijät
Painotetutpuutetekijät
Resurssien tuntomerkittai ominaisuudet (ominaisuus, jolla haluammeparantaa tuotetta tai palvelua asiakkaan ja meidän deuksi)
Resurssienosattai komponentit(avut, joilla ominaisuusaikaansaadaan)
stabiliteettitekniikka
. . . .
KOMMRNTIT >PK,TVselvittääTKK:nuusintatutkimusta
TV,VTTKK:n mu
JS, SRhitsauskurssille,
kpl Analyysi2
Mer
kits
evyy
s
Saa
tavu
uus
Resurssin osattai komponentit (tekija, jollaominaisuus aikaansaadaan)
KO
MM
RN
TIT
ÇM
erki
tt
Kyv
yt/V
arus
tus
Kok
em./K
unto
ÇM
erki
ttK
yvyt
/Var
ustu
sK
okem
./Kun
to
ÇM
erki
ttK
yvyt
/Var
ustu
sK
okem
./Kun
toÇ
Mer
kitt
Kyv
yt/V
arus
tus
Kok
em./K
unto
ÇM
erki
ttK
yvyt
/Var
ustu
sK
okem
./Kun
to
1 0,3 0,3 ulkonäkö<rakenne 1 2 EK, TV 2 3 32 < 3 EK, TV, JM, Niras, Pappas, 4 3 2 31 < 2 EK 4 3 3
< 2
Figure 10.1. Resource analysis table, Stage 10
New: divided tables
R+ R
R+ R

220
Kopioi ResursseinKOKOOMATAULUKKOviivan alle Pastespecial/Values:lla
"Tentop" Analyysi 1 multi006.xls
££1ANALYYSI 1KOKOOMATAULUKKOResurssit
Konseptin ja resurssien riskianalyysi #1792#
Ominaisuus ~Osa
Painotetutriskitekijät
Kpl.
os.al.
Ominaisuus ~ Osa Painotetutriskitekijät
Kpl. os.al.testattu
kestävyys<pintalevymateriaali<FÖ
212930 8 kestävyys<pintalevymateriaali<FÖ 212930 8
kestävyys<rakenne<FÖ,PJ, PK, JM, TV, VT,Pappas, Niras, TKK, VTT
141696 8 kestävyys<rakenne<FÖ, PJ, PK, JM, TV, VT, Pappas,Niras, TKK, VTT
141696 8
kestävyys<liitäntämenetelmä<FÖ,JM, TV, WSD, Pappas,Niras, TKK,
75469 4 kestävyys<liitäntämenetelmä<FÖ, JM, TV, WSD,Pappas, Niras, TKK,
75469 4
toimivuus<rakenne<FÖ,JM, VT, PJ, PK, TV.,Niras, Pappas, TKK
44020 5 toimivuus<rakenne<FÖ, JM, VT, PJ, PK, TV., Niras,Pappas, TKK
44020 5
kestävyys<tukilevymateriaali<FÖ,JM, TV, EK, Pappas,Niras, TKK,
33633 8 kestävyys<tukilevymateriaali<FÖ, JM, TV, EK, Pappas,Niras, TKK,
33633 8
tilatehokkuus<rakenne<FÖ, JM, VT, PJ, JS, WSD, PS, KM, PK, EK, TV.
26760 7 tilatehokkuus<rakenne<FÖ, JM, VT, PJ, JS, WSD, PS,KM, PK, EK, TV.
26760 7
Figure 10.2. Example of sorting table, Stage 10
NEW: table for presenting mostimportant risk factors

221
#169
8#
KO
NSE
PTIN
ESI
AN
ALY
YSI
Not
eera
ttuje
nos
aam
isal
ueid
enlu
kum
äärä
tät
>
RE
SUR
SSIE
N E
SI
AN
AL
YY
SIte
kniik
ka ate
st.Ta
rve
teki
jätP
aino
tetu
tta
rve
teki
jätK
onse
ptin
PÄ
Ä
omin
aisu
udet
tai –
tunt
omer
kit
(om
inai
suus
, jol
la h
alua
mm
epa
rant
aa tu
otet
ta ta
i pal
velu
aas
iakk
aan
ja m
eidä
n ed
uksi
)
Mer
kits
evy
ysK
onse
ptin
osa
tta
i kom
pone
ntit
(avu
t, jo
illa
omin
aisu
usai
kaan
saad
aan)
EI N
IME
TÄ ID
EO
INTI
A
STE
ELL
A O
LEV
ILLE
PR
OJE
KTE
ILLE
Osaamisalue taiteknologia
Osaamisalue taiteknologia
Osaamisalue taiteknologia
Osaamisalue taiteknologia
Osaamisalue taiteknologia
Osaamisalue taiteknologia
Osaamisalue taiteknologia
Osaamisalue taiteknologia
Saatavuus
Res
urss
ien
osat
tai
kom
pone
ntit
(avu
t, jo
illa
omin
aisu
usai
kaan
saad
aan)
Osaamisalue taiteknologia
Osaamisalue taiteknologia
Osaamisalue taiteknologia
Osaamisalue taiteknologia
Osaamisalue taiteknologia
Osaamisalue taiteknologia
Osaamisalue taiteknologia
Osaamisalue taiteknologia
K
OM
MEN
TIT
>
kpl
ei täyt
etä
!
ei täyt
etä
!
ei tä
ytet
ä !
KOMMENTIT >
ÇMerkitt
ÇMerkitt
ÇMerkitt
ÇMerkitt
ÇMerkitt
ÇMerkitt
ÇMerkitt
ÇMerkitt
KOMMENTIT >
Kyvyt/KokemusVarustus/Kunto
Kyvyt/KokemusVarustus/Kunto
Kyvyt/KokemusVarustus/Kunto
Kyvyt/KokemusVarustus/Kunto
Kyvyt/KokemusVarustus/Kunto
Kyvyt/KokemusVarustus/Kunto
Kyvyt/KokemusVarustus/Kunto
Kyvyt/KokemusVarustus/Kunto
Jää
Jää
2Fi
ll!
2Fi
ll!4
Fill!
5Fi
ll
..
..
...
. .
..
..
..
..
..
Figu
re 1
1.1.
Con
cept
ana
lysi
s tab
le, a
nd to
the
right
an
exce
rpt o
f the
Res
ourc
es ta
ble,
Sta
ge 1
New
: num
ber o
f rat
ing
crite
riare
duce
d to
one
per
kno
wle
dge
New
: ind
icat
ion
for
ratin
g in
Res
ourc
esta
ble
at o
rres
pond
ing
cells
to ra
tings
inC
once
pt ta
ble

222
Appendix 4. Interview Form used in Pilot Firms after the End of the EDCPDevelopment Project
c:\wp\dr\dr2\market\interv1.docINTERVJUGUIDEDatum:Företagets namn
Intervjuad person
Företagets bakgrund· historia
· branch
· underleverantör eller huvudleverantör
· storlek
· personal
Aanalyserade projekt, storlek: mk/arb.tid; direkt utveckl. / följd· proj.1
· proj.2
· proj.3
· proj.4
· proj.5
Är företaget med som en del av TEKESprojektet eller som en separat betalande kund?
Varför kom företaget in i projektet?· företaget hade vissa speciella projekt som man ville analysera
· företaget kartlägger aktivt nya analyssätt & instrument
· projektet var ett enkelt & billigt sätt att få assistens i projekt

223
· företaget hade ett allmänt intresse för projektet och Fo & Uproblematiken
· nyfikenhet
Hur kom företagen in i projekten?· företagets interna beslutsprocess
· Tekes & VTT:s roll som imagebärare
Vilka förväntningar hade företagen på projektet?Hurdan uppfattning hade företagen om analysmetoden i början av projektet?· Hurdan Fo & Ubakgrund hade företaget
· Hade företaget använt sig av QFD eller FMEA
Hurdan uppfattning hade företagen om konsulterna i början?
DEN TEKNISKA KVALITETEN OCH PROCESSKVALITETENHurdan uppfattning hade företagen om helhetskvaliteten?
Den tekniska kvaliteten inmatningen av data
kvaliteten på ADBmjukvara som användes vid analyssessionerna
den tekniska kvaliteten på analysresultaten
1. EDCP som kartläggningsinstrument och tankeväckare
2. kvalitetet på parametrarna i analysen
224
3. är slutresultaten användbara
konsulternas sakkunskap och det mervärde detta bidrog med1. om EDCP och analysmetoder i allmänhet
2. allmänkunskap om industrier
3. industrispecifik kunskap
4. datorkunskap
Den funktionella kvaliteten· under diskussionerna innan projektet
· under diskussionerna under projektet
· under diskussionerna efter projektet
Konsulternas attityd och tjänstevillighet i allmänhet och speciellt under analyssessionerna
Fortlöpandet av analysen och problem i detta· kritiska händelser & återhämtningar
· den interna klimaten bland sessionsdeltagarna och dess inverkan på analysen ochanalysresultaten
tyckte ni att ni kunde bidra till att ge något till analysen och dessutom till utvecklingenav analysmetoden
· relationerna mellan konsulterna och sessionsdeltagarna
har konsulterna tid till era problem?
förstår konsulterna era problem?

225
· kände ni att ni fick någonting extra av dessa sessioner?
· pekade analysresultaten ut några konkreta risker i något av de analyserade projekten, vilkarisker?
· verkade analysen som ett hjälpmedel till planeringen av projektets fortsättning, hur?
· bidrog analysen till att utpeka nya saker, som skall tagas med i innovationsprojektet, vilka?
· bidrog analysen till att utpeka nya saker, som skall lämnas bort från innovationsprojektet,vilka?
· bidrog analysen till att öka säkerhetskänslan (“komfortkänslan”, comfort level) hosbeslutsfattarna?
Har ni fortlöpande kontakt med konsulterna? problemfrågor och lösning av dessa
utveckling av idéer / projekt
TEKES’ roll· profil
· som en byrokratisk maskinerirapporteringsbyrokratin & hur mycket detta tär på företgets resurser / föder frustration
Kunden som merproducent1. under analysprocessen
2. som idémakare / problemlösare
Kände Ni att Ni hade en roll i denna utvecklingsprocess?

226
Hur mycket av analysresultaten anade Ni redan innan analysen?
Vilka var positivaste sakerna med EDCPprocessen?
Vilka var de största bristerna med EDCPprocessen?
Kunde Ni tänka Er att använda Er av EDCPprocessen även i fortsätningen?
Hur mycket skulle Ni vara beredda att betala / göra andra uppoffringar?

227
Appendix 5. Description of EDCP to prospective Pilot FirmsOY SESAM CONSULTING AB
EDCP Early Detection of Complex ProblemsEDCP on ongelmien ratkaisumenetelmä, minkä avulla päättäjät projektin varhaisessavaiheessa pystyvät kartoittamaan T&K projektin heikot kohdat.
Tuotekehitysongelmat tulevat monasti “sivusta”.Innovaatio, tutkimus ja kehitysprojekteissa törmätään usein yllättäviin ongelmiin työnedetessä. Nämä arvaamattomat pulmat eivät useinkaan johdu projektin varsinaisesta aiheesta,mutta niiden ratkaiseminen osoittautuu monesti varsin vaikeaksi, työlääksi ja kalliiksi.Projektin kustannusten kannalta on edullisinta ratkaista pulmat mahdollisimman varhaisessavaiheessa.
Mihin EDCP soveltuu ?EDCP soveltuu parhaiten ideaasteella oleviin projekteihin. EDCPmenetelmää voidaansoveltaa sekä teknisiin että kaupallisiin ja hallinnollisiin hankkeisiin.
Mitä EDCPmenetelmässä analysoidaan ?EDCPmenetelmässä analysoidaan rinnakkain perusidea ja resurssit kuvaamalla näidenoleelliset ominaisuudet ja osat. Idean vahvistettavia ominaisuuksia verrataan ideantoteuttamiseksi käytettävissä olevien resurssien ja osien ominaisuuksiin. Resursseja ja osiaovat mm. työvoima, asiantuntijat, patentit, erilaiset järjestelmät ja laitteet sekä aika ja pääoma.
Mitä EDCP’llä saavutetaan ?Menetelmä parantaa projektin osanottajien keskinäistä vuorovaikutusta. Samalla se ohjaapäättäjiä löytämään ne osaalueet, joihin voimavaroja kannattaa keskittää. Menetelmä auttaapäättäjiä ratkaisemaan voidaanko projektia jatkaa, tarvitaanko projektin syvällisempääanalyysia, pitääkö projektin rakennetta muuttaa vai pitääkö projekti mahdollisesti lopettaa.
Miten analyysi tehdään käytännössä ?EDCPmenetelmässä projektiidean ja resurssien ominaisuudet ja osat pisteytetään projektinvaatimusten perusteella. Vertailemalla analyysien tuloksia voidaan päätellä kuinka hyvinresurssit soveltuvat projektin läpiviemiseksi.
Testattu menetelmä nyt käytössä.EDCP on nyt saatavana tietokonesovelluksen muodossa. Sesamin konsultit ovat valmiitsuorittamaan nopean EDCPanalyysin yhdessä asiakkaan kanssa. Analyysin perusteellakonsultit voivat opastaa jatkotoimenpiteistä. Luottamuksellinen työskentely ja projektiensalassapitäminen on meille elinehto.
Oy Sesam Consulting AbPL 127; 02401 KirkkonummiPuh & Fax 09 298 9001

228
Appendix 6. Exemplar cases of actual analyses papers (including notationsetc.)
Example of analysis form with markings of progress done by the researcher.
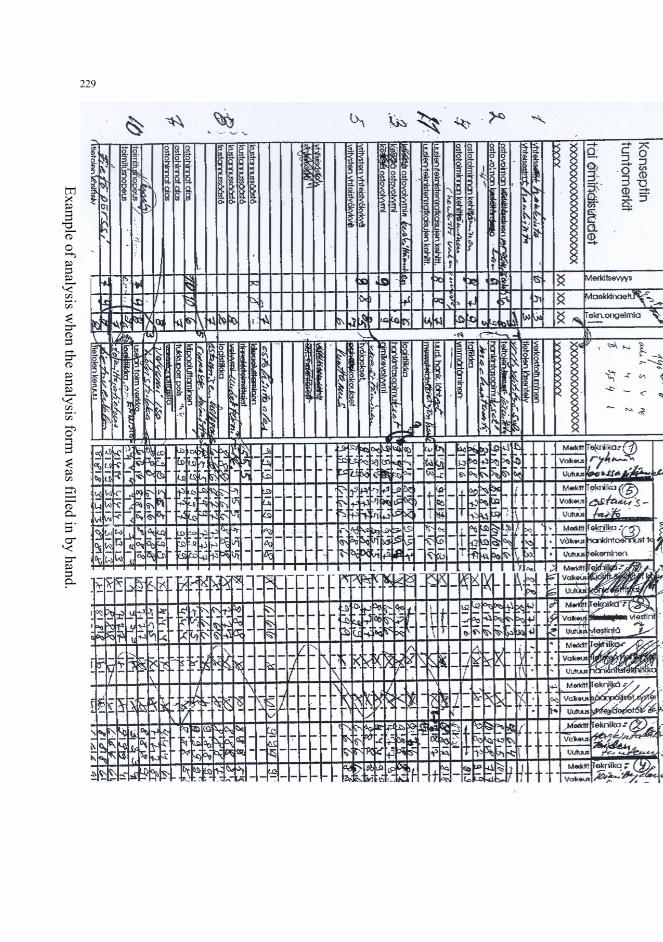
229
Example of analysis w
hen the analysis form w
as filled in by hand.

230
Appendix 7. Descriptions of the Analysis Cases from Firms B, C, E and I
Case descriptionCase: Firm B Date: 311098 Updated: 1.11.98; 23.3.99; 8.5.01; 18.5.010,5 15,251. Company description
Character, industry, structure, size, research background 1971 Teknos started to make black and white master batches for the plastics
industry. 1980 Premix Oy was founded. The development has since brought outsemi conducting master batches for plastics for electronics etc products.Turnover 60 mmk/year, personnel slightly under 50 persons.Research backgroundThe company does research and development continuously for their manufacturingprocess and product development for their customers.
3. Project definition The project referred to the renewal of the firm’s data processing system. It included
setting of objectives, tasks, allotment of resources, and assigning responsiblepersons. An action plan was to be set up. The plan included system planning,invitation of offers and treatment of offers. The realization of the project includedcoordination and supervision of the work as well as the documentation of thesystem. Finally the project regarded the continuous followup of the resourcebudget and total assessment of the project.
4. TeamPersons (description, character), changes
The original team included the administrative director (responsible for the project),two representatives for product development, one representative each forproduction quality, and sales.
7. Proceeding of analysis processCalendar: time elapsed between sessions, postponements, number of sessions
The project was analyzed in five sessions, analysis results and conclusions werepresented in a sixth session. Time elapsed ca. 2 weeks between 1st and 2nd analyses,35 days between the following.Analysis proceeding
Preparations and facilities The two first analyses were done in a meeting room using computer and a big
screen. The following analyses were performed in the office of the administrativedirector.The researcher acted as analysis moderator and computer operator in all sessions.During the first analysis the background of the project was thoroughly presentedand the plan for implementing of the project was explained by the administrativedirector. The principles of EDCP were also explained to all the members of theteam. In the following sessions the analysis proceeded in the logical succession ofEDCP.
Listings: (attributes, components, knowledge areas, resources, number of items,

231
time) The analysis started in the Concept analysis table. 17 attributes, 45 components and
12 knowledge areas were listed in the first session. Rating of attributes forSignificance, Market benefit and Technical problems were also done in the firstsession. Totally 61 attributecomponent pairs were formed. Rating in the grid wasstarted in five groups.
In the second session 3 attributes and 7 components were added, and rating wascontinued under the grid.
In the third session the rating under the grid of the Concept analysis table wasfinished, totally 182 knowledge area groups were rated. In the Resource analysistable 14 resourcecomponents were listed, 42 resource groups were formed. In thisanalysis the Note function of Excel was used for making comments to items duringthe analysis.
In the fourth session the rating in the Resource analysis table was finished, theresult tables for Concept, Resource and Knowledge area analyses were printed anddiscussed and graphs were printed.
Table 1.Listings and ratingsConcept analysis sheetListings # Sess # Ratings # Sess #Attributes 20 3 Signif / Attr 61 3Components, tot. 61 3 Market benefit 61 3Components, diff. 52 3 Technical problems 61 3Knowledge areas 12 1
#rows & knowl. areastotal matrix grid area 732
# cell groups rated 182 3% grid area rated 24,9
Resources analysissheet
#rows & knowl. areas
#Res. comp. groups,tot.
42 3 total grid area 504
#Res. comp. groups,diff.
14 3
# cell groups rated 116 4% grid area rated 23,0
Progress of the analysis work

232
The analysis sessions lasted from 3 to 4 h. Table 2 gives an overview of the proceeding,totally 12 h. were used to finish the analysis work. In the Concept analysis table thelistings of attributes, components and knowledge areas were finished during the firstsession, as were ratings for significance, market benefit and technical problems for theattributes, and five knowledge area groups in the grid. Rating under grid was continuedin the second and third sessions. Rating was finished during the third session. In theResource analysis table resources components were listed and all the knowledge areagroups in the grid were rated during the third session. In the fourth session the analysisresult tables for concept, resources, and knowledge areas were printed and discussed, aswere the correspondent graphs.
The stage 6 type base was used in all sessions.
Analysis progress11.2.97: Now worked 2 sessions: 1st 3h/6p.; 2nd 3h/4p. Experience: see improvementsuggestions.... "Rating is dull".13.2.97: Originally intended computer (386) did not function, analysis was transferred toRK's machine ("586"). Visibility poor at the beginning. .After enlarging the font. Afterenlarging the font visibility increased so much that reading from paper printout becameunnecesseary for Knowledge area text.Printing of Excel notes was done.3.3.97: Resources: Concreteness and assigning. How do with the resources that will beavailable in the future and with their rating in field under K ? NO AUTOMATIC transferof attributecomp.pairs from Cons. to Res.was used at this stage.
Table 2.Listing & rating progressSession # 1 2 3 4 5 6Stage, base 6 6 6 6Time per sess., h 3 3 4 2Cumulat. time , h 3 6 10 12Listingsattribcomp pairs 61components,diff. 52Ratingssign. etc. for attrib. 61cons.knowl.areamatrix
5 81 176 182
resknowl.areamatrix
116
Monitoring of the analysis work The analysis work was monitored for the team by making printouts of the Excel sheet at
the end of each session and, in the first session at the end of significant analysis stages.Totally four printouts of the Excel sheets were made. The analysis work during thesessions was monitored for research purpose by the researcher besides of his promoting

233
of the analysis process itself. The monitoring consisted of notations on a pad and on theExcel sheet printouts.
Interpretation of analysis results The team interpreted analysis continuously during the progress of the work. After the
fourth session an interpretation of the analysis results was performed with the team.
Preparation of analysis report The Analysis report was prepared by copying the listings and the calculated analysis
results from the Excel sheets to their appropriate sites in the form and then typingcomments and conclusions in their appropriate places.
8. Result of analysis process in this caseResults for the benefit of the EDCP analysis process
One team member rejected navigating in the spreadsheet, and the outlook of the windowitself. Suggested to split the window into three partitions.
Found faults
Feedback from firm, solutions in interactive cooperative workSuggestions for improvement, Development11.2.97: It would be more descriptive to display the table on the wall or on paper Rowsize and font size must be adjustable. Names: Tekn. ongelma > Implement. ongelma,Suunnitelma > Konsepti, Osa > Komponentti. Make all headings visible at once. Avoidrepetitions of matters Rating is dull work.Conc. sheet.\7\: Attrib & Comp.columns questions with small font, texts must be visibleon prints.13.2.97: Experiments done with different font sizes and text directions in the Knowl.area headings.7.3.97: Suggestions for improvementsMake a report generator that transfers the appropriate results automatically to the reportform. Use separate worksheets (ATKMIX was done on the old onesheet bottomoriginally made on and for Excel 3).When data is fed one often gets trivial answers. It is difficult to keep three things (eg.,attribute, component, knowledge area) in mind, then trivial answers are given. Difficultto name the knowledge areas for totally new concepts.
Excel database in the background
feeding fields
234
Input from this analysis, new features added to analysis base New, more explanatory heading names.
Results for the benefit to the firm
Case descriptionCase: Firm C Date: 311098 Updated: 1.11.98; 23.3.99; 8.5.01; 18.5.010,5 15,251. Company description
Character, industry, structure, size, research background The firm was a subsidiary (Inc.) of a large corporation that is more than 100 years old.
It is mainly active in different industrial sectors than the subsidiary although there aresome divisions that use similar technology. The subsidiary may purchase certaincomponents and service functions from other sectors. Since 1993 the subsidiarydevelops, produces and sells large machinery units for environement processes and isa forerunner in technical development and holds a number of patents. The technologyis based on an idea created in 1988 by an independent inventor, the rights were boughtby the firm in 1992. It is a major player internationally in its industry. It operates quiteindependently from the mother corporation.Turnover of firm was ca. 40 mmk/year, manpower was 25 persons of which 14academics, 5 professionals and 6 workers.
Research backgroundThe company had done research (continually), now they were in a stage where theresearch work was the main purpose. They had not used other formal methods e. g.,QFD or FMEA.
3. Project definition The first project was selected together with the R&D director and the technical
director. The object for EDCP analysis was a key technical component of one of thenew machine models that was to be commercialized soon. The machine utilizes anumber of physical processes and new material applications that have never beenused before. The concept of the innovation can be classified as radical with regard toboth processes and to materials.
The object of the first analysis involved an improved version of an existingcomponent theat was to be installed in a prototype of a commercially used machine.Particularly material selection and design configuration of elements of the machinewere involved in the project. Chemical resistence and plastics processing were the

235
main areas of interest.
Project size was 4,3 mmk, the EDCPanalysis costs to the firm were calculated to67.526:
4. TeamPersons (description, character), changes
The initial team consisted of the R&D director, the technical director and two researchengineers. In later sessions one of the research engineers or the technical director wereabsent.
7. Proceeding of analysis processCalendar: time elapsed between sessions, postponements, number of sessions
This project was analysed in five sessions, two additional sessions were held for thepresentation of the results. Time elapses between sessions were 2, 2 and 1,5 weeks,total time from analysis start to finish was 5,5 weeks. There were no postponements ofscheduled sessions.
Analysis proceeding Preparations and facilities During all analyses the analysis team convened around the conference table in the
office of the R&D director. The HP Omnibook 5000 CTS laptop computer connectedto a larger screen acted as analysis tool. Printing of Excel tables for monitoringpurposes during the sessions was done on a printer of the firm.The researcher acted as analysis moderator and computer operator. During the firstsession the background and function of the EDCP system was explained to the team inca. ½ h. The R&D director explained the reason for choosing the particular project foranalysis. After this the analysis work was started.
Listings: (attributes, components, knowledge areas, resources, number of items, time The analysis work was started on the Concept analysis sheet. All 16 attributes were
listed during the first session.During the second session the listing of the 26 different components as well as that of18 knowledge areas were completed. Totally 45 attributecomponent pairs wereformed. Rating of all attributecomponent pairs for Significance, Market benefit andTechnical problems was completed during session 2.
The stage 6 type base was used during sessions 1 and 2.
The rating of Significance, Difficulty and Newness of all attributecomponent pairswith respect to the knowledge areas was finished during session 4. As seen in Table 128% of all the matrix grid area was rated.On the Resources analysis sheet 32 different resources component groups were listedduring session 4. The rating was completed during the fifth session. As seen fromTable 1, 24,4% of all the matrix grid area was rated on the Resources sheet.
The stage 7 type base was used during sessions 37.

236
Table 1.Listings and ratingsConcept analysis sheetListings # Sess # Ratings # Sess #Attributes 16 1 Signif / Attr 45 2Components, tot. 45 2 Market benefit 45 2Components, diff. 26 2 Technical problems 45 2Knowledge areas 18 2 Knowl. area groups 193 4
#rows & knowl. areas 45total matrix grid area 810
# cell groups rated 193 4% grid area rated 23,8
Resources analysissheet
#rows & knowl. areas 45
#Res. comp. groups,tot.
45 4 total grid area 810
#Res. comp. groups,diff.
32 4
# cell groups rated 198 5% grid area rated 24,4
Progress of the analysis work The analysis sessions lasted from 3 to 6 h., sessions longer than 3 h. were
interrupted for lunch. Table 2 gives an overview of the proceeding, totally 22,5 h.were used to finish the analysis work. The listings of attributes, components,knowledge areas and resources components were finished during the third session.Ratings for significance, market benefit and technical problems for the attributeswas finished during the third session, ratings for significance, difficulty and newnessof the knowledge areas for the attributecomponent pairs was finished during thefourth session. Rating of the ability/equipment and competence/condition of theresource components for the knowledge areas was finished during the fifth session.

237
Table 2.Listing & rating progressSession # 1 2 3 3 4 5Stage, base 6 6 7 7 7 7Time per sess., h 6 3 1 3 5 4,5Cumulat. time , h 6 9 10 13 18 22,5Listingsattribcomp pairs 39 45 45 45 45 45components,diff. 21 26 26 26 26 26Ratingssign. etc. for attrib. 45 45 45 45cons.knowl.areamatrix
27 75 193 193
resknowl.areamatrix
193
Monitoring of the analysis workThe analysis work was monitored for the team by making printouts of the Excelsheet at the end of each session and sometimes at the end of significant analysisstages e. g., after the listings were finished. Totally six printouts of the Excel sheetswere made. The analysis work during the sessions was monitored for researchpurpose by the researcher besides of his promoting of the analysis process itself.The monitoring consisted of notations on a pad and on the Excel sheet printouts.
Interpretation of analysis resultsA preliminary interpretation of the analysis results was made with the R&Ddirector and the technical director using the printouts of the Excel tables anddiagrams.A task list for further action was prepared. A table of the algorithms was wanted,three groups of faults in diagrams needed correction. Further more a table of "Topten" items was required and use was made of new names for the risk factors fordifferent categories (see later under the heading "input from this analysis").The corrections and improvements were included in a renewed version of theanalysis table.After this the researcher prepared an Analysis report using the form anarap.doc.
Preparation of analysis reportThe Analysis report was prepared by copying the listings and the calculatedanalysis results from the Excel sheets to their appropriate sites in the form and thentyping comments and conclusions in their appropriate places.
8. Result of analysis process in this caseResults for the benefit of the EDCP analysis processThe proceeding of the analysis is shown in Table 3 that shows dates, time used persession, participants, activities and results as well as observations and suggestions.

238
Technical quality and process qualityfeeding of data: facilitator did all feeding
Quality of softwareProblems in the beginning but it worked anyway, there was constant improvement.
Quality of parametersParameters were logical and necessary.
Found faultsFont too small for easy reading. Some of the headings difficult to understand.Wrong parameter order in charts. Wrong pair listings (reference displacement) inResources sheet and missing formulas after addition of knowledge area columns.Feedback from firm, solutions in interactive cooperative workMake program "lighter" looking, remove (empty) lines make font larger.Copying the significance ratings from the Concept sheet to the Resources sheetfacilitated the analysis work.New, more explanatory names were created for the risk factors for differentcategories: risks from concept > requirement of concept risks from resources > shortages of resources risks from knowledge areas > weakness in knowledge areas
Input from this analysis, new features added to analysis baseNew, more explanatory names for the risk factors, "Top ten" table for the tenbiggest risk factors in selected categories, need for clearer view of the Excel tableon the screen. Division of large diagrams to facilitate display and printing.
Results for the benefit to the firmAccording to the R&D director the project benefited from the EDCP analysisbecause it provided a documented list of things to be taken care of. The ratingprovided guidance to the importance of the different items relative to each other.Gave thought provokers. The analysis process itself was equally important as the(end) results.The cost to the firm for the EDCP analysis in the form of salaries assigned to theanalysis work was approximately 1,6% of total project costs.

239
Case descriptionCase: Firm I Date: 311098 Updated: 1.11.98; 23.3.99; 8.5.010,5 16,01. Company description
Character, industry, structure, size, research background The firm is 46 years old, now owned by foreign concern. Products include plastics, lighting
fixtures for vehicles and like, personal reflectors. The firm is both a subcontractor assystems supplier to automotive industry and a main supplier of own products. The firmemploys 270 persons, and has a turnover of 160 mmk per year.
3. Project definition The project involved a product group, the development costs were 3mmk (including
molds), and it lead to product turnover of ca. 3 mmk/year.
4. TeamPersons (description, character), changes
The team consisted of the technical manager (tm), a research engineer (re) and a designer(d). The team stayed consistent through the whole analysis.
7. Proceeding of analysis processCalendar: time elapsed between sessions, postponements, number of sessions
Two weeks elapsed between the two analyses.
Analysis proceeding Preparations and facilities The analysis was made in (re)’s office using his machine. The project was selected at the
start of the first session, and shortly described. Listings: (attributes, components, knowledge areas, resources, number of items, time In the first session 17 groups of attributes were listed, after that five different attributes
were listed under the group headings and then 14 knowledge areas in the knowledge arearow above the grid. Significance, Market benefit and Technical problems were rated for 9attributes. 55 rows of components were listed and five rows of knowledge area groups wererated as an example. After the first session the team continued on their own and finished thelisting of attributes and components. Furthermore the team rated the Significance, Marketbenefit and Technical problems for the remainder of the attributes so that the Conceptanalysis table consisted of 151 rows. Some of the attributes were changed. The analyzerswere unable to print diagrams on their own.
During the second session resources were listed in the Resource analysis table without anyguidance. Then the results and diagrams were printed. No Analysis Report was prepared.
For the first and second sessions the stage 6 type base was used, for the third session thedata was transferred to the stage 7 type base for demonstration purpose.
The listings and ratings in the Concept and Resource Analysis tables are presented in Table1.

240
Table 1. Listings and ratingsConcept analysis sheetListings # Sess # Ratings # Sess
#Attributes 45 1 Signif / Attr 45 2Components, tot. 151 2 Market benefit 45 2Components, diff. 59 2 Technical problems 45 2Knowledge areas 14 1 Knowl. area groups 428 2
#rows & knowl.areas
151&14 2
total matrix grid area 2114 2# cell groups rated 420 2% grid area rated 19,9 2
Resources analysissheet
#rows & knowl.areas
90&14 2
#Res. comp. groups, tot. 90 2 total grid area 1260 2#Res. comp. groups,diff.
5 2 # cell groups rated 389 2
% grid area rated 30,9 2
Progress of the analysis work The analysis work progressed in two sessions, the first lasting 3, and the second 7 hours.
Between the sessions the team worked several hours completing the analysis.
Table 2.Listing & rating progressSession # 1 2 3 4 5 6 7Stage, base 6 6 7Time per sess., h 3 7Cumulat. time , h 3 10Listingsattribcomp pairs 55components,diff. 35resources, diff 5Knowledge areas 14Ratingssign. etc. for attrib. 9cons.knowl.areamatrix
18 420
Resknowl.areamatrix
389

241
Monitoring of the analysis work The analysis team monitored the analysis work on their own.
The firm additionally had an ad hoc analysis of the project performed by a group of personsfamiliar with the project but totally unaware of EDCP.
Interpretation of analysis results The interpretation of the analysis results was done by the analysis team.
Preparation of analysis report No Analysis Report was prepared for this analysis.
8. Result of analysis process in this caseResults for the benefit of the EDCP analysis process
This analysis gave incentive to develop multisheet structure.
Found faults It was difficult to get people enthusiastic, difficult to commit people when plenty of (other)
work.It was also difficult to define the project, the attributes and components. The spreadsheetgrew too big e.g., compared to QFD.
The analyzers were unable to produce the staple diagrams themselves.
Feedback from firm, solutions in interactive cooperative workOf the found risks most were guessed on beforehand, the analyzed projects had no newnessvalue. EDCP works well particularly for projects with more newness value than thosepresented for analysis by the firm.
The knowledge areas ought to be defined on beforehand based on the knowledge of the firm,and supplemented later. The knowledge areas in the Resource analysis table ought to be ratedbefore the resource components aare selected. The ability and experience of the resourcecomponents can be rated later when the resources are selected. Better grouping was alsodeemed necessary for the attributecomponent pairs. Data sorting was deemed necessary inthe result tables for the risk factors.
A better manual was needed for selection and generation of attributes and components aswell as for the rating. Furthermore a description of the algorithms are needed in the manual.
The resource analysis was deemed to be more difficult than the concept analysis inindependent work because no previous structuring had been done to the project prior to theanalysis. The Excel spreadsheet proved to be difficult to handle because of “navigatingproblems”. Suggestions were made to abandon Excel in favor of own program ware.

242
The adhocanalysis produced quite different results as risk factors than EDCP, and it was notnearly as detailed. In the comparison below the adhoc column shows all listed items, but theEDCP column shows only the most important items.
Adhoc analysis EDCPanalysis Attributes
version control heat problems mechanical design/small size Unicolor problems
Resources perdesign/teamwork in predesign stage
Attributecomponent pairs acceptability ~ color reflector ~ affixing acceptability ~ photometry
Resources mechanics designer
Input from this analysis, new features added to analysis base Need for multisheet structure in Excel as well as need for manual and guidance during
analysis.
Results for the benefit to the firmThrough EDCP several persons can be connected to think about the risks, EDCP shows them,the riks will be commonly considered, and they will not be only the “order of the boss”.EDCP can increase the comfort level of the decision makers to a certain extent, when onegets something to show and everything is not only talk. The EDCP analysis results helped,they aided conscious directing of resource and time allocation., and they were good asreminder of items to observe and consider.

243
Appendix 8. List of the Formulas
Concept
concept wants attribute|component|pair = [(significanceattibuter ´market benefitattribute ´ techn.problems) ] ´ å[(significance´difficulty´ newness)rated knowl.area
weighted concept wants =
Resources
resources lack attribute|component|pair =
weighted resource lack =
Knowledge areas
for concept analysis: dependency knowl.area = å(significance ´difficulty´newness)rated knowl.are
for resources analysis: deficiency knowl.area =
for concept analysis: weighted dependency knowl.area =
for resources analysis: weighted deficiency knowl.area =
Risk knowl.area = weighted dependency knowl.area ´ weighted deficiency knowl.area
Risks from attributecomponent pairs to project
Risk project = wants concept ´ lack resources
weighted risk project =
C:\wp\Dr\Avh\Appendix\Aa0_App2.doc, der 25.3.02 fr. Dr1 a:\ & c:\wp\sesam\algor01.doc 27.12.97
concept wants .number of rated knowledge areas
significanceattribute|component|pair ´åsignificance knowl.area .(ability|equipmentresuorce compon. ´experience|condition resuorce compon.)rated
resources lack .number of rated knowledge areas
åsignificance knowl.area .(ability|equipmentresuorce compon. ´experience|condition resuorce compon.)rated
dependency knowl.area .number of rated attribute|component|pairsconcept analysis
deficiency knowl.area .number of rated attribute|component|pairsconcept analysis
risk project .ånumber of rated knowledge areas

244
App
endi
x 9.
Lis
t of a
ll Q
uest
ions
, Sug
gest
ions
and
Exp
lana
tions
in th
e G
uida
nce
Syst
emc:
\wp\
dr\A
vh\W
book
\Gui
de01
.doc
Que
stio
n fo
r Attr
ibut
e: F
ind
one
mor
e pr
oper
ty th
at m
akes
the
prod
uct,
the
serv
ice
or th
e ac
tivity
bet
ter f
ot th
e cl
ient
and
for o
urse
lves
, i.e
., gi
ves
AD
DED
VA
LUE
!
Que
stio
n fo
r com
pone
nts:
Whe
rew
ith /
how
do
we
carr
yth
is A
ttri
bute
*) in
to e
ffec
t ?
Que
stio
n to
the
sign
ifica
nce
for t
he c
lient
, for
our
selv
es: H
ow im
porta
nt is
this
Att
ribu
te f
or th
e cl
ient
and
for o
urse
lves
? 5
mos
t, 1
leas
t
Que
stio
n to
Kno
wle
dge
area
: Whi
ch a
dditi
onal
Kno
wle
dge
area
can
con
tribu
te w
ith k
now
ledg
e to
real
ize
the
Attr
ibut
es b
y m
eans
of t
heC
ompo
nent
s lis
ted
here
? Pl
ease
not
e th
at th
e A
ttrib
utes
giv
e A
DD
ED V
ALU
E to
the
conc
ept !
Que
stio
n fo
r jud
ging
the
abili
ty o
f the
ana
lyzi
ng te
am: H
ow g
ood
are
You
, who
now
are
doi
ng th
is E
DC
Pan
alys
is a
tthi
s Res
ourc
e ?
Que
stio
n to
the
sign
ifica
nce
of th
e K
now
ledg
e ar
ea fo
r the
Con
cept
: How
sing
ifica
ntis
this
Kno
wle
dge
area
whe
nth
is A
ttri
bute
is re
aliz
ed b
ym
eans
oft
his C
ompo
nent
?
Que
stio
n fö
r Res
ourc
es: W
hat r
esou
rces
shal
l cre
ate
this
Att
ribu
te b
y m
eans
of
this
Com
pone
nt?
Que
stio
n fö
r Res
ourc
e av
aila
bilit
y: H
ow w
ell a
vaila
ble
are
the
Res
ourc
esth
is R
esou
rce
to re
aliz
eth
is A
ttri
bute
by m
eans
of
this
Com
pone
nt?
Que
stio
n to
Res
urse
qua
lity/
com
pete
nce
in K
now
ledg
e ar
ea: H
ow g
ood
are/
isth
is R
esou
rce
atth
is K
now
ledg
e ar
ea to
real
ize
this
Att
ribu
teby
mea
ns o
fth
is C
ompo
nent
?
Com
men
ts to
Attr
ibut
eC
ompo
nent
pai
r: C
omm
ents
toth
is A
ttri
bute
and
this
Com
pone
nt
Que
stio
n to
the
com
men
ts fo
r kno
wl.
area
s: C
omm
ents
to th
e ko
nwle
dge
area
this
Kno
wle
dge
area
in c
onne
ctio
n to
the
reso
urce
s!
Com
men
ts to
Res
ourc
es: C
omm
ents
to R
esou
rces
this
Res
ourc
ein
con
nect
ion
toth
is A
ttri
bute
and
this
Com
pone
nt
*) n
otat
ions
in b
old
styl
e re
pres
ent w
ords
that
the
guid
ance
syst
em p
icks
from
the
actu
al c
olum
n in
that
row
whe
re th
e cu
rsor
is lo
cate
d e.
g.,
this
Att
ribu
te w
ill re
pres
ent t
he n
ame
of th
e at
tribu
te in
the
Attr
ibut
eco
lum
n in
that
row
whe
re th
e cu
rsor
is

245
Tabl
e (G
uide
)
Ex1
Expl
anat
ion
to fo
rmul
a fo
r Req
uire
men
t fac
tor:
Req
uire
men
t fac
tor r
epre
sent
s the
requ
irem
ents
that
the
it ta
kes t
o re
aliz
e th
e at
tribu
te w
ith th
eco
mpo
nent
on
this
row
. The
form
ula
is: r
equi
rem
ent f
acto
r = si
gnfic
ance
of a
ttrib
ute
to p
roje
ct *
sum
(sig
nific
ance
s of k
now
ledg
e ar
eas)
Ex2
Expl
anat
ion
to fo
rmul
a fo
r Sho
rtage
fact
or: S
horta
ge fa
ctor
repr
esen
ts sh
orta
ge o
f res
ourc
es w
hen
real
izin
g at
tribu
te w
ith c
ompo
nent
on
this
row
.Th
e fo
rmul
a is
: sho
rtage
fact
or=
(sig
nific
ance
to p
roje
ct/a
vaila
bilit
y of
reso
urce
)*(#
"1:
s" in
row
*12
+ #
"2:s
" *3
,7 +
# "
3:s"
* 1
,7 +
# "
4:s"
* 0
,5 +
# "5
:s"
*0,1
Ex3
Expl
anat
ion
to fo
rmul
a fo
r Wei
ghte
d R
equi
rem
ent f
acto
r: W
eigh
ted
Req
uire
men
t fac
tor=
requ
irem
ent f
acto
r/ #
rarte
d kn
owle
dge
area
s in
row
.A
lway
s eva
luat
e W
eigh
ted
Req
uire
men
t fac
tor t
oget
her w
ith R
equi
rem
ent f
acto
r, be
caus
e th
e nu
mbe
r of k
now
l. ar
eas m
ay in
fuen
ce th
e ris
k!
Ex4
Expl
anat
ion
to fo
rmul
a fo
r Wei
ghte
d Sh
orta
ge fa
ctor
: Wei
ghte
d Sh
orta
ge fa
ctor
= re
quire
men
t fac
tor/
# ra
rted
know
ledg
e ar
eas i
n ro
w. A
lway
sev
alua
te W
eigh
ted
Shor
tage
fact
or to
geth
er w
ith S
horta
ge fa
ctor
, bec
ause
the
num
ber o
f kno
wl.
area
s may
infu
ence
the
risk!
Ex5
Expl
anat
ion
to th
e fo
rmul
a fo
r Pro
ject
's ris
ks: P
roje
ct's
risk
fact
or =
requ
irem
ent f
acto
r * sh
orta
ge fa
ctor
in ro
w. A
lway
s eva
luat
e W
eigh
ted
Ris
kfa
ctor
toge
ther
with
risk
fact
or, b
ecau
se th
e nu
mbe
r of k
now
l. ar
eas m
ay in
fuen
ce th
e ris
k!
Ex6
Expl
anat
ion
to fo
rmul
a fo
r Wei
ghte
d Pr
ojec
t's ri
sks:
Wei
ghte
d R
isk
fact
or=
risk
fact
or/ #
rarte
d kn
owle
dge
area
s in
row
. A
lway
s eva
luat
eW
eigh
ted
Ris
k fa
ctor
toge
ther
with
Ris
k fa
ctor
, bec
ause
the
num
ber o
f kno
wl.
area
s may
infu
ence
the
risk!
Ex7
Expl
anat
ion
to fo
rmul
a fo
r the
Num
ber o
f Kno
wle
dge
area
s rat
ed: T
he fo
rmul
a co
unts
the
num
ber o
f rat
ed K
now
ledg
e ar
eas i
n th
is ro
w, t
he n
on
rate
d ce
lls re
mai
n un
coun
ted.
c:\w
p\dr
\Avh
\Que
s01.
doc

246
Ans
wer
to A
ttrib
ute
text
abb
revi
atio
nA
bbre
viat
e to
max
.4
sign
s for
dia
gram
text
!
Ans
wer
to C
ompo
nent
text
abb
revi
atio
nA
bbre
viat
e to
max
.6
sign
s for
dia
gram
text
!
Ans
wer
to R
esou
rce
text
abb
revi
atio
nA
bbre
viat
e to
max
.10
si
gns f
or d
iagr
am te
xt !
Vc1
Que
stio
n: c
omm
ents
to re
sour
ces:
Com
men
ts to
and
Que
stio
n fo
r com
men
ts to
reso
urce
s com
men
tsC
omm
ents
to th
e kn
owle
dge
area
in
con
nect
ion
to th
e co
ncep
t!

247
App
endi
x 10
C
olle
ctio
n of
Gra
phs f
rom
Ana
lysis
Rep
ort
Dia
gram
1.
Requ
irem
ent f
acto
rs o
f Con
cept
510152025
Weighted requirement factors
20406080100
120
140
160
180
200
Requirement factors
wei
ghte
d re
quir
emen
t fac
t.re
quir
emen
t fac
tor
Dia
gram
2.
Lack
fact
ors
of R
esou
rces
5101520253035
dura
& geom
et~de
sign ,
Var,
Kot 11
dura
& supp
or~Varo
8
dura
& surffi
~des
ign , V
ar,Kot
11
dura
& seam
mt~r&d,
Var,Kot,
T 2
repl &
geom
et~KV 6
repl &
seam
s~t&d,
mark 4
spac
& geom
et~r&
d, mark
, purc
8
spac
& su
rffi~d
esign
, Kota
y 5
func &
geom
et~r&
d, Var,
Kot 8
func &
surffi
~r&d,
Var,Kot,
T 5
look &
geom
et~EK 7
look &
finish
~EK, C
EW
, 3
cost
& m se
le~ex
port,
Kot,Var
5
cost
& contr
a~ex
port,
Kot 4
cost
& si se
r~exp
ort, K
ot 5
cost
& few m
o~ex
port,
Kot 6
disp &
m se
le~ex
port,
Kot 2
~ 0
Weighted shortage factors
10203040506070
Shortage factors
weig
hted
sho
rtage
fact
.sh
orta
ge fa
ctor

248
Dia
gram
3.
Risk
s of
Pro
ject
100
200
300
400
500
600
700
800
900
Weighted risks
1000
2000
3000
4000
5000
6000
7000
8000
9000
1000
0
Risksw
eight
ed r
isk f
acto
rris
k fa
ctor
Diag
ram
4. T
eam
's C
ompe
tenc
e
012345du
rabi
lity c
alcu
lus
plas
tics
mat
l. te
chno
l.
plas
tics
seam
tech
nol.
test
ing
tech
nol.
mac
hine
des
ign
plas
tics
proc
essi
ngw
ood
proc
essi
ng
indu
stria
l des
ign
qual
ity te
chno
l.
netw
orkin
g
pate
nt la
w

248
Appendix 11. Explanation of Analysis Progress, Analysis Interpretation andPreparation of Analysis Report
PROJECTPRESENTATION
Connecting projectsLimiting factors
Stages or sequences in therealization of the Project
Name of ProjectSupport plate Listing of available solutions
Mapping of connecting /edprojects
File name & path Find out main properties from customersC:\wp\delivery\EDCP250e.xls Car body design
Serviceability Explain main properties to productionExport project
Character of Project Selection of surface material
Branch Selection of core/fill materialTechnical XCommercial CompressionFinancial
Fire testsState of developmentidea creationmain ideas clearcomponents sketchedmodification of somethingexisting
X
repetitive EDCPanalysis
Placing within Organisation Limitations to the Projectproduct or service for sale Xactivity or product for internal use not logistics
not cargo bodynot African marketsno new production lineservice only for France and Italy
Team members and sessions
session 2.10.1998
Peter Justice, Tina Varese, Paul Hall,I. Hawethorne
session 13.10.1998
Peter Justice, Tina Varese, Keithgordon,I. Hawethorne, Pauline Storm
ãMikael Epstein 1998

249
Proj
ect p
rese
ntat
ion
Con
cept
pre
sent
atio
n
#161
1#C
ON
CE
PT A
NA
LY
SIS
# ev
al.
know
led
ge a
reas
Req
uir
emen
tfa
ctor
sWei
ghte
dre
q.fa
ctor
sAttr
ibut
es o
rpr
oper
ties
(pro
pert
y by
whi
ch w
e ad
dva
lue
to th
e co
ncep
t for
our
clie
nt a
nd fo
r our
selv
es)
Abb
re
viat
ion
colu
mn
Sign
ific
ance
Com
pone
nts
of th
eC
once
pt(c
ompo
nent
sby
whi
ch th
e pr
oper
ties
are
real
ized
)
Abb
re
viat
ion
colu
mn
CO
MM
EN TS
Ana
lysi
ste
am’s
com
pete
nce
Kno
wle
dge
area
s
dura
bilit
yca
lcul
uspl
astic
sm
atl.
tech
nol.
plas
tics
seam
tech
nol.
test
ing
tech
nol.
mac
hine
desi
gn
CO
MM
ENTS
>
plas
tics
cour
s
111
15
5 14
dura
bilit
ydu
ra
geom
etry
geom
dura
bilit
y ca
lcul
us1
28
608
dura
bilit
ydu
ra
supp
ort p
late
mat
eria
lsu
pmpl
astic
s m
atl.
tech
nol.
2
311
17
5 16
dura
bilit
ydu
ra
surfa
ce fi
lmsu
fipl
astic
s se
amte
chno
l.3
42
2010
dura
bilit
ydu
ra
seam
met
hod
s m
etw
eldi
nte
stin
g te
chno
l.4
56
488
repl
acea
bilit
yre
pl
geom
etry
geom
mac
hine
des
ign
5
64
4511
re
plac
eabi
lity
repl
se
ams
seam
plas
tics
proc
essi
ng6
78
108
14
Spa
ce e
ffect
iven
ess
sp e
ge
omet
ryge
omw
ood
proc
essi
ng7
85
5611
S
pace
effe
ctiv
enes
ssp
e
surfa
ce fi
lmsu
finy
lon
indu
stria
l des
ign
8
98
180
23
func
tiona
lity
func
ge
omet
ryge
omqu
ality
tech
nol.
9
105
7014
fu
nctio
nalit
yfu
nc
surfa
ce fi
lmsu
fine
twor
king
10
117
183
outlo
okou
tl
geom
etry
geom
pate
nt la
w11
123
62
outlo
okou
tl
finis
hfin
sK
now
ledg
e ar
ea12
135
8417
C
ost
cost
m
ater
ial s
elec
tion
m s
elK
now
ledg
e ar
ea13
ãM
ikae
l Eps
tein
199
7, 1
998,
200
1
?R
+R

250
Res
ourc
e pr
esen
tatio
n
#161
5#R
ESO
UR
CE
AN
AL
YSI
S#
eval
.kn
owle
dge
area
s
Lack
fact
orsW
eigh
ted
Lack
fact
orsTh
e A
ttrib
utes
(pro
pert
ies)
and
Com
pone
nts
of th
eC
once
pt(p
rope
rty
by w
hich
we
add
valu
e to
the
conc
ept f
or o
urcl
ient
and
for o
urse
lves
as
wel
l as
the
com
pone
nts
that
are
use
d fo
rth
is)
Abb
re
viat
ion
colu
mn
Sign
ifica
nce
Res
ourc
e fa
ctor
s(p
erso
ns,
mac
hine
s, c
ontr
acto
rs, e
tc. r
ealiz
eA
ttrib
utes
)
Abb
re
viat
ion
colu
mn
Av ail
abi
lity
CO
MM
ENTS
dura
bilit
y calc
ulus
plas
tics
mat
l.te
chno
l.
plas
tics
seam
tech
nol.
test
ing
tech
nol.
mac
hin
e desi
gn
CO
MM
ENTS
>
1117
1,
6r1
dur
abili
ty &
geo
met
rydu
r geo
5K
V, P
J, P
K, J
M, T
V, V
T, V
aro
Co,
Kot
ayK
PP
J..+
5de
pend
s on
edgi
ng
828
3,
5r2
dur
abili
ty &
sup
port
plat
e m
ater
ial
dur s
pm5
Var
o C
o,Va
1de
pend
s on
edgi
ng
1154
4,
9r3
dur
abili
ty &
sur
face
film
dur s
uf5
KV
, PJ,
PK
, JM
, TV
, VT,
Var
o C
o., K
otay
KP
PJTV
+3
260
30
,0r4
dur
abili
ty &
sea
m m
etho
ddu
r sm
e5
KV
, JM
, TV
, SR
, Var
o C
o., K
otay
, TK
K,
KJT
S..+
26
20,
3r5
rep
lace
abili
ty &
geo
met
ryre
p ge
o3
KV
K1
46
1,5
r6 r
epla
ceab
ility
& s
eam
sre
p se
a3
KV
, JM
, VT,
PJ,
JS
, SR
, PS
, KM
,KJ
VPJ
…2
825
3,
1r7
spa
ce e
ffect
iven
ess
& g
eom
etry
spe
geo
4K
V, J
M, V
T, P
J, J
S, S
R, P
S, K
M, P
K,
KJVP
J….
2sh
ould
the
grou
p
511
2,
1r8
spa
ce e
ffect
iven
ess
& s
urfa
ce fi
lmsp
e su
f4
KV
, JM
, VT,
PJ,
PK
, TV
., K
otay
KJV
...+
58
23
2,9
r9 f
unct
iona
lity
& g
eom
etry
fun
geo
5K
V, J
M, V
T, P
J, P
K, T
V.,
Kot
ay, V
aro
Co.
K
JV...
+..
35
19
3,8
r10
func
tiona
lity
& s
urfa
ce fi
lmfu
n su
f5
KV
, JM
, VT,
PJ,
TV
., K
otay
, Var
o C
o., T
KK
K
JV...
+…3
depe
nds
oned
ging
75
0,7
r11
out
look
& g
eom
etry
outl
geo
1E
KE
23
00,
0r1
2 o
utlo
ok &
fini
shou
tl fin
1E
K, C
EW
,EC
35
14
2,8
r13
cos
t & m
ater
ial s
elec
tion
cos
m s
4K
R, C
EW
, PH
, TV
, JM
, Kot
a K
y, V
aro
Co.
, K
JV...
+..
4
ãM
ikae
l Eps
tein
199
7, 1
998
?R
+R
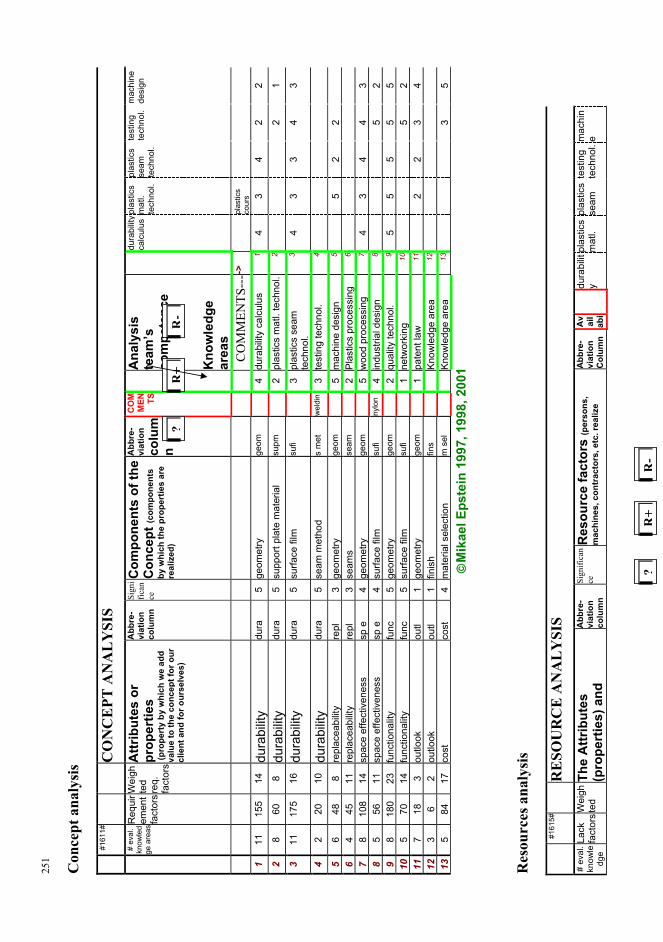
251
Con
cept
ana
lysi
s
#161
1#C
ON
CE
PT A
NA
LY
SIS
# ev
al.
know
led
ge a
reas
Req
uir
emen
tfa
ctor
sWei
ghte
dre
q.fa
ctor
sAttr
ibut
es o
rpr
oper
ties
(pro
pert
y by
whi
ch w
e ad
dva
lue
to th
e co
ncep
t for
our
clie
nt a
nd fo
r our
selv
es)
Abb
re
viat
ion
colu
mn
Sign
ific
ance
Com
pone
nts
of th
eC
once
pt(c
ompo
nent
sby
whi
ch th
e pr
oper
ties
are
real
ized
)
Abb
re
viat
ion
colu
mn
CO
MM
EN TS
Ana
lysi
ste
am’s
com
pete
nce
Kno
wle
dge
area
s
dura
bilit
yca
lcul
uspl
astic
sm
atl.
tech
nol.
plas
tics
seam
tech
nol.
test
ing
tech
nol.
mac
hine
desi
gn
CO
MM
ENTS
>
plas
tics
cour
s
111
15
5 14
dura
bilit
ydu
ra5
geom
etry
geom
4du
rabi
lity
calc
ulus
14
34
22
28
608
dura
bilit
ydu
ra5
supp
ort p
late
mat
eria
lsu
pm2
plas
tics
mat
l. te
chno
l.2
21
311
17
5 16
dura
bilit
ydu
ra5
surfa
ce fi
lmsu
fi3
plas
tics
seam
tech
nol.
34
33
43
42
2010
dura
bilit
ydu
ra5
seam
met
hod
s m
etw
eldi
n3
test
ing
tech
nol.
4
56
488
repl
acea
bilit
yre
pl3
geom
etry
geom
5m
achi
ne d
esig
n5
52
26
445
11
repl
acea
bilit
yre
pl3
seam
sse
am2
Pla
stic
s pr
oces
sing
6
78
108
14
spac
e ef
fect
iven
ess
sp e
4 ge
omet
ryge
om5
woo
d pr
oces
sing
74
34
43
85
5611
sp
ace
effe
ctiv
enes
ssp
e4
surfa
ce fi
lmsu
finy
lon
4in
dust
rial d
esig
n8
52
98
180
23
func
tiona
lity
func
5 ge
omet
ryge
om2
qual
ity te
chno
l.9
55
55
510
570
14
func
tiona
lity
func
5 su
rface
film
sufi
1ne
twor
king
105
211
718
3 ou
tlook
outl
1 ge
omet
ryge
om1
pate
nt la
w11
22
34
123
62
outlo
okou
tl1
finis
hfin
sK
now
ledg
e ar
ea12
135
8417
co
stco
st4
mat
eria
l sel
ectio
nm
sel
Kno
wle
dge
area
133
5
ãM
ikae
l Eps
tein
199
7, 1
998,
200
1
Res
ourc
es a
naly
sis
#161
5#R
ESO
UR
CE
AN
AL
YSI
S#
eval
.kn
owle
dge
Lack
fact
orsW
eigh
ted
The
Attr
ibut
es(p
rope
rtie
s) a
ndA
bbre
vi
atio
nco
lum
n
Sign
ifica
nce
Res
ourc
e fa
ctor
s(p
erso
ns,
mac
hine
s, c
ontr
acto
rs, e
tc. r
ealiz
eA
bbre
vi
atio
nC
olum
n
Av ail
abi
dura
bilit
ypl
astic
sm
atl.
plas
tics
seam
test
ing
tech
nol.
mac
hin
e
?R
+R
?R
+R

252
area
sLa
ckfa
ctor
sCom
pone
nts
of th
eC
once
pt(p
rope
rty
by w
hich
we
add
valu
e to
the
conc
ept f
or o
urcl
ient
and
for o
urse
lves
as
wel
l as
the
com
pone
nts
that
are
use
d fo
rth
is)
Attr
ibut
es)
lity
CO
MM
ENTS
calc
ulus
tech
nol.
tech
nol.
desi
gn
CO
MM
ENTS
>
1117
1,
6r1
dur
abili
ty &
geo
met
rydu
r geo
5K
V, P
J, P
K, J
M, T
V, V
T, V
aro
Co,
Kot
ayK
PP
J..+
5de
pend
s on
edgi
ng
23
32
5
828
3,
5r2
dur
abili
ty &
sup
port
plat
e m
ater
ial
dur s
pm5
Var
o C
o,Va
1de
pend
s on
edgi
ng
fill !
fill !
1154
4,
9r3
dur
abili
ty &
sur
face
film
dur s
uf5
KV
, PJ,
PK
, JM
, TV
, VT,
Var
o C
o., K
otay
KP
PJTV
+3
23
25
32
60
30,0
r4 d
urab
ility
& s
eam
met
hod
dur s
me
5K
V, J
M, T
V, S
R, V
aro
Co.
, Kot
ay, T
KK
,K
JTS
..+2
62
0,3
r5 r
epla
ceab
ility
& g
eom
etry
rep
geo
3K
VK
15
55
46
1,5
r6 r
epla
ceab
ility
& s
eam
sre
p se
a3
KV
, JM
, VT,
PJ,
JS
, SR
, PS
, KM
,KJ
VPJ
…2
825
3,
1r7
spa
ce e
ffect
iven
ess
& g
eom
etry
spe
geo
4K
V, J
M, V
T, P
J, J
S, S
R, P
S, K
M, P
K,
KJVP
J….
2sh
ould
the
grou
p
42
43
5
511
2,
1r8
spa
ce e
ffect
iven
ess
& s
urfa
ce fi
lmsp
e su
f4
KV
, JM
, VT,
PJ,
PK
, TV
., K
otay
KJV
...+
52
38
23
2,9
r9 f
unct
iona
lity
& g
eom
etry
fun
geo
5K
V, J
M, V
T, P
J, P
K, T
V.,
Kot
ay, V
aro
Co.
K
JV...
+..
33
42
32
519
3,
8r1
0 fu
nctio
nalit
y &
sur
face
film
fun
suf
5K
V, J
M, V
T, P
J, T
V.,
Kot
ay, V
aro
Co.
, TK
K
KJV
...+…
3de
pend
s on
edgi
ng
32
75
0,7
r11
out
look
& g
eom
etry
outl
geo
1E
KE
24
44
23
00,
0r1
2 o
utlo
ok &
fini
shou
tl fin
1E
K, C
EW
,EC
35
14
2,8
r13
cos
t & m
ater
ial s
elec
tion
cos
m s
4K
R, C
EW
, PH
, TV
, JM
, Kot
a K
y, V
aro
Co.
, K
JV...
+..
44
4
ãM
ikae
l Eps
tein
199
7, 1
998

253
Deliverables, Concept and Resource analysis results
COLLATION TABLE FOR ANALYSIS RESULTS #1649#
AttributeComponentResourcegroups
wghtdRequirementfactor
Requireme
ntfacto
r
wghtd
Lackfacto
r
Lackfacto
r
weighted
Riskfactor
Riskfacto
r
#know
lareasevaluated
CommentsfromConceptanalysis
Commentsfrom Resourceanalysis
r1 dura & geomet &design , Var,Kot
14 155 1,55 17 241 2651 11
r2 dura & suppor & Varo 8 60 3,50 28 210 1680 8 depends onedging machine
r3 dura & surffi & design ,Var,Kot
16 175 4,88 54 854 9392 11 depends onedging machine
r4 dura & seammt & r&d,Var,Kot, T
10 20 30,00 60 600 1200 2 welding,riveting
r5 repl & geomet & KV 8 48 0,30 2 14 86 6r6 repl & seams & t&d,mark
11 45 1,50 6 68 270 4
r7 spac & geomet & r&d,mark, purc
14 108 3,10 25 335 2678 8 should the groupbe splitted
r8 spac & surffi & design ,Kotay
11 56 2,13 11 119 596 5 nylon,polyester
r9 func & geomet & r&d,Var,Kot
23 180 2,92 23 525 4200 8
r10 func & surffi & r&d,Var,Kot, T
14 70 3,77 19 264 1318 5 depends onedging machine
r11 look & geomet & EK 3 18 0,68 5 12 86 7r12 look & finish & EK,CEW,
2 6 0,03 0 0 1 3
r13 cost & m sele &export, Kot,Var
17 84 2,80 14 235 1176 5
ãMikael Epstein 1997, 1998, 2001
?
New:guidance for

254
Deliverables, Knowledge analysis results
Collation table for the knowledge areas #1650#
Knowledge area Dependencyfactor(Risk ofKnowl.area reltoConcept)
Weighteddepsndency factor(weighted risk reltoConcept)
Deficiencyfactor(Risk ofKnowl.area rel toResources)
Weighteddeficiencyfactor(weightedrisk rel toResources)
RisksofProjectrel toKnowl.areas
weightedrisks ofProjectrel toKnowl.areas
#Know
lareasevaluated
Comments
Diagram No 8 9 10 11 12 13 relativetoConcept
relative toResources
durability calculus 22 4 10 2 227 45 5plastics matl.technol.
26 4 8 1 216 31 7 plasticscourse
plastics seamtechnol.
29 4 18 2 513 64 8
Testing technol. 39 4 15 1 601 55 11machine design 29 3 19 2 545 55 10plastics processing 38 3 17 1 654 54 12 designers to
InterplasexhibitioninGermany!
wood processing 30 3 25 3 762 85 9 industrial design 23 3 9 1 216 24 9 quality technol. 22 3 23 3 515 64 8 networking 33 3 27 2 904 82 11 patent law 21 2 23 2 477 48 10 patent
lawcourse
makecontractwith patentattorney
Knowledge area Knowledge area Knowledge area
ãMikael Epstein 1997, 1998, 2001

255
Example of Diagram: Requirement factors of Concept
Diagram 1.Requirement factors of Concept
5
10
15
20
25
dura~
geom
et 11
dura~
surffi
11
repl~g
eomet
6
spac
~geo
met 8
func~
geom
et 8
look~
geom
et 7
cost~
m sele
5
cost~
si se
r 5
disp~
m sele
2
Wei
ghte
d re
quire
men
t fac
tors
20
40
60
80
100
120
140
160
180
200
Req
uire
men
t fac
tors
w eighted requirement fact.
requirement factor
Example of Diagram: Risks of Project

256
Diagram 3.Risks of Project
100
200
300
400
500
600
700
800
900W
eigh
ted
risks
1000
2000
3000
4000
5000
6000
7000
8000
9000
10000
Ris
ks
w eighted risk factor
risk factor

257
Example of Diagram: Analysis team’s competence, from selfrating inConcept analysis table
Diagram 4Analysis Team Competence for Knowledge
Areas
012345
durability calculus
plastics matl. technol.
plastics seam technol.
testing technol.
machine design
plasrics processingwood processing
industrial design
quality technol.
networking
patent law
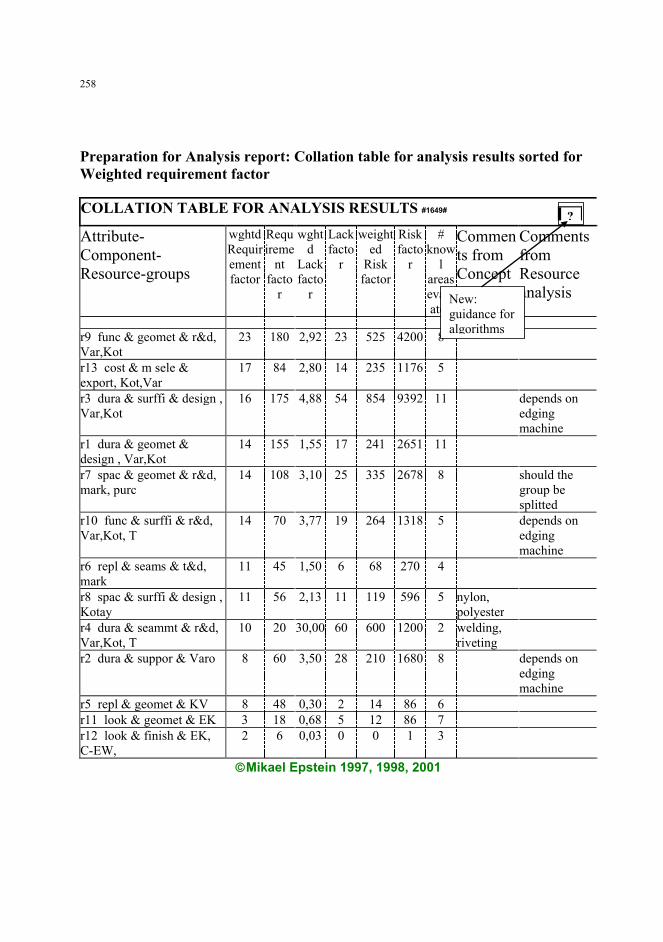
258
Preparation for Analysis report: Collation table for analysis results sorted forWeighted requirement factor
COLLATION TABLE FOR ANALYSIS RESULTS #1649#
AttributeComponentResourcegroups
wghtdRequirementfactor
Requireme
ntfacto
r
wghtd
Lackfacto
r
Lackfacto
r
weighted
Riskfactor
Riskfacto
r
#know
lareasevaluated
Comments fromConceptanalysis
CommentsfromResourceanalysis
r9 func & geomet & r&d,Var,Kot
23 180 2,92 23 525 4200 8
r13 cost & m sele &export, Kot,Var
17 84 2,80 14 235 1176 5
r3 dura & surffi & design ,Var,Kot
16 175 4,88 54 854 9392 11 depends onedgingmachine
r1 dura & geomet &design , Var,Kot
14 155 1,55 17 241 2651 11
r7 spac & geomet & r&d,mark, purc
14 108 3,10 25 335 2678 8 should thegroup besplitted
r10 func & surffi & r&d,Var,Kot, T
14 70 3,77 19 264 1318 5 depends onedgingmachine
r6 repl & seams & t&d,mark
11 45 1,50 6 68 270 4
r8 spac & surffi & design ,Kotay
11 56 2,13 11 119 596 5 nylon,polyester
r4 dura & seammt & r&d,Var,Kot, T
10 20 30,00 60 600 1200 2 welding,riveting
r2 dura & suppor & Varo 8 60 3,50 28 210 1680 8 depends onedgingmachine
r5 repl & geomet & KV 8 48 0,30 2 14 86 6r11 look & geomet & EK 3 18 0,68 5 12 86 7r12 look & finish & EK,CEW,
2 6 0,03 0 0 1 3
ãMikael Epstein 1997, 1998, 2001
?
New:guidance foralgorithms

259
Preparation for Analysis report: Collation table for Knocledge area resultssorted for Weighted dependency factor
Collation table for the knowledge areas #1650#
Knowledge area Dependencyfactor(Risk ofKnowl.area reltoConcept)
Weighteddepsndency factor(weighted risk reltoConcept)
Deficiencyfactor(Risk ofKnowl.area rel toResources)
Weighteddeficiencyfactor(weightedrisk rel toResources)
RisksofProjectrel toKnowl.areas
weightedrisks ofProjectrel toKnowl.areas
#Know
lareasevaluated
Comments
Diagram No 8 9 10 11 12 13 relative toConcept
relative toResources
durability calculus 22 4 10 2 227 45 5plastics matl.technol.
26 4 8 1 216 31 7 plasticscourse
plastics seamtechnol.
29 4 18 2 513 64 8
Testing technol. 39 4 15 1 601 55 11machine design 29 3 19 2 545 55 10plastics processing 38 3 17 1 654 54 12 designers
toInterplasexhibitioninGermany!
wood processing 30 3 25 3 762 85 9 industrial design 23 3 9 1 216 24 9 quality technol. 22 3 23 3 515 64 8 networking 33 3 27 2 904 82 11 patent law 21 2 23 2 477 48 10 patent law
coursemakecontractwithpatentattorney
Knowledge area Knowledge area Knowledge area
ãMikael Epstein 1997, 1998, 2001

260
Appendix 12. Example of Analysis Report
c:\wp\delivery\en{anarape.doc
EDCP A N A L Y S I S R E S U L T S R E P O R T
Report of analyzed case: Support plate (c:\wp\Demo\En\Anademe.doc)
Concept
Attributes and componentsThe following Attributes were selected and they were rated for significance relative to the project according to the tablebelow
Attribute Significancedurability 5functionality 5disposability 5space effectiveness 4cost 4replaceability 3outlook 1
The folliwing AttributeConcept pairs emerged, they appear in the order of their Requirement factor in the table below
AttributeComponent pair weighted Requirementfactor
Requirementfactor
functionality & geometry 8 23 180cost & material selection 5 17 84cost & size of series 5 17 84durability & surface film 11 16 175cost & contractors 4 15 60disposability & material selection 2 15 30durability & geometry 11 14 155functionality & surface film 5 14 70cost & few models 6 14 84space effectiveness & geometry 8 14 108replaceability & seams 4 11 45space effectiveness & surface film 5 11 56durability & seam method 2 10 20replaceability & geometry 6 8 48durability & support plate material 8 8 60outlook & geometry 7 3 18outlook & finish 3 2 6

261
Knowledge areasThe following Knowledge areas were selected based on the AttributeComponent pairs. The adjacent number expresses theteam members’ rating of their competence in the Knowledge areas
Knowledge area Team's competence
durability calculus 4plastics matl. technol. 2plastics seam technol. 3testing technol. 3machine design 5plasrics processing 2wood processing 5industrial design 4quality technol. 2networking 1patent law 1
The Dependency factors (relative to the Concept) of the Knowledge areas is expressed in the table below, sorted according to weightedDependency factors
Knowledge area Dependency factor(Risk of Knowl. area rel to
Concept)
weightedDependency factor
# Knowl. areasevaluated
1 durability calculus 22 4,4 52 plastics matl. technol. 26 3,7 73 plastics seam technol. 29 3,6 84 testing technol. 39 3,5 117 wood processing 30 3,3 96 plastics processing 38 3,2 1210 networking 33 3,0 115 machine design 29 2,9 109 quality technol. 22 2,8 88 industrial design 23 2,6 911 patent law 21 2,1 10
Conclusions about the ConceptAttributeComponent pairs
The AttributeComponent pair functionality & geometry (on row 8) clearlyexhibited the biggest requirement, both the weighted and nonweightedrequirement factors were the biggest in the table. From the Concept analysis tablecan be seen that this pair is strongly dependent on many significant knowledgeareas (six knowledge areas were rated to 5).
Knowledge areas
The Dependency factors of the knowledge areas were fairly evenly distributed. Durability calculus,plastics materials. technology., plastics seam technology and testing technologyexhibited the biggest weighted dependency factors.

262
ResourcesThe AttributeComponentResource groups, sorted according to decending weighted Lack factors appear in the table below. The tablealso shows the nonweighted Lack factors. The rnumber in front of each group expresses the row number in the analysis tables, forpossible further reference
Print time210299 11:34
COLLATION TABLE FOR ANALYSIS RESULTSAttributeComponentResourcegroups weighted
Lack factorLackfactor
# knowledgeareas
evaluatedr4 durability & seam method 2 r&d, Var,Kot, T 30,00 60 2r3 durability & surface film 11 design , Var,Kot 4,88 54 11r10 functionality & surface film 5 r&d, Var,Kot, T 3,80 19 5r2 durability & support plate material 8 Varo 3,56 29 8r7 space effectiveness & geometry 8 r&d, mark,purc
3,15 25 8
r16 cost & few models 6 export, Kot 3,03 18 6r9 functionality & geometry 8 r&d, Var,Kot 2,98 24 8r13 cost & material selection 5 export, Kot,Var 2,88 14 5r15 cost & size of series 5 export, Kot 2,34 12 5r8 space effectiveness & surface film 5 design ,Kotay
2 11 5
r1 durability & geometry 11 design , Var,Kot 1,55 17 11r6 replaceability & seams 4 t&d, mark 1,50 6 4r14 cost & contractors 4 export, Kot 1,50 6 4r17 disposability & material selection 2 export,Kot
0,75 2 2
r11 outlook & geometry 7 EK 0,70 5 7r5 replaceability & geometry 6 KV 0,00 6r12 outlook & finish 3 EK, CEW, 0,00 3
The Deficiency factors (relative to the Concept) of the Knowledge areas is expressed in the table below, sorted according to weightedDeficiency factors
Knowledge area Deficiency factor (Risk ofKnowl. area rel to Resources)
weighted Deficiencyfactor
# Knowl. areasevaluated
9 quality technol. 23,4 2,9 87 wood processing 25,4 2,8 910 networking 27,4 2,5 1111 patent law 22,7 2,3 103 plastics seam technol. 17,7 2,2 81 durability calculus 10,3 2,1 55 machine design 18,8 1,9 10

263
4 testing technol. 15,4 1,4 116 plasrics processing 17,2 1,4 122 plastics matl. technol. 8,3 1,2 78 industrial design 9,4 1,0 9
Conclusions about the ResourcesAttributeComponentResource groups
The AttributeComponentResource group durability & seam method 2Rr&D,Varo, Kotay, TKK exhibited clearly the biggest Lack factor. From row 4 in theResource analysis table can be seen that this group is dependent on two knowledgeareas with abilities rated only to 1, furthermore the availability of the resources onthis row has been rated only to 2. The next biggest lack factors belong to rows 3,10, 2 and 7. On row 3 the group durability & surface film design office,Varo,Kotay the resource abilities were rated to 1 once and to 2 three times, on row10 the group functionality & surface film 5 R&D, Var,Kot, TKK exhibitsresource ability ratings of 2 for two knowledge areas. On row 2 the groupdurability & support plate material 8 Varo suffers from resource availability of 1.On row 7 the group space effectiveness & geometry & R&D, marketing, purchasewas rated to 2 for ability of two resources, and their availability was rated to 2
Knowledge areas
The knowledge areas quality technology, wood processing and networkingrepresent the biggest deficiency factors both as weighted and nonweighted.
General conclusionsThe AttributeComponentResource groups appear in the following table sorted according to weighted Riskfactor

264
COLLATION TABLE FOR ANALYSIS RESULTSAttributeComponentResourcegroups weighted
riskRisk #
knowledgeareas
evaluated
r3 durability & surface film 11 design , Var,Kot 854 9392 11r4 durability & seam method 2 r&d, Var,Kot, T 600 1200 2r9 functionality & geometry 8 r&d, Var,Kot 536 4290 8r7 space effectiveness & geometry 8 r&d, mark, purc 340 2722 8r10 functionality & surface film 5 r&d, Var,Kot, T 266 1330 5r16 cost & few models 6 export, Kot 255 1529 6r13 cost & material selection 5 export, Kot,Var 242 1210 5r1 durability & geometry 11 design , Var,Kot 241 2651 11r2 durability & support plate material 8 Varo 214 1710 8r15 cost & size of series 5 export, Kot 197 983 5r8 space effectiveness & surface film 5 design , Kotay 120 600 5r14 cost & contractors 4 export, Kot 90 360 4r6 replaceability & seams 4 t&d, mark 68 270 4r17 disposability & material selection 2 export, Kot 23 45 2r11 outlook & geometry 7 EK 13 88 7r5 replaceability & geometry 6 KV 6r12 outlook & finish 3 EK, CEW, 3
Knowledge areas
Knowledge area Risks of Projectrel to Knowl.
areas
Weighted risks ofProject rel toKnowl. areas
# Knowl. areasevaluated
7 wood processing 762 85 910 networking 904 82 113 plastics seam technol. 513 64 89 quality technol. 515 64 84 testing technol. 601 55 115 machine design 545 55 106 plasrics processing 654 54 1211 patent law 477 48 101 durability calculus 227 45 52 plastics matl. technol. 216 31 78 industrial design 216 24 9

265
General conclusions about the project Support plate
The AttributeComponentResourcegroup durability & surface film 11 design ,Var,Kot (on row 3) clearly represents the biggest risks both as weighted and nonweighted. The group r4 durability & seam method 2 D&D, Varo,Kotay, TKKrepresented the second biggest weighted risk factor, from row 4 in the Analysiscollation teble can be seen that the lack factors in the resource column arerelatively large, but the requirement factors in the concept column are not so. Fromrow 4 in the Resource analysis table it can further be seen that the ability has beenrated to 1 for both knowledge areas involved.
The risk factors of the Knowledge areas are quite evenly distributed. The biggestrisk factors are represented by wood processing and networking.
Date: 22.2.1999Signature:
NN

266
Appendix 13. Tables of Improvements to bases during the Development of theEDCP Analysis System
Items introduced to the Concept analysis table of the model in stage 1#1789#
Stag
eB
ase Table
/Graph
Group Column / Row Activity Algorithm
Conceptpresentation
Conc. Attributes listing
Attr. Significance ratingMarket benefit rating
Concept analysis
Techn. problem ratingConceptcomponents
Conceptcomponents
listing
Technologypresentation
Technologies orsciences
listing
Technologysignificance
rating
Technologydifficulty
rating
Technologycompetenceanalysis
Technologynewness
rating
Key attribute listing, manualtransfer
Key attributes
Key attributesignificance
rating, manualtransfer
Key components Key components listing, manualtransfer
Risk of concept listing, manualtransfer
Difficulty rel.competitors
rating, manualtransfer, sorted
Newness rating, manualtransfer, sorted
1 1.1 Concept
Risk of concept
Risk factor,concept
Riskfactor
c:\WP\Dr\Avh\Wbook\Wk2tab03.doc

267
Items introduced to Resource analysis table of the the model in stage 1
Stag
e Base Table/Graph
Group Column / Row Activity Algorithm
1 1.2 Res. Attributes ListingAttr. signif. RatingAttr. Ability Rating
Resourcesattrib.
Ability dimension ListingResourcecomponent
Resourcecomponent
Listing
Technologysignificance
Rating
Difficulty rel.competitors
Rating
Newness Ratingdiff. × newness
Technologies, sciences
Difficulty ×NewnessKey attribute listing, manual
transferKey attributesignificance
rating, manualtransfer
Keyattributes
Key ability rating, manualtransfer
Key resourcerequirement
rating, manualtransfer
Key res. req.significance
listing, manualtransfer
Risks fr. resources listing, manualtransfer
Significance, risksof resources
rating, manualtransfer
Difficulty relativeto competitors
rating, manualtransfer
Newness rating, manualtransfer
Difficulty ×newness
difficulty × newness
#1790#
Resources
Resourcerequirement
Risk factor,resources
risk factor
Items introduced to the Matching table of the the model in stage 1#1791#
Stag
Bas
e
Table /Graph
Group Column / Row Activity

268
Rating of techn.risks
listing, manualtransfer
Difficulty rating, manualtransfer
Newness rating, manualtransfer
Risks ofconcept
Risk factor value, manualtransfer
Technology listing, manualtransfer
1 1.3 Matching ofCons. andRes.
Risks ofresources
Significance rating, manualtransfer
Items introduced to Concept analysis table of the the model in stage 2 #1741#
Stage
Base Table /Graph
Group Column / Row Activity Structure
individualtechnologycolumns
listing grid structure
SignificanceDifficulty
2 2.1 Concept Technologypresentation
Newness
rating for each technology
Items introduced to Resource analysis table of the the model in stage 2 #1742#
Stage
Base Table /Graph
Group Column / Row Activity Structure
individualtechnologycolumns
listing grid structure
SignificanceDifficulty
2 2.2 Resource Technologypresentation
Newness
rating for each technology
Items introduced to Concept and Resource analysis tables of the model in stage 3 #1797#
Stage
Base Table /Graph
Group Column / Row Structure
Concept Technologypresentation
formula columns foreach technology
3 3.1
Resources Technologypresentation
formula columns foreach technology
Concept andResources tablesbesides of each otherin same sheet

269
Items introduced to the Analysis tables and Graphs of the model in stage 4#1798#
Stage
Base Table /Graph
Group Structure
risks of conceptrisks of conc.relative totechnology
Graphs
risks of res. relativeto technology
Concept and Resources tablesbelow each other in samesheet
4 4 (notshown)
Key factor Key attr., comp andtech.
Tables removed from Cons.and Res. tables
Items introduced to the Analysis tables and Report form of the model in stage 5#1745#
Stage
Base Table /Graph
Group Column / Row Algorithm
number oftechnologies rated
counts ratedtechnologies
Concept Risk factor ofconcept
weighted risk factor weighingformula
number oftechnologies rated
counts ratedtechnologies
5 5.1 and 5.2
Resources Risk factor ofresources
weighted risk factor weighingformula
Attrcomppair# tech testedrisk factor
Concept
w. risk factorAttrcomppair# tech testedrisk factor
Resources
w. risk factorTechnologyConc: #a/cpairs test Risk factor W risk factor
Res: #a/cpairs test Risk factor
5 Coreen51.xls
Report form
Technologies
W risk factor

270
PILOT COMPANIES SELECTED HERE
Items introduced to Concept analysis table of the model in stage 6 #1746#
Stage
Base Table /Graph
Group Column /Row
Activity Structure
Formulas removed fromgrid to separate formulaareraRisk values oftechnologies displayedat top of table
6 6.1 Conceptanalysis
Grid Knowledgeareas
Knowledge areaintroduced asterm forTechnology
Larger font
Items introduced to Analysis tables of the model in stage 7 #1747#
Stage
Base Table /Graph
Group Column / Row Activity Structure
Algorithm
7 7.1 and 7.2Branch “xrating”
State of developm. “xrating”
Projectpresentation
Projectcharacterization
Organiz. placement “xrating”Main attribute listingSignificance ratingComponents listingKnowledge areas listingSignif. of Knowl.Ar. rating(1/Kn.ar.)
# knowl. areas rated Count Kn.ar.Risk factor Risk factor
(new f.)Weighted risk fact. Weighting
formula
Preanalysis ofproject
Comments listingConceptandResourcesTables
Comments toattr/comppairs,resources andknowledge areas
Multisheetstructure
Intermediate“heading” rowslinked to Preanalysis table
Automaticcopy fromPreanalysistableCentral fillingfor Difficultyand Newness
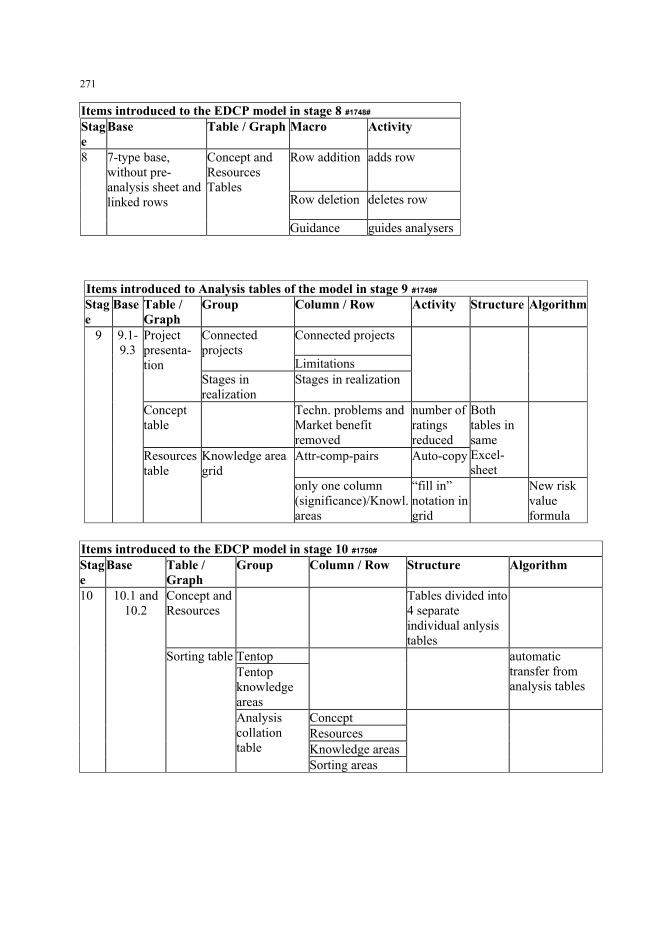
271
Items introduced to the EDCP model in stage 8 #1748#
Stage
Base Table / Graph Macro Activity
Row addition adds row
Row deletion deletes row
8 7type base,without preanalysis sheet andlinked rows
Concept andResourcesTables
Guidance guides analysers
Items introduced to Analysis tables of the model in stage 9 #1749#
Stage
Base Table /Graph
Group Column / Row Activity Structure Algorithm
Connected projectsConnectedprojects
Limitations
Projectpresentation
Stages inrealization
Stages in realization
Concepttable
Techn. problems andMarket benefitremoved
number ofratingsreduced
Attrcomppairs Autocopy
Bothtables insameExcelsheet
9 9.19.3
Resourcestable
Knowledge areagrid
only one column(significance)/Knowl.areas
“fill in”notation ingrid
New riskvalueformula
Items introduced to the EDCP model in stage 10 #1750#
Stage
Base Table /Graph
Group Column / Row Structure Algorithm
Concept andResources
Tables divided into4 separateindividual anlysistables
TentopTentopknowledgeareas
automatictransfer fromanalysis tables
ConceptResourcesKnowledge areas
10 10.1 and10.2
Sorting table
Analysiscollationtable
Sorting areas

272
Firm F analyses
Items introducedto the EDCP model in stage 11 #1713#
Stage
Base Table /Graph
Column / Row Activity
Algorithm
Needs pf project listingTechnical problems > Challenge listingAttributeComponent pairsImportance importance = signif. to
customer + marketing benefit
Preanalysis
Criticality criticality = importance ×challenge
Concept Significance to customer for eachknowledge area /attr.comp. group cell ingrid
rating
11 11.1
Resources Knowledge area ratings reduced to one perknowledge area/attr.comp. group cell ingrid, and named Resource quality
rating
Items introduced to the Analysis table in stage 11 #1720#
Stage
Base Table /Graph
Column / Row Activity Algorithm
Attribute listingSignificance ratingMarket benefits ratingComponents listingTechnicalchallenge
rating
Risk forimportance
importance = significance + marketingbenefit
11 11.2 Analysistable
Risk forCriticality
criticality = importance/technicalchallenge
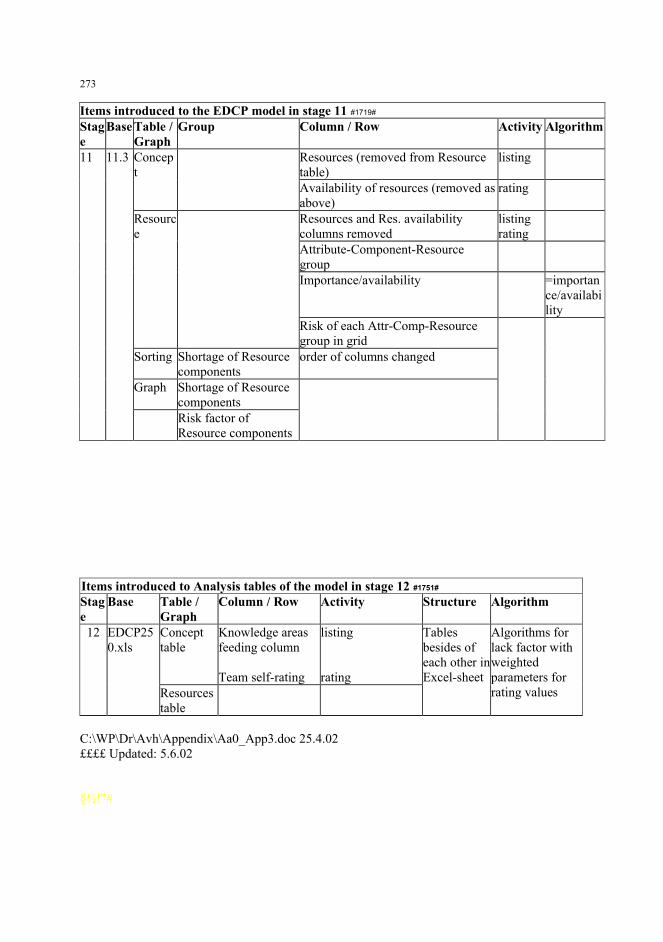
273
Items introduced to the EDCP model in stage 11 #1719#
Stage
Base Table /Graph
Group Column / Row Activity Algorithm
Resources (removed from Resourcetable)
listingConcept
Availability of resources (removed asabove)
rating
Resources and Res. availabilitycolumns removed
listingrating
AttributeComponentResourcegroupImportance/availability =importan
ce/availability
Resource
Risk of each AttrCompResourcegroup in grid
Sorting Shortage of Resourcecomponents
order of columns changed
Graph Shortage of Resourcecomponents
11 11.3
Risk factor ofResource components
Items introduced to Analysis tables of the model in stage 12 #1751#
Stage
Base Table /Graph
Column / Row Activity Structure Algorithm
Concepttable
Knowledge areasfeeding column
Team selfrating
listing
rating
12 EDCP250.xls
Resourcestable
Tablesbesides ofeach other inExcelsheet
Algorithms forlack factor withweightedparameters forrating values
C:\WP\Dr\Avh\Appendix\Aa0_App3.doc 25.4.02££££ Updated: 5.6.02
§½!”#


HELSINGIN KAUPPAKORKEAKOULUN JULKAISUJAPublications of the Helsinki School of Economics
A-SARJA: VÄITÖSKIRJOJA - DOCTORAL DISSERTATIONS. ISSN 1237-556X.
A:164. PASI SORJONEN: Essays on Dividends and Taxes. 2000.
A:165. KARI LOHIVESI: Managerial and Organisational Mechanisms for Corporate Failure. Ekomen Group Case. 2000.
A:166. KARLO KAUKO: The Microeconomics of Innovation: Oligopoly Theoretic Analyses with Applications to Banking and Patenting. 2000.
A:167. SAKU SALO: Information Technology Enabled Change. Dramatic Improvement and Perceived Success. 2000.
A:168. MATTI KUKKONEN: Capital Gains Taxation and Realization Behaviour: Evidence from Finnish Panel Data. 2000.
A:169. PEIK GRANLUND: Rättsliga utvärderingsstudier i USA och Norden – orsaker till skiljaktigheter mellan studierna. 2000.
A:170. MARTTI NYBERG: Interaction Between the Economy and Politics in Finland. A Study on Popularity of Parties and Political Business Cycles. 2000.
A:171. TARJA JORO: Incorporating Preference Information in Data Envelopment Analysis. 2000.
A:172. MARKO LINDROOS: Cooperation and Conflicts in High Seas Fisheries. 2000.
A:173. KIMMO LAHTI-NUUTTILA: Geneeriset ympäristöstrategiat ja Suomen paperiteollisuuden ympäristökilpailukyvyn edellytykset. 2000. ISBN 951-791-473-3.
A:174. SAIJA KATILA: Moraalijärjestyksen rajaama tila: maanviljelijä-yrittäjäperheiden selviytymisstrategiat. 2000. ISBN 951-791-475-X.
A:175. AIJA LEIPONEN: Essays in the Economics of Knowledge: Innovation, Collaboration, and Organizational Complementarities. 2000. ISBN 951-791-478-4.
A:176. MIKA VEHNÄMÄKI: Political Elite’s Ideology, Economic Policy and Regional Economic Development in Ghana. 2000. ISBN 951-791-484-9.
A:177. TOIVO KOSKI: Success Potential of a Venture Capital Investment – A Model to Simulate Venture Capitalists’ Perception Using Fuzzy Set Theory. 2000. ISBN 951-791-487-3.
A:178. EVA HEISKANEN: Translations of an Environmental Technique: Institutionalization of the Life Cycle Approach in Business, Policy and Research Networks. 2000.
ISBN 951-791-488-1.
A:179. SAMI TORSTILA: Essays on Gross Spreads in Initial Public Offerings. 2000. ISBN 951-791-492-X.

A:180. LIISA LINTUNEN: Who is the Winner Entrepreneur ? An Epistemological Study of the Schumpeterian Entrepreneur. 2000. ISBN 951-791-498-9.
A:181. KARI INKINEN: Dif fuusio ja fuusio. Osuuskauppainnovaation levinneisyysja sen dynamiikka 1901 - 1998. Alueellisesti tulostuva näkökulma suomalaisen osuuskauppatoiminnan kehitykseen ja sisällön muutokseen. 2000. ISBN 951-791-505-5.
A:182. ARI HYYTINEN: Essays on Bank Screening and Market Power in Loan Markets. 2000. ISBN 951-791-506-3.
A:183. PIRJA HEISKANEN: On Decentralized Computation of Pareto-optimal Solutions in Multi-party Negotiations. 2000. ISBN 951-791-512-8.
A:184. JUKKA VESALA: Technological Transformation and Retail Banking Competition: Implications and Measurement. 2001. ISBN 951-791-518-7.
A:185. JOHANNA MOISANDER: Representation of Green Consumerism: A Constructionist Critique. 2001. ISBN 951-791-602-7.
A:186. JUHANI VAIVIO: Non-financial Measurement in an Organizational Context. Three Perspectives. 2001. ISBN 951-791-604-3.
A:187. ARJA JUNTUNEN: Audience Members’ Goals of Media Use and Processing of Advertisements. 2001. ISBN 951-791-608-6.
A:188. TIMO KUOSMANEN: The Role of Production Assumptions in Data Envelopment Analysis. 2001. ISBN 951-791-610-8.
A:189. ISMO TEIKARI: Poisson Mixture Sampling in Controlling the Distribution of Response Burden in Longitudinal and Cross Section Business Surveys. 2001.
ISBN 951-791-611-6.
A:190. LIISA ROHWEDER: Ympäristökasvatus ammattikorkeakoulussa. Opetussuunnitelma-teoreettisen mallin kehittäminen liiketalouden koulutukseen. 2001. ISBN 951-791-613-2.
A:191. PEKKA SULAMAA: Essays in Deregulated Finnish and Nordic Electricity Markets. 2001. ISBN 951-791-617-5.
A:192. SUSAN MERILÄINEN: Changing Gendered Practices: A PAR Project within an Academic Work Community. 2001. ISBN 951-791-640-X.
A:193. A. MAARIT I. KALLIO: Studies on Competition in the Finnish Wood Market. 2001. ISBN 951-791-643-4.
A:194. KALEVI EURO: Locational Changes of Headquarters of Multinational Corporations. A Theoretical Study on The Motives and Reasons for Relocating Finnish Divisional Headquarters Abroad. 2001. ISBN 951-791-646-9.
A:195. VELI-PEKKA HEIKKINEN: Modelling Timber Harvesting Decisions as a Part of the Management of a Mixed Asset Portfolio. 2001. ISBN 951-791-656-6.
A:196. NIINA PAUTOLA-MOL: The Baltic States’ Integration into the European Union – Institutional Approach. 2001. ISBN 951-791-657-4.
A:197. ANSSI ÖÖRNI: Consumer Search in Electronic Markets. 2002. ISBN 951-791-680-9.

A:198. ARI MATIKKA: Measuring the Performance of Owner-Managed Firms: A systems approach. 2002. ISBN 951-791-685-X.
A:199. RIITTA KOSONEN: Governance, the Local Regulation Process, and Enterprise Adaptation in Post-Socialism. The Case of Vyborg. 2002. ISBN 951-791-692-2.
A:200. SUSANNE SUHONEN: Industry Evolution and Shakeout Mechanisms: The Case of the Internet Service Provider Industry. 2002. ISBN 951-791-693-0.
A:201. MATTI TUOMINEN: Market-Driven Capabilities and Operational Performance. Theoretical Foundations and Managerial Practices. 2002. ISBN 95-791-694-9.
A:202. JUSSI KARHUNEN: Essays on Tender Offers and Share Repurchases. 2002. ISBN 951-791-696-5.
A:203. HENNAMARI MIKKOLA: Empirical Studies on Finnish Hospital Pricing Methods. 2002.ISBN 951-791-714-7.
A:204. MIKA KORTELAINEN: EDGE: a Model of the Euro Area with Applications to Monetary Policy. 2002. ISBN 951-791-715-5.
A:205. TOMI LAAMANEN: Essays on Technology Investments and Valuation. 2002. ISBN 951-791-716-3.
A:206. MINNA SÖDERQVIST: Internationalisation and its Management at Higher-Education Institutions. Applying Conceptual, Content and Discourse Analysis. 2002.
ISBN 951-791-718-X.
A:207. TARJA PIETILÄINEN: Moninainen yrittäminen. Sukupuoli ja yrittäjänaisten toimintatila tietoteollisuudessa. 2002. ISBN 951-791-719-8.
A:208. BIRGIT KLEYMANN: The Development of Multilateral Alliances. The Case of the Airline Industry. 2002. ISBN 951-791-720-1.
A:209. MIKAEL EPSTEIN: Risk Management of Innovative R&D Project. Development of Analysys Model. A Systematic Approach for the Early Detection of Complex Problems(EDCP) in R&D Projects in Order to Increase Success in Enterprises. 2002.
ISBN 951-791-717-9, ISBN 951-791-919-0 (Electronic dissertation).
A:210. SAMI KAJALO: Deregulation of Retail Hours in Finland: Historical and Empirical Perspectives.2002. ISBN 951-791-734-1.
A-SARJA: MUITA JULKAISUJA - OTHER PUBLICATIONS
UOLEVI LEHTINEN – HANNU SERISTÖ (edit.): Perspectives on Internationalization. 1999. ISBN 951-791-418-0.
JARI HEIKKI KUUSISTO: The Determinants of Service Capability in Small Manufacturing Firms. 2000. ISBN 951-791-510-1.
Väitöskirjojen tiivistelmät 1996-2001. Helsingin kauppakorkeakoulun 12. promootion juhlajulkaisu. 2001. ISBN 951-791-617-5.

ANNE HERBERT: The Paradoxes of Action Learning: An Interpretive and Critical Inquiry into Vocational Educators’ Professional Development. 2002. ISBN 951-791-684-1.
B-SARJA: TUTKIMUKSIA - RESEARCH REPORTS. ISSN 0356-889X.
B:29. RISTO WALDEN – SEPPO IKÄHEIMO – RAIMO IMMONEN: Työsuhdeoptiojärjestelmien verotus. 2000.
B:30. EERO W. ARTTO - RISTO Y. JUURMAA: Performance and International Competitiveness of Listed Paper Industry Groups 1991-1999. Finland vs Sweden, Canada and USA. 2000.
B:31. HEIDI MOISIO – ANNUKKA JYRÄMÄ: Helsingin kulttuurikaupunkisäätiön ja tuotan-toyhtiöiden välinen yhteistyö. 2001. ISBN 951-791-607-8.
B:32. KRISTIINA KORHONEN: Role of government intervention in foreign direct investment: Case of South Korea. 2001. ISBN 951-791-620-5.
B:33. MINNA SÖDERQVIST: The Internationalisation and Strategic Planning of Higher-Education Institutions. An Analysis of Finnish EPS Strategies. 2001. ISBN 951-791-623-X.
B:34. KATJA LEPPÄLÄ – HANNA PÄIVIÖ: Kauppatieteiden opiskelijoiden moraalijärjestys: Nar-ratiivinen tutkimus kolmen eri pääaineen opiskelusta Helsingin kauppakorkeakoulussa. 2001. ISBN 951-791-629-9.
B:35. EERO W. ARTTO: Performance and International Competitiveness of Listed Paper Industry Groups 1992-2000. Finland vs Sweden, Canada and USA. 2001. ISBN 951-791-635-3.
B:36. ARJA KALMARI – JOHANNA MARKKANEN: Erektiohäiriölääke Viagran saama julkisuus Suomessa vuosina 1998 - 2000. 2001. ISBN 951-791-647-7.
B:37. ANTERO HONKASALO: Ekotehokkuus, tuotepolitiikka ja ympäristöpolitiikan ohjauskeinot. 2001. ISBN 951-791-653-1.
B:38. KRISTIINA KORHONEN(ed.): Current Reflections on the Pacific Rim. 2002. ISBN 951-791-661-2.
B:39. RISTO Y. JUURMAA: Performance and International Competitiveness of Listed Metal and Telecommunication Industry Groups 1992 - 2000. Finland vs Sweden and Germany. 2002. ISBN 951-791-668-X.
B:40. KAIJA TUOMI – SINIKKA VANHALA (toim.): Yrityksen toiminta, menestyminen ja henkilöstön hyvinvointi. Seurantatutkimus metalliteollisuudessa ja vähittäiskaupan alalla. 2002. ISBN 951-791-674-4.
B:41. ANNE ÄYVÄRI: Verkottuneen pienyrityksen markkinointikyvykkyys. 2002. ISBN 951-791-682-5.
B:42. RIKU OKSMAN: Intohimoa ja ammattitaitoa: puheenvuoroja tuottajan työstä. 2002. ISBN 951-791-700-7.

B:43. RISTO TAINIO – KARI LILJA – TIMO SANTALAINEN: Organizational Learning in the Context of Corporate Growth and Decline: A Case Study of a Major Finnish Bank. 2002. ISBN 951-791-717-1
CKIR-SARJA: HELSINKI SCHOOL OF ECONOMICS. CENTER FOR KNOWLEDGE AND INNOVATION RESEARCH. CKIR WORKING PAPERS. ISSN 1458-5189.
CKIR:1. SATINDER P. GILL: The Engagement Space and Parallel Coordinated Movement: Case of a Conceptual Drawing Task. 2002. ISBN 951-791-660-4.
CKIR:2 PEKKA ISOTALUS – HANNI MUUKKONEN: How Do Users of Pda’s React to an Animated Human Character in Online News? 2002. ISBN 951-791-664-7.
E-SARJA: SELVITYKSIÄ - REPORTS AND CATALOGUES. ISSN 1237-5330.
E:99. Research Catalogue 1999-2000. 2000.
E:100. JUHA KINNUNEN: Opiskelijoiden valikoituminen pääaineisiin Helsingin kauppakorkeak-oulussa. Pääainetoiveita ja niihin vaikuttavia tekijöitä kartoittava kyselytutkimus vuosina 1995-2000 opintonsa aloittaneista. 2002. ISBN 951-791-669-8.
E:101. Research Catalogue 2000 – 2002. Projects and Publications. 2002. ISBN 951-791-670-1.
N-SARJA: HELSINKI SCHOOL OF ECONOMICS. MIKKELI BUSINESS CAMPUS PUBLICATIONS.ISSN 1458-5383
N:1 PÄIVI KARHUNEN: Etelä-Savon yritysten ulkomaankauppa 2000. 2001. ISBN 951-791-648-5.
N:2. PÄIVI KARHUNEN: Etelä-Savon yritysten Venäjän-kauppa 2002. 2001. ISBN 951-791-649-3.
N:3. RIITTA ERONEN: Selvitys venäläismatkailua koskevasta tutkimustiedosta. 2001. ISBN 951-791-650-7.
N:4. MARITA HEIKKINEN-RUMMUKAINEN: Venäläläismatkailu Etelä-Savossa. 2001. ISBN 951-791-651-5.
N:5. PÄIVI KARHUNEN: Metalliteollisuuden alinhankintamahdollisuudet Venäjällä. Eteläsavolaisten ja pietarilaisten yritysten kokemuksia tuotannollisesta yhteistyöstä. 2001. ISBN 951-791-652-3.
N:6 JUHA SIIKAVUO: Taloushallinon opas alkavalle yrittäjälle. 2002. ISBN 951-791-686-8.
N:7. JOHANNA NISKANEN: Etelä-Savon pk-yritysten vienti Tanskaan: ulkomaankaupan erityisraportti 2001. 2002. ISBN 951-791-687-6.

N:8. MIKKO NUMMI: Etelä-Savon pk-yritysten vienti Saksaan: ulkomaankaupan erityisraportti 2001. 2002. ISBN 951-791-688-4.
N:9. NOORA RUOHONEN – RIIKKA OLLI: Etelä-Savon pk-yritysten vienti Tsekkiin: ulkomaankaupan erityisraportti 2001. 2002. ISBN 951-791-689-2.
N:10. ANNA HÄKKINEN – ESKO LÄIKKÖ: Etelä-Savon pk-yritysten vientikohteena USA: ulkomaankaupan erityisraportti 2001. 2002. ISBN 951-791-690-6.
N:11. JUHA SIIKAVUO: Verkko-oppimisympäristön kehittäminen. Esimerkkinä HA Boctok Venäjän-kaupan erikoistumisopintojen yksi moduuli, vuosi: 2002. 2002.
ISBN 951-791-695-7.
N:12. JUHO PETTER PUHAKAINEN: German Venture Capitalists’ Decision Criteria in NewVenture Evaluation. 2002. ISBN 951-791-650-7.
W-SARJA: TYÖPAPEREITA - WORKING PAPERS . ISSN 1235-5674.
W:235. PERTTI HAAPARANTA – MIKKO PUHAKKA: Development Traps: Investing in Patience. 2000.
W:236. SAMI TORSTILA: What explains the clustering of ipo gross spreads? 2000.
W:237. VIRPI KRISTIINA TUUNAINEN (edit.): Proceedings of The Second Electronic Grocery Shop-ping (EGS) Workshop. In connection with The 20th Anniversary International Conference on Information Systems (ICIS). 2000.
W:238. HANNU SERISTÖ: Industry Liberalization and Privatization in Small and Open Economies – Research Avenues for Studying the European Airline Industry. 2000.
W:239. ANU H. BASK – JARI JUGA: Selective Integration in supply Chain Management. 2000.
W:240. TARJA JORO – PEKKA KORHONEN – STANLEY ZIONTS: An Interactive Approach to Improve Estimates of Value Efficiency in Data Envelopment Analysis. 2000.
W:241. PEKKA KORHONEN – MIKULAS LUPTACIK: Eco-Efficiency Analysis of Power Plants: An Extension of Data Envelopment Analysis. 2000.
W:242. HANNU SERISTÖ: Alliance Objectives in Strategy framework – the Case of Multipartner Alliances in the Airline Industry. 2000.
W:243. OLLI TAHVONEN – SEPPO SALO: On Faustmann Rotation and Normal Forest Convergence. 2000.
W:244. PIRJA HEISKANEN: An Application of a Constraint Proposal Method in a Transboundary Air Pollution Negotiation. 2000.
W:245. SAMI TORSTILA: What Determines the Distribution of Fees within the IPO Syndicate? 2000.
W:246. MARJA-LIISA KINTURI – LIISA UUSITALO: Advertising in Finland – A Overview. 2000.

W:247. JUHANI VAIVIO: Accounting and Knowledge Creation: The Case for ”Provocative” Management Accounting. 2000.
W:248. ARTO LAHTI: Creative Entrepreneurship and New Economy. The Challenge of the Nordic It Cluster. 2000.
W:249. MATTI LISKI – PETER M. KORT – ANDREAS NOVAK: Increasing Returns and Cycles in Fishing. 2000.
W:250. MATTI LISKI: Thin versus Thick CO2 Market. (running head: CO2 Market). 2000.
W:251. MATTI LISKI: Taxing Average Emissions to Overcome the Shutdown Problem. 2000.
W:252. MATTI LISKI – JUHA VIRRANKOSKI: Project-based CO2 Trading. 2000. ISBN 951-791-467-9.
W:253. SEPPO SALO – OLLI TAHVONEN: On Equilibrium Cycles and Normal Forests in Vintage Models for Forest Resources. 2000. ISBN 951-791-468-7.
W:254. TAPANI KYKKÄNEN: Johdon yritysostot Suomessa. 2000. ISBN 951-791-470-9.
W:255. KLAUS KULTTI: Comparison of Auctions and Posted Prices in a Finite Random Matching Model. 2000. ISBN 951-791-476-8.
W:256. KLAUS KULTTI – TUOMAS TAKALO: A Search Model of Intellectual Property Protection. 2000. ISBN 951-791-477-6.
W:257. MIIA KANKAANPÄÄ – HANNU SERISTÖ: Development of Services in Industrial Markets: A Process Driven by Customer Value. 2000. ISBN 951-791-479-2.
W:258. MATTI TUOMINEN – ARTO RAJALA – KRISTIAN MÖLLER – MAI ANTTILA: Moderat-ing Effects of Internal and External Strategic Postures on the Adaptability - Innovativeness Interplay. 2000. ISBN 951-791-481-4.
W:259. SEPPO SALO – OLLI TAHVONEN: On the Economics of Forest Vintages. 2000. ISBN 951-791-482-2.
W:260. JUSSI KARHUNEN – MATTI KELOHARJU: Shareownership in Finland 2000. 2000. ISBN 951-791-483-0.
W:261. LEENA KERKELÄ – JANNE NIEMI – RISTO VAITTINEN: Renegotiating the Lome Convention - Trade Policy Schemes and Their Effects for African Regions. 2000. ISBN 951-791-485-7.
W:262. MATTI LISKI: Should ERUs be Tradable? 2000. ISBN 951-791-486-5.
W:263. MARKKU KAUSTIA: Can Loss Aversion Move the Market? Evidence from IPO Trading Volume. 2000. ISBN 951-791-489-X.
W:264. OTTO TOIVANEN – PETRI NIININEN: Investment, R&D, Subsidies and Credit Constraints. 2000. ISBN 951-791-490-3.
W:265. ARI HYYTINEN – OTTO TOIVANEN: Vertical Differentiation, Asymmetric information and Endogenous Bank Screening. 2000. ISBN 951-791-491-X.

W:266. MARJA-LIISA KAKKURI-KNUUTTILA – EERO VAARA: Reconciliation of Modernist and Postmodernist Standpoints in Management Studies: Towards Reflective Realism? 2000.
ISBN 951-791-493-8.
W:267. JANNE TIENARI – EERO VAARA – RISTO SÄNTTI: Pride and Prejudice. Construction of Metaphors in a Merger Acros National Boundaries. 2000. ISBN 951-791-494-6.
W:268. EERO VAARA: Towards Critical International Business Studies? Three Perspectives on Inter-national Mergers and Acquisitions. 2000. ISBN 951-791-495-4.
W:269. MIRJALIISA CHARLES – HELENA KANGASHARJU (Eds.): New Orientations and Devel-opments. Business Communication Research and Teaching Working Papers. 2000. ISBN 951-791-496-2.
W:270. LAURENS CHERCHYE – TIMO KUOSMANEN – THIERRY POST: Why Convexify ? An Assessment of Convexity Axioms in DEA. 2000. ISBN 951-791-499-7.
W:271. SEPPO SALO – OLLI TAHVONEN: Economics of Forest Vintages with Multiple Land Classes. 2000. ISBN 951-791-500-4.
W:272. LASSE NIEMI: Tilintarkastusmarkkinoiden rakenne ja toiminta. 2000. ISBN 951-791-503-9.
W:273. SAMI JÄRVINEN – JANNE SAARIKKO: Suomalaisten piensijoittajien käsityksiä indeksilainoista. 2000. ISBN 951-791-504-7.
W:274. ERLING ANDERSEN – CEES ROOS – TAMÁS TERLAKY: On Implementing a Primal-dual Interior-point Method for Conic Quadratic Optimization. 2000. ISBN 951-791-509-8.
W:275. JOHANNA MOISANDER – LIISA UUSITALO: Motivation and Social Contingency of Environmental Consumer Choices. 2001. ISBN 951-791-516-0.
W:276. MIRJAMI FAGERSTRÖM: Suhdemarkkinoinnin hyödyntäminen kuluttajatuotteiden mark-kinoinnissa. Kuluttajasuhdemarkkinoinnin tutkimuksen kirjallisuusanalyysi. 2001.
ISBN 951-791-518-7.
W:277. JUHANI VAIVIO: “Provocative” Non-Financial Measures in Knowledge Creation. 2001. ISBN 951-791-603-5.
W:278. HANNU KIVIJÄRVI – MARKKU KUULA: A Finnish Forest Sector Model. 2001. ISBN 951-791-606-X.
W:279. VIRPI KRISTIINA TUUNAINEN (Edit.): Proceedings of The Third Electronic GroceryShopping (EGS) Workshop. Brisbane, Australia, December 13, 2000. In Connection with The 21st International Conference on Information Systems (ICIS). 2001.
ISBN 951-791-609-4.
W:280. JUSSI V. KOIVISTO: Conceptualising Cross-Culturall Organisations: Cultural Crossing with its Locus, Modus And Focus. 2001. ISBN 951-791-612-4.
W:281. JUKKA KALLIO – TIMO SAARINEN – MARKKU TINNILÄ: Efficient Change Strategies-matching Drivers and Tracers in Change Projects. 2001. ISBN 951-791-614-0.
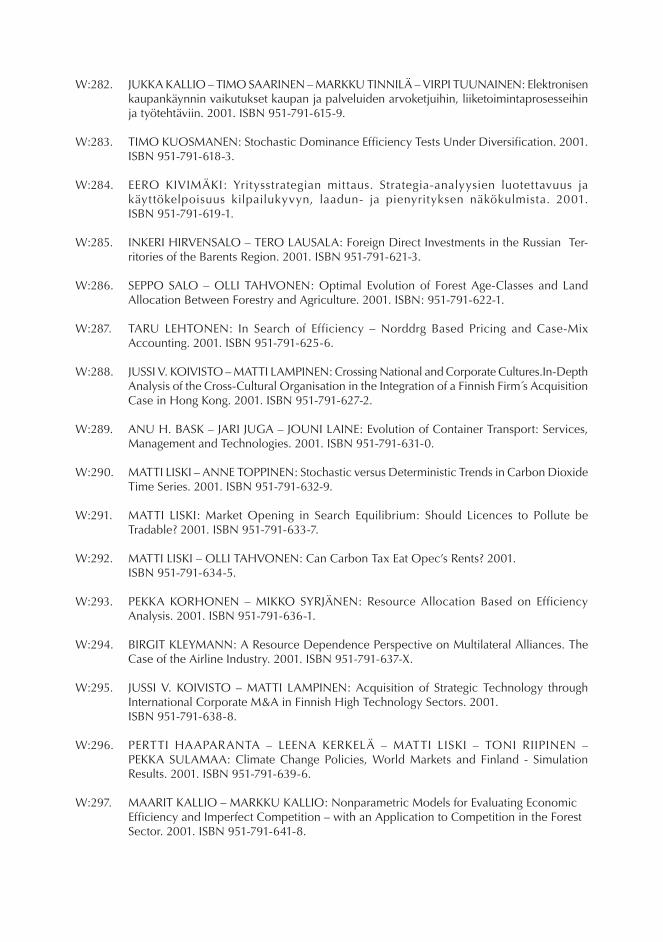
W:282. JUKKA KALLIO – TIMO SAARINEN – MARKKU TINNILÄ – VIRPI TUUNAINEN: Elektronisen kaupankäynnin vaikutukset kaupan ja palveluiden arvoketjuihin, liiketoimintaprosesseihin ja työtehtäviin. 2001. ISBN 951-791-615-9.
W:283. TIMO KUOSMANEN: Stochastic Dominance Efficiency Tests Under Diversification. 2001. ISBN 951-791-618-3.
W:284. EERO KIVIMÄKI: Yritysstrategian mittaus. Strategia-analyysien luotettavuus ja käyttökelpoisuus kilpailukyvyn, laadun- ja pienyrityksen näkökulmista. 2001. ISBN 951-791-619-1.
W:285. INKERI HIRVENSALO – TERO LAUSALA: Foreign Direct Investments in the Russian Ter-ritories of the Barents Region. 2001. ISBN 951-791-621-3.
W:286. SEPPO SALO – OLLI TAHVONEN: Optimal Evolution of Forest Age-Classes and Land Allocation Between Forestry and Agriculture. 2001. ISBN: 951-791-622-1.
W:287. TARU LEHTONEN: In Search of Efficiency – Norddrg Based Pricing and Case-Mix Accounting. 2001. ISBN 951-791-625-6.
W:288. JUSSI V. KOIVISTO – MATTI LAMPINEN: Crossing National and Corporate Cultures.In-Depth Analysis of the Cross-Cultural Organisation in the Integration of a Finnish Firm s Acquisition Case in Hong Kong. 2001. ISBN 951-791-627-2.
W:289. ANU H. BASK – JARI JUGA – JOUNI LAINE: Evolution of Container Transport: Services, Management and Technologies. 2001. ISBN 951-791-631-0.
W:290. MATTI LISKI – ANNE TOPPINEN: Stochastic versus Deterministic Trends in Carbon Dioxide Time Series. 2001. ISBN 951-791-632-9.
W:291. MATTI LISKI: Market Opening in Search Equilibrium: Should Licences to Pollute be Tradable? 2001. ISBN 951-791-633-7.
W:292. MATTI LISKI – OLLI TAHVONEN: Can Carbon Tax Eat Opec’s Rents? 2001. ISBN 951-791-634-5.
W:293. PEKKA KORHONEN – MIKKO SYRJÄNEN: Resource Allocation Based on Efficiency Analysis. 2001. ISBN 951-791-636-1.
W:294. BIRGIT KLEYMANN: A Resource Dependence Perspective on Multilateral Alliances. The Case of the Airline Industry. 2001. ISBN 951-791-637-X.
W:295. JUSSI V. KOIVISTO – MATTI LAMPINEN: Acquisition of Strategic Technology through International Corporate M&A in Finnish High Technology Sectors. 2001.
ISBN 951-791-638-8.
W:296. PERTTI HAAPARANTA – LEENA KERKELÄ – MATTI LISKI – TONI RIIPINEN – PEKKA SULAMAA: Climate Change Policies, World Markets and Finland - Simulation Results. 2001. ISBN 951-791-639-6.
W:297. MAARIT KALLIO – MARKKU KALLIO: Nonparametric Models for Evaluating Economic Efficiency and Imperfect Competition – with an Application to Competition in the Forest Sector. 2001. ISBN 951-791-641-8.

W:298. TOMI DAHLBERG – JENS HØRLÜCK: Internet Hype Overreaction - And What We Can Learn from it. 2001. ISBN 951-791-642-6.
W:299. ANTTI SÄÄSKILAHTI: Epäjatkuvuuden hallinta. 2001. ISBN 951-791-644-2.
W:300. VELI-PEKKA HEIKKINEN: Timber Harvesting Decisions Based On Multi-period Stochastic Portfolio Optimisation. 2001. ISBN 951-791-645-0.
W:301. PEKKA KORHONEN – SARI RYTÖKOSKI – MIKKO SYRJÄNEN: Multiple Objective Approach as an Alternative to Radial Projection in DEA. 2001. ISBN 951-791-654-X.
W:302. JUSSI KARHUNEN: What Determines Actual Open Market Repurchases? Evidence from Finland. 2001. ISBN 951-791-658-2.
W:303. JUSSI KARHUNEN: Who Accepts Tender Offers? 2001. ISBN 951-791-659-0.
W:304. PETRI BÖCKERMAN – KARI HÄMÄLÄINEN – MIKA MALIRANTA: Explaining Regional Job and Worker Flows. 2002. ISBN 951-791.662-0.
W:305. PEKKA KORHONEN – MIKKO SYRJÄNEN: Evaluation of Cost Efficiency in Finnish Electricity Distribution. 2002. ISBN 951-791-663-9.
W:306. SATU NURMI: The Determinants of Plant Survival in Finnish Manufacturing. 2002. ISBN 951-791-665-5.
W:307. JUSSI KARHUNEN: Taking Stock of Themselves. An Analysis of the Motives and the Market Reaction in Finnish Share Repurchase Programs 2002. ISBN 951-791-666-3.
W:308. PEKKA ILMAKUNNAS – HANNA PESOLA: Matching Functions and Efficiency Analysis. 2002. ISBN 951-791-671-X.
W:309. MARKKU SÄÄKSJÄRVI: Software Application Platforms: From Product Architecture to Integrated Application Strategy. 2002. ISBN 951-791-672-8.
W:310. MILLA HUURROS – HANNU SERISTÖ: Alliancing for Mobile Commerce: Convergence of Financial Institutions and Mobile Operators. 2002. ISBN 951-791-673-6.
W:311. ANSSI ÖÖRNI: Objectives of Search and Combination of Information Channels in Electronic Consumer Markets: An Explorative Study. 2002. ISBN 951-791-675-2.
W:312. ANSSI ÖÖRNI: Consumer Search in Electronic Markets: Experimental Analysis of Travel Services. 2002. ISBN 951-791-676-0.
W:313. ANSSI ÖÖRNI: Dominant Search Pattern in Electronic Markets: Simultaneous or Sequential Search. 2002. ISBN 951-791-677-9.
W:314. ANSSI ÖÖRNI: The Amount of Search in Electronic Consumer Markets. 2002. ISBN 951-791-678-7.
W:315. KLAUS KULTTI – TUOMAS TAKALO – TANJA TANAYAMA: R&d Spillovers and Information Exchange: A Case Study. 2002. ISBN 951-791-681-7.
W:316. OLLI TAHVONEN: Timber Production v.s. Old Growth Conservation with Endogenous Prices and Forest Age Classes. 2002. ISBN 951-791-691-4.

W:317. KLAUS KULTTI – JUHA VIRRANKOSKI: Price Distribution in a Symmetric Economy. 2002. ISBN 951-791-697-3.
W:318. KLAUS KULTTI – TONI RIIPINEN: Multilateral and Bilateral Meetings with Production Heterogeneity. 2002. ISBN 951-791-698-1.
W:319. MARKKU KAUSTIA: Psychological Reference Levels and IPO Stock Returns. 2002. ISBN 951-791-699-X.
W:320. MERVI LINDQVIST: Possible Research Issues in Management and Control of New Economy Companies. 2002. ISBN 951-791-701-5.
W:321. MARKO LINDROOS: Coalitions in Fisheries. 2002. ISBN 951-791-702-3.
W:322. MIKKO SYRJÄNEN: Non-discretionary and Discretionary Factors and Scale in Data Envel-opment Analysis. 2002. ISBN 951-791-705-8.
W:323. KLAUS KULTTI – HANNU VARTIAINEN: VonNeumann-Morgenstern Solution to the Cake Division Problem. 2002. ISBN 951-791-708-2.
W:324. TOM LAHTI: A Review of the Principal-agent Theory and the Theory of Incomplete Contracts: An Examination of the Venture Capital Context. 2002. ISBN 951-791-709-0.
W:325. KRISTIAN MÖLLER – PEKKA TÖRRÖNEN: Business Suppliers’ Value-Creation Potential: A Capability-based Analysis. 2002. ISBN 951-791-710-4.
W:326. KRISTIAN MÖLLER – ARTO RAJALA – SENJA SVAHN: Strategic Business Nets – Their Types and Management. 2002. ISBN 951-791-711-2.
W:327. KRISTIAN MÖLLER – SENJA SVAHN – ARTO RAJALA: Network Management as a Set of Dynamic Capabilities. 2002. ISBN 951-791-712-0.
W:328. PANU KALMI: Employee Ownership and Degeneration. Evidence from Estonian case studies. 2002. ISBN 951-791-713-9.
W:329. ANNELI NORDBERG: Yrittäjyys, johtajuus ja johtaminen – uuden talouden innovatiivisia haasteita. 2002. ISBN 951-791-721-X.
W:330. LEENA LOUHIALA-SALMINEN: Communication and language use in merged corporations: Cases Stora Enso and Nordea. 2002. ISBN 951-791-722-8.
W:331. TOMMI KASURINEN: Conceptualising the Encoding Process Related to Institutionalisation in Organisations. From Key Performance Indicator Scorecard to a Strategic Balanced Scorecard. 2002. ISBN 951-791-723-6.
W:332. PEKKA KORHONEN – HELENA TOPDAGI: Performance of the AHP in Comparison of Gains and Losses. 2002. ISBN 951-791-724-4.
W:333. TARJA JORO – PEKKA KORHONEN – STANLEY ZIONTS: An Interactive Approach to ImproveEstimates of Value Efficiency in Data Envelopment Analysis. 2002. ISBN 951-791-725-2.
W:334. JUHA-PEKKA TOLVANEN – JEFF GRAY – MATTI ROSSI (edit.): Proceedings of the Second- Domain Specific Modeling Languages Workshop. 2002. ISBN 951-791-726-0.

Y-SARJA: HELSINKI SCHOOL OF ECONOMICS. CENTRE FOR INTERNATIONAL BUSINESS RESEARCH. CIBR RESEARCH PAPERS. ISSN 1237-394X.
Y:6. MIKA GABRIELSSON – V. H. MANEK KIRPALANI – REIJO LUOSTARINEN: Multiple Chan-nel Strategies in the European PC Industry. 2001. ISBN 951-791-628-0.
Y:7. ZUHAIR AL-OBAIDI – MIKA GABRIELSSON: Multiple Sales Channel Strategies in Export Marketing of High Tech SMEs. 2002. ISBN 951-791-703-1.
Z-SARJA: HELSINKI SCHOOL OF ECONOMICS.CENTRE FOR INTERNATIONAL BUSINESS RESEARCH. CIBR WORKING PAPERS. ISSN 1235-3931.
Z:8. CLARA CARDONE-RIPORTELLA - MARÍA JOSÉ ÁLVAREZ-GIL – NORA LADO-COUSTÉ - VIVECA SASI: Going International: Are Financial Service Companies Following Manufac-turing Firms? The Case of Finnish and Spanish Banks and Insurance Companies. 2000. ISBN 951-791-454-7.
Z:9. V.H. MANEK KIRPALANI – MIKA GABRIELSSON: Worldwide Evolution of Channels Policy. 2002. ISBN 951-791-704-X.
Kaikkia Helsingin kauppakorkeakoulun julkaisusarjassa ilmestyneitä julkaisuja voi tilata osoitteella:
KY-Palvelu Oy Helsingin kauppakorkeakouluKirjakauppa JulkaisutoimittajaRuneberginkatu 14-16 PL 121000100 Helsinki 00101 HelsinkiPuh. (09) 4313 8310, fax (09) 495 617 Puh. (09) 4313 8579, fax (09) 4313 8305Sähköposti: [email protected] Sähköposti: [email protected]
All the publications can be ordered from
Helsinki School of EconomicsPublications officerP.O.Box 1210FIN-00101 HelsinkiPhone +358-9-4313 8579, fax +358-9-4313 8305 E-mail: [email protected]


![[DevTestday] Azure devtestlab - Mikael Krief](https://img.pdfslide.us/doc/110x75/58ee50361a28ab75228b456b/devtestday-azure-devtestlab-mikael-krief.jpg)