Embed Size (px)
Citation preview

1
Mihovil Andelinovic
Faculty of Economics and Business Zagreb, Croatia
Ivana Vucemil
Faculty of Economics and Business Zagreb, Croatia
Comparative Fundamental Analysis of Stock Market Indices in Ex-Yugoslavia
Countries
Abstract:
Comparative fundamental analysis of stock market indices in former Yugoslavia in 2011 is
conducted in this paper. The comparison is conducted on the basis of the fundamental indicators
which have been calculated from the financial reports of the companies that are part of the market
index. Fundamental analysis was performed, initially, by making fundamental analysis of each
company’s stock in the index and then, based on the weight of the company’s stock in the market
index, fundamental analysis of the index is performed. For the purpose of thorough comparative
analysis of the markets in Croatia, Slovenia, Serbia, Bosnia and Herzegovina, Montenegro and
Macedonia, the fundamental indicators of investment, liquidity and profitability, which are
considered to give a relevant insight of the stock market, were calculated.
Key Words: Fundamental analysis, Stock exchange, Ex – Yugoslavia, Stock index, Comparative
analysis, Investment decision.
1. INTRODUCTION
Investment decision could be bring on the various bases. Economic theory and practice recognize
plenty of different models which function is to bring quality decision wheter to invest in company’s
stock and/or stock market in analized country, or not. Several authors of such models even won the
Nobel Prize, many analysts were very successful in practice, and many analysts, including some
Nobel Prize winners, failed to recognize market trends and went bankrupt.
Fundamental analysis is one of the most common tools to compare the indicators of different
companies and/or different markets and to bring the investment decision. This paper studies
comparative fundamental analysis of stock market indices in former Yugoslavia in 2011. The aim
of the paper is to compare the stock markets in the countries of former Yugoslavia on the basis of
the fundamental indicators which have been calculated from the financial reports of the companies
that are part of the market index.
Fundamental analysis is performed initially by making fundamental analysis of each company’s
stock in the index and then, based on the weight of the company’s stock in the market index, the
2013 International Journal of Economic Sciences Vol. II (No. 1)
The International Institute of Social and Economic Sciences ISSN 1804-9796
2
fundamental analysis of the index is performed. Research is conducted in following countries:
Croatia, Slovenia, Serbia, Bosnia and Herzegovina, Montenegro and Macedonia. Fundamental
indicators of investment, liquidity and profitability, which are considered to give a relevant
comparison basis, are calculated.
2. STOCK MARKETS IN THE COUNTRIES OF FORMER YUGOSLAVIA
According to Orsag (2003) stronger development of the capital markets in analyzed countries
begins with the exit from the socialism into capitalism. This paper brings an analysis of stock
markets in former Yugoslavia and respective stock indices.
REPUBLIC OF CROATIA - ZAGREB STOCK EXCHANGE
Stock exchange in Croatia was founded in 1991, when 25 banks and 2 insurance companies set
Zagreb Stock Exchange (ZSE) as a central place for stock trading in Republic of Croatia. Members
of ZSE are private brokerage companies and banks. Securities (stocks and bonds) are traded on the
ZSE via electronic trading system (ZSE, 2012).
Brokerage companies that are Exchange members are connected with the Exchange head office via
special telecommunication lines; they enter their sell and buy orders and conclude transactions with
other brokers directly from their offices. This means that the physical place where securities are
traded (traditional trading floor) no longer exists, but rather trading takes place among electronically
connected traders. All member brokers have access to the trading system in real time (with not time
delay/shift) so that they can enjoy equal status with respect to the receipt of information on the
current securities offer at exactly the same time.
According to ZSE (2012) the Exchange is open for trading between 10 a.m. and 4. p.m. every day,
with the exception of holidays, and trading reports with daily stock prices are available to any
interested party in daily newspapers, from specialist financial data vendors as well as on the
Exchange's website and via a specialized exchange information distribution system, named the ZSE
Monitor.
The ZSE Monitor is a system that distributes exchange-related information in real time. It enables
users to access the information on total trade and to monitor current price movements with no delay.
ZSE had used different trading platforms and the new trading platform, NASDAQ OMX's X-
Stream, was launched in autumn 2007.
Stocks trading in ZSE are possible using Regulated Market and Multilateral Trading
Facility (MTF). Regulated market is a trading segment managed by the Zagreb Stock Exchange in
which it is possible to trade listed instruments. As stated by ZSE (2012) the principal difference
between the regulated market and the MTF is in the level of transparency. Transparency involves
the submission of all the information stipulated by law and Exchange Rules concerning the issuer
and the listed financial instruments which may affect the price of the respective instruments.
Regulated market is divided into the following segments:
Prime Market
Official Market
Regular Market
Prime Market is the most demanding market segment with regard to the requirements set before the
issuer, especially in relation to transparency. Regular Market commits the issuer to submit only a
minimum of information stipulated by the Capital Market Act while the Exchange Rules stipulate
additional requirements applicable to the Official and the Prime Market. In addition, when listing
instruments on the regulated market, it is generally necessary to prepare a Prospectus, aimed at
providing the information which may be required for the purpose of instrument evaluation by
investors. Currently, stocks of the 21 stock companies are listed on official market; while stocks of
the 45 stock companies are on regular market.
In accordance with the provisions of the Capital Market Act, the MTF does not have the same status
as the regulated market. In view of lower requirements set before the issuer with regard to
2013 International Journal of Economic Sciences Vol. II (No. 1)
The International Institute of Social and Economic Sciences ISSN 1804-9796
3
the instruments traded on the MTF, the risk of investment into such instruments may be higher than
the risk of investing into the instruments traded on the regulated market. Nevertheless, there is a
minimum of publicly available information on the instruments admitted to trading on the MTF to
enable investors to take well-grounded investment decisions.
The Zagreb Stock Exchange’s MTF is divided into:
Domestic MTF
International MTF
Domestic MTF serves for admission to trading of the instruments whose issuers have a registered
place of business in Croatia, with no obligation of a parallel listing on some other market.
The International MTF serves for admission to trading of the instruments whose issuers are
domiciled in other countries, where the instrument to be admitted to trading must be listed on an
exchange or a regulated market of the respective country. (ZSE 2012)
Basic information to be submitted by the issuers whose instruments trade on the MTF:
invitation to the company’s AGM
annual financial statement
information on capital reduction or capital increase
2.1. Status Changes of the Issuer
STOCK INDICES OF ZAGREB STOCK EXCHANGE In Republic of Croatia exchange indices are differentiated, of which two are stock indices:
CROBEX: it is official ZSE stock index published on September 1, 1997, with base value
1000. Index is weighted by free float adjusted market capitalization, where the weight of any
individual issuer in index is limited to 10% of the index capitalization. If a stock was not
traded on the given day, the previous last price is used (ZSE, 2012).
Stocks are ranked by the market share and the top 25 stocks are selected to be included into
the CROBEX index. Stocks which were traded on more then 90% of the available trading
days in the previous six month period are qualified for CROBEX selection.
In the selection process stocks are ranked by the following two criteria:
1. Free float market capitalization
2. Order book turnover in proceeding 6 month period
According to ZSE (2012) following is not considerd as free float:
Ownership stakes exceeding 5%
Treasury stocks.
CROBEX10: it is an index which was published on September 7, 2009, with base value 1000.
CROBEX10 is weighted by free float adjusted market capitalization, where the weight of any
individual issuer in index is limited to 20% of the index capitalization. If a stock was not traded
on the given day, the previous last price is used. CROBEX10 contains 10 stocks with the
highest free float adjusted market capitalization and trade, included in CROBEX index.
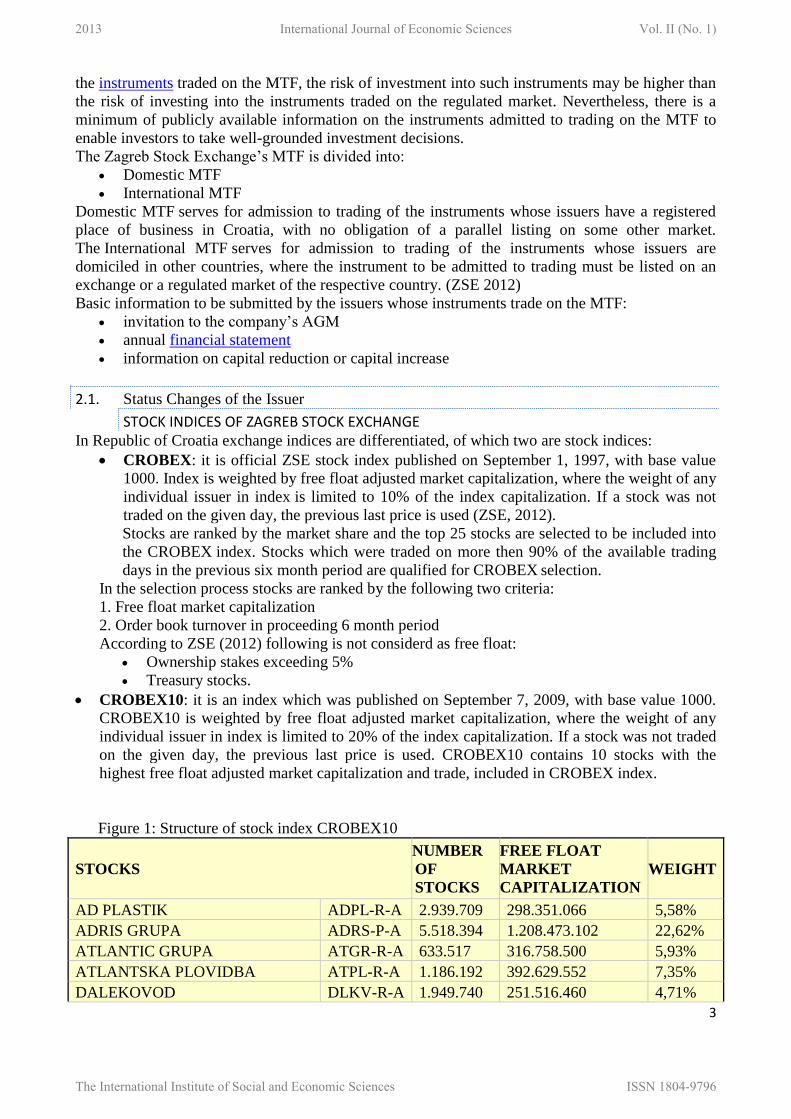
Figure 1: Structure of stock index CROBEX10
STOCKS
NUMBER
OF
STOCKS
FREE FLOAT
MARKET
CAPITALIZATION
WEIGHT
AD PLASTIK ADPL-R-A 2.939.709 298.351.066 5,58%
ADRIS GRUPA ADRS-P-A 5.518.394 1.208.473.102 22,62%
ATLANTIC GRUPA ATGR-R-A 633.517 316.758.500 5,93%
ATLANTSKA PLOVIDBA ATPL-R-A 1.186.192 392.629.552 7,35%
DALEKOVOD DLKV-R-A 1.949.740 251.516.460 4,71%
2013 International Journal of Economic Sciences Vol. II (No. 1)
The International Institute of Social and Economic Sciences ISSN 1804-9796
4
ERICSSON NIKOLA TESLA ERNT-R-A 599.243 647.182.440 12,11%
HRVATSKI TELEKOM HT-R-A 4.610.281 1.115.688.002 20,88%
INGRA INGR-R-A 12.867.940 86.343.877 1,62%
KONČAR-ELEKTROINDUSTRIJA KOEI-R-A 900.242 462.724.388 8,66%
PODRAVKA PODR-R-A 2.439.001 563.409.231 10,54%
Source: www.zse.hr
2.2. REPUBLIC OF SERBIA – Begrade Stock Exchange
Belgrade Stock Exchange has been in operation in the Republic of Serbia since January, 1985. It
performs activities of organizing securities and financial derivatives trade, and includes following:
1. organising securities public offering and connecting securities demand and suply
2. publishing information about securities demand, suply, market price and other significant
data
3. establishing and publishing lists of securities
4. other acitivities in accordance with Law on Capital Market.
As proposed by Beogradska berza (2012) the Belgrade Stock Exchange indices were created for the
purpose of improving the information process and the transparency and comparison of the market
data. The Exchange currently maintains the following two indices:
BELEXline: it is general, “benchmark” index of the Belgrade Stock Exchange, calculated at
the end of a trading day
BELEX15: it is set as leading index of the Belgrade Stock Exchange, describes the
movement of prices of the most liquid Serbian stocks and is calculated in real time.
Stock market is divided on Regulated market and Multilateral Trading Facility (MTF). Regulated
market consists of Prime Listing, Standard Listing and Open Market. Prime Listing contains stocks
of five stock companies and represents first quotation, i.e. quotation A. Standard Listing, i.e.
quotation B, contains stocks of three stock companies, while 217 stock companies are active on
Open Market. The biggest number of stock companies, 963, does business on MTF. With new
Rules on Listing and Quotation, conditions for companies to become the most liquid were made
stricter. Necessary minimum of equity and securities issuers has doubled and now is 20 million
euros. For companies to come to quotation A the time of being active remains the same, three years.
In free trade there have to be at least 25 % of total issued stocks or the equity has to be at least 10
million euros owned by at least 500 shareholders. That is twice the previous stock trading.
Conditions to come to quotation B remain the same, which means the least amount of total equity
has to to be four million euros but being active as a company is reduced from three to two years.
REPUBLIC OF MAKEDONIA – MAKEDONIAN STOCK EXCHANGE
Macedonian Stock Exchange began with work in 1995. Until then the Republic of Macedonia had
never before had a stock exchange. The total number of the initial founders of the Macedonian
Stock Exchange was 19. Although the Exchange was open for trading twice a week (Tuesdays and
Thursdays) in the beginning, it has developed by time, mostly because of the international
cooperation and foreign investments. The most successful year for Macedonian Stock Exchange
was 2007, when it realized record turnover of 41, 7 billions euros and MBI 10 index achieved its
biggest value. According to Macedonian Stock Exchange (2012) one of the most important events
for the year 2007 was signing the Memorandum of partnership between the exchanges in Belgrade,
Skopje, Zagreb and Ljubljana. The partnership primarily aims to contribute towards further
developement the regional and national markets and thus serve the needs of major regional and
international market players. On the Exchange, trading is active on two markets, Official and
Regulated market. Macedonian Stock Exchange contains three indices, of which two refer to stocks:
2013 International Journal of Economic Sciences Vol. II (No. 1)
The International Institute of Social and Economic Sciences ISSN 1804-9796
5
MBID is a stock exchange index that was cretaed in 2007 with based value 10,000. It is a
price index, which elements are being chosen according to the following criteria; number of
trading days and turnover in the period between two revisions of the index.
2.3. MBI10: it is a stock exchange index that was introduced in 2005 with based value 1000. It
represents substitution for former index MBI. It is consisted of up to 10 listed ordinary
stocks, chosen by the Stock Exchange Index Commission, according to the criteria from the
Methodology. REPUBLIC SLOVENIA – Ljubljana Stock Exchange
Ljubljana Stock Exchange was founded in August 1924. As stated by BORZA (2012) upon the
opening of the Exchange, 27 securities were traded, the majority of which were state securities, and
the rest were securities of Slovenian financial institutions and industrial enterprises. After the World
War II the Exchange was banned by decree and started working again after 50 years, in 1988. There
are two stock indices that give information about market position, stock companies and market
fluctuations:
LJSE Composite: it represents general market index including all the stocks listed on the
market. It gives general market overview. Its main purpose is to provide information about
general performances of Slovenian regulated stock market.
The blue-chip SBI TOP index: it is an index which measures the performance of the most
liquid and highly capitalized stocks on the Ljubljana Stock Exchange Market. It was
introduced in 2006 with based value 1000. According to BORZA (2012) the purpose of SBI
TOP is to follow the performance of LJSE’s most important equities and thus serve as
underlying for advanced financial products. Inclusion of stocks into the index increases their
reputation and creates their profile, which results with longer-term liquidity. To be included
in SBITOP index, stock has to fullfil fllowing conditions:
o Minimum free float market capitalization – 50 million euros
o Minimum average daily trading value – 50,000 euros
2.4. REPUBLIC OF MONTENEGRO – Montenegro Stock Exchange
As stated by MONTENEGRO BERZA (2012) Montenegro Stock Exchange was established in June
1993, pursuant to the Law on Money and the Capital Market. The first shareholders of the Stock
Exchange were the Republic of Montenegro and four banks from Montenegro. Since September
2006 the Exchange became completely private ownership, which means that Montenegro
government sold 5% of its ownership for 1,100 euros per share or five times more than nominal
value, which is 1.4 million euros of market capitalization. On December 31, 2010, the two
Montenegrin stock exchanges were integrated, through the merge of the New Securities Exchange
of Montenegro to the Montenegro Stock Exchange.
According to MONTENEGRO BERZA (2012) market on the Montenegro Stock Exchange consists
of Official market and Free market. Official market is a prestigious segment of the market. In order
for issuers to be able to list on the official market, in addition to the general requirements, they must
meet certain criteria regarding the amount of capital, number of shareholders, financial condition
etc. Official market consists of A i B list, which have their extra conditions to fullfil depending on
the list. Free market includes all other securities not included on the official market and trading in
securities that are allocated to the free market is performed by the method of continuous trading.
MONEX20 is Montenegro Stock Exchange index. The Exchange uses market liquidity indicator
while including stock companies into the index. Therefore, index is formed with the most liquid
stocks on market in its structure. According to contemporary stock markets, free float capitalization
was introduced as a base to determine stocks proportion within the index.
2013 International Journal of Economic Sciences Vol. II (No. 1)
The International Institute of Social and Economic Sciences ISSN 1804-9796
6
2.5. REPUBLIC OF BOSNIA AND HERZEGOVINA – Sarajevo and Banja Luka Stock Exchange
2.5.1. Sarajevo Stock Exchange
Sarajevo Stock Exchange was established in September 2001 by eight brokerage houses and it
started trading in 2002. Trading can be done on Official and Free market. As proposed by SASE
(2012) the Official market is the place where “blue-chips”, the highest quality stocks are beeing
traded. In order to be listed at this market segment, an issuer has to meet certain requirements:
Minimum size of capital - 4.000.000 KM
Minimum size of class of stocks - 2.000.000 KM
Listing on the Official market is not just a prestige; it includes many privileges for the issuer. If the
company operates in a transparent and successful way, then investors have confidence in their
management and company has the option of issuing new securities to finance their upcoming
projects. Other benefits for the issuer include less possibility for manipulations of price of their
stocks. If security is listed on the Official market, trading is not possible if the price differs more
than 10% in regards to the last trading day's official price.
Free market consists of primary, secondary and tertiary markets. Primary market consists of 30
most traded stocks that are not listed on the Official market, which satisfy their obligations in
regards to the regulations of the Securities Comission on disclosing the financial reports. Secondary
market consists of the issuers that are not listed on the Official market, do not meet the conditions
for the Primary Free market and are not in the bankruptcy proceedings. Tertiary market consists of
issuers that have open stock company status and do not publish periodical financial reports
regularly. There are three stock indices active on the Exchange:
SASX-10: it is the main index on the Sarajevo Stock Exchange and it depicts the price
movement of the top 10 issuers on the Exchange (excluding investment funds) ranked by
market capitalization and frequency of trading. The index is not limited for one segment
only and issuers from Official and Free market can be included into the index. SASX-10 is
price, weighted index, where the maximum influence of an individual issuer is capped at
20%.
SASX-30: it is price index and it depicts the price movement of the issuers on the Primary
Free market, which is reserved for the most liquid issuers from the Free market. The index is
an unweighted index, where all the consistents have the same influence on the index
movement (SASE, 2012). To be included in the index, an issuer must be listed on the
Primary Free market. The index can include maximum 30 stock companies within its
structure.
BATX: it is an index that observes price movements six largest and most liquidity
companies from Sarajevo and Banja Luka Stock Exchange, which allows this index to serve
as the basis for the issuance of structured products and standardized derivatives. Including
the largest and the most liquid stocks of the Bosnian and Herzegovinian stock market,
BATX index is a tradable/investible index, i.e. it is a basis for indices products. Emission of
new products, based on this index, can significantly increase the liquidity of BH capital
markets.
a) 2.7.2. Banja luka stock exchange
Banja Luka Stock Exchange was founded in 2001 and the first trading was done following year.
According to Banja Luka Stock Exchange (2012) the trading methods that the Exchange uses are
continuous trading and single price auction. Trading on Banja Luka Stock Exchange is performed
on Official and Free market.
To be listed on the Official market stocks have to fullfil general criteria:
They can be used for organized trading
They need to be funded completely
They need to be assignable unlimitedly
2013 International Journal of Economic Sciences Vol. II (No. 1)
The International Institute of Social and Economic Sciences ISSN 1804-9796
7
They need to be issued in immaterial form
In accordance with A and B list stock has to fullfil additional conditions depending on the list.
Stocks listed on the Free market fullfil following general criteria:
They need to be funded completely
They need to be assignable unlimitedly
Including fee need to be paid
Inclusion of stocks on the Free market is performed by issuer request. There were 780 issuers
registered in 2010.
BIRS, the stock index of Serbian Republic, which is Bosnian and Herzegovonian entity, was
formed in 2004. It represents price and weighted index with maximum proportion of 25% per
issuer. Its based value is 1000 and in the begining 11 stock companies were included into the index.
Moreover, BATX index was introduced, which was already explained within the Sarajevo Stock
Exchange.
3. FUNDAMENTAL ANALYSIS OF STOCK MARKET INDICES Fundamental analysis implies thorough analysis of companies’ financial reports and connects with
complete economic analysis of the company’s management capabilities, economic sector the
company is in, and total micro and macroeconomic environment in which the company exists
(Žager, et al., 2008). The aim of the fundamental analysis is to detect stocks which are still
underestimated according to the criteria above. Its task is to recognize positive qualities of the
company analysed, as well as its weaknesses, and to acquire impression of the company’s value, its
assets and business processes. Evaluation of every company is done according to estimated value
of its future gain. Fundamental analysis aims to the future and it stresses company’s business
aspects critical for its existance, primarily security and efficacy. Fundamental indicators are related
to assets structure and their financing, efficacy, liquidity and profitability. Analysis using
fundamental indicators is one of the best known and most often used financial analysis and can give
a valuable insight into the company and point out its strengths and weaknesses. This type of
analysis represents the first part of financial analysis. Connecting items from one or two reports,
respectively bookkeeping and marketing data, shows connection between financial accounts and
enables evaluation of financial position of the company.
Žager, et al. (2008) found several groups of fundamental financial indicators:
A. Business security indicators
(a) Liquidity indicators
(b) Indebtedness indicators
B. Activity indicators or turnover ratios
C. Business efficacy indicators
(a) Economy indicators
(b) Profitability indicators
(c) Investment indicators
Fundamental analysis of stock market indices in former Yugoslavia shown in this paper is based on
the analysis of individual companies contained in stock index of individual country. The analysis
covers stock market indices containing the most liquid stocks of the respective stock market.
For every company fundamental indicators have been calculated based on reports from 2011. The
price of company stock is the price achieved on December 30, 2011. Calculated indicators
multiplied with the company proportion in stock index show fundamental indicators of stock market
index.
The indicators calculated for every company and used in further calculations are:
1. EPS (Earnings per share) – is an indicator showing how much net profit a
company has earned per share. EPS is calculated by dividing net profit (profit after
taxes) with number of regular stocks, subtracted for treasury stocks. It is one of the
2013 International Journal of Economic Sciences Vol. II (No. 1)
The International Institute of Social and Economic Sciences ISSN 1804-9796

8
most important profitability indicators and therefore one of the most used indicators
investors use to value stock growing potential. As investment indicator it shows
company’s ability to attract investments, respectively it expresses its capability to
make profit. High values of EPS indicate company’s efficacy to make profit.
2. P/E ratio (Price-to-earnings ratio) - is an indicator calculated relating actual
market price and earning per share during the business year. Simply, P/E ratio shows
how much the market is willing to pay per share per every unit of net profit,
respectively the price of the stocks in relation to the possible gain if they are sold.
The lower the P/E, the cheaper the stock. It means the stock is undervalued, because
investors pay less per stock making bigger profit selling it. The higher P/E, the more
expensive the stock and the lower its growth potential. (Reilly and Brown, 2003).
3. P/S ratio (Price-to-sales ratio) - is an indicator calculated relating actual market
price and total income per share. It is used to identify underrated/overrated stocks.
The lower P/S, the cheaper the stock, because investors pay less per stock per every
unit of stock income. However, one has to be careful when interpreting this
indicator. Companies near the bankruptcy can also have low P/S ratio.
4. P/B ratio (Price-to-book ratio) - is a ratio of market price and book stock value.
P/B indicates how much the market is willing to pay per stock per every unit of
company book value. As well as other similar indicators (P/E, P/S), it indicates
overvalued/undervalued stock. Values lower than the averages of sector are
desirable. These values indicate possible undervalue of the stocks and as such they
have higher growth potential than the overvalued ones.
5. Total stock profitability - is a ratio of earning per share (EPS) and price per share
(PPS). The higher the ratio, the better and more profitable the investment in stock.
6. Return on assets (ROA) - is the basic indicator of company profitability and it
measures achieved gain per every unit of invested asset. In this way the indicator
shows how big a profit a company can achieve per one unit of asset in its ownership.
Having in mind that the values of these indicators differ from industry to industry, it
is necessary to observe it in relation with the average of sector. The higher the ratio,
industrial standards usually indicate more efficient usage of the resources. ROA
gives investors an insight into how effectively a company invests the money it owns
into investments using its net profit. ROA ratio higher than the average of sector is
considered positive. The higher the ratio, the better it is. That value shows that a
company is more successful than its competition in making profit per every unit of
its asset.
7. Return on equity (ROE) - is an indicator of company’s achievement in turning
shareholders’ money into profit. It indicates how successfully a company uses its
equity to make a profit. It is used to compare profitability of companies in the same
sector. Having in mind that the values of these indicators differ from industry to
industry, it is necessary to observe it in relation with the average of sector. Higher
ROE value shows good profitability. It is desirable to have ROE values higher than
the average of sector. They show that a company is more successful than its
competition in making profit per every unit of its equity.
8. Current ratio – is a ratio of current assets and current liabilities. According to rule-
of-thumb estimates sometimes used by traditional bankers, it is considered that 2:1
ratio of current assets and current liabilities is optimal for company. It is coverage
for current liabilities and to preserve normal liquidity of a company part of current
assets has to bi financed out of quality long-term sources. As with other estimates,
their usage depends on many factors, such as industry branch and its perspectives. If
a company has fast stock turnover and is able to charge its realisation, acceptable
2013 International Journal of Economic Sciences Vol. II (No. 1)
The International Institute of Social and Economic Sciences ISSN 1804-9796
9
ratio of current assets and liabilities can be lower. However, it should not be lower
than 1:1.
9. Financial stability coefficient – is a ratio of long-term assets and equity enlarged
for long-term liabilities. Decrease of coefficient is a positive tendency; it means that
more current assets are financed from long-term funding sources, giving good
estimates for financial stability. If the coefficient is lower than 1 it means that this
short-term assets has to bi financed from long-term sources. If higher than 1 it means
that long-term assets are financed from short-term liabilities or there is working
capital deficit (Žager, et al., 2008).
10. Net profit margin - is a ratio of net profit and income. It is the most precise
indicator of final effects of realised and charged transactions. It shows what
percentage of income remains in the form of profit at our disposal.
11. Interest margin – is an indicator showing the relation between the difference of
interest revenues and expenses, and total assets. It is used in analysis of banks and it
depends on many factors, such as development of financial sector of a country, their
size and position in relation to competition etc. The influence on profit decrease is
the most obvious when the non-profitable assets are financed from interest liabilities.
We get the opposite when non-interest liabilities increase profit if they are used to
finance assets that bring high interests.
Fundamental analysis has been carried for each ex-Yugoslavia country. In the Republic of
Montenegro, company Solana Bajo Sekulić in MONEX20 index, is in bankruptcy. It did not submit
annual report for 2011 and its influence has been disregarded during the indicator calculations.
Earnings per share have been expressed in euros according to exchange rate on December 30, 2011.
The results are following:
2013 International Journal of Economic Sciences Vol. II (No. 1)
The International Institute of Social and Economic Sciences ISSN 1804-9796
10
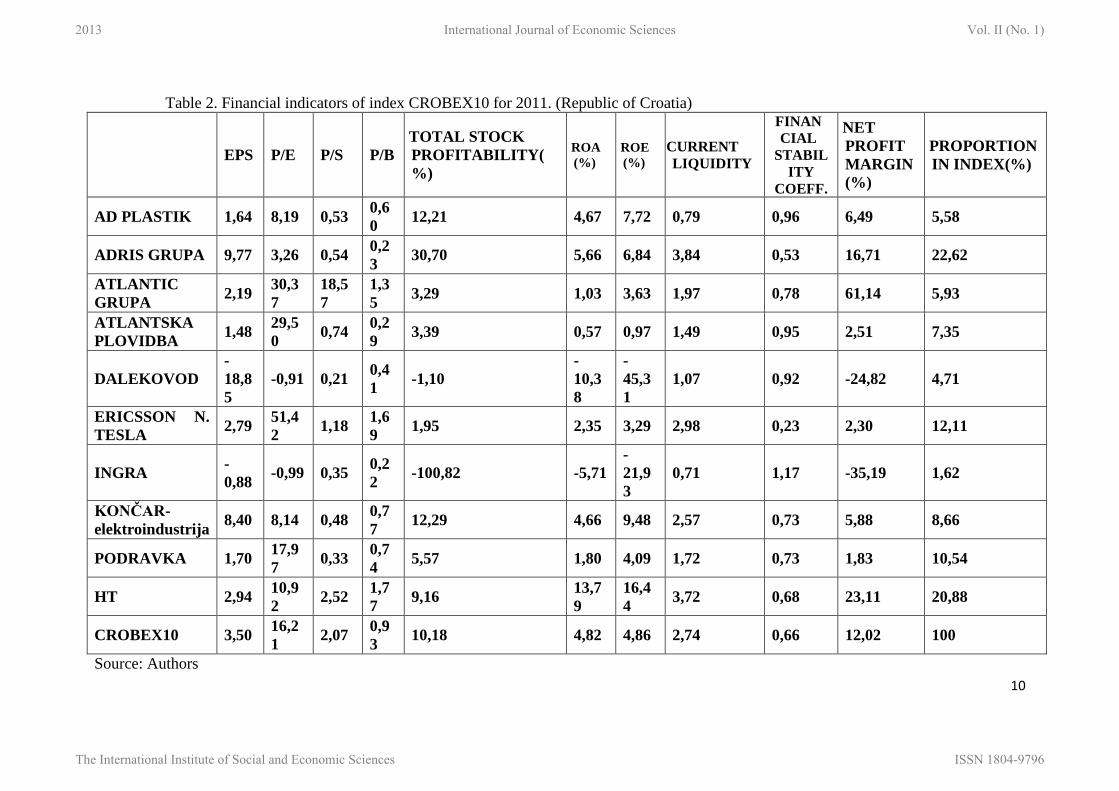
Table 2. Financial indicators of index CROBEX10 for 2011. (Republic of Croatia)
EPS P/E P/S P/B
TOTAL STOCK
PROFITABILITY(
%)
ROA
(%)
ROE
(%)
CURRENT
LIQUIDITY
FINAN
CIAL
STABIL
ITY
COEFF.
NET
PROFIT
MARGIN
(%)
PROPORTION
IN INDEX(%)
AD PLASTIK 1,64 8,19 0,53 0,6
0 12,21 4,67 7,72 0,79 0,96 6,49 5,58
ADRIS GRUPA 9,77 3,26 0,54 0,2
3 30,70 5,66 6,84 3,84 0,53 16,71 22,62
ATLANTIC
GRUPA 2,19
30,3
7
18,5
7
1,3
5 3,29 1,03 3,63 1,97 0,78 61,14 5,93
ATLANTSKA
PLOVIDBA 1,48
29,5
0 0,74
0,2
9 3,39 0,57 0,97 1,49 0,95 2,51 7,35
DALEKOVOD
-
18,8
5
-0,91 0,21 0,4
1 -1,10
-
10,3
8
-
45,3
1
1,07 0,92 -24,82 4,71
ERICSSON N.
TESLA 2,79
51,4
2 1,18
1,6
9 1,95 2,35 3,29 2,98 0,23 2,30 12,11
INGRA -
0,88 -0,99 0,35
0,2
2 -100,82 -5,71
-
21,9
3
0,71 1,17 -35,19 1,62
KONČAR-
elektroindustrija 8,40 8,14 0,48
0,7
7 12,29 4,66 9,48 2,57 0,73 5,88 8,66
PODRAVKA 1,70 17,9
7 0,33
0,7
4 5,57 1,80 4,09 1,72 0,73 1,83 10,54
HT 2,94 10,9
2 2,52
1,7
7 9,16
13,7
9
16,4
4 3,72 0,68 23,11 20,88
CROBEX10 3,50 16,2
1 2,07
0,9
3 10,18 4,82 4,86 2,74 0,66 12,02 100
Source: Authors
2013 International Journal of Economic Sciences Vol. II (No. 1)
The International Institute of Social and Economic Sciences ISSN 1804-9796
11
Table 3. Financial indicators of index BELEX15 for 2011. (Republic of Serbia)
EPS P/E P/S P/B TOTAL STOCK
PROFITA
BILITY (%)
ROA
(%)
ROE
(%)
CURRENT
LIQUIDIT
Y
FINAN
CIAL
STABILIT
Y COEFF.
NET
PRO
FIT
MARGI
N (%)
INTEREST
MARGIN
(%)
PROPORTIO
N IN INDEX
(%)
AERODROM
N. TESLA 0,44
10,8
1 2,70 0,75 9,25 6,31 6,89 10,46 0,85 24,98 - 5,78
AIK BANKA 3,19 4,91 0,79 0,31 20,36 6,48 6,35 - - - 4,44 20,00
ALFA PLAM 26,2
7 2,55 0,31 0,31 38,18
10,0
8
11,9
0 5,28 0,39 11,67 - 1,55
ENERGOPRO
JEKT
HOLDING
0,27 14,0
3 4,85 0,54 7,13 3,49 3,87 22,03 0,84 34,57 - 6,66
GALENIKA
FITOFARMA
CIJA
5,52 3,15 0,76 0,70 31,73 20,6
9
22,1
5 11,89 0,23 24,20 - 3,83
IMLEK 2,13 10,5
7 1.00 2,06 9,45
10,0
1
19,4
8 1,47 0,82 9,45 - 9,91
JEDINSTVO
SEVOJNO
11,9
4 4,05 0,47 0,78 24,68
11,0
7
19,2
4 1,69 0,45 11,66 - 2,53
JUBMES
BANKA 8,42
14,7
5 2,79 0,67 6,78 3,99 4,55 - - - 8,76 5,53
KOMERCIJA
LNA BANKA 3,86 4,21 0,41 0,33 23,73 4,25 7,94 - - - 3,58 10,79
METALAC 3,81 4,01 1,59 0,60 24,93 12,4
4
14,9
8 1,94 0,90 39,63 - 3,84
NIS 2,28 2,43 0,47 1,13 41,16 17,4
5
46,3
6 1,79 0,81 19,31 - 20,00
2013 International Journal of Economic Sciences Vol. II (No. 1)
The International Institute of Social and Economic Sciences ISSN 1804-9796
12
SOJA
PROTEIN 0,73 7,36 0,65 0,75 13,58 6,61
10,1
5 3,15 0,06 8,83 - 7,81
TIGAR 0,68 7,24 0,19 0,31 13,81 1,64 4,23 1,00 1,00 2,74 - 0,95
VETERINARS
KI ZAVOD
SUBOTICA
0,29 10,5
0 0,23 0,28 9,52 1,97 2,66 2,72 0,67 2,20 - 0,81
BELEX15 3,36 6,49 1,19 0,78 21,84 9,31 17,1
9 3,51 0,43 12,20 1,76 100
Source: Authors
Table 4. Financial indicators of index MBI10 for 2011. (Republic of Macedonia)
EPS P/E P/S P/B
TOTAL STOCK
PROFITABILITY
(%)
ROA
(%) ROE
(%)
CUR
RENT
LIQUIDI
TY
FINAN
CIAL
STABI
LITY
COEFF.
NET
PRO
FIT
MARG
IN (%)
INTERE
ST
MARGI
N (%)
PROPORTI
ON IN
INDEX (%)
ALKALOID
SKOPJE 7,00
9,2
0 0,80
0,8
2 10,87 7,01 8,86 2,49 0,63 9,15 - 25,00
GRANIT SKOPJE 2,10 3,6
2 0,18
0,3
7 27,60 4,50
10,1
3 1,30 0,73 5,08 - 6,71
KOMERCIJALNA
BANKA SKOPJE 7,75
5,5
4 1,08
0,6
3 18,05 3,27
11,4
0 - - - 3,31 25,00
MAKEDONIJATU
RIST SKOPJE 7,14
5,8
1 2,13
0,5
5 17,22 9,32 9,49 22,50 0,61 36,70 - 5,43
MAKPETROL
SKOPJE
55,0
6
5.6
1 0,34
0,5
8 17,82 4,28
10,4
3 1,30 1,41 6,08 - 9,74
MAKSTIL SKOPJE 0,01 293
,54 0,26
1,5
4 0,34 0,10 8,96 0,57 1,84 0,09 - 8,20
STOPANSKA
BANKA SKOPJE -19,8
-
1,71,65
0,7
0 -58,15
-
4,72
-
4,06 - - - 3,46 3,93
2013 International Journal of Economic Sciences Vol. II (No. 1)
The International Institute of Social and Economic Sciences ISSN 1804-9796
13
2
TOPLIFIKACIJA
SKOPJE 0,32
200
,90 0,69
1,0
7 0,50 0,22 0,53 0,84 1,12 0,34 - 8,20
TTK BANKA
SKOPJE 0,13
137
,01 1,61
1,0
4 0,73 2,99 0,82 - - - 3,49 4,60
ZK PELAGONIJA
BITOLA
16,2
4
2,4
0 1,90
0,3
4 41,63
12,5
9
14,0
7 7,66 0,51 79,01 - 3,19
MBI10 9,35 51,
65 0,90
0.8
0 10,90 4,17 8,38 2,42 0,64 7,71 1,12 100
Source: Authors
Table 5. Financial indicators of index SBITOP for 2011. (Republic of Slovenia)
EPS P/E P/S P/B
TOTAL
STOCK
PROFITA
BILITY(%)
ROA
(%)
ROE
(%)
CUR
RENT
LIQUI
DITY
FINAN
CIAL
STABILIT
Y COEFF.
NET
PRO
FIT
MARGI
N (%)
INTE REST
MARGIN
(%)
PROPORTI
ON IN
INDEX (%)
GORENJE 0,46 10,9
4 0,12 0,24 9,16 2,53 2,17 1,52 0,74 1,08 - 4,48
KRKA 6,04 8,76 1,74 1,64 11,42 10,80 14,8
0 2,82 0,66 19,90 - 30,00
MERCATO
R 6,25
23,5
1 0,19 0,70 4,25 0,80 3,00 0,64 1,20 0,80 - 26,83
NOVA
KBM 2,15 1,47 0,47 0,33 67,93 3,99
22,4
7 - - - 2,06 5,81
PETROL 25,0
9 6,18 0,10 0,73 16,18 4,77
11,8
5 0,83 1,13 1,60 - 21,28
TELEKOM
SLOVENIJE 5,20 12,1 0,50 0,50 8,26 2,16 4,17 1,21 0,96 4,13 - 11,60
2013 International Journal of Economic Sciences Vol. II (No. 1)
The International Institute of Social and Economic Sciences ISSN 1804-9796

14
SBITOP 9,58 12,2 0,68 0,92 13,32 5,07 9,65 1,40 0,90 7,05 0,12 100
Source: Authors
Table 6. Financial indicators of index MONEX20 for 2011. (Republic of Montenegro)
EPS P/E P/S P/B TOTAL STOCK
PROFITABILI
TY(%)
ROA
(%)
ROE
(%)
CURRENT
LIQUIDI
TY
FINAN
CIAL
STABILIT
Y COEFF.
NET
PRO
FIT
MARGI
N (%)
INTEREST
MARGIN
(%)
PROPOR
TION IN
INDEX (%)
13 JUL
PLANTAŽE
PODGORICA
0,02 12,8
6
0,8
7 0,37 7,78
21,2
2 2,84 1,88 0,82 6,75 - 6,61
BUDVANSKA
RIVIJERA 0,11
24,4
7
0,6
7 0,14 3,85 0,52 0,58 4,59 0,99 2,59 - 2,73
CRNOGORSKI
TELEKOM 0,35 7,74
1,0
6 0,77 12,92 8,38 9,91 2,56 0,74 13,74 - 19,90
ELEKTROPRIV
REDA CRNE
GORE
-0,53 -
5,09
1,2
0 0,39 -19,66
-
6,34
-
7,75 2,04 0,94 -23,59 - 3,98
HIPOTEKARNA
BANKA
48,6
2
13,3
7
1,3
2 0,88 7,48 3,47 6,59 - - - 4,84 5,96
HTP
PRIMORIJE
TIVAT
-0,39
-
12,9
3
2,9
8 0,50 -7,73
-
3,79
-
3,89 21,27 0,66 -23,04 - 1,65
INSTITUT SIMO
MILOSEVIC -2,72
-
12,1
3
1,2
0 0,21 -8,25
-
1,47
-
1,71 0,83 1,02 -9,90 - 1,52
JADRANSKO
BRODOGRADIL
IŠTE
-1,11 -
1,30
0,1
4 0,09 -76,99
-
3,45
-
6,73 0,51 1,22 -10,77 - 0,67
2013 International Journal of Economic Sciences Vol. II (No. 1)
The International Institute of Social and Economic Sciences ISSN 1804-9796
15
JUGOPETROL
KOTOR 1,58 5,86
0,2
2 0,47 17,06 7,04 8,05 4,57 0,59 3,73 - 11,85
KOMBINAT
ALUMINIJUMA
PODGORICA
-8,22 -
0,20
0,1
1
-
0,13 -424,65
-
32,4
2
0,55 0,08 -1,34 -45,49 - 3,69
KONTEJNERSK
I TERMINAL I
GENERALNI
TERET
-1,10 -
3,36
2,4
3 0,32 -29,79
-
9,11
-
9,55 0,83 1,02 -72,26 - 7,35
LUKA BAR 0,00
3
48,8
5
1,0
3 0,13 2,05 0,25 0,27 1,86 0,96 2,10 - 3,10
PRENOS 0,02 14,1
8
1,9
3 0,31 7,05 2,01 2,16 5,88 0,75 0,14 - 7,45
PRVA BANKA
-
21,2
2
-
4,24
1,0
8 1,78 -23,57 0,77
-
42,0
5
- - - 3,89 8,11
RUDNIK
PLJEVLJA 0,26
11,0
1
0,2
7 0,74 9,09 1,28 6,69 0,30 1,85 2,41 - 2,78
SOLANA BAJO
SEKULIC - - - - - - - - - - - 2,83
TREBJESA
NIKSIC 7,79 6,40
1,1
6 1,21 15,64
18,9
0
18,9
0 2,56 0,67 18,15 - 6,20
ULCINJSKA
RIVIJERA -0,40
-
4,77
1,1
8 0,03 -20,98
-
0,57
-
0,57 0,54 1,00 -24,77 - 0,95
ZETATRANS 0,08 10,4
6
1,0
8 0,32 9,57 2,86 3,03 3,40 0,91 10,28 - 1,27
ŽELJEZNIČKA
INFRASTRUKT
URA
0,62 0,80 0,4
3 0,01 1242,43
17,8
2
18,5
2 1,86 0,99 539,94 - 1,42
MONEX20 1,50 6,71 1,0
6 0.61 3,72 3,61 0,81 2,55 0,61 3,99 0,61 100
2013 International Journal of Economic Sciences Vol. II (No. 1)
The International Institute of Social and Economic Sciences ISSN 1804-9796

16
Table 7. Financial indicators of index BATX for 2011. (Republic of Bosnia and Herzegovina)
EPS P/E P/S P/B
TOTAL STOCK
PROFITABILITY
(%)
ROA
(%)
ROE
(%)
CUR RENT
LIQUIDITY
FINAN
CIAL
STABILI
TY
COEFF.
NET PRO
FIT
MARGIN
(%)
INTE REST
MARGIN
(%)
PROPO
RTION IN
INDEX
(%)
BH TELEKOM
SARAJEVO 1,10 8,46 1,88 1,04 11,82 9,45
12,
30 4,24 0,83 22,17 - 24,99
BOSNALIJEK
SARAJEVO 0,40 10,44 0,57 0,50 9,58 4,00
4,7
9 2,16 0,69 5,47 - 18,41
ELEKTROPRIVREDA
BIH SARAJEVO 0,03 377,90 0,58 0,19 0,26 0,13
0,0
5 5,21 0,95 0,15 - 14,38
FABRIKA DUHANA
SARAJEVO 2,57 9,31 0,75 0,27 10,74 2,61
2,9
3 6,89 0,62 8,10 - 9,82
NOVA BANKA
BANJA LUKA 0,06 7,18 0,64 0,67 13,92 9,28
2,6
3 - - - 2,39 7,40
TELEKOM SRPSKE
BANJA LUKA 0,11 6,68 1,43 1,46 14,97 11,92
15,
49 0,33 0,95 21,41 - 25,00
BATX 0,64 61,49 1,14 0,82 10,58 7,05 8,3
5 2,97 0,77 12,77 0,17 100
Source: Authors
2013 International Journal of Economic Sciences Vol. II (No. 1)
The International Institute of Social and Economic Sciences ISSN 1804-9796
17
4. FUNDAMENTAL ANALYSIS COMPARISON OF STOCK MARKET INDICES
For the purpose of simple analysis indicators of stock market indices in former Yugoslavia are
shown in table 8:
Table 8. Financial indicators of stock market indices in former Yugoslavia for 2011.
Index EPS P/E P/
S
P/
B
TOTAL
STOCK
PROFITABI
LITY(%)
RO
A
%
RO
E
%
CUR
RENT
LIQU
IDI
TY
FINANC
IAL
STABIL
ITY
COEFF.
NET
PRO
FIT
MAR
GIN
(%)
INTE
REST
MARG
IN(%)
CROB
EX10
3,5
0
16,
21
2,
0
7
0,
9
3
10,18 4,
82
4,8
6 2,74 0,66 12,02 -
BELEX
15
3,3
6
6,4
9
1,
1
9
0,
7
8
21,84 9,
31
17,
19 3,51 0,43 12,20 1,76
MBI10 9,3
5
51,
65
0,
9
0
0.
8
0
10,90 4,
17
8,3
8 2,42 0,64 7,71 1,12
SBITO
P
9,5
8
12,
23
0,
6
8
0,
9
2
13,32 5,
07
9,6
5 1,40 0,90 7,05 0,12
MONE
X20
1,5
0
6,7
1
1,
0
6
0.
6
1
3,72 3,
61
0,8
1 2,55 0,61 3,99 0,61
BATX 0,6
4
61,
49
1,
1
4
0,
8
2
10,58 7,
05
8,3
5 2,97 0,77 12,77 0,17
Source: Authors
Slovenian index SBITOP has achieved, in relation to other regional markets, the highest
earnings per share, 9.58 euros, in 2011. If we consider tehnical analysis according to which
Slovenian index SBITOP, in relation to the region, reaches the lowest fall, 4.70% in 2011
compared to 2010, then the fact of reaching the top earning per share does not surprise. The
higher values were reached due to good performance of Petrol stock company which earned
25 euros per share.
On the other side, decrease of Montenegro index MONEX20 in 2011, 18.54%, had an impact
on earning per share of mere 1.50 euros. It is not surprising because of the fact that eight stock
companies out of 20 ended their business year with the loss. Eventually, the lowest earnings
per share ware realized by index BATX of Sarajevo and Banja Luka stock exchanges.
According to the results obtained, Bosnia and Herzegovina stock market earns 0.64 euros per
share, which is mostly due to low net profits in 2011. In accordance with this indicator
Croatian index CROBEX10 is in the centre of regional markets, making 3.50 euros per share.
The ratio of market price and EPS points to the overrated and underrated stocks. The highest
values are reached by Macedonian index MBI10 and Bosnia and Herzegovina index BATX. It
is usually considered that P/E lower than 15 is a sign of undervalued stocks. In the Republic
of Bosnia and Herzegovina market price is 61.49 times higher than EPS. It means that BATX
index contains overvalued stocks, which bring extremely low earnings, while their price is
2013 International Journal of Economic Sciences Vol. II (No. 1)
The International Institute of Social and Economic Sciences ISSN 1804-9796
18
unusually high. This is supported by the fact that four stock companies out of six earn less
than one euro per share.
The above is followed by Macedonian index MBI10. High value according to which market
price is 51.65 times higher than EPS, MBI10 index accomplishes mostly due to extremely low
net profits of Makstil and Toplifikacija companies and TTK bank, which have relatively high
proportion in the index structure.
Serbian index BELEX15 and Montenegro index MONEX20 show the lowest P/E values.
However, MONEX20 P/E indicator is not relevant in this case considering many companies
within the index, showed a loss in 2011, which directly decreases indicator values not
providing correct information on overvaluation and undervaluation of their stocks. We can
therefore say there are extremely underrated stocks only within Belgrade index BELEX15,
whose price is just 6.48 times higher than EPS. SBITOP and CROBEX10 indices achieve
average values showing potential undervaluation of stocks.
To provide analysis of stocks overvaluation and undervaluation, P/S and P/B ratios are carried
out. These indicators do not bring the same results as those shown in P/E ratio. Macedionian
index MBI10 showing extremely high P/E ratio indicating overvaluation of stocks, shows
different results based on P/S ratio, 0.90, and P/B ratio, 0.80. In other words, investors pay
0.90 of monetary unit per every unit of income per share and 0.80 per every unit of company
book value respectively. These results indicate stock undervaluation within the MBI10 index.
Of all regional indices, Slovenian SBITOP index is the most underrated and its P/S ratio,
which is 0.68, and P/B ratio, which is 0.92, are in accordance with P/E ratio. P/S and P/B
ratios follow the P/E ratio in the case of Belgrade index also and show stock undervaluatiom
within the BELEX15 index. According to P/S and P/B ratios Croatian index CROBEX10
indicates stock overvaluation in relation to the other stock exchange indices in the region and
it has the highest values. Market price is 2.07 times higher than the income per share and 0.93
higher than the company book value per share respectively.
The most significant investment indicator is stock profitability because one uses market
values and not book values in its calculations. It is very important information for investors.
Total stock profitability has been calculated in this paper. Belgrade index BELEX15 achieves
the highest total stock profitability, 21.84%. It indicates positive effect of financial leverage
and companies’ business stability. The lowest total stock profitability, 3.72%, is realized by
Montenegro index MONEX20. Ragarding poor business results this profitability could be
expected. Other indices have achieved satisfactory values within 8-14%.
Provided total stock profitability is connected with rentability on assets, which is a ratio of net
profit and total assets, significant differences can be seen. They are achieved because
rentability on assets calculation uses book values. ROA is a good indicator for investors but
insufficient for company evaluation. The lowest ROA value, 3.61%, is achieved by
Montenegro index MONEX20 and that result is in accordance with the results mentioned
above which show negative index position in 2011. However, calculations of this indicator
point out Serbian index BELEX15, which has the highest ROA ratio, followed by Bosnian
and Herzegovinian BATX. Precisely, BELEX15 realizes 9.31% of net profit per every asset
unit, while BATX realizes 7.05%. Macedonian, Croatian and Slovenian indices ahieve ROA
value within 3-7%.
Rentability on equity is in accordance with rentability on assets, so index values rank almost
as in the case above. BELEX15 achieves the highest ROE value, 17.19%, followed by
MBI10, 8.38%. These results indicate efficient use of shareholders resources which gives
certain security to potential investors. MONEX20 continues to show low results with ROE
ratio 0.81%, which means companies within the index earn 0.81% per every unit of equity.
2013 International Journal of Economic Sciences Vol. II (No. 1)
The International Institute of Social and Economic Sciences ISSN 1804-9796
19
Croatian index CROBEX10 does not show good results while calculating this indicator.
Precisely, it realizes ROE ratio 4,86%.
Two indicators that measure liquidity, company’s ability to cover its due short-term liabilities
are calculated. Current liquidity and financial stability coefficient have been calculated for
that purpose. Current liquidity is a ratio of current assets and current liabilities, so the optimal
ratio is 2:1. All the indices in this region show high values, with the most liquid companies in
BELEX15 index with ratio 3.51, and of BATX index with ratio 2.97. The least liquid
companies are those of Slovenian index SBITOP with current liquidity coefficient 1.40. It
indicates potential problems with covering due short-term liabilities.
Financial stability coefficient by default has to be lower than 1 because part of current assets
has to be financed from long-term resources. All indices in former Yugoslavia have values
less than 1, where stocks of Belgrade index BELEX15 have the lowest value, 0.43. It
indicates the highest financial stability and liquidity in relation to stocks within indices of
countries of former Yugoslavia. On the other side, the financial stability coefficient, 0.90,
shown by stocks within Slovenian index SBITOP, is acceptable and desirable. However, they
ensure the lowest financial stability in relation to other stocks within indices of former
Yugoslavia. One should consider the fact that financial reports of banks within the index were
insufficient for current liquidity and financial stability coefficients so they were left out of the
calculations.
To show company profitability as well as the index, net profit margin and interest margin
indicators have been calculated. Interest margin refers to banks. The highest net profit margin
was realized by Bosnian and Herzegovinian index BATX, 12.77%, which means that 12.77%
of total revenues can be used for future investment. BATX is followed by BELEX15, with
value of 12.20%, and CROBEX10 with value of 12.02%. The least resources to be used from
total revenues remain in Motenegro, where the net profit margin is 3.99%. SBITOP and
MBI10 indices reached acceptable values of net profit margin of about 7%.
According to interest margin, the most profitable is Serbian market with value 1.76%, while
the least profitable is Slovenian market with value 0.12%. Analizing this indicator one should
take in the consideration the number of banks within the index and with what proportion.
Therefore, the highest interest margin value of BELEX15 is the result of the high proportion
of three banks within the index. On the other hand, Slovenian market has a bank within the
index SBITOP with low proportion so the interest margin value is extremely low. To avoid
this, it is necessary to consider more indicators to get wider general conclusion.
5. CONCLUSION
This paper shows fundamental analysis of stock market indices in former Yugoslavia. It has
been done firstly with fundamental analysis of companies within the indices and,
consequently, the fundamental analysis of indices, based on companies’ proportion in the
index, has been made. For better overview of differences between Croatian, Slovenian,
Serbian, Bosnian and Herzegovinian, Montenegro and Macedonian market, investment,
liquidity and profitability indicators have been calculated for 2011.
Serbian market, Belgrade stock market respectively, provided the best business picture and
security of investment. It shows very good results in all the calculated indicators. Stocks
within the Serbian index BELEX15 show high values in calculations of stock profitability,
rentability on assets (ROA), rentability on equity (ROE), net profit margin and interest
margin.
Unlike Belgrade stock market, Montenegro market proved to be the most unfavorable market.
It gave negative results in all segments. While stocks of index MONEX20 show low earnings
2013 International Journal of Economic Sciences Vol. II (No. 1)
The International Institute of Social and Economic Sciences ISSN 1804-9796

20
per share, they also show extremely low values in stocks profitability, rentability on assets
and on equity, in relation to stocks within the indices in other countries of former Yugoslavia.
Croatian, Slovenian, Bosnian and Herzegovinian and Macedonian stock markets vary from
indicator to indicator while at the same time Bosnian and Herzegovinian index shows slightly
better results within those named here. However, markets yield relatively good results despite
economic and financial crisis and have growth potential in the following years.
LITERATURE
Books:
1. Orsag, S., 2003. Vrijednosni papiri. Sarajevo: Revicon.
2. Žager, L. et al., 2008. Analiza financijskih izvještaja. 2nd ed. Zagreb. Masmedia.
3. Reilly, F.K., Brown, C.K., 2003. Investment Analysis and Portfolio Management. 7.
ed. Thomson: South-Western.
Websites:
1. Zse.hr, 2012. Croatian Stock Exchange History. [online] Available at:
<http://zse.hr/default.aspx?id=32877> (Accessed 04 July 2012)
2. Zse.hr, 2012. MTF: About MTF. [online] Available at:
<http://zse.hr/default.aspx?id=36803> (Accessed 04 July 2012)
3. Zse.hr, 2012. Trading data and statistics: Indices. [online] Available at:
<http://zse.hr/default.aspx?id=109> (Accessed 04 July 2012)
4. Belex.rs, 2012. Products and services: Indices. [online] Available at:
<http://www.belex.rs/eng/proizvodi_i_usluge/indeksi_opste> (Accessed 05 July 2012)
5. Mse.mk, 2012. About MSE: History. [online] Available at:
<http://www.mse.mk/en/content/22/1/2008/history> (Accessed 05 July 2012)
6. Ljse.si, 2012. About LJSE: History. [online] Available at: <http://www.ljse.si/cgi-
bin/jve.cgi?doc=2327> (Accessed 06 July 2012)
7. Ljse.si, 2012. Products and services: Indices. [online] Available at:
<http://www.ljse.si/cgi-bin/jve.cgi?doc=8340> (Accessed 06 July 2012)
8. Montenegroberza.com, 2012. About us: General data: About MNSE. [online]
Available at: <http://www.montenegroberza.com/code/navigate.asp?Id=944>
(Accessed 07 July 2012)
9. Montenegroberza.com, 2012. Market: Organization of the market. [online] Available
at: <http://www.montenegroberza.com/code/navigate.asp?Id=905> (Accessed 07 July
2012)
10. Sase.ba, 2012. Market: Organization of the market: Market structure. [online]
Available at: <http://195.222.43.81/sase-final/language/en-
US/Market/Organization_of_the_Market/Market_Structure.aspx> (Accessed 07 July
2012)
11. Sase.ba, 2012. Market: Index: Index SASX-30. [online] Available at:
<http://195.222.43.81/sase-final/language/en-US/Market/Index/Index_SASX-
30.aspx> (Accessed 07 July 2012)
12. Blberza.com, 2012. About us: Trading system. [online] Available at:
<http://www.blberza.com/v2/Pages/docview.aspx?page=sp6> (Accessed 08 July
2012)
2013 International Journal of Economic Sciences Vol. II (No. 1)
The International Institute of Social and Economic Sciences ISSN 1804-9796


![Sveti Mihovil 2018. - HPS Mini GP · 2018. 10. 14. · Sveti Mihovil 2018.- HPS Mini GP ŠIBENIK 13.10.2018. 14.10.2018. od god. [from YOB] do god. [to YOB] 9. 100m SLOBODNO, Plivačice](https://img.pdfslide.us/doc/110x75/610f1d1e62153716247dc33a/sveti-mihovil-2018-hps-mini-gp-2018-10-14-sveti-mihovil-2018-hps-mini.jpg)